01 Pune - Comprehensive Bicycle Plan - PDA, iTrans, CEE, PMC, Parisar : Chetan Sodaye

Page 30

       

Providing bypass routes for long distance commuter and truck traffic so that they do not have to travel through the city roads. Identifying feeder systems that connect different pockets and wards in the city to the most convenient point in one or more of the mobility corridors Providing a network of dedicated cycle tracks, footpaths and pedestrian crossings Pedestrianizing important portions of the core city area and linking them with strategic parking places to encourage people to walk in such areas Providing flyovers in a few heavily congested junctions/intersections to reduce idling traffic Special attention towards road safety Introduction of physical and fiscal measures to discourage the use of personal motor vehicles Reform and strengthen the institutional arrangements for managing and regulating the transport system in the city.

The Comprehensive Mobility Plan thus provides the overall transportation planning framework for the city, and prioritizes cycles, pedestrian facilities and public transport. The implications for the Pune Cycle Plan, emerging from the CMP include:   

Need for creation of a dedicated cycle track network Possibility of using cycles as a feeder mode The proposal for decongestion of the core city and pedestrianization of selected areas, may be considered as cycling inclusive planning, as these measures would also help to promote cycling

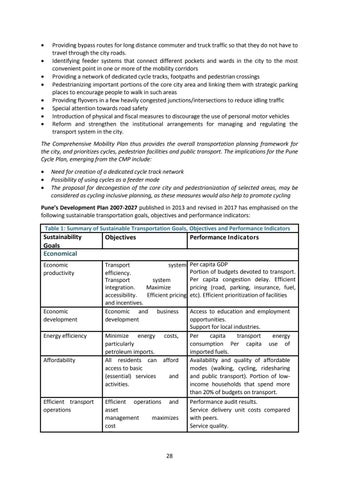
Pune’s Development Plan 2007-2027 published in 2013 and revised in 2017 has emphasised on the following sustainable transportation goals, objectives and performance indicators: Table 1: Summary of Sustainable Transportation Goals, Objectives and Performance Indicators

Sustainability Goals Economical

Objectives

Performance Indicators

Economic productivity

Transport system efficiency. Transport system integration. Maximize accessibility. Efficient pricing and incentives. Economic and business development

Per capita GDP Portion of budgets devoted to transport. Per capita congestion delay. Efficient pricing (road, parking, insurance, fuel, etc). Efficient prioritization of facilities

Economic development Energy efficiency

Affordability

Efficient transport operations

Minimize energy costs, particularly petroleum imports. All residents can afford access to basic (essential) services and activities. Efficient operations and asset management maximizes cost efficiency.

28

Access to education and employment opportunities. Support for local industries. Per capita transport energy consumption Per capita use of imported fuels. Availability and quality of affordable modes (walking, cycling, ridesharing and public transport). Portion of lowincome households that spend more than 20% of budgets on transport. Performance audit results. Service delivery unit costs compared with peers. Service quality.


Turn static files into dynamic content formats.

Create a flipbook

Articles inside

4.3.6. Repair Shops, Resting Places and other Facilities

1min
page 105

4.3.5. Cycle Parking

2min
pages 102-103

Table 6: Activities for public awareness and outreach

5min
pages 111-113

4.3.4. Integration with Public Transit

1min
page 101

4.4. Traffic Management, Regulation and Enforcement

3min
pages 108-109

4.7. Implementation Schedule

1min
page 115

Figure 49: Treatment of Access Roads

1min
pages 93-94

4.3.3. Public Bicycle Sharing system

2min
pages 97-98

Figure 48: Treatment of Collector Roads

1min
page 92

Figure 47: Treatment of arterial and sub-arterial roads

1min
page 91

Figure 43: A smooth road surface, also at intersections, leads to better comfort

1min
page 85

Figure 42: Interlocking paver blocks for cycle track surface may be appropriate provided these are affixed at level

1min
page 84

left

1min
page 83

Figure 39: Road safety problems resulting from traffic going through the city centre (left) are resolved by leading all through-traffic around the city-centre (right

1min
page 81

4.2.2. Controlled Parking for Motorized Vehicles

1min
pages 71-72

Figure 19: Preferred route by cyclists

1min
page 48

Figure 25: Percentage of households with cycle ownership across wards in Pune

2min
page 53

Figure 21: Perceived unsafe corridors

1min
page 50

Table 4: Highlights of School-based Learning about Sustainable Transportation

2min
pages 57-58

Figure 27: Willingness to shift to cycling if infrastructure improves

2min
page 60

4.2. Cycling inclusive mobility planning proposals

3min
pages 67-68

3. Vision and Goals

1min
page 63

Figure 15 Assessment of Existing Cycle Tracks

1min
page 45

Figure 13: Encroachment of the NMT lane by hawkers due to absence of dedicated space for them42 Figure 14: Cyclists being forced to use the carriage way because of unplanned services in the NMT lanes (like public toilets

1min
page 44

Figure 5: Inter and intra ward travel patterns of cycling commuters in Pune

1min
page 40

Figure 1: Potential of shift from other modes to cycling

27min
pages 13-25

Figure 1 Responses to an online survey on all proposals in the preliminary draft of Pune Cycle Plan

1min
page 28

1.2. Methodology

2min
page 27

Figure 2: Framework to solve Pune's Transport and Mobility problem

2min
pages 33-34

Table 1: Summary of Sustainable Transportation Goals, Objectives and Performance Indicators

6min
pages 30-32

Preface by Municipal Commissioner

2min
page 8

Executive Summary

10min
pages 9-12

Preface by Mayor

1min
page 7
Issuu converts static files into: digital portfolios, online yearbooks, online catalogs, digital photo albums and more. Sign up and create your flipbook.