ENDURANCE | PERFORMANCE ANALYSIS
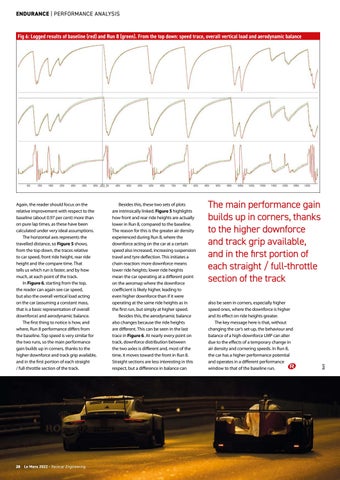
Fig 6: Logged results of baseline (red) and Run 8 (green). From the top down: speed trace, overall vertical load and aerodynamic balance
28 Le Mans 2022 • Racecar Engineering
Besides this, these two sets of plots are intrinsically linked. Figure 5 highlights how front and rear ride heights are actually lower in Run 8, compared to the baseline. The reason for this is the greater air density experienced during Run 8, where the downforce acting on the car at a certain speed also increased, increasing suspension travel and tyre deflection. This initiates a chain reaction: more downforce means lower ride heights; lower ride heights mean the car operating at a different point on the aeromap where the downforce coefficient is likely higher, leading to even higher downforce than if it were operating at the same ride heights as in the first run, but simply at higher speed. Besides this, the aerodynamic balance also changes because the ride heights are different. This can be seen in the last trace in Figure 6. At nearly every point on track, downforce distribution between the two axles is different and, most of the time, it moves toward the front in Run 8. Straight sections are less interesting in this respect, but a difference in balance can
The main performance gain builds up in corners, thanks to the higher downforce and track grip available, and in the first portion of each straight / full-throttle section of the track also be seen in corners, especially higher speed ones, where the downforce is higher and its effect on ride heights greater. The key message here is that, without changing the car’s set-up, the behaviour and balance of a high-downforce LMP can alter due to the effects of a temporary change in air density and cornering speeds. In Run 8, the car has a higher performance potential and operates in a different performance window to that of the baseline run.
XPB
Again, the reader should focus on the relative improvement with respect to the baseline (about 0.97 per cent) more than on pure lap times, as these have been calculated under very ideal assumptions. The horizontal axis represents the travelled distance, so Figure 5 shows, from the top down, the traces relative to car speed, front ride height, rear ride height and the compare time. That tells us which run is faster, and by how much, at each point of the track. In Figure 6, starting from the top, the reader can again see car speed, but also the overall vertical load acting on the car (assuming a constant mass, that is a basic representation of overall downforce) and aerodynamic balance. The first thing to notice is how, and where, Run 8 performance differs from the baseline. Top speed is very similar for the two runs, so the main performance gain builds up in corners, thanks to the higher downforce and track grip available, and in the first portion of each straight / full-throttle section of the track.