
Remember the 80s? We do. Pg. 12 Storing Up Hope: Grain Bins Aid in Humanitarian Efforts.
FEED
FIELD Supporting American Agricultural Producers Edition Eight | Spring 2023 Pg. 62
SEED,
AND
A LETTER FROM THE NATIONAL SALES MANAGER
Josh Dickson explains how, despite the challenges of recent years, the overall outlook for agriculture remains positive, with strong demand for U.S. ag production.
(CALIFORNIA) FARMERS BRACE FOR MORE DESTRUCTION
Months of heavy rainfall and subsequent flooding have dealt a new financial blow to California farmers as they come out of a multi-year drought that had them fallowing land and plowing under crops due to water shortages.
The purchase of 42 acres, renovation of an old farmhouse, and construction of a Horse barn, complete with indoor and outdoor riding ring, establishes Stargazer Farm in Connecticut.
Rising interest rates, bank failures, and a high rate of inflation have many in the agriculture community saying, “Not again!”
A BIG STEP HIGHER, A SMALL STEP DOWN FOR FARM INCOMES
Farm incomes are forecast to drop in 2023 after peaking at record levels last year. Still, several years of strong profitability have boosted farm balance sheets and positioned the sector for a pullback in commodity prices.
THE FEED - FARMER MAC 20 SEED, FEED AND FIELD - SPRING 2023 1
REMEMBER THE 80s? WE DO.
04 12
CONTENTS SEED, FEED AND FIELD - AGRIFINANCIAL
05 NEW HORSE BARN AND RIDING ARENA FULFILL A LIFELONG DREAM 09
GRAINS AND OILSEEDS SUPPLIES CHALLENGED BY BIG BRAZILIAN CROP
Tight global inventories boosted producer revenues in the previous two years. However, the expectation for bumper crops in Brazil this year has led to a pullback in global commodity prices.
FARMERS AND RANCHERS REACT TO HIGHER RATES
Agricultural lending rates have spiked over the last year due to Federal Reserve actions. Borrowing behavior has shifted in response, despite farmers being wellpositioned to absorb higher interest costs.
TIGHT LABOR MARKET HAS FARMERS LOOKING ABROAD FOR HELP
The H-2A program has been providing U.S. farmers an alternative to the historically tight labor market. However, guidelines on pay for H-2A employees have also led to a jump in labor costs.
SWEET AND SOUR: THE TWO SIDES OF FOOD PRICE INFLATION
The Federal Reserve’s goal of taming inflation includes slowing the increase in retail food prices. However, the agricultural sector has historically benefitted from rising food prices and may prefer the consequence of moderately higher interest rates.
SLOWLY BUT SURELY, U.S. POWER MIX IS CHANGING
Despite slowing in recent years, U.S. power production continues to transition towards natural gas and renewables. Distributed power generation has improved grid resiliency but increases the complexity and technology required to meet demand.
ABOUT SEED, FEED AND FIELD
Seed, Feed and Field is a publication from AgriFinancial, dedicated to supporting American agricultural producers. This quarterly resource features information on wide-ranging agricultural products raised throughout the U.S. Inside, you’ll find everything from financial tips and market data, to Farm Fresh Recipes and Farmer Features.
You will also find, as an insert and central element, Farmer Mac's The Feed, which is re-printed and included with Farmer Mac's permission as pages 18 through 59.
To subscribe to Seed, Feed and Field, or to access a digital download of this publication: www.cgb-agfi.com/seed-feed-field/
For media inquiries: AgFiMarketing@cgb.com
To learn more about AgriFinancial: Toll-free 877-548-2622 www.cgb-agfi.com
40
36
24 32 28 SEED, FEED AND FIELD - SPRING 2023 2
FALLOUT FROM THE RUSSIAUKRAINE WAR: ONE YEAR LATER
Russia’s ongoing invasion of Ukraine continues to disrupt global commodity markets. However, prices have retreated from post-invasion peaks as supply chains and global producers have adapted.
WATER, WATER (ALMOST) EVERYWHERE IN THE SOUTHWEST
44
Abundant precipitation this winter eliminated drought conditions across much of California and the U.S. Southwest. Reservoir levels have rebounded as a result, but replenishing aquifers will take time.
AG LENDING INSTITUTION HEALTH IN PERSPECTIVE
48
Volatility in the banking sector remains elevated following the failure of several large banks in March. However, agricultural banks have faced less financial stress thus far due in part to asset allocation.
52
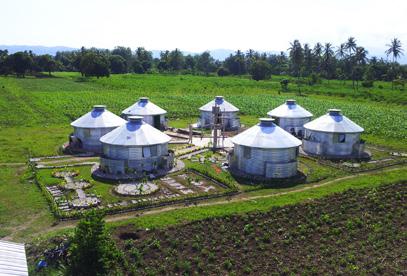
STORING UP HOPE - GRAIN BINS AID IN HUMANITARIAN EFFORTS
Sukup Grain Bin Manufacturers have partnered with the organization GoServ Global, a faithbased nonprofit that serves in communities around the world.
SOYBEAN PLANT TO BRING ECONOMIC BOOST
62
The state-of-the-art soybean processing plant to bring an economic boost to Casselton, North Dakota and nearby producers.
65
SLOW-COOKER BERRY COBBLER
As berries come into season, this simple two-step recipe combines the best of hearty comfort food with a light and juicy Spring sweetness. 68
SEED, FEED AND FIELD - SPRING 2023 3
LETTER FROM THE NATIONAL SALES MANAGER

As you are likely aware, the agricultural industry has faced a number of challenges in recent years, including trade tensions, weather-related disruptions, and pandemic-related supply chain issues. Despite these challenges, the overall outlook for agriculture remains positive, with strong demand for U.S. ag production.
That being said, prices for grains have fluctuated over the last 2-3 years in a positive way. Since 2020, we have seen significant increases in corn and soybean prices which has resulted in increased crop inputs and operating costs.
In addition to price fluctuations, farmers and agribusinesses also face ongoing challenges in the marketplace, including competition from large-scale industrial agriculture operations, changing consumer preferences, and increasing regulation.
In terms of interest rates, the long-term outlook has seen the most significant rise in over a decade for borrowers. The Federal Reserve has increased interest rates due to the rise in inflation, which has forced many to look into short-term fixed rates in hopes of waiting for the next fall in interest rates. An upcoming presidential election could be a factor in supporting this in the next 18 months which would help farmers to borrow at a lower cost.
At our institution, we remain committed to providing our customers with the financing and support they need to succeed in today's challenging environment.
Whether you are looking to lease new equipment, expand your operations, or invest in new technologies and practices, we are here to help.
We have new products for 2023, including our own interest-only loan program that is seeing early success for customers looking to wait out the interest rate peaks we’ve recently experienced. We are proud to serve the agricultural community and look forward to continuing to support your success in the years to come.

SEED, FEED AND FIELD - SPRING 2023 4
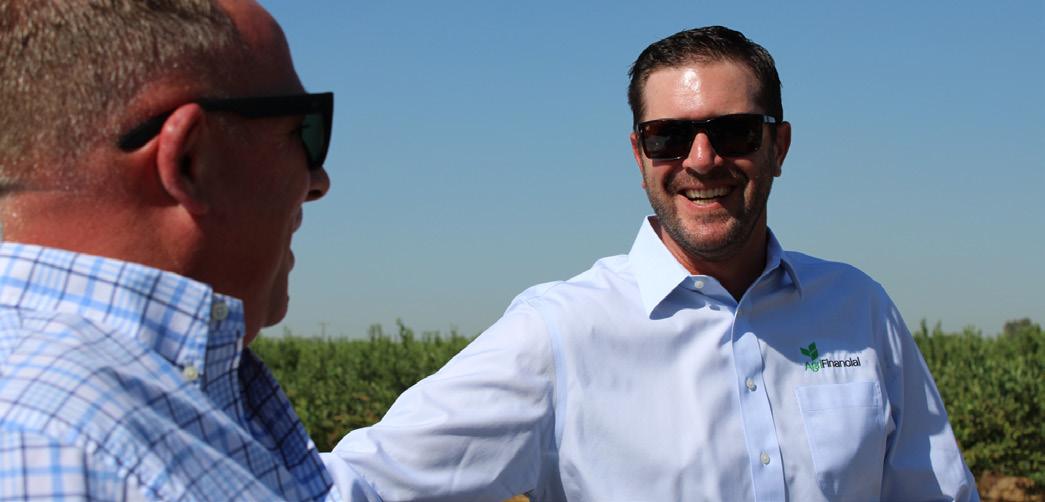
Josh Dickson, AgriFinancial National Sales Manager
Josh visits with customers on their farm.
FARMERS BRACE FOR MORE DESTRUCTION, LOSSES FROM FLOODS
Lerda-Goni Farms in Tulare was one of the first dairies to evacuate cattle last month when Lake Success overflowed, flooding the owners’ houses and other structures, feed supplies and cropland.

Months of heavy rainfall and subsequent flooding have dealt a new financial blow to California farmers as they come out of a multi-year drought that had them fallowing land and plowing under crops due to water shortages.
They now face flooded fields, waterlogged plants, crop delays and property damage. From dairies and orchards in the San Joaquin Valley to strawberry and vegetable fields along the Central Coast, farmers are also bracing for longer-term fallout that could threaten one of the most productive agricultural regions in the world.
With some fields still underwater and farmers continuing to tally losses and damage, full extent of the storm impacts remains unclear. Farmers say time will tell how fast fields dry out and whether crops on them will survive.
“We’ve still got ways to go in all this,” said Tricia Stever Blattler, executive director of Tulare County Farm Bureau. With a record snowpack in the Sierra Nevada
mountains, “there could be months of flooding in front of us,” she added, as warmer weather and rain melt the snow in the weeks ahead.
In the Salinas Valley, a survey has begun collecting data on flood impacts, “but it will be weeks before we have a good sense of damages,” said Norm Groot, executive director of Monterey County Farm Bureau. He noted many fields remain in flood stage and said he expects new agricultural damage will exceed the $330 million caused by storms in January, when more than 15,000 acres were flooded. He estimated another 20,000 acres were hit by March storms.
An estimated 47,000 acres of farmland have so far been impacted by floodwaters in Kings County, said Dusty Ference, executive director of Kings County Farm Bureau. The number is expected to grow. With the return of Tulare Lake—once the largest body of freshwater west of the Mississippi River—areas around the town of Corcoran, which sits near the lake bottom, have seen substantial amounts of flooding. Ference noted crops including alfalfa, barley, wheat, canning
SEED, FEED AND FIELD - SPRING 2023 5
tomatoes, corn silage, grapes, pistachios, almonds, walnuts are all grown in the lakebed and have been underwater for weeks.
“We don’t know what all we’re going to see yet, but we are expecting significant crop loss,” he said.
Tulare County farmer Josh Pitigliano, who has wheat, almonds and pistachios in standing water for several weeks, said he doesn’t think those crops will survive. The wheat crop “looks very yellow.” The almond trees still have green leaves on them, with nutlets developing, “but I think it’s just a matter of time till they shrivel up and are no longer viable,” he said.
Pistachios are coming out of dormancy and going through bud swell. But trees on the edge of the lake bottom probably won’t make it, he said, as “the water is not going to come off of them anytime soon.”
As many as 40,000 to 75,000 acres in Tulare County could still be underwater, Stever Blattler said. She noted a lot of standing water is going down faster on the east side of the valley. That means permanent crops there will probably survive, even though they will encounter some disease and rot from being wet for an extended period. That will impact their ability to set a crop this year, she said. The region also has many newly planted pistachio trees on the southwest side, she added, and if those trees stand in water for one to two months, they likely will be destroyed.
As the largest dairy-producing region in the state, Tulare County has so far seen 12 to 15 dairies needing to move some animals due to flooding. Stever Blattler estimated around 20,000 to 25,000 dairy cattle have been evacuated, with another 10,000 to 20,000 that may need to be moved depending on severity of floodwaters in the coming days.
Anja Raudabaugh, CEO of Western United Dairies, estimated some 75,000 dairy cattle statewide had to be hauled to safer ground due to flooding. Evacuating dairy livestock took a “mind-numbing amount of logistics,” she said, as it required identifying not just places to relocate them but facilities where the cows could be milked. Going too long without milking could adversely impact the cows’ health and even result in death, she pointed out.
Some cows were moved to vacant dairies that had gone out of business, others to feedlots and stockyards that sell cattle, Stever Blattler said. The rest went
to neighboring dairies on higher ground generous enough to take them. To be able to milk the cows, milking permits had to be transferred to those dairies. Empty dairies had to be cleaned and inspected by the state.
There are other “hidden impacts” to evacuating dairies, Stever Blattler said, noting that replacing damaged feed “is a major problem,” with silage in short supply. Flooded dairies not only lost their stored silage and hay but crops in the field.

Though some flooded cows and calves were not evacuated in time, Raudabaugh said, “we haven’t lost a lot of cows” thanks to the hundreds of people who volunteered their time, vehicles and equipment without expecting any compensation.
“People dropped everything,” she said. “If they had a truck and trailer, they showed up to move these animals, sometimes moving through the night without sleep.”
The crisis has proved the resilience of the agricultural community and its willingness to band together in times of need, said Stephen Mancebo, a dairy farmer in Tulare County.
Lerda-Goni Farms in Tulare, whose owners are related to Mancebo by marriage, was one of the first ones to evacuate when Lake Success spilled 2 feet of standing water onto the dairy last month. Housing and feed crops were flooded. Mancebo, whose own dairy was not hit, helped with the evacuation and took in some of Lerda-Goni’s more than 2,000 animals, now housed in six different locations.
SEED, FEED AND FIELD - SPRING 2023 6
Photo/ Anja Raudabaugh Bales of hay are inundated with floodwaters at Lerda-Goni Farms in Tulare.
“It took a village to help save those cattle and what business they might have left,” Mancebo said, describing the emotional toll the ordeal had on his in-laws, who initially did not think they could salvage the dairy. The farm is now “in a better spot,” Mancebo said, noting the property has dried, and the owners are rebuilding and starting to take some cattle back.
But other flooded dairies in the region have not been as lucky, he said. Those on the west side of the valley, particularly in the Corcoran area, are expected to remain underwater for some time, possibly months to a year, according to estimates.
“It’s really hard for me to fathom how some of these people are going to come back to business,” Raudabaugh said, noting two dairies that were forced to disperse their herds have called it quits.
Despite recent floods, Jeff Cardinale, spokesman for the California Strawberry Commission, said 95% of the state’s strawberry farms remain in good shape and are waiting for warming weather to boost productivity of the plants. As with other state crops, strawberry production has struggled due to delays from rain and below-normal temperatures.
“As soon as the California sunshine returns, we expect strawberry farms to surge with hiring and harvesting,” Cardinale said, adding that by Mother’s Day, the state should be supplying more than 95% of all strawberries on grocery store shelves.
(Ching Lee is an assistant editor of Ag Alert. She may be contacted at clee@cfbf.com.)
Reprinted with permission for use from the California Farm Bureau Federation.
Lee, Ching. “Farmers Brace For Destruction, Losses From Floods.” Ag Alert, 5 April 2023, https://www.agalert. com/california-ag-news/archives/april-5-2023/ farmers-brace-for-more-destruction-losses-fromfloods/.

SEED, FEED AND FIELD - SPRING 2023 7
 Photo/Tyler Ribeiro
NEW HORSE BARN AND RIDING ARENA FULFILL A LIFELONG DREAM

Virginia McMahon took up horseback riding as a young girl, developing a passion that continued as a member of her college equestrian team and through her years as an elementary schoolteacher and into retirement as a riding instructor.

She finally realized her dream of owning her own horse barn, which was completed in December 2020, in East Woodstock, Connecticut. “I always rode horses my whole life,” she said. “It’s my salvation and my escape.”
Prior to moving to Connecticut, Virginia and her husband, Christopher, a retired rear admiral in the U.S. Maritime Service, lived on Long Island, New York, where they leased a barn for eight years so she could teach riding.
Their daughter, also an avid equestrian, helped out in the barn, but once she went to college, Virginia decided to close the business. “I lamented to my husband I would love to have my own barn, and that planted the idea that maybe we could work something out,” she said. “We began looking for a setting where we wanted to live and retire.”
The couple purchased a 42-acre property in East Woodstock, which they named Stargazer Farm. There they renovated an old farmhouse and built a new horse barn. The corrugated steel structure, designed and constructed by Morton Buildings, includes a 170-by-80-foot indoor ring and 175-by-100-foot outdoor ring.
SEED, FEED AND FIELD - SPRING 2023 9
The facility has 18 horse stalls, each 10 by 12 feet with mats and individual fans, two indoor grooming stalls, and indoor and outdoor wash stalls. There are also two tack rooms, a storage room, office viewing area, utility room and hayloft with functioning hayloft door.

Other features include:
• 60-foot round pen.
• Grass riding field and large grass pastures.
• Individual paddocks.
• Grass and wooded riding trails.
• Flex fencing in paddocks and pastures.
“Everyone loves the barn. It’s fantastic, and the farm is very beautiful,” Christopher said. “We looked up and down the East Coast before settling on this area.”
Virginia currently has six horses and ponies for conducting hunt seat equitation lessons for all levels, ages six through adult. She also conducts summer pony camp as part of the community’s summer recreational program for kids. The rest of the stalls are rented by boarders.

“I enjoy teaching riding and imparting information about being a better horse person,” she said. “It’s a blast, really a lot of fun!”
When she has time, Virginia continues to ride for enjoyment. Christopher isn’t into horse riding himself, but he does help out with the business.
The family’s equestrian tradition recently extended to a third generation. The McMahons’ granddaughter, age three, also rides.
To learn more, visit www.stargazerfarmct.com. For more information about Morton Buildings’ equestrian projects, visit www.mortonbuildings.com/projects/ equestrian.
SEED, FEED AND FIELD - SPRING 2023 10
Pictured below: Virginia McMahon

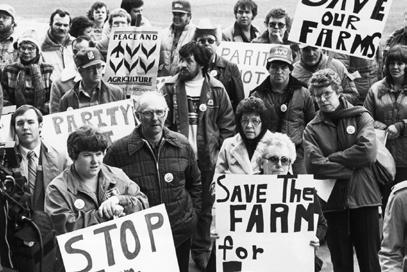
REMEMBER THE 80S? WE DO.
The current economic situation feels a little too reminiscent of the 1980s; one of the most difficult decades for American farmers.

AgriFinancial Founder and President, Alan Singleton, reflects on that time, “During the financial crisis of the 80s, I was a relatively young loan officer and I remember that time very well. Profitability diminished, working capital declined quickly, and refinancing current and intermediate debt to long-term real estate loans (many at variable rates) occurred over a few years. Then interest rates jumped substantially, delinquencies ballooned, and real estate values tanked.”
It was a relatively uncertain time, out of which grew expanded crop insurance protections, the secondary market for agricultural lending, Farmer Mac, and a small, Midwestern-based lending group called American Farm Mortgage Company, now called AgriFinancial. All of these built to offer farmers unique and alternative solutions to keep growing and manage risk; especially financially, with long-term fixed rates that had been difficult to find in years prior.
While many within the agricultural sector are sensing that eerie déjà vu about today’s economy, there are several important considerations that may provide comfort for those uneasy feelings.
Recently, the National Corn Growers Association (NCGA) released an article that compared key economic factors of the 1980s with those of today. Lead Economist for NCGA, Krista Swanson, offers an analysis of three data points which we’ll cover in this article and add a fourth of our own. You can ready the entire article here: https://ncga.com/stay-informed/ media/editorials/article/2023/03/agriculture-and-theeconomy-an-assessment-of-our-current-situationversus-the-1980s.
FARM DEBT VS. FARM SOLVENCY
According to the USDA Economic Research Service (ERS), farm sector debt is forecast to hit $535.1 billion in 2023. Krista Swanson notes in her article, “Up until 2020, farm debt remained below the 1980 inflation adjusted peak of $501.7 billion.”
Rising interest rates, bank failures, and a high rate of inflation have many in the agriculture community saying, “Not again!”
Background Image: Farmers and supporters rally in 1983 in Iowa, seeking price supports for crops and a moratorium on farm foreclosures. Photo: Bettmann Archive Sourced from WSJ.com
While this statistic may make an agricultural producer pause, farm solvency is much stronger than that of the 1980s. Solvency refers to the farm’s ability to cover long-term debts.
The article continues, “For 2023, the farm sector debt-to-asset ratio is forecast at 13.22, stronger than the 1985 peak at 22.19.” This means that an average farmer has less interest-bearing debt in relation to their income-producing assets.
INFLATION VS INTEREST RATES
Tracking interest rates from the last three years creates a graph that, if a diagram of a roller coaster, would take you on a wild ride. Perhaps, a wild ride is exactly how to describe it. “The Consumer Prices Index (CPI), a common measure of inflation, hit 9.1% in June 2022, reaching the highest point since 1981,” states the article from NCGA. The cure for a high rate of inflation? The Federal Reserve raises rates. This isn’t new news.
Since March 2022, the Fed has raised rates nine times. The frequent increases have also increased concerns and possible aversion to financing a new purchase, yet despite these recent hikes, current rates stand at just a quarter of where they wound up in the 80s. Topping out at 20% (federal funds rate), today’s projection of 5% by end-of-year pales in comparison. As with anything, it takes time to adjust to change. It’s understandable how today’s rate seems so high when it’s more than double what we were looking at just two short years ago.
Another key factor to consider when thinking about interest rates is the percentage of income that goes towards interest expenses. In our most recent edition of Seed, Feed and Field, in the article titled The Farm
Economy in Transition (Page 18), “In 1983, farmers and ranchers spent nearly thirty-five cents of every dollar earned farming on interest. Today, that figure is approximately twelve cents, below the 60-year average of fifteen cents.”

As difficult as it is to think about the higher rates of today, it’s good to acknowledge they are effectively reducing inflation; now down to 6%, but still a long way off from our goal of 2%.
BOND INVERSION VS. POSITION
When it comes to lending, it’s relatively easy to understand that the longer you commit to lending money, the more risk you take on. So, when it comes to rates, you would expect that longer-term rates would be higher than those of short-term loans. Over the last few months, the opposite has been true as the 2 Year Treasury Bond Yield exceeded the 10 Year, creating a bond inversion. In fact, on March 8, 2023, it was the largest inverted spread (1.07%) since 1981. The article states, “When that has happened in the past, a recession within two years has occurred 98% of the time.”
Any mention of economic recession can send anyone, not just those in the ag community, into slight panic; however, should we enter into a recession, production agriculture is better positioned to sustain operations. USDA ERS forecasts an increase to farm sector equity by 5% in 2023 as well as an increase by 5.2% of farm sector assets.
An increase to equity and assets means better solvency. To state it differently from earlier, if you had to sell off everything today to cover your debts, having strong solvency would mean the value of your assets would easily cover your debt obligations.
SEED, FEED AND FIELD - SPRING 2023 13
More important than solvency is liquidity. That is the ability to pay short-term debts out of cash, assets that can easily be converted to cash, or available credit. Liquidity is what allows a farmer to withstand shortterm volatility without selling long-term assets or resorting to more debt. Referencing liquidity during the 1980s farm crisis, Singleton offered a perspective for farmers who were able to sustain operations during those trying times, “Those very difficult years also brought opportunity to those individuals that managed the situation and maintained liquidity.”
COMMODITY MARKETS VS. PRODUCTION
Lastly, let’s talk about commodity markets; our fourth added data point. In the 1980s, the average market price of corn was $2.67. When adjusting for inflation, that would be $7.49 today. Unfortunately, corn has averaged almost a dollar less than that at $6.52/bu. year-to-date.
While market prices haven’t seemed to keep pace, production levels cannot be dismissed. Again, using
corn as our example, in the 1980s, yields ranged from 80-120 bushels/acre. Today, the USDA places corn production at an average of 177 bu. per acre.
Here are some basic calculations to provide an example:
• One acre of corn in the 1980s would sell for approximately $749.

(gross profit based on 100 bushel avg. and inflation adjusted market value of $7.49/bu.)
• One acre of corn today would sell for approximately $1,154.04.
(gross profit based on 177 bushel avg. and YTD 2023 avg market value of $6.52/bu.)
As we gaze into our crystal ball, no one knows exactly what we will encounter economically; however, no matter how many similarities you can draw between the 1980s and today, we can find hope and comfort in understanding how there are many ways in which they’re different.
SEED, FEED AND FIELD - SPRING 2023 14
Farmers and supporters rally in 1983 in Iowa, seeking price supports for crops and a moratorium on farm foreclosures. Photo: Bettmann Archive Sourced from WSJ.com
References:
Resource Center | U.S. Department of the Treasury. (2023, April 17). U.S. Department of The Treasury.
https://home.treasury.gov/resource-center/data-chart-center/interest-rates/TextView?type=dai ly_treasury_yield_curve&field_tdr_date_value=2023
USDA ERS - Farm Sector Income Forecast. (n.d.). https://www.ers.usda.gov/topics/farm-economy/ farm-sector-income-finances/farm-sector-income-forecast/#:~:text=Farm%20sector%20as sets%20are%20forecast%20to%20increase%205.2,percent%20in%202022%20to%2013.22%20 percent%20in%202023
National Corn Growers Association. (n.d.). Agriculture and the Economy: An Assessment of Our Current Situation Versus the 1980s. https://ncga.com/stay-informed/media/editorials/article/2023/03/ agriculture-and-the-economy-an-assessment-of-our-current-situation-versus-the-1980s

Historical Corn Grain Yields in the U.S. (n.d.). https://www.agry.purdue.edu/ext/corn/news/timeless/ YieldTrends.html
Corn Prices - 59 Year Historical Chart. (n.d.). MacroTrends. https://www.macrotrends.net/2532/corn-pric es-historical-chart-data
US Inflation Calculator. (2023, April 14). Inflation Calculator | Find US Dollar’s Value From 1913-2023. US Inflation Calculator | Easily Calculate How the Buying Power of the U.S. Dollar Has Changed From 1913 to 2023. Get Inflation Rates and U.S. Inflation News. https://www.usinflationcalcula tor.com/
The Feed
Farmer Mac’s Quarterly Perspective on Agriculture


© 2023 Federal Agricultural Mortgage Corporation. All Rights Reserved. www.farmermac.com/thefeed Welcome to the Next Level SPRING 2023
LETTER FROM THE CHIEF ECONOMIST
natural gas prices. Leveling-up incomes and costs seem almost ubiquitous in the U.S. rural and agricultural economy.
Economies go in cycles. This concept is simple and almost universal—good times always wind down, and bad times eventually fade. But as business conditions rise and fall, they are subject to short-term and long-term trends that can extend, exacerbate, or unsettle these cycles. As the U.S. agricultural economy and its many participants come off a record-setting farm income year, cycles and trends are top of mind as we all set budgets and hopes for the year ahead. Record-setting years have a strange way of raising expectations and risks simultaneously, creating a high bar that even the best economic athletes may have difficulty clearing.
The trends pushing up our high-water marks come in a multitude of forms. High grain commodity prices in 2022 reset many producers’ profit prospects and put upward pressure on land values. High grain prices and drought conditions skyrocketed animal feed costs, causing herd consolidation and contraction. Food price inflation in 2021 and 2022 created space to pass some of these higher costs through to consumers. Food prices slow down but don’t go down very often (only four times since 1960), which provides support to higher levels of commodity prices and production costs. Farm expenses are playing catch up, particularly for labor and interest, raising the cost of production in ways that are primarily outside of producers’ control. Farm lenders did step up between 2020 and 2022 to help capitalize on the rural and agricultural economic expansion. But higher interest rates still raised the cost of capital and stressed bank balance sheets in unforeseen ways. Meanwhile, rural utility providers are coping with trends in fuel costs and energy transition: supply chain disruptions from the COVID-19 pandemic hurt renewable energy project development, and the war in Ukraine created a massive bulge in
Can America’s farming and rural economy succeed at this new level? Historically, the U.S. ag sector has experienced three step-ups in economic activity: the 1940s after World War II, the 1970s during trade expansion, and the 2010s after a biofuel boom and drought. Following each of those expansions, U.S. farmers and ranchers adapted to lagging expenses and made critical investments in their operations that helped them endure the subsequent contractions. Rural economies have also adapted to the continuously tightening labor markets through automation and investments in connectivity. Through adaptation, U.S. farmers, ranchers, and rural businesses can survive and thrive during economic expansions, contractions, and even new levels. And with the support of a healthy and vibrant network of ag and rural lenders, raising the bar is not an individual effort; it’s a team sport. We hope you enjoy the collection of articles in our spring edition, curated to explore and uncover how the rural economy has expanded and what it might mean for the nearterm rural economic outlook.
Wishing you and yours a healthy and happy spring,
Jackson Takach, CFA Chief Economist at Farmer Mac
THE FEED - SPRING 2023 19
Welcome to the Next Level
A BIG STEP HIGHER, A SMALL STEP DOWN FOR FARM INCOMES
Farm incomes are forecast to drop in 2023 after surging to record levels last year. While most agricultural commodity prices remain elevated today, farmers may face significantly higher production expenses. Still, consecutive years of elevated incomes have boosted farm financials and positioned the sector to manage tighter profitability conditions ahead.
Outlook for 2023 Farm Incomes
In February, the USDA released its initial projections for 2023 farm sector financials. The report contained both positive updates regarding farm finances last year along with a subdued outlook for the year ahead. While Net Cash Farm Income (NCFI) has risen for six consecutive years, the
USDA projects it will drop 21% year-over-year in 2023. The projected decline, if realized, signals an end to one of the most profitable periods for U.S. farmers in decades. However, the decline in many ways reflects how abnormally profitable 2022 was within the agricultural sector. NCFI rose to a record level in 2022, propelled by robust export demand and a rebounding global economy. Even accounting for inflation, 2022 NCFI surpasses all previous highs, including the 1970s

THE FEED - SPRING 2023 20
1, 2, 3, 4, 5, 6
and early-2010s. So, while the forecast decline in 2023 is significant, it isn’t too surprising: it was unlikely that farm incomes could rise further from such an extraordinarily high level.

The forecast decline in 2023 NCFI is due to both lower revenues and higher costs. Producers in most agricultural sectors benefitted from a surge in prices and cash receipts last year. In 2022, yearover-year crop and livestock receipts increased by 24% and 19%, respectively. Global inventories of most agricultural commodities were relatively tight entering 2022. This set the conditions for a subsequent spike in prices when Russia invaded Ukraine in February. The timing benefitted U.S. producers, as many had already locked in input costs ahead of Russia’s invasion but had yet to lock in the price of their grain. The result was historic profitability. However, commodity prices have trended lower after peaking in mid-2022. Favorable growing weather in the U.S. and South America last year along with a Russia-Ukraine grain treaty have helped alleviate the global supply crunch and started a trend of lower commodity prices. In 2023, year-over-year crop and livestock cash receipts are forecast to decline by 3% and 6%, respectively.
Contrary to farm revenues, expenses are forecast to increase in 2023. Cash expenses jumped nearly 20% in 2022 as global energy prices surged. Total fertilizer and fuel expenses jumped 44% year-over-year in 2022. Energy prices have since declined but have been offset by rising feed, seed, and pesticide costs. Higher interest rates are also weighing on producer margins this year. Actions by the Federal Reserve to combat high inflation have led to a sharp uptick in short-term borrowing costs. Total interest expense on non-real estate farm loans is forecast to increase 45% this year relative to last year.
Acknowledging lower revenues and higher expenses, net farm incomes are still projected to be elevated this year. The current forecast shows NCFI will remain 21% above the previous inflationadjusted 30-year average. This forecast remains unrealized and future updates may be influenced by the Russia-Ukraine war, South American production, and a potential recession this year, among other factors. Still, the current forecast suggests that another year of strong sector profitability is likely.
THE FEED - SPRING 2023 21
2020
Figure 1: Net Cash Farm Income Source: USDA ERS Farm Income and Wealth Statistics, December 2022
The surge in recent incomes has bolstered farm sector balance sheets. Between 2018 and 2023, farm sector assets increased by 34% to just over $4 trillion. The underlying factor has been the strong growth of farmland values. Farmland constitutes approximately 80% of farm sector assets. Changes in values can therefore have outsized impacts on producer balance sheets. Over the same period, equity increased by nearly $900 billion dollars on the farm sector balance sheet.
Acknowledging these tailwinds, higher farm expenses this year will put modest pressure on farm finances. The USDA projects that farm sector working capital will decline 12% year-over-year in 2023. Working capital has historically tracked farm incomes as assets are banked during profitable periods and spent when margins are squeezed. Therefore, declining working capital provides another signal of tighter financial conditions. One key difference to the last broad decline in working capital is the current interest rate environment. Farmers were able to utilize short-term financing at relatively low interest rates when working capital declined from 2014 to 2018. However, the average interest rate on agricultural production loans is 48% higher today than during that period. Therefore, producers that do not have the working capital to self-finance their operations face significantly higher operating costs.
Declining Government Payment
Favorable commodity prices and incomes are projected to contribute to a sharp decline in direct government payments to farmers in 2023. Government payments are projected to drop 34% year-over-year in 2023 to $10.2 billion. Adjusted for inflation, this would be the lowest level since 1982, just prior to the onset of the 1980s Farm Crisis. Government support peaked in 2020 at nearly $46 billion dollars, due largely to
ad hoc programs intended to offset the COVID-19 disruption and trade dispute with China.
This pivot away from government payments dictating farm incomes is generally viewed as a positive development for the agricultural sector. Government payments are an important support mechanism for the food and agriculture sectors, but if support payments are too high, it can be a sign of structural or market problems for producers. Government support as a proportion of NCFI is projected at the lowest percentage since the early-1980s. Furthermore, nearly 40% of government payments in 2022 are attributable to conservation programs, many of which didn’t even exist until recent decades. Government payments could rise in the years ahead if commodity prices decline. Whether or not this occurs, relatively low government payments in 2023 should help reverse some criticism of high government payments to farmers in 2020 and 2021. Solidifying support for agricultural sector programs will be key for the Farm Bill negotiations that began earlier this year.
In Conclusion
Farm cash flows are expected to decline in 2023 as farm revenues retreat from historic levels. Still, the health of the agricultural economy remains strong. Farmland values are up following six years of rising farm incomes. Meanwhile, government payments have dropped as pandemic-era programs expire, and the necessity for additional payments has waned. Rising interest rates and higher operating expenses will undoubtedly lead to tighter profit margins for many producers. Looking ahead, commodity prices may remain volatile due to geopolitical events, but robust farm balance sheets reduce the risk of a significant uptick in farm sector stress or an immediate downturn in farm loan performance.
THE FEED - SPRING 2023 22
Farm Balance Sheet

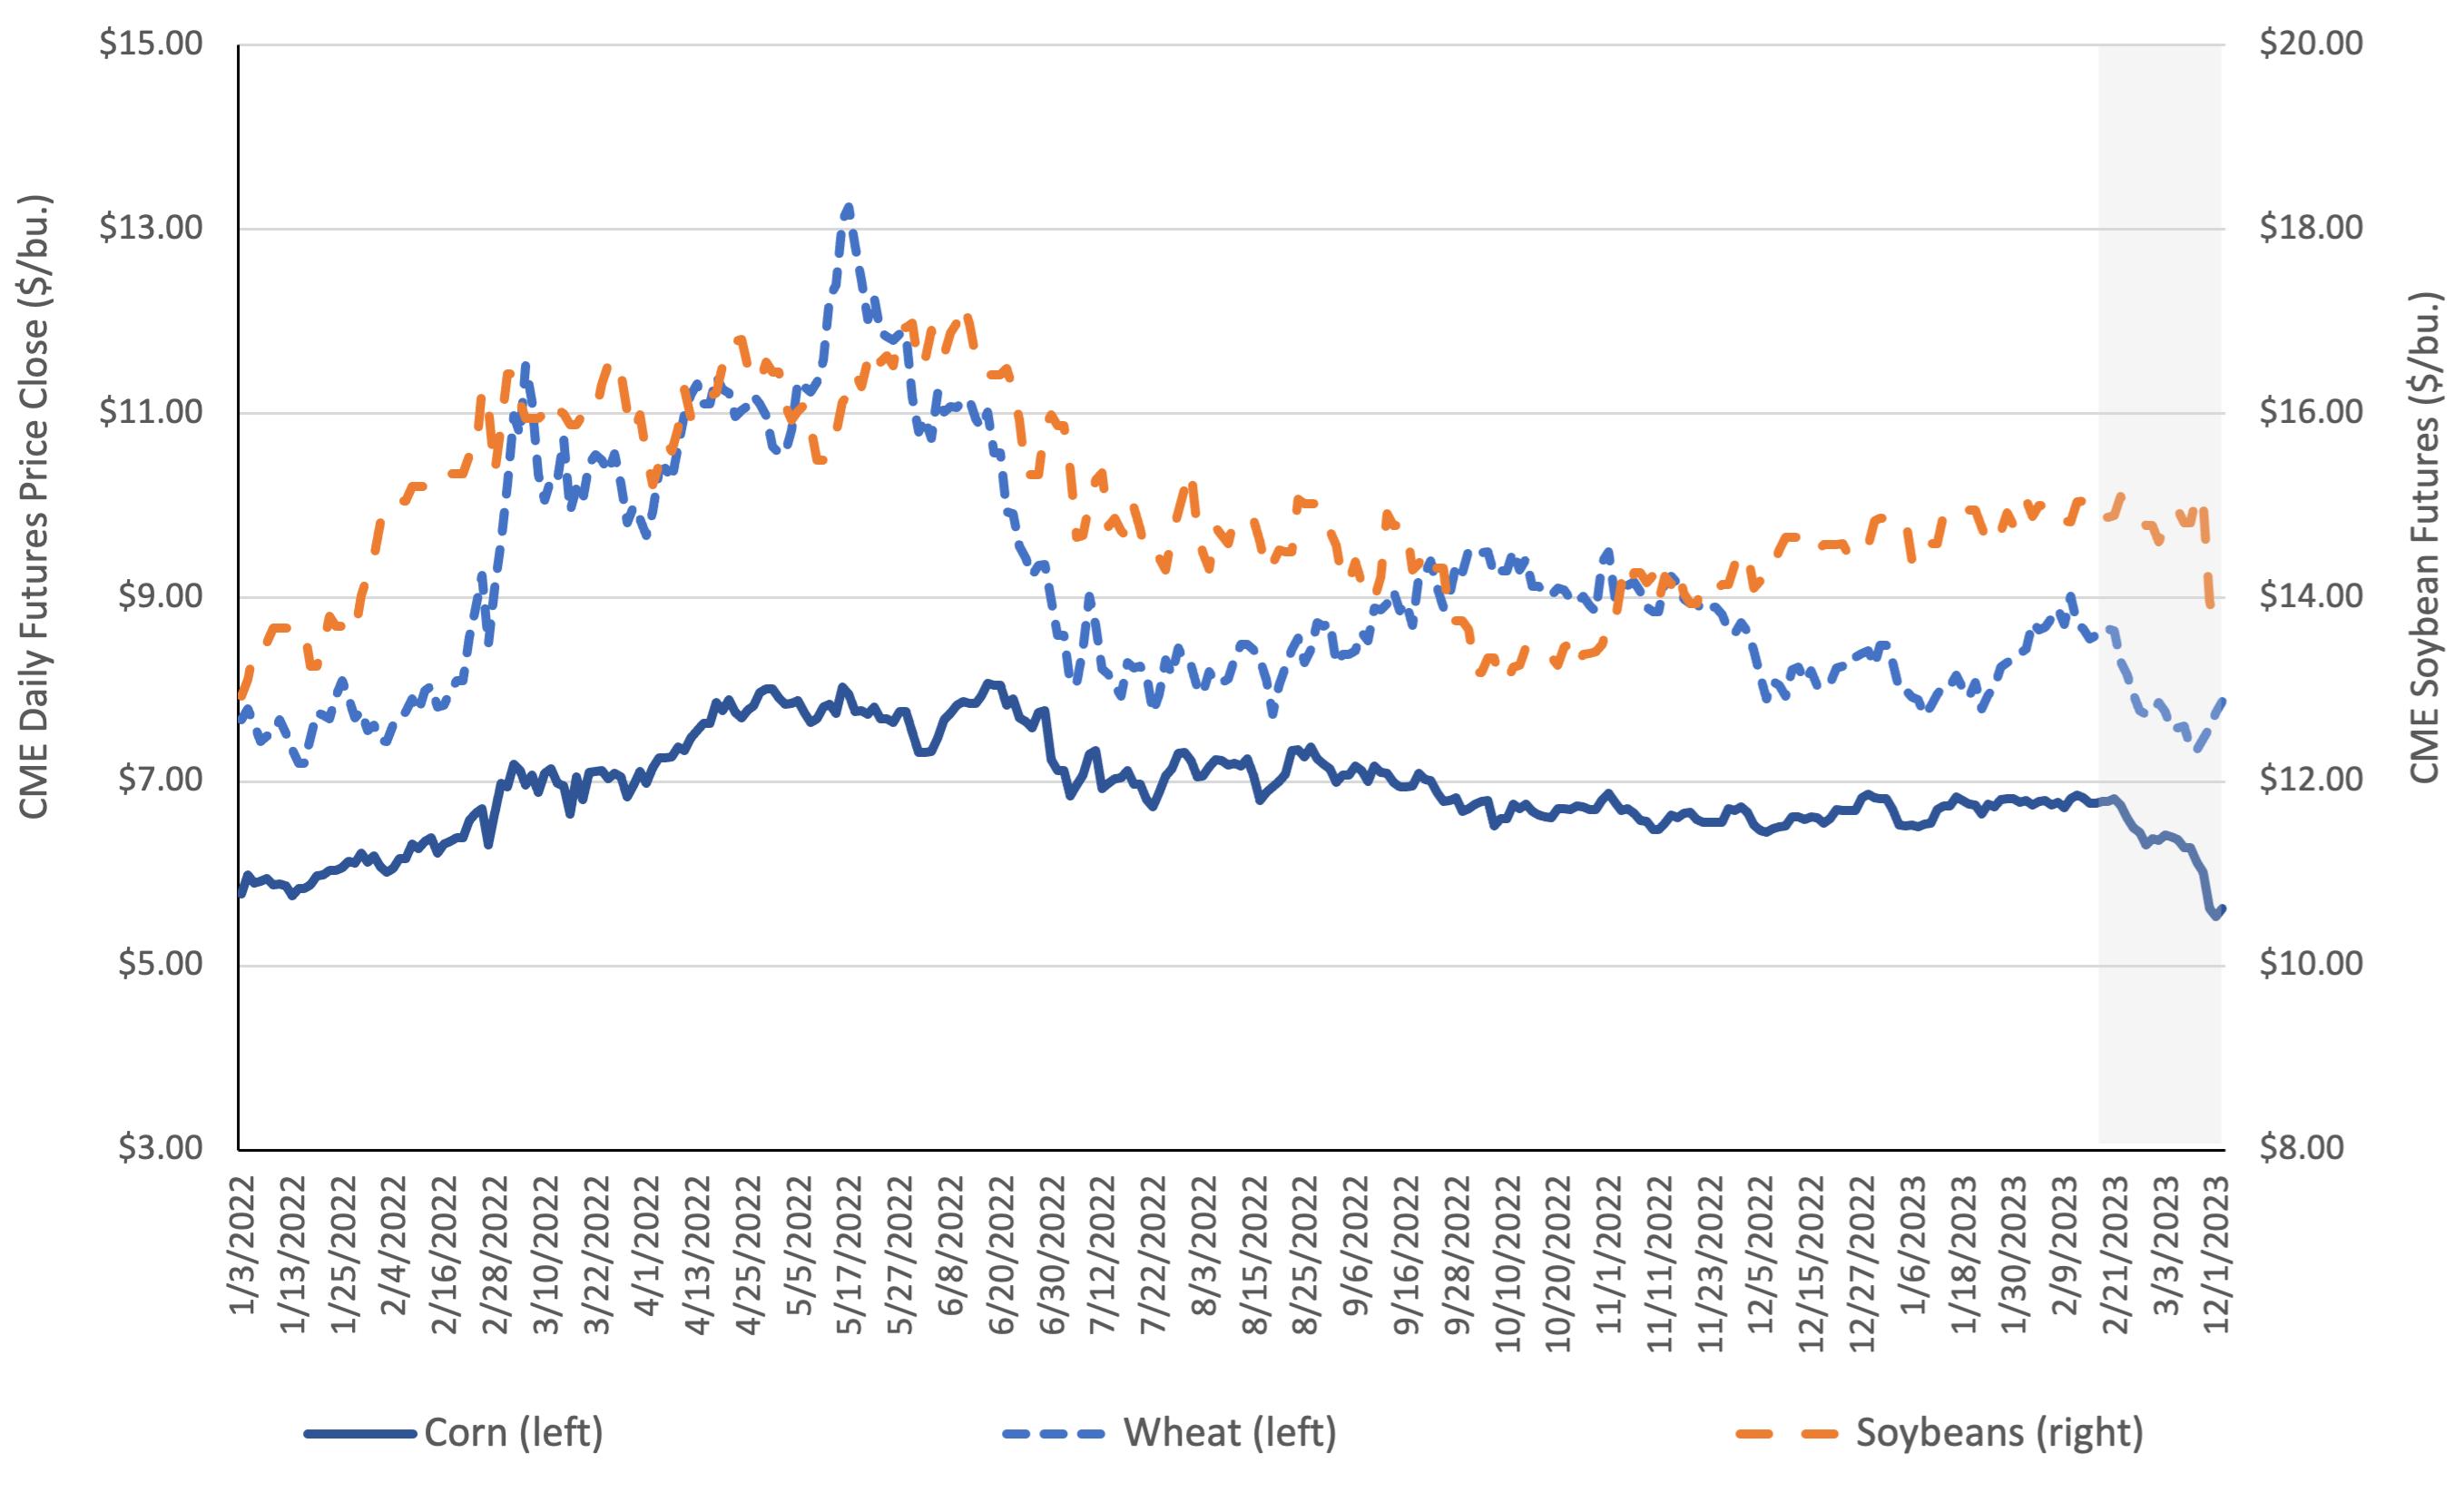
GRAINS AND OILSEEDS SUPPLIES CHALLENGED BY BIG BRAZILIAN CROP
7, 8, 9, 10
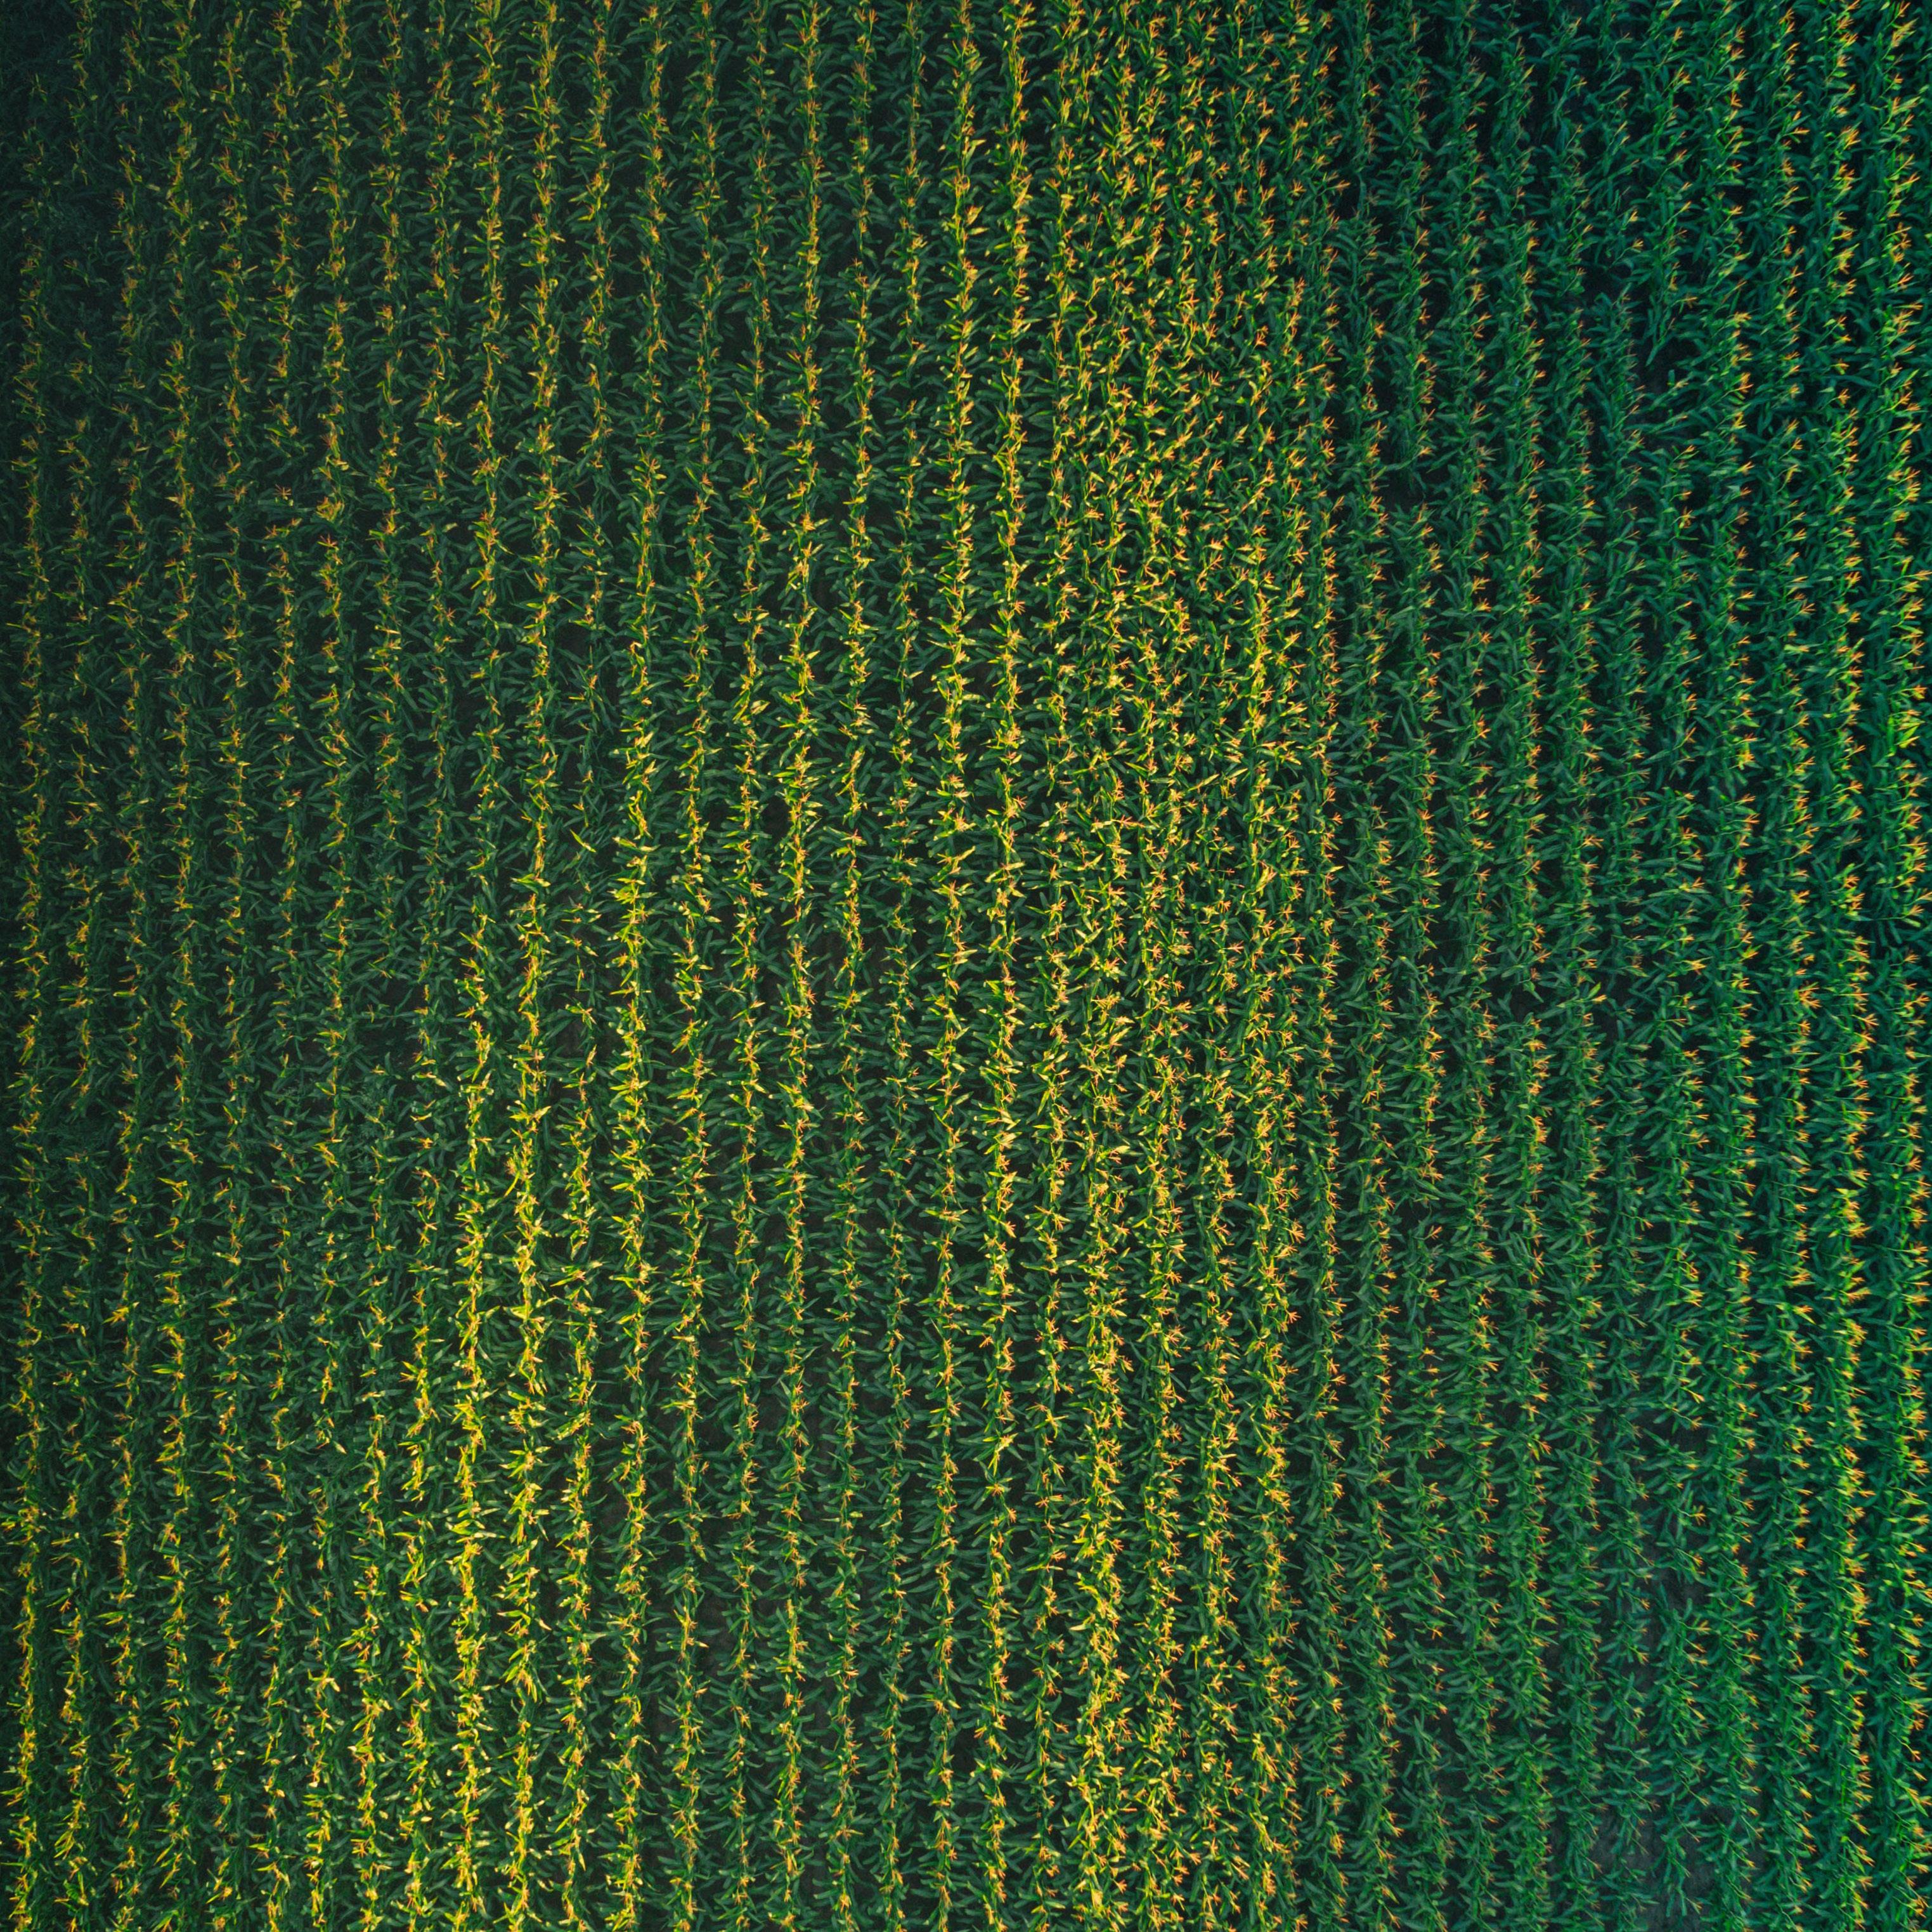
Due to elevated commodity prices, corn, soybean, and wheat returns were record-setting in 2021 and 2022. However, Brazil will likely have a bumper crop of corn and soybeans in 2023, pushing up global supply and putting downward pressure on global prices. Operating expenses caught up with grain and oilseed prices, but demand drivers could be strong enough to outrun the higher expenses.
Grain operations in the U.S. have had a good run since 2020. High commodity prices drove revenues to new highs in 2021 and 2022. Input costs rose, but much of that run-up happened after farmers procured supplies for the 2022 crop year. Depending on the crop grown, operator profits soared to new records on a per-acre basis in 2021 and 2022. Stock-to-use ratios, a measure of the amount of supply relative to the demand, for corn, soybeans, and wheat touched multi-year lows in 2021 and 2022. The disruption in Ukrainian corn and wheat exacerbated these market conditions, pushing
supply and demand further apart and increasing world food price volatility.
But now, two sources of market disruption are taking form in early 2023. First, Brazil is set for a bumper crop of corn and soybeans in 2023; the USDA’s March World Agricultural Supply and Demand Estimates (WASDE) forecast a record crop for both commodities. Brazilian farmers planted approximately 5% more acres in 2023 compared to 2022. While there is some speculation that a warmer, dryer fall could hurt ultimate yields, the downside risk to the crop is limited this late in
THE FEED - SPRING 2023 24
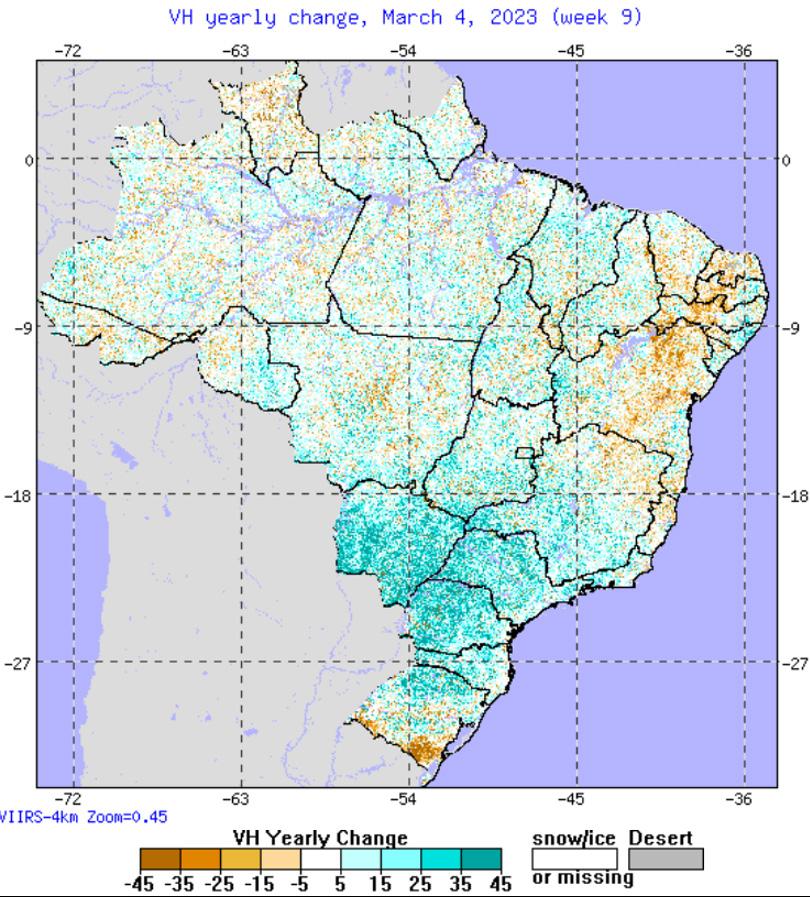
their growing season. Vegetative health in early March was much improved compared to 2022, further evidence that Brazilian crop yields could still be healthy at harvest. Large corn and soybean crops in Brazil increase global supplies and can put downward pressure on commodity prices.

Second, relations between the U.S. and China became more strained in early 2023. National security concerns, the future fate of Taiwan, deglobalization, and the ongoing Russia-Ukraine war have challenged Sino-American relations. China was America’s largest agricultural trading partner in 2021 and 2022, and a downturn in the relationship could jeopardize billions in demand for U.S. exports, particularly for soybeans.
With production costs in greater focus, supply and demand are likely becoming the biggest drivers of commodity prices and crop profitability in 2023. Corn and wheat are leaking out of Ukraine at a
slower pace and smaller volume than pre-war. Despite concerns about Sino-American relations, U.S. exports to China were exceptional in January and February of 2023. Brazil will certainly provide an effective challenge for U.S. producers, putting additional supply in the market in 2023. Renewable diesel and other low-carbon biofuels are spawning new sources of domestic demand for soybean oil and corn that could help offset any disruption to exports. The U.S. Energy Information Administration estimates another 100,000 barrels per day of renewable diesel production will come online in 2023, and the total U.S. production capacity will more than double by 2025. Soybean, canola, and corn oil will be high-energy feedstocks for renewable diesel and sustainable jet fuel. Taken together, the increases in grain demand could be an important offset to the increasing supply, and growers and lenders should continue to follow both threads carefully into 2024 to monitor profitability levels.
THE FEED - SPRING 2023 25
Figure 2: Grain Futures Prices in 2022 and Futures Curve into 2023
Source: CME Futures Data, Author’s Calculations
Futures Curve
THE FEED - SPRING 2023 26
Source: NOAA Center for Satellite Applications and Research

FARMERS AND RANCHERS REACT TO HIGHER RATES
11,
Agricultural interest rates rose substantially in 2022 and early 2023. Farmers and ranchers can adapt to higher interest rates by stomaching the higher payments, changing the loan products in use, or adjusting the amount of borrowing. Lenders can also stay ahead of changing interest rates by keeping in tune with the market and their customers to take advantage of any rate drop. Ultimately, farmers and ranchers should have the income and working capital this year to manage the higher-rate environment in the short term.
Farmers and ranchers are processing a new interest rate regime that has been increasing at the fastest pace since the 1970s. In 2022, the average interest rate reported by banks in the Tenth Federal Reserve district (Wyoming, Colorado, Nebraska, Kansas, Oklahoma, and parts of New Mexico and Missouri) rose by more than 2.50 percentage points on real estate loans and almost 3.00 percentage points on operating debt. Those rates of increase are nearly

THE FEED - SPRING 2023 28
double the prior high-water mark for the series going back 35 years. Many farmers and ranchers locked in historically-low interest rates between 2020 and 2022, minimizing interest rate expenses on real estate and some operating debt for years. However, some farm debt resets annually, exposing borrowers to the higher rate environment in 2023. Additionally, borrowers looking for refinancing or new mortgage debt will face higher principal and interest payment levels than in recent experience. 12
Borrower Response
Debt-seekers can pull three big levers in this elevated rate environment (and some farmers and ranchers will pull multiple levers simultaneously). First and most simply, borrowers can pay more in principal and interest payments in order to access needed capital, but this can be costly. A 30-year mortgage for a $1 million loan at a 4% interest rate would have an annual payment of around $58,000. The same loan at a 7% interest rate would have an annual payment of around $81,000, or roughly a 40% increase in yearly debt requirements. This difference could be small relative to the operation’s overall balance sheet and income statement, but it could also be a big hurdle for smaller operators.
Second, borrowers might try to find savings via different loan products. If short-term debt is costly due to the Federal Reserve’s Federal Fund Rate target, a borrower may look longer out on the yield

curve for some savings. If long-term rates are also elevated, a borrower can find some middle ground in a product that locks in the rate today but will change in three, five, or ten years and may offer some savings and optionality for the borrower. Indeed, during times of low rates and a flat interest rate curve, loans trading in the secondary market tend to choose a high percentage of long-term fixed rates (see Figure 5).
Third, borrowers can adjust how much they borrow. If a farm operator can cash flow $80,000 in annual principal and interest payments for their real estate debt and they have $2 million in farm real estate to pledge as collateral, a 4% interest rate environment allows them to borrow nearly $1.4 million or a 70% loan-to-value ratio. In a 7% interest rate environment, that same operation would likely only be able to afford a $1 million loan or a 50% loan-to-value ratio. In other words, for a borrower to maintain the same cash flow ratios as they could in a low-interest rate environment, the higher
THE FEED - SPRING 2023 29
Figure 4: Average Interest Rates Reporting in Federal Reserve’s Tenth District by Quarter
Source: USDA ERS Farm Income and Wealth Statistics, December 2022
mortgage interest payments would require them to reduce the possible loan balance by 28%. Lenders, too, can see collateral requirements increase during rising rates. Lenders are not necessarily tightening standards, but loan-to-values naturally fall when borrowers’ cash flows cover a smaller loan amount.
Lender Response
Lenders can also react to the rising rate environment in numerous ways. First, lenders may ensure that borrowers can access loan optionality. Annual operating debt has a natural optionality because of the renewal process, but some longerterm real estate mortgages have prepayment penalties or yield maintenance provisions that can prevent borrowers from refinancing when rates come back down. Lenders can help borrowers maximize their future flexibility with transparency and education on product selection and prepayment optionality. Second, lenders
can monitor the rate environment and look for temporary declines. Like most economic series, interest rates never move in a straight line. There are likely periods of volatility in which rates decline and give windows of opportunity for lenders and borrowers that are paying attention. Finally, lenders can keep in constant contact with their customers on capital needs; if rates start to recede, farmers and ranchers who are prepared and ready to move will be in an excellent position to quickly close on loans at lower rates.
No matter the interest rate environment, farming is a capital-intensive business. Debt will continue to be a part of the capital stack for America’s farmers and ranchers, and ag lenders will continue to provide access to capital at the best rates and terms the market can offer. For 2023, at least, robust farm incomes and elevated working capital give ag borrowers solid footing to handle this dynamic interest rate environment.

THE FEED - SPRING 2023 30
Figure 5: Farmer Mac Loan Product Percentage: Long-term Fixed Rate Products
Source: Farmer Mac Internal Loan Data

TIGHT LABOR MARKET HAS FARMERS LOOKING ABROAD FOR HELP
13, 14, 15, 16, 17
Participation in the H-2A visa program has surged among U.S. agricultural producers in recent years. The program provides growers an alternative to the historically tight U.S. labor market. However, guidelines on pay for H-2A employees can also create a financial burden for growers that participate in the program. Ultimately, the program will likely continue to alleviate short-term labor shortages while also accelerating further mechanization within the agricultural sector.
Arobust labor market remains a bright spot among U.S. economic indicators. The U.S. unemployment rate remained at 3.5% in March 2023, nearly the lowest level since the 1960s, and there are still more jobs to fill. As of January, there were more job openings than available workers. One reason behind the tight labor market has been the
disappearance of workers from the workforce: There are nearly 3 million fewer workers in the workforce today compared to early-2020. Numerous factors are behind the decline in labor force participation, including lack of childcare and inadequate wages to entice workers back following the COVID-19 pandemic. Still, the combined result is a limited supply of available workers for companies to hire.
Tight labor market conditions affecting the broader U.S. economy are incentivizing U.S.
THE FEED - SPRING 2023 32
The Growing Importance of Foreign Labor
agricultural companies to look abroad for workers. The H-2A temporary visa program was created in 1986 and has grown into a vital resource that helps U.S. farmers meet labor requirements. U.S. companies that face labor shortages among domestic workers can use the H-2A program to hire agricultural workers from abroad. These workers are eligible to work in the U.S. for no more than one year and are generally scheduled during peak planting and harvesting periods for labor-intensive crops. As of last year, approximately 8% of U.S. agriculture jobs were filled by H-2A employees.
Applications to hire H-2A workers have spiked in response to the tight labor market. The H-2A program has grown consistently since its inception, tripling in size over the last decade. Application volumes grew even faster last year as employers struggled to staff positions with domestic workers. Using preliminary data, we estimate the number of H-2A workers authorized in 2022 surpassed 378,000, 18% more than in 2021. The number of H-2A workers will likely continue to grow in future years, especially if the

broader labor market remains tight. The majority of H-2A applications originate for jobs in six states. California and Florida together account for over 25% of H-2A jobs. Unsurprisingly, there exists a strong geographic overlap between H-2A applications and the states in which labor-intensive commodities are grown. For example, planting, pruning, and harvesting can require significant labor to produce fruits, vegetables, and some permanent plantings. California, Florida, Georgia, and Washington all produce significant volumes of these types of crops. In other states, H-2A jobs vary widely from nursery workers and foresters to equipment mechanics and agricultural engineers. One common theme, though, is all of these jobs have faced differing levels of labor shortages over the past year.
While the H-2A program has helped alleviate the farm labor shortage in the U.S., the program can also introduce financial uncertainty to employers. Notably, hiring H-2A employees requires strict compliance with minimum wage requirements. The U.S. Department of Labor
THE FEED - SPRING 2023 33
Figure 6: Trends in H-2A Worker Authorizations
Source: U.S. Department of Labor, Author’s Calcuations
annually calculates the Adverse Effect Wage Rate (AEWR) as the minimum wage allowed to be paid to workers in the H-2A program. The AEWR is calculated for each state using USDA survey data but tends to be higher than state and federal minimum wages. As such, over 96% of applications listed the corresponding AEWR as the hourly wage rate on applications in 2022.
Employers generally rely on H-2A employees for labor-intensive jobs and are therefore exposed to the financial burden of increases in AEWR. The rates vary across states, with California’s AEWR at $17.51 per hour, while Georgia, Alabama, and South Carolina face an AEWR of $11.99 per hour. Acknowledging the variance, the average hourly
wage offered on H-2A visa applications rose to $14.68 in 2022, a 7% increase from 2021. Looking ahead, wages are likely to increase further in 2023. Updated AEWR rates suggest the average hourly wage on 2023 H-2A visa applications will rise 8% to $15.88.
Despite the increasing wage rates, the H-2A program provides a vital and unique outlet for farm labor shortages. U.S. farmers and ranchers have faced rising prices for many other input costs over the last year: elevated prices for seed, fertilizer, and fuel have all weighed on profitability. Given this environment, further increases to H-2A wage requirements are a tough pill to swallow. Still, the H-2A program positions

THE FEED - SPRING 2023 34
the agricultural sector better to weather a period of low unemployment and rising wages. Other industries have similar visa programs, but they are limited by a U.S. government-imposed cap that can cause significant delays in hiring. The

importance of the H-2A program to farmers and ranchers is likely to grow, especially if labor market conditions remain tight.

THE FEED - SPRING 2023 35
Figure 8: Average H-2A Hourly Wage by Authorization Year
Source: U.S. Department of Labor
Figure 7: H-2A Jobs by State
Source: U.S. Department of Labor
SWEET AND SOUR: THE TWO SIDES OF FOOD PRICE INFLATION
18, 19, 20, 21, 22, 23
Elevated inflation remains a hot topic entering the 2023 growing season. For many producers, inflation equated to higher input costs last year but also significantly higher revenues. For the Federal Reserve, elevated inflation led to a sharp pivot in monetary policy. Actions from the Fed have helped to moderate demand and have thus far slowed the increase in consumer prices broadly. But food prices are influenced by a variety of factors, and it remains to be seen if they will follow suit with changes in the overall Consumer Price Index (CPI).
Inflation and Interest Rates
After several years of near-zero interest rates, the Federal Reserve responded in force in 2022 to the sharp increase in U.S. consumer prices. Short-term interest rates were raised at the fastest pace in decades, while long-term rates rose in response to a shrinking Federal Reserve balance sheet. Figure 9 shows how the pivot in monetary policy helped reverse the rising trend in consumer prices. The Fed has stated a commitment
to driving inflation even lower, which may indicate we’re seeing a new normal for high-interest rates, at least in the near term.
The impact of persistently high inflation on the agricultural sector varies. Input costs for fuel and fertilizer rose 43% and 32%, respectively, in 2022 as Russia’s invasion of Ukraine sparked a rally in global energy prices. Labor costs also jumped last year as U.S. producers competed for workers in the tightest labor market in several decades. Fortunately, higher costs were largely offset last year by rising
THE FEED - SPRING 2023 36
revenues. Farm-level commodity prices jumped in 2022 and boosted Net Cash Farm Income (NCFI) to the highest level on record.
Elevated Food Prices
Food constitutes a relatively small portion of the Consumer Price Index (CPI) basket but has contributed to the broad increase in consumer prices. The Fed’s goal to reduce inflation means slowing the increase in CPI, including for food prices, but the numerous unique factors driving up food prices complicate that goal. For example, factors like avian influenza and drought conditions across the western U.S., both of which have contributed to higher food prices, cannot generally be solved by monetary policy alone.

Figure 10 displays agricultural products and the corresponding changes in prices that have factored into the CPI calculation. There were numerous individual factors behind the rise in food prices last year. Egg prices surged as an avian

THE FEED - SPRING 2023 37
Figure 9: Inflation vs. Short-term Interest Rates
Source: Federal Reserve, U.S. Bureau of Labor Statistics
influenza outbreak led to lower egg supplies. Beef prices rose due to record export demand amid lower U.S. cattle inventories. Multiple other commodities also benefitted from record export demand, including dairy and poultry. Meanwhile, fruit and vegetable prices rose in response to higher labor, water, and other production costs. The collective impact of these different factors was food price inflation reaching the highest level last year since the late-1970s.

Food price gains are expected to moderate in 2023 but are not expected to pull down overall inflation. Current projections show food prices increasing 8% in 2023, modestly lower than the 10% increase in 2022. Farm-level prices are broadly lower this year relative to last, highlighting an important attribute of retail food prices: labor, packaging, transportation, and other marketing costs constitute a much larger proportion of retail food costs than the underlying commodity. On average, agricultural producers receive only 15% of each dollar spent on food in the U.S. Therefore, changes in costs for the remaining 85% can have
an outsized impact on food prices and inflation. Notably, higher labor and transportation costs have contributed significantly to higher retail food prices over the last year.
Importantly for agricultural producers, farm profitability tends to rise during periods of elevated food price inflation. Since 1951, NCFI has, on average, been 10% higher during years when food price inflation exceeded 5%. When accounting for government payments, which are often countercyclical, the difference in NCFI is even larger. While elevated food prices may weigh on consumer budgets and raise the likelihood of continued interest rate hikes, history suggests that overall farm profitability could follow food prices and remain elevated. Overall, it remains to be seen how food price inflation—and the Fed’s efforts to cool it down—will play out in the near term, but producers and lenders should continue to monitor food price levels as an important indicator.
THE FEED - SPRING 2023 38
Figure 10: U.S. Retail Food Price Index
Source: USDA

THE FEED - SPRING 2023 39
SLOWLY BUT SURELY, U.S. POWER MIX IS CHANGING
24, 25, 26
Power production has been transitioning in the U.S. for almost a decade, but the transition has slowed in recent years. And although electricity prices spiked in 2022, greater diversity in the power mix has helped to mitigate some of the volatility in prices in 2023. Planned power projects in 2023 are focused on renewable generation spread across many rural areas across the country. Increasingly distributed power generation improves grid resiliency but increases the complexity and technology required to meet demand.
America’s energy production industry, once dominated by coal-fired plants, is now rooted in combined-cycle natural gas power and renewables like wind and solar. Between 2012 and 2022, the net generation of utility-scale power generated by coal power plants fell by more than 680 million megawatt hours, or roughly 45% of all coal-fired power production. That production was more than offset by an increase of more than 450 million megawatt hours of natural gas power production (37% increase) and more than 400 million megawatt hours of renewables (200% increase).
The retirement of coal plants from 2014 to 2020 was largely driven by economic forces. Cheap and abundant natural gas improved the profitability and investment payback on new power capacity while increasing regulations and steady coal prices slowly increased the cost of power production from coal. Meanwhile, technology for solar and wind power production and storage continued to improve, decreasing the levelized cost of renewable power production (the breakeven cost of electricity for a power source over its lifetime) to be competitive with natural gas.
This rapid change in the U.S. power mix slowed considerably in 2021 and 2022 due to numerous market dynamics. First, cheap natural gas reduced
THE FEED - SPRING 2023 40
Power Mix
investor returns on new well exploration and processing. Second, supply chains for solar and wind projects were highly disrupted by the COVID-19 pandemic. And third, the Russian invasion of Ukraine and subsequent sanctions against Russian energy exports drove up global energy prices, especially for natural gas. Since 2020, natural gas-fueled electricity has been steady, with fewer megawatts of production scheduled for retirement but also fewer new plants planned to open. Instead, much of the new net generation capacity has come from wind production, with small-scale solar projects gaining momentum in 2022.
of renewable power production, like the Midwest, electricity prices increased at a slower rate of 14%, or at roughly the same pace of inflation. These data suggest that a more diverse mix of fuels decouples some of the relationships between retail electricity prices and energy prices.
Changing energy prices had a significant impact on electricity prices in 2021 and 2022. U.S. average retail electricity prices increased by 21% between December 2020 and December 2022, outpacing inflation by more than 6% during that time frame. In Texas, a state with a high concentration of natural gas-based electricity, the increase was more than 40%. However, in regions with a higher mix
Looking forward, much of the planned capacity for U.S. power generation is coming from renewable sources; primarily solar and battery storage. In fact, approximately 75% of the registered investment in power production for 2023 and 2024 is in solar photovoltaic and battery technology. That said, solar projects tend to be much smaller in scale compared to gas, wind, and nuclear. The average generating capacity of planned solar projects in the next two years is 88 megawatts, compared to 496 megawatts for gas projects and 1,114 megawatts for nuclear power projects. The increase in distributed power generation improves grid resiliency, but the tradeoff is complexity and technology. Rural power providers will likely need to continue to raise the bar on the capabilities of our nation’s increasingly complex power systems in order to meet future demand, minimize costs, and maximize power safety and security.

THE FEED - SPRING 2023 39 41
Figure 11: U.S. Utility-Scale Electricity Generation by Source
Source: EIA Electric Power Monthly; EIA Preliminary Monthly Electric Generator Inventory Data
Power Prices and Future Power Mix
Natural Gas
Source: U.S. Bureau of Labor Statistics, Average Energy Prices by Region and City

Source: U EIA Preliminary Monthly Electric Generator Inventory Data

THE FEED - SPRING 2023 40 42
Figure 12: Inflation-Adjusted Electricity Prices by Region
Figure 13: Planned Power Capacity Additions in 2023 and 2024

FALLOUT FROM THE RUSSIAUKRAINE WAR: ONE YEAR LATER
27, 28, 29, 30, 31
The global economic rebound from COVID-19 was disrupted in February 2022 when Russia invaded Ukraine. The invasion sparked a humanitarian crisis and generated heightened volatility across the energy and commodity markets. Sanctions levied against Russia caused a rapid increase in oil and natural gas prices. Commodity markets were also shaken as Ukraine and Russia are key global suppliers of wheat, sunflowers, and many other agricultural commodities. One year later, commodity prices remain elevated, but a realignment in global trade flows has helped reduce volatility.
Disrupted Grain Production
Ukraine emerged over the last several decades as a key global supplier of food and agricultural commodities. Before Russia’s invasion, the agricultural sector employed over 14% of Ukraine’s population and accounted for over 41% of Ukrainian exports. Fertile soil and numerous ports positioned Ukrainian farmers well to compete in agricultural
export markets. However, Russia’s invasion in March 2022 derailed decades of development within this sector.
Ukrainian grain production declined sharply last year. Historically, nearly 62% of the 102 million arable acres in Ukraine have been utilized for commercial crop production. This dropped to 46% in 2022 as the Russian invasion disrupted growers. The decline was most pronounced in regions that became conflict zones between Russia and Ukraine.
THE FEED - SPRING 2023 44
However, grain production also declined in other regions as farmers were forced to ration crop inputs and fuel across the country.
Among the 16 million acre decline in Ukraine’s harvested farmland in 2022, wheat and sunflowers dropped the most. The decline among these crops reflects the geographic regions most impacted by the war thus far. Sunflower production is concentrated in the northeast and central-eastern region of Ukraine, while wheat is concentrated in the east and south. All of these areas saw intense fighting in the last year, and the continued fighting in these regions will likely prevent a significant rebound in the country’s grain production in the near term.
Impact on Prices
The war in Ukraine continues to have an outsized impact on global energy and agricultural prices. Commodity prices initially spiked in 2022 as global trade flows were disrupted. Then wheat, sunflower oil, and natural gas prices all rose over 50% in the weeks following the invasion. Prices for most commodities remain elevated today but have retreated from the historic levels of 2022. Figure 14 displays the change in price since last year’s peak for numerous commodities affected by the war. Wheat futures prices have dropped 40% from the peak, while corn and soybeans prices have declined 17% and 12%, respectively. The larger decline in U.S. wheat prices is attributable to a record harvest in Australia and a general decline in U.S. wheat export market share over time. Still, high global commodity prices led to a broad increase in U.S. farm revenues in 2022.
For energy prices, the war in Ukraine only added to the volatility of the last several years. Prior to February 2022, energy prices had trended consistently higher after bottoming out during the COVID-19 pandemic. Russia’s invasion of Ukraine accelerated the increase in energy prices, with natural gas prices soaring to record levels. Farmers felt the pinch as fertilizer and fuel prices also spiked. Diesel prices eventually approached $6 per gallon in mid-summer as fears over shortages mounted.
Luckily for U.S. growers, energy prices have slumped ahead of the 2023 growing seasons. Concerns about possible diesel fuel shortages have largely abated. Meanwhile, natural gas shortages predicted for Europe this winter were never realized due to an unseasonably warm winter and sharply higher imports.
After rising during the pandemic, natural gas prices have declined more than 75% since August 2022. This has helped drive down nitrogen fertilizer prices, for which natural gas is a key component. The benchmark New Orleans nitrogen fertilizer price has declined more than 60% since the spring of 2022. Lower fertilizer prices this growing season are helping offset increases among other production costs such as seed and rental rates.
Outlook for Ukranian Grain Exports
Despite ongoing hostilities, Ukrainian grain continues to flow to global markets via railroads to the west and ships in the Black Sea to the south. The United Nations and Turkey, along with other countries, helped broker a trade agreement between Russia and Ukraine in July 2022 that allowed Ukrainian grain to be exported from certain Black Sea ports. The deal was originally set to expire in November but has since been extended twice and is now authorized into May.
The grain deal has helped alleviate a growing food crisis, but Ukrainian grain exports remain a fraction of pre-invasion volumes. Figure 15 compares Ukrainian grain export volumes for the 2022/23 crop to the previous 5 growing seasons. Exports of sunflower oil and wheat are projected to be 31% and 25% lower this marketing year due to both reduced grain production and logistical challenges associated with the war.
Notwithstanding the trade agreement, Russia continues to try to obstruct and impede the resumption of Ukrainian grain exports. By repeatedly attacking electrical infrastructure and port facilities, Russia has limited the pace of export loading capacity. This has led to a backlog of ships, which at times wait weeks to be
THE FEED - SPRING 2023 45
loaded with Ukrainian grain. Among ships that are eventually loaded, Russia has continuously delayed the certification process that is required before the grain can then be delivered to export destinations. All told, the impact of Russia’s actions has been reduced grain supplies for global markets. The current dynamic for Ukraine’s grain
exports is unlikely to change in the near future, and global grain prices will remain elevated as a result. U.S. grain producers could continue to see elevated prices and high incomes to continue in 2023, albeit at lower levels than in 2022.


THE FEED - SPRING 2023 46
Figure 15: Ukraine Exports
Figure 14: Commodity Prices Relative to 2022 Peak
Source: USDA FAS
Source: CME Group, EIA, NYMEX

WATER, WATER (ALMOST)
EVERYWHERE IN THE SOUTHWEST
32, 33, 34, 35
The epicenter of the Southwest drought shifted over the winter. Several large rain and snow storms have brought a reprieve to the parched state of California. Meanwhile, agricultural producers in Arizona and several other states face mandatory water cutbacks due to a drought in the Colorado River basin. And drought conditions have spread further east, still impacting livestock and annual crop producers across the western and southern Plains. Forecasters predict La Niña conditions fading this spring, which could help disrupt the ongoing drought. In the meantime, many agricultural producers continue to face heightened uncertainty surrounding water availability.
Water Deliverance in California
After three years of intensifying drought, California finally received some sorely needed rainfall this winter. In some regions in the state, December and January storms brought record rainfall. While the rain ultimately provides only a small amount of direct relief in replenishing soil moisture, these precipitation events have had a big impact on state snowpack levels.
California relies on melting snowpack each spring to replenish aquifer water levels, making snowpack a closely watched benchmark for residential and agricultural users. Statewide snowpack levels surpassed 237% of historical average this winter, reaching the highest level on record.
The surge in precipitation this winter has sparked optimism among agricultural and urban users alike. Reservoirs throughout the state were significantly depleted by several consecutive years of drought

THE FEED - SPRING 2023 48


THE FEED - SPRING 2023 49
Figure 16: Snow Water Equivalents (inches)
Source: California Cooperative Snow Surveys
Figure 17: California Water Allocation
Source: California Department of Water Resources
leading up to 2023 but now are expected to reach capacity this year. This is a positive shift for Lake Shasta, the largest reservoir in California, where water levels had dropped to 34% of capacity by the end of 2022. The winter precipitation has already lifted Lake Shasta’s water level to 97% of the reservoir’s capacity and will hover near full-capacity as the snowpack melts this spring.
This year’s rebound in the snowpack should directly benefit California’s agricultural sector. The California state water allocation for 2023 was raised to 35% in February, the highest level since 2019. After two consecutive years of minimum allocations, growers are welcoming the projected increase this year. The current allocation of 35% is unlikely to fully satiate demand for irrigation water, but there is reason to believe this allocation may increase, as they historically have been raised once a final water inventory is established in the spring.
The rebound in snowpack levels doesn’t guarantee an end to tight water supplies in California. The last several years of drought
conditions have led to increased demand to pump irrigation water from the ground. The Sustainable Groundwater Management Act Groundwater (SGMA) regulates groundwater usage to long-term sustainable levels. However, the gradual transition to sustainable groundwater pumping has allowed groundwater levels to decline upwards of 25 feet over the last year in some agricultural districts. Replenishing these underground water supplies will likely require more time than refilling a reservoir. Still, historic snowpack and full reservoirs should help recharge aquifer levels and limit groundwater demand in the near-term.
U.S. Southwest
While the drought situation has improved in California, the water situation remains precarious in Arizona and other Southwest states. The two largest reservoirs in the U.S. are Lake Powell and Lake Mead. Both reservoirs currently sit at the lowest water level since their creation decades ago. These reservoirs are linked, as Lake Mead is filled in part by runoff from Lake Powell. Water

THE FEED - SPRING 2023 50
Figure 18: Lake Mead – Water Level
Source: Bureau of Reclamation
levels in these reservoirs have trended moderately lower for decades as agricultural use grew and the population in the U.S. Southwest expanded. And in the last several years, drought has accelerated reservoir-level decline.
In response to the broad decline in water availability along the Colorado River, the Department of Interior declared a Tier 2 water shortage (i.e., a measure of severity established by drought contingency plans) in August 2022. The designation resulted in the loss of up to four million feet of water allocation for seven Colorado River basin states. Arizona faces the largest reduction and will receive as much as 21% less water in 2023 than the historical agreement allocates to the state.
The importance of water conservation continues to grow for Arizona agricultural producers. Currently, nearly three-quarters of Arizona water use is related to agricultural production. Much of this was historically sourced from the Colorado River and related reservoirs. Many producers have been able to pivot to ground-water irrigation in the face of declining reservoir levels. However, a drop in aquifer levels shows this strategy has limits as well.
There is reason to be optimistic that the Tier 2 water shortage won’t be elevated to a Tier 3 designation by officials this year, as snowpack levels in the Upper Colorado Basin entered May at 150% of the historical average and were already above the average annual peak. However, it remains unclear if this factor alone will be enough for officials to downgrade the water shortage to Tier 1, as replenishment of the depleted reservoirs is expected to require consecutive years of above-average precipitation. In the near term, farmers in the U.S. Southwest can expect to have to continue navigating limited water supplies amid greater demand from agricultural and nonagricultural users.
Livestock Impacts
The spread of drought conditions from the U.S. Southwest to the Southern Plains has received comparatively less news coverage but is directly
impacting the agricultural sector. Notably, cattle producers have been challenged by the degradation of pasture conditions due to a lack of rainfall. Over half of the U.S. cattle herd is currently located in drought-affected areas. This is down slightly from the peak of 76% in November, which was the highest level since late-2012. Still, the USDA rates most pasture conditions as fair or poor, leading producers to rely more heavily on hay and other feedstuffs. Hay prices have increased over 20% year-over-year, leading many producers to cull cattle instead.
The U.S. cattle herd has historically cycled through periods of expansion and contraction, but the current situation is relatively unique in size and timing. Total U.S. cattle and calves declined by 2.8 million in January relative to last year. This was the largest decline since 1989. At the same time, retail beef prices hovered near record levels for much of the last three years, while beef exports set a new record in 2022. Processors benefitted most from the robust demand for U.S. beef by capturing record margins while farm level prices stayed relatively low. Still, drought conditions and the corresponding rise in feed prices have limited cattle producers’ ability to expand.
For livestock and crop producers in droughtaffected areas, farm profitability has likely lagged behind other agricultural producers this past year. Higher water costs compounded the already rising production expenses for many growers. Producers unable to source irrigation water experienced lower crop yields and revenues. Crop insurance and ad hoc payments provided moderate relief to some producers. The impact on farm finances can last for several years, though, including after the drought has ended. Rebuilding livestock inventories and replanting permanent crops that were pulled out during the drought will both take time. The predicted end to the La Niña weather pattern this spring is welcomed news for producers across the U.S. Southwest. Future droughts are likely, though, and understanding this ongoing risk is increasingly vital within the agricultural sector.
THE FEED - SPRING 2023 51
AG LENDING INSTITUTION HEALTH IN PERSPECTIVE
36,
37, 38
Rising interest rates affected many banks’ balance sheets and deposit demand in 2022 and early 2023. Silicon Valley Bank’s failure highlighted the importance of asset-liability management in banking and the consequences of rapidly rising interest rates. On average, ag lending institutions have materially different asset-liability profiles compared to recently failed banks. While banking and financial stress could persist throughout the year, ag and rural lenders started 2023 on strong footing.
Stress in the financial sector can send shockwaves through the global economy. Some of the deepest recessions in modern economic history developed when the economic plumbing of global transactions got clogged. When banking regulator and consumerdeposit-protector Federal Deposit Insurance Corporation (FDIC) announced the sudden takeover of Silicon Valley Bank (SVB) on March 10, 2023, shockwaves ensued. The failure of SVB marked the first U.S. bank failure in three years and the secondlargest failure in U.S. history. Signature Bank closed its doors three days later, marking the third-largest bank failure. Between March 6 and March 13, 2023, the KBW Bank Index of publicly traded bank
stocks fell by 25%, with some individual bank stocks falling as much as 75%. On March 12, 2023, the U.S. Federal Reserve launched a new bank liquidity program, the Bank Term Funding Program (BTFP), which allows banks to access short-term borrowings and pledge their long-dated debt securities as collateral. By the end of March, bank stock volatility had calmed, and deposit flows between banks had slowed.
This article explores some of the root causes of SVB’s failure, many of which harken back to the savings and loan crisis of the 1980s and analyzes how agricultural lending institutions compare using the same critical financial metrics.
THE FEED - SPRING 2023 52
Ag Lenders Compared
The allocation of bank assets played a significant role in pushing SVB and other banks toward insolvency. The two main categories of bank assets are loans and debt securities like U.S. Treasury bonds or mortgage-backed securities. Together, loans and debt securities constitute roughly 76% of bank assets, with the balance being cash and other holdings. Banks have relative autonomy in deciding how to allocate assets. Some institutions allocate upwards of 90% of assets to debt securities, while others invest the same proportion in loans. The allocation differences reflect the various markets that each bank operates in, as well as different return targets and market strategies. Agricultural banks (those with more than 25% of their net loans and leases classified as agricultural production or real estate) tend to allocate more assets to loans than debt securities. Loans represented over 60% of ag bank assets at the end of 2022. At SVB, loans only constituted 35% of assets, while debt securities constituted 56%.

SVB’s greater allocation to debt securities did not inherently represent a greater risk to the bank. However, the duration of those debt securities became critical, given their more significant share of overall assets. Over 85% of SVB debt securities had maturities of three
years or longer. Higher coupon rates on longerduration securities helped boost SVB returns in the short run; however, interest rates increased dramatically over the past year as the Federal Reserve tightened monetary policy. Rising interest rates pushed down the value of the long-term securities on SVB’s balance sheet as these securities were paying rates well below the market. SVB shifted the declining value of its debt securities through unrealized losses until a surge in deposit withdrawals forced it to liquidate assets, at which point the losses on securities had to be realized or the bank would be insolvent.
Comparing the composition of assets, agricultural banks entered 2023 better positioned to endure this period of rising interest rates than SVB. Agricultural banks hold a significantly larger proportion of short- to medium-duration assets. Holding shorter maturity assets allows banks to reinvest the capital at market interest rates more frequently. This then allows banks to adjust what interest rates they pay on deposits, which reduces withdrawal demand from customers looking to capture higher interest rates elsewhere. SVB was shifting non-interestbearing deposits to interest-bearing deposits in 2022 in an attempt to retain customers. However, SVB’s ability to pay market interest rates on those deposits was constrained by their significant holdings of long-term securities that paid below market coupons.
THE FEED - SPRING 2023 53
Figure 19: Historical Bank Failures by Count and Failed Assets
Source: FDIC Failed Bank Data
Diverse Capital Providers
Another important differentiator in ag lending is the diversity of lender types. Non-depository institutions like the Farm Credit System, life insurers, and Farmer Mac hold more than half of all farm debt. These financial institutions have different asset-liability dynamics and are less exposed to quick calls on liabilities like bank deposits. In April 2023, debt issued by the Federal Farm Credit Funding Corporation, the Farm Credit System’s funding arm, had an average maturity of more than three years. Farmer Mac’s debt has a similar maturity profile. Virtually none of the Farm Credit or Farmer Mac debt is directly puttable,

which prevents debt holders from calling capital. Farms and rural businesses are fortunate to have a strong network of financially-sound capital providers. Ag and rural banks have excellent credit profiles, stable balance sheets, and a higher percentage of short-term assets that are less interest-rate-sensitive. Furthermore, the sector has many additional capital providers that are not depository, creating redundancy and resiliency for sector capital availability. The rising and elevated interest rate environment may continue to stretch bank liquidity and cause financial stress, but ag lenders came into 2023 in an excellent position to endure heightened volatility.

THE FEED - SPRING 2023 54
Figure 20: Composition of Bank Assets Compared
Figure 20: Composition of Bank Assets Compared
Source: FDIC Call Report Data
Source: FDIC Call Report Data
ABOUT THE AUTHORS
Jackson Takach, Chief Economist, is a Kentucky native whose strong ties to agriculture began while growing up in the small farming town of Scottsville. He has since dedicated a career to agricultural finance where he can combine his passion for rural America with his natural curiosity of the world and his strong (and perhaps unrealistic) desire to explain how we interact within it. He joined the Farmer Mac team in 2005, and has worked in the research, credit, and underwriting departments. Today, his focus at Farmer Mac currently includes quantitative analysis of credit, interest rate, and other marketbased risks, as well as monitoring conditions of the agricultural economy, operational information systems analysis, and statistical programming. He holds a Bachelor’s degree in economics from Centre College, a Master’s degree in agricultural economics from Purdue University, and a Master’s of Business Administration from Indiana University’s Kelley School of Business.
Blaine Nelson is the Senior Economist on the Strategy, Research, and Analytics team at Farmer Mac. In his role, he analyzes trends within America’s agricultural sector, with areas of focus including farmland values, commodity prices, interest rates, and agricultural sector profitability. He disseminates this information to borrowers and lenders to help keep them well-informed about the environment they operate in and to help guide their decisions. Blaine was raised on a commercial row crop and dairy farm in northern Minnesota and went on to earn a bachelor’s degree in Applied Economics from the University of Minnesota and a master’s degree in Agricultural and Applied Economics from the University of Illinois at UrbanaChampaign.
As Executive Vice President –Chief Business Officer, Zack leads the vision, development, and go-to-market strategy of the Farmer Mac brand. He also oversees the company’s Agribusiness activities, including the business development and marketing efforts for its foundational lines of business that provide agricultural lenders across the country with financial solutions and effective risk mitigation tools that allow farmers, ranchers, and agribusinesses access to flexible and affordable credit. In this role, he oversees the company’s expansive loan portfolio, partner and business development strategies, product innovation and standardization, and marketing and corporate communications.


 Riley Croghan-Mejia, Editor-in-Chief
Betsy Urso, Copy Editor & Design
Riley Croghan-Mejia, Editor-in-Chief
Betsy Urso, Copy Editor & Design
SEED, FEED AND FIELD - SPRING 2023 49
LEAD AUTHOR JACKSON TAKACH
CONTRIBUTING AUTHOR ZACHARY CARPENTER
LEAD AUTHOR BLAINE NELSON
ABOUT THE FEED
The Feed is a quarterly economic outlook for current events and market conditions within agriculture and rural infrastructure sectors.
The report is broad-based, covers multiple regions and commodities and incorporates data and analysis from numerous sources to present a mosaic of the leading industry information, with a focus on the latest information from the United States Department of Agriculture and their Economic Research Service.
There are several regularly included sections like weather and major industry segments, but the authors rotate through other industries and topics as they become relevant in the seasonal agricultural cycle. Where the report adds value to readers is through its unique synthesis of these multiple sources into a single succinct report.

We hope you’ve enjoyed this issue.
For media inquiries:
Megan
Pelaez
Director
–
Marketing & Communications mpelaez@farmermac.com
For business inquiries:
Patrick
Kerrigan
Vice President – Business Development
pkerrigan@farmermac.com
THE FEED - SPRING 2023 56
RESOURCES
The information and opinions or conclusions contained herein have been compiled or arrived at from the following sources and references:
1. USDA Economic Research Service, Farm Income and Wealth Statistics (https://www.ers.usda.gov/dataproducts/farm-income-and-wealth-statistics/)
2. USDA Economic Research Service, Farm Sector Financial Ratios (https://data.ers.usda.gov/reports. aspx?ID=17838)
3. USDA Economic Research Service, Net Cash Income (https://data.ers.usda.gov/reports.aspx?ID=17831)
4. United Nations, Black Sea Grain Initiative (https:// www.un.org/en/black-sea-grain-initiative)
5. New York Federal Reserve, Effective Federal Funds Rate (https://www.newyorkfed.org/markets/ reference-rates/effr)
6. Kansas City Federal Reserve, Federal Reserve Ag Credit Survey Data (https://www.kansascityfed.org/ agriculture/agfinance-updates/)
7. CME Group Agricultural Futures Prices (https:// www.cmegroup.com/market-data/delayed-quotes/ agricultural.html#)
8. USDA ERS Outlook Reports: Feed Grain, Oil Crops, and Wheat (https://www.ers.usda.gov/topics/farmeconomy/commodity-outlook/ers-outlook-reportsand-data/)
9. U.S. Energy Information Administration, Today in Energy (https://www.eia.gov/todayinenergy/detail. php?id=55399)
10. NOAA STAR (https://www.star.nesdis.noaa.gov/star/ index.php)
11. Federal Reserve Bank of Kansas City, Ag Credit Survey (https://www.kansascityfed.org/agriculture/ ag-credit-survey/)
12. Federal Reserve Bank of Kansas City, Ag Finance Updates (https://www.kansascityfed.org/ agriculture/agfinance-updates/)
13. Department of Labor, H-2A Disclosure Data (https://www.dol.gov/agencies/eta/foreign-labor/ performance)
14. U.S. Bureau of Labor Statistics, Employment Situation Summary (https://www.bls.gov/news. release/empsit.nr0.htm)
15. U.S. Chamber of Commerce, Understanding America’s Labor Shortage (https://www.uschamber. com/workforce/understanding-americas-laborshortage)
16. Wilson Center, A Look at H-2A Growth and Reform in 2021 and 2022 (https://www.wilsoncenter.org/article/ look-h-2a-growth-and-reform-2021-and-2022)
17. Farmer Mac projection using preliminary Department of Labor H-2A Disclosure Data (https://www.dol.gov/agencies/eta/foreign-labor/ performance)
18. USDA Economic Research Service, Food Price Outlook (https://www.ers.usda.gov/data-products/ food-price-outlook.aspx)
19. Federal Reserve Bank of New York, Effective Fed Funds Rate (https://www.newyorkfed.org/markets/ reference-rates/effr)
20. U.S. Energy Information Administration, Weekly Retail Gasoline and Diesel Prices (https://www.eia. gov/dnav/pet/pet_pri_gnd_dcus_nus_w.htm)
21. USDA Economic Research Service, Farm Income Forecast (https://www.ers.usda.gov/topics/farmeconomy/farm-sector-income-finances/highlightsfrom-the-farm-income-forecast)
22. USDA Economic Research Service, Food Dollar Series (https://www.ers.usda.gov/data-products/ food-dollar-series/quick-facts/)
23. USDA Economic Research Service, Farm Income and Wealth Statistics (https://www.ers.usda.gov/ data-products/farm-income-and-wealth-statistics/)
24. U.S. Energy Information Administration, Electric Power Monthly (https://www.eia.gov/electricity/ monthly/)
THE FEED - SPRING 2023 57
25. U.S. Energy Information Administration, Preliminary Monthly Electric Generator Inventory (https://www. eia.gov/electricity/data/eia860m/)
26. U.S. Bureau of Labor Statistics, Energy Prices by Region (https://www.bls.gov/regions/midwest/data/ averageenergyprices_selectedareas_table.htm)
27. USDA Foreign Agricultural Service, Production, Supply and Distribution (https://apps.fas.usda.gov/ psdonline/app/index.html#/app/advQuery)

28. USDA Foreign Agricultural Service, Ukraine Agricultural Production and Trade (https://www. fas.usda.gov/sites/default/files/2022-04/UkraineFactsheet-April2022.pdf)
29. The World Bank, Agricultural Land in Ukraine (https://data.worldbank.org/indicator/AG.LND.AGRI. K2?locations=UA)
30. U.S. Energy Information Administration, Weekly Retail Gasoline and Diesel Prices (https://www.eia. gov/dnav/pet/pet_pri_gnd_dcus_nus_w.htm)
31. United Nations, Black Sea Grain Initiative (https:// www.un.org/en/black-sea-grain-initiative)
32. California Department of Water Resources, Data and Tools (https://water.ca.gov/programs/ groundwater-management/data-and-tools)
33. Council of State Governments West, Department of Interior Announces Tier 2 Shortage on the Colorado River (https://csgwest.org/2022/08/18/departmentof-interior-announces-tier-2-shortage-on-thecolorado-river/)
34. Arizona State University, Where the Water Goes: Water in Arizonan Agriculture (https://sustainabilityinnovation.asu.edu/food/news/archive/where-thewater-goes-water-in-arizonan-agriculture)
35. National Oceanic and Atmospheric Administration, Colorado Snowpack (https://www.weather.gov/bou/ co_snowpack)
36. Federal Deposit Insurance Corporation, BankFind Suite (https://banks.data.fdic.gov/bankfind-suite/)
37. Federal Deposit Insurance Corporation, Bank Failure Resources (https://www.fdic.gov/resources/ resolutions/bank-failures/)
38. Bloomberg L.P., KBW Bank Stock Index and Member Component Prices, Bloomberg April 2023
THE FEED - SPRING 2023 58
1999 K Street, N.W., Fourth Floor Washington, DC 20006
Phone: 800.879.3276
www farmermac com/thefeed
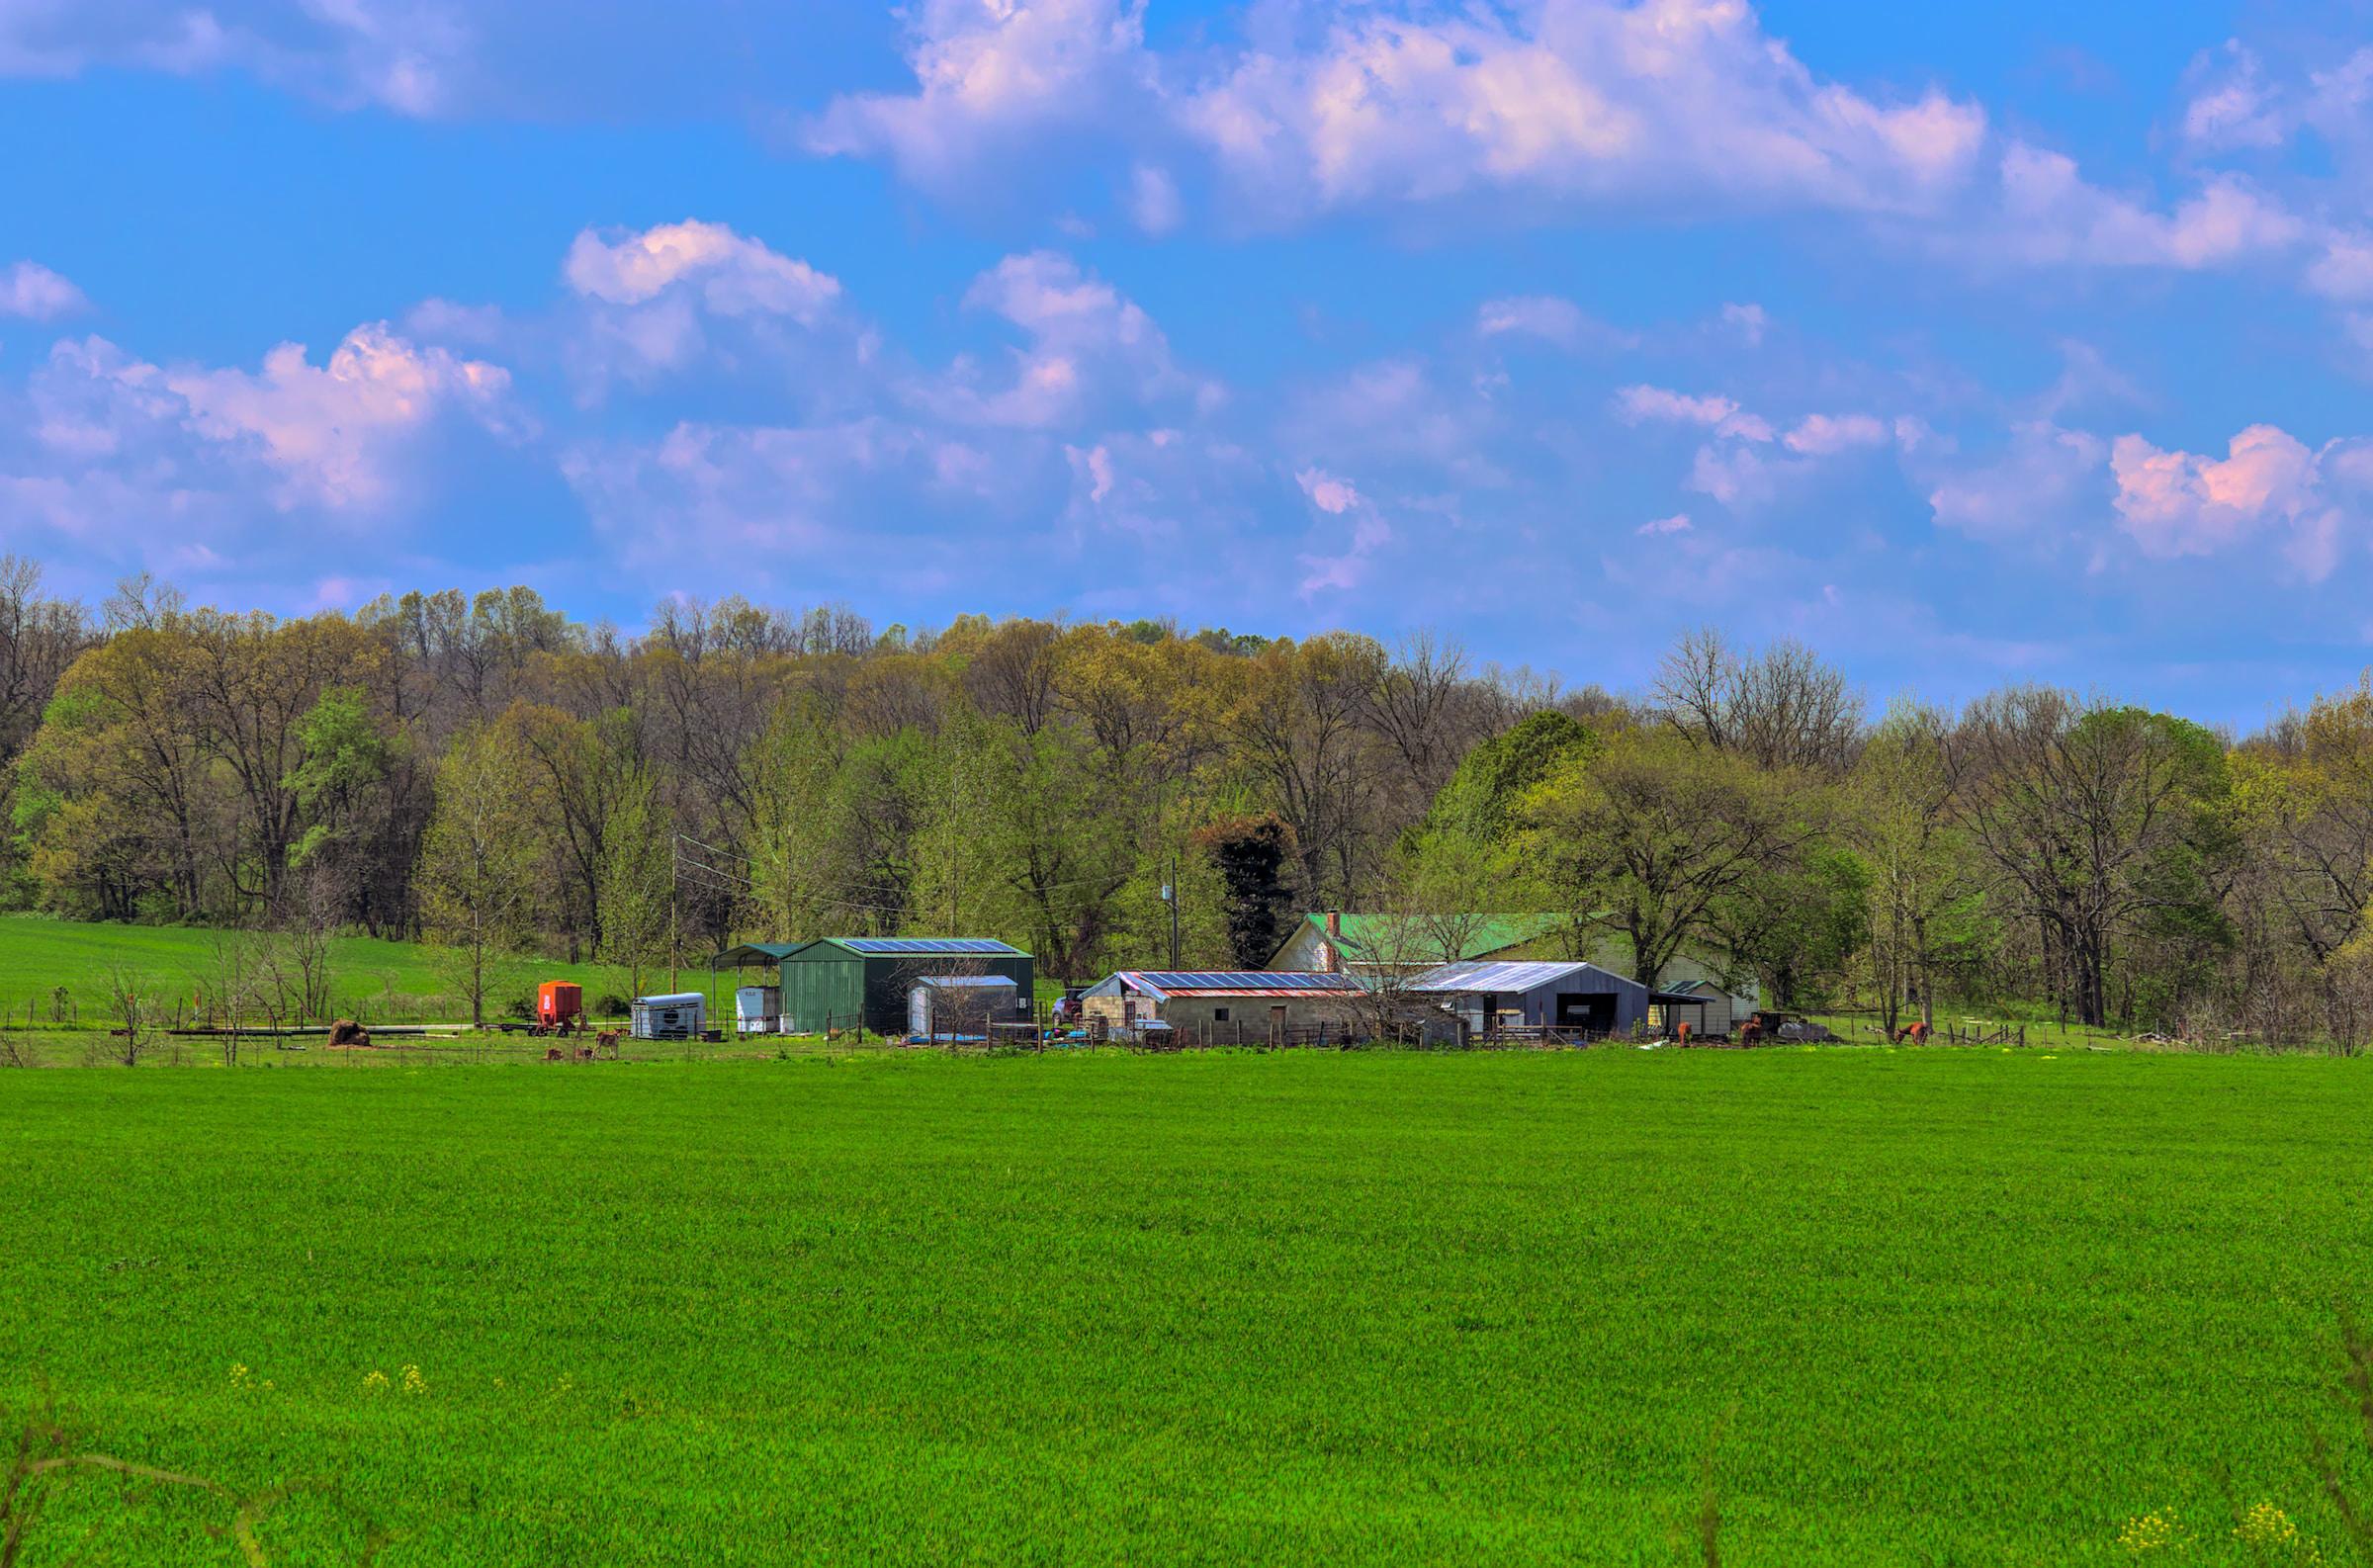
ISSUE NO. 28
The Feed is a publication produced by the Federal Agricultural Mortgage Corporation (“Farmer Mac”), which distributes this publication directly. The information and opinions contained herein have been compiled or arrived at from sources believed to be reliable, but no representation or warranty, express or implied, by Farmer Mac is made as to the accuracy, completeness, timeliness, or correctness of the information, opinions, or the sources from which they were derived. The information and opinions contained herein are here for general information purposes only and have been provided with the understanding that the authors and publishers are not herein engaged in rendering investment, legal, accounting, tax, or other professional advice or services. This publication may include “forward-looking statements,” which include all projections, forecasts, or expectations of future performance or results, as well as statements or expressions of opinions. No reliance should be placed on any forward-looking statements expressed in this publication. Farmer Mac specifically disclaims any liability for any errors, inaccuracies, or omissions in this publication and for any loss or damage, however arising, that may result from the use of or reliance by any person upon any information or opinions contained herein. Such information and opinions are subject to change at any time without notice, and nothing contained in this publication is intended as an o er or solicitation with respect to the purchase or sale of any security, including any Farmer Mac security. Unless stated otherwise, all views expressed herein represent Farmer Mac’s opinion. From time to time, The Feed features articles or reports from authors una iliated with Farmer Mac, and the views and opinions expressed in these articles or reports do not necessarily reflect those of Farmer Mac. This document may not be reproduced, distributed, or published, in whole or in part, for any purposes, without the prior written consent of Farmer Mac. All copyrights are reserved.
SEED, FEED AND FIELD - SPRING 2023 51

STORING UP HOPE - GRAIN BINS AID IN HUMANITARIAN EFFORTS
Imagine living in a country where fuel is $35 a gallon, food prices have multiplied ten times in less than a year, access to healthcare and clean water are hard to come by, as is shelter due to natural events that have devastated infrastructure in recent years? For many Haitians, this describes daily life.
Adding to these items, according to The World Bank Group, “Amid the lingering political and institutional crisis, high vulnerability to natural hazards, coupled with violent gangs vying to gain control over business districts, the economy (has) contracted for four consecutive years.”
Many may read these striking statistics on the current state of Haiti and be moved to ask, “How can I help?” One Iowa-based agriculture company answers that question with an innovative solution – making homes out of grain bins.

Sukup Grain Bin Manufacturers have partnered with the organization GoServ Global, a faith-based nonprofit that serves in communities around the world. Sukup has been building what they call Safe T Homes® - repurposed grain bins that serve as weatherresistant, termite-proof, fireproof, secure dwellings for people in need. There are more than 500 Safe T Homes® currently in use.
Below is an excerpt, taken directly from the GoServ Global website that describes the bins and their function as a home:
The overall round design withstands high winds, while the near-zero seismic load is virtually earthquake proof. Inside, 254 sq. ft. provides families with long-term refugee housing or short-term disaster relief.
SEED, FEED AND FIELD - SPRING 2023 62
Sukup Safe T Homes® are made of 20-gauge galvanized steel for a 75-year life expectancy. These silo homes measure 18 ft. in diameter with 8 ft. sidewalls. They stand 13.5 ft. from the bottom to the roof peak.

The double roof system deflects heat, redirects rainwater and ventilates the interior space regardless of wind direction. The roof can support 5,000 pounds for families who wish to add a sleeping or storage loft.
Sukup Safe T Homes® are 100 percent termite proof, fireproof and waterproof. Windows have lockable covers for security and 16-gauge, galvanized steel screens.
The idea for these unique homes came about when a 2010 earthquake destroyed, or heavily damaged, much of the infrastructure in Haiti. While helping with recovery efforts, the team saw an opportunity to use existing manufacturing capabilities to produce a shelter that could withstand natural disasters.
The team’s design was put to the test just six years later when Hurricane Matthew ripped through Les Cayes with 145 mph winds. “Thanks to nearly 200 Sukup Safe T Homes®—quality, compassionate and durable dwellings—village residents remained safe.” It reads on the GoServ Global website, “As many as 60 people crowded into one structure to ride out the storm. We now have over 500 homes in Haiti, and they have seen a 7.2 magnitude earthquake and stood through it and its aftershocks.”
Safe T Homes® are also set up in Uganda to serve as refugee homes for children fleeing neighboring countries.
So, how much does one cost? According to the GoServ website, “nonprofits intending to use the grain bin house for humanitarian efforts,” can purchase one for $5,700 plus the cost to ship ($1,500) and the cost to pour a cement foundation ($300). Approximately 10 grain bin homes can fit on one shipping container.
SEED, FEED AND FIELD - SPRING 2023 63
The materials can be transported by truck, boat, or hand to assist in delivering them to remote areas and are quick and simple to assemble. They can be designed to connect together for multi-room units, and can also be adapted for offices, homes, schools, churches, hospitals, mobile clinics and stores. You can learn more about Sukup Safe T Homes® by visiting https://goservglobal. org/safe-t-home/
References:
Overview. (n.d.). World Bank. https://www.worldbank. org/en/country/haiti/overview
GoServ Global. (2021a, November 5). Sukup Safe T Home® | Disaster Relief Housing | GoServ Global. https://goservglobal.org/safe-t-home/
GoServ Global. (2022, December 2). Haiti Mission Trips | Child Sponsorship | GoServ Global. https:// goservglobal.org/haiti/


SEED, FEED AND FIELD - SPRING 2023 64
SOYBEAN PLANT TO BRING ECONOMIC BOOST
The state-of-the-art soybean processing plant to bring an economic boost to Casselton, North Dakota and nearby producers.
Casselton, ND – Construction for the Cass County’s new, large-scale soybean processing plant is off to a great start and on track to be fully operational by Fall 2024. North Dakota Soybean Processors, LLC, (NDSP) jointly owned by CGB Enterprises, Inc. (CGB) and Minnesota Soybean Processors (MnSP) is already bringing economic activity to the area after its groundbreaking on August 24, 2022.
Governor Doug Burgum (eighth from left, pictured above), remarked, “This soybean crushing facility is another landmark investment in North Dakota agriculture, one that will add tremendous value for our soybean growers, create quality jobs and benefit all North Dakotans through greater economic activity and tax revenue that supports essential services and critical infrastructure.”

BENEFITS TO LOCAL PRODUCERS
NDSP is expected to crush 42.5 million bushels of soybeans in its first year. Whereas most soybeans produced in North Dakota are shipped out of state, this plant will offer a local market for producers. NDSP’s Commercial Manager Bill McBee explains, “CGB has been processing soybeans since 1997. We know that time is our producers’ most precious commodity. The plant will feature a large truck staging area, which will mitigate traffic congestion near the plant. State of the art technology will also help us reduce wait times and have faster truck turn around.”
NDSP has access to two rail lines and has highway and interstate access nearby, allowing direct shipment of product to and from the plant. Producers will benefit
SEED, FEED AND FIELD - SPRING 2023 65
Groundbreaking ceremony in Casselton August 24, 2022.
from lower transport costs and better prices paid for the crop. Upon purchase, NDSP will then process the soybeans into soyhull pellets and soybean meal for livestock, and refined soybean oil to meet the demand of both food consumers and the booming renewable fuel industry. September 1, 2023 is the date NDSP plans to begin contracting soybeans from producers for fall of 2024 start-up.

BENEFITS TO CASS COUNTY
The positive impacts for Cass County are numerous. Construction continues to bring revenue to Casselton through rapid job creation. “While we knew Cass County would serve as a convenient, cost-saving location for nearby producers in the future, we are equally enthused by the local workforce who are both constructing the facility today and applying for
future management roles,”explained Kristy VanMeter, HR Business Partner for CGB Enterprises, Inc. Once operational, the plant will offer 50-60 competitve paying jobs with benefits for the local workforce.
Through incentive programs, NDSP has committed to supporting Central Cass Schools in excess of $100,000 annually as well as the township and county. NDSP looks forward to participating in and supporting community events, as well. In recognition of the economic ripple effect that the soybean facility will have, Cass County Commission Chair, Chad Peterson offered, “For this reason, the County is committed to partnering to improve roads and critical infrastructure which provides the foundation for significant private investment. A plant of this size will become a huge revenue producer and employer and will provide a significant ROI for County taxpayers.”
SEED, FEED AND FIELD - SPRING 2023 66
Digital rendering of the soybean processing plant once complete, estimated Fall 2024.
NEED FOR ADDITIONAL GRAIN STORAGE
With our need of soybeans year round, we are encouraging grain elevators and producers to add storage space. For those interested, CGB AgriFinancial is partnering with SUKUP manufacturing company to offer grain bin lease financing options. For more information visit: https://cgb-agfi.com/bins/
JOB OPPORTUNITIES
Senior Vice President of CGB Soybean Processing, Tom Malecha, is already interviewing applicants for roles at NDSP. His team is currently hiring for the roles of Maintenance Manager, Extraction Manager, and a Production Manager. More operational and commercial roles will be available soon and can be found at https://ndsoy.com.
FOR MORE INFORMATION
NDSP is grateful for the support of Cass County, the talent it is seeing in the nearby workforce to open the plant in 2024 and the excitement shared by nearby producers. As expressed by farmer Joe Morken, “Casselton is, and has always been, an agricultural community. The NDSP plant will benefit farmers and the businesses they support. That is why I’m in favor of this project.”
Regular updates on plant construction and related information is available on the webpage (https://ndsoy. com) and the North Dakota Soybean Processors, LLC Facebook page. You can also e-mail connect@ndsoy. com to speak with someone directly.

SEED, FEED AND FIELD - SPRING 2023 67
Drone image of the site from March 4, 2023.
SLOW-COOKER BERRY COBBLER

• 1 1/4 cups all-purpose flour, divided
• 2 tablespoons plus 1 cup sugar, divided
• 1 teaspoon baking powder
• 1/4 teaspoon ground cinnamon
• 1 large egg
• 1/4 cup fat-free milk
• 2 tablespoons canola oil
• 1/8 teaspoon salt
• 2 cups fresh or frozen raspberries, thawed
• 2 cups fresh or frozen blueberries, thawed

• Vanilla frozen yogurt or ice cream, optional
DIRECTIONS
1. Whisk together 1 cup flour, 2 tablespoons sugar, baking powder, and cinnamon. In another bowl, whisk together egg, milk and oil; add to dry ingredients, stirring just until moistened (batter will be thick). Spread onto bottom of a 5-qt. slow cooker coated with cooking spray.
2. Mix salt and the remaining flour and sugar; toss with berries. Spoon over batter. Cook, covered, on high until berry mixture is bubbly, 1 3/4 to 2 hours. Serve with a scoop of frozen yogurt or ice cream, if desired.
SEED, FEED AND FIELD - SPRING 2023 68
As berries come into season, this simple two-step recipe combines the best of hearty comfort food with a light and juicy Spring sweetness.
Slow-Cooker Berry Cobbler Recipe photo by Taste of Home
ABOUT AGRIFINANCIAL
AgriFinancial is a premier agricultural lender, backed by decades of ag expertise and dedicated to understanding your longterm goals in the face of ever-changing markets.
As a subsidiary of CGB Enterprises, Inc. (an innovative and progressive leader in agriculture since 1969), AgFi takes a comprehensive approach to custom-tailored financial solutions.
Our sales officers are strategically located throughout the country to be able to meet customers on their farms, sit at the kitchen table, identify the producer's individual goals, and find the financial solution that works best for each unique operation.
SEED, FEED AND FIELD - SPRING 2023 69
FOLLOW AGRIFINANCIAL
@AgriFinancial
@cgbagfi @cgbagfi @AgriFinancial
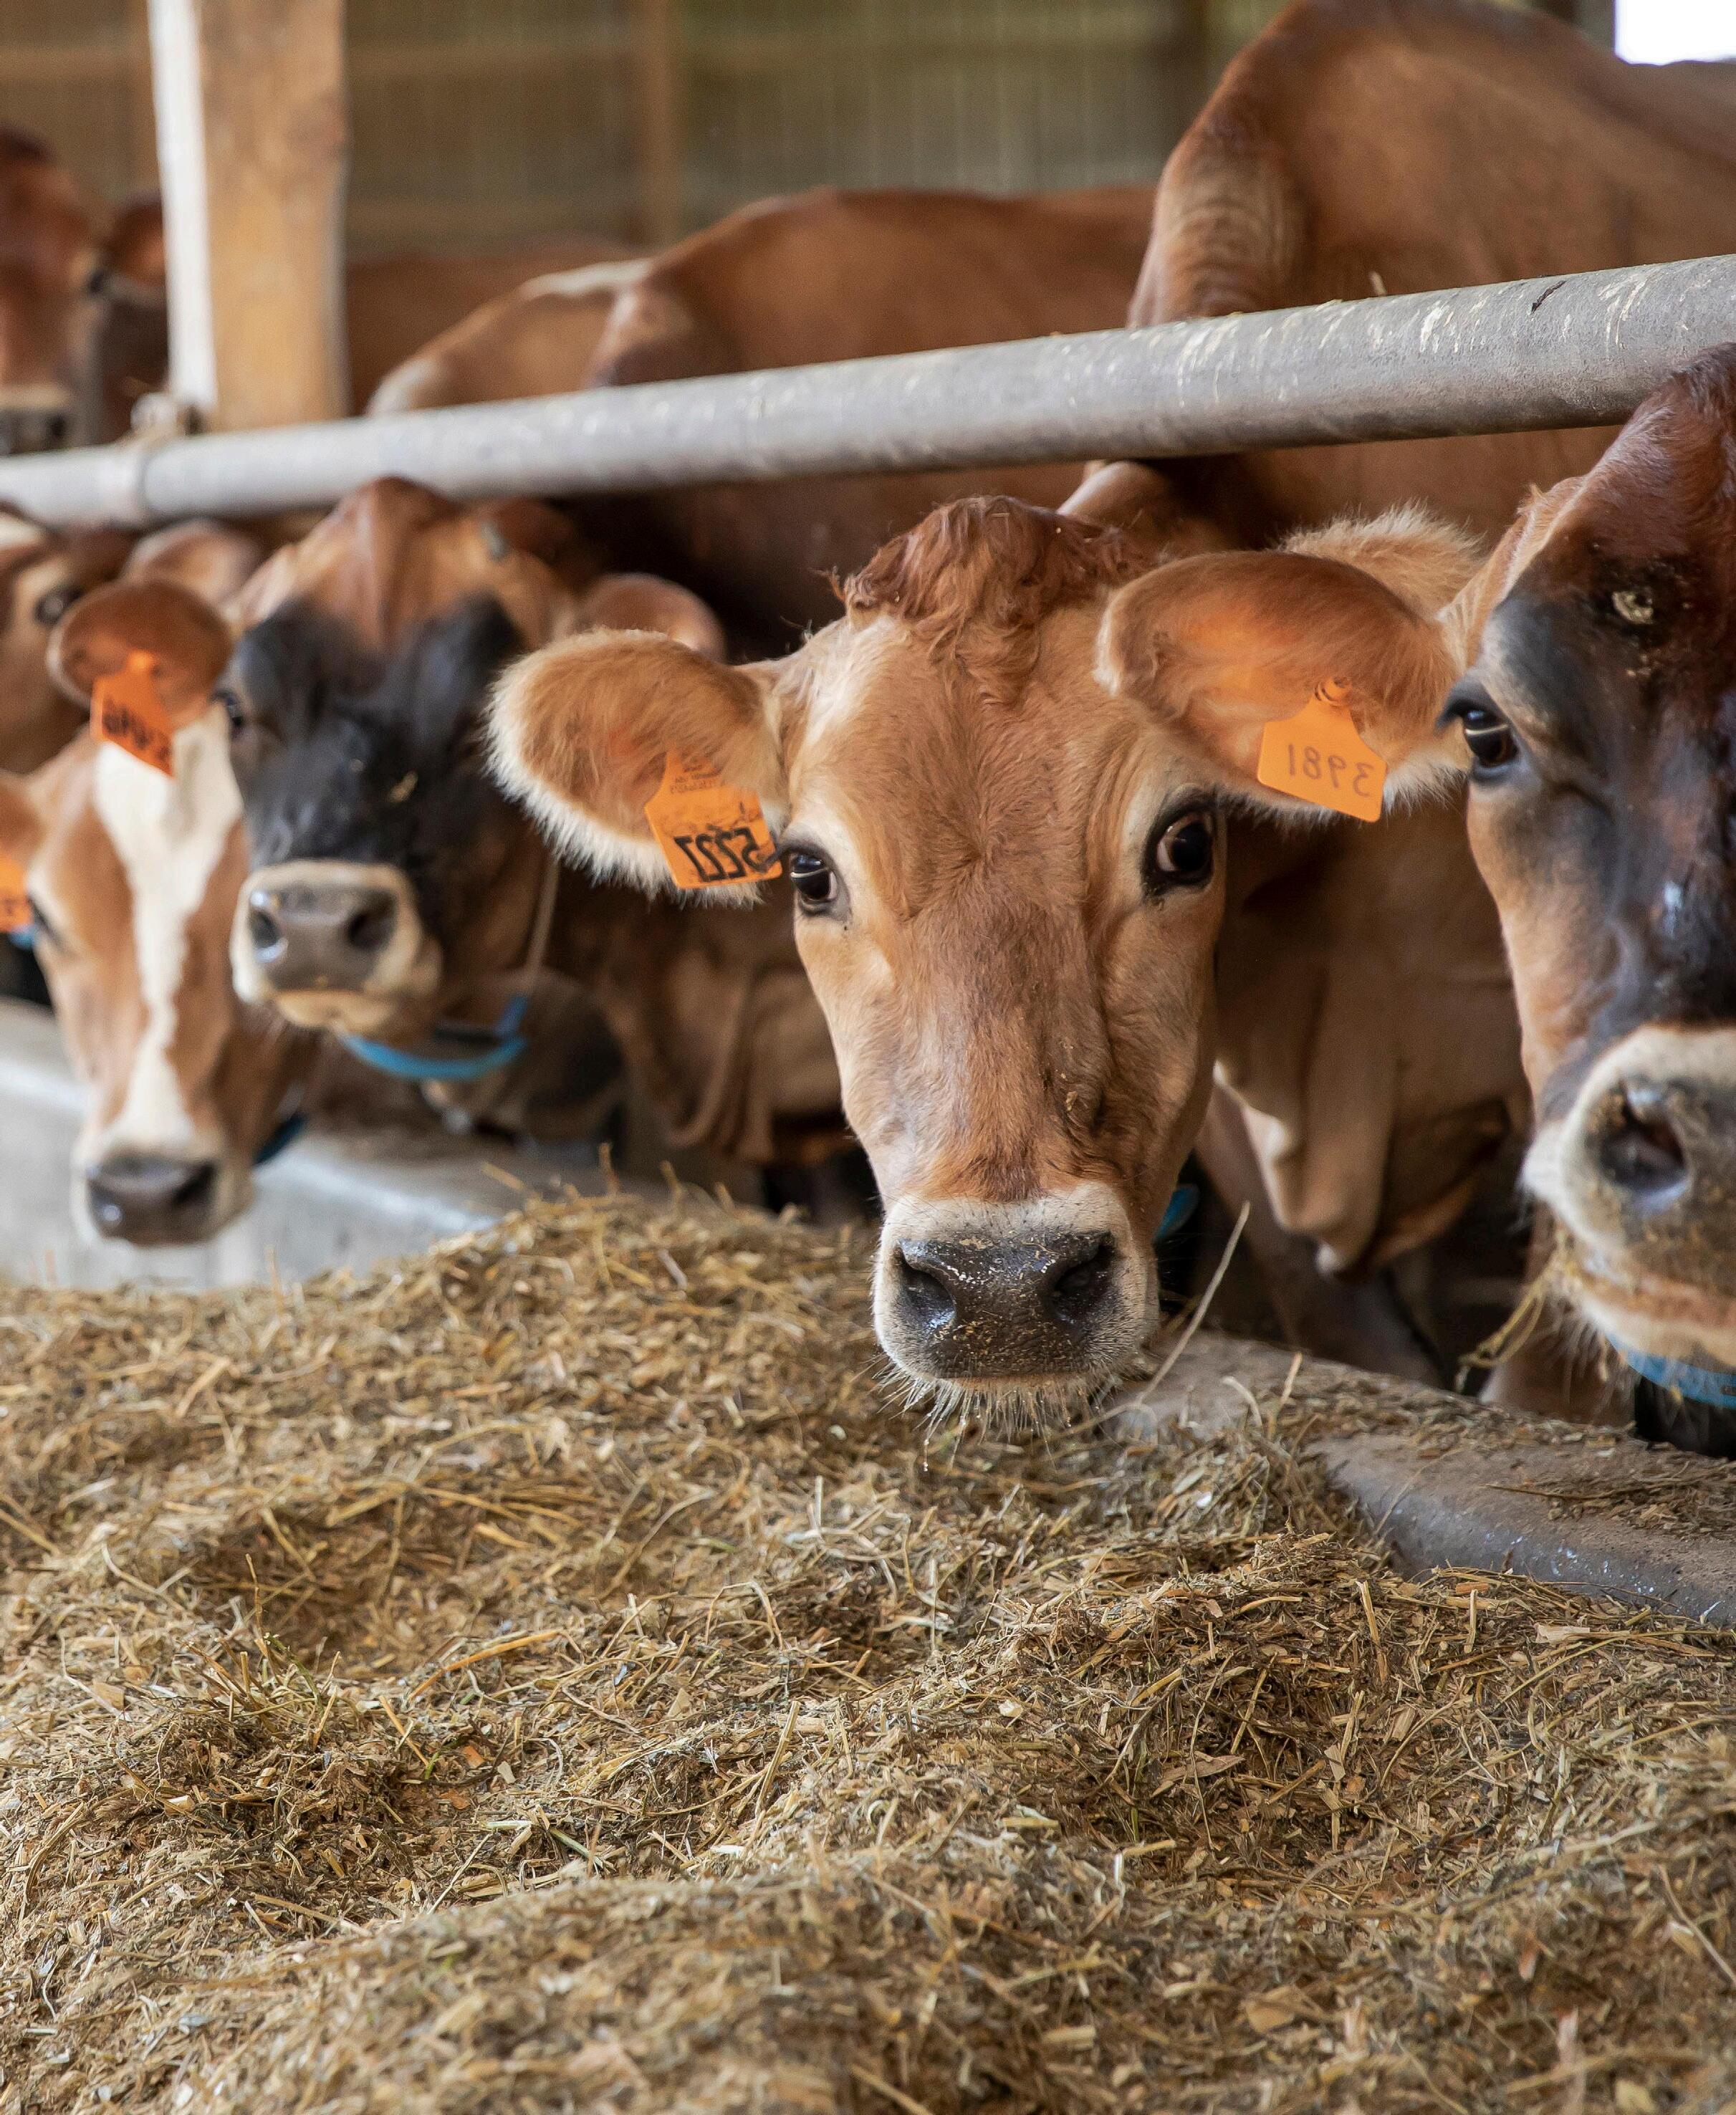
SEED, FEED AND FIELD - SPRING 2023 70
2209 River Rd. Louisville, KY 40206 Phone: 877.548.2622
FinanceInfo@cgb.com www.cgb-agfi.com

Issue No. 8
Trust Our Roots, to Grow Yours.
Seed, Feed and Field is a publication produced by CGB Agri Financial Services, Inc., (“AgriFinancial”). The information and opinions contained herein have been compiled or derived from sources believed to be reliable, but no representation or warranty, express or implied, by AgriFinancial is made as to the accuracy, completeness, timeliness, or correctness of the information, opinions, or the sources from which they were derived. This publication is provided on and with the condition that neither AgriFinancial nor anyone else is, by virtue of this publication or its contents, engaged in rendering investment, legal, accounting, tax, or other professional advice or services. This publication may include “forward-looking statements,” which include projections, forecasts, or expectations of future performance or results, as well as statements or expressions of opinion. No reliance should be placed on any forward-looking statements expressed in this publication. The content of this publication is for general information purposes only and is not to be relied upon or used for any particular purpose. AgriFinancial specifically disclaims any liability for any errors, inaccuracies, or omissions in this publication and for any loss or damage, however arising, that may result from the use of or reliance by any person upon any information or opinions contained herein. Such information and opinions are subject to change at any time without notice, and nothing contained in this publication is intended (nor shall it be construed) as an offer or solicitation with respect to the purchase or sale of any goods, services or securities, including, without limitation, the same by or of AgriFinancial. Seed, Feed and Field features publications, articles and/or reports from others unaffiliated with AgriFinancial, and the views and opinions expressed in these articles or reports do not necessarily reflect those of AgriFinancial. This document may not be reproduced, distributed, or published, in whole or in part, for any purposes, without the prior written consent of AgriFinancial. All copyrights are reserved.