5 minute read
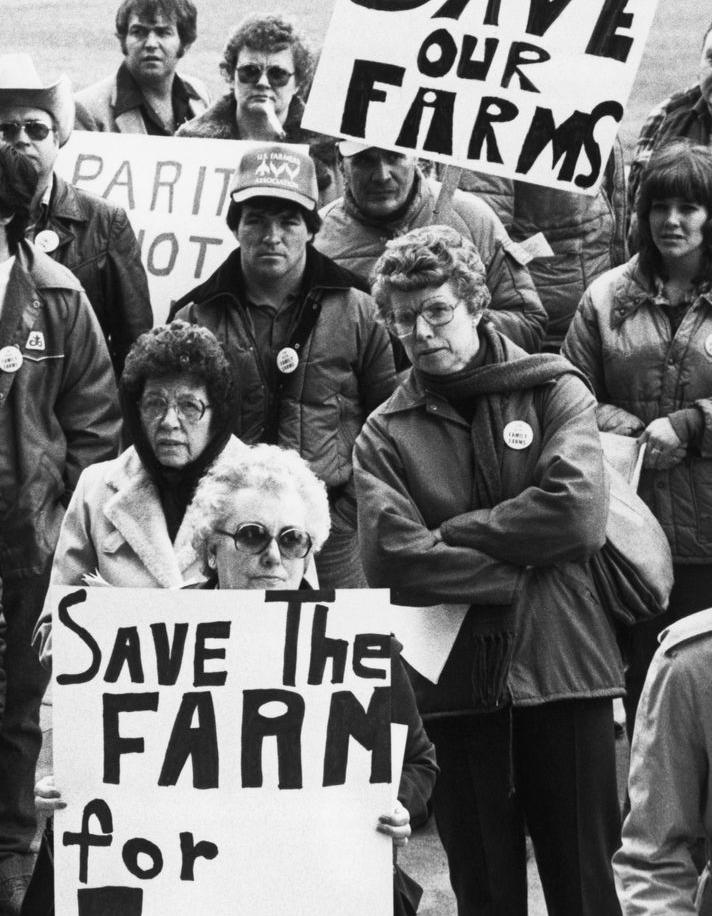
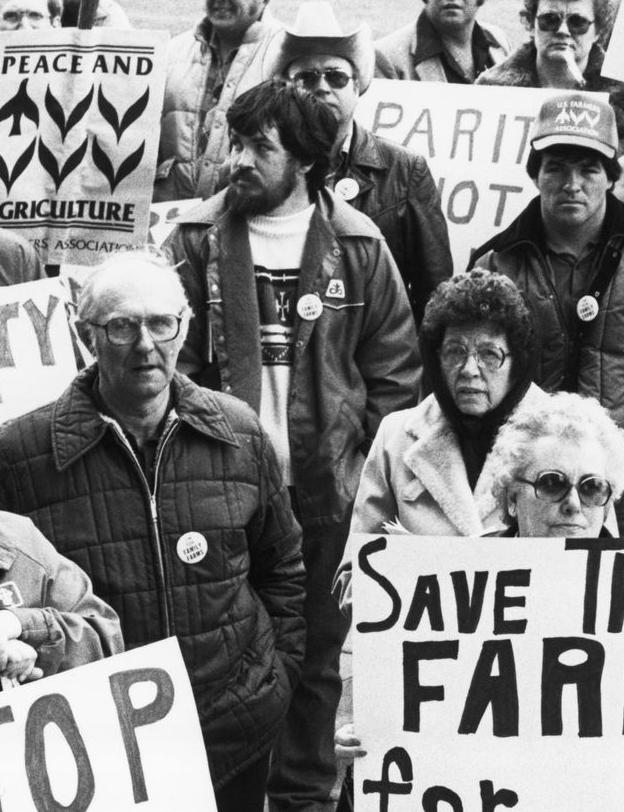
REMEMBER THE 80S? WE DO.


The current economic situation feels a little too reminiscent of the 1980s; one of the most difficult decades for American farmers.
AgriFinancial Founder and President, Alan Singleton, reflects on that time, “During the financial crisis of the 80s, I was a relatively young loan officer and I remember that time very well. Profitability diminished, working capital declined quickly, and refinancing current and intermediate debt to long-term real estate loans (many at variable rates) occurred over a few years. Then interest rates jumped substantially, delinquencies ballooned, and real estate values tanked.”
Advertisement
It was a relatively uncertain time, out of which grew expanded crop insurance protections, the secondary market for agricultural lending, Farmer Mac, and a small, Midwestern-based lending group called American Farm Mortgage Company, now called AgriFinancial. All of these built to offer farmers unique and alternative solutions to keep growing and manage risk; especially financially, with long-term fixed rates that had been difficult to find in years prior.
While many within the agricultural sector are sensing that eerie déjà vu about today’s economy, there are several important considerations that may provide comfort for those uneasy feelings.
Recently, the National Corn Growers Association (NCGA) released an article that compared key economic factors of the 1980s with those of today. Lead Economist for NCGA, Krista Swanson, offers an analysis of three data points which we’ll cover in this article and add a fourth of our own. You can ready the entire article here: https://ncga.com/stay-informed/ media/editorials/article/2023/03/agriculture-and-theeconomy-an-assessment-of-our-current-situationversus-the-1980s.
FARM DEBT VS. FARM SOLVENCY
According to the USDA Economic Research Service (ERS), farm sector debt is forecast to hit $535.1 billion in 2023. Krista Swanson notes in her article, “Up until 2020, farm debt remained below the 1980 inflation adjusted peak of $501.7 billion.”
While this statistic may make an agricultural producer pause, farm solvency is much stronger than that of the 1980s. Solvency refers to the farm’s ability to cover long-term debts.
The article continues, “For 2023, the farm sector debt-to-asset ratio is forecast at 13.22, stronger than the 1985 peak at 22.19.” This means that an average farmer has less interest-bearing debt in relation to their income-producing assets.
Inflation Vs Interest Rates
Tracking interest rates from the last three years creates a graph that, if a diagram of a roller coaster, would take you on a wild ride. Perhaps, a wild ride is exactly how to describe it. “The Consumer Prices Index (CPI), a common measure of inflation, hit 9.1% in June 2022, reaching the highest point since 1981,” states the article from NCGA. The cure for a high rate of inflation? The Federal Reserve raises rates. This isn’t new news.
Since March 2022, the Fed has raised rates nine times. The frequent increases have also increased concerns and possible aversion to financing a new purchase, yet despite these recent hikes, current rates stand at just a quarter of where they wound up in the 80s. Topping out at 20% (federal funds rate), today’s projection of 5% by end-of-year pales in comparison. As with anything, it takes time to adjust to change. It’s understandable how today’s rate seems so high when it’s more than double what we were looking at just two short years ago.
Another key factor to consider when thinking about interest rates is the percentage of income that goes towards interest expenses. In our most recent edition of Seed, Feed and Field, in the article titled The Farm
Economy in Transition (Page 18), “In 1983, farmers and ranchers spent nearly thirty-five cents of every dollar earned farming on interest. Today, that figure is approximately twelve cents, below the 60-year average of fifteen cents.”

As difficult as it is to think about the higher rates of today, it’s good to acknowledge they are effectively reducing inflation; now down to 6%, but still a long way off from our goal of 2%.
BOND INVERSION VS. POSITION
When it comes to lending, it’s relatively easy to understand that the longer you commit to lending money, the more risk you take on. So, when it comes to rates, you would expect that longer-term rates would be higher than those of short-term loans. Over the last few months, the opposite has been true as the 2 Year Treasury Bond Yield exceeded the 10 Year, creating a bond inversion. In fact, on March 8, 2023, it was the largest inverted spread (1.07%) since 1981. The article states, “When that has happened in the past, a recession within two years has occurred 98% of the time.”
Any mention of economic recession can send anyone, not just those in the ag community, into slight panic; however, should we enter into a recession, production agriculture is better positioned to sustain operations. USDA ERS forecasts an increase to farm sector equity by 5% in 2023 as well as an increase by 5.2% of farm sector assets.
An increase to equity and assets means better solvency. To state it differently from earlier, if you had to sell off everything today to cover your debts, having strong solvency would mean the value of your assets would easily cover your debt obligations.
More important than solvency is liquidity. That is the ability to pay short-term debts out of cash, assets that can easily be converted to cash, or available credit. Liquidity is what allows a farmer to withstand shortterm volatility without selling long-term assets or resorting to more debt. Referencing liquidity during the 1980s farm crisis, Singleton offered a perspective for farmers who were able to sustain operations during those trying times, “Those very difficult years also brought opportunity to those individuals that managed the situation and maintained liquidity.”
COMMODITY MARKETS VS. PRODUCTION
Lastly, let’s talk about commodity markets; our fourth added data point. In the 1980s, the average market price of corn was $2.67. When adjusting for inflation, that would be $7.49 today. Unfortunately, corn has averaged almost a dollar less than that at $6.52/bu. year-to-date.
While market prices haven’t seemed to keep pace, production levels cannot be dismissed. Again, using corn as our example, in the 1980s, yields ranged from 80-120 bushels/acre. Today, the USDA places corn production at an average of 177 bu. per acre.
Here are some basic calculations to provide an example:
• One acre of corn in the 1980s would sell for approximately $749.

(gross profit based on 100 bushel avg. and inflation adjusted market value of $7.49/bu.)
• One acre of corn today would sell for approximately $1,154.04.
(gross profit based on 177 bushel avg. and YTD 2023 avg market value of $6.52/bu.)
As we gaze into our crystal ball, no one knows exactly what we will encounter economically; however, no matter how many similarities you can draw between the 1980s and today, we can find hope and comfort in understanding how there are many ways in which they’re different.
References: https://home.treasury.gov/resource-center/data-chart-center/interest-rates/TextView?type=dai ly_treasury_yield_curve&field_tdr_date_value=2023
Resource Center | U.S. Department of the Treasury. (2023, April 17). U.S. Department of The Treasury.
USDA ERS - Farm Sector Income Forecast. (n.d.). https://www.ers.usda.gov/topics/farm-economy/ farm-sector-income-finances/farm-sector-income-forecast/#:~:text=Farm%20sector%20as sets%20are%20forecast%20to%20increase%205.2,percent%20in%202022%20to%2013.22%20 percent%20in%202023
National Corn Growers Association. (n.d.). Agriculture and the Economy: An Assessment of Our Current Situation Versus the 1980s. https://ncga.com/stay-informed/media/editorials/article/2023/03/ agriculture-and-the-economy-an-assessment-of-our-current-situation-versus-the-1980s
Historical Corn Grain Yields in the U.S. (n.d.). https://www.agry.purdue.edu/ext/corn/news/timeless/ YieldTrends.html
Corn Prices - 59 Year Historical Chart. (n.d.). MacroTrends. https://www.macrotrends.net/2532/corn-pric es-historical-chart-data
US Inflation Calculator. (2023, April 14). Inflation Calculator | Find US Dollar’s Value From 1913-2023. US Inflation Calculator | Easily Calculate How the Buying Power of the U.S. Dollar Has Changed From 1913 to 2023. Get Inflation Rates and U.S. Inflation News. https://www.usinflationcalcula tor.com/