SEED, FEED AND FIELD
Sustainability in Agriculture Pg. 5 Top Planning Tips for Building a Riding Arena Pg. 3
Supporting American Agricultural Producers Edition Three | Fall 2021
TABLE OF CONTENTS ABOUT SEED, FEED AND FIELD
Seed, Feed and Field is a publication from AgriFinancial, dedicated to supporting American agricultural producers. This quarterly resource features information on a wide-range of agricultural products raised throughout the U.S. Inside, you’ll find everything from financial tips and market data, to Farm Fresh Recipes and Farmer Features. You will also find, as an insert and central element, Farmer Mac's The Feed, which is re-printed and included with Farmer Mac's permission as pages 8 through 27.
ABOUT AGRIFINANCIAL
AgriFinancial is a premier agricultural lender, backed by decades of ag expertise and dedicated to understanding your long-term goals in the face of ever-changing markets. As a subsidiary of CGB Enterprises, Inc. (an innovative and progressive leader in agriculture since 1969), AgFi takes a comprehensive approach to customtailored financial solutions. Our sales officers are strategically located throughout the country to be able to meet customers on their farms, sit at the kitchen table, identify the producers’ individual goals, and find the financial solution that works best for each unique operation.
To subscribe to Seed, Feed and Field, or to access a digital download of this publication, please visit: www.cgb-agfi.com/seedfeedandfield
For media inquiries: AgFiMarketing@cgb.com
To learn more about AgriFinancial: www.cgb-agfi.com Toll-free 877-548-2622
Seed, Feed and Field is a publication produced by CGB Agri Financial Services, Inc., (“AgriFinancial”). The information and opinions contained herein have been compiled or derived from sources believed to be reliable, but no representation or warranty, express or implied, by AgriFinancial is made as to the accuracy, completeness, timeliness, or correctness of the information, opinions, or the sources from which they were derived. This publication is provided on and with the condition that neither AgriFinancial nor anyone else is, by virtue of this publication or its contents, engaged in rendering investment, legal, accounting, tax, or other professional advice or services. This publication may include “forward-looking statements,” which include projections, forecasts, or expectations of future performance or results, as well as statements or expressions of opinion. No reliance should be placed on any forward-looking statements expressed in this publication. The content of this publication is for general information purposes only and is not to be relied upon or used for any particular purpose. AgriFinancial specifically disclaims any liability for any errors, inaccuracies, or omissions in this publication and for any loss or damage, however arising, that may result from the use of or reliance by any person upon any information or opinions contained herein. Such information and opinions are subject to change at any time without notice, and nothing contained in this publication is intended (nor shall it be construed) as an offer or solicitation with respect to the purchase or sale of any goods, services or securities, including, without limitation, the same by or of AgriFinancial. Seed, Feed and Field features publications, articles and/or reports from others unaffiliated with AgriFinancial, and the views and opinions expressed in these articles or reports do not necessarily reflect those of AgriFinancial. This document may not be reproduced, distributed, or published, in whole or in part, for any purposes, without the prior written consent of AgriFinancial. All copyrights are reserved.
FOLLOW AGRIFINANCIAL CONTACTS @AgriFinancial @cgbagfi @cgbagfi @AgriFinancial
..................................................
.......................................................
A Letter from the Editor ........................................ Pg.2 Morton Buildings Feature ...................................... Pg.3 Sustainability in Agriculture ................................. Pg.5 The Feed by Farmer Mac ................................. Pg.8 A Message from Jackson Takach ...…..…... Pg.10 Farm Income Update ……………………..…. Pg.11 Farmland Values …………………………….... Pg.13 Cropland Acreage ………………………….... Pg.15 Farm Labor ...............……………………….. Pg.16 Farm Finances Improve ……………………. Pg.17 Drought …………………………………...…. Pg.19 Corn and Soybeans ………………………… Pg.20 Poultry ……………………………......……... Pg.21 Dairy ………………………………............… Pg.22 Spending on Food Away From Home ... Pg.23 Resources ……………………………………. Pg.25 Farm Fresh Recipe
Pg.30 Special Feature: Fancy Farm Children's Story ..... Pg.31 Farmer Feature
Pg.33 Seed, Feed and Field - Fall 2021
Growing up on my family’s dairy farm in southern Indiana, as featured in the background image on this page, taught me a great deal about life, hard work, and hard lessons. One of my first and most vivid memories from my childhood is watching my grandfather help a heifer give birth during a difficult labor and delivery. Unfortunately, the calf didn’t survive. My grandfather was not a man of many emotions. Life was pretty straightforward. Do your job. Go to church. Help your neighbor. That day; however, it was different. The intensity of the situation brought on a sorrow I had not yet seen in the patriarch of our family. He felt the loss deeply and it showed. That memory has been imprinted on my mind and on my heart, and I imagine it will stay with me for the rest of my life.
As a family, we never ventured too far from the dairy
operation. With milking and feeding rotations, family vacations were less about plane trips, packing suitcases, and hotel reservations, and more about long days at the county fair with card tournaments in the livestock barns, multiple trips to the midway, and heaping scoops of Rocky Road ice cream.
I attended a small country school that was a step up from a one-room school house – it was four rooms – and each of my five other classmates had nearly the exact same upbringing I had on the farm. Livestock and grain. Grain and livestock. The morning bus ride took more than an hour to pick up the half dozen passengers; traveling county-wide across thousands of acres of lush farmland. I probably could have walked to school faster than being transported, but the extra hour of sleep in the seat where the heater was located was pure bliss!
My world was wonderfully simple and small. I assumed everyone grew up this way. Of course, fast-forward to turning 19 and trekking north to the big city of Indianapolis and my subsequent travels, and my bubble didn’t just burst…it exploded! It was an exciting and beautiful journey of exploration. Years passed filled with discovery of who I was and where I fit in. No matter what may have changed during this time, my love for agriculture never grew dim. In fact, it blossomed. My journey not only brought new ideas about myself and the world we share, but also opened my eyes to different forms of agricultural production I had never experienced. Olives, avocados, oranges, apples, peanuts, cotton, strawberries, blueberries, asparagus, almonds, the list is extensive and expanding still today. New methods, new machinery, the implementation of data and ever-changing technology – this fascinating world of agriculture is an adventure all on its own.
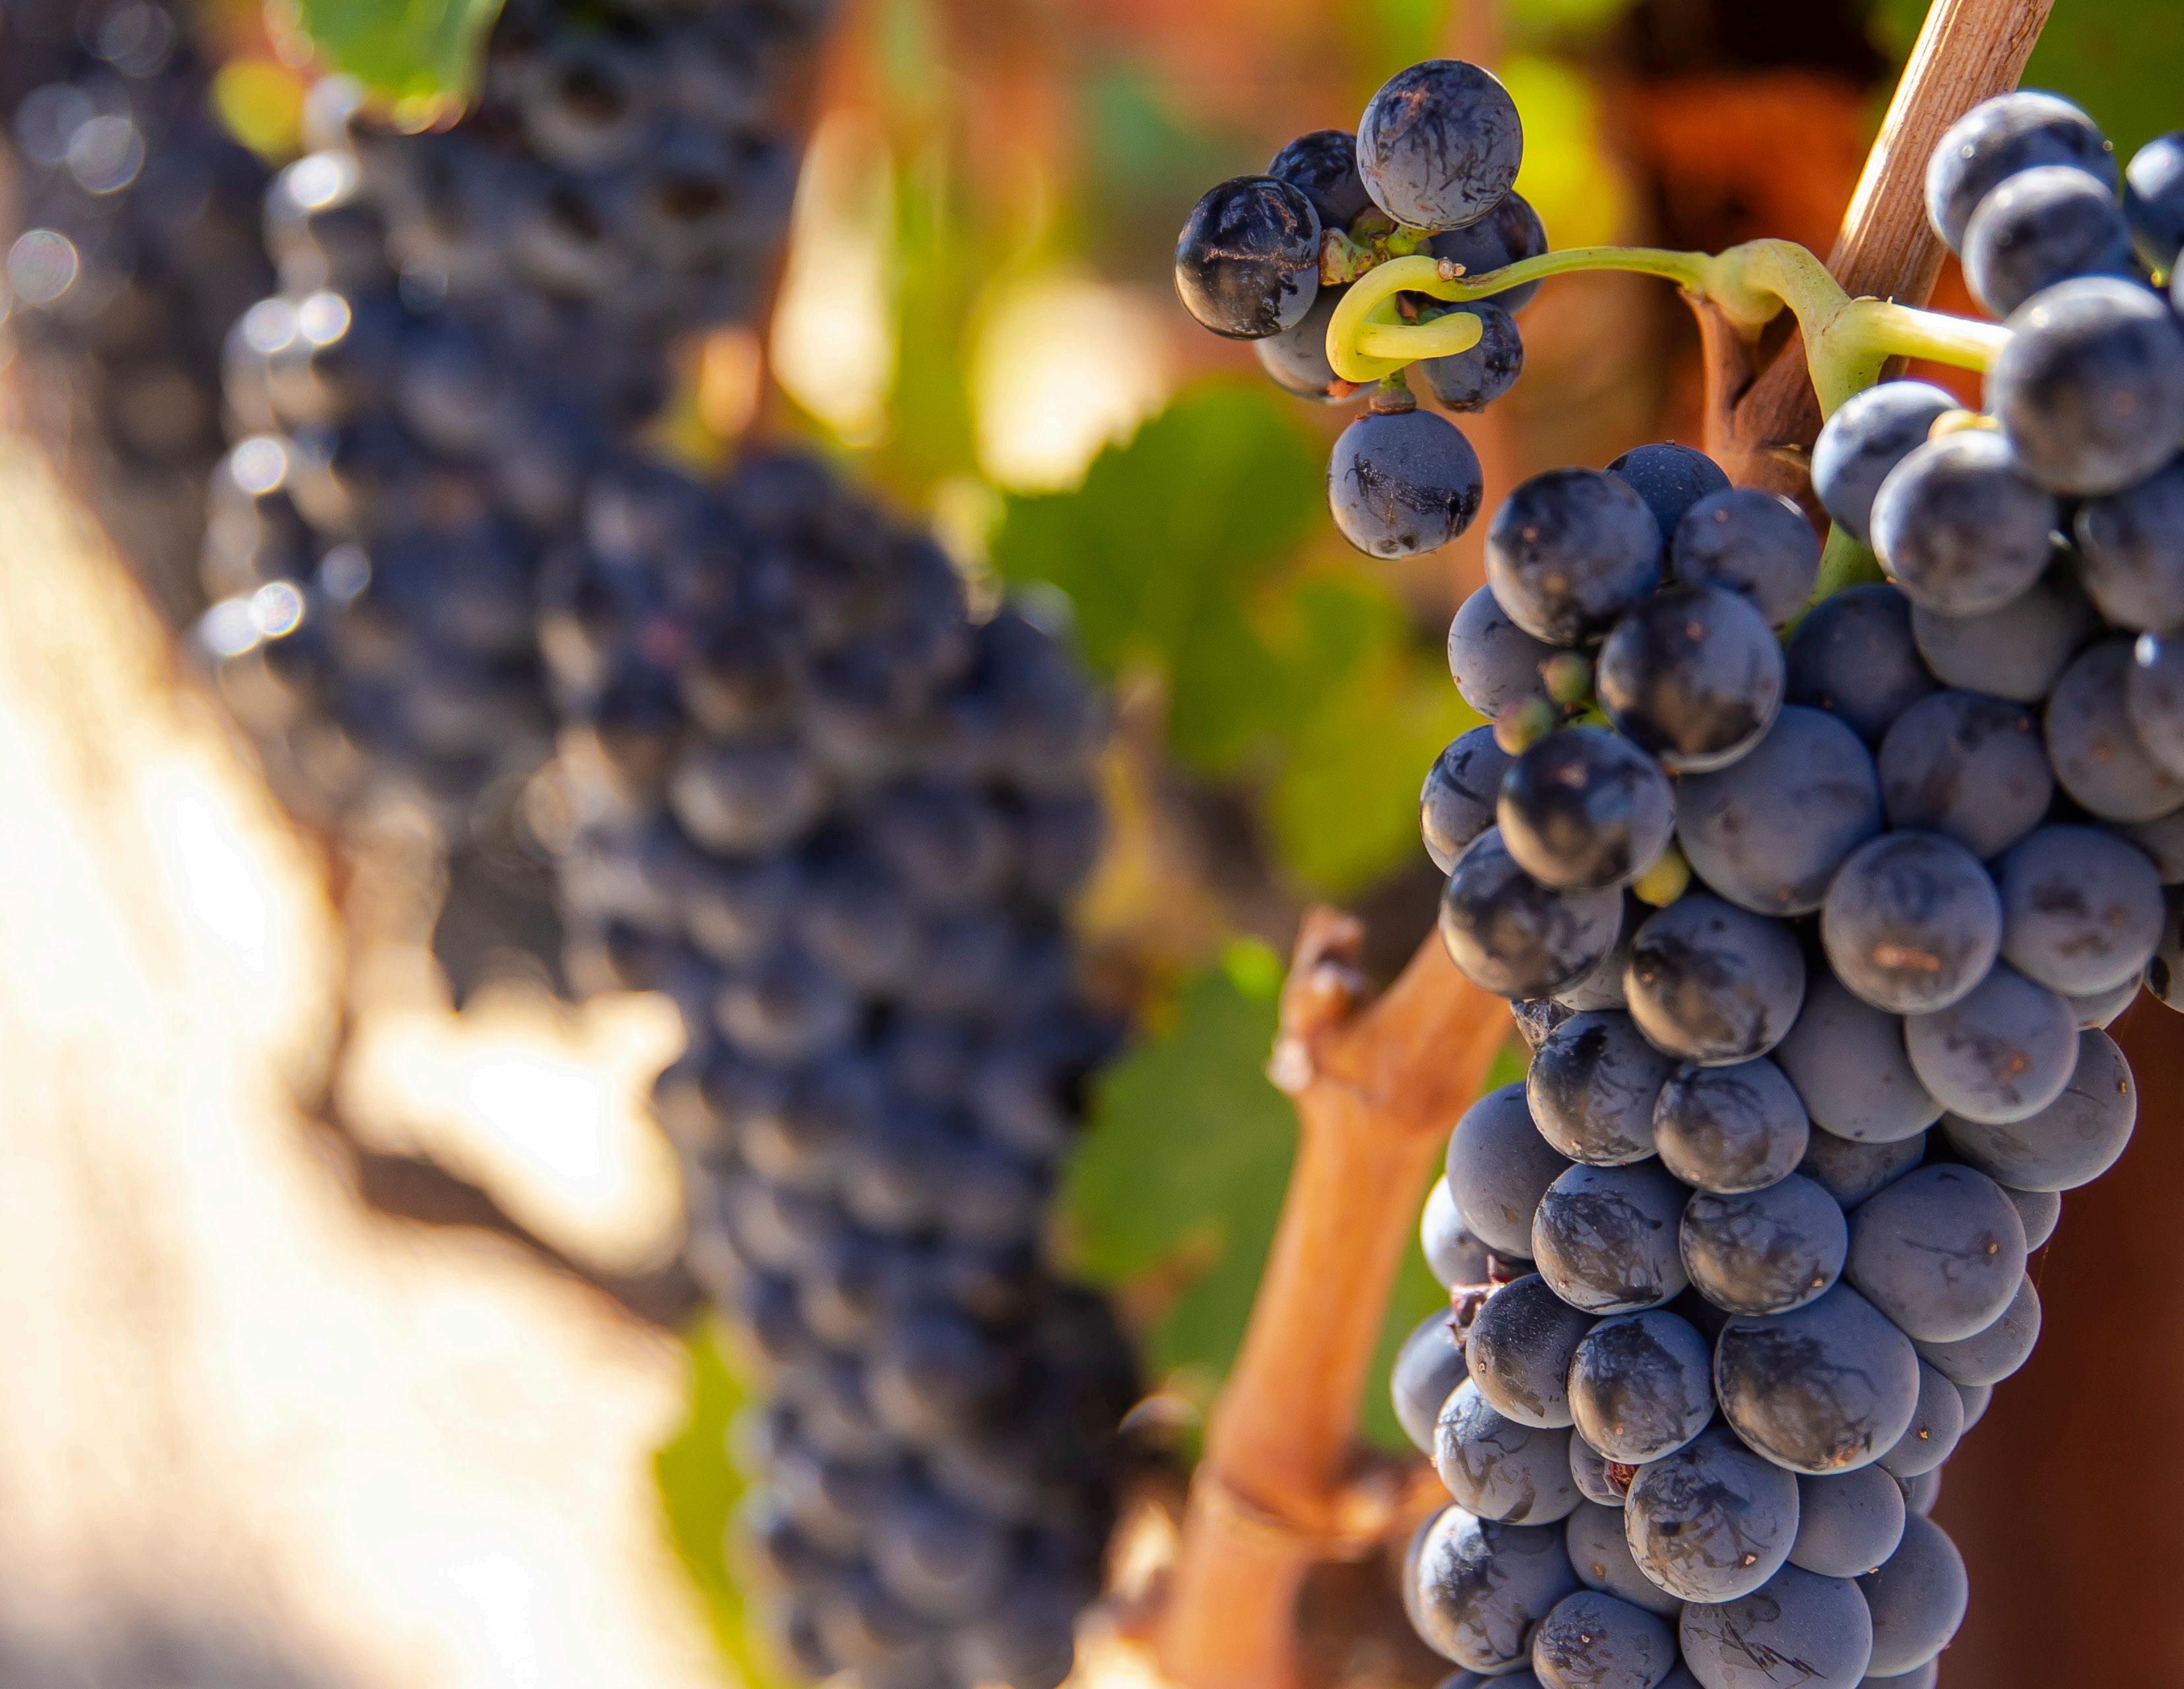
Today, as a wife and mom, I reflect on how life has taken me down many paths, but they all have similar scenery – those acres upon acres of lush cropland. Agriculture is placed at the very heart of who I am, and the reason for dedicating the last decade of my professional career to the ag industry and the producers who feed and fuel our world. That’s why I selected the cover of this edition
of Seed, Feed and Field to be wine grapes – a crop completely different from the Midwestern grains and cattle I was raised to know. This photo was taken at Galante Vineyards in California, one of our customers. Getting to know Jack, his wife, and his operation has been a joy of our team. You can get to know a little more about them too in this edition’s Farmer Feature on pages 33 and 34.
Our cover photo is more than just a beautiful picture, a bountiful crop ready for harvest, or the beginnings of what will be a delicious beverage. It’s a representation of a journey… of growth.
One of our favorite sayings at AgriFinancial is Trust Our Roots, to Grow Yours. It’s not just about the knowledge of agricultural production, it’s also about appreciation and respect; understanding the vital role agriculture plays on the world stage. Many of my coworkers grew up on a farm just like I did. Some still farm today. We won’t pretend that we know everything about everything when it comes to the way you farm. However, we do know the long hours, the calloused hands, the prayers for rain, the acreage lost to floods, the thrill of high yields, and the devastation of disease. Even more, we know how to set you up for success when it comes to your operational financing to see you continue farming year after year.

You can Trust Our Roots, to Grow Yours. Let’s keep growing together.
 Katie Irk Director of Marketing & Communications Editor - Seed, Feed and Field

2021 2
Seed, Feed and Field - Fall
A LETTER FROM THE EDITOR
Katie Irk
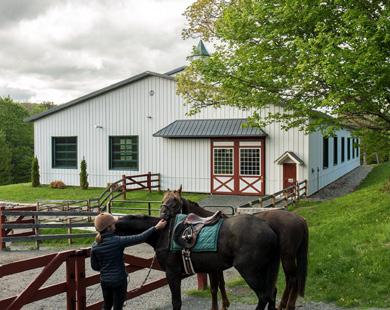
TOP PLANNING TIPS FOR BUILDING A RIDING
ARENA
Building your own personal or commercial riding arena can be a very exciting time. Just like planning to build a stall barn, there are some important elements to consider before design and construction can begin on your new arena.

Zoning and Other Regulations
Early in the planning stage, check to find out what various regulations and restrictions there may be that might affect the proposed project. Find out if your state and local codes have any restrictions on equestrian buildings including:

• Zoning regulations
• Building codes
• Sanitary regulations
Generally, building codes set construction standards. Zoning prohibits the use of property for specific purposes and sanitary regulations are in accordance with public health, related pollution, and pest control. Other restrictions that may limit the use of property include deed restrictions and easements. Even if the equine riding arena is allowed in the area, you will need to determine if there are any covenants that need to be factored in. You won’t find that in the local county planning or zoning office. They won’t always know if there is a protective covenant that a homeowners association might have. These covenants might require a certain building size, siding, or roofing that matches other buildings in the area. In addition, certain areas will be more strict regarding manure and runoff, due to the potential water pollution. If you will need to compost manure, you may need an additional building.
Site Selection and Development
The building site for your riding arena should be welldrained, accessible and have a slope of about 5'/100' away from the building in all directions to assure good surface drainage. Consider the grading and filling that will be needed for a well-drained site. Plan on using only clean soil, sand, gravel, or crushed rock for fill. Topography of the site, particularly, affects the cost of site
development; and site preparation should be completed before building construction is started. A nearly level site usually involves the least cost. Sites on steep slopes or rocky terrain, or sites requiring considerable fill are costly to develop and may make compromises necessary.
Avoid sites that have serious drainage problems (such as steep slopes that concentrate surface runoff in the building area and wet areas caused by critical ground-water conditions) unless the problems can be completely eliminated. You will want your riding arena to be out of the natural drainage water path as much as possible. It’s important to think about the flow of water—where it’s coming from, and where it’s going to go after it leaves the roof of the building.
Other factors influencing the selection of a building site are:
• Size of operation: In addition to room for the planned buildings, the site should provide space for other planned facilities and areas. It should also provide for future building and paddock expansion and for good traffic patterns for safe and convenient handling of animals, vehicles, equipment, materials, and potential snow removal.
• Accessibility: This deals with the access of vehicles, large equipment, and horse trailers in and out of the building. It is generally agreed to not set the building too close to the road.
• Utilities: An adequate, all-year water supply of the quality needed must be available at the site, either from a public water system or from convenient ground-water and surface water developments, as well as electrical service.
• Windbreaks: The natural protection from the elements provided by wooded areas, knolls, hills and ravines is a consideration in site selection.
• Existing buildings: Existing buildings may be a determining factor in site selection, but only if their size, location, physical condition and inside arrangement fit into the overall plan.
• Building layout: This may be a deciding factor in selecting the site, but the site chosen may affect both building layout and building style.
Riding Arena Size
Width:
Riding arenas can be as narrow as 42' for such training requirements of Tennessee Walking Horses or wider to an average width of 60' for most training and exercise programs.
Widths of 66', 72' and 81' are not uncommon. However, local needs based on competition-sized arenas should be verified to select proper width. The hybrid truss system provides clear-span widths up to 150’.
Height:
Overall, the height of the arena is dependent on the size of the horses using it. Riding arenas should be a minimum height of 14' for horse and rider. This height is sufficient for most training activities and pleasure riding. When extensive training in jumping techniques is required, the arena should be 16' or higher to allow for clearance of the horse and rider.
Length:
Arena length should be a minimum of twice its width. Certain types of riding and training activity may require other minimum sizes, and it is best to work with local riding clubs or organizations to obtain these guidelines. For example, a regulationsized Dressage riding arena is 66' x 132' or 66' x 198'.
Arena Ventilation and Insulation
Equine arenas, like stall barns, require roof insulation and ventilation to help control summer heat gain and to reduce condensation during cool seasons. A plywood or Oriented Strand Board (OSB) roof with felt and shingles should provide the same effect as a metal-insulated roof.

3 Seed, Feed and Field - Fall 2021
To further control condensation, the arena should have vented overhangs, power cupolas and large end wall or sidewall sliding doors, which also aid in summer ventilation.
Vent doors, when used, require mounting at a minimum of 10' from the ground to the bottom of the door and need special hinge pivot placement so the vent door does not protrude into the arena. Some may want windows; however, they can create shadows which could cause a horse to shy. Windows need to be mounted high in the wall, or awnings may be required to control shadows.
Arena Lighting
Natural Lighting:
Roof skylights with a vapor barrier can be utilized at various positions on the roof surface. A minimum of one skylight per 18' of ridge length can be used. Spacing could also be 15' or 12' for increased lighting. They can be on one or both sides of the ridge. Another row of skylights can also be placed down from the peak at half the distance from the peak to sidewall on the same frequency as the skylights at the peak.
If roof skylights are not desired, a continuous sidewall skybelt just under the eave line can be utilized on one or both sides of the arena. A combination of roof skylights and sidewall skybelts can also be used.
Artificial Lighting:
Because artificial lighting will be needed for night riding, it may be necessary to limit the amount of natural lighting skylight panels and opt for an appropriate type and number of electrical light fixtures. These range from cold-start, fluorescent to high-pressure sodium units, which have certain advantages and disadvantages over each other. Because of the diversity of available types, an electrical contractor should be consulted for the best type available based on customer preference. Ordinary fluorescent lighting tends to flicker at temperatures below 50 degrees. Specialized, cold-start fluorescent units, which are more expensive, should not flicker.
Riding Arena Liners
An arena liner provides protection for the horse and rider against the exterior wall of the building. Most liners are tapered into the building at the bottom to allow a safe pattern of riding away from the building wall. Common height is 4' with some using 6' or even 8' heights. The liner is angled at door openings, or it can be built into hinged panels that swing in for easy access to and from the arena. The liner cavity should be closed at the top for safety and to prevent the collection of debris.
Tack Room
It’s important to consider the type of horse that will be utilizing the arena when planning a tack room. For example, the tack room for warm-blooded Dressage and Jumpers will be completely different from the tack room of the Quarter Horse. The Quarter Horse rider is typically going to have a tack room only for saddles and bridles. The Hunter Jumper may want to make their tack rooms more like a lounge, with air conditioning, sinks, or even small kitchenettes. They might have carpet on the floor, hardwood, or laminate floors. Western-type Quarter Horse riders need to have a larger door because their saddles are larger and more cumbersome to carry.
Other elements to consider when planning to build a riding arena:


• What are your long-term plans or future expansion areas?
• Would you like the arena heated?
• What pitch roof are you looking for? 4/12 and 6/12 are standard for a Morton riding arena.
• Do you have ideas for interior finishing of the arena?
• What, besides expected use, do you intend to store in the building? You may need to plan on adding storage for equipment, hay, feed, and bedding, or a horse trailer.

• Will you need a viewing area or lounge?
• Will you need a grooming and mounting area?
• If the arena will be used for physio-therapy, will you need a hydraulic ceiling suspended lift?
• Will you need restrooms?
When working with Morton Buildings, you have several choices when it comes to the style and size of your riding arena. Our open-framed design offers structural rigidity and a sense of openness.


Learn more at www.MortonBuildings.com.

Seed, Feed and Field - Fall 2021 4
SUSTAINABILITY – A HOT TOPIC ACROSS THE AG INDUSTRY
When it comes to the increasingly pressing topics of the 2020s, our minds immediately go to unprecedented, pandemic, quarantine, social distancing, and of course COVID. These terms have not only become a part of our everyday conversations, but also our everyday routines and general lifestyles. They are now (another popular phrase) the new normal.
Another word that has permeated seemingly every facet of society in recent years is sustainability. This term has made just as large of an impact on our daily lives and isn’t going anywhere anytime soon.
There are numerous definitions of sustainability out there, but the one offered by Investopedia seems most comprehensive and easiest to understand. It states that “Sustainability focuses on meeting the needs of the present without compromising the ability of future generations to meet their needs.” They further categorize sustainability into three areas: economic, environmental and social. In other words, the impact on profitability, planet and people.
Conversations regarding sustainability have become a hot topic within the ag industry, influencing organizations and individual companies to roll out their sustainability goals and strategies.
AgriFinancial’s parent company, CGB Enterprises Inc. (CGB), is one of those companies having far-reaching strategic conversations as to how elements of sustainability will be built into

the value stream for upstream producers and downstream. In a recent release, CGB introduced Ellie =Murphy, the organization’s first Director of Sustainability and Food Safety, who will lead the overall development and execution of sustainability and food safety initiatives, tailored to meet the objectives and needs of customers, employees and communities in which they operate.
Murphy states, “We are interested in understanding how we might become more competitive by creatively introducing elements of advanced operational efficiency to our facilities, harnessing those benefits at scale. Our ultimate objective is to shift the culture from ‘doing things differently’ to ‘doing different things.’ This will provide the most value to our increasingly diverse operational footprint.”
CGB is one of the largest shippers of grain on the inland river system. With numerous companies under their umbrella, they provide services like financial solutions, grain marketing, soybean processing, logistics and transportation to farmers and ranchers across the U.S. Each of their eight subsidiaries, including AgFi, will play an integral role in employing five actionable pillars.

1.) Resilient Supply Chain – providing traceable, dependable services and products.
2.) Sourcing & Production – responsibly sourcing materials.
3.) Community Commitment – impactful local relationships.
4.) Industry Collaboration – cultivating relationships with industry peers and government entities to implement industry best practices.
5.) Employee Wellbeing – diversity and inclusion, employee health and welfare and ethical business practices.
Alongside each pillar, CGB aligned their objectives with the United Nations Sustainable Development Goals (UN SDGs) in an effort to unite strategy with a larger global purpose. The UN SDGs establish 17 goals with specified targets, events, publications and actions. A few examples of these goals include Zero Hunger (#2) and Peace, Justice and Strong Institutions (#16).
You can read more about the UN SDGs at http://sdgs.un.org/goals.
You can learn more about CGB and their newly released sustainability pillars at www.cgb.com/sustainability.
RESOURCES: https://www.investopedia.com/terms/s/sustainability.asp www.cgb.com/about-us http://cgb.com/Sustainability https://sdgs.un.org/goals
5 Seed, Feed and Field - Fall 2021
The Feed
Farmer Mac’s Quarterly Perspective on Agriculture


The Feed
Farmer Mac’s Quarterly Perspective on Agriculture Fall 2021
ABOUT THE FEED
The Feed is a quarterly economic outlook for current events and market conditions within agriculture. The report is broad-based, covers multiple regions and commodities and incorporates data and analysis from numerous sources to present a mosaic of the leading industry information, with a focus on the latest information from the United States Department of Agriculture and their Economic Research Service. There are several regularly included sections like weather and major industry segments, but the authors rotate through other industries and topics as they become relevant in the seasonal agricultural cycle. Where the report adds value to readers is through its unique synthesis of these multiple sources into a single succinct report. Please enjoy.
For media inquiries: Megan Pelaez Director – Marketing & Communications MPelaez@farmermac.com | 202.872.5689

ABOUT FARMER MAC
Farmer Mac is a vital part of the agricultural credit markets and was created to increase access to and reduce the cost of capital for the benefit of American agricultural and rural communities. As the nation’s premier secondary market for agricultural credit, we provide financial solutions to a broad spectrum of the agricultural community, including agricultural lenders, agribusinesses, and other institutions that can benefit from access to flexible, low-cost financing and risk management tools. Farmer Mac’s customers benefit from our low cost of funds, low overhead costs, and high operational efficiency. For more than a quartercentury, Farmer Mac has been delivering the capital and commitment rural America deserves.
For business inquiries: Patrick Kerrigan
Vice President -- Business Development PKerrigan@farmermac.com | 202.872.5560 Follow Farmer Mac:


The Feed is a publication produced by the Federal Agricultural Mortgage Corporation (“Farmer Mac”), which distributes this publication directly. The information and opinions contained herein have been compiled or arrived at from sources believed to be reliable, but no representation or warranty, express or implied, by Farmer Mac is made as to the accuracy, completeness, timeliness, or correctness of the information, opinions, or the sources from which they were derived. The information and opinions contained herein are here for general information purposes only and have been provided with the understanding that the authors and publishers are not herein engaged in rendering investment, legal, accounting, tax, or other professional advice or services. This publication may include “forward-looking statements,” which include all projections, forecasts, or expectations of future performance or results, as well as statements or expressions of opinions. No reliance should be placed on any forward-looking statements expressed in this publication. Farmer Mac specifically disclaims any liability for any errors, inaccuracies, or omissions in this publication and for any loss or damage, however arising, that may result from the use of or reliance by any person upon any information or opinions contained herein. Such information and opinions are subject to change at any time without notice, and nothing contained in this publication is intended as an offer or solicitation with respect to the purchase or sale of any security, including any Farmer Mac security. Unless stated otherwise, all views expressed herein represent Farmer Mac’s opinion. From time to time, The Feed features articles or reports from authors unaffiliated with Farmer Mac, and the views and opinions expressed in these articles or reports do not necessarily reflect those of Farmer Mac. This document may not be reproduced, distributed, or published, in whole or in part, for any purposes, without the prior written consent of Farmer Mac. All copyrights are reserved.
Contacts
To subscribe to The Feed, please visit: www.farmermac.com/thefeed
@FarmerMacNews @FarmerMacNews
@JacksonTakach
Follow the author:
The Calm or the Eye?
After years of tighter and tighter profitability, it’s comforting to see a little breathing room back in the U.S. agricultural economy. Farm loan delinquencies are abating, farm bankruptcies are lower, and the USDA recently forecast the 2021 net cash farm income at its highest level in eight years. This improved outlook comes from higher expected commodity prices—no surprise to those following corn, soybean, wheat, and hog markets. Farm income statements received a boost from some leftover COVID-19 recovery programs from the USDA that overflowed from 2020. Farm balance sheets saw support from improving profitability potential, tight land markets, and a low interest rate environment. According to USDA data, farm real estate is up 7% from mid-year 2020 to midyear 2021. These are very positive numbers, worthy of a sigh of relief for many of rural America’s hardworking residents and the billions around the globe that rely on them for a safe and reliable supply of food, fuel, and fiber.
However, during this time of agricultural and rural economic recovery, it is difficult to determine if current conditions represent the calm after the storm or the eye of the hurricane. For many grain and oilseed producers, the higher prices are a welcomed relief, a calming presence that allows rejuvenation of working capital after a tempest of grinding prices. Meanwhile, for cattle, fruit, and nut producers, this period may feel more like the eye of a hurricane: a break from the brutal supply chain situation of 2020, but pressed against a crushing drought. And for some in the food supply chain, animal protein sector, and timber markets, a new battle with coronavirus variants and consumer preference uncertainty may even look
like foreboding clouds on the horizon. Depending on your perspective, the current recovery could be viewed as one or all three of these conditions simultaneously.
Regardless of perspective, what we do in the calm matters. Some will prepare for the next storm; some will reexamine expansion or strategic endeavors; and many will check on their neighbor to see how they fared during the latest squall and if they need some assistance. As the days shorten and the temperatures subside, there are fewer hours to spare and fewer days to waste in 2021. And I am confident that America’s farmers, ranchers, rural residents, and the lenders
and service providers that serve them will make the most of each one of them.
A happy and healthy harvest to all, Jackson Takach, Chief Economist at Farmer Mac

ALMONDS CATTLE/CALVES CITRUS CORN COTTON DAIRY HAY HOGS
SOYBEANS
WHEAT WINE GRAPES
2021 10
The Feed by Farmer Mac - Fall
FROM THE DESK OF THE CHIEF ECONOMIST
Higher
Environment Unfavorable
Fruit
Lower Prices
Prices Favorable Production
Production Environment
and Tree Nuts Feed Grains and Oilseeds
Summer 2021 Fall 2021 PRODUCTION AND MARKET PRICE PERCEPTUAL MAP
Livestock Sector
FARM INCOME UPDATE
Key Highlights
(resource 1)
Net cash farm income is forecast to be $134.7 billion in 2021, its highest point since the supercycle; government support adds to a strong underlying farm economy.
Corn, soybean, wheat, and hog producers are forecast to see incomes that could be near 2012–2014 peaks; cattle and specialty crops are at their lowest point in the last decade.
New estimates for 2020 find that eastern Corn Belt states saw far lower incomes in 2020 than initial projections, though that region should see strong 2021 incomes.
STRONG 2021 INCOMES In general, farm incomes are projected to be very strong for 2021. Total net cash income is forecast at $134.7 billion for 2021, up 17% from 2020, though still well below supercycle peaks. While commodity prices have improved through 2021, strong incomes are also a function of higher government payments. Figure 1 shows sector gross cash income broken out by major type. The blue area represents all income from the sale of commodities, which is a good proxy for the overall health of the farm economy. While total farm incomes in 2021 are projected to be at their fourth highest point in real terms since 2000, cash receipt income is forecast to be similar to 2015 income—good, but not great.
Figure 1: U.S. Gross Cash Income by Major Source, 2000 – 2021 Forecast
Figure 1: U.S. Gross Cash Income by Major Source, 2000 – 2021 Forecast
On September 2, the USDA’s Economic Research Service (ERS) issued its latest Farm Income and Wealth Statistics release, which included its second forecast for 2021 and its first set of estimates for 2020. There were two major themes of this release: First, producers should generally expect strong incomes in 2021 despite falling government payments; and second, the damage to the underlying agricultural economy in 2020 is estimated to be more significant than was suggested by the USDA’s last release in February. Both stories are not universal, as some producers saw good results in 2020, while others have not benefited from the booming incomes of 2021.
The Feed by Farmer Mac - Fall 2021
These conditions will likely not be realized sector-wide in 2021. Figure 2 shows average net cash farm income by farm business specialization. The USDA ERS forecasts that the average wheat, soybean, corn, and hog operation will see net cash incomes almost 50% higher than their average since 2010. In fact, the USDA currently forecasts that these producers will see incomes in 2021 that rival those seen during the supercycle era. Unlike in the supercycle, however, not every commodity is seeing a boom. On the other end of the spectrum, cattle producers and specialty producers (like fruit and tree nut farmers) are forecast to see their lowest incomes on average since 2010. Cattle futures and recent fruit and tree nut data suggest the potential for a turnaround late in 2021, but the USDA’s forecasts are reflecting their struggles to date.
FINANCIAL STRAIN One positive bit of information was on overall sector financial strain, which appears to be lessening. Since 2012, the farm sector’s debt to asset ratio has increased every year. Measures of liquidity and profitability have shown similar trends since the supercycle era. This farm income release indicates a break in that pattern, forecasting that these measures will all improve. Sector debt to asset ratios are forecast to fall to 13.6% in 2021, down from 14.0% percent in 2020, though still well above the 2010–2019 average of 12.5%. Working capital is forecast to be at its highest point since 2014, and many measures of profitability are also near supercycle levels.
The sharp income shock has led to other unique impacts on strain measured by the USDA. The USDA’s estimate for farm bankruptcies finds that bankruptcies should be at their lowest point in over a decade. It also finds that producers’ ability to service debt will be at its highest point since the end of the supercycle, and overall farm debt is
11
250
350 400 450 500 550 2000 2003 2006 2009 2012 2015 2018
300
2021F Gross Cash Income (2021 $s) Cash Receipts Farm-Related Income Direct Government Payments
forecast to decline for the first time since 2012. This is led by a predicted 6% decline in total operating loan debt in real terms, though real estate debt is forecast to show a smaller decline. Interestingly, the USDA projects that total real estate asset values will decline in 2021, despite the strong land values reported in the USDA’s annual land value report.
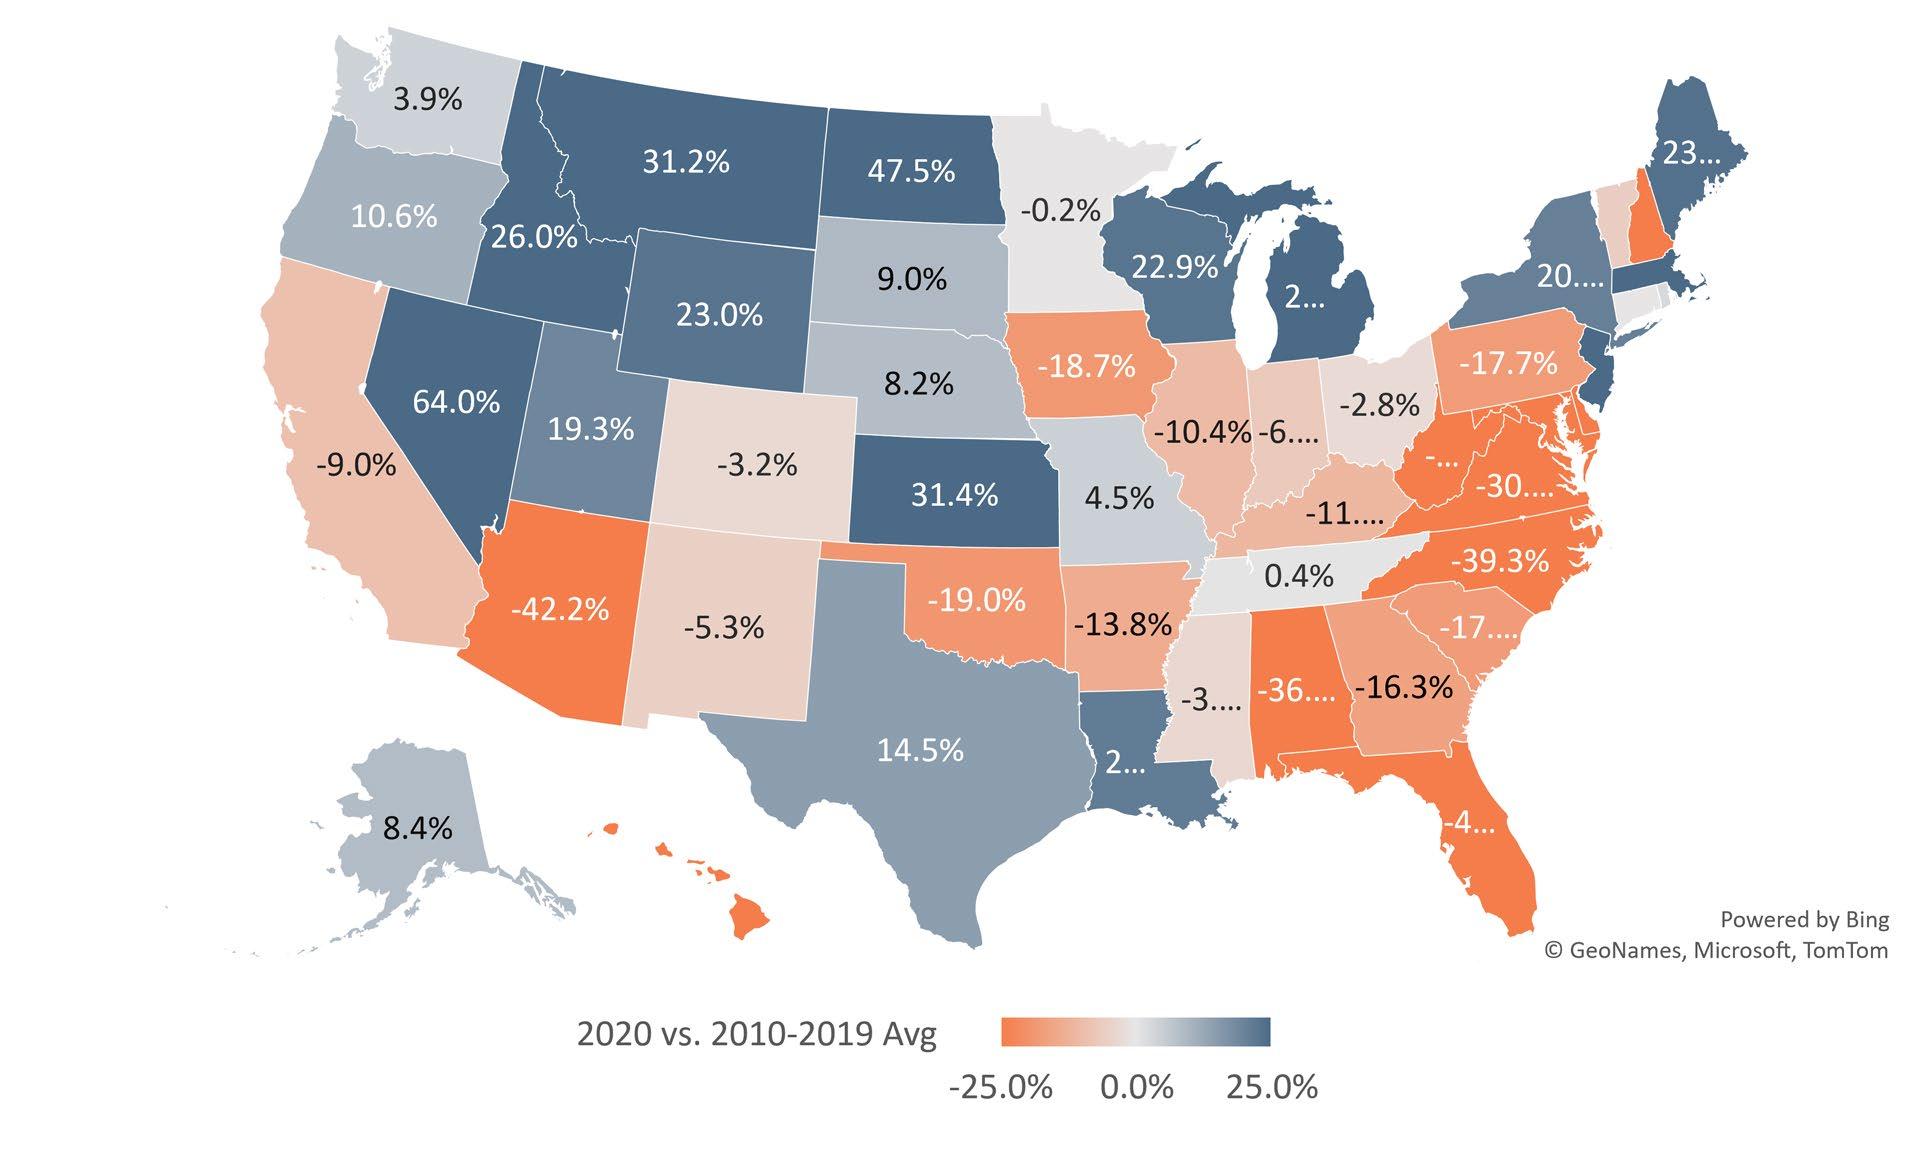
2020 UPDATES The September update is also when the USDA releases its first state-level estimates for prior year farm incomes. For this report, they issued a sharp downward revision in their expectations for 2020 income, driven largely by lower estimates for cash receipt income. However, regions saw very divergent outcomes from last year that depended on their local commodity mix. Figure 3 shows incomes for 2020 relative to a state’s 10-year average. In general, the Southeast saw far lower incomes than their recent averages. In the Northern Plains, states benefitted from an early surge in wheat prices. Major dairy producing states, like Michigan and Wisconsin, also saw very strong incomes in 2020, due to strong dairy prices through much of the year.
While these stories were largely known before the September release, the story of the eastern Corn Belt was more of a surprise. Many eastern Corn Belt states were among the largest recipients of Coronavirus Food Assistance Program funds. While this program was designed to be countercyclical, mid-year price surges in hogs, corn, and soybeans appeared to position these producers in this region better than those in almost any other region in the country. However, these new estimates suggest that a large quantity of both old and new crop corn and soybeans were sold during the low-price period between April and September 2020, leading to far lower overall receipts than season average prices would indicate.
Figure 2: Index of Average Farm Business Net Cash Farm Income, 2010 – 2021 Forecast
Figure 2: Index of Average Farm Business Net Cash Farm Income, 2010 – 2021 Forecast
250.0%
Index of Inflation Adjusted Net Cash Income (20102019 Avg = 100%)
200.0%
150.0%
100.0%
50.0%
0.0%
Wheat Corn Soybeans Cotton Specialty Crops Cattle and Calves Hogs Poultry Dairy
2010 2011 2012 2013 2014 2015 2016 2017 2018 2019 2020 2021F
Figure 3: State 2020 Net Cash Income vs. 2010 – 2019 Average
Figure 3: State 2020 Net Cash Income vs. 2010 – 2019 Average
Despite these small areas of concern, the overall thrust of this release is good. Many producers will receive their strongest farm incomes since 2014, with considerable government spending adding to a strong year for cash receipts. These incomes will reverse a near decade-long trend of increasing financial strain that has been observed in these forecasts. However, producers and lenders should be prepared to see lower incomes in 2022. The ERS paints a picture of a 2021 farm economy that resembles 2015, but with additional government support. Producers and lenders should prepare for a single year of very high incomes with a good, but not great, year to follow in 2022.
The Feed by Farmer Mac - Fall 2021 12
FARMLAND VALUES
Key Highlights
USDA data indicate that average farm real estate values increased to $3,380 per acre in 2021, an increase of 7% over 2020 levels.
The overall increase in land values is a function of increased profitability, heightened demand, increased liquidity, and a lower interest rate environment.

Changes in land values are highly regionalized, with large increases across grain-producing areas.
Farm real estate values have risen rapidly in the last six to twelve months. Surveys from the Federal Reserve Bank of Chicago show an increase of between 6% and 10% in Illinois, Indiana, and Iowa from September of 2020 and March of 2021. Researchers at Iowa State University measure the increase in land values in Iowa between the third quarter of 2020 and the first quarter of 2021 at nearly 20%. The Federal Reserve Bank of Dallas estimates average land values in Texas increased 11% during that same time frame. And the benchmark USDA Land Values report shows a national increase of 7% between June 2020 and June 2021.
Numerous economic factors contributed to the recent movement in land markets. The general increase in crop commodity prices in 2020 boosted the profitability outlook for 2021 and 2022. Combined with a generous amount of government support
Feed by Farmer Mac - Fall 2021
Figure 4: USDA 2021 Average Farm Real Estate Value Map, % Change from 2020


for COVID-19 disruptions, solid cash inflows gave many producers and land investors ample liquidity and working capital heading into 2021. Finally, the persistently low interest rate environment lifted all real assets, including farm real estate.
PROFITABILITY AND LIQUIDITY
The agricultural production sector experienced a broad increase in profitability and cash flow in 2020. While grain and livestock prices dropped early in the pandemic, grain prices ended the year up approximately 30%. The run on grain commodity prices continued in 2021 due to low global supplies, increasing international demand,
and a weak U.S. dollar, all contributing to price appreciation. In early August 2021, corn, soybean, wheat, and cotton prices remained between 30% and 75% above early 2020. Hog and poultry prices are also elevated in 2021, helping to boost production economics in many protein-heavy production regions. Adjusting county-level revenue levels for recent surges in commodity prices, producer revenues are up nearly 30% in 2021 for major corn and soybean states like Iowa, Illinois, and Indiana, and more than 20% in Northern Plains states like Minnesota, South Dakota, and North Dakota, compared to 2017 levels (the latest Ag Census data available).
13
The
(resource 1, 2, 3, 4, 5)
Figure 4: USDA 2021 Average Farm Real Estate Value Map, % Change from 2020
Source: USDA NASS Land Value Survey
While higher farmgate revenues are a big variable in land value appreciation, recent government support programs are another important source of cash flow and liquidity for producers. The Coronavirus Food Assistance Program (CFAP) allowed the USDA to aid farmers, ranchers, and others in the food supply chain with direct payments distributed in 2020 and early 2021 to help offset the market disruptions from COVID-19. These payments came on the heels of the Market Facilitation Program (MFP) payments in 2019 and early 2020, giving agricultural producers two years of very high government support payments. The USDA estimates that government program payments represented over 5% of gross farm income in 2019 and over 10% of gross farm income in 2020, compared to a prior-five-year average of 3% per year. These payments
helped restore much-needed working capital across the ag sector, and they gave many operators additional liquidity to tap for expansion and new land purchases. Seven of the top ten states by CFAP receipts are also in the top ten states by farm real estate value change in 2021. Overall liquidity in the U.S. economy can also be evidenced by the incredible surge in bank deposits in 2020 and 2021. Total commercial bank deposits ended July 2021 at $17.3 trillion, a $4 trillion increase from December 2019.
INTEREST RATES Interest rates for agricultural production remain near historic lows in 2021. The average fixed interest rate on real estate loans in the Federal Reserve Bank’s Tenth District fell from 5.31% in the first quarter of 2020 to 4.64% in the second quarter of 2021, as seen in Figure 5. Meanwhile, average rates on farm operating lines have also
Figure 5: Lower Interest Rates on Ag-Producing Assets
Figure 5: Lower Interest Rates on Ag-Producing Assets
Average Tenth District Fixed Interest Rate
12.00%
10.00%
8.00%
6.00%
4.00%
2.00%
0.00%
Real Estate Loans Operating Loans

Avg. 30-Year Residential Mortgage Rate 10-Year UST
dropped in the last year, while interest rates for farm production have generally tracked with residential mortgages and U.S. Treasury rates.
This lower interest rate environment has two effects on farm finances. First, the lower interest rates decrease interest expenses for producers with farm debt. Farmers can save between 7% and 14% in debt costs annually, depending on the term and tenor of financing. Second, a lower interest rate environment reduces the required return investment threshold in farmland to make the investment attractive. A lower hurdle rate due to lower interest rates can increase the willingness of investors to invest in an asset, and thus drives asset prices higher. The capitalization approach to farmland valuation implies that this downward shift in interest rates, if lasting, could drive an increase in farmland assets between 10% and 20% compared to mid-2020 levels.
Source: Federal Reserve Bank of Kansas City, Ag Credit Survey; Freddie Mac Rate Survey Data
OUTLOOK Persistent upward pressure on commodity prices and downward pressure on interest rates will likely help boost farmland values into 2022. Auction markets continue to see strong bidding and limited supply of land coming to market, which bodes well for the farm real estate assets that do come to market in the coming months. Markets may hit some resistance in 2022 if Federal Reserve monetary policy tightens or commodity prices back off recent levels. Water availability could also play a role in Western states. Access to adequate water may prove to differentiate property values rather than move the average. Slowing cash liquidity could also present a headwind to values in 2022; while commercial bank deposits remain at all-time highs, the growth stalled in May, reversed in June, and trod water in July of 2021.
The Feed by Farmer Mac - Fall 2021 14
CROPLAND ACREAGE
(resource 6, 7, 8, 9)
Key Highlights
The USDA’s June Acreage Report showed little change from March’s Prospective Plantings report, with corn, soybean, and wheat planted acres estimated at 92.7, 87.6, and 46.7 million, respectively.
Price-based models had suggested the potential for far higher acres, which led to a surge in futures prices for these commodities following the report’s release.
Planting progress and prevented plant acreage may be better predictors of final acreage, but the June report is likely to remain a major market mover.
The June Acreage Report is always one of the most market-moving reports that the USDA releases every year, and 2021 was no different. September futures for new crop corn and soybeans both rose over a dollar per bushel after the report was released, though markets pared back those gains in the following days. The 2021 June report showed that the USDA had not moved far off their March prospective planting numbers. Estimated corn acres rose from 91.1 to 92.7 million acres, wheat from 46.4 to 46.7, and soybeans stayed flat at 87.6. This also meant that production estimates for the 2021/22 crop marketing year were mostly unchanged.
These updated figures were all well below what the private sector expected, and caused the price surge. The
Figure 6: Change in Prices Received and Planted Acre Estimates for Cash Grains, 2012 – 2021
Percent Change in Farm Prices Received (FebMay)
Corn Soybeans Wheat
r = 0.54
2021 2021 2021
Prices, Planted Acres Rise
Prices, Planted Acres Fall
Figure 6: Change in Prices Received and Planted Acre Estimates for Cash Grains, 2012 – 2021 -20 -15 -10 -5 0 5 10 15 20 25 30 -6 -4 -2 0 2 4 6
Percent Change in Planted Acres Estimate (Mar - June)
Source: USDA Farm Prices Receieved, March Prospecting Planting Report, June Acreage Report
cash grain price surge in April of this year meant that all three commodities had seen record percentage increases in farm prices between the two reports. Figure 6 shows the percentage change in both prices and acreage estimates going back to when the first June report was released in 2012. Historically, price movements have been correlated with changes in acreage estimates between the two reports. A simple linear model of these data suggests that the price changes in 2021 are associated with a roughly 3% increase in corn acres, 2% for soybeans, and 1.3% for wheat. These estimates are all well above the change observed between this year’s March and June acreage reports.
Overall, the new report estimates that total corn and soybean acreage will be 180.3 million acres, just shy of the record 180.4 million acres planted in 2017. Several factors help explain why this acreage estimate may have differed from some industry expectations. One report from the University of Illinois found that
USDA data on planting progress and prevent plant acres have been highly correlated with June acreage estimates. In May, these pieces of evidence suggested 92 million acres of corn and 88.6 million acres of soybeans, close to the final June estimate. Despite some indication of higher prices, producers may have been holding back from expanding their operations as much as possible in 2021.
Yet even these other potential means of estimating acreage are not perfectly predictive of the final report’s numbers. Producers have shown a complex decisionmaking process that adapts to changes in the trade situation, weather, foreign production, policy changes, and a host of other factors that influence global supply and demand. This means that even good models of acreage will have years where they miss the mark. For that reason, the June Acreage Report will continue to be a major market mover and a must-read for agricultural commodity watchers.
15 The
Feed by Farmer Mac - Fall 2021
FARM LABOR
Figure 7: Farm Labor Wages in Dollars per Hour by Labor Type, January 2018 – April 2021
Figure 7: Farm Labor Wages in Dollars per Hour by Labor Type, January 2018 – April 2021
(resource 10, 11, 12, 13, 14)
Key Highlights
Worker absenteeism, H-2A visa disruption, and rising labor costs were thought to be potential outcomes from last year.
Actual results show negligible impacts to agricultural absenteeism and H-2A labor; farm labor should be readily available going forward.
Average farm labor costs rose 3% between 2019 and 2020, in line with national averages; specialty commodities and dairy are most at risk from these increased expenses.
Over the last year, agricultural labor has shown remarkable resilience to the potential threats it faced. Last April, we noted that high worker absenteeism, surging labor costs, and H-2A visa disruption could all present major threats to U.S. producers through 2020. While there were disruptions to some processors and there were some cost increases, the agricultural labor pool was largely sufficient for producers’ needs.
The first threat, significantly higher worker absences (e.g., employees taking more sick leave), never materialized in a real way in America. While a record share of the U.S. workforce was out of the office in April 2020, total absenteeism hit a record of 7.4% and quickly recovered in the summer following typical seasonal patterns. Through the second half of 2020, an average of 600,000 more people were absent from work due to illness than a typical year; high, but still
Hourly Wage ($)
All Farm Labor Animal Workers
Crop Workers Graders and Sorters Packers and Packagers
Jan-18 Jul-18 Jan-19 Jul-19 Jan-20 Jul-20 Jan-21
Source: U.S. NASS Farm Labor Reports
just 0.4% of the total workforce. The recent Delta variant outbreak has led to a modest increase in total workplace absences, but those are still below 2020 peaks. The USDA did find that the total number of hired agricultural workers fell between 3% and 6% between 2019 and 2020, but that decline may be explained by factors other than worker availability.
There was also minimal disruption to H-2A visas. The Department of Labor reports that between April and June of 2020, they certified 85,000 positions and processed 96% of applications within 30 days. Overall, there was an 8% increase in the number of applications processed in FY2020. While there were initial concerns around what visas might be impacted by policy decisions in April of last year, quick action led to an almost immediate set of changes designed to enable producers to continue finding labor through the H-2A program.
However, we have seen that even these minor impacts have contributed to rising labor costs. Between April 2020 and April 2021, average farm labor wages rose
from $15.07 per hour to $15.97 per hour, a 6% increase. The magnitude of this increase was roughly even across the U.S., rather than being specific to regions with high hired labor needs. This increase was only modestly above prior year increases and is in line with the national picture of a tight labor market. In the first part of 2021, the U.S. economy exhibited a record number of job openings as well as quits, indicating that wages will see some pressure over the near future. While this impacts all producers’ bottom lines, dairy and specialty crop producers will be most at risk from the rising labor costs.
Despite some potential labor cost increases, the overall picture from agricultural labor is far better than we could have imagined in April 2020. Large-scale worker absenteeism never came to pass, the USDA ensured that H-2A labor would continue to be available, and wage increases have been manageable. Outside specific meat processing facility closures, at no point was labor access a threat to agricultural production. Given the range of outcomes we thought were possible back then, farm labor has had a very good story.
The Feed by Farmer Mac - Fall 2021
16
10 11 12 13 14 15 16 17
FARM FINANCES IMPROVE
(resource 15, 16, 17, 18)
Key Highlights
Overall levels of financial strain have continued to fall due to strong government support and higher commodity prices; systemwide strain is the lowest it has been since 2017.
Improvements have varied by region: Regions with high dairy and cotton production saw the greatest declines in financial strain, while cattle-dependent regions may have seen increases to financial strain.
Q2 2021 farm bankruptcies were the lowest nationally since 2014, and the bankruptcy rate has reversed a 5-year trend of rising financial strain.
Instead, financial strain saw a sharp reversal in Q2 2020 that has only continued to wane, driven at first by robust government support and then later by a surge in many commodity prices. These forces have left many producers in their strongest position in years.
At a national level, strain at commercial banks and savings associations plummeted since the first quarter of 2020. Figure 8 shows nonaccrual and delinquency rates for agricultural loans by quarter. Even as commodity prices bottomed out in Q2 2020, delinquency rates improved by almost a half percent for both real estate and operating lines. By then, direct payments from government programs like CFAP and PPP had already begun hitting producers’ bank accounts. These payments had a second benefit for crop producers. Grain stocks reports suggest that producers were more likely to hold onto old crop through summer 2020 than prior years. Government support may have allowed producers to avoid having to sell storable commodities during this extreme lowprice period. By Q1 2021, agricultural delinquencies were at their lowest point since 2017. Initial data from Q2 2021 suggest that these trends continued through the second quarter.
areas by their major production type. Areas that are darker blue saw improving delinquency rates between Q2 2020 and Q2 2021, while orange areas saw their local conditions deteriorate.
The picture this breakout paints largely aligns with what we know about producer incomes from last year. The sole region with deteriorating conditions, the Basin and Range, is a major cattle region that is also in a region with extreme drought. Despite considerable government payments, persistent poor market conditions may have impacted banks who were largely reliant on cattle, like many in the Basin and Range. Meanwhile, areas like the Fruitful Rim saw underwhelming delinquency improvements. This sort of region is reliant on specialty crops like tree nuts, cotton, or fruit and vegetables; national government payment data suggested these commodities may have received less direct payments from programs like CFAP. Additionally, many of these commodities, like almonds, have seen persistent poor prices in part due to continued impacts from the global downturn.
Before 2020, agricultural banks had seen several years of rising financial strain. Farmers and ranchers had faced a half-decade of lower commodity prices, and the assets they had built up during the commodity supercycle had diminished. The USDA’s Economic Research Service (ERS) forecast that sector debt to asset ratios would be at their highest point since 2002. In April 2020, extreme lows in commodity prices led some to believe that the agricultural economy could receive a one-two punch that would lead to spikes in strain that would exceed the financial crisis or extreme drought years of the early 2000s.
It’s important to keep in mind that this rosy national picture did not apply evenly to all locations or all commodities. While grain producers with storage capabilities could wait out low price points, this was less possible for animal product and specialty producers. The second quarter of 2020 was filled with stories about upturned vegetable fields, dumped milk, and cattle languishing on feed lots. Cattle specifically also saw tepid markets with high supply that has continued through today. Figure 9 breaks out the national delinquency data by bank and aggregates it to the USDA ERS resource regions—these regions group
Conversely, areas like the Northern Crescent saw considerable improvements in local financial conditions. This region consists of dairy and cash grain operations and had seen some higher strain due to low milk prices before 2020. After an initial collapse of the dairy markets in April 2020, dairy producers saw both direct government payments and market supports through the USDA Food Box program. And while the Heartland saw less improvement in local financial conditions, consider that this region already had some of the lowest delinquency rates in the country in 2019. Regions that are corn-, bean-, and hog-dependent have seen delinquency rates fall to recent historic lows.
17
The Feed by Farmer Mac - Fall 2021
Figure 8: Delinquency and Nonaccrual Rate for Agricultural Loans at Commercial Banks, 2000 – 2021
4.50
4.00
3.50
3.00
2.50
2.00
1.50
1.00
0.50
RE - Nonaccrual RE - Total Operating - Nonaccrual Operating - Total
Figure 8: Delinquency and Nonaccrual Rate for Agricultural Loans at Commercial Banks, 2000 – 2021 0.00
Figure 9: Change in Agricultural Delinquency Rate by USDA ERS Resource Region, Q2 2020 – Q2 2021
Source: Federal Reserve Bank of Kansas City, Commercial Bank Call Report Data
Another way of viewing financial strain is through farm bankruptcies. Since the mid-1980s, most farmers who filed for bankruptcies have used Chapter 12, a provision specific to farmers and fishers which enables producers to retain assets far more easily than they would under other bankruptcy chapters. Figure 10 shows the number of Chapter 12 filings by quarter and the rate per 10,000 farmers. Like with delinquencies, we see a trend of improving conditions following a peak in bankruptcies in Q1 2020. In Q2 2021, the U.S. courts witnessed the fewest Chapter 12 filings since 2014, signaling that several years of strong government support and higher incomes have contributed to lower financial strain.
In short, most producers are seeing improving financial conditions for the first time in almost a decade. The robust government support of 2020 and the commodity price boom of 2021 appear to have made the difference. Incomes are up, working capital is up, land values are up, and delinquencies and bankruptcies are down. Even if the commodity price increases aren’t sustained over the long term, these higher-income years are helping producers recapitalize after years of lower incomes. The next time the agricultural economy takes a hit, producers should be in a better position to withstand the pressure.
Northern Crescent: -0.61% Northern Great Plains: -0.43%
Basin and Range: 0.34%
Figure 9: Change in Agricultural Delinquency Rate by USDA ERS Resource Region, Q2 2020 – Q2 2021 Heartland: -0.41%
Prairie Gateway: -0.77%

Mississippi Portal: -0.31% Fruitful Rim: -0.21%
Eastern Uplands: -0.39% Southern Seaboard: -0.47%
Source: FFIEC Call Report Data; USDA ERS Resource Regions; Farmer Mac Calculations
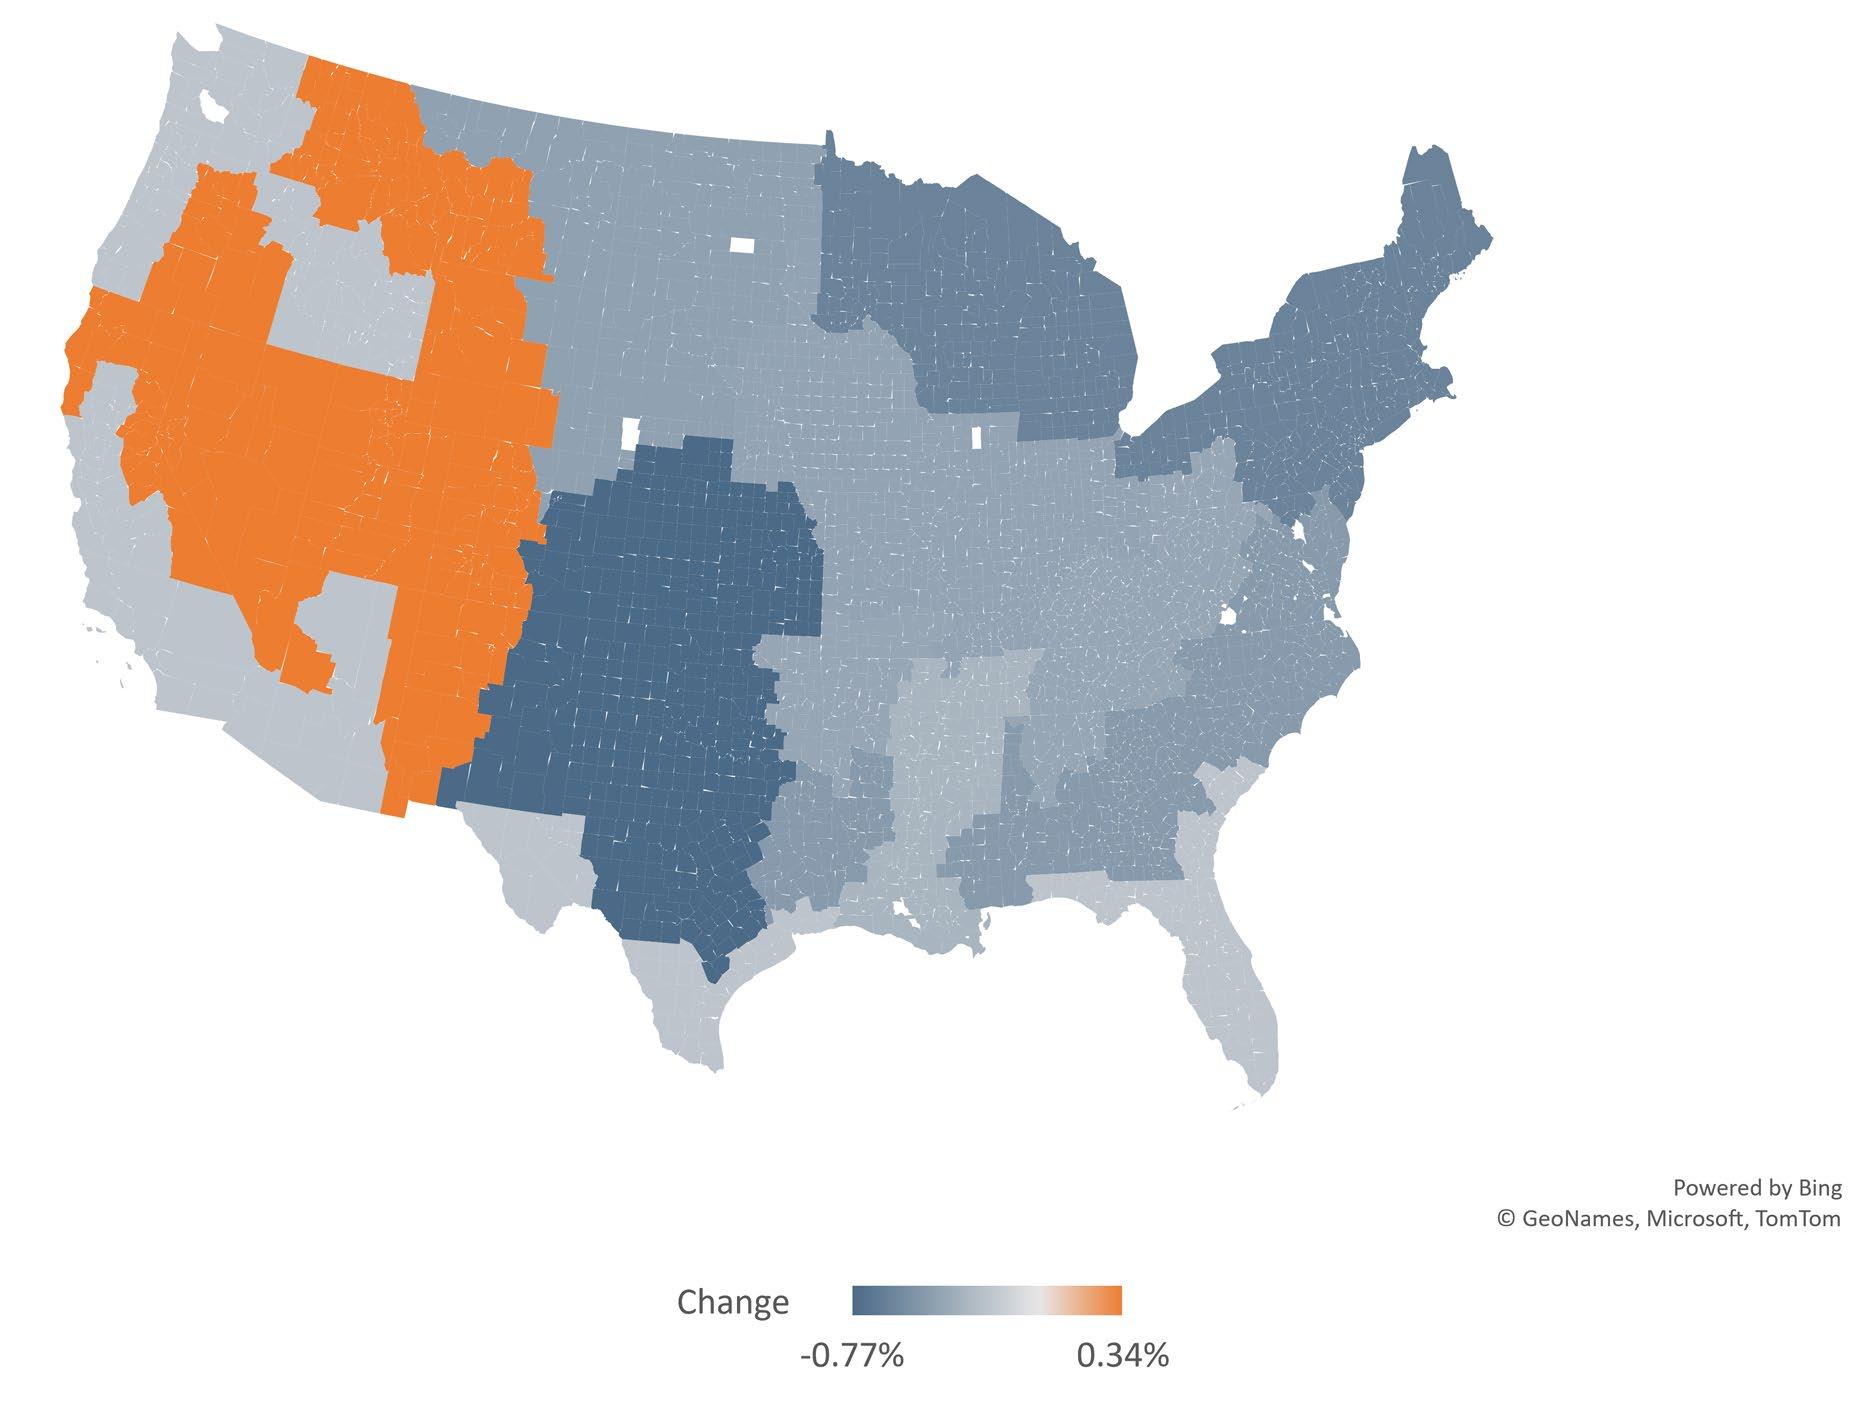
Figure 10: Chapter 12 Bankruptcies and Bankruptcy Rate, 2000 – Q1 2021
Chapter 12 Bankruptcies Bankruptcy Rate
3.50
3.00
2.50
2.00
1.50
1.00
Figure 10: Chapter 12 Bankruptcies and Bankruptcy Rate, 2000 – Q1 2021 0
4.00 2000
250
200
150
100
50
0.50
300 0.00
Source: United States Courts, Caseload Statistics Data Tables
The Feed by Farmer Mac - Fall 2021 18
2001 2003 2005 2007 2009 2011 2013 2015 2017 2019 2021 Rate
2002 2004 2006 2008 2010 2012 2014 2016 2018 2020 Number of Bankrupcties 12Month Bankruptcy Rate Per 10,000 Farms
DROUGHT
(resource 19)
Key Highlights
The 2021 drought is as severe as the 2002 and 2012 droughts, but it is having a greater impact on production; 25% of the top 100 agricultural counties were in exceptional drought as of August.
Drought conditions are leading to conversations around water access, from more minor changes (like improving irrigation system efficiency) to major ones (like permanently fallowing land).
Farmers and ranchers have over a 100-year history of managing water rights and have been active in forming new associations to meet current changing water conditions.
Figure 11 shows the national overall drought condition by showing the share of the country by drought status. The recent drought is more severe than the 2002 drought, with almost 10% of land in exceptional drought conditions. While the 2012 Palmer drought was more severe, it was highly localized to Texas for much of 2012, and its expansion into the Corn Belt in 2013 was less severe. The drought of 2021 is unusual both in the share of regions in exceptional drought, but also how squarely those areas of severe drought fall on major agricultural regions. A quarter of the top 100 largest agricultural counties are currently experiencing exceptional drought conditions. Almost half are experiencing at least severe drought.
if drought conditions continue to worsen across the U.S.
Through 2021, many producers both at home and abroad have been facing persistent drought conditions. This has been especially impactful for commodities that are concentrated in the Northern Plains and the West Coast. The USDA NASS’s spring wheat conditions reports are at record lows, and tree nut production is expected to fall precipitously from the prior year. Droughts are not uncommon in U.S. agriculture and several droughts have been notable, such as the 2002 drought in the southwest and the 2012 Palmer drought in the south. Yet there are several reasons why the 2021 drought is shaping up to be even more impactful than those prior drought years.
In some regions, the current drought period is driving producer conversations about the future of water access. In some cases, water access can be shored up through minor changes, like improving irrigation systems or through the purchase of water rights. But in regions that fear chronic future drought, producers are having conversations about whether they may have to permanently fallow land or purchase additional land almost exclusively for incremental water rights. To date, these conversations are localized in regions with specialty crops that need a lot of water and have limited local water supplies, but they may become more common
Of course, these conditions may also improve, or we could see minimal impacts on producers. In regions with a history of short water supplies, like California, producers have collaborated on local groundwater management associations for over a hundred years. Even if farmers and ranchers see exceptional drought periods, many areas have a long history of addressing water concerns to ensure that production can be maintained. In areas with new water risks, like near the Ogallala aquifer in the southern Plains states, producers have formed new associations designed to meet potential water risks. Drought and water access may become a much larger part of the conversation around U.S. agricultural production, but it appears that producers are willing and able to meet the challenge.
Figure 11: Percent of Counties by Current Drought Condition, January 2000 – September 2021
Figure 11: Percent of Counties by Current Drought Condition, January 2000 – September 2021
19 The
Feed by Farmer Mac - Fall 2021
0% 10% 20% 30% 40% 50% 60% 70% 80% 90% 100% 2000 2003 2006 2009 2012 2015 2018 2021 Share of Area In Drought Category Exceptional Extreme Severe Moderate Abnormally Dry None
Source: University of Nebraska Lincoln, National Drought Mitigation Center
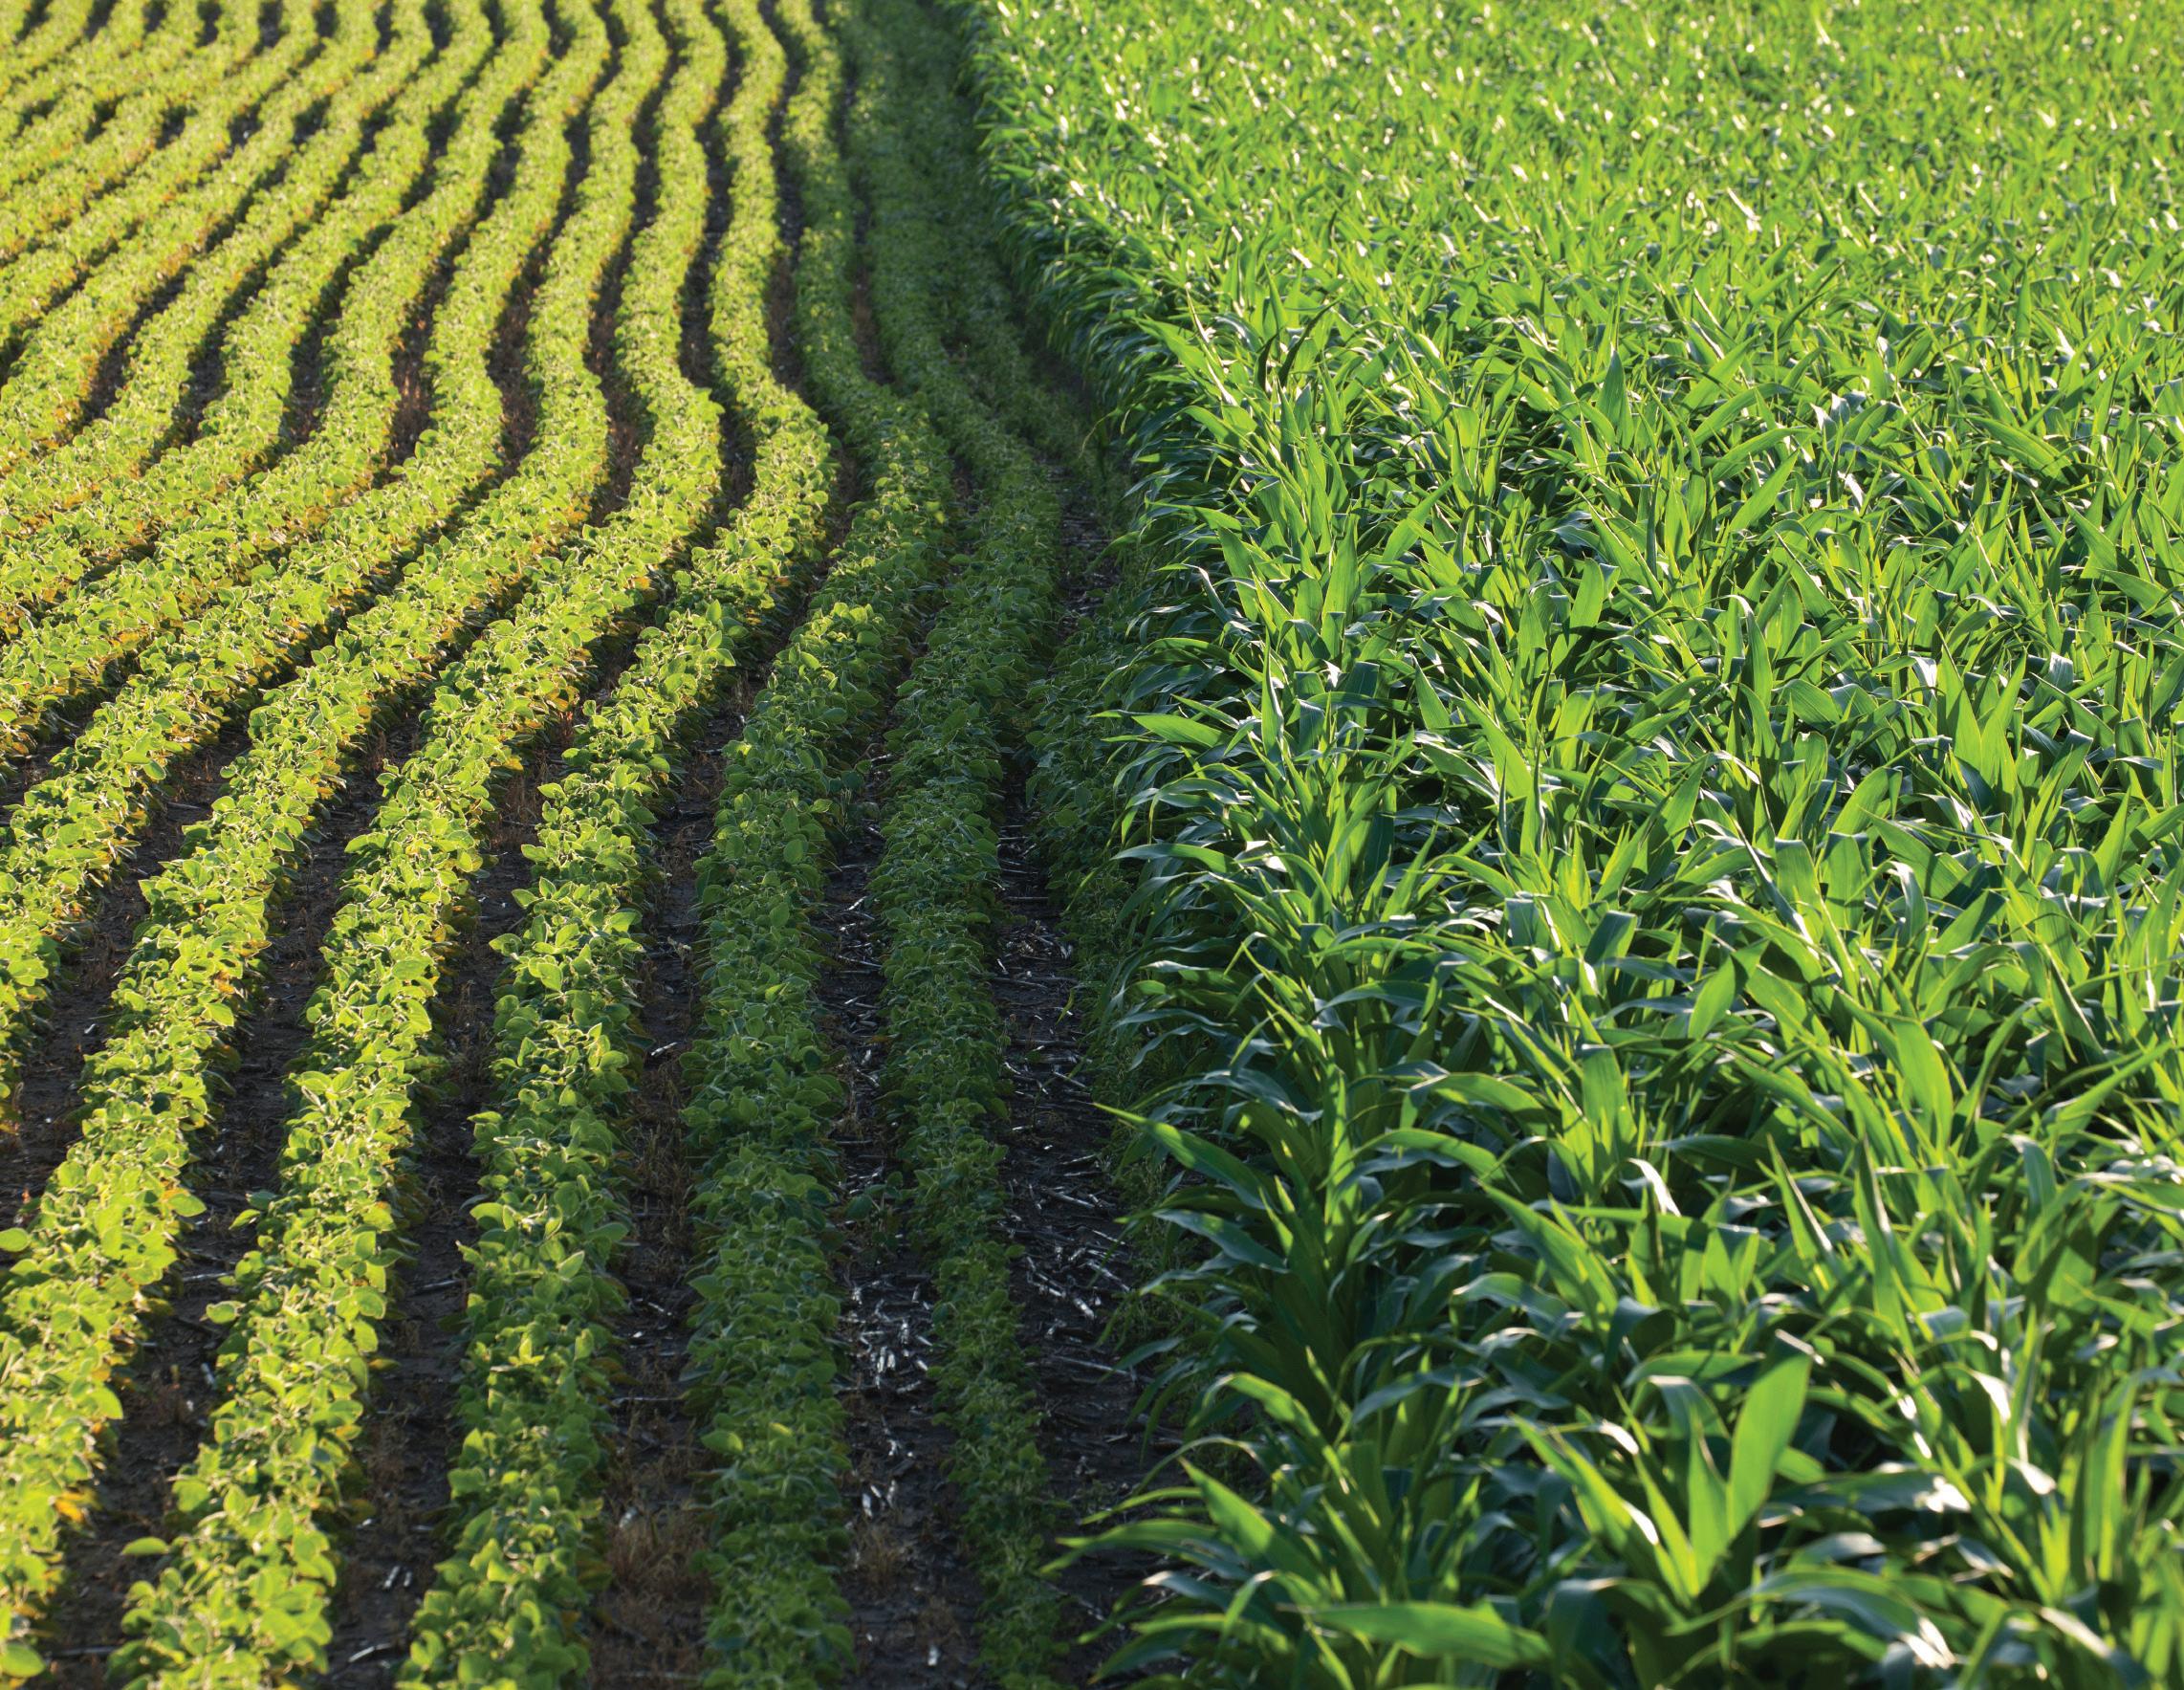
CORN AND SOYBEANS
Figure 12: Next Marketing Year Export Commitments, 2020/21 CMY and 2021/22 CMY
(resource 20, 21, 22)

Key Highlights
A combination of low stocks, poor U.S. conditions, lower global exports, and large Chinese imports are bolstering cash grain futures through at least the 2021/22 CMY.
U.S. beginning stocks for the 2021/22 CMY are at their lowest point since the supercycle, and crop conditions point towards lower production.
China’s record 2020/21 imports are forecast to be replicated in 2021/22, and poor 2020/21 global production should support American producers through China’s major winter buying season.
Through the summer, farmers have been able to sell old crop corn, beans, and wheat at some of the best prices in recent memory. As the 2021/22 crop marketing year (CMY) gets underway for all three commodities, several common threads will be important to watch to sustain the current strong futures markets. Domestic supply should be low, driven by low carry-in figures and poor crop conditions for the current marketing year. Global production forecasts are also lower in many regions for these commodities, contributing to tight global supplies. Meanwhile, U.S. exports are forecast to continue to be strong, driven by Chinese demand that is not expected to subside after the current record year.
The first bullish sign for producers is that the total U.S. supply for the 2021/22 CMY was already forecast low, and there are signs it could shrink further. Corn,
Corn - 20/21
Corn - 21/22
Soybeans - 20/21
Soybeans - 21/22 Source: USDA FAS Export Query Sales System
Week of Corn/Soybean Crop Marketing Year
soybeans, and wheat all benefitted from record exports last year, and they’ll start the 2021/22 CMY with the lowest stocks since the end of the commodity supercycle. All three commodities have also seen a deterioration in growing conditions, with spring wheat at its lowest point on record. Spring wheat has been heavily exposed to current severe drought conditions in Northern Plains states like North Dakota. The USDA’s current projections signal that spring wheat yields will be their lowest since 2002. Major corn and bean states, like Minnesota and Iowa, have also seen encroaching severe drought conditions late in the growing season. With stocks already near lows, small changes in crop conditions have led to large swings in the futures markets through the summer.
Producers also benefitted from delayed or poor global production during the 2020/21 growing season. Major South American producers Brazil and Argentina saw declines in corn production, which helped drive U.S. exports. While Brazilian soybean production was at a record high, poor conditions led to a delayed harvest, which allowed U.S. producers to dominate export markets over the winter months. However, all three crops are forecast to see record production in the 2021/22 crop marketing year. Futures markets
are likely to be sensitive to changes in these global production forecasts. If forecasts continue to rise, expect futures markets to penalize contracts that occur after major international harvests. Contracts before those harvests are less likely to be sensitive to future foreign harvests, suggesting that there should be less volatility in contracts for commodities before 2022.
The true wildcard is China. China’s total imports of corn more than tripled in the 2020/21 CMY total, which led to a sharp income boost for American producers. China also doubled its global imports of wheat the same year. The USDA currently projects that these record figures will be repeated for the 2021/22 CMY, and even forecasts an increase in China’s soybean demand. China’s rising protein demand has led to growth in use to outpace their domestic production for several years, and producers may see several years of record Chinese imports before their domestic production catches up. Figure 12 shows current commitments for the 2021/22 CMY. While lagging soybean commitments signal some concerns, corn commitments should exceed the robust 2020/21 year. Even if exports don’t hit 2020/21 highs, producers should see strong demand from overseas that helps support the current price environment.
The Feed by Farmer Mac- Fall 2021
20
Figure 12: Next marketing year export commitments,
5 10 15 20 25 30 35 1 3 5 7 9 11 13 15 17 19 21 23 25 27 29 31 33 35 37 39 41 43 45 47 49 51 53 Commitments (MMT)
2020/21 CMY and 2021/22 CMY
POULTRY
(resource 23, 24, 25)
Key Highlights
Labor shortages are crimping poultry processor throughput and reducing frozen stocks of chicken and turkey products.
Strong retail and export demand are supporting poultry prices at the retail, wholesale, and farmgate levels.
Feed prices remain the largest headwind for poultry producers in 2021.
After years of building stocks, poultry producers are experiencing tighter supplies and growing demand, helping to boost prices in 2021. Broiler production is down slightly through mid-year, driven by labor shortages at chicken processing plants. Slower throughput from broiler processors drove down farmer-received prices throughout 2020 and early 2021, but the strong grocery and food service price inflation are helping to boost margins throughout the supply chain. Frozen stocks of all parts of the chicken are at multi-year lows in mid2021, especially for chicken wings. Turkey production is also down in 2021 compared to recent history, driven by dry weather conditions in the upper Midwest, rising feed costs, and several years of tight profitability in the sector. Frozen storage of all turkey meat has averaged 20% below the five-year average in 2021, virtually tied with pork for the shortest supplies in recent memory.
In addition to supply-side challenges, the story of declining stocks is a function of exceptional demand in the first half of 2021. Competition for the best chicken 21 The Feed by Farmer Mac - Fall 2021
sandwich among quick-service restaurants continues to drive demand for white meat. Meanwhile, chicken wing demand remains robust in 2021 after a very strong 2020, and the demand has been strong enough to fuel wing-themed restaurants to create chicken thigh-themed offerings as a complement. Exports are another important driver of demand, and we’ve seen robust shipments to Mexico, Cuba, and Canada compared to 2020. Sales of turkey products to China have slowed in 2021 due to the rebound in pork production and reduced demand for meat substitutes, but the shipments to all other countries have more than offset this decline. There have been limited concerns about a recent outbreak of avian influenza in some global producing regions, but that has not dramatically impacted exports.
Farm prices for poultry look good heading into the fall, but profitability could remain under pressure in 2021 and into 2022. The USDA projects wholesale broiler prices to remain at approximately 93 cents per pound through 2022 and for turkey hens to average approximately 119 cents per pound. Both prices are substantially higher than 2019 and 2020 levels. However, rising feed costs are capping the benefits of higher retail and wholesale prices. The national broiler-to-feed price ratio, a measure of the price received for chickens compared to the cost of raw feed components, is at its lowest levels since 2012/13. Turkey producers see slightly better profitability levels, but the exuberance in turkey prices is capped by rising feed costs. If export and retail demand continue to pick up and processors can solve some modest labor shortages, the poultry sector should have a reasonably strong year in 2021 and into 2022.
Figure 13: U.S. Cold Storage of Animal Protein Compared to Last 5-Year Average
Frozen Stocks Compared to 5Year Average
-25% -20% -15% -10% -5% 0% 5% 10% 15% 20% 25%
Figure 13: U.S. Cold Storage of Animal Protein Compared to Last 5-Year Average
Chickens Turkeys Beef Pork
1/1/2017 1/1/2018 1/1/2019 1/1/2020 1/1/2021
Source: USDA Cold Storage Reports
DAIRY
Key Highlights
(resource 26, 27, 28)
Dairy producers should see less price volatility following the end of the USDA Food Box program and the near full resumption of restaurant activity.
Producers grew the herd consistently over the last year given high prices, but have already begun to thin the herd as prices softened and feed expenses rose in 2021.
Domestic market weakness, especially for dairy solids, should be offset by forecasts for robust dairy product demand overseas, especially in Asian markets.
Few sectors have seen the volatility that dairy producers have over the last year and a half. After experiencing all milk prices at a historic low in April of last year, producers were able to lock in highly profitable prices through the remainder of the year. As discussed elsewhere in this issue, these incomes contributed to sharp reductions in financial strain in dairy-reliant regions. Current futures markets suggest stable prices through the rest of the year, with minor upside in the winter months. However, current high feed costs will be a major pain point for producers over the near term.
The recent decline in dairy prices is based on forces that should be fully accounted for at this point. First, producers had thinned the dairy herd back in April 2020 as prices collapsed. The USDA Food Box program then invoiced 174 million boxes between May 2020
and April 2021, with at least a quarter of all proceeds going to dairy producers. This led to a cash infusion of almost a billion dollars into the dairy sector, prompting producers to grow herds to record levels shortly after thinning them. Recent price declines are resulting from the confluence of a high herd, the end of the Food Box program, and slower than anticipated restaurant demand growth.
There is evidence that dairy producers have begun to thin the herd in response to falling milk prices and rising feed costs. Figure 14 shows the national dairy herd and the ratio between all milk prices combined feed prices. Following a year of straight growth in the herd size, the overall herd size has fallen since May. In that time, prices for alfalfa have risen by as much as 20%, while corn and soybeans remain almost 50% above their historic averages. The combination of steep price declines and sharp feed cost increases have led to a rapid decline in this core profitability metric.
There is some positive news for dairy producers. School milk purchases are ramping up and appear to be unaffected by the Delta variant. Export markets also have the potential to lead to some upside for dairy over the near term. China has begun purchasing considerable volumes of whey protein for piglet feeding, causing prices to rise almost 50% over 5-year averages. Asian markets are also taking advantage of low cheese prices, and
consumer-oriented products like cheese are forecast to grow significantly in developing Asian markets. U.S. producers will have greater ability to sell into markets like Japan this year due to existing trade agreements, and will be on more even footing with a Canadian market that has historically engaged in protectionism.
In short, some upside in the export markets should counterbalance some near-term domestic market downsides. However, producers should be ready for feed costs to be elevated through at least the end of the 2021/22 crop marketing year. Dairy producers were quick to respond to rapid price declines last year and have shown that they are just as willing to respond to the softer prices and higher costs we’re seeing in the second half of 2021. That flexibility, combined with competing market forces, should allow producers to avoid significant price volatility and low-price environments over the near term.
Fall 2021 22
The Feed by Farmer Mac -
Figure 14: U.S. Dairy Herd Size and All Milk Price, January 2020 – July 2021 Figure 14: U.S. Dairy Herd Size and All Milk Price, January 2020 – July 2021 1 1.1 1.2 1.3 1.4 1.5 1.6 1.7 1.8 1.9 2 9,250 9,300 9,350 9,400 9,450 9,500 9,550 Jan-20 Mar-20 May-20 Jul-20 Sep-20 Nov-20 Jan-21 Mar-21 May-21 Jul-21 Feed Price Ratio U.S. Dairy Herd (Thousands) Herd Feed Price Ratio Source: USDA NASS, Milk Production Reports
Figure
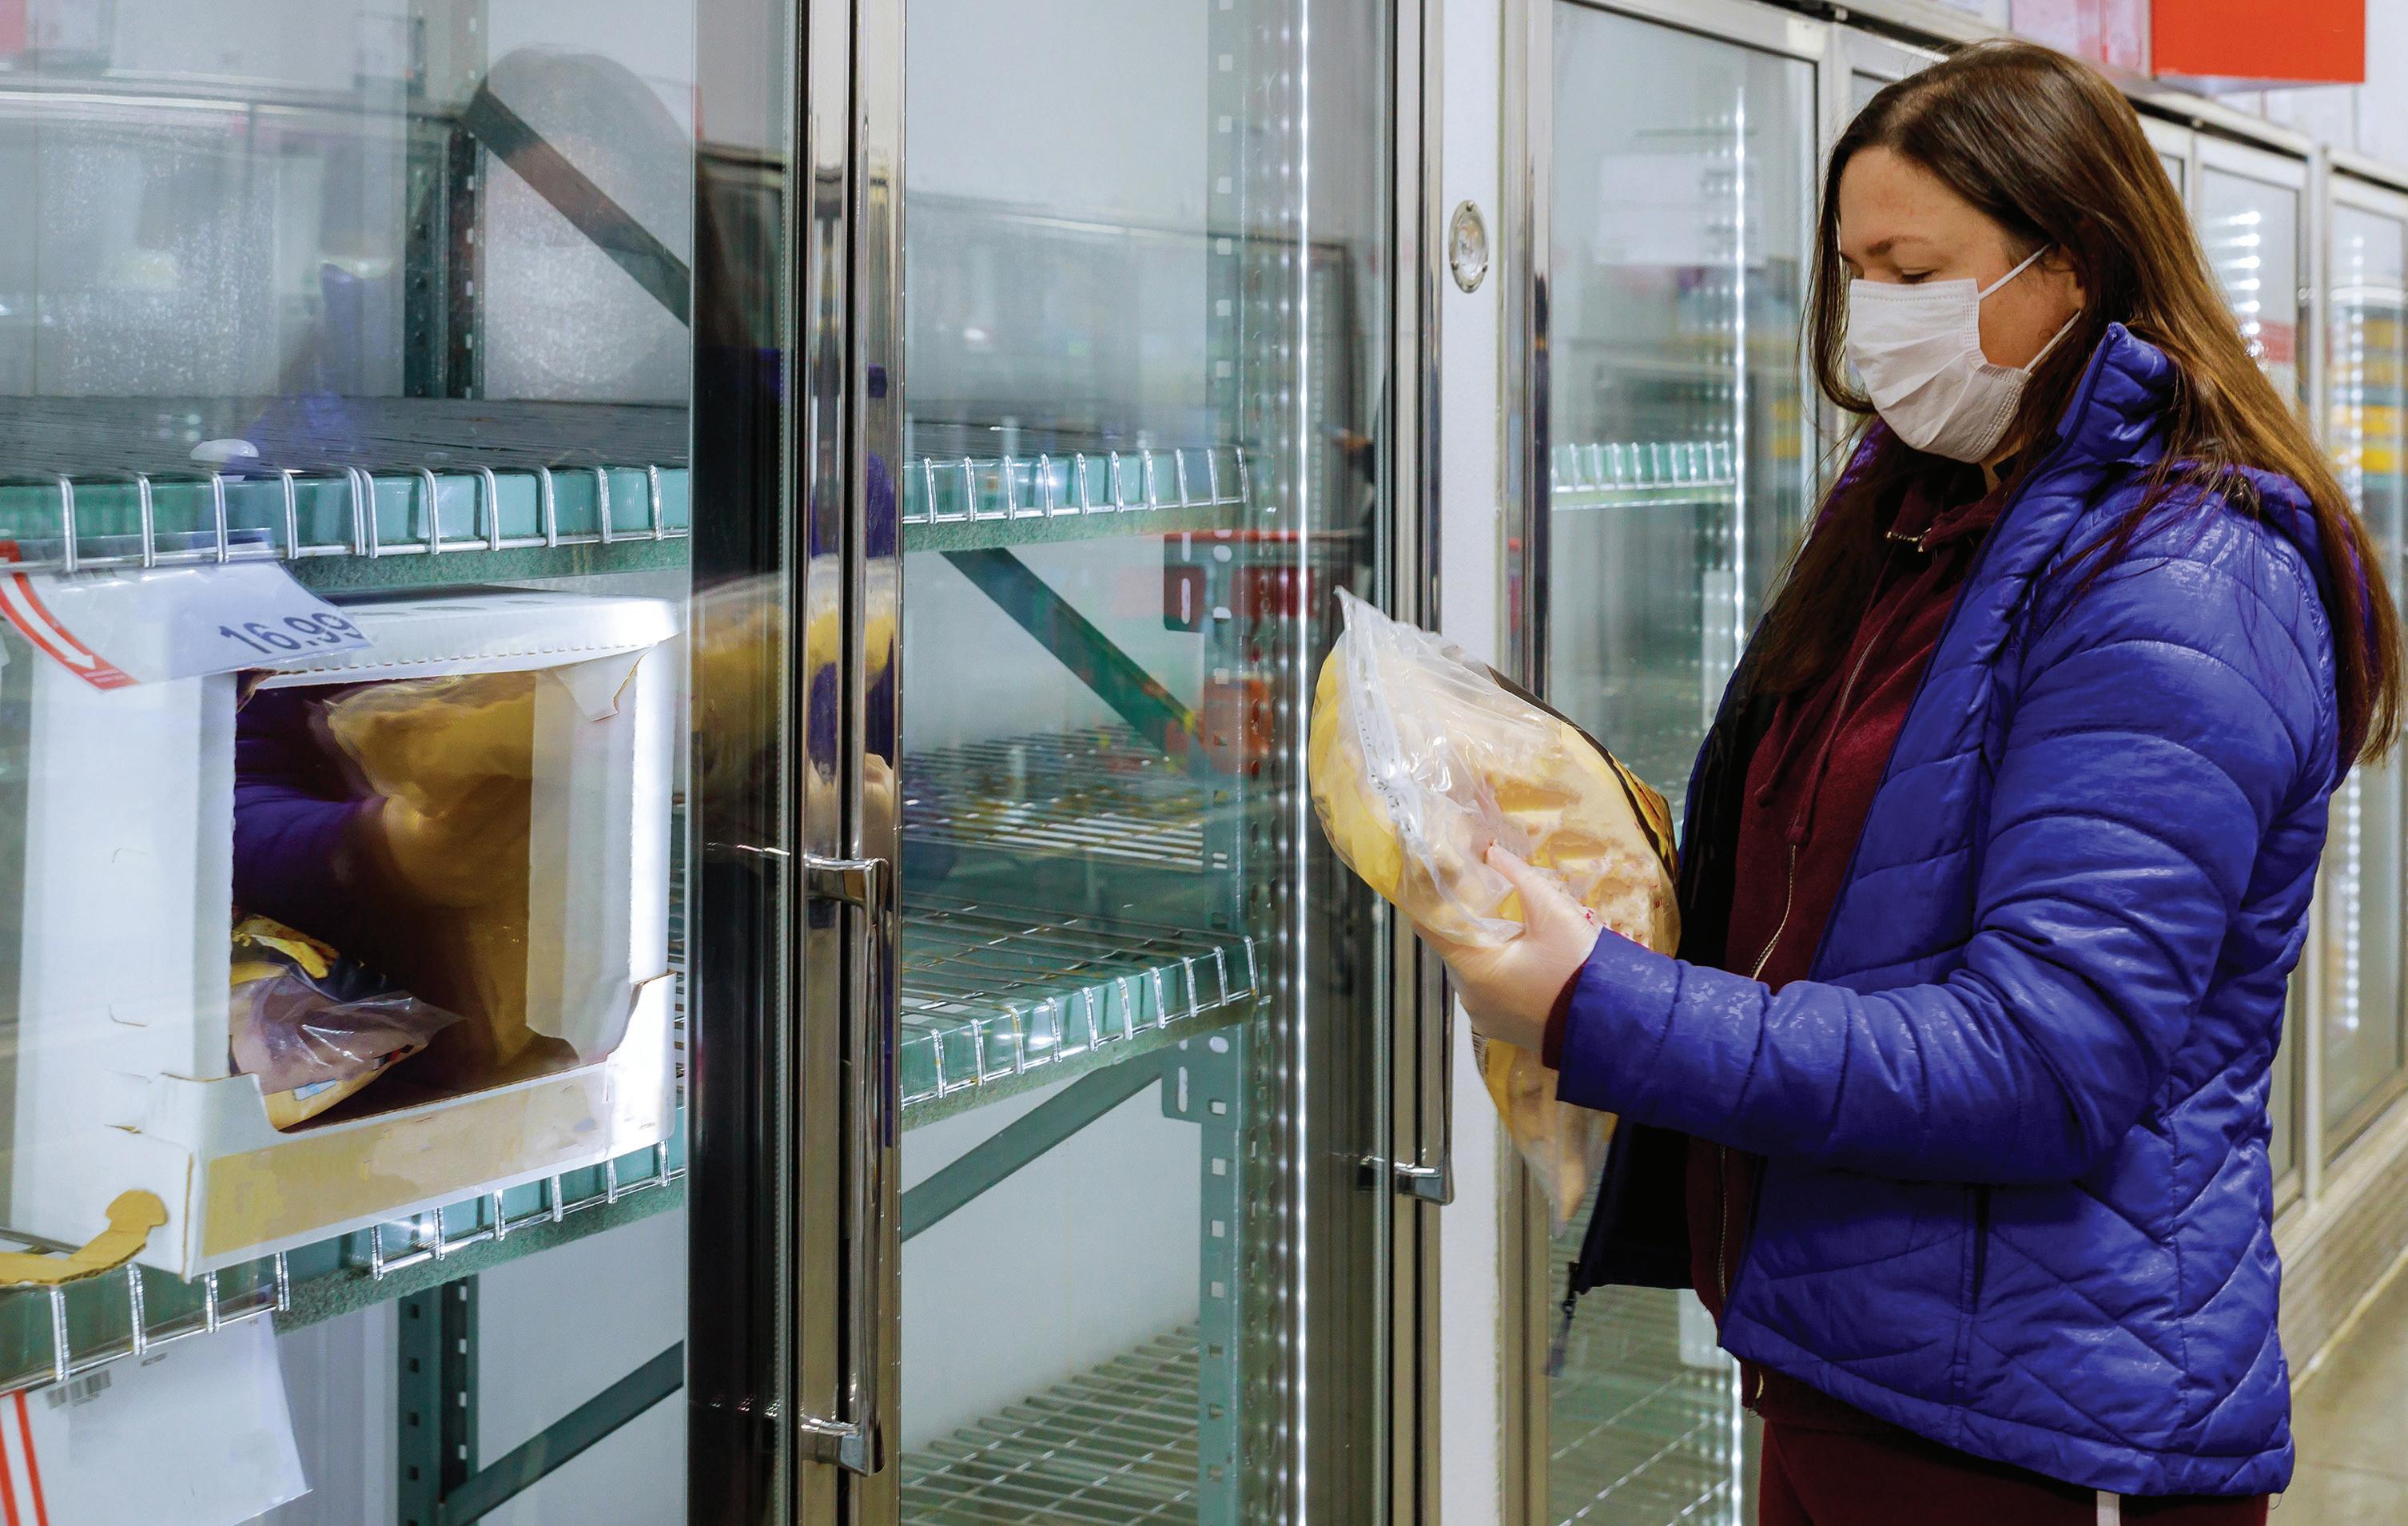
SPENDING ON FOOD AWAY FROM HOME
(resource 29, 30, 31, 32, 33)

Key Highlights
Many commodities are reliant on domestic restaurant activity to drive sales and have been waiting for the service sector to fully recover.
Americans’ spending on restaurants has surged to new highs, but mobility and savings data suggest that even more spending may occur.
Restaurant owners have been making historic investments in their operations and are expecting very strong sales growth through 2021 despite the recent Delta coronavirus wave.

Through last year, many Americans came to realize that we eat far differently away from home than we do at home—both in how much and in how richly we eat. Many of us have found, for instance, that our favorite dishes away from home contain a lot more butter than our home cooking, and that side salads aren’t quite as enticing outside a restaurant. Data from the USDA back this up, finding that frequent restaurant diners consume about 10% more calories than those who do not go to restaurants. And individuals who frequent restaurants also see significantly higher consumptions of fats, vegetables, and some proteins. As many Americans spent the last year waiting for their favorite restaurants to fully re-open their doors and serve up their favorite moredecadent foods, so too did many animal protein and
The Feed by Farmer Mac - Fall 2021
U.S. Food Spending and Inflation, 2000
Figure 15: U.S. Food Spending and Inflation, 2000 – 2021
Spending: Food at Home Spending: Food Away From Home
Inflation: Food at Home Inflation: Food Away From Home
Source: U.S. Census Bureau Advance Monthly Sales for Retail and Food Services, U.S. Bureau of Labor Statistics Consumer Price Index
specialty crop producers hold their breath waiting for their markets to fully recover.
The waiting appears to have come to an end, though the recent Delta wave has proven to be a minor speed bump. Americans are spending more money on food than ever before—both at home and away. Spending on food away from home surpassed prior highs in April 2021 and has shown no signs of stopping its ascent. At the same time, spending on food at home has remained high following sharp increases observed last year. As shown in Figure 15, the net effect is that total food spending is higher today than it would have likely been without the COVID-19 pandemic.
Inflation explains part of the reason for higher overall spending. Grocery store prices surged in 2020, and inflation on food away from the home is near historic high levels as of July 2021. In recent months, the Bureau of Labor Statistics has found that total quantity of food purchased has fallen even as total spending rises. Some of this record spending could reflect higher labor costs or other non-food expenses, but it suggests that restaurant activity is robust, as two-thirds of all food dollars spent away from home are spent at restaurants.
A key question is whether Americans are now back to using restaurants exactly as they did before 2020. If not, there is some potential that spending on food away from home could increase as we approach true normalcy. One indication of whether restaurants are
23
15:
– 2021 -4 -2 0 2 4 6 8 10 20 40 60 80 100 120 140 160 2000 2002 2004 2006 2008 2010 2012 2014 2016 2018 2020 Inflation (Percent Change From Prior Year) Monthly Spending ($Billions)
Figure 16: U.S. Mobility for Select Categories, January 2021 – September 2021
Figure 16: U.S. Mobility for Select Categories, January 2021 – September 2021 -40 -35 -30 -25 -20 -15 -10 -5 0 5 10
Percent Difference From Baseline Retail and Recreation Workplaces Grocery
Jan Feb Mar Apr May Jun Jul Aug
Source: Google Mobility Data
back to normal comes from mobility data, or how frequently individuals are going to places like bars and restaurants. Figure 16 shows these levels for several major categories like work, grocery stores, and retail and recreation. Even in early summer when coronavirus cases were very low, restaurant and retail activity remained stubbornly below baseline levels. With the onset of the Delta wave, restaurant mobility has fallen, and we are likely to see spending on food away from the home decline in the coming months.
There is also some data to suggest that Americans might spend more money on food away from home once the current wave is behind us. Many Americans are still in a better financial position today than they were in 2019, with data showing more total savings and disposable income available than at this point in 2019. While we don’t have information from the Census Bureau on whether this applied to all Americans or just those whose incomes were
Figure 17: Restaurant Performance Index, January 2020 – July 2021
Current Situation Indicator
115
110
105
Same-Store Sales Customer Traffic Labor
Capital Expenditures
100
95
90
Figure 17: Restaurant Performance Index, January 2020 – July 2021 85
Expanding
Contracting
Jan-20 Mar-20 May-20 Jul-20 Sep-20 Nov-20 Jan-21 Mar-21 May-21 Jul-21
Source: National Restaurant Association Restaurant Performance Index
unaffected through 2020, data suggests that the stimulus checks issued through the pandemic were always followed by material increases in both savings rates and disposable income. In short, growth in spending at restaurants is not likely to be limited by income through 2021.
Industry data support these views. The National Restaurant Association creates a monthly index that measures whether the industry is in an expansion or contraction phase relative to a year ago, broken out by four subcomponents. In recent months, restaurant owners have indicated that they were seeing strong spending and foot traffic. There has also been a surge in capital expenditures as these owners sought to capture new business. This index also tracks future expectations. While expectations about the next six months have softened considerably in the last month, restaurant owners still believe that the industry will be in an expansion phase at the start of 2022. Strong
sales growth is forecast through the coming months, and restaurant owners are continuing to spend to promote future growth.
For agricultural producers and lenders, this means that commodities heavily impacted by restaurants should see some improvement in the coming months, even if the Delta variant has slowed a full recovery. Cattle slaughter weights, which have remained stubbornly above pre-pandemic levels, should converge with historic averages. We also anticipate that historic cold butter stores should return to more typical levels. Total demand for vegetables should increase on greater full-service restaurant activity. In short, many commodities that have been held back by the sluggish restaurant industry should find some relief in the coming months. With evidence pointing towards a surge in restaurant activity heading into late 2021, those commodities might finally be able o break out of recent price lulls.

Fall 2021 24
The Feed by Farmer Mac -
RESOURCES
1 USDA ERS Farm Income and Wealth Statistics (https://www.ers.usda.gov/data-products/farm-income-and-wealth-statistics/)
2 USDA NASS, Land Values, 2021 Summary (https://usda.library.cornell.edu/concern/publications/pn89d6567)
3 Federal Reserve Bank of Kansas City, Ag Credit Survey (https://www.kansascityfed.org/agriculture/ag-credit-survey/)
4 Federal Reserve Bank of Chicago, Land Value and Credit Conditions Survey (https://www.chicagofed.org/research/data/ag-conditions/index)
5 Board of Governors of the Federal Reserve System, Assets and Liabilities of Commercial Banks in the United States (https://www.federalreserve.gov/releases/h8/)
6 USDA NASS, Acreage Report (https://www.nass.usda.gov/Publications/Todays_Reports/reports/acrg0621.pdf)
7 USDA NASS, Prospective Plantings (https://downloads.usda.library.cornell.edu/usda-esmis/files/x633f100h/w6634x823/x633fv29f/pspl0321.pdf)
8 Irwin, Scott; “Estimating Total Crop Acres in the U.S.” farmdoc daily. (https://farmdocdaily.illinois.edu/2021/06/estimating-total-crop-acres-in-the-us.html)
9 USDA NASS, Agricultural Prices (https://www.nass.usda.gov/Charts_and_Maps/Agricultural_Prices/index.php)
10 U.S. Bureau of Labor Statistics, Labor Force Statistics from the Current Population Survey (https://www.bls.gov/cps/absences.htm)
11 U.S. Department of Labor Office of Foreign Labor Certification, Performance Data (https://www.dol.gov/agencies/eta/foreign-labor/performance)
12 USDA ERS, Farm Labor (https://www.ers.usda.gov/topics/farm-economy/farm-labor/#wages)
13 U.S. Bureau of Labor Statistics, Job Openings and Labor Turnover Survey (https://www.bls.gov/jlt/)
14 USDA NASS, Farm Labor (https://www.nass.usda.gov/Surveys/Guide_to_NASS_Surveys/Farm_Labor/)
15 Federal Reserve Bank of Kansas City, Ag Finance Updates. https://www.kansascityfed.org/agriculture/agfinance-updates/
16 USDA ERS, Farm Resource Regions. https://www.ers.usda.gov/publications/pub-details/?pubid=42299
17 Federal Financial Institutions Examination Council, Bulk Data Download (https://cdr.ffiec.gov/public/pws/downloadbulkdata.aspx)
18 United States Courts, Caseload Statistics Data Tables (https://www.uscourts.gov/statistics-reports/caseload-statistics-data-tables)
19 University of Nebraska Lincoln, National Drought Mitigation Center (https://droughtmonitor.unl.edu/)
20 USDA NASS, Crop Progress and Conditions (https://www.nass.usda.gov/Charts_and_Maps/Crop_Progress_&_Condition/2021/index.php)
21 USDA FAS, Export Query Sales System (https://apps.fas.usda.gov/esrquery/)
22 USDA FAS, Production and Supply Database (https://apps.fas.usda.gov/psdonline/app/index.html#/app/advQuery)
23 USDA Economic Research Service, Livestock, Dairy, and Poultry Outlook. (https://www.ers.usda.gov/publications/pub-details/?pubid=101675)
24 USDA Economic Research Service, Feed Grains Database (https://www.ers.usda.gov/data-products/feed-grains-database/feed-grains-yearbook-tables.aspx)
25 USDA NASS Cold Storage Reports (https://usda.library.cornell.edu/concern/publications/pg15bd892?locale=en)
26 USDA NASS, Milk Production (https://downloads.usda.library.cornell.edu/usda-esmis/files/h989r321c/7h14bn48r/4q77gp501/mkpr0821.pdf)
27 USDA, USDA Farmers to Families Food Box (https://www.ams.usda.gov/selling-food-to-usda/farmers-to-families-food-box)
28 USDA AMS, Dairy Market News (https://mymarketnews.ams.usda.gov/filerepo/sites/default/files/2998/2021-09-03/502042/ams_2998_00080_01.pdf)
29 USDA ERS, America’s Eating Habits: Food Away From Home (https://www.ers.usda.gov/webdocs/publications/90228/eib-196.pdf?v=1881.1)
30 US Bureau of Labor Statistics, Consumer Price Index Summary (https://www.bls.gov/news.release/cpi.nr0.htm)
31 US Census Bureau, Advance Monthly Sales for Retail and Food Services (http://www.census.gov/retail/)
32 Google, COVID-19 Community Mobility Reports (https://www.google.com/covid19/mobility/)
33 National Restaurant Association, Restaurant Performance Index (https://restaurant.org/research/economy/rpi)
25 The Feed by Farmer Mac - Fall 2021
ABOUT THE AUTHORS
Lead Author - Jackson Takach, Chief Economist, is a Kentucky native whose strong ties to agriculture began while growing up in the small farming town of Scottsville. He has since dedicated a career to agricultural finance where he can combine his passion for rural America with his natural curiosity of the world and his strong (and perhaps unrealistic) desire to explain how we interact within it. He joined the Farmer Mac team in 2005, and has worked in the research, credit, and underwriting departments. Today, his focus at Farmer Mac currently includes quantitative analysis of credit, interest rate, and other marketbased risks, as well as monitoring conditions of the agricultural economy, operational information systems analysis, and statistical programming. He holds a Bachelor’s degree in economics from Centre College, a Master’s degree in agricultural economics from Purdue University, and a Master’s of Business Administration from Indiana University’s Kelley School of Business. He has also been a CFA Charterholder since 2012.
Lead Author - Greg Lyons is an economist who joined the Farmer Mac team in 2019. Prior to joining Farmer Mac, Greg was an economist with the USDA, Economic Research Service, where he created estimates of farm sector income and researched topics related to agricultural finance, beginning farmers and farm households. Greg’s interest in rural America stems from his time growing up in upstate New York, where he spent many hours on his family’s dairy farm. At Farmer Mac, he spends most of his time researching topics related to credit access, land values, and farm financial conditions. Greg has a bachelor’s degree in Policy Analysis and Management from Cornell University, and a Master’s of Public Policy degree from Georgetown University.


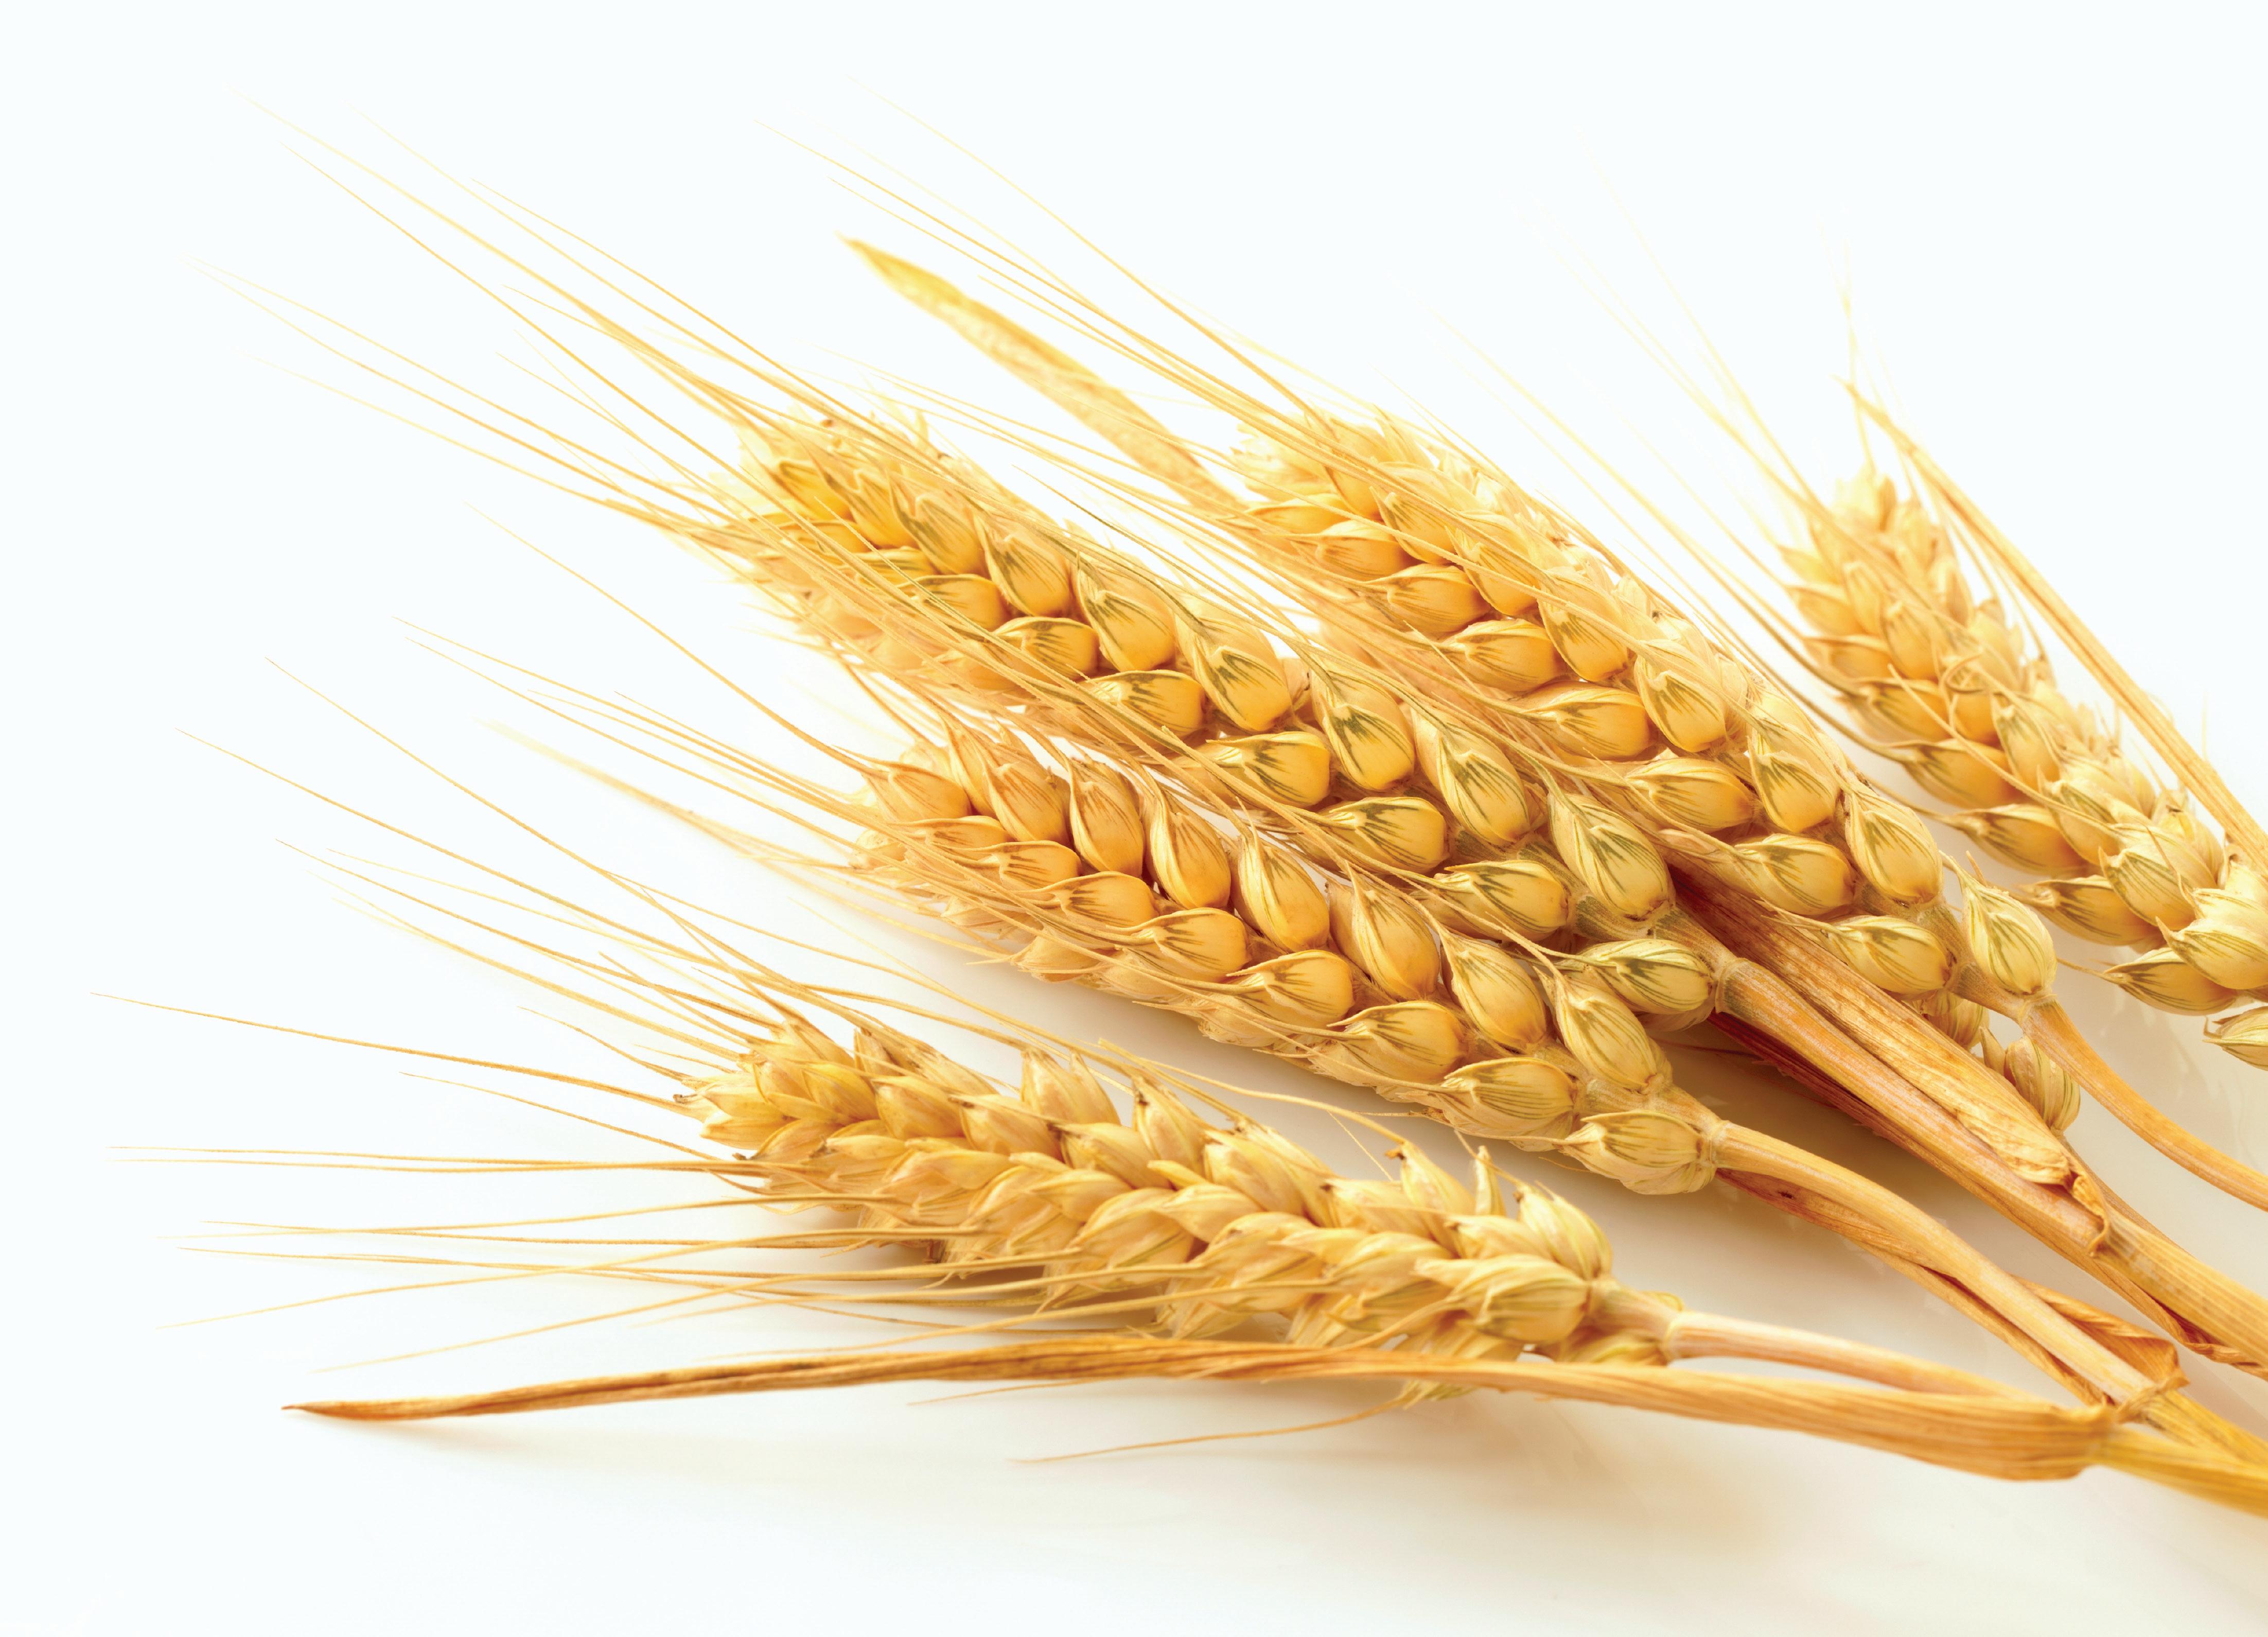 Croghan, Editor-in-Chief Betsy Urso, Copy Editor & Design
26
The Feed by Farmer Mac - Fall 2021
Riley
Corporate Stewardship I Unparalleled Service I Innovative Thinking I Collegial Collaboration

1999 K Street, N.W. Fourth Floor Washington, DC 20006
Phone: 800.879.3276 Fax: 800.999.1814 www.farmermac.com
Issue No. 22
Unrelenting Excellence I Absolute Integrity I Passion for Rural America I One Farmer Mac


INTENTIONALLY LEFT BLANK
FARM FRESH RECIPE

GRILLED CHEESE AND TOMATO SOUP BAKE
Ingredients
3 ounces reduced-fat cream cheese
1 1/2 teaspoons dried basil
6 large slices sourdough bread (1/2 inch thick)
6 slices part-skim mozzarella cheese
6 tablespoons butter, softened
1/2 cup tomato paste
1 garlic clove, minced
1/4 teaspoon salt
1/4 teaspoon pepper
1 3/4 cups milk (2% or Whole)
2 large eggs
1 cup shredded part-skim mozzarella cheese


Directions
Preheat oven to 350°. In a small bowl, mix cream cheese and 1 teaspoon basil until blended; spread onto 3 bread slices. Top with the mozzarella cheese slices and remaining bread. Spread outsides of sandwiches with butter. Arrange in a greased 13x9 inch baking dish.

In a small saucepan, combine tomato paste, garlic, salt, pepper and remaining basil; cook and stir over medium heat for 1 minute. Gradually whisk in milk and bring to a boil. Reduce heat, simmer, uncovered, for 4-5 minutes or until thickened, stirring frequently. Remove from heat.
Whisk the eggs in a large bowl; gradually whisk in a third of the milk mixture. Stir in the remaining milk mixture; pour over the sandwiches. Sprinkle with shredded mozzarella cheese.
Bake, uncovered, 25-30 minutes or until golden brown and cheese is melted. Let stand 10 minutes before serving.
Seed, Feed and Field - Fall 2021
30
INTRODUCTION


As a special feature in this edition of Seed, Feed and Field, we wanted to introduce you to Maggie Tuttle, a fictional little girl who loves to play dress up while helping out around the farm.
Fancy Farm was written and illustrated by members of our staff. We hope this story brings you joy and that you can share it with the Maggie Tuttles in your life.

31 Seed, Feed and Field - Fall 2021 FANCY FARM
A pink tutu and cowboy boots
That's what Maggie Tuttle wore To feed the calves and clean the pens and collect eggs from all the hens
A pink tutu and cowboy boots But that's nothing compared to the day before
A glitter ring and overalls
That's how Maggie Tuttle dressed To serve dinner and sweep the floors. To dust, and mop and finish chores
A glitter ring and overalls She always tries to look her best

Red lipstick and a princess dress
That's how Maggie Tuttle looked To feed the chicks and milk the cows. To weed the garden and wash the sows Red lipstick and a princess dress When it comes to fashion and flair, she's hooked


A shiny crown and red high heels
That's what Maggie Tuttle chose
To help wash dishes and fold socks and to put toys back in their box

A shiny crown and red high heels She has a knack for picking clothes

No matter what she wears, she's always in style
Maggie Tuttle has lots of charm
When she picks berries, beets and beans, shucks the corn and rakes the leaves She tops off her look with a great big smile
Just another day down on Fancy Farm

- Fall 2021 32
Seed, Feed and Field
FARMER FEATURE
Jack Galante
Carmel Valley/Monterey, California (3rd Generation) Galante Vineyards
*Producer
CROPS RAISED: Wine Grapes and Cattle
FAVORITE THING ABOUT BEING ON THE FARM:
Enjoying the beauty and uniqueness of each day – no matter how challenging it can be at times.
FAVORITE FARM MEMORY: By far my favorite memory from our ranch is the joy that my five children experienced by spending their days on the ranch and learning about the land and animal husbandry.
CURRENT FARM CHALLENGES :
The drought situation in California is quite challenging, however, our vineyards are extremely resilient and over the last several years we have been “training” the vines to adapt to dry farming.The main problem from the drought is the lack of adequate feed for the cattle and the constant fire danger.


WHAT I KNOW NOW THAT I WISH I KNEW WHEN I FIRST STARTED FARMING:

I learned a lot over the past few years from working with the AgriFinancial team on strategizing financial growth. I wish I had this kind of partner when I first started the vineyards and winery.

33 Seed, Feed and Field - Fall 2021
featured with permission
-Jack Galante


Fall 2021 34
Seed, Feed and Field -
"Nothing is more satisfying than to be able to work outdoors with your hands and to witness the results of your hard work in the final product, which for us is our wine."
2209 River Rd. Louisville, KY 40206
Phone: 877.548.2622 FinanceInfo@cgb.com www.cgb-agfi.com

Issue No. 3 Trust Our Roots, to Grow Yours.