

The only scorecard for entrepreneurial activity in North Carolina
As one of the few organizations in the US

The Council for Entrepreneurial Development (CED) was formed in 1984 with the mission of empowering and growing entrepreneurial companies in North Carolina.
CED provides many avenues that support growth. Through high-touch support, educational programs, access to capital and quality connections, we provide the resources that entrepreneurs need to become a success.
GET SUPPORT | cednc.org/get
Connect to Capital
Connects entrepreneurs with potential investors via formal introductions and is responsible for over 300 introductions a year.
Accelerate Series
An exclusive learning opportunity presented in workshop format with curriculum focused on the functional areas of building and scaling a company.
Venture Mentoring Service (CED-VMS)
A free, team-based mentoring program developed by MIT and adapted to meet the needs of our entrepreneurs, CEDVMS is responsible for graduating over 200 companies and has clocked over 6,700 hours.
Venture Connect Summit
We provide valuable connections and programming each year over multiple days at our annual Venture Connect Summit. cednc.org/venture-connect
GIVE SUPPORT | cednc.org/give
Partner
CED is a community of companies that need support and give support. CED Partners are the resources that provide support, while making an investment to support companies as they build and scale.
Build
Investments from CED Builders allow us to increase the capacity and overall impact of our programs and services while allowing us to tackle big initiatives that transform the ecosystem.
Collaborate
Our Collaborators are the foundation of CED. Through knowledge, financial support or both, these are key components to supporting the growth of entrepreneurial companies alongside CED.
CED has a passion for entrepreneurship and a desire to help people build their companies. We have seen the results of creating powerful connections and strengthening our ecosystem through growth. Visit our website and connect with us today!

The mission at CED is to connect entrepreneurial companies with high-value resources to accelerate business growth.
“I first started using CED in 1995, when we launched SciQuest and it’s hard to imagine how we could have grown a simple idea into a public company in just five years without their assistance.”
Scott Andrews/ Founder/SciQuest

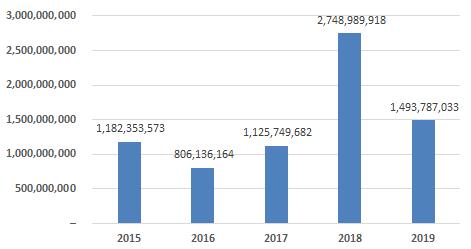
In 2019, North Carolina entrepreneurs raised nearly $1.5B in equity funding, the second highest amount over the last twenty years, trailing only the year prior. In fact, in normalizing 2018 by removing the large Epic Games outlier, 2019 almost identically matched 2018.
On the flipside, there were fewer overall deals compared to the year prior, driven largely by less seed stage deals.

$17,687,982
$53,847,953
$258,934,228
$657,744,769 Raleigh/WF
$275,941,326 Cary/Morrisville
$126,248,448
$19,855,278


As is the case in most years, the bulk of venture investment activity occurred in the Triangle, with the Life Science density in Durham/RTP helping that area raise nearly half of the state’s total dollars. Interestingly, there were three Fintech deals over $75M in each of Charlotte, the Triangle, and Eastern NC with large fundraises for AvidXChange, Spreedly and nCino. Western

There was almost perfect balance between the Tech and Life Science sectors in 2019, with each raising nearly $700M. This result may be an indicator of stronger balance in North Carolina’s innovation ecosystem with all sectors seemingly healthy.
From a quarterly perspective Q2 and Q4 are historically the largest quarters, and that remained the case in 2019, with some of the larger deals helping to skew the quarterly splits.
Investors from all over the country have continued to target the Southeast, seeking lower valuations than some of their home markets as well as capital efficiencies for portfolio company operations. Nearly a third of the 137 unique investment funds that did a deal in North Carolina in 2019 came from either California or New York.


With larger growth deals (>$50M) happening more frequently, less companies and their investors have found the desire to sell their businesses. With public markets also not being particularly favorable to recent venture-backed companies, the delayed, or avoided IPO trend has also happened in North Carolina. In 2019, there were only 21 exits, including one IPO among the acquisitions, down from 30 total exits the prior year.


“Of all the markets where we have investments, Raleigh Durham stands out as a tremendous incubator of talent, largely due to the work of CED. It is a pleasure being a part of the Raleigh Durham market through our investment in Keen Decision Systems. CED does a tremendous job of coordinating local resources to advance the goals of the business community, connecting the dots between companies, investors and local talent” Jamie Weston, Managing Director of Spring Mountain Capital in New York.


“Not only do we have great entrepreneurs coming out of all the local Universities everyday, we have seen an influx of entrepreneurs from other tech hubs moving to the area because of the cost of living, access to talent, and quality of life. This all creates even more deal flow, which is outpacing the availability of institutional seed stage capital.”
Tim McLoughlin, Cofounders Capital
As is happening nationally, North Carolina saw fewer overall deals in 2019, but deal size has remained larger than the average over the last five years. While reported seed deals were seemingly down, there was little noticeable change in large follow-on growth equity funding rounds for established venture-backed companies.
$5M-$14.9M
$1M-$4.9M <$1M-$4.9M
You can make a difference
The entrepreneurial ecosystem in North Carolina is a result of collaboration of resources across our region. Through financial support and skilled volunteerism, CED is able to make a significant impact. Entrepreneurs, mentors, investors, and business partners all contribute to our success. Learn how you can make a difference: cednc.org/give/donate
Empowering Entreprenuers to go further faster


CED is a nonprofit organization that provides support to the entrepreneurial community by deploying its own resources and resources from the CED Network of Partners. Donations made directly to CED enable us to track entrepreneurial and investor activity, then report out to you on an annual basis. For information on how you can support the work of CED, please contact us at 919.549.7500 or visit us on the web at CEDNC.org/give/donate.
Information obtained from: CED, PitchBook, National Venture Capital Association (NVCA), North Carolina Biotechnology Center, Small Business Technology Development Center (SBTDC), NCIDEA, EY, PwC & SBIR.gov.