Thank you to all of the residents of the Hilltop as well as the many business and community organizations who have committed time to advancing the Envision Hilltop Community Plan. As this update illustrates, we are making progress to secure the Hilltop’s future prosperity, together.
The city has completed a number of projects in the community including the $9 million Glenwood Pool renovations, the $8.35 million Sullivant Avenue streetscape improvements and the $22 million Hilltop Early Learning Center.
Community partners are also making a significant difference. The Mid-Ohio Food Collective recently completed construction on a seven-acre, urban “smart farm” on the Hilltop where innovative growing techniques will be showcased.
The Hilltop RISE economic Community Development Corporation (CDC) that is dedicated to supporting “mindful economic growth and development on The Hilltop” was established in 2022. This year, they led an illegal dumping and litter cleanup campaign.
Franklinton Development Association (FDA) has been an important partner in supporting the work of the Envision Hilltop community plan. This includes FDA’s Financial LifeSkills Program that
helps participants build a strong foundation of basic budgeting and money management skills. This work reflects our shared commitment to providing exceptional amenities and opportunities for all our residents.
While celebrating these achievements, it’s important to acknowledge that our work continues. We must build upon these successes and ensure ongoing progress throughout our community.
The Envision Hilltop community plan continues to be informed by comprehensive data, and uses strategies and recommendations aimed at catalyzing impactful change for Hilltop families. Columbus and Central Ohio are experiencing unprecedented growth, and for that to continue, we must plan accordingly for our neighborhoods. By remaining committed to the pillars that were outlined in the plan, we will not only address existing challenges but also ignite transformative growth, better equipping us to navigate future developments with thoughtfulness and confidence.
I extend my deepest gratitude to everyone who has contributed to these projects—residents, community leaders and city staff alike. Let us renew our commitment to continued collaboration, progress and improvement. Together, we will ensure that Columbus remains a place where everyone can live, work and prosper.
Sincerely, Mayor Andrew J. Ginther City of Columbus
DEPARTMENT OF NEIGHBORHOODS STAFF
William Wilder Community Planning Analyst
Nick Plouck Neighborhood Program Specialist
Patrice Allen Brady Neighborhood Strategies Manager
Kym Douglas Director
ACKNOWLEDGMENTS
NDC PLANNING TEAM
Juliana Silveira Dir. Planning and Urban Design
Jacob Gagnon Planner
Pranav Naukudkar Planning Intern
Tara Smith Project Manager
HOUSING & RETAIL MARKET STUDIES
Matt Wetli Principal
Andy Pfister Principal
Richa Singh Senior Associate, Urban Planner
Olivia Borland Project Planner
Carolyn Flesaker Associate, Economic and Urban Planner
Dawson Estep Graphic Design Intern
Lucas Martinez Planning Intern
ADVISORY COMMITTEE
Amber Shoup
180 Demo
Kayla Davis
A Step in the Right Direction
Georden Burton
Boys and Girls Club - J Ashburn Center
Jerome Buckner
Neighborhood Legacy Group
Shwonia Barry
City of Columbus - CARE Coalition
Megan Beck
City of Columbus - Celebrate One
Alex Passas
City of Columbus - Recreation and Parks
Nancy Rhynard Hilltop Business Association
Theresa Whittington Hilltop YMCA
Audrey Beam
Mid-Ohio Food Collective
Tim Rush Third Way Café
Stephanie Kensler City of Columbus - Development
Olabisi Eddy City of Columbus - Neighborhoods
Shavonne Jones City of Columbus - Violence Prevention
John Rush Clean Turn, 180 Demo
John Tetzloff
Columbus Metropolitan Library - Hilltop Branch
Mike Alcock
Columbus Metropolitan Library - Hilltop Branch
Haley Gerken
Columbus City Council
Kristina Diane Hilltop Homes
Stephen Torsell Homes on the Hill
Zerqa Abid MY Project USA
Ibrahima Sow United Way
Andrew Neutzling
Central Ohio Transit Authority
Gina Shimer CRT Realtors
Ashley Montana Franklinton Development Association
Dan Fagan
Greater Hilltop Area Commission
James White
Greater Hilltop Area Commission
Victoria Klein
Greater Hilltop Area Commission
Joe Argiro
Greater Hilltop Area Commission
Betty Jaynes Hilltop Rise CDC
Daniel Ruggiero Homes on the Hill
Eric Green Neighborhood Legacy Group
Molly Donavan Westgate Farmers Market
Kevin Orr Glenwood Methodist Church
Lisa Jones
Habitat for Humanity - Mid Ohio
Geoffrey Phillips Highland West Civic Association
Scott Carr
Highland West Civic Association
Carla Carr
Highland West Civic Association
Shelly Casto
Highland Youth Garden
Danny Peterson Hilltop RISE CDC
Morgan DeBoth Hilltop RISE CDC
Hunter Winey Lower Lights Community Learning Center
Austin Hill The Refuge
Cory James City of Columbus - Code Enforcement
BACKGROUND
WHAT IS THIS REPORT? WHY NOW?
Strong and vibrant neighborhoods are the backbone of our city. The Envision Hilltop Community Plan was designed to be a roadmap to revitalization and set the framework for long-term transformation for the Hilltop neighborhood.
After five years, it is time to review our progress and look at current trends and market changes impacting the goals and action steps of the plan. This progress report builds on the foundation of the Envision Hilltop Community Plan, providing updates on the goals originally created by the community. The involvement of Hilltop residents and stakeholders has been paramount to making progress towards those goals.
WHERE ARE WE NOW?
Over the past five years there has been a concerted effort to organize around the pillars of the Envision Hilltop Community Plan. Released in January 2020 after an 18-month planning process with significant input from residents and community stakeholders, the plan aimed for community groups and organizations to unify their work while building capacity and increasing collective impact through a newly formed strategic partnership or a dedicated organization. It also called for actively involving residents in the decision-making processes, ensuring their genuine and meaningful participation.
Implementing the recommendations of Envision Hilltop is a long-term effort. As Mayor Ginther noted, transforming the neighborhood will "take 10, 15, 20 years of sustained continued commitment" to overcome decades of disinvestment. As new opportunities and challenges unfold, it is also possible that some goals are adjusted to reflect the current conditions of the community. The ultimate goal of both the plan and progress report is to foster a thriving community where success is driven not just by physical improvements, but by the active involvement and growth of its people.
Images from the 2018 Envision Hilltop community planning engagements.
READING THE REPORT
This report presents a comprehensive overview of the Envision Hilltop Community Plan in three structured sections.
The opening section examines the plan's foundation and community engagement initiatives. It describes the multifaceted approach to building community connections through strategic partnerships with key stakeholders, neighborhood gatherings that facilitate direct resident interaction, and digital platforms that share essential information and updates. The section also documents neighborhood-based information stations and the ongoing advisory committee meetings that guide the plan's implementation process.
Section two provides an updated community assessment reflecting recent developments in the plan area. This includes current demographic analysis and refreshed housing and retail market evaluations that build upon the original plan's research. This updated profile establishes important context for evaluating the effectiveness and impact of existing initiatives.
The final section presents a thorough review of implementation progress. This evaluation is essential for measuring advancement toward plan objectives and identifying areas requiring additional focus. Collectively, these three sections deliver a detailed assessment of the accomplishments while highlighting potential areas for enhancement in future Envision Hilltop Community Plan efforts.
The Home subcommittee in partnership with the Ohio State University Community Health Worker Program conducts a neighborhood canvas.
Artwork from local muralists on display for residents to select who will paint a new mural at Hauntz Park.
ADVISORY COMMITTEE MEETINGS
The Envision Hilltop Advisory Committee is a group of residents and community stakeholders committed to the work identified in the Envision Hilltop Community Plan (2020). The committee first convened at the end of 2021, and has been meeting consistently ever since. In 2022, the Advisory Committee elected Glenwood United Methodist Church Pastor and Hilltop resident Kevin Orr to serve as its Committee Co-Chair.
Over the last two years, the team has met on a quarterly basis, with a focus on reviewing the ongoing implementation of the plan. As a part of this work, the Advisory Committee created three subcommittees around each of the pillars of the plan (People, Place, and Home). The three subcommittees on the following page are where committee members have focused the bulk of their time and energy.
October, 29th
December 10th
January 28th
February 25th March 25th May 20th July 29th September 27th
December 2nd
September 2024 Advisory Committee meeting.
Site visit of Mid-Ohio Farm on the Hilltop at the June 2024 Advisory Committee meeting.
Greenhouses at the Mid-Ohio Farm on the Hilltop.
March 17th
June 13th September 12th
December 8th
March 15th
June 13th
September 10th
December 6th
Inside look at one of the Mid-Ohio Farm greenhouses.
PEOPLE SUBCOMMITTEE
The People subcommittee is chaired by the Hilltop Library Community Support Leader Mike Alcock. The work of this subcommittee has been focused on supporting social service community partners in the neighborhood. Over the last year this team has filled a gap by creating a monthly space for community partners to meet and share around the work their organizations are doing. In addition to the community partner meeting, this group has provided strong advocacy for important community plan topics, such as education and youth programming.
PLACE SUBCOMMITTEE
The Place subcommittee is currently chaired by Hilltop RISE Executive Director and Hilltop resident Danny Peterson. This subcommittee has led and supported a number of placemaking projects, most notably the completion of the West Broad Street Unification Project. Built upon the idea that the Hilltop is a “neighborhood of neighborhoods”, this project was a collaborative effort between the Highland West and Westgate neighborhoods, and funded through the City of Columbus 614 Beautiful Program. A special thank you to former Hilltop RISE Executive Director and Hilltop resident Morgan DeBoth, who has also served as chair of the Place subcommittee.
HOME SUBCOMMITTEE
The Home subcommittee is chaired by Franklinton Development Association Community Engagement Director and Hilltop resident Ashley Montana. Ashley and the subcommittee have led a number of successful projects over the last couple years. Most visibly, they completed a HilltopUSA.org mural at the corner of Lechner and Sullivant Avenue. Additionally, this subcommittee has dedicated a great deal of their time toward neighborhood canvassing, providing residents with neighborhood resources and information around how to handle predatory home buyers. In 2024 alone, the group touched approximately 1,992 homes through 8 separate canvass events.
To learn more about the work of the Envision Hilltop Advisory Committee or to get involved with one the Subcommittees, please visit: https://www.envisionhilltop.com/advisory-committee.
United Way Success by Third Grade presentation at the September 2024 Advisory Committee meeting.
One of the murals from the West Broad Street Unification Project.
OUTREACH & ENGAGEMENT
POP UP EVENTS
The Hilltop has a number of neighborhood events throughout the year that serve to bring the community together. Bringing the plan to these events allows for the opportunity to engage community members with the work of the plan. These events include:
• Summer Jam West - 7/9/22, 7/8/23, 7/13/24
• South Central National Night (Day) Out - 8/13/22, 8/12/23
• Hilltop Bean Dinner - 6/24/23
• Celebrate Hilltop - 7/15/23
• West High School Back to School Bash - 8/19/23, 8/10/24
• Hilltonia Middle School Financial Literacy Health is Wealth Event - 2/6/24
RISE UP CBUS
This event is designed to elevate community pride and support Mayor Andrew J. Ginther’s Opportunity Rising initiative, which aims to ensure equitable growth and prosperity for all Columbus residents. Attendees can learn about various resources provided by the city and community partners, enjoy free food and music, and connect with neighbors. The initiative focuses on addressing systemic racism and creating equal opportunities in key areas such as safe housing, supportive jobs, clean air, and access to high-speed internet. By collaborating with partners and residents, Opportunity Rising seeks to dismantle racism and enhance economic stability, health, and safety in neighborhoods. Hilltop residents had the opportunity to join their Neighborhood Strategist at the Rise Up CBUS! at three opportunities: at Hilltonia Park (5/16/24), Hauntz Park (7/11/24), and Eakin Elementary (9/19/24).
ENVISION HILLTOP WEBSITE AND STORYMAP
EnvisionHilltop.org serves as an online hub for residents and stakeholders to continue engaging with the Envision Hilltop Community Plan. The website breaks up plan sections into their own webpages so users can easily find and scroll through the information most important to them. It also includes contact information for the Envision Hilltop Advisory Committee and subcommittees, as well as meeting information. The site’s navigation panel also includes links to HilltopUSA.org and the plan’s StoryMap.
The StoryMap offers an interactive tool for residents to explore information about the plan’s implementation and progress. This online platform includes periodic updates on the progress of community projects and infrastructure improvements. The map includes a brief overview of the plan, the plan’s impact over time, the city’s investments, and what’s changed in Hilltop.
COMMUNITY PROFILE
COMMUNITY CHANGES
POPULATION & DEMOGRAPHICS
For comparison purposes, this Community Profile utilizes the same datasets that were used in the original Envision Hilltop Community Plan (2020). For new datasets the Study Area1 was prioritized when possible.
Census data was collected based on the six census tracts within the Study Area boundary (shown on the map). Some data was collected by ZIP code, but this data is not accurately representative of the Hilltop Study Area due to the large area of zip codes. Despite this, some data is only available by ZIP code and must be displayed as such.
Conflicting boundaries and incongruous data-collection geographies present difficulties when comparing data. In this document, data sources and scopes are labeled to be explicit about the area(s) and time
periods represented. When comparing to previously collected data in the Envision Hilltop Community Plan, the same boundaries are used for consistency in analysis. Please see the map below2 for more information on the boundaries used for this study.
1Throughout the report the terms "Study Area" and "Plan Area" are used interchangably. These are both in reference to the Focus Area from the original Envision Hilltop Community Plan. See page 16 of the original plan for more context.
2 “Plan Focus Area & Other Relevant Geographies” page 17, Envision Hilltop Community Plan
Population Density per Square Mile1
by Census Tract (2023)
Census ACS (B01003)2
The Study Area has historically had more people per square mile than Columbus.
1Population density per square mile is the average number of people in a specific geographic location. It is calculated by dividing the total population in that location by the land area, in this case it is measured in square miles.
2See census.gov for more information
The population density table displays the total population of the Study Area and Columbus divided by their respective total square miles of land area. Hilltop consistently maintains a higher population density than Columbus, however, Columbus has experienced a more pronounced increase in population density over the past decade, slightly closing the gap between the two geographies’ densities.
Hilltop has a 7% higher proportion of cohabiting couple households than Columbus. Conversely, married-couple households make up only 45% of Hilltop households, compared to 54% for Columbus overall. The proportion of single-female householders is significantly higher than single-male householders for both areas.
Hilltop has a higher proportion of school-age children and 45 to 74 age ranges than Columbus. Meanwhile, Columbus has a larger share of residents in the 20 to 44 age range and a greater proportion of those aged 75 and older.
Family Households with Children
by Census Tract (2023)
Census ACS (DP02)1
Population
Pyramid by Study Area Boundary (2023)
Esri Business Analyst Age by Sex Profile
Hilltop is a community with more young children and less young adults than the City of Columbus.
There is a 26% higher instance of single-female householders than single-male householders in Hilltop. 1See census.gov for more information
New American Population
by Census Tract (2023)
Census ACS (B05006, B05012)1
Hilltop’s foreign born population is 9%.
New Americans from the Americas make up the largest portion of the New American population in the Hilltop, at 79%, in comparison to 26% of Columbus residents. In contrast, Columbus has a more diverse New American population, with higher proportions from Africa and Asia. The New American population in Hilltop has grown since 2017.
Americas
Hilltop: 78.9%
Columbus: 25.9%
Africa
Hilltop: 11.6%
Columbus: 35.2%
Central America
South America
Caribbean
Western Africa
Eastern Africa
Asia
Hilltop: 6.8%
Columbus: 32.9%
Europe
Hilltop: 2.7%
Columbus: 5.7%
South Eastern Asia
Western Europe
Eastern Europe
TOP 10 COUNTRIES OF ORIGIN FOR NEW AMERICANS IN HILLTOP
1See census.gov for more information
Unemployment in Hilltop increased from 6% in 2018 to 9% in 2023, with notable rises among residents both with and without high school educations. In contrast, Columbus experienced a slight decrease in unemployment and improvements among those without a high school education.
However, labor force participation (a measurement of those who are currently working or actively looking for work) in Hilltop rose significantly from 53% in 2018 to 65% in 2023. In contrast, Columbus maintained a stable labor force participation rate with slight improvements in employment and a lower, stable unemployment rate.
Unemployment Rate
by Census Tract (2023)
Census ACS (S2301)2
Black or African American alone
Labor Force Participation1
by Census Tract (2018-2023)
Census ACS (DP03)3
Labor force participation in the Hilltop rose by about 12 percentage points from 2018 to 2023.
High school graduate (includes equivalency)
Some college or associates degree
Bachelor’s degree or higher
1Labor force participation measures the percentage of adult Americans who have a job or don’t have a job but are actively seeking one. The unemployment rate measures the percentage of adult Americans in the labor force without a job, but actively searching for one. The Labor Force Participation Rate includes individuals who have a job, while the Unemployment Rate does not.
2 3See census.gov for more information
Population by Poverty Level1
by Census Tract (2023) Census ACS (S1701)2
Poverty remains a significant issue in Hilltop, with 30% of the population living below the poverty level. Despite reductions in poverty rates among families and families with children from 2018 to 2023, Hilltop still faces higher poverty rates compared to Columbus.
The poverty status of families decreased across the board from 2018 to 2023, but still remains higher compared to the City of Columbus.
Families3 by Poverty Status
by Census Tract (2018-2023)
Census ACS (S1702)4
1Poverty is measured by comparing a person’s or family’s income to a set poverty threshold or minimum amount of income needed to cover basic needs. People whose income falls under their certain thresholds are considered low income. The United States Census Bureau measures poverty by using both the Official Poverty Measure and the Supplemental Poverty Measure.
2 4See census.gov for more information.
3The census defines families as groups of at least two people that live in the same household, with one being the head of household, who are related by birth, marriage, or adoption. See census.gov for more information.
Household by Income
by Study Area Boundary (2024)
Esri Business Analyst Market Profile
Hilltop Columbus
<$24,999
$25,000 - $49,999
$50,000 - $74,999
$75,000 - $99,999
$100,000 - $149,999
$150,000+
29% of Hilltop’s households earn less than $24,999, compared to 17% of Columbus householders. Columbus has a larger share of households in higher income brackets, with 31% earning above $100,000 versus Hilltop’s 14%.
Median household incomes in Hilltop have increased, with Black households seeing a 83% rise, though net worth remains significantly lower than in Columbus. Hilltop residents have a median net worth of $23,457, far below Columbus’ $74,450. There has been a decrease in residents with net worths below $49,999 and a notable increase in higher net worth categories, particularly $250,000+, which saw a 97% rise from 2018 to 2024.
Over half of Hilltop households make less than $50,000.
Median Household Income
by Census Tract (2018-2023)
Census ACS (S1903, S2001, S2503)1
The median household income in the Study Area increased by 62% from 2018 to 2023.
Households by Net Worth1
While the number of households with net worth valued $50,000 or more grew between 2018 to 2024, 43% of Hilltop households have less than $15,000 in net worth.
Household Median Income, Net
Disposable Income
Median household net worths are 51% of household incomes in Hilltop, compared to 115% for the city. Median household disposable incomes are 83% of household incomes in Hilltop, compared to 84% for the city.
Hilltop has a higher proportion of blue-collar and service sector workers than Columbus, at 33% and 26%, respectively, while Columbus has a higher proportion of white-collar workers at 65%. Retail Trade and Other Services are key business sectors in Hilltop, whereas Health Care & Social Assistance and Professional, Scientific, and Tech Services dominate in employment.
Population by Job Type by Study Area Boundary (2024)
Esri Business Analyst Demographic Profile
Businesses, 2024
278
Esri Business Analyst Business Summary
Employees, 2024
4,363
Esri Business Analyst Business Summary
Top 5 Hilltop Industries
by Study Area Boundary (2024)
Esri Business Analyst Business Summary
By Total Businesses
By Total Employees
Hilltop Residents Employed in Central Ohio Zip Codes
Home Zip Code of Workers Employed in the Hilltop Plan Area by Study Area Boundary (2022)
Census OnTheMap2
From 2015 to 2022 there was a decline in employment for Hilltop residents across many Central Ohio ZIP codes. ZIP codes 43204 (Greater Hilltop), and 43207 (Obetz), experienced the most significant decreases. However, ZIP code 43125 (Groveport), saw a notable increase.
Despite overall employment challenges, the number of workers residing in Hilltop increased, particularly in ZIP codes 43232 and 43229, while ZIP code 43204 saw a decrease.
1 2See onthemap.ces.census.gov for more information
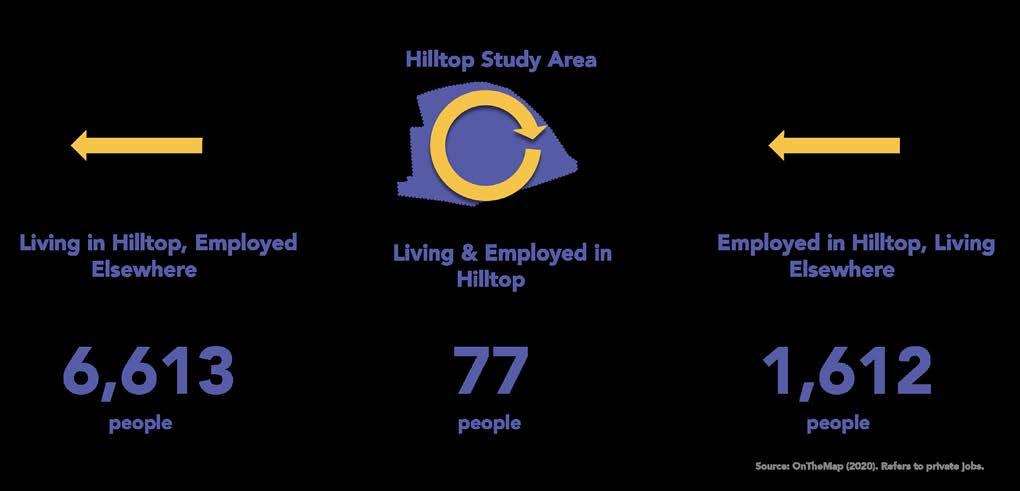
Most Hilltop labor force members live within the Study Area but work in an outside zip code. Study Area residents tend to work outside of the community, with only around 1% living and working within the Study Area. A significant proportion of those working outside Hilltop earn more than $3,333 per month, while those working within the area earn significantly less.
A majority of Hilltop workers that live outside of the Study Area earn more than $3,333. Regardless of whether the job is located within or outside of the Study Area, Hilltop residents are much less likely to earn above $3,333.
In-Area Labor Force Efficiency by Monthly Income
by Study Area Boundary (2022)
Census OnTheMap1
1See onthemap.ces.census.gov for more information
Employees/Residential Population Ratio, 2024 (per 100 residents)
Hilltop experienced a minor decline in homeownership and an increase in rental occupancy over recent years, with a reduction in vacant units from 2010 to 2024. Although both Hilltop and Columbus have less vacant buildings since 2010, around 5% more of the Study Area’s housing stock is vacant than Columbus.
While the number of owner-occupied units went up slightly from 2020 to 2024, the overall number of housing units went down by 31 units.
Housing Unit Occupancy
by Study Area Boundary (2024)
Esri Business Analyst Market Profile
Between 2018 and 2023, both the Hilltop and Columbus saw an increase of around 2 percentage points in homeowners with no mortgage payments. Hilltop owner-occupied households are also around 9% more likely to have no mortgage payment compared to Columbus homeowners.
Monthly Housing Costs by Tenure by Census Tract (2018-2023)
Census ACS (S2503)1
Housing by Mortgage Status
by Census Tract (2018-2023)
Census ACS (S2506, S2507)2
Households with 30% or More of Income Towards Housing Cost in the Past 12 Months
by
Census Tract (2018-2023)
Renters in the Hilltop and Columbus overall are much more likely to spend 30% or more of their income towards housing costs. In the Hilltop a higher percentage of both homeowners and renters spend 30% or more of their income on housing costs compared to Columbus.
In Hilltop, the number of renter households with a yearly income between $35,000-$49,999 spending 30% or more of their income towards housing went up by 52% from 2018 to 2023.
Mortgage Payment
Overall, residents in Hilltop pay less in mortgage or loan payments compared to those in Columbus, both in absolute terms and as a percentage of income. 1See
Hilltop is projected to experience a substantial decrease in owner-occupied homes valued under $99,999 by 2028, while homes valued over $100,000 will increase. Both Hilltop and Columbus have seen significant increases in households paying higher rents from 2016 to 2023, with Hilltop experiencing a notable decrease
Housing Units by Value and Projected Value
by Study Area Boundary (2024-2029)
Esri Business Analyst Market Profile
$500,000 to $749,999
$400,000 to $499,999
$300,000 to $399,999
$200,000 to $299,999
$100,000 to $199,999
$500,000 to $749,999
$400,000 to $499,999
$300,000
$200,000
in rental units priced $500 to $999 and a dramatic rise in those priced $1,000 to $1,499. Both 43204 and 43223 experience high volumes of code complaints per capita and have seen declines in evictions from 2019 to 2020, followed by increases in subsequent years.
Code Complaints per Capita by Zip Code
(2018-October 2024)
City of Columbus Code Violation Records
The projected housing value is calculated by Esri Business Analyst by taking into account the increasing mortgage rates and low housing supply.
Code Complaints by Type by
Top ZIP Codes for Housing
Housing Choice Voucher Recipients as a Percent of Renter Households by Zip Code (2024)
ZIP code 43223 is notable for its high proportion of renter households that receive Housing Choice Vouchers (HCV) at 10.5%, while 43204 has a lower proportion. Both rank high for tax-delinquent parcels and foreclosures, with 43204 having 83 foreclosures and 43223 having 55.
The census tracts making up the Study Area account for about 4% of all the Housing Choice Voucher recipients in Franklin County.
1See hud.gov for more information
Individuals Entering Emergency Shelters
Top
10 Zip Codes for Foreclosures
Zip
(2021 Q1-2024 Q3)
While the 43223 zip code is primarily Franklinton, it contains half of the Study Area - for a map of the Study Area see page 22.
Top 5 Zips for Foreclosures
(2021 Q1-2024 Q3)
Foreclosures spiked across Ohio in 2022 following the expiration of COVID-19 foreclosure moratoriums.
The two zip codes in the Study Area have the fourth and fifth most tax delinquent parcels in Franklin CountyZIP 43223 has 434 while ZIP 43204 has 503.
Evictions fell because of COVID related moratoriums, but are rebounding to pre-2020 levels.
Annual Residential Permit Totals
by Study Area Boundary (2024)
City of Columbus Department of Building and Zoning Services
There was a 226% increase in permit amounts from 2020 to 2023.
$18,000,000
$12,000,000
$6,000,000
$0
Despite a significant drop in permit amounts from 2019 to 2020 due to many factors including the COVID-19 pandemic, there has been a rebound. Permit totals rose to $9,822,239 by 2023, indicating renewed investment.
In terms of parcel ownership, residents that live in zip codes comprising the Study Area own significantly more parcels in the Study Area than anyone else. Suburbs of Columbus, like Grove City, Hilliard, Dublin, Powell, and Gahanna are also home to people who own 50 parcels or more in the Study Area.
by Study Area Boundary (2024)
Franklin County Auditor, USPS
Dayton, OH is the only city outside of Franklin County with 50 parcels or more owned in the Study Area.
by Study Area Boundary (2024)
City of Columbus Department of Building and Zoning Services
by Study Area Boundary (2024)
City of Columbus Department of Building and Zoning Services
Hilltop residents have a lower percentage of employer-based or direct-purchase health insurance at 30% compared to Columbus’ 53%. Conversely, 43% of Hilltop residents rely on Medicare or Medicaid, 18% more than Columbus at 25%. The percentage of residents without health insurance is much higher in Hilltop at almost 17% compared to 10% in Columbus.
Tract (2023) Census ACS (B27010)1
$2,956
$3,919
There has been a significant increase in the percentage of Hilltop households with earnings, rising from 70% in 2018 to 80% in 2023. Concurrently, there has been a notable decrease in households receiving Social Security, Supplemental Security Income, cash public assistance, and Food Stamp/SNAP benefits.
Households by Public Assistance Income
On average Hilltop residents spent $531 more on medical care than Columbus in 2024.
Hilltop Average Medical Care Spending, 2024
$2,103
Esri Business Analyst Health Care & Insurance Statistics
Columbus Average Medical Care Spending, 2024
$1,572
Esri Business Analyst Health Care & Insurance Statistics
1See census.gov for more information
CDC Social Vulnerability Index
by Census Tract (2022)
Centers for Disease Control and Prevention
The CDC’s Social Vulnerability Index looks at demographic and socioeconomic factors that negatively affect communities to determine their vulnerability to emergencies or disasters.
Franklin County Trees per Square Mile by Census Tract (2022)
Columbus Department of Recreation and Parks
Grocery Accessibility 1 mile
by Census Tract (2024)
Columbus Public Health identified Central Hilltop as a neighborhood with a food imbalance, meaning it is easier or more convenient to access less nutritious food.
Grocery Accessibility 0.5 mile
by Census Tract (2024)
Columbus Public Health
Ethnic Grocery Store
Hilltop Heat Map by Study Area Boundary (2022)
A lack of tree canopy and concentration of asphalt can lead to a higher temperature throughout the day.
Franklin County Infant Mortality per 1,000 Births
by Zip Code (2014-2023)
Ohio Department of Health Office of Vital Statistics
The median infant mortality rate for Franklin County between 2014 to 2023 was 7.5 per 1,000 births, with the rate for zip code 43223 at 8.4, and 43204 at 10.9.
Franklin County Low Birth Weight Births
by Zip Code (2018-2022)
Ohio Department of Health Office of Vital Statistics
Franklin County Mothers Smoking While Pregnant by
Zip Code (2018-2022)
Ohio Department of Health Office of Vital Statistics
Franklin County Teen Birth Rate per 1,000 Births by Zip Code (2018-2022)
Ohio Department of Health Office of Vital Statistics
Maternal smoking is associated with low birth weight, a risk for infant mortality.
Franklin County Preterm Birth Rate
by Zip Code (2022-2023)
Ohio Department of Health Office of Vital Statistics
Franklin County Sleep-Related Infant Death Rate
by Zip Code (2014-2023)
Ohio Department of Health Office of Vital Statistics
CelebrateOne defines “preterm birth” as before 37 weeks of pregnancy have been completed.
Crime Index1
by Study Area Boundary (2024)
Esri
Business Analyst Crime Summary
Hilltop faces higher crime rates across most categories compared to Columbus, including motor vehicle theft, assault, rape, personal crime, robbery, burglary, and murder. Columbus exhibits a lower overall crime index with fewer violent and property crimes.
In Hilltop, crime indexes for various categories, including motor vehicle theft, assault, rape, personal crime, robbery, burglary, and murder, are significantly higher than the total crime index. In Columbus, most indexes are also higher than its total crime index, besides the indexes for assault, personal crime, and larceny.
Franklin County Crime Index
by Zip Code (2023)
Esri Business Analyst Crime Summary
The Esri’s Crime Index provides a view of the relative risk of a specific type of crime, not a database of actual crimes.
1For more detailed definitions of violent crimes, property crimes, and other crimes, go to https://ucr.fbi.gov/crime-in-the-u.s/2011/crime-in-the-u.s.-2011/offense-definitions
Crime Indexes Greater than Hilltop Total Crime Index1
by Study Area Boundary (2024)
Esri Business Analyst Crime Summary
The crime rate in Hilltop’s ZIP codes 43204 and 43223 is 18% from 2018 to 2022, higher than some other areas like 43201 (Weinland Park), at 14% and 43206 (Near South) at 16%, but lower than the highest crime rate areas such as 43222 (Franklinton) at 34% and 43211 (Linden) at 29%.
Top Crime Rates by Zip Code
Violent Crimes
Top 10 Property Crimes
1Esri represents the likelihood of overall crime occurring for an area through its total crime index. This graphic compares specific crime type indexes for the Hilltop that are above the area’s total crime index. These indexes are also compared to the same index types for Columbus
Violent Crime Heat Map
by Study Area
Boundary (2018-October 2023)
Columbus Department of Public Safety
Both violent crime and property crime are concentrated along major roadways, near commercial properties.
Property Crime Heat Map
by Study Area
Boundary (2018-October 2023)
Columbus Department of Public Safety
High Crime
Traffic-related issues and requests for information/assistance are increasing in Hilltop, whereas domestic-related calls have declined. Domestic violence is the most prevalent violent crime in Hilltop, making up 19% of all violent crime reports, followed by aid and transport, assault, and gun-related incidents. Motor vehicle theft is the leading property crime in Hilltop, accounting for 16% of all property crime reports, with burglary and criminal damaging also significant.
Total Crime Heat Map
by Study Area Boundary (2018-October 2023)
Columbus Department of Public Safety
The Study Area is overseen by Police Precincts 8 & 19 and falls in Patrol Zone 3.
Columbus Department of Public Safety
Domestic violence and domestic disturbance calls both went down in ranking of top 911 calls from 2018 to 2022.
WEST BROAD ST
Between 2017 and 2024, educational attainment improved in both Hilltop and Columbus. In Hilltop, the percentage of residents without a high school diploma decreased from 28% to 22%, and those with a bachelor’s degree or higher increased from 7% to 14%. Despite these advancements, a higher percentage of Hilltop residents still remain in the lower educational attainment categories compared to Columbus.
Highest
Level of Educational Attainment
by Study Area Boundary (2017-2024)
Esri Business Analyst Demographic Profile
Columbus City Schools Metrics
Study Area Feeder Pattern Schools (2018-2024)
Ohio School Report Cards1
District Elementary Schools
District Middle Schools
1See reportcard.education.ohio.gov for more information
2Early literacy is made up of three measurements: proficiency in third grade reading, promotion to fourth grade, and improvements in K-3 literacy.
3Proficiency in third grade reading represents the percent of third graders that scored proficient on the reading segment of the state English language arts test.
District High Schools
HOUSING MARKET STUDIES
To assess the current conditions of the Envision Hilltop Community Plan Study Area, the Neighborhood Design Center engaged the consultant team Development Strategies to conduct housing and retail market studies.
Their main tasks included:
• Identifying trends and changes in the retail and housing markets since the Envision Hilltop Community Plan was finalized in 2020.
REGIONAL CONTEXT
Columbus Metropolitan Statistical Area (MSA)
• Updating demand projections for retail and housing in the Study Area.
• Auditing priorities and strategies outlined in the Envision Hilltop Community Plan based on the market analysis results.
This section summarizes their findings, which include illustrations from their detailed existing conditions presentation.
SOCIOECONOMIC & DEMOGRAPHIC TRENDS
In Development Strategies’ recent socioeconomic and demographic analysis, they’ve uncovered some compelling trends that highlight the evolution of the Columbus region over the last decade. The Columbus region grew substantially during the last decade, adding more than 300,000 new residents since 2010. This remarkable growth can be largely attributed to the rise of high-paying knowledge-sector jobs, which have become a magnet for talent.
Columbus is also seeing an influx of college graduates moving in from other parts of Ohio, further enriching our workforce and reassuring its reputation as a brain drain region. Additionally, the region has benefited from increased immigration, with foreign-born residents now making up about ten percent of Franklin County’s population. This diversity is a vital part of what makes this community vibrant and dynamic.
REGIONAL CONTEXT
Franklin County Migration Trends
Franklin County Immigration Trends
KEY THEMES
Stakeholder Interviews
Source: Esri (2023), Placer.ai (2023), STI (2023), ACS (2022), Franklin County Auditor (2023), Development Strategies
The Hilltop neighborhood has remained stable in the last decade, with a population of about 20,000 residents since 2010. This is important because of the population loss for several decades prior.
As Columbus attracts higherincome residents, we’re also seeing changes in Hilltop’s economic landscape. The median household income increased from $30,000 in 2018 to $41,000 by 2023. However, the share of households earning less than $25,000 annually declined only slightly, from 35% to 33%, suggesting that income growth has been uneven.
Overall, Hilltop’s population is becoming more educated. The share of residents that had not completed high school or equivalency declined by 6% from 2018 to 2023. The proportion of residents with Bachelor’s degrees rose from 7% to 15% from 2018 to 2023.
In 2018, 28% of residents had not completed high school compared to 22% of residents in 2023; simultaneously, the share of residents with Bachelor’s degrees or higher rose from 7% in 2018 to 15% in 2023
Following a decade-long trend, owner occupied occupancy declined further
While incomes rose only slightly, the median rent increased by 49%.
Retail inventory had steadily declined, leading nearly all retail categories undersupplied; as retail inventory remained stagnant through 2023, most retail continues to be undersupplied.
HOUSING MARKET STUDY
Introduction
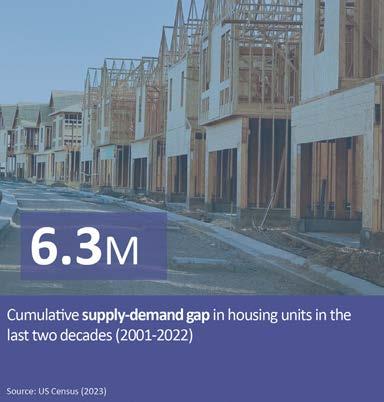
The consultant team examined the housing landscape in Columbus, with a specific focus on the Hilltop neighborhood, which has been significantly impacted by broader national and regional trends. Over the past two decades, rising construction costs and an insufficient housing supply have contributed to a critical inventory shortage, exacerbating affordability challenges for residents.
Despite Columbus experiencing substantial job growth, projected to add nearly 100,000 jobs by 2030, housing development has lagged behind, creating a disparity between job availability and suitable housing options. According to the City of Columbus, this region needs 1 (one) house for every 1 (one) job to accommodate growth, but currently, this ratio is 1 (one) house for every 2.5 (two and a half) jobs.
NATIONAL HOUSING CHALLENGES Impact of National Trends
Impact of Regional Trends
In Hilltop, where the majority of the housing stock consists of older single-family homes, the lack of new development has led to a precarious rental market, with rising costs pushing long-term residents towards displacement. This analysis not only highlights the urgent need for diverse and affordable housing options but also underscores the importance of strategic planning to address the community’s evolving needs amid ongoing economic growth.
Columbus Housing Context
Columbus’ housing landscape is grappling with significant challenges driven by rising construction costs and a growing demand for homes. As the job market expands rapidly, the pace of housing development has not kept up, leading to a widening gap between available units and the increasing workforce. This imbalance is further exacerbated by a disparity between rising housing costs and stagnant incomes, creating a pressing need for innovative housing solutions. Addressing these issues is essential for ensuring that all residents can find affordable housing in a thriving economic environment.
HILLTOP HOUSING MARKET IS BECOMING MORE EXPENSIVE Growth in Home Values
While home values in the Study Area are lower, they rose more quickly than the city overall — especially in the less affluent zip codes.
HILLTOP MULTI-FAMILY MARKET IS BECOMING MORE EXPENSIVE Rental and Vacancy Rates
The housing context has been shaped heavily by national and regional trends, including the following:
+ Nationally, construction costs rose substantially over the past two decades, with a 40% increase alone from 2012 to 2019. This trend has made it more difficult to develop housing of all types, especially affordable and moderately-priced homes.
+ Construction has failed to keep up with demand nationally, culminating in an inventory shortage of 6.3 million housing units between 2001 and 2022.
+ To address the supply gap, multi-family construction is ramping up and, in March 2023, reached 960,000 units under construction – a pace of development not seen since the 1970s.
+ Columbus’ job market is expanding rapidly, with nearly 100,000 jobs projected to be added in the Columbus/Central Ohio region by 2030.
+ Regionally, housing development has failed to keep up with growth; there were 2.5 jobs added in the Columbus MSA for every housing unit built between 2009 and 2019, whereas a ratio of 1.5 jobs per housing unit is considered sustainable.
+ Incomes have failed to keep up with housing costs: from 2000 to 2020, the median rent in Franklin County rose 84% while the median household income rose just 46%.
UNDERSTANDING
Hilltop Study Area Employment
CONTEXT: REGIONAL Job Proximity Index
This Census block group level index of neighborhood accessibility to jobs quantifies the accessibility of a residential neighborhood in relation to its distance to all job locations within the CBSA. The closer the Census block is to a larger employment center the darker it appears on the index, the better access to employment opportunities for residents in a neighborhood.
HOUSING CONDITIONS REMAIN A CHALLENGE
Residential Year Built
Hilltop Housing Context
Hilltop, a historic neighborhood just miles west of downtown, presents a complex housing landscape shaped by its historical context and recent market dynamics. Primarily consisting of singlefamily homes developed early to early to mid-20th century, the neighborhood has experienced significant demographic shifts and economic changes. This stagnation in housing development has resulted in a largely aging housing stock, with minimal new construction in recent years.
The community is predominantly rental-based, with many single-family homes converted for this purpose, reflecting a growing demand for affordable living options. Despite a broader economic resurgence in Columbus, Hilltop has seen limited investment in multi-family housing, underscoring the need for greater diversification in its housing supply. Rising home values and rents have led to concerns about displacement and housing instability among long-term residents. While the area shows signs of revitalization, persistent challenges, such as a lack of diverse housing options and issues related to property management, continue to impede its potential for sustainable growth.
HOUSING SUPPLY HAS NOT KEPT UP WITH DEMAND Regional Multi-Family Deliveries
Of the 31,135 units delivered in Columbus since 2010, only 106 units (0.3%) were delivered in Hilltop.
MANY RESIDENTS FACE HOUSING COST BURDEN
Property Values and Taxes
Between 2020 and 2023, assessed home values in Franklin County increased by 40% on average. Based on proposed 2023 values, in Hilltop, the average value nearly doubled.
New assessed values are based on recent sales data, which indicates that these increases occurred primarily within the last two years.
MANY RESIDENTS FACE HOUSING COST BURDEN Eviction Rates
In the past year, of the over 22,000 evictions filed citywide, around 7% (1,630) were renter households in the Study Area’s zip codes (43223 & 43204). This is greater than the citywide rate (5% of renter households).*
Analysis of Hilltop’s housing supply indicated key themes:
+ A historic residential area of the city, Hilltop, 48% developed in the 1920 and late-1940s to 50s; per Esri, 80% of the housing stock is single-family homes, compared to 56% in the city.
+ Hilltop’s population began declining in the 1980s as jobs were off-shored to emerging global economies, and urban sprawl pushed amenities and housing farther west and north; consequently, housing development stalled and, today, 77% of Hilltop’s single-family stock dates to before 1940.
+ The Study Area added just 94 single-family units since 2000, equivalent to about 1.5% of the total supply. Comparatively, about 19% of Columbus’ housing stock was built after 2000.
+ Hilltop is majority (59%) renter and the rental market is comprised primarily of single-family rentals.
+ Since 2010, Columbus has added upwards of 31,000 multi-family units, of which only 106 units were in Hilltop, some of which are contained in the multi-family development Wheatland Crossing, completed in 2020.
HOUSING CONDITIONS REMAIN A CHALLENGE
Supply Overview-Legacy of Redlining
HOUSING CONDITIONS
Condition Rating for Residential Parcels
79% of residential parcels in the Study Area have a building condition rating of Fair
+ Over three quarters (80%) of all multi-family units in the Study Area are Class C1 and the remaining are Class B, reflecting the lack of new multi-family development and the need to diversify housing options, including new construction.
+ Columbus’ economic and population growth over the last decade has generated new investment in the housing stock, including in Hilltop: the average home value grew from $63,000 in 2013 to $185,000 by 2023— roughly tripling—while home values citywide increased 160%.
HOUSING CONDITIONS
Hilltop Rental Market
Generally older
Modestly lower rental income
Sometimes professionally managed
Well-maintained
May have deferred maintenance
Typically 20+ years old
Generally in need of renovation
Significant deferred maintenance
Have the lowest rental rates
1 Multi-family properties are generally categorized into one of three classes based on their rent rates, age, design, amenities, and condition. Class A properties are typically the newest, highest-end, and most “in demand” properties that tend to have the highest rents and most competitive amenity package within the market. Class B properties are usually wellmaintained, comparatively dated, and still professionally managed, though frequently have incurred deferred maintenance and require upgrades, with rent rates considered moderate for the market. Finally, Class C properties are the oldest on the market, generally needing significant renovation and updating, lack all but basic amenities, are often not professionallymanaged, and have the lowest rent rates.
+ The city has seen a steady demand for renovated homes, driven by a growing population and a tight housing market. The average gross flipping profit in Columbus, including Hilltop, was around $75,000 this year, positioning the area as one of Ohio’s profitable spots for investment in housing. Proximity to amenities, improving infrastructure, and ongoing community revitalization efforts have also made Hilltop a strategic choice for house flippers.
+ Escalating prices are due in part to heightened home “flipping” activity–in South Hilltop, recent sales data shows homes being flipped and sold within a relatively short market time, some with properties selling for as much as $225,000, though substantial appreciation was seen even among homes that received no upgrades.
+ While 54% of the residential parcels in the Study Area are owned by Hilltop residents, a significant share (34%) is owned by Columbus-area residents, living outside of the Study Area but in the MSA’s more affluent suburbs.
+ Average rents increased 60% from 2017 to 2023, despite no new market-rate units delivered.
WORKERS AND RESIDENTS
Hilltop Study Area
+ As prices continue to rise, Hilltop’s long-
term residents are increasingly at risk of displacement; for instance, the neighborhood’s average assessed property value nearly doubled between 2020 ($60,000) and 2023 ($116,000).
+ Rent growth has increased the risk of eviction and resulting housing instability, as 7% of renter households in the Study Area, 43223 & 43204 zip codes, faced eviction filings in 2023.1
Overall, Hilltop’s housing market is experiencing substantial investment: its population is stable, and with a marketable housing stock, it is a potential destination for households looking for value within Columbus However, many of Hilltop’s long-term challenges persist, such as the limited diversity of housing options, poorlymanaged and -maintained properties, and structural barriers to accessing jobs, transportation, and amenities.
HOUSING AFFORDABILITY
Defining Affordability for Buyers: Median Home Value
HOUSING CONDITIONS
Supply Overview
Opportunities
1 Long-term COVID-19 programs, funded by the American Rescue Plan Act, have temporarily limited the number of successful evictions citywide since 2020, though the potential for rates to rise as these funds expire in coming years is of major concern among philanthropic, nonprofit, and institutional leadership in Hilltop and the city at large.
Defining Affordability for Renters
Housing Cost Burden Owners
Housing Cost Burden Renters
23% of owner households in the Study Area are housing cost burdened, paying over 30% of their income toward housing, similar to the citywide rate of 20%.
Over a third of renter households in the Study Area are severely cost burdened, paying over 50% of their income on rent, compared to 21% citywide.
The analysis of housing demand in Hilltop reveals significant and ongoing affordability challenges for residents. Many households struggle to find safe and decent rental options within their budget, highlighting a critical gap between income levels and housing costs. This situation is exacerbated by a limited supply of affordable housing, with a substantial number of residents facing cost burdens that strain their finances. The lack of diverse housing options restricts residents’ access to better employment opportunities.
10-YEAR DEMAND
Hilltop Neighborhood
DEDICATED AFFORDABLE UNITS
Affordable Housing Supply
There are 648 dedicated affordable units in the Study Area. That is 1.7% of the city’s supply
Furthermore, projections indicate a growing population in the region, underscoring the urgent need for additional housing units to accommodate future demand. Addressing these affordability issues is essential not only for attracting new residents but also for ensuring that long-term residents have viable options to remain in the community.
As Hilltop seeks to revitalize, a balanced approach that includes the preservation of existing affordable units and the development of new housing types will be crucial for creating a sustainable and inclusive neighborhood.
+ According to HUD, it costs $1,160 per month to rent a safe and decent twobedroom unit in the Columbus MSA, translating into a “housing wage” of $22.40/hour, or $45,700 per year without the household facing cost burden.1
+ More than half of renter households in Hilltop cannot afford the “safe and decent” rent of $1,160 without being cost burdened.
+ Forty percent of households in the Study Area cannot afford the median home value in Hilltop ($87,000) without being cost burdened,5 while two-thirds of the households in the city cannot afford the median home value in Columbus ($232,000); consequently, Hilltop residents face a lack of housing choices, particularly those closer to jobs or desired amenities.
+ Over one-third of renter households and about 7% of owner households in the Study Area are severely cost burdened, paying over 50% of income towards housing costs.
+ Approximately 4,300 households in the
1 A household is considered housing cost burdened if housing costs account for more than 30% of monthly income. “Severe” cost burden refers to households paying upward of 50% of income on housing costs.
OWNER AFFORDABILITY
Hilltop Study Area - For Sale Demand and Supply
Study Area qualify for affordable housing, but there are only 650 units (1.7% of the city’s supply) of dedicated affordable housing; hence, there is a need to improve the quality of existing units while preserving their affordability and increase the production of affordable units.
+ Improving Hilltop’s access to employment opportunities, encouraging local business growth, and strategic investments in enhancing access to daily needs services such as grocery, medical facilities, etc. will address the immediate needs and contribute to longterm sustainability and community well-being.
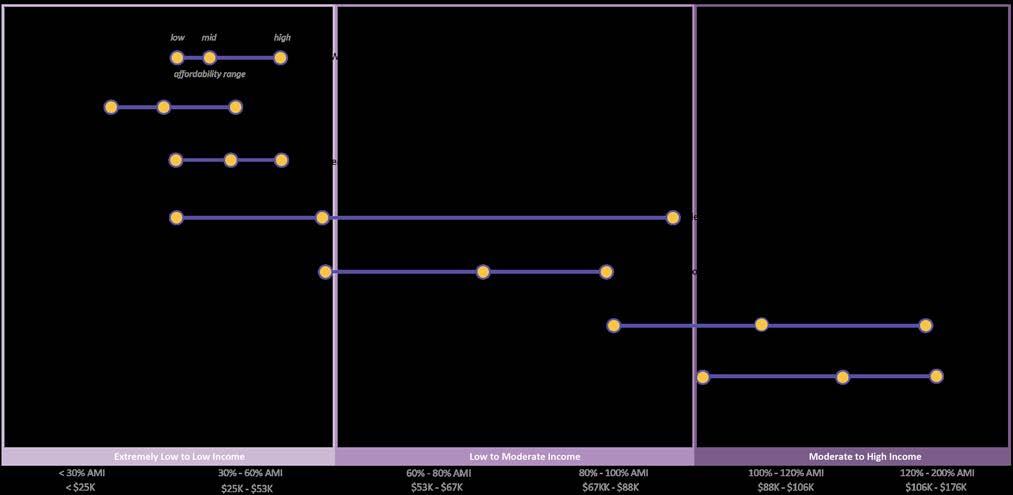
+ According to Esri data, comparing existing household affordability with the housing supply suggests that there are gaps at both ends of the household income spectrum:
• While there seems to be an oversupply of housing units that are affordable to households earning extremely low to very low incomes (less than 50% area median income [AMI] or $44,000), this does not account for the condition or desirability (number of bedrooms, suitability, accessibility, etc.) of these units.
• There is an undersupply of units affordable to households earning moderate to higher incomes (above 80% AMI, or $69,000); these households, while willing to pay higher housing costs, may be choosing to own or rent units that are priced lower due to unavailability of the right or desired product.
HOUSING AFFORDABILITY
Franklin County Long-Term Population Projections
By 2040 Franklin County will have nearly 1.6 million residents. To accommodate these new residents, annual permitting activity would have to double 2010-2021 activity
HOUSING AFFORDABILITY
Hilltop Neighborhood Long-Term Population Projections
By 2040 Franklin County will have nearly 350k more residents. If Hilltop captured 0.5% of that growth, there could be 1,750 residents added to the neighborhood. To accommodate these new residents, 600 to 800 housing units are needed. To accommodate these new residents, 600 to 800 housing units are needed.
• This analysis is indicative of the opportunity to capture some of the growth being experienced by the neighborhood and the city at large by bringing in new residents, while ensuring that long-term residents have enough housing options to choose from to stay in the neighborhood.
If the current regional growth trends continue, Franklin County is projected to have 1.6 million residents by 2040. Considering Hilltop’s current annual growth rate of 0.1% and factoring in for a population growth interval ranging from conservative to moderate, Hilltop will need approximately 645 housing units to meet demand over the next 10 years. This includes:
+ Nearly 50 units (20 for-sale and 30 rental) in current, or pent-up, demand that represents housing units needed to create a more balanced market today. This includes replacement housing for units in poor condition, as well as new units better suited to meeting household needs, such as units with more bedrooms.
+ Approximately 160 units of housing for older adults (60 to 90 affordable units, 130 to 180 traditional market-rate units, 40 to 55 downsizing units, 8 to 12 independent living units, and 15 to 20 assisted living units). It is important to expand options for older adults so they can stay in the neighborhood if they want to downsize or move out of their existing home.
+ 375 units of affordable housing for households earning less than 60% of AMI, or $52,800, (450 to 535 rental, 105 to 130 for-sale).
+ 200 units of moderately-priced housing for households earning 60% to 120% of AMI, or $52,800 to $105,600, (70 rental, 130 for-sale) and,
+ 70 units of market-rate housing for households earning above 120% AMI, or above $105,600 (10 to 30 rental, 45 to 100 for-sale).
+ While most of this demand will be met through new construction, there is enough vacancy to continue stabilizing the existing housing stock and infill development on vacant lots.
+ Preserving existing affordable housing options will continue to be an important element of meeting housing demand. The demand calculations include a shift in housing types to include more missing middle typologies over time.
DEMAND BY TYPOLOGY
A More Balanced Supply
A More Balanced Supply
A greater diversity of housing supply would allow for:
+ Existing residents to have more options
+ New Hilltop homeowners to enter without displacing current homeowners
+ Greater income diversity to support services and increase buying power in the neighborhood
+ Growth to be captured in a sustainable way
HILLTOP’S MULTI-FAMILY MARKET IS BECOMING MORE EXPENSIVE
Average Rents (Zillow)
Recently, housing costs have risen significantly, risking displacement for many households without more affordable options. Affordable and adequate housing development hasn’t kept pace with Hilltop’s needs, leading to ongoing challenges. Additionally, access to jobs with livable wages is crucial for improving housing stability for residents The housing analysis for the Hilltop Study Area highlights the key issues in the local market below.
+ Though affordable relative to the city, housing has become much more expensive in Hilltop.
+ Many households are struggling to keep up with the housing costs and are at risk of displacement if new, attainable options are not added to the neighborhood.
+ Limited housing supply, in price and type, limits Hilltop from capturing its fair share of regional growth.
+ Even with vacancy reducing, housing conditions remain a challenge and are an important element to address to improve housing stability.
Since 2017 average rents have increased by 43% for Columbus and 60% for zip code 43204.
+ Hilltop’s limited growth is a barrier to new housing development.
+ There is upward mobility within the Hilltop workforce, with growth in median household incomes as well as increase in share of residents earning higher wages1. Enhancing access to well-paying jobs will be a key part of improving house opportunities.
1 On the Map data shows that since 2018, there has been an increase of 5 percent in the share of resident workers earning more than $40,000.
RETAIL MARKET STUDY
RETAIL ENVIRONMENT National Context
RETAIL MARKET
STUDY
The consultant team assessed the market conditions of the Hilltop Study Area to understand not just the current market conditions of the area, but also how they have changed over time and are projected to change into the future. This analysis was also supplemented by a comparison to Columbus to illustrate the unique conditions that are present in the neighborhood. Additionally, the challenging cycle of the retail environment was identified,
along with potential points of intervention to provide the basis for a market strategy.
What is market analysis?
+ Market analysis seeks to determine a realistic program for future retail development by analyzing existing and projected demographic trends, physical conditions, and market performance.
+ Retail markets—even at the most local level—are shaped by (inter)national trends, including emergent technologies, consumer preferences, and economic and political environments.
+ Brick-and-mortar retail continues to be challenged by the rise of e-commerce and lingering economic impacts of the COVID-19 pandemic.
The Hilltop Study Area is near minor shopping centers, but is a 25 to 30-minute drive away from major shopping and population centers like Easton Town Center and Polaris. Residents must either drive or take substantial bus commutes to these employment centers. Downtown Columbus is closer, about a 10-minute drive from the Study Area.
The Primary Market Area (PMA) of Hilltop represents 40% of market demand for retail. PMA conditions are necessary to understand to address potential market changes in the Hilltop area. For example, if the PMA is already oversupplied in one type of business, then that business may not be able to thrive in Hilltop, compared to one that is underrepresented in the PMA.
RETAIL SUPPLY
Regional Primary Market Area
RETAIL ENVIRONMENT
Study Area Context
The PMA has 7.9M SF of commercial space, of which 2.6M SF is in use as “true” occupied retail space.
The retail supply Study Area is undersupplied based on current household retail trends.
+ Today, Hilltop has a total retail inventory of 570,000 S.F., while its residents can support approximately 700,000 S.F. based on household retail spending patterns.
In contrast, retail in the PMA is heavily oversupplied: there are three million square feet of retail in the PMA and residents can only support 1.7 million square feet.
Household incomes and retail spending vary across the PMA, though household spending on “essential goods” like groceries is more consistent across geographies and represent relatively stable markets.
The Study Area contains a sufficient number of residents to support a neighborhood retail center that serves daily needs. Yet, according to data from Placer.ai, Hilltop residents travel outside of the Study Area to fulfill daily needs because those goods in services are not available in the neighborhood. This results in retail leakage.
RETAIL DEMAND
Regional Primary Market Area
RETAIL DEMAND
Retail Purchasing Power
RETAIL DEMAND
Retail Demand by Product Type
Daily needs are products that are commonly purchased daily, and ideally should be 1.5 miles or less from resident homes. Common needs are products that are purchased less frequently, less than daily but more than once a month. Ideally these retail stores should be 5 miles or less from resident homes. Occasional needs are purchased on occasion, once a month or less. These should be 10 miles or less from resident homes. Retail in the Hilltop study area totals about 1.3M SF, but it does not take into account online spending. In the Study Area, online shopping accounts for about 30% of total retail spending.
RETAIL DEMAND
Demand and Supply by Product Type: Hilltop Study Area
Consistent with these findings, all goods besides automotive fuels are deeply undersupplied in the Study Area, while most essentials, including groceries and personal care items, are oversupplied in the PMA.
Gasoline is the only oversupplied good in Hilltop, which suggests that the vast majority of Hilltop residents’ day to day and occasional retail spending is captured outside of the community
RETAIL DEMAND
Demand and Supply by Product Type: Hilltop PMA
RETAIL DEMAND
Essential Retail-Frequented Pharmacies
RETAIL DEMAND
RETAIL DEMAND
Essential Retail-Frequented Grocery Stores
Essential Retail-Frequented Big-Box Stores
Thus, the Study Area is challenged by the oversupply of retail in the PMA: retailers located outside of the Study Area, but in the PMA, compete with local retailers. As a result, prospective tenants, like a grocer, may be more reluctant to locate in the Study Area. This market study can help show that there is demand in the Study Area that certain retailers can meet.
Despite these market pressures, there is opportunity to develop neighborhood and community retail that can provide currently undersupplied goods and services. Attracting these needed retailers in what appears to be an already-oversaturated PMA will serve as the basis of market strategies for the neighborhood.
Share of Hilltop residents that visited within the past 12 months
Share of Hilltop residents that visited within the past 12 months
Share of Hilltop residents that visited within the past 12 months
Supply trends and associated challenges reflect Hilltop’s historical position in Columbus:
+ Hilltop emerged as an early inner-ring suburb of Columbus in the early 1900s, which correspond with peaks in commercial and housing development.
+ Hilltop’s retail stock was designed for the shopper of the early- to mid-20th century: development typologies in the community were designed to be small in scale, patronized daily, in service of local residents, and accessible via walking.
Retail Supply and Demand Conclusions
Categories of Retail
+ Post-war construction of the interstate system and mass adoption of personal vehicles allowed for the development of large-scale retail centers in newly-built outer-ring suburbs; these new centers captured much of the market support for neighborhood retailers, while inner-ring suburbs like Hilltop began seeing residents relocate to outer-ring communities.
+ The neighborhood also adapted to car dependence, with thoroughfares like Broad Street reconfigured to accommodate and principally serve daily auto traffic, contributing to “stroad”1 conditions that detract from the area’s marketability.
Food & beverage stores account for 42% of retailers, but account only for 2% of occupied retail space in Hilltop.
RETAIL SUPPLY
Age of Inventory
Inventory
Since 2010, Hilltop has lost around 20k SF of retail space, contributing to an overall decline in vacancy.
With roughly 30% of properties aged 100 years or older, coupled with relatively high rates of absentee ownership, Hilltop’s retail stock is vulnerable to incurring deferred maintenance and declining and condition.
1 The term “stroad” was coined in 2013 by the organization, Strong Towns, to refer to “what happens when a street (a place where people interact with businesses and residences, and where wealth is produced) gets combined with a road (a high-speed route between productive places).” Strong Towns (2018). “What’s a STROAD and Why Does It Matter?” https://www.strongtowns.org/journal/2018/3/1/whats-a-stroad- and-why-does-it-matter
Data from years with the greatest leasing activity are the most accurate, as they are based on the largest sample sizes.
+ Because of Hilltop’s development history, nearly one-third of Hilltop’s retail properties are more than 100 years old and just 4% of properties were built after 2000. While a handful of Hilltop’s historic properties have been well-maintained, many have incurred deferred maintenance and require substantial investment to be brought back online.
These data points indicate that Hilltop’s retail rents are, on average, $2 PSF lower than citywide rents.
+ The Study Area has lost around 20,000 square feet of retail space since 2010.
+ Due to the limited availability of highquality and/or newer space, recent market activity is highly limited; consequently, data on market rent rates is limited, though general trends suggest that Hilltop’s average retail rent is, on average, about
$2 per square foot lower than the citywide average ($16 per square foot).
+ In both the PMA and Study Area, the majority of the leasable inventory is available at less than $12 per square foot, which is insufficient to fund the repairs that would be needed to restore Hilltop’s commercial stock without incentives, grants,
or other capital programs.
+ Additionally, this analysis indicates that comparatively newer space in shopping centers in the PMA is inexpensive and benefits from proximity to the interstate, posing a major challenge to attracting tenants to the Study Area.
+ While Hilltop’s historic commercial stock presents challenges, it is also one of the area’s greatest assets: its typology as dense, ground-floor storefront retail provides a strong basis upon which walkable retail corridors can be developed. Therefore, investment in restoring Hilltop’s storefronts is crucial to revitalizing the retail environment.
Hilltop’s retail environment can be thought of as stuck in a challenging cycle: population support (i.e., buying power) for retail declined as employment opportunities diminished, leading to a loss of support for businesses and retail. As support declines, these businesses close and, consequently, access to essential services and goods is reduced. With poor access to retail, residents relocate, restarting the cycle once again. The current retail environment can be understood as a product of decades of this cycle, but identifying the challenge, along with points of intervention, provides the basis for market strategy.
Supporting businesses is one proposed
RETAIL ENVIRONMENT
Commercial Corridor Analysis
TOWARD A STRATEGY
Commercial Corridor Strategies
TOWARD A
Corridor Strategies
TOWARD A STRATEGY
Inner-Ring Suburb Retail Revitalization
intervention for Hilltop’s market strategy. Improving the retail environment by employing strategies and best practices from Columbus inner-ring suburbs that have successfully revitalized their retail corridors (Grandview Avenue in Grandview Heights, Main Street in Bexley, Lane Avenue in Upper Arlington, and High Street in Clintonville).
+ Planning strategies include recruiting participation from an anchor institution, concentrating retail to a high-density, pedestrian-focused corridor no more than three blocks long, and positioning parking lots and B-street uses on side streets.
+ A shared tenanting strategy across all four examples is achieving a mix of chain retailers that benefit from brand recognition and local businesses that can capitalize on their foot traffic.
+ Financing strategies, among others, can include implementing economic incentives, investing in mixed-use districts and new housing to create built-in demand, and carrying out marketing campaigns.
+ Compared to these communities, Hilltop’s retail environment is challenged by low resident incomes and limited population growth, evidencing the need for co-acting strategies to increase residents’ incomes and add population.
In alignment with the best practices noted on the previous page, building upon existing assets on major commercial corridors—Broad Street and Sullivant Avenue— is key to attracting essential retailers to the community, respectively.
+ Broad Street is the entryway into Columbus from the west and is used heavily by regional commuters and local residents alike.
+ The corridor’s assets include its historic building stock, cluster of small businesses, recent investment in placemaking, and accessibility to employment centers.
+ Broad Street is well-positioned to add both niche and communityserving retailers within rehabbed historic storefronts and newlyconstructed, dense mixed-use buildings. This is, in part, because of high traffic volumes and the forthcoming LinkUS transit initiative.
RETAIL ENVIRONMENT
Broad Street: Opportunities and Challenges
RETAIL ENVIRONMENT
Broad Street: Assets
TOWARD A STRATEGY
Corridor Strategies: Broad Street
TOWARD A STRATEGY
Corridor Strategies: Broad Street
The corridor strategy for Broad Street includes positioning the corridor as a community destination, focusing on infill small-scale multi-family housing, and developing niche retail opportunities.
There is about 3 acres of space that could be used for infill housing, providing an additional 120 units to the area. In addition, Broad Street has 11,500 sq ft available for retail.
TOWARD A STRATEGY
Commercial Corridor Analysis: Broad Street
The graphic above illustrates the retail establishments already operating within a mile of the Broad Street corridor. Combining this information with income and demographic data of residents in the same radius can help identify specific niche retail opportunities for the area.
Strong competition from larger retail centers westward on Broad Street diminishes the corridor’s marketability. “Visitors” typically pass through, and approximately 15% travel to or from outside retailers. Nevertheless, Broad Street is strategically positioned to accommodate additional neighborhood-oriented businesses, such as restaurants, pharmacies, and specialty retail shops.
+ Sullivant Avenue is a pedestrian-friendly corridor that has a limited retail supply, characterized primarily by local restaurants and bars and a handful of discount and convenience retailers.
+ The corridor is primarily frequented by local residents, commuters, and patrons from destinations westward, like the Hollywood Casino.
+ Sullivant Avenue’s retail environment will benefit most from concentrating retail at a catalyst site near a major intersection, with visitation augmented by recruiting a larger chain retailer, and marketing a unique identity for the corridor based on existing local dining.
RETAIL ENVIRONMENT
Sullivant Avenue: Opportunities and Challenges
RETAIL ENVIRONMENT
Sullivant Avenue: Assets
TOWARD A STRATEGY
Corridor Strategies: Sullivant Avenue
Sullivant Avenue provides an existing retail culture with its bars and restaurants. This corridor’s strategy includes building on this by adding a community-serving anchor and small-scale chain infill retail to increase retail activity. There is also opportunity for small-scale housing development, and adding community amenities like pocket parks. The local dining and service culture can be enhanced by adding free shared parking on side streets and investing in new retail and dining spaces.
TOWARD A STRATEGY
Commercial Corridor Analysis: Sullivant Avenue
The graphic above illustrates the retail opportunities offered within a mile of the Sullivant Avenue corridor. A community-serving retail anchor can be narrowed down by using that information along with income and demographic information of residents within a mile of the corridor. There is opportunity for development of restaurants and specialty food and drink, which could be supported via a marketing campaign for the corridor.
Retail growth and diversification require a strategy that builds upon multiple tiers of demand, such as from nearby workers, visitors, and residents.
+ The most effective method for growing retail demand is by adding housing.
+ Over the next decade, if Hilltop added 500 new units, capturing three percent of projected city growth, the neighborhood could support an additional 30,000 square feet of retail, which is enough demand to support a catalyst project.
Overall, the creation of a walkable, mixed-use district combining historic storefronts with contemporary infill housing offers a relatively future-proof strategy for strengthening the retail ecosystem—yet, this strategy will only succeed if it is paired with investment in housing, jobs, people, and place.
IMPLEMENTATION
IMPLEMENTATION TABLES
The Envision Hilltop Community Plan has three pillars: People, Place, and Home. Under each pillar, there are three topic areas of goals and action steps. The topic areas are based on the guiding principles that were developed with residents.
Reading the Implementation Tables
Goals
Each topic area has three goals that were developed in tandem with residents through the Envision Hilltop planning process. Unlike the specific action steps listed under each goal, the goal itself is more broad.
Action Steps
Unlike goals, action steps are specific items that should be completed in order to work toward accomplishing the goal. They are more discrete, tangible, and manageable than the goal.
Approach
The approaches categorize the recommended strategies for each goal. Some goals can be easily described as a physical project, a program idea, or a policy suggestion. Others are integrated, requiring a multi-pronged approach.
The timeline outlines the expected duration, either short-term or long-term, for implementing each actionable item. This will help set realistic goals and assist in managing resources effectively. Short-term goals should be initiated by 2025, and long term should be initiated by 2030.
Outcomes
Outcomes help measure the success of the goal. They answer the question, “How will we know when this goal has been accomplished?”
Progress Scale Key
None
An action step where no progress toward the goal has been made, and no partners have been identified. May require increased focus from the City and/or community.
Started
An action step where work has been started but little progress has been made.
Progress measures the advancement of each action step. This provides a snapshot of what has been achieved and what remains to be done. The key defines how progress is measured.
Partial
An action step where some progress has been made and there is some level of community partnership (where possible).
Strong
An action step where strong progress has been made and there is a strong level of community partnership (where possible)
Completed
An action step that has been completed.
The Envision Hilltop Community Plan focuses on three pillars that guide implementation. Each pillar has three topic areas. These were developed alongside community members.
PEOPLE
Health & Recreation
Every person deserves unrestricted access to high-quality physical, mental, and emotional wellness, including addiction treatment, primary care, and recreational activities.
Education & Schools
All children will be prepared for living wage jobs in diverse opportunities by integrating workforce development with academic and vocational experience.
Employment & Incom e
Opportunities and assistance for living- wage employment will be accessible, achievable, retainable, and include the ability for career progress.
PLACE
Business & Economy
The Hilltop will support and sustain a variety of businesses to create a foundation of amenities and economic activity for existing residents and visitors. Mobility
Hilltop infrastructure will embrace a multi-modal transportation network that is responsive to the needs of the community today and in the future.
Safety & Crime
The Hilltop will be a safe, secure, and inviting community for residents.
HOME
Housing Quality
Housing in the neighborhood will be safe inside and out, and properties will be well-maintained.
Mixed-Income Housing & Affordability
The Hilltop will be home for a range of income levels, while staying true to its diverse heritage.
Homeownership
People will be encouraged and empowered to buy homes for neighborhood stability and community pride.
Topic Area #1: Health & Recreation
Guiding Principle
Every person deserves unrestricted access to high-quality physical, mental, and emotional wellness, including addiction treatment, primary care, and recreational activities.
Resident Priorities
1. Drug addiction and trafficking
2. Mental health
3. Financial wellness
4. Infant mortality
5. Primary care
Statement of Need
With lower life expectancy, higher rates of chronic disease, and a substantial number of households more than a 10-minute walk from a park, the Hilltop focus area requires interventions to improve resident quality of life. These should include physical improvements to the built environment as well as policy and program steps that will lead to a healthier population, both physically and emotionally.
Progress by the Numbers
The 2020 Envision Hilltop Community Plan identified three goals with 9 Action Steps. The information below illustrates the progress made to date.
Scale
Glenwood Community Center & Pool
In 2023, the City of Columbus Recreation & Parks Department opened a new pool facility at the Glenwood Community Center on West Broad Street. These updates include a 6-lane pool, diving pool, activity pool, wading pool, plunge pool, waterslides, and two diving boards. The facility also received a new bathhouse with men’s and women’s locker rooms, and a family changing and vending deck. The facility was designed by Williams Architects/Aquatics.
Opening day at the new Glenwood Community Center pool.
Children playing at the new Glenwood Community Center pool.
Health & Recreation:
Topic Area #2: Education & Schools
Guiding Principle
All pre-K to high school aged children will be prepared for living wage jobs in diverse opportunities by integrating workforce development with academic and vocational experience
Resident Priorities
1. Parent engagement
2. High school graduation
3. Vocational training
4. Kindergarten readiness
5. Divided school boundaries
Statement of Need
Residents of the Hilltop focus area have lower rates of educational attainment than the Franklin County average—and socioeconomic barriers contribute to this high figure. Strategies should help lower these barriers by offering stabilizing wraparound services, increasing the rate of Hilltop children in high-quality childcare, and improving K-12 educational completion.
Progress by the Numbers
The 2020 Envision Hilltop Community Plan identified three goals with 10 Action Steps. The information below illustrates the progress made to date.
Student Success Stores provide free, anonymous stores inside schools filled with hygiene products, easy-to-eat food items, school-code clothing, and school supplies. Since 2023, the City of Columbus Department of Neighborhoods has provided grant support for product restock and staffing for stores at Hilltonia and Wedgewood Middle Schools, in addition to Highland Elementary and Hilltop Library in the summer. In the 2023–2024 school year, 195 students were served with 378 shopping visits distributing approximately $10k in supplies, hygiene products, and more.
West High School’s cafeteria received improvements with a focus on socialemotional learning.
Children playing at the Highland Youth Garden.
A Student Success Store.
Student Success Stores
Education & Schools:
Topic Area #3: Employment & Income
Guiding Principle
Opportunities and assistance for living-wage employment will be accessible, achievable, retainable, and include the ability for career progress.
Resident Priorities
1. Living-wage jobs and training
2. Transportation
3. “Soft-skills” development
4. Wealth-building programs
5. Shared equity businesses
Statement of Need
In the Hilltop focus area, a high rate of adults are not in the labor force and unemployment is higher than the county average. Connecting people to living wage employment requires early preparation and targeted efforts that align training with future jobs. Objectives include focusing on vocational training, working toward higher wages, and including workers in the shared prosperity of businesses.
FDA Financial LifeSkills Program
Progress by the Numbers
The 2020 Envision Hilltop Community Plan identified three goals with 9 Action Steps. The information below illustrates the progress made to date.
The Franklinton Development Association’s Financial LifeSkills Program teaches Franklinton and Hilltop residents about personal finances and housing. It is broken up into six, 2-hour classes with topics such as loan & debt management, banks & credit, and more. The program helps connect participants with resources related to class topics and a financial incentive to complete the program. Through grant support from the City of Columbus Department of Neighborhoods, 43 individuals from the Envision Hilltop Community Plan area graduated from this program in 2024.
Graduates of the FDA program.
FDA Financial LifeSkills program participants.
Financial LifeSkills program participants.
Employment & Income:
PLACE
Topic Area #4: Business & Economy
Guiding Principle
The Hilltop will support and sustain a variety of businesses to create a foundation of amenities and economic activity for existing residents and visitors.
Resident Priorities
1. Trash and litter
2. Local businesses
3. Weak market conditions
4. Streetscape
5. Customer access
Statement of Need
The historic hilltop business district retains a sense of place, indicating a past when establishments thrived. Attention should be given to revitalizing this district, with consideration to supporting fledgling businesses and employing residents. Inviting customers into the district to visit and shop will require substantial investment and coordination to overcome obstacles of stigma and physical access.
Hilltop RISE
Progress by the Numbers
The 2020 Envision Hilltop Community Plan identified three goals with 10 Action Steps. The information below illustrates the progress made to date.
Scale Action in progress: 10 of 10
Formed in 2022, Hilltop RISE is a private, economic community development corporation (CDC), committed to mindful economic growth and development on The Hilltop. Over the last few years, Hilltop RISE has led a Litter CleanUp Campaign, successfully supported multiple 614 Beautiful projects, and assisted Hilltop businesses with applying for façade and building improvements. In 2025 Hilltop RISE, in partnership with Columbus Next Generation, assisted with the acquisition of the historic Hilltop Bank Block property; located on West Broad Street.
Betty Jaynes, Chair of Hilltop RISE, at the announcement of the CDC.
President John F. Kennedy rides past the Hilltop Bank Block on his 1960 campaign.
Hilltop RISE celebration of the new Executive Director, Danny Peterson, and former Executive Director, Morgan DeBoth.
Business & Economy:
PLACE
Topic Area #5: Mobility
Guiding Principle
Hilltop infrastructure will embrace a multi-modal transportation network that is responsive to the needs of the community today and in the future.
Resident Priorities
1. Resident engagement/socialization
2. Access for elderly and disabled
3. Infrastructure for walking or biking
4. Bus routes and shelters
5. Recreational amenities
Statement of Need
Broad Street, a thoroughfare that privileges passing cars over residents, dominates mobility in the Hilltop focus area. Strategies to improve mobility focus on safety and dignity for non-motorists, as well as improved transportation to employment centers outside the focus area. With a significant number of households lacking vehicle access, transportation choice is a high priority.
Progress by the Numbers
The 2020 Envision Hilltop Community Plan identified three goals with 9 Action Steps. The information below illustrates the progress made to date.
Actions in progress: 9 of 9
An almost two-mile corridor along Sullivant Avenue between I-70 and Hague Avenue received both artistic and infrastructure improvements as part of the Sullivant Bright Public Art and Parklet Project. The $10M improvements include sidewalk replacement, adding pedestrian refuge islands, bus shelters, and extending curbs up to bus stops. Artistic improvements include decorative lighting under I-70 and a mural celebrating the corridor.
Decorative lighting under I-70.
A sidewalk infrastructure improvement on Wicklow Road.
Bike lane infrastructure on Claredon Avenue near Palmetto Street.
Sullivant Avenue Roadway Improvements
PLACE
Topic Area #6: Safety & Crime
Guiding Principle
The Hilltop will be a safe, secure, and inviting community for residents.
Progress by the Numbers
The 2020 Envision Hilltop Community Plan identified three goals with 9 Action Steps. The information below illustrates the progress made to date.
Resident Priorities
1. Violent crime
2. Surveillance and responsiveness
3. Proactive policing
4. Speeding vehicles
5. Inadequate sidewalks
Statement of Need
Violent crime is one of the most distressing issues plaguing the Hilltop focus area. Violence is traumatic for residents and casts a long shadow over the neighborhood throughout Central Ohio. Combating gun violence, domestic abuse, drug trafficking, and other criminal activity is an immense challenge. Strategies should focus on investing in people and working to prevent demand for illicit activities.
Sullivant Avenue Police Substation
A new Columbus Division of Police substation for Precinct 19 is planned for four acres of land on Sullivant Avenue, between Townsend and Columbian Avenues. The property is located at 1860 Sullivant Avenue on land being rezoned from rural to a commercial planned development district. Plans for the new substation include a two-story, 13,500 square-foot building where offices and other spaces for Precinct 19 will reside. Outside will include a public plaza with benches, plantings, and a drinking fountain.
Actions in progress: 9 of 9
A rendering of the new Sullivant Avenue police substation.
Hilltop RISE partners with Cleaner Columbus on their litter clean-up campaign
Safety & Crime:
Topic Area #7: Housing Quality
Guiding Principle
Housing in the neighborhood will be safe inside and out, and properties will be well-maintained.
Resident Priorities
1. Home repair, maintenance, curb appeal
2. Infrastructure: fix flooding issues, more trees, streetlights
3. Aging in place
4. Encourage compatible new construction/remodel
5. Leverage rental registry
Statement of Need
The condition of housing is critical, from fostering community pride to ensuring public health. Increasing housing quality will require building relationships with landlords, enforcing and strengthening tenant rights, and encouraging improvements. Though aging housing stock may present challenges, investing in the diversity of residential architectural styles will play a vital role in neighborhood stabilization.
Progress by the Numbers
The 2020 Envision Hilltop Community Plan identified three goals with 8 Action Steps. The information below illustrates the progress made to date.
Actions in progress: 8 of 8
Nationwide Children’s Hospital’s Healthy
Neighborhoods Healthy Homes initiative received $500,000 from the City of Columbus’ Department of Neighborhoods to support home repair work in the Hilltop neighborhood, starting in 2025. The grant will target around 15 projects, with projects costing an average of $30,000. Repairs range from roof repair, siding, exterior painting, installing handrails, and more.
The Healthy Neighborhoods Healthy Homes logo.
Hilltop Home Repair Program
Columbus City Council hosts a Housing4All meeting and resource fair at Hilltop Library
Caption
Housing Quality
Explore
Topic Area #8: Mixed-Income Housing & Affordability
Guiding Principle
The Hilltop will be home for a range of income levels, while staying true to its diverse heritage.
Resident Priorities
1. Diverse portfolio of affordable housing
2. Rehabilitate historic housing
3. Prevent displacement
4. Create smaller districts
5. More housing density
Statement of Need
Despite the Hilltop’s relative affordability in the Central Ohio market, many households are still burdened by monthly housing costs. Strategies to ensure affordability include efforts to build mixedincome community, increase development activity, and plan for longterm affordability. Particular attention should be given to stabilizing senior citizens.
Crossing apartments.
Progress by the Numbers
The 2020 Envision Hilltop Community Plan identified three goals with 9 Action Steps. The information below illustrates the progress made to date.
Actions in progress: 8 of 9
Wheatland Crossing II
Wheatland Crossing II is an intergenerational housing development that includes a gazebo, fitness center, community gardens, and more. It offers 1 and 2-bedroom apartments and 2 and 3-bedroom townhomes. This development is part of the Low-Income Housing Tax Credit program, developed to provide an opportunity for residents to access existing amenities, public transit, and job opportunities at the adjacent State of Ohio office complex.
Zone In Columbus identifies the Sullivant Avenue and W Broad Street corridors as mixed-use districts to allow for more mixed-income housing.
Development Strategies presents the Hilltop Housing & Retail Market Studies.
Wheatland
Mixed-Income Housing & Affordability:
HOME
Topic Area #9: Homeownership
Guiding Principle
People will be encouraged and empowered to buy homes for neighborhood stability and community pride.
Resident Priorities
1. Create attractions/amenities to draw new homeowners
2. Tax abatements for home improvement
3. Incentivize redevelopment for homeownership
4. Increase owner-occupied tax credit
5. First-time buyer assistance
Statement of Need
In 1960, nearly 70% of homes in the Hilltop focus area were owneroccupied. Today, that figure is just under 40%. Strategies to increase homeownership will prepare people financially, build pride, and add amenities to attract potential homebuyers. Additionally, shared-equity homeownership presents a unique opportunity for lower-income homebuyers to build wealth.
Progress by the Numbers
The 2020 Envision Hilltop Community Plan identified three goals with 10 Action Steps. The information below illustrates the progress made to date.
Actions in progress: 9 of 10
The Central Ohio Community Land Trust (COCLT) is a nonprofit subsidiary of the Central Ohio Community Improvement Corporation. Founded in 2018, they work with developers to provide residential, new construction homes on Land Bank property in areas with high housing costs. There are currently five homes being built in the Hilltop on Oakley Avenue. These will be listed for $199,000 each, and include 3 bedrooms and 2.5 baths.
A Central Ohio Community Land Trust home.
Central Ohio Community Land Trust Homes
Homeownership:
Mid-Ohio Farm on the Hilltop
Project Investment: $10.3M ($4.5M from the City of Columbus)
Project Timeline: 2018-2024
This seven-acre urban farm offers fresh produce and educational programming to the Hilltop. This programming seeks to empower individuals to be more educated consumers, teach neighbors how to grow their own healthy food, and support workforce development for aspiring urban agriculture professionals.
Specific programming currently implemented or being developed includes the following:
• Youth and family programming
• A mentorship program for recent high school graduates and/or early career urban farmers
• A focus on supporting agricultural science education for K-12 schools through external partnerships and teacher workshops
• Adult programming supporting local urban growers
• Controlled Environment System workforce development training
• Future summer program offerings themed around food production, environmental stewardship, and food science
• Hands-on learning and volunteering opportunities
Source: Mid-Ohio Farm on the Hilltop
Hilltop Early Learning Center
Project Investment: $22M
Project Timeline: 2020-2022
The Hilltop Early Learning Center serves as a one-stop-shop for family services in the Hilltop community. The 50,000-squarefoot center also houses a 3,000-square-foot healthcare clinic and the center services are free to households at or below 300 percent of the poverty line.
Services include:
• Pre-K programming
• On-site healthcare
• Food security resources, including a food pantry
• Family counseling
APPENDIX
CONSULTANT PLAN AUDIT
Following is the Development Strategies audit of the priorities and strategies outlined in the Envision Hilltop Community Plan based on the housing market analysis results as of 2024. Goals were assessed based on the progress made by entities involved in achieving these goals. Plan goals with no established partners or programs were determined to have made no progress, while goals with established city level programs or quantifiable improvements have made strong progress.