2023 Q4
•
Quad Cities Latah • Whitman • Nez Perce
Asotin Market Report

2 Quad Cities Quarterly Market Report | Q4 2023 CONTENTS Q4 2023 Market REPORT 4 LATAH COUNTY MARKET DATA 10 WHITMAN COUNTY MARKET DATA 16 NEZ PERCE COUNTY MARKET DATA 22 ASOTIN COUNTY MARKET DATA
Today’s Real Estate Market in the Quad Cities Region
Q4–2023 Market Summary
2023 is now in the books and a slow market has continued through it. Multiple factors contributed to a softening market including high interest rates, limited inventory, and recession fears.
In the Latah County, closed transactions were down 14.0% from this same last year, with new listings also decreased by 29.4% compared to Q4 2022. In this same time frame, the median sales price increased only slightly by 3.8% to $403,000 while average sales price increased 8.3% to $435,880.
The Whitman County market was once again showed the biggest increase in the amount of new listings in comparison to Q4 2022, with 150 properties listed in the quarter. This was an increase of 59.5% from last year, and a 2.0% increase from last quarter. Home sale prices have shown a slight increasing trend over the past year, rising 16.3% from Q4 2022 to a median home sale price of $375,000.
The Nez Perce County market – as with all of the other markets – realized a considerable rise in current active listings in relation to the previous year, increasing by 177.3%, with 61 properties active at thime this report was pulled. The median home sale price increased 8.2% from the previous year to $356,950. The median days on market decreased to 23 days, compared to 29 days in previous year.
The market west of the state line in Asotin County market saw the most notable drop in new listings, decreasing by 36.8% from last year with just 36 listings to go live, where it was 57 at the same time a year ago. Closed transactions also plunged by 30.4% from the previous year, with 39 homes sold in Q4 2023
There has been an increase in activity towards the end of 2023, coupled with an upswing in buyer inquiries. We are continuing to keep a close eye on interest rates along with inventory levels as we head through the fall selling season.
Jason Brown Designated Broker / Regional Manager
3 Quad Cities Quarterly Market Report | Q4 2023
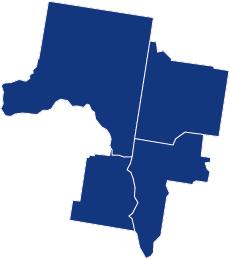
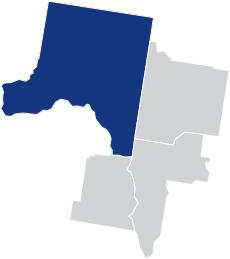
Latah County

What’s in the Latah County Data?
In Quarter 4 2023, Latah County median home prices were up 3.8% compared to last year and down 5.2% compared to last quarter, selling for a median price of $403,000. There were 49 homes sold in Q4 2023 this year, down from 57 at this same time last year.
On median, homes in Latah County sell after 53 days on the market, up 140.9% from this same time last year. There were 36 new listings to go live last quarter and there are a total of 38 active listings at the time of this report.
4 Quad Cities Quarterly Market Report | Q4 2023 - Latah County
Q4 2023 Market data
Latah County
5 Quad Cities Quarterly Market Report | Q4 2023 - Latah County
Down 5.2% prior quarter Up 430.0% prior quarter Up 3.8% prior year Up 140.9% prior year Down 39.5% prior quarter Down 14.0% prior year Median Sales Price Closed Sales Median Days on Market $403,000 49 53 At a Glance Snapshot overview Latah County Q4 2023 (Current) 49 $435,880 36 $403,000 53 38 81 $441,789 81 $425,000 10 51 57 $402,551 51 $419,000 22 15 -39.5% -1.3% -55.6% -5.2% +430.0% -25.5% -14.0% +8.3% -29.4% +3.8% +140.9% +153.3% Closed Sales Average Sales Price New Listings Median Sales Price Median DOM Active Listings Q3 2023 (Last Quarter) Q4 2022 (Last Year) % Change (Last Quarter) % Change (Last Year) Information pulled on 01/08/2024. The information in this report section for Latah County is compiled from a report given by the Intermountain MLS and to the best of our knowledge is accurate and current.
Closed Sales
As of 01/08/2024. By quarter dating from Q1 2018 to Q4 2023. Closed Sales is the number of properties sold.
Closed Sales By Price Range
As of 01/08/2024. Year-over-year comparison for Q4 2023 and Q4 2022.
6 Quad Cities Quarterly Market Report | Q4 2023 - Latah County
Closed Sales By Price Range is the number and percentage of properties sold in different price ranges. 8.8% 8.8% 10.5% 15.8% 36.8% 19.3% 2.0% 8.2% 8.2% 28.6% 20.4% 32.7% 0 3 6 9 12 15 18 21 $0-200K $200K-$250K $250K-300K $300K-$400K $400K-$500K $500K+ Q4 2022 Q4 2023 59 116 98 71 51 130 120 96 51 109 118 95 66 88 120 80 42 101 107 57 37 85 81 49 25 50 75 100 125 150 Q1-18 Q2-18 Q3-18 Q4-18 Q1-19 Q2-19 Q3-19 Q4-19 Q1-20 Q2-20 Q3-20 Q4-20 Q1-21 Q2-21 Q3-21 Q4-21 Q1-22 Q2-22 Q3-22 Q4-22 Q1-23 Q2-23 Q3-23 Q4-23
Average and Median Sales Price
As of 01/08/2024. By quarter dating from Q1 2018 to Q4 2023.
Median Sales Price is the mid-point (median) value where the price for half of the closed sales is higher and half is lower.
Average Sales Price is the sum of the sold dollar volume divided by the number of units sold.
Median Days on Market
As of 01/08/2024. By quarter dating from Q1 2018 to Q4 2023. Days on Market is the median number of days between when a property is listed and the contract date. $200 $225 $250 $275 $300 $325 $350 $375 $400 $425 $450
7 Quad Cities Quarterly Market Report | Q4 2023 - Latah County
Q1-18 Q2-18 Q3-18 Q4-18 Q1-19 Q2-19 Q3-19 Q4-19 Q1-20 Q2-20 Q3-20 Q4-20 Q1-21 Q2-21 Q3-21 Q4-21 Q1-22 Q2-22 Q3-22 Q4-22 Q1-23 Q2-23 Q3-23 Q4-23 Average Median 0 3 6 9 12 15 18 21 24 27 30 33 36 39 42 45 48 51 54 Q1-18 Q2-18 Q3-18 Q4-18 Q1-19 Q2-19 Q3-19 Q4-19 Q1-20 Q2-20 Q3-20 Q4-20 Q1-21 Q2-21 Q3-21 Q4-21 Q1-22 Q2-22 Q3-22 Q4-22 Q1-23 Q2-23 Q3-23 Q4-23
New Listings
As of 01/08/2024. By quarter dating from Q1 2018 to Q4 2023. New Listings is the number of properties listed regardless of current status.
Sale-to-List Price Ratio
As of 01/08/2024. By quarter dating from Q1 2018 to Q4 2023. Sale-to-List Price
8 Quad Cities Quarterly Market Report | Q4 2023 - Latah County
Ratio
divided
price
104 150 118 39 119 154 123 62 100 106 102 79 78 126 96 42 80 144 94 49 71 105 81 36 25 50 75 100 125 150 175 Q1-18 Q2-18 Q3-18 Q4-18 Q1-19 Q2-19 Q3-19 Q4-19 Q1-20 Q2-20 Q3-20 Q4-20 Q1-21 Q2-21 Q3-21 Q4-21 Q1-22 Q2-22 Q3-22 Q4-22 Q1-23 Q2-23 Q3-23 Q4-23 97.4% 99.0% 98.2% 99.2% 99.3% 99.5% 99.2% 99.2% 98.1% 99.4% 99.8% 99.3% 99.8% 102.3% 100.2% 99.7% 101.6% 102.9% 100.1% 98.3% 98.6% 100.2% 99.0% 97.2% 97.0% 97.5% 98.0% 98.5% 99.0% 99.5% 100.0% 100.5% 101.0% 101.5% 102.0% 102.5% 103.0% Q1-18 Q2-18 Q3-18 Q4-18 Q1-19 Q2-19 Q3-19 Q4-19 Q1-20 Q2-20 Q3-20 Q4-20 Q1-21 Q2-21 Q3-21 Q4-21 Q1-22 Q2-22 Q3-22 Q4-22 Q1-23 Q2-23 Q3-23 Q4-23
is the average of sales price
by the final list
expressed as a percentage.
Supply and Demand
As of 01/08/2024. Year-over-year comparison of Closed Sales and Active Inventory for Q4 2023 and Q4 2022.
Mortgage Rates
9 Quad Cities Quarterly Market Report | Q4 2023 - Latah County
Price Range Closed Sales Active Inventory Q4 2023 Q4 2023 Q4 2022 Q4 2022 % Change % Change 1 10 4 4 16 14 49 2 8 0 0 11 12 33 5 21 6 5 11 9 57 0 3 1 2 2 7 15 -280.0% -52.4% -33.3% -20.0% +45.5% +55.6% -14.0% + +166.7%+450.0% +71.4% +120.0% $0-$199,999 $250,000-$299,999 $400,000-$499,999 $200,000-$249,999 $300,000-$399,999 $500,000+ Totals
Quarterly 30-year fixed mortgage rates dating from January 2018 to the week ending Thursday, January 4, 2024. 4.40%4.52% 4.71% 4.51% 4.08% 3.75%3.65%3.72% 3.33% 3.07% 2.88% 2.67% 3.18%2.98%3.01%3.11% 4.67% 5.70% 6.70% 6.48% 6.32% 6.81% 7.49% 6.62% 2.50% 3.25% 4.00% 4.75% 5.50% 6.25% 7.00% 7.75% Q1-18 Q2-18 Q3-18 Q4-18 Q1-19 Q2-19 Q3-19 Q4-19 Q1-20 Q2-20 Q3-20 Q4-20 Q1-21 Q2-21 Q3-21 Q4-21 Q1-22 Q2-22 Q3-22 Q4-22 Q1-23 Q2-23 Q3-23 Q4-23
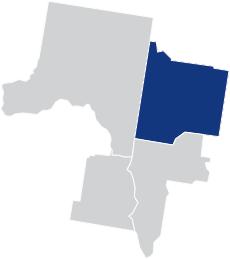
Whitman County
What’s in the Whitman County Data?
In Quarter 4 2023, Whitman County median home prices were up 16.3% compared to last year and up 1.4% compared to last quarter, selling for a median price of $375,000. There were 83 homes sold in Q4 2023 this year, down from 84 at this same time last year.
On median, homes in Whitman County sell after 30 days on the market, up 15.4% from this same time last year. There were 150 new listings to go live last quarter and there are a total of 72 active listings at the time of this report.
10 Quad Cities Quarterly Market Report | Q4 2023 - Whitman County
Q4 2023 Market data
Whitman County
11 Quad Cities Quarterly Market Report | Q4 2023 - Whitman County
Up 1.4% prior quarter Up 114.3% prior quarter Up 16.3% prior year Up 15.4% prior year Down 6.7% prior quarter Down 1.2% prior year Median Sales Price Closed Sales Median Days on Market $375,000 83 30 At a Glance Snapshot overview Whitman County Q4 2023 (Current) 83 $357,763 150 $375,000 30 72 89 $370,224 147 $370,000 14 88 84 $322,722 94 $322,500 26 18 -6.7% -3.4% +2.0% +1.4% +114.3% -18.2% -1.2% +10.9% +59.6% +16.3% +15.4% +300.0% Closed Sales Average Sales Price New Listings Median Sales Price Median DOM Active Listings Q3 2023 (Last Quarter) Q4 2022 (Last Year) % Change (Last Quarter) % Change (Last Year) Information pulled on 01/08/2024. The information in this report section for Whitman County is compiled from a report given by the Pacific Regional MLS and to the best of our knowledge is accurate and current.
Closed Sales
As of 01/08/2024. By quarter dating from Q1 2018 to Q4 2023. Closed Sales is the number of properties sold.
Closed Sales By Price Range
As of 01/08/2024. Year-over-year comparison for Q4 2023 and Q4 2022.
12 Quad Cities Quarterly Market Report | Q4 2023 - Whitman County
Range
27.4% 11.9% 8.3% 19.0% 19.0% 14.3% 26.5% 4.8% 12.0% 14.5% 16.9% 25.3% 0 2 4 6 8 10 12 14 16 18 20 22 24 26 $0-200K $200K-$250K $250K-300K $300K-$400K $400K-$500K $500K+ Q4 2022 Q4 2023 79 179 112 69 56 146 123 86 73 121 115 118 68 160 146 81 73 135 126 74 62 115 89 83 25 50 75 100 125 150 175 200 Q1-18 Q2-18 Q3-18 Q4-18 Q1-19 Q2-19 Q3-19 Q4-19 Q1-20 Q2-20 Q3-20 Q4-20 Q1-21 Q2-21 Q3-21 Q4-21 Q1-22 Q2-22 Q3-22 Q4-22 Q1-23 Q2-23 Q3-23 Q4-23
Closed Sales By Price
is the number and percentage of properties sold in different price ranges.
Average and Median Sales Price
As of 01/08/2024. By quarter dating from Q1 2018 to Q4 2023.
Median Sales Price is the mid-point (median) value where the price for half of the closed sales is higher and half is lower.
Average Sales Price is the sum of the sold dollar volume divided by the number of units sold.
Median Days on Market
As of 01/08/2024. By quarter dating from Q1 2018 to Q4 2023. Days on Market is the median number of days between when a property is listed and the contract date. $225 $250 $275 $300 $325 $350 $375 $400 $425 $450
13 Quad Cities Quarterly Market Report | Q4 2023 - Whitman County
Q1-18 Q2-18 Q3-18 Q4-18 Q1-19 Q2-19 Q3-19 Q4-19 Q1-20 Q2-20 Q3-20 Q4-20 Q1-21 Q2-21 Q3-21 Q4-21 Q1-22 Q2-22 Q3-22 Q4-22 Q1-23 Q2-23 Q3-23 Q4-23 Average Median 0 5 10 15 20 25 30 35 40 Q1-18 Q2-18 Q3-18 Q4-18 Q1-19 Q2-19 Q3-19 Q4-19 Q1-20 Q2-20 Q3-20 Q4-20 Q1-21 Q2-21 Q3-21 Q4-21 Q1-22 Q2-22 Q3-22 Q4-22 Q1-23 Q2-23 Q3-23 Q4-23
New Listings
As of 01/08/2024. By quarter dating from Q1 2018 to Q4 2023. New Listings is the number of properties listed regardless of current status.
Sale-to-List Price Ratio
As of 01/08/2024. By quarter dating from Q1 2018 to Q4 2023. Sale-to-List Price
14 Quad Cities Quarterly Market Report | Q4 2023 - Whitman County
Ratio is the average
divided by the final list price expressed as
percentage. 185 155 104 61 138 193 119 69 160 125 128 80 144 173 114 62 121 181 120 71 95 172 147 150 50 75 100 125 150 175 200 Q1-18 Q2-18 Q3-18 Q4-18 Q1-19 Q2-19 Q3-19 Q4-19 Q1-20 Q2-20 Q3-20 Q4-20 Q1-21 Q2-21 Q3-21 Q4-21 Q1-22 Q2-22 Q3-22 Q4-22 Q1-23 Q2-23 Q3-23 Q4-23 98.2% 98.3% 97.6% 97.6% 98.0% 98.8% 98.4% 97.3% 98.6% 98.3% 98.8% 98.3% 98.8% 99.7% 99.3% 99.1% 99.4% 101.4% 99.0% 97.1% 98.7% 98.5% 97.6% 95.6% 95.5% 96.0% 96.5% 97.0% 97.5% 98.0% 98.5% 99.0% 99.5% 100.0% 100.5% 101.0% 101.5% Q1-18 Q2-18 Q3-18 Q4-18 Q1-19 Q2-19 Q3-19 Q4-19 Q1-20 Q2-20 Q3-20 Q4-20 Q1-21 Q2-21 Q3-21 Q4-21 Q1-22 Q2-22 Q3-22 Q4-22 Q1-23 Q2-23 Q3-23 Q4-23
of sales price
a
Supply and Demand
As of 01/08/2024. Year-over-year comparison of Closed Sales and Active Inventory for Q4 2023 and Q4 2022.
Mortgage Rates
15 Quad Cities Quarterly Market Report | Q4 2023 - Whitman County
Price Range Closed Sales Active Inventory Q4 2023 Q4 2023 Q4 2022 Q4 2022 % Change % Change 22 14 10 4 21 12 83 7 21 3 1 25 15 72 23 16 7 10 12 16 84 1 4 1 1 7 4 18 -4.3% -12.5% +42.9% -60.0% +75.0% -25.0% -1.2% +600.0% +425.0% +200% =0.0% +257.1% +275.0% +300.0% $0-$199,999 $250,000-$299,999 $400,000-$499,999 $200,000-$249,999 $300,000-$399,999 $500,000+ Totals
Quarterly 30-year fixed mortgage rates dating from January 2018 to the week ending Thursday, January 4, 2024. 4.40%4.52% 4.71% 4.51% 4.08% 3.75%3.65%3.72% 3.33% 3.07% 2.88% 2.67% 3.18%2.98%3.01%3.11% 4.67% 5.70% 6.70% 6.48% 6.32% 6.81% 7.49% 6.62% 2.50% 3.25% 4.00% 4.75% 5.50% 6.25% 7.00% 7.75% Q1-18 Q2-18 Q3-18 Q4-18 Q1-19 Q2-19 Q3-19 Q4-19 Q1-20 Q2-20 Q3-20 Q4-20 Q1-21 Q2-21 Q3-21 Q4-21 Q1-22 Q2-22 Q3-22 Q4-22 Q1-23 Q2-23 Q3-23 Q4-23
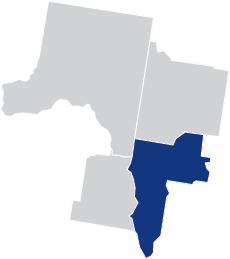
Nez Perce County

What’s in the Nez Perce County Data?
In Quarter 4 2023, Nez Perce County median home prices were up 8.2% compared to last year and up 8.2% compared to last quarter, selling for a median price of $356,950. There were 90 homes sold in Q4 2023 this year, up from 75 at this same time last year.
On median, homes in Nez Perce County sell after 23 days on the market, down 20.7% from this same time last year. There were 86 new listings to go live last quarter and there are a total of 61 active listings at the time of this report.
16 Quad Cities Quarterly Market Report | Q4 2023 - Nez Perce County
17 Quad Cities Quarterly Market Report | Q4 2023 - Nez Perce County
Q4 2023 Market data
At a Glance Snapshot overview Nez Perce County Q4 2023 (Current) 90 $371,001 86 $356,950 23 61 109 $356,779 128 $330,000 15 82 75 $363,473 79 $330,000 29 22 -17.4% +4.0% -32.8% +8.2% +53.3% -25.6% +20.0% +2.1% +8.9% +8.2% -20.7% +177.3% Closed Sales Average Sales Price New Listings Median Sales Price Median DOM Active Listings Q3 2023 (Last Quarter) Q4 2022 (Last Year) % Change (Last Quarter) % Change (Last Year) Information pulled on 01/08/2024. The information in this report section for Nez Perce County is compiled from a report given by the Intermountail MLS and to the best of our knowledge is accurate and current. Up 8.2% prior quarter Up 53.3% prior quarter Up 8.2% prior year Down 20.7% prior year Down 17.4% prior quarter Up 20.0% prior year Median Sales Price Closed Sales Median Days on Market $356,950 90 23
Nez Perce County
Closed Sales
As of 01/08/2024. By quarter dating from Q1 2018 to Q4 2023. Closed Sales is the number of properties sold.
Closed Sales By Price Range
As of 01/08/2024. Year-over-year comparison for Q4 2023 and Q4 2022.
18 Quad Cities Quarterly Market Report | Q4 2023 - Nez Perce County
Closed Sales By Price Range is the number and percentage of properties sold in different
ranges. 2.7% 8.0% 29.3% 34.7% 13.3% 12.0% 4.4% 8.9% 15.6% 37.8% 16.7% 16.7% 0 5 10 15 20 25 30 35 $0-200K $200K-$250K $250K-300K $300K-$400K $400K-$500K $500K+ Q4 2022 Q4 2023 121 162 154 124 82 120 152 120 115 123 172 133 108 128 133 162 114 128 116 75 78 132 109 90 50 75 100 125 150 175 Q1-18 Q2-18 Q3-18 Q4-18 Q1-19 Q2-19 Q3-19 Q4-19 Q1-20 Q2-20 Q3-20 Q4-20 Q1-21 Q2-21 Q3-21 Q4-21 Q1-22 Q2-22 Q3-22 Q4-22 Q1-23 Q2-23 Q3-23 Q4-23
price
Average and Median Sales Price
As of 01/08/2024. By quarter dating from Q1 2018 to Q4 2023.
Median Sales Price is the mid-point (median) value where the price for half of the closed sales is higher and half is lower.
Average Sales Price is the sum of the sold dollar volume divided by the number of units sold.
Median Days on Market
As of 01/08/2024. By quarter dating from Q1 2018 to Q4 2023. Days on Market is the median number of days between when a property is listed and the contract date. $200 $225 $250 $275 $300 $325 $350 $375 $400
19 Quad Cities Quarterly Market Report | Q4 2023 - Nez Perce County
Q1-18 Q2-18 Q3-18 Q4-18 Q1-19 Q2-19 Q3-19 Q4-19 Q1-20 Q2-20 Q3-20 Q4-20 Q1-21 Q2-21 Q3-21 Q4-21 Q1-22 Q2-22 Q3-22 Q4-22 Q1-23 Q2-23 Q3-23 Q4-23 Average Median 0 10 20 30 40 50 60 70 80 Q1-18 Q2-18 Q3-18 Q4-18 Q1-19 Q2-19 Q3-19 Q4-19 Q1-20 Q2-20 Q3-20 Q4-20 Q1-21 Q2-21 Q3-21 Q4-21 Q1-22 Q2-22 Q3-22 Q4-22 Q1-23 Q2-23 Q3-23 Q4-23
New Listings
As of 01/08/2024. By quarter dating from Q1 2018 to Q4 2023. New Listings is the number of properties listed regardless of current status.
Sale-to-List Price Ratio
As of 01/08/2024. By quarter dating from Q1 2018 to Q4 2023. Sale-to-List Price
20 Quad Cities Quarterly Market Report | Q4 2023 - Nez Perce County
divided
final
price expressed as
percentage. 132 200 169 93 108 197 152 113 134 164 153 111 128 154 183 116 137 159 140 79 128 159 128 86 50 75 100 125 150 175 200 Q1-18 Q2-18 Q3-18 Q4-18 Q1-19 Q2-19 Q3-19 Q4-19 Q1-20 Q2-20 Q3-20 Q4-20 Q1-21 Q2-21 Q3-21 Q4-21 Q1-22 Q2-22 Q3-22 Q4-22 Q1-23 Q2-23 Q3-23 Q4-23 98.8% 99.1% 99.2% 98.8% 98.4% 98.8% 98.7% 98.2% 98.0% 99.3% 99.8% 100.0%100.0% 101.7% 100.3% 100.0% 99.9% 100.4% 99.5% 97.3% 97.7% 98.8% 98.0% 97.8% 97.0% 97.5% 98.0% 98.5% 99.0% 99.5% 100.0% 100.5% 101.0% 101.5% 102.0% Q1-18 Q2-18 Q3-18 Q4-18 Q1-19 Q2-19 Q3-19 Q4-19 Q1-20 Q2-20 Q3-20 Q4-20 Q1-21 Q2-21 Q3-21 Q4-21 Q1-22 Q2-22 Q3-22 Q4-22 Q1-23 Q2-23 Q3-23 Q4-23
Ratio is the average of sales price
by the
list
a
Supply and Demand
As of 01/08/2024. Year-over-year comparison of Closed Sales and Active Inventory for Q4 2023 and Q4 2022.
21 Quad Cities Quarterly Market Report | Q4 2023 - Nez Perce County
Price Range Closed Sales Active Inventory Q4 2023 Q4 2023 Q4 2022 Q4 2022 % Change % Change 4 15 14 8 15 34 90 2 12 5 2 14 22 57 2 10 22 6 9 26 75 3 5 5 1 2 6 22 +100.0% +50.0% -36.4% +33.3% +66.7% +30.8% +20.0% -33.3% +140.0% =0.0% +100.0% +600.0% +266.7% +159.1% $0-$199,999 $250,000-$299,999 $400,000-$499,999 $200,000-$249,999 $300,000-$399,999 $500,000+ Totals
Quarterly 30-year fixed mortgage rates dating from January 2018 to the week ending Thursday, January 4, 2024. 4.40%4.52% 4.71% 4.51% 4.08% 3.75%3.65%3.72% 3.33% 3.07% 2.88% 2.67% 3.18%2.98%3.01%3.11% 4.67% 5.70% 6.70% 6.48% 6.32% 6.81% 7.49% 6.62% 2.50% 3.25% 4.00% 4.75% 5.50% 6.25% 7.00% 7.75% Q1-18 Q2-18 Q3-18 Q4-18 Q1-19 Q2-19 Q3-19 Q4-19 Q1-20 Q2-20 Q3-20 Q4-20 Q1-21 Q2-21 Q3-21 Q4-21 Q1-22 Q2-22 Q3-22 Q4-22 Q1-23 Q2-23 Q3-23 Q4-23
Mortgage Rates
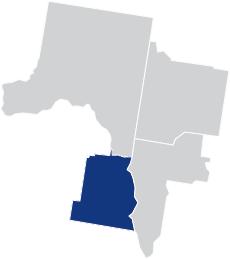
Asotin County

What’s in the Asotin County Data?
In Quarter 4 2023, Asotin County median home prices were up 8.0% compared to last year and down 4.7% compared to last quarter, selling for a median price of $312,000. There were 39 homes sold in Q4 2023 this year, down from 56 at this same time last year.
On median, homes in Asotin County sell after 63 days on the market, up 186.4% from this same time last year. There were 36 new listings to go live last quarter and there are a total of 45 active listings at the time of this report.
22 Quad Cities Quarterly Market Report | Q4 2023 - Asotin County
23 Quad Cities Quarterly Market Report | Q4 2023 - Asotin County
At a Glance Snapshot overview Asotin County Q4 2023 (Current) 39 $310,683 36 $312,000 63 45 54 $368,834 77 $327,500 19 66 56 $322,240 57 $289,000 22 15 -27.8% -15.8% -53.2% -4.7% +231.6% -31.8% -30.4% -3.6% -36.8% +8.0% +186.4% +200.0% Closed Sales Average Sales Price New Listings Median Sales Price Median DOM Active Listings Q3 2023 (Last Quarter) Q4 2022 (Last Year) % Change (Last Quarter) % Change (Last Year) Information pulled on 01/08/2024. The information in this report section for Asotin County is compiled from a report given by the Intermountail MLS and to the best of our knowledge is accurate and current. Down 4.7% prior quarter Up 231.6% prior quarter Up 8.0% prior year Up 186.4% prior year Down 27.8% prior quarter Down 30.4% prior year Median Sales Price Closed Sales Median Days on Market $312,000 39 63
Q4 2023 Market data Asotin County
Closed Sales
As of 01/08/2024. By quarter dating from Q1 2018 to Q4 2023. Closed Sales is the number of properties sold.
Closed Sales By Price Range
As of 01/08/2024. Year-over-year comparison for Q4 2023 and Q4 2022.
24 Quad Cities Quarterly Market Report | Q4 2023 - Asotin County
Closed Sales By
Range is the number and percentage of properties sold in different
ranges. 10.7% 17.9% 25.0% 21.4% 16.1% 8.9% 12.8% 12.8% 23.1% 35.9% 12.8% 2.6% 0 2 4 6 8 10 12 14 16 $0-200K $200K-$250K $250K-300K $300K-$400K $400K-$500K $500K+ Q3 2022 Q3 2023 42 147 70 62 43 78 80 69 44 66 85 88 54 67 87 71 49 74 130 56 57 52 54 39 25 50 75 100 125 150 Q1-18 Q2-18 Q3-18 Q4-18 Q1-19 Q2-19 Q3-19 Q4-19 Q1-20 Q2-20 Q3-20 Q4-20 Q1-21 Q2-21 Q3-21 Q4-21 Q1-22 Q2-22 Q3-22 Q4-22 Q1-23 Q2-23 Q3-23 Q4-23
Price
price
Average and Median Sales Price
As of 01/08/2024. By quarter dating from Q1 2018 to Q4 2023.
Median Sales Price is the mid-point (median) value where the price for half of the closed sales is higher and half is lower.
Average Sales Price is the sum of the sold dollar volume divided by the number of units sold.
Median Days on Market
As of 01/08/2024. By quarter dating from Q1 2018 to Q4 2023. Days on Market is the median number of days between when a property is listed and the contract date. $175 $200 $225 $250 $275 $300 $325 $350 $375 $400
25 Quad Cities Quarterly Market Report | Q4 2023 - Asotin County
Q1-18 Q2-18 Q3-18 Q4-18 Q1-19 Q2-19 Q3-19 Q4-19 Q1-20 Q2-20 Q3-20 Q4-20 Q1-21 Q2-21 Q3-21 Q4-21 Q1-22 Q2-22 Q3-22 Q4-22 Q1-23 Q2-23 Q3-23 Q4-23 Median Average 0 10 20 30 40 50 60 70 80 90 100 Q1-18 Q2-18 Q3-18 Q4-18 Q1-19 Q2-19 Q3-19 Q4-19 Q1-20 Q2-20 Q3-20 Q4-20 Q1-21 Q2-21 Q3-21 Q4-21 Q1-22 Q2-22 Q3-22 Q4-22 Q1-23 Q2-23 Q3-23 Q4-23
New Listings
As of 01/08/2024. By quarter dating from Q1 2018 to Q4 2023. New Listings is the number of properties listed regardless of current status.
Sale-to-List Price Ratio
As of 01/08/2024. By quarter dating from Q1 2018 to Q4 2023. Sale-to-List Price Ratio is the average of sales price divided by the final list price expressed as a percentage.
26 Quad Cities Quarterly Market Report | Q4 2023 - Asotin County
68 186 81 50 67 98 96 60 72 74 97 60 70 80 97 63 69 93 148 57 57 74 77 36 25 50 75 100 125 150 175 200 Q1-18 Q2-18 Q3-18 Q4-18 Q1-19 Q2-19 Q3-19 Q4-19 Q1-20 Q2-20 Q3-20 Q4-20 Q1-21 Q2-21 Q3-21 Q4-21 Q1-22 Q2-22 Q3-22 Q4-22 Q1-23 Q2-23 Q3-23 Q4-23 97.8% 98.0% 98.0% 97.4% 97.5% 98.4% 98.5% 97.5% 98.3% 99.3% 99.1% 99.6% 100.5% 101.2% 100.3% 98.7% 100.2% 100.6% 98.1% 97.4% 98.1% 98.8% 98.9% 97.3% 97.0% 97.5% 98.0% 98.5% 99.0% 99.5% 100.0% 100.5% 101.0% 101.5% Q1-18 Q2-18 Q3-18 Q4-18 Q1-19 Q2-19 Q3-19 Q4-19 Q1-20 Q2-20 Q3-20 Q4-20 Q1-21 Q2-21 Q3-21 Q4-21 Q1-22 Q2-22 Q3-22 Q4-22 Q1-23 Q2-23 Q3-23 Q4-23
Supply and Demand
As of 01/08/2024. Year-over-year comparison of Closed Sales and Active Inventory for Q4 2023 and Q4 2022.
Mortgage Rates
27 Quad Cities Quarterly Market Report | Q4 2023 - Asotin County
Quarterly 30-year fixed mortgage rates dating from January 2018 to the week ending Thursday, January 4, 2024. 4.40%4.52% 4.71% 4.51% 4.08% 3.75%3.65%3.72% 3.33% 3.07% 2.88% 2.67% 3.18%2.98%3.01%3.11% 4.67% 5.70% 6.70% 6.48% 6.32% 6.81% 7.49% 6.62% 2.50% 3.25% 4.00% 4.75% 5.50% 6.25% 7.00% 7.75% Q1-18 Q2-18 Q3-18 Q4-18 Q1-19 Q2-19 Q3-19 Q4-19 Q1-20 Q2-20 Q3-20 Q4-20 Q1-21 Q2-21 Q3-21 Q4-21 Q1-22 Q2-22 Q3-22 Q4-22 Q1-23 Q2-23 Q3-23 Q4-23
Price Range Closed Sales Active Inventory Q4 2023 Q4 2023 Q4 2022 Q4 2022 % Change % Change 5 5 9 6 1 14 39 2 11 7 1 11 17 45 6 9 14 10 5 12 56 2 3 3 1 2 4 15 -16.7% -44.4% -35.7% -40.0% -80.0% +16.7% -30.4% =0.0% +266.7% +133.3% =0.0% +450.0% +325.0% +200.0% $0-$199,999 $250,000-$299,999 $400,000-$499,999 $200,000-$249,999 $300,000-$399,999 $500,000+ Totals
The information in this report is compiled from a report given by the Intermountain MLS and the Pacific Regional MLS and to the best of our knowledge is accurate and current. Coldwell Banker Real Estate LLC. All Rights Reserved. Coldwell Banker Real Estate LLC fully supports the principles of the Fair Housing Act and the Equal Opportunity Act. Each Office Is Independently Owned And Operated. Coldwell Banker and the Coldwell Banker Logo are registered service marks owned by Coldwell Banker Real Estate LLC. Information deemed reliable but not guaranteed and should be independently verified. cbquadcities.com Lewiston • 325 Main St 208.746.7400 Moscow • 217 S Main St 208.882.0800 Pullman • 405 S Grand Ave 509.334.0562