MarketReport
Latah•Whitman•NezPerce•Asotin

2023 Q2
QuadCities
2 QuadCitiesQuarterlyMarketReport| Q22023 CONTENTS Q22023MarketREPORT 4 LATAHCOUNTY MARKETDATA 10 WHITMANCOUNTY MARKETDATA 16 NEZPERCECOUNTY MARKETDATA 22 ASOTINCOUNTY MARKETDATA
Today’sRealEstateMarket intheQuadCitiesRegion
Q2–2023MarketSummary
Thefirsthalfof2023isinthebooksandaslowmarkethascontinuedthroughnewyear.Multiple factorscontributedtoasofteningmarketincludinghighinterestrates,limitedinventory,and recessionfears.
IntheLatahCounty,closedtransactionsweredown15.8%fromthissamelastyear,withnewlistings alsodecreasedby32.3%comparedtoQ22022.Inthissametimeframe,themediansalesprice increasedonlyslightlyby5.8%to$439,000whileaveragesalespriceincreased5.9%to$445,615.
TheWhitmanCountymarketwastheonlycountytoshowanincreaseintheamountofnew listingsincomparisontoQ22022,with172propertieslistedinthequarter.Thiswasanincreaseof 15.4%fromlastyearanda81.1%increasefromlastquarter.Homesalepriceshaveshowna slightincreasingtrendoverthepastyear,climbingjust1.0%fromQ22022toamedianhomesale priceof$409,000.
TheNezPerceCountymarketrealizedbiggestslipincurrentactivelistingsinrelationtothe previousquarter,decreasingby21.7%,with159newpropertiesgoingliveinQ22023.Themedian homesalepricerose10.7%fromthepreviousyearto$371,00.Themediandaysonmarket increasedto16days,comparedto28daysinpreviousquarter.
ThemarketwestofthestatelineinAsotinCountymarketsawthemostnotablesurgeinmedian saleprice,increasingby16.5%to$349,540,whereitwas$299,950atthesametimeayearago. Closedtransactionsalsoplungedby27.8%with52homessoldinQ22023
Therehasbeenanincreaseinactivityatthestartof2023,coupledwithanupswinginbuyer inquiries.Wearecontinuingtokeepacloseeyeoninterestratesalongwithinventorylevelsaswe headthroughthesummersellingseason.
JasonBrown DesignatedBroker/RegionalManager
3 QuadCitiesQuarterlyMarketReport| Q22023
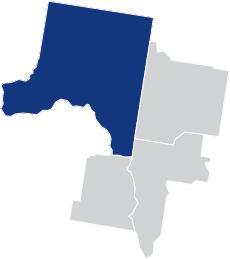
LatahCounty
What’sintheLatahCountyData?
InQuarter12023,LatahCountymedianhomepriceswereup19.0%comparedto lastyearandup5.8%comparedtolastquarter,sellingforamedianpriceof $439,000.Therewere85homessoldinQ22023thisyear,downfrom101atthis sametimelastyear. Onmedian,homesinLatahCountysellafter8daysonthemarket,up60.0%from thissametimelastyear.Therewere105newlistingstogolivelastquarterand thereareatotalof39activelistingsatthetimeofthisreport.
4 QuadCitiesQuarterlyMarketReport| Q22023-LatahCounty

5 QuadCitiesQuarterlyMarketReport| Q22023-LatahCounty Q22023Marketdata LatahCounty Up19.0%priorquarter Down50.0%priorquarter Up5.8%prioryear Up60.0%prioryear Up129.7%priorquarter Down15.8%prioryear MedianSalesPrice ClosedSales MedianDaysonMarket $439,000 85 8 AtaGlance Snapshotoverview LatahCounty Q22023 (Current) 85 $445,615 105 $439,000 8 39 37 $397,392 71 $369,000 16 41 101 $420,602 144 $415,000 5 59 +129.7% +12.1% +47.9% +19.0% -50.0% -4.9% -15.8% +5.9% -32.3% +5.8% +60.0% -33.9% ClosedSales AverageSalesPrice NewListings MedianSalesPrice MedianDOM ActiveListings Q12023 (LastQuarter) Q22022 (LastYear) %Change (LastQuarter) %Change (LastYear) Informationpulledon07/07/2023. TheinformationinthisreportsectionforLatahCountyiscompiledfromareportgivenbytheIntermountainMLSandtothebestofourknowledgeisaccurateandcurrent.
ClosedSales
Asof07/07/2023.ByquarterdatingfromQ12018toQ22023. ClosedSalesisthenumberofpropertiessold.
ClosedSalesByPriceRange
Asof07/07/2023.Year-over-yearcomparisonforQ22023andQ22022.
ClosedSalesByPriceRangeisthenumberandpercentageofpropertiessoldindifferentpriceranges.
6 QuadCitiesQuarterlyMarketReport| Q22023-LatahCounty
8.9% 6.9% 7.9% 23.8% 24.8% 27.7% 2.4% 5.9% 5.9% 20.0% 34.1% 31.8% 0 4 8 12 16 20 24 28 32 $0-200K $200K-$250K $250K-300K $300K-$400K $400K-$500K $500K+ Q2 2022 Q2 2023 59 116 98 71 51 130 120 96 51 109 118 95 66 88 120 80 42 101 107 57 37 85 25 50 75 100 125 150 Q1-18 Q2-18 Q3-18 Q4-18 Q1-19 Q2-19 Q3-19 Q4-19 Q1-20 Q2-20 Q3-20 Q4-20 Q1-21 Q2-21 Q3-21 Q4-21 Q1-22 Q2-22 Q3-22 Q4-22 Q1-23 Q2-23
AverageandMedianSalesPrice
Asof07/07/2023.ByquarterdatingfromQ12018toQ22023.
MedianSalesPriceisthemid-point(median)valuewherethepriceforhalfoftheclosedsalesishigherandhalfislower.
AverageSalesPriceisthesumofthesolddollarvolumedividedbythenumberofunitssold.
MedianDaysonMarket
Asof07/07/2023.ByquarterdatingfromQ12018toQ22023. DaysonMarketisthemediannumberofdaysbetweenwhenapropertyislistedandthecontractdate.
7 QuadCitiesQuarterlyMarketReport| Q22023-LatahCounty
$200 $225 $250 $275 $300 $325 $350 $375 $400 $425 $450 Q1-18 Q2-18 Q3-18 Q4-18 Q1-19 Q2-19 Q3-19 Q4-19 Q1-20 Q2-20 Q3-20 Q4-20 Q1-21 Q2-21 Q3-21 Q4-21 Q1-22 Q2-22 Q3-22 Q4-22 Q1-23 Q2-23 Average Median 0 3 6 9 12 15 18 21 24 27 30 Q1-18 Q2-18 Q3-18 Q4-18 Q1-19 Q2-19 Q3-19 Q4-19 Q1-20 Q2-20 Q3-20 Q4-20 Q1-21 Q2-21 Q3-21 Q4-21 Q1-22 Q2-22 Q3-22 Q4-22 Q1-23 Q2-23
NewListings
Asof07/07/2023.ByquarterdatingfromQ12018toQ22023. NewListingsisthenumberofpropertieslistedregardlessofcurrentstatus.
Sale-to-ListPriceRatio
8 QuadCitiesQuarterlyMarketReport| Q22023-LatahCounty
Sale-to-ListPriceRatioistheaverageofsalespricedividedbythefinallistpriceexpressedasapercentage. 104 150 118 39 119 154 123 62 100 106 102 79 78 126 96 42 80 144 94 49 71 105 25 50 75 100 125 150 175 Q1-18 Q2-18 Q3-18 Q4-18 Q1-19 Q2-19 Q3-19 Q4-19 Q1-20 Q2-20 Q3-20 Q4-20 Q1-21 Q2-21 Q3-21 Q4-21 Q1-22 Q2-22 Q3-22 Q4-22 Q1-23 Q2-23 97.4% 99.0% 98.2% 99.2% 99.3% 99.5% 99.2% 99.2% 98.1% 99.4% 99.8% 99.3% 99.8% 102.3% 100.2% 99.7% 101.6% 102.9% 100.1% 98.3% 98.6% 100.2% 97.0% 97.5% 98.0% 98.5% 99.0% 99.5% 100.0% 100.5% 101.0% 101.5% 102.0% 102.5% 103.0% Q1-18 Q2-18 Q3-18 Q4-18 Q1-19 Q2-19 Q3-19 Q4-19 Q1-20 Q2-20 Q3-20 Q4-20 Q1-21 Q2-21 Q3-21 Q4-21 Q1-22 Q2-22 Q3-22 Q4-22 Q1-23 Q2-23
Asof07/07/2023.ByquarterdatingfromQ12018toQ22023.
9 QuadCitiesQuarterlyMarketReport| Q22023-LatahCounty SupplyandDemand Asof07/07/2023.Year-over-yearcomparisonofClosedSalesandActiveInventoryforQ22023andQ22022. PriceRange ClosedSales ActiveInventory Q22023 Q22023 Q22022 Q22022 %Change %Change 2 29 5 5 27 17 85 1 14 4 1 19 11 50 9 25 8 7 28 24 101 2 27 7 2 14 13 65 -77.7% +16.0% -37.5% -28.6% -3.6% -29.2% 15.8% -50.0% -48.1% -42.6% -50.0% +35.7% -15.4% -23.1% $0-$199,999 $250,000-$299,999 $400,000-$499,999 $200,000-$249,999 $300,000-$399,999 $500,000+ Totals MortgageRates Quarterly30-yearfixedmortgageratesdatingfromJanuary2018totheweekendingThursday,July6,2023. 4.40% 4.52% 4.71% 4.51% 4.08% 3.75% 3.65% 3.72% 3.33% 3.07% 2.88% 2.67% 3.18% 2.98% 3.01% 3.11% 4.67% 5.70% 6.70% 6.48% 6.32% 6.81% 2.50% 3.25% 4.00% 4.75% 5.50% 6.25% 7.00% Q1-18 Q2-18 Q3-18 Q4-18 Q1-19 Q2-19 Q3-19 Q4-19 Q1-20 Q2-20 Q3-20 Q4-20 Q1-21 Q2-21 Q3-21 Q4-21 Q1-22 Q2-22 Q3-22 Q4-22 Q1-23 Q2-23
WhitmanCounty
What’sintheWhitmanCountyData?
InQuarter12023,WhitmanCountymedianhomepriceswereup1.0%compared tolastyearandup19.6%comparedtolastquarter,sellingforamedianpriceof $409,000.Therewere115homessoldinQ12023thisyear,downfrom135atthis sametimelastyear.
Onmedian,homesinWhitmanCountysellafter12daysonthemarket,up200.0% fromthissametimelastyear.Therewere172newlistingstogolivelastquarterand thereareatotalof55activelistingsatthetimeofthisreport.
10 QuadCitiesQuarterlyMarketReport| Q22023-WhitmanCounty
11 QuadCitiesQuarterlyMarketReport| Q22023-WhitmanCounty Q22023Marketdata WhitmanCounty Up19.6%priorquarter Down20.0%priorquarter Up1.0%prioryear Up200.0%prioryear Up85.5%priorquarter Down14.8%prioryear MedianSalesPrice ClosedSales MedianDaysonMarket $409,000 115 12 AtaGlance Snapshotoverview WhitmanCounty Q22023 (Current) 115 $414,706 172 $409,000 12 55 62 $387,727 95 $342,000 15 56 135 $407,925 149 $405,000 4 57 +85.5% +7.0% +81.1% +19.6% -20.0% -1.8% -14.8% +1.7% +15.4% +1.0% +200.0% -3.5% ClosedSales AverageSalesPrice NewListings MedianSalesPrice MedianDOM ActiveListings Q12023 (LastQuarter) Q22022 (LastYear) %Change (LastQuarter) %Change (LastYear) Informationpulledon07/07/2023. TheinformationinthisreportsectionforWhitmanCountyiscompiledfromareportgivenbythePacificRegionalMLSandtothebestofourknowledgeisaccurateandcurrent.
ClosedSales
Asof07/07/2023.ByquarterdatingfromQ12018toQ22023. ClosedSalesisthenumberofpropertiessold.
ClosedSalesByPriceRange
Asof07/07/2023.Year-over-yearcomparisonforQ22023andQ22022.
ClosedSalesByPriceRangeisthenumberandpercentageofpropertiessoldindifferentpriceranges.
12 QuadCitiesQuarterlyMarketReport| Q22023-WhitmanCounty
17.9% 4.0% 8.6% 21.9% 23.8% 23.8% 18.7% 8.6% 9.4% 18.7% 20.9% 23.7% 0 4 8 12 16 20 24 28 32 36 40 $0-200K $200K-$250K $250K-300K $300K-$400K $400K-$500K $500K+ Q2 2022 Q2 2023 79 179 112 69 56 146 123 86 73 121 115 118 68 160 146 81 73 135 126 74 62 115 25 50 75 100 125 150 175 200 Q1-18 Q2-18 Q3-18 Q4-18 Q1-19 Q2-19 Q3-19 Q4-19 Q1-20 Q2-20 Q3-20 Q4-20 Q1-21 Q2-21 Q3-21 Q4-21 Q1-22 Q2-22 Q3-22 Q4-22 Q1-23 Q2-23
AverageandMedianSalesPrice
Asof07/07/2023.ByquarterdatingfromQ12018toQ22023. MedianSalesPriceisthemid-point(median)valuewherethepriceforhalfoftheclosedsalesishigherandhalfislower. AverageSalesPriceisthesumofthesolddollarvolumedividedbythenumberofunitssold.
MedianDaysonMarket
Asof07/07/2023.ByquarterdatingfromQ12018toQ22023. DaysonMarketisthemediannumberofdaysbetweenwhenapropertyislistedandthecontractdate.
13 QuadCitiesQuarterlyMarketReport| Q22023-WhitmanCounty
$225 $250 $275 $300 $325 $350 $375 $400 $425 $450 Q1-18 Q2-18 Q3-18 Q4-18 Q1-19 Q2-19 Q3-19 Q4-19 Q1-20 Q2-20 Q3-20 Q4-20 Q1-21 Q2-21 Q3-21 Q4-21 Q1-22 Q2-22 Q3-22 Q4-22 Q1-23 Q2-23 Average Median 0 5 10 15 20 25 30 35 40 Q1-18 Q2-18 Q3-18 Q4-18 Q1-19 Q2-19 Q3-19 Q4-19 Q1-20 Q2-20 Q3-20 Q4-20 Q1-21 Q2-21 Q3-21 Q4-21 Q1-22 Q2-22 Q3-22 Q4-22 Q1-23 Q2-23
NewListings
Asof07/07/2023.ByquarterdatingfromQ12018toQ22023. NewListingsisthenumberofpropertieslistedregardlessofcurrentstatus.
Sale-to-ListPriceRatio
14 QuadCitiesQuarterlyMarketReport| Q22023-WhitmanCounty
Asof07/07/2023.ByquarterdatingfromQ12018toQ22023. Sale-to-ListPriceRatioistheaverageofsalespricedividedbythefinallistpriceexpressedasapercentage. 185 155 104 61 138 193 119 69 160 125 128 80 144 173 114 62 121 181 120 71 95 172 50 75 100 125 150 175 200 Q1-18 Q2-18 Q3-18 Q4-18 Q1-19 Q2-19 Q3-19 Q4-19 Q1-20 Q2-20 Q3-20 Q4-20 Q1-21 Q2-21 Q3-21 Q4-21 Q1-22 Q2-22 Q3-22 Q4-22 Q1-23 Q2-23 98.2% 98.3% 97.6% 97.6% 98.0% 98.8% 98.4% 97.3% 98.6% 98.3% 98.8% 98.3% 98.8% 99.7% 99.3% 99.1% 99.4% 101.4% 99.0% 97.1% 98.7% 98.5% 97.0% 97.5% 98.0% 98.5% 99.0% 99.5% 100.0% 100.5% 101.0% 101.5% Q1-18 Q2-18 Q3-18 Q4-18 Q1-19 Q2-19 Q3-19 Q4-19 Q1-20 Q2-20 Q3-20 Q4-20 Q1-21 Q2-21 Q3-21 Q4-21 Q1-22 Q2-22 Q3-22 Q4-22 Q1-23 Q2-23
15 QuadCitiesQuarterlyMarketReport| Q22023-WhitmanCounty SupplyandDemand Asof07/07/2023.Year-over-yearcomparisonofClosedSalesandActiveInventoryforQ22023andQ22022. PriceRange ClosedSales ActiveInventory Q22023 Q22023 Q22022 Q22022 %Change %Change 26 29 13 12 33 26 139 6 14 2 2 27 5 56 27 36 13 6 36 33 151 2 11 6 1 17 20 57 -3.7% -19.4% =0.0% +100.0% -8.3% -21.2% -7.9% -14.3% +75.0% -33.3% +100.0% +68.8% -37.5% +30.1% $0-$199,999 $250,000-$299,999 $400,000-$499,999 $200,000-$249,999 $300,000-$399,999 $500,000+ Totals MortgageRates Quarterly30-yearfixedmortgageratesdatingfromJanuary2018totheweekendingThursday,July6,2023. 4.40% 4.52% 4.71% 4.51% 4.08% 3.75% 3.65% 3.72% 3.33% 3.07% 2.88% 2.67% 3.18% 2.98% 3.01% 3.11% 4.67% 5.70% 6.70% 6.48% 6.32% 6.81% 2.50% 3.25% 4.00% 4.75% 5.50% 6.25% 7.00% Q1-18 Q2-18 Q3-18 Q4-18 Q1-19 Q2-19 Q3-19 Q4-19 Q1-20 Q2-20 Q3-20 Q4-20 Q1-21 Q2-21 Q3-21 Q4-21 Q1-22 Q2-22 Q3-22 Q4-22 Q1-23 Q2-23
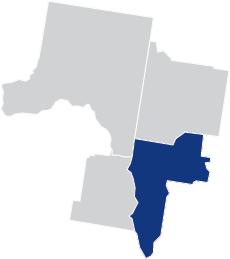
NezPerceCounty

What’sintheNezPerceCountyData?
InQuarter12023,NezPerceCountymedianhomepriceswereup10.7% comparedtolastyearandup4.5%comparedtolastquarter,sellingforamedian priceof$371,000.Therewere132homessoldinQ12023thisyear,downfrom128 atthissametimelastyear.
Onmedian,homesinNezPerceCountysellafter16daysonthemarket,up 128.6%fromthissametimelastyear.Therewere159newlistingstogolivelast quarterandthereareatotalof54activelistingsatthetimeofthisreport.
16 QuadCitiesQuarterlyMarketReport| Q22023-NezPerceCounty
17 QuadCitiesQuarterlyMarketReport| Q22023-NezPerceCounty Q22023Marketdata NezPerceCounty AtaGlance Snapshotoverview NezPerceCounty Q22023 (Current) 132 $386,508 159 $371,000 16 54 78 $364,352 128 $355,000 28 69 128 $362,371 159 $335,000 7 73 +69.2% +6.1% +24.2% +4.5% -42.9% -21.7% +3.1% +6.7% =0.0% +10.7% +128.6% -26.0% ClosedSales AverageSalesPrice NewListings MedianSalesPrice MedianDOM ActiveListings Q12023 (LastQuarter) Q22022 (LastYear) %Change (LastQuarter) %Change (LastYear) Informationpulledon07/07/2023. TheinformationinthisreportsectionforNezPerceCountyiscompiledfromareportgivenbytheIntermountailMLSandtothebestofourknowledgeisaccurateandcurrent. Up4.5%priorquarter Down42.9%priorquarter Up10.7%prioryear Up128.6%prioryear Up69.2%priorquarter Up3.1%prioryear MedianSalesPrice ClosedSales MedianDaysonMarket $371,000 132 16
ClosedSales
Asof07/07/2023.ByquarterdatingfromQ12018toQ22023. ClosedSalesisthenumberofpropertiessold.
ClosedSalesByPriceRange
Asof07/07/2023.Year-over-yearcomparisonforQ22023andQ22022. ClosedSalesByPriceRangeisthenumberandpercentageofpropertiessoldindifferentpriceranges.
18 QuadCitiesQuarterlyMarketReport| Q22023-NezPerceCounty
4.7% 10.9% 10.2% 37.5% 21.1% 15.6% 5.3% 6.1% 12.9% 37.9% 19.7% 18.2% 0 5 10 15 20 25 30 35 40 45 50 $0-200K $200K-$250K $250K-300K $300K-$400K $400K-$500K $500K+ Q2 2022 Q2 2023 121 162 154 124 82 120 152 120 115 123 172 133 108 128 133 162 114 128 116 75 78 132 50 75 100 125 150 175 Q1-18 Q2-18 Q3-18 Q4-18 Q1-19 Q2-19 Q3-19 Q4-19 Q1-20 Q2-20 Q3-20 Q4-20 Q1-21 Q2-21 Q3-21 Q4-21 Q1-22 Q2-22 Q3-22 Q4-22 Q1-23 Q2-23
AverageandMedianSalesPrice
Asof07/07/2023.ByquarterdatingfromQ12018toQ22023. MedianSalesPriceisthemid-point(median)valuewherethepriceforhalfoftheclosedsalesishigherandhalfislower. AverageSalesPriceisthesumofthesolddollarvolumedividedbythenumberofunitssold.
MedianDaysonMarket
Asof07/07/2023.ByquarterdatingfromQ12018toQ22023. DaysonMarketisthemediannumberofdaysbetweenwhenapropertyislistedandthecontractdate.
19 QuadCitiesQuarterlyMarketReport| Q22023-NezPerceCounty
$200 $225 $250 $275 $300 $325 $350 $375 $400 Q1-18 Q2-18 Q3-18 Q4-18 Q1-19 Q2-19 Q3-19 Q4-19 Q1-20 Q2-20 Q3-20 Q4-20 Q1-21 Q2-21 Q3-21 Q4-21 Q1-22 Q2-22 Q3-22 Q4-22 Q1-23 Q2-23 Average Median 0 10 20 30 40 50 60 70 80 Q1-18 Q2-18 Q3-18 Q4-18 Q1-19 Q2-19 Q3-19 Q4-19 Q1-20 Q2-20 Q3-20 Q4-20 Q1-21 Q2-21 Q3-21 Q4-21 Q1-22 Q2-22 Q3-22 Q4-22 Q1-23 Q2-23
NewListings
Asof07/07/2023.ByquarterdatingfromQ12018toQ22023. NewListingsisthenumberofpropertieslistedregardlessofcurrentstatus.
Sale-to-ListPriceRatio
Asof07/07/2023.ByquarterdatingfromQ12018toQ22023.
20 QuadCitiesQuarterlyMarketReport| Q22023-NezPerceCounty
132 200 169 93 108 197 152 113 134 164 153 111 128 154 183 116 137 159 140 79 128 159 50 75 100 125 150 175 200 Q1-18 Q2-18 Q3-18 Q4-18 Q1-19 Q2-19 Q3-19 Q4-19 Q1-20 Q2-20 Q3-20 Q4-20 Q1-21 Q2-21 Q3-21 Q4-21 Q1-22 Q2-22 Q3-22 Q4-22 Q1-23 Q2-23 98.8% 99.1% 99.2% 98.8% 98.4% 98.8% 98.7% 98.2% 98.0% 99.3% 99.8% 100.0% 100.0% 101.7% 100.3% 100.0% 99.9% 100.4% 99.5% 97.3% 97.7% 98.8% 97.0% 97.5% 98.0% 98.5% 99.0% 99.5% 100.0% 100.5% 101.0% 101.5% 102.0% Q1-18 Q2-18 Q3-18 Q4-18 Q1-19 Q2-19 Q3-19 Q4-19 Q1-20 Q2-20 Q3-20 Q4-20 Q1-21 Q2-21 Q3-21 Q4-21 Q1-22 Q2-22 Q3-22 Q4-22 Q1-23 Q2-23
Sale-to-ListPriceRatioistheaverageofsalespricedividedbythefinallistpriceexpressedasapercentage.
21 QuadCitiesQuarterlyMarketReport| Q22023-NezPerceCounty SupplyandDemand Asof07/07/2023.Year-over-yearcomparisonofClosedSalesandActiveInventoryforQ22023andQ22022. PriceRange ClosedSales ActiveInventory Q22023 Q22023 Q22022 Q22022 %Change %Change 7 26 17 8 24 50 132 2 28 4 3 19 22 78 6 27 13 14 20 48 128 5 20 12 4 9 17 67 +16.7% -3.7% +30.8% -42.9% +20.0% +4.2% +3.1% -60.0% +40.0% -66.7% -25.0% +111.2 % +29.4% +16.4% $0-$199,999 $250,000-$299,999 $400,000-$499,999 $200,000-$249,999 $300,000-$399,999 $500,000+ Totals MortgageRates Quarterly30-yearfixedmortgageratesdatingfromJanuary2018totheweekendingThursday,July6,2023. 4.40% 4.52% 4.71% 4.51% 4.08% 3.75% 3.65% 3.72% 3.33% 3.07% 2.88% 2.67% 3.18% 2.98% 3.01% 3.11% 4.67% 5.70% 6.70% 6.48% 6.32% 6.81% 2.50% 3.25% 4.00% 4.75% 5.50% 6.25% 7.00% Q1-18 Q2-18 Q3-18 Q4-18 Q1-19 Q2-19 Q3-19 Q4-19 Q1-20 Q2-20 Q3-20 Q4-20 Q1-21 Q2-21 Q3-21 Q4-21 Q1-22 Q2-22 Q3-22 Q4-22 Q1-23 Q2-23
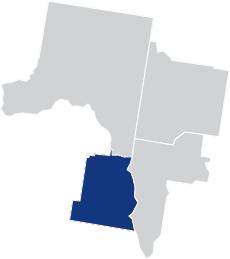
AsotinCounty

What’sintheAsotinCountyData?
InQuarter12023,AsotinCountymedianhomepriceswereup16.5%comparedto lastyearandup4.3%comparedtolastquarter,sellingforamedianpriceof $349,540.Therewere52homessoldinQ12023thisyear,downfrom72atthis sametimelastyear.
Onmedian,homesinAsotinCountysellafter18daysonthemarket,up260.0% fromthissametimelastyear.Therewere74newlistingstogolivelastquarterand thereareatotalof28activelistingsatthetimeofthisreport.
22 QuadCitiesQuarterlyMarketReport| Q22023-AsotinCounty
23 QuadCitiesQuarterlyMarketReport| Q22023-AsotinCounty Q22023Marketdata AsotinCounty AtaGlance Snapshotoverview AsotinCounty Q22023 (Current) 52 $384,104 74 $349,540 18 28 57 $332,568 57 $335,000 18 34 72 $326,982 89 $299,950 5 39 -8.8% +15.5% +29.8% +4.3% =00.0% -17.6% -27.8% +17.5% -16.9% +16.5% +260.0% -28.2% ClosedSales AverageSalesPrice NewListings MedianSalesPrice MedianDOM ActiveListings Q12023 (LastQuarter) Q22022 (LastYear) %Change (LastQuarter) %Change (LastYear) Informationpulledon07/07/2023. TheinformationinthisreportsectionforAsotinCountyiscompiledfromareportgivenbytheIntermountailMLSandtothebestofourknowledgeisaccurateandcurrent. Up4.3%priorquarter Even0.0%priorquarter Up16.5%prioryear Up260.0%prioryear Down8.8%priorquarter Down27.8%prioryear MedianSalesPrice ClosedSales MedianDaysonMarket $349,540 52 18
ClosedSales
Asof07/07/2023.ByquarterdatingfromQ12018toQ22023. ClosedSalesisthenumberofpropertiessold.
ClosedSalesByPriceRange
Asof07/07/2023.Year-over-yearcomparisonforQ22023andQ22022.
ClosedSalesByPriceRangeisthenumberandpercentageofpropertiessoldindifferentpriceranges.
24 QuadCitiesQuarterlyMarketReport| Q22023-AsotinCounty
11.1% 12.5% 26.4% 26.4% 8.3% 15.3% 3.8% 9.6% 25.0% 28.8% 11.5% 21.2% 0 2 4 6 8 10 12 14 16 18 20 $0-200K $200K-$250K $250K-300K $300K-$400K $400K-$500K $500K+ Q2 2022 Q2 2023 42 147 70 62 43 78 80 69 44 66 85 88 54 67 87 71 49 74 130 56 57 52 25 50 75 100 125 150 Q1-18 Q2-18 Q3-18 Q4-18 Q1-19 Q2-19 Q3-19 Q4-19 Q1-20 Q2-20 Q3-20 Q4-20 Q1-21 Q2-21 Q3-21 Q4-21 Q1-22 Q2-22 Q3-22 Q4-22 Q1-23 Q2-23
AverageandMedianSalesPrice
Asof07/07/2023.ByquarterdatingfromQ12018toQ22023. MedianSalesPriceisthemid-point(median)valuewherethepriceforhalfoftheclosedsalesishigherandhalfislower.
AverageSalesPriceisthesumofthesolddollarvolumedividedbythenumberofunitssold.
MedianDaysonMarket
Asof07/07/2023.ByquarterdatingfromQ12018toQ22023. DaysonMarketisthemediannumberofdaysbetweenwhenapropertyislistedandthecontractdate.
25 QuadCitiesQuarterlyMarketReport| Q22023-AsotinCounty
$175 $200 $225 $250 $275 $300 $325 $350 $375 $400 Q1-18 Q2-18 Q3-18 Q4-18 Q1-19 Q2-19 Q3-19 Q4-19 Q1-20 Q2-20 Q3-20 Q4-20 Q1-21 Q2-21 Q3-21 Q4-21 Q1-22 Q2-22 Q3-22 Q4-22 Q1-23 Q2-23 Median Average 0 10 20 30 40 50 60 70 80 90 100 Q1-18 Q2-18 Q3-18 Q4-18 Q1-19 Q2-19 Q3-19 Q4-19 Q1-20 Q2-20 Q3-20 Q4-20 Q1-21 Q2-21 Q3-21 Q4-21 Q1-22 Q2-22 Q3-22 Q4-22 Q1-23
NewListings
Asof07/07/2023.ByquarterdatingfromQ12018toQ22023. NewListingsisthenumberofpropertieslistedregardlessofcurrentstatus.
Sale-to-ListPriceRatio
Asof07/07/2023.ByquarterdatingfromQ12018toQ22023.
Sale-to-ListPriceRatioistheaverageofsalespricedividedbythefinallistpriceexpressedasapercentage.
26 QuadCitiesQuarterlyMarketReport| Q22023-AsotinCounty
68 186 81 50 67 98 96 60 72 74 97 60 70 80 97 63 69 93 148 57 57 74 25 50 75 100 125 150 175 200 Q1-18 Q2-18 Q3-18 Q4-18 Q1-19 Q2-19 Q3-19 Q4-19 Q1-20 Q2-20 Q3-20 Q4-20 Q1-21 Q2-21 Q3-21 Q4-21 Q1-22 Q2-22 Q3-22 Q4-22 Q1-23 Q2-23 97.8% 98.0% 98.0% 97.4% 97.5% 98.4% 98.5% 97.5% 98.3% 99.3% 99.1% 99.6% 100.5% 101.2% 100.3% 98.7% 100.2% 100.6% 98.1% 97.4% 98.1% 98.8% 97.0% 97.5% 98.0% 98.5% 99.0% 99.5% 100.0% 100.5% 101.0% 101.5% Q1-18 Q2-18 Q3-18 Q4-18 Q1-19 Q2-19 Q3-19 Q4-19 Q1-20 Q2-20 Q3-20 Q4-20 Q1-21 Q2-21 Q3-21 Q4-21 Q1-22 Q2-22 Q3-22 Q4-22 Q1-23 Q2-23
27 QuadCitiesQuarterlyMarketReport| Q22023-AsotinCounty
4.40% 4.52% 4.71% 4.51% 4.08% 3.75% 3.65% 3.72% 3.33% 3.07% 2.88% 2.67% 3.18% 2.98% 3.01% 3.11% 4.67% 5.70% 6.70% 6.48% 6.32% 6.81% 2.50% 3.25% 4.00% 4.75% 5.50% 6.25% 7.00% Q1-18 Q2-18 Q3-18 Q4-18 Q1-19 Q2-19 Q3-19 Q4-19 Q1-20 Q2-20 Q3-20 Q4-20 Q1-21 Q2-21 Q3-21 Q4-21 Q1-22 Q2-22 Q3-22 Q4-22 Q1-23 Q2-23 SupplyandDemand
PriceRange ClosedSales ActiveInventory Q22023 Q22023 Q22022 Q22022 %Change %Change 2 6 13 5 11 15 52 2 9 8 3 10 20 52 8 10 19 9 7 19 72 3 11 6 2 5 13 40 -75.0% -40.0% -31.6% -44.4% +57.1% -21.1% -27.8% -33.3% -18.2% +33.3% +50.0% +100.0% +53.8% +30.0% $0-$199,999 $250,000-$299,999 $400,000-$499,999 $200,000-$249,999 $300,000-$399,999 $500,000+ Totals
MortgageRates Quarterly30-yearfixedmortgageratesdatingfromJanuary2018totheweekendingThursday,July6,2023.
Asof07/07/2023.Year-over-yearcomparisonofClosedSalesandActiveInventoryforQ22023andQ22022.
TheinformationinthisreportiscompiledfromareportgivenbytheIntermountainMLSandthePacificRegionalMLSandtothebestofourknowledgeisaccurateandcurrent.
ColdwellBankerRealEstateLLC.AllRightsReserved.ColdwellBankerRealEstateLLCfullysupportstheprinciplesoftheFairHousingActandtheEqualOpportunityAct.EachOfficeIs IndependentlyOwnedAndOperated.ColdwellBankerandtheColdwellBankerLogoareregisteredservicemarksownedbyColdwellBankerRealEstateLLC.Informationdeemedreliablebutnot guaranteedandshouldbeindependentlyverified.
Lewiston•325MainSt 208.746.7400 Moscow•217SMainSt 208.882.0800 Pullman•405SGrandAve 509.334.0562
cbquadcities.com