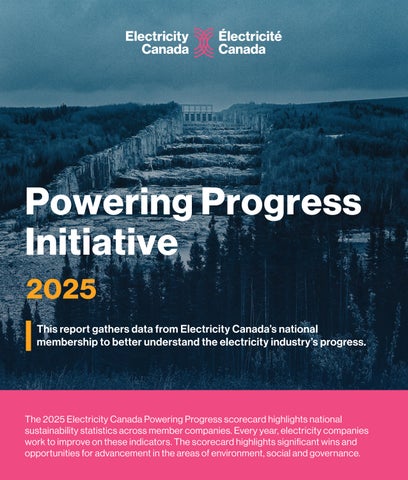
Powering Progress Initiative 2025 This report gathers data from Electricity Canada’s national membership to better understand the electricity industry’s progress.
The 2025 Electricity Canada Powering Progress scorecard highlights national sustainability statistics across member companies. Every year, electricity companies work to improve on these indicators. The scorecard highlights significant wins and opportunities for advancement in the areas of environment, social and governance.
Community Relationships Our members are investing in local and Indigenous communities.
Economic Impacts Total national capital expenditures on infrastructure (CAD $)
$24, 139, 581, 000 20%
$71, 312, 000
Which is on average…
Total national community investments (donations and sponsorships in CAD $)
$862, 128, 000 per member company
5%
Indigenous Relations
3.16% of total utility spending is on Indigenous suppliers
062, 034, 000 0% $1,0% Total national spending on Indigenous suppliers (CAD $)
100%
82%
17%
of reporting utilities have processes, policies, and procedures in place to promote respect of Indigenous values, traditions, and rights.
6%
of reporting utilities have Indigenous cultural awareness training programs for staff and management.
Legend All data cited is from 2024
Increase from 2023 data
Decrease from 2023 data
Reliability Electricity providers are working to ensure that Canada's grid is reliable. In fact, most service interruptions occur during major weather events.
System Average Interruption Duration Index (SAIDI) – 6.26 | 5.14 Total duration of outages for the average customer
System Average Interruption Frequency Index (SAIFI) – 2.64 | 2.44 Average number of times a customer experiences an outage
Customer Average Interruption Duration Index (CAIDI) – 2.38 | 2.10 Average amount of time to restore service after an interruption Significant events excluded
Managing Climate-related Risks 100% 96% 85% 78%
4%
58%
Percentage of Utilities
7%
16%
42% 22% 15% 4%
0%
2023 data
Fair and Safe Workplace Our members work hard to foster health, safety and diversity in the workplace.
Fatality/Injury Rate Our members closely track injuries occurring in the workplace in order to continuously improve processes.
Industry Average
Industry Average
1.38
0.003
Fatality Rate (per 200,000 work hours)
Total Recordable Injury Rate (per 200,000 work hours)
/ Workforce health & Safety/OHS 100%
0%
=
96%
4%
89%
11%
82%
18%
100%
0%
93%
7%
89%
11%
96%
4%
Workplace Demographics
Utility Demographics 71% 29%
Men (%) Women (%)
4.7%
Indigenous employees (%)
= = = =
Environment In Canada, 84% of electricity generated comes from non-emitting sources like hydro, nuclear and wind (ECCC, 2020). The sector has also been reducing its Scope 1 emissions (emissions that come directly from producing electricity), which have decreased 13% from 2023.
2,635 kg SF6
Total industry SF6 used for maintenance purposes
Sulfur hexafluoride (SF6) is an insulator, often used with transformers to prevent equipment from arcing. However, the global warming potential of SF6 is 23,500 times that of CO2 over a 100-year period (GHG Protocol, AR5). The industry is exploring alternatives and monitoring its use of SF6.
Air Quality
Average air pollution emissions in tonnes
NOx – 3,190 t SOx – 5,594 t PM10 – 152 t Mercury (Hg)– 0.03 t Lead (Pb)– 0.10 t
86% 7% of our members have implemented an EMS standard aligned or certified with ISO 14001. This indicator reflects the ISO 14001 standard, so reported values are lower than last year. This change reflects an update in methodology.
Spill Management
Average annual priority spills per utility – 18.0 Priority Spills- Petroleum spillovers of over 500L or containing PCBs over 1g; and/or, any volume of petroleum-based or PCB contaminated substance that enters a water body. Petroleum can be used as insulation in transformers in the form of mineral oil, or the oil is burned as a backup source of energy in remote communities. Recording this information helps to predict the impact of the spill and manage proper cleanup.
On average our members experience less than one incident of non-compliance associated with environmental laws and regulations.
Electrification Electricity Canada members are helping to electrify the economy through increasing EVs and heatpumps, as a few examples.
Total Greenhouse Gas Emissions (tCO2e) Canada has a goal of net zero emissions by 2050. To reach that goal the electricity sector has been working towards reducing their Scope 1 and 2 emissions.
Scope 1 – 47, 667, 463 13%
Sources of emissions that come directly from producing the electricity (i.e. burning natural gas to generate electricity at a power plant)
Scope 2 (Corporate/Operation, excluding T&D Line Losses) – 267, 580 9%
Indirect emissions utilities use for it operations (i.e. electricity purchased to run office buildings).
In 2023, the electricity sector made up only 7% of Canada’s greenhouse gas emissions (Environment and Climate Change Canada, 2025).
Rate Increases Electricity Canada commissioned Power Advisory to develop an estimate of the supply costs related to decarbonization and its potential bill impacts. Based on this model by 2035.
17%
bill increase for residential customers.
21%
bill increase for commercial customers.
26%
bill increase for industrial customers**.
However, according to our research, increasing bills above 3% will be a challenge for utilities (Electricity Canada Customer National Survey, 2022).
Fleet Electrification Members reported 2,093 out of 20,592 fleet vehicles have been electrified.
2,093
20,592
Total fleet size Number of total fleet vehicles converted to i.e EV, PHEV, HEV, Dual-energy
**The costs related to electricity delivery, distribution, and transmission related costs, are not included in these estimates. If incremental network costs are incurred for the purposes of facilitating the energy transition, and if those costs increase at a rate greater than inflation, the overall bill increase will be higher than what is presented in this report.
This data set is based on… • 28 utilities & electricity companies • Over 12* million customers served (*Based on 24 out of 28 members) • Over 83,900 people employed by our members