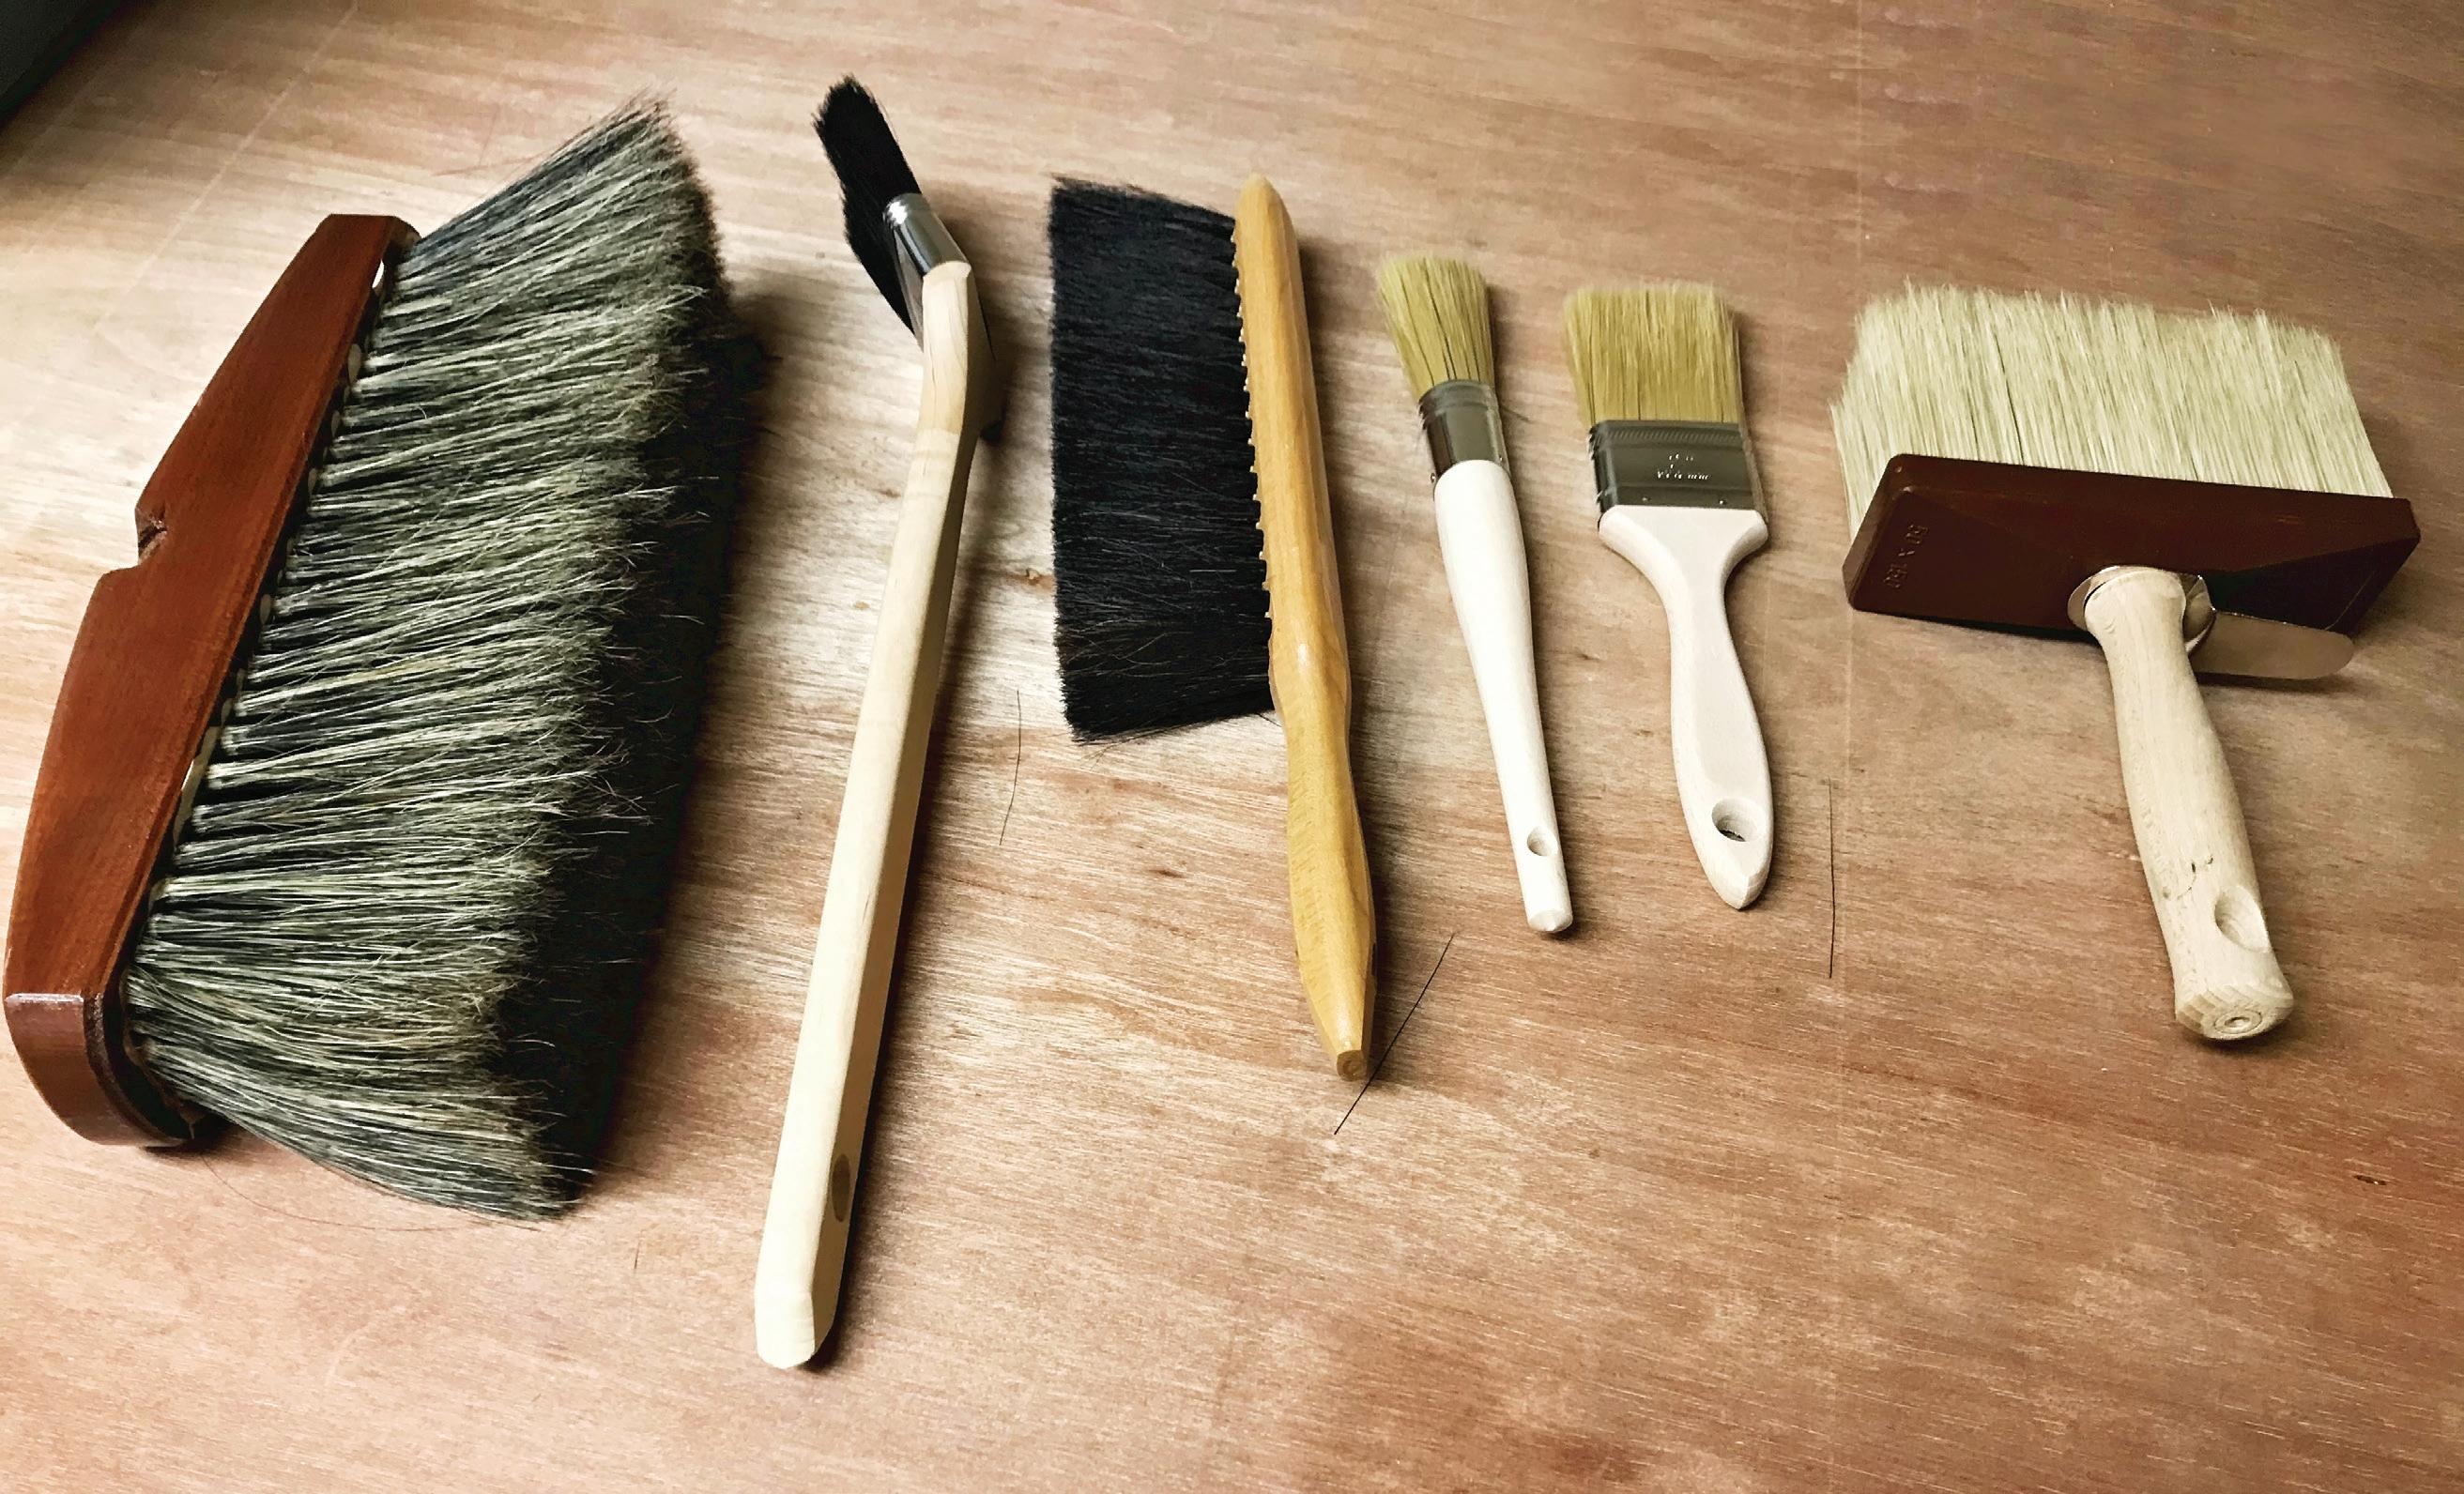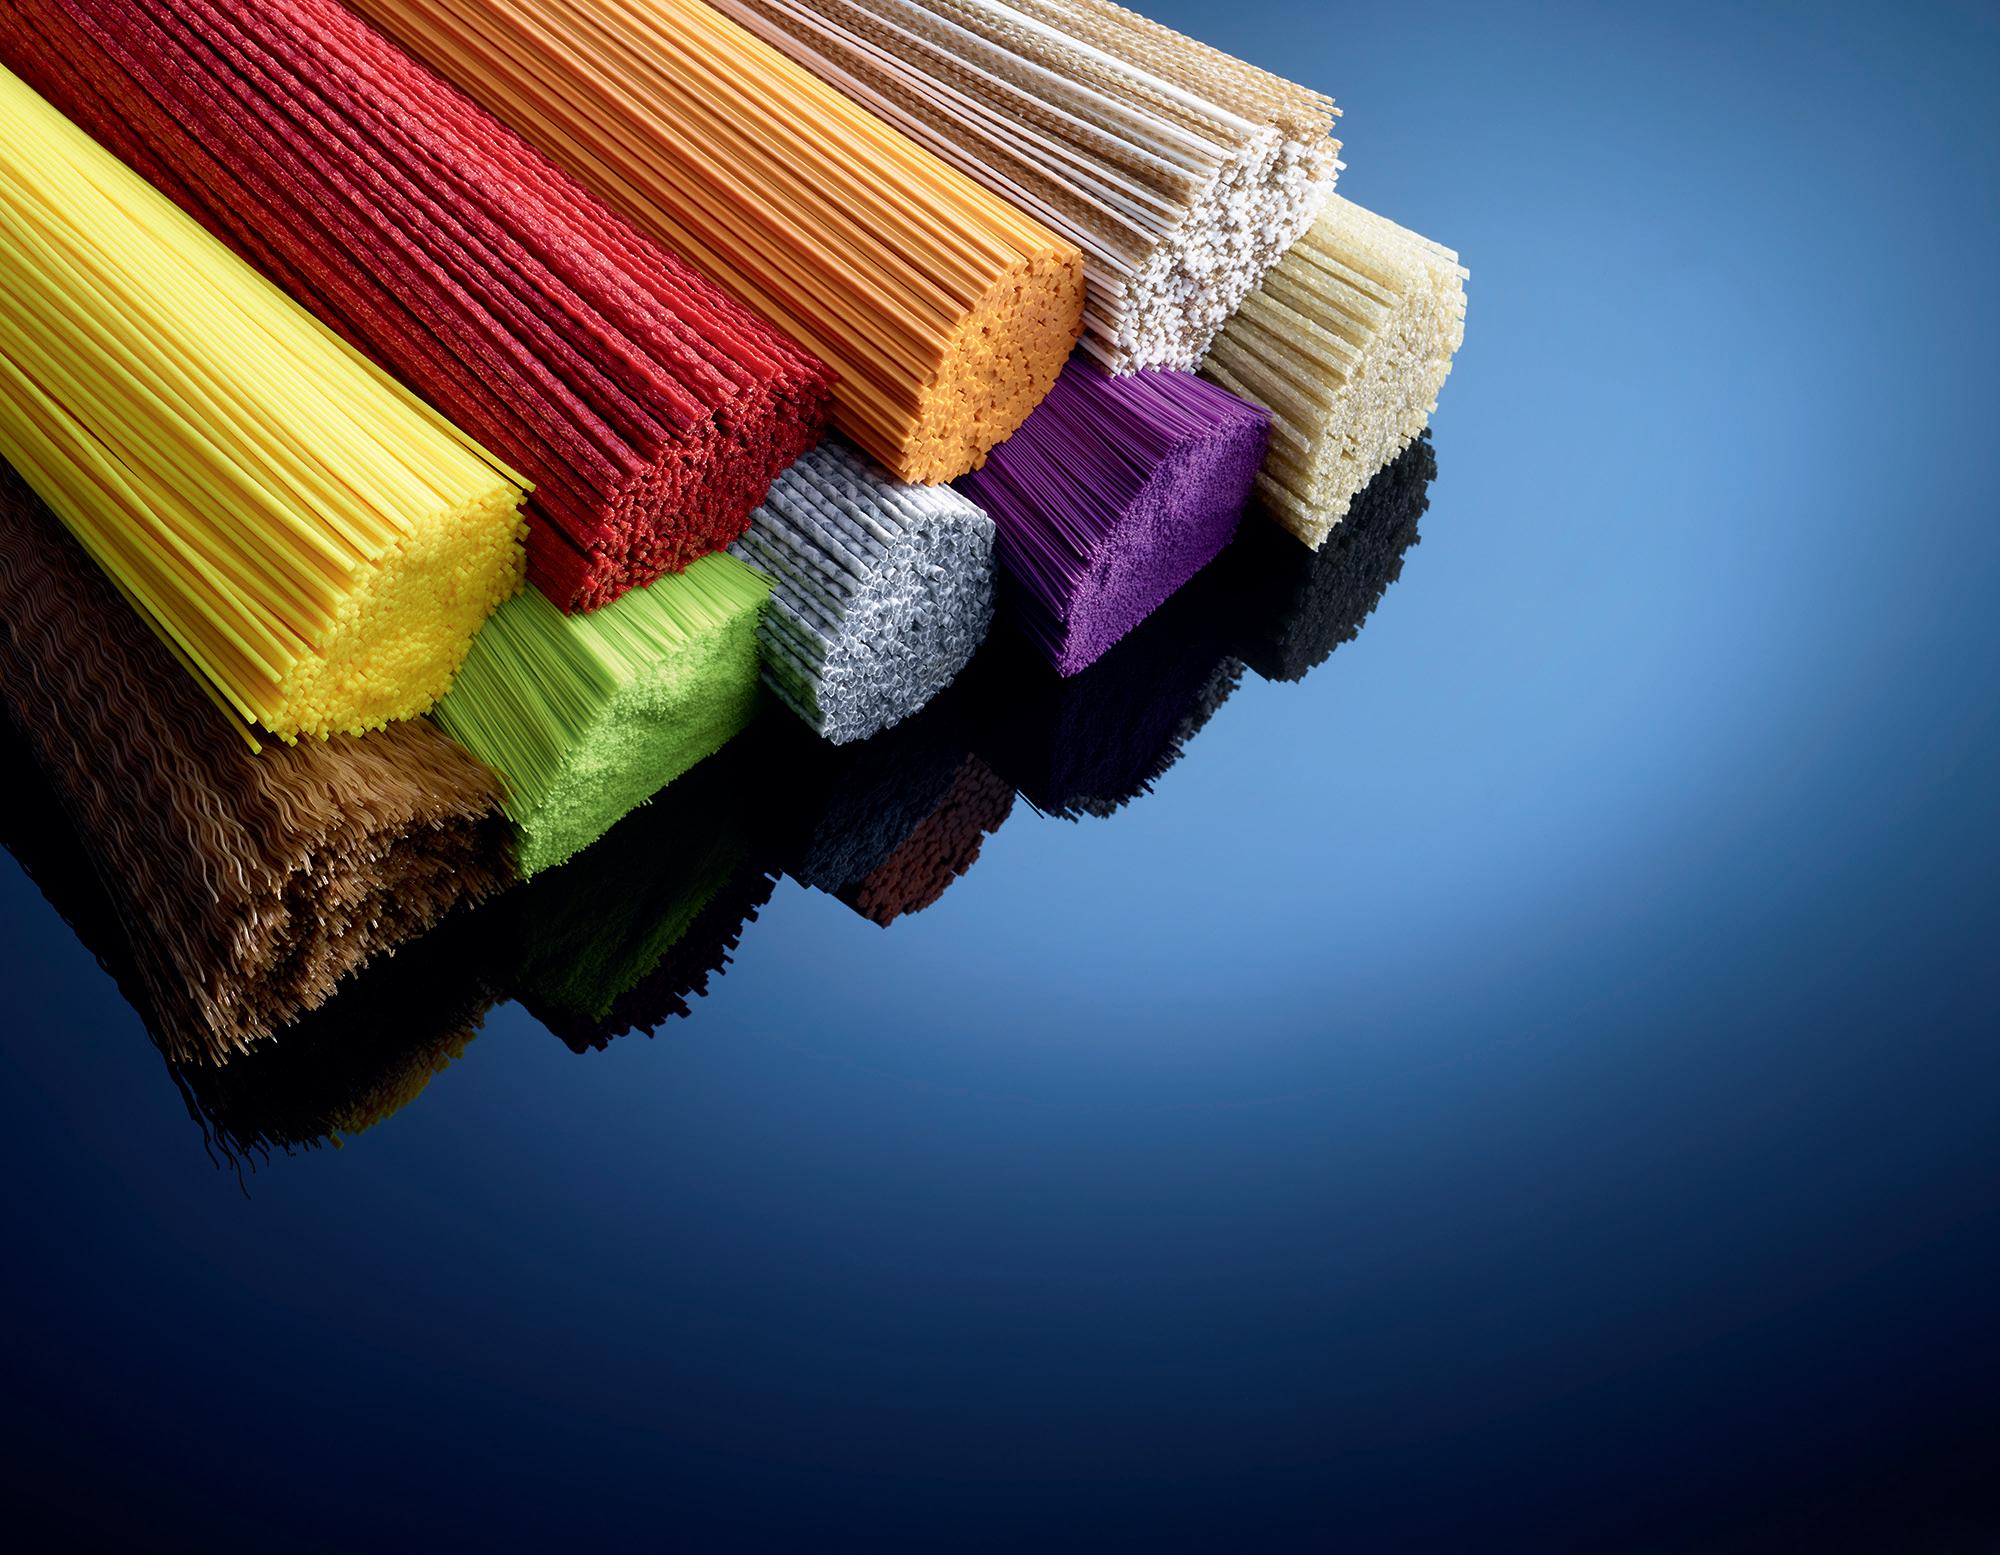


Mill-Rose brushes set the standard for quality and are trusted by more professionals. From surgeons using our medical brushes to machinists using industrial brushes, Mill-Rose brushes perform long after other brushes fail.
We’ve been making brushes since 1919. Millions of them. That’s over a century of brush manufacturing experience!
Mill-Rose makes brushes in every size, shape and material imaginable. From miniature brushes as small as 0.014” in diameter to 48” diameter brushes for industrial applications.

If we don’t have a stock brush for you, we’ll design your brush and make it from any material the job calls for.
Mill-Rose prices typically meet or beat cheaper-quality brushes, but our mission is to always deliver the bestquality brushes. Period.
from
PUBLISHER
Legacy 2023 Media Kit 125 Year Anniversary 1898-2023
As we enter only our fifth year with the magazine, we certainly say that we are “standing on the shoulders of giants.” With that kind of legacy, we endeavor to continue the drive to make Brushware better every single day — striving to not only make the brand the best in the brush industry but also to make it the best media brand period. The mission for Brushware is not simply to modernize, our aim is to go beyond and forge new paths in the media arena to provide the brush community with a vital resource for connection and information.
Plans to celebrate the 125-year anniversary have been ongoing for more than a year and I am happy to have already made connections with a few key players in the history of Brushware. During those exchanges, I heard a couple of new stories and learned a few bits of history I didn’t know. I am excited to make more connections and follow through on our plan to showcase this milestone year with an article in each issue for 2023.
For part one of this 125-year celebration series, I was able to meet with the previous owner Norman Finegold, who now lives here in my home base of Kansas City. We were able to sit down for a lengthy catch-up and the full interview is available on page 14.
And while we will enjoy looking back, business is always moving forward. We are excited to see that the ABMA and FEIBP have announced Bologna, Italy, as the location for the new World Brush Expo to be held in May 2024. We look forward to promoting, attending and covering the event.
While we are aware that the global economy is facing severe challenges, we do thank all of our readers and advertisers for their support, and we hope our coverage helps provide guidance and inspiration. We are here to help all manufacturers and suppliers achieve success, so as always I welcome your feedback on how Brushware can help the industry move forward. Please enjoy this 125th Anniversary Special edition and have a Happy New Year!
Dylan Goodwin | Publisher
dylan.goodwin@goodwinworldmedia.comBrushware – a bi-monthly publication edited for key personnel in the brush, roller, broom, mop and applicator industry. Published continuously through the years, the one publication that is the spokesman for the brush and allied industries: 1898-1923, called Brooms, Brushes & Handles; 1924-1947, called Brooms, Brushes & Mops, 1948-today, called Brushware
Brushware Magazine Goodwin World Media LLC P.O. Box 7093 Overland Park, KS 66207 Tel: 913-636-7231
GENERAL MANAGER

Susan Goodwin info.brushware@goodwinworldmedia.com
Dylan Goodwin dylan.goodwin@goodwinworldmedia.com
EDITOR Gwyneth Bowen news.brushware@goodwinworldmedia.com
Bob Lawrence Phil Perry Meg Cooper Katharina Goldbeck-Hörz Mark E. Battersby Lisa Anderson
Conor M. Todd
Brushware (ISSN 00072710) (Canadian Sales Agreement Number 0650153) is published bimonthly by Goodwin World Media LLC, P.O. Box 7093, Overland Park, KS 66207 USA. Periodical postage paid at Overland Park, KS 66207 and at additional mailing offices. Printed in the USA. Subscription: $95/year for US, Canada and Mexico. All other countries $210/year.
US Distributor: Brush Fibers Arcola
Please contact us for further information, specifications and offers:
Reinhold Hoerz
Senior Sales Manager, Brush Industry
Phone +41 44 386 7901 Mobile +41 79 785 4657 reinhold.hoerz@dksh.com www.dksh.ch/brush
Think Asia. Think DKSH.



The American Brush Manufacturers Association (ABMA) and the European Brushware Federation (FEIBP) are excited to announce the creation of a new show for the industry: World Brush Expo, which will take place May 22-24, 2024, at the Bologna Exhibition Centre in Bologna, Italy.

Donna Frendt, ABMA Executive Director says, “We have been working on this show since it became apparent at the ABMA meeting last March that Interbrush in Freiburg was untenable. Shortly after the completion of the ABMA convention, ABMA reached out to FEIBP to see if there was interest in putting on an industry show, by and for the industry.”
Since that time, a joint task force from the two associations has been working together to determine a pathway to create and hold an industry show. Fons Ceelaert, FEIBP Managing Director says, “The process to come together has been very good for both associations and we look forward to partnering with ABMA to make World Brush Expo THE show for the industry.”
The task force invited Daniel Strowitzki of FWTM (the owners of Interbrush) to make a presentation to continue the show in Freiburg and to submit a proposal for Salzburg, Austria. The task force and ABMA/FEIBP wish to thank Daniel Strowitzki, FWTM, and the Messe in Freiburg for 45 years of partnership and for the outstanding InterBrossa/Interbrush shows. In addition to the proposals from Freiburg and Salzburg, the task force entertained proposals from Bologna, Modena and Parma, Italy. Eventually, Bologna was selected as the host venue for 2024.
Greg Miller, ABMA President said, “I am very excited to see a new industry show arise from the ashes. It has been since
2016 that the entire industry has been able to get together and I think I speak for everyone when I say that this will be a great event for the industry and I can’t wait for 2024!”
Andrew McIlroy added, “The Bologna venue is world-class and Bologna is a fascinating city and will appeal to attendees from all over the world. In addition, their infrastructure is excellent for our show; attendees and exhibitors alike will enjoy the variety of hotel accommodations and the easy logistics of the Bologna site.”
The Bologna Exhibition Centre covers 375,000 square meters of indoor and external areas. Its exhibition services area covers 36,000 square meters. The venue has 20 halls which are fully wired, air-conditioned and equipped with state-of-the-art IT systems. Multiple events can be held simultaneously thanks to five separate entrances. Flexibility and mobility are ensured by a network of walkways and by a system of carparks for a total of 14,500 covered parking spaces. Vehicle owners can reserve their space in advance. Bologna Fiere is the first exhibition center with its own motorway tollbooth, that provides direct entrance to the venue. A “BolognaFiere” railway station handles special trains for exhibitions with a large number of visitors. A heliport is located on the roof of halls 16-18.
Bologna is one of Italy’s great and historic cities. It has a major airport (BLQ) and supports over 13,000 hotel rooms in the city. The exhibition center is near the city center making for convenient logistics. Bologna is home to the oldest university in Europe and has many nearby attractions for attendees and visitors alike. Visit www.worldbrushexpo.com for updates.

Celanese Corporation (NYSE: CE), a global chemical and specialty materials company, announced on November 1, 2022, that it completed the acquisition of the majority of the Mobility & Materials (M&M) business of DuPont.
“We are excited to welcome the M&M team to Celanese and I want to thank the teams that worked diligently to successfully close this acquisition today,” says Lori Ryerkerk, Chairman and Chief Executive Officer.
“With the addition of M&M’s industry-renowned brands and product portfolios, we have established Celanese as the preeminent global specialty materials company. As one team, we will be better positioned to elevate the growth trajectory of Engineered Materials and to create value for our customers and shareholders.”
The company announced the acquisition of M&M in February 2022. As part of the transaction, Celanese has acquired a broad portfolio of engineered thermoplastics and elastomers, industry-renowned brands and intellectual property, global production assets and a world-class organization.
Celanese Corporation is a global chemical leader in the production of differentiated chemistry solutions and specialty materials used in most major industries and consumer applications. The Celanese portfolio of businesses utilizes the full breadth of Celanese’s global chemistry, technology and commercial expertise to create value for customers, employees, shareholders and the corporation. Celanese partners with customers to solve their most critical business needs and strives to make a positive impact on our communities and the world through The Celanese Foundation. Based in Dallas, Tx., Celanese employs approximately 8,500 employees worldwide and had net sales of $8.5 billion in 2021.
For more information about Celanese Corporation and its product offerings, visit www.celanese.com.
In a year packed with news surrounding tradeshow ups and downs for the brush industry, it was a little surprising that the article on Best Watercolor Brushes for 2022 far outperformed all postings for the year. That probably serves as another reminder as to how important brush industry products are to consumers across the world. Certainly, the controversy around the demise of Interbrush drove readers to the site, but it is heartening to see a lot of the “good news” articles also ranked high with loyal readers. Here are the top-performing news articles for 2022 from the www.brushwaremag.com website:
Brushware presented the best watercolor brushes sourced by top artist brush manufacturers. www.brushwaremag.com//best-watercolor-brushes-2022/
Ken Rakusin offered his perspective on Zahoransky exiting Interbrush. www.brushwaremag.com/gordon-brush-letter-to-zahoransky/
Toredo Fairs and FBMA – INDIA announced the inaugural BrushTech-2022 Exhibition that was held in July in New Delhi.
www.brushwaremag.com/new-brushtech-2022-to-showcase-brush-manufacturers-in-india/
Osborn’s parent company, Jason Industries, announced financial reorganization transitioning the company to private ownership. www.brushwaremag.com/osborn-parent-company-announces-reorganization/
Brushware magazine’s recap of the ABMA’s return to a live convention in 2022 www.brushwaremag.com/2022-abma-convention-notes/
Brush industry machine maker issued a December 2021 press release detailing the decision to exit Interbrush as an exhibitor. www.brushwaremag.com/zahoransky-will-no-longer-exhibit-at-interbrush/
Leading brush industry associations announce the new World Brush Expo just weeks after Interbrush announces the end of its run.
www.brushwaremag.com/abma-feibp-announce-new-brush-industry-trade-show-for-2024/
In February, Perlon announced the acquisition of NOWO Products Sp.z.o.o. in Kluczbork, Poland, a leading European producer of twisted monofilaments for the global paper industry.
www.brushwaremag.com/perlon-takes-over-nowo-products-sp-z-o-o/
Interbrush organizers responded to the loss of Zahoransky as an exhibitor with plans to seek feedback from associations and other top exhibitors on a path forward.
www.brushwaremag.com/interbrush-responds-to-zahoransky-loss/
Hillbrush was featured on an episode of BBC TV’s Inside the Factory about vacuum cleaner manufacturer and Hillbrush customer, Numatic.
www.brushwaremag.com/inside-the-factory-brushes-up-on-hillbrush/
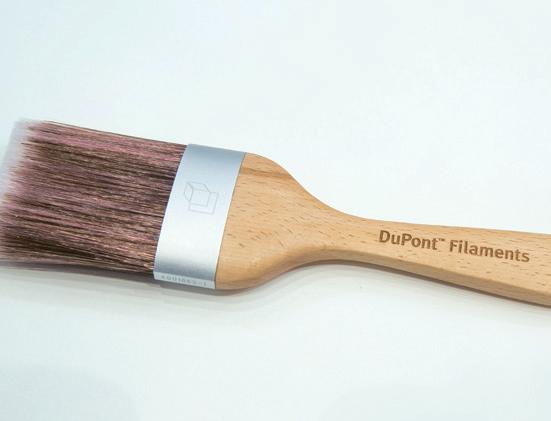
For more than 80 years, DuPont Filaments has been recognized as a leader in innovative synthetic filaments that enable brush manufacturers to address emerging trends and meet evolving consumer expectations.
The most important component of a toothbrush lies in the bristle. With outstanding industry expertise accumulated over the years, coupled with our proven technologies, DuPont Filaments is dedicated to the oral care brush industry with our nylon solutions under the brand names of DuPont™ Tynex®(nylon 612) and DuPont™ Herox®(nylon 610) . Leading toothbrush brands and manufacturers are able to produce very high quality brushes with a balance of consistent quality, wear performance and unmatched productivities in tufting and end-rounding by using DuPont filaments. As consumer trends in toothbrush are increasingly focused on the six major areas of 1) Visual Attractiveness, 2) Interdental Cleaning, 3) Plaque Removal, 4) Gum Comfort, 5) Gingival Cleaning and 6) Anti-microbial within the filaments, DuPont Filaments has been working closely with the leading global brands in oral care as well as toothbrush manufacturers by fulfilling these needs with our broad range of innovative products in the portfolio

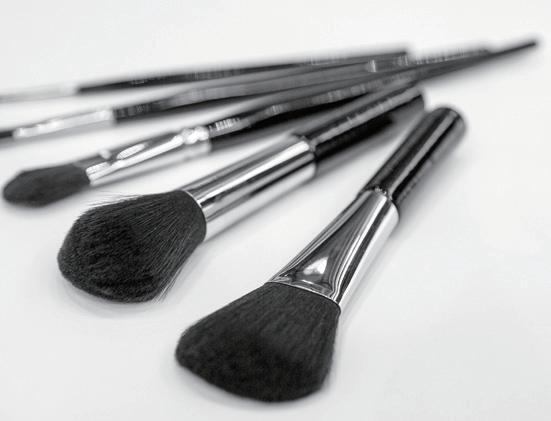
DuPont™ Natrafil® filaments, a pioneering filament from DuPont’s unique polyester based material, contain proprietary texturizing additives that create a structured surface that mimics animal hair. Natrafil® filaments offer a synthetic alternative to animal hair in premium cosmetic powder brushes with more consistency in the bristle while maintaining the touch-and-feel of premium animal hair. Studies have shown that brushes made with Natrafil® filaments have equal to superior pickup and release performance versus brushes made with animal hair.
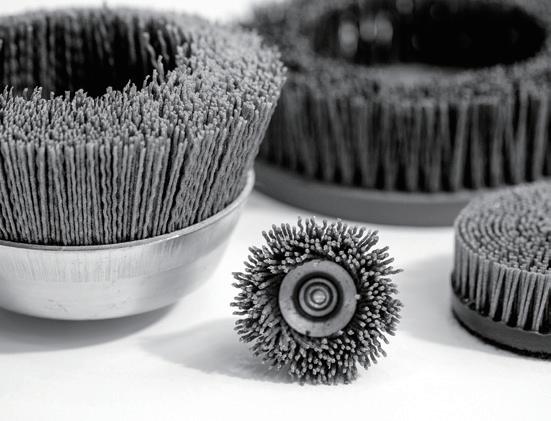
Like most industries, steel manufacturers are always looking for
ways to increase productivity. The emphasis is on getting more square feet of metal through the mill, cleaned and coated faster than ever before. To accomplish this, steel mills are using more aggressive cleaning solutions. The problem is that the cleaning brushes typically used were quickly degrading because many plastics used in the brush filaments can’t handle the solutions of the extremes of the PH scale. The technical resources at DuPont Filaments were able to help solve the problem by adding stabilizers to one of our nylon polymer formulations, effectively extending the pH range that these filaments can be used in. Brushes made with these filaments deliver cleaning performance over an improved service life, helping steel manufactures to achieve higher productivity. Another need voiced by customers is higher aggressiveness in metal finishing applications. DuPont™ Tynex® A filaments, a family of ceramic grit-containing filaments, was developed to meet this need.
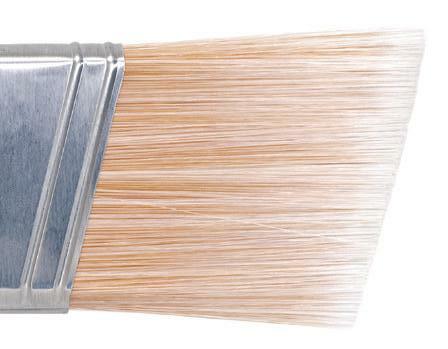
When manufacturers began changing their paints to water-based formulations, more people began using paintbrushes made with synthetic bristles because the hog bristles traditionally used in paintbrushes lost stiffness in water-based paints. Synthetics such as DuPont™ Tynex®, DuPont™ Chinex® and DuPont™ Orel® brand filaments quickly became popular choices. As paint manufacturers continue to improve their water-based formulations by reducing volatile organic compound (VOC) content, increasing solid loadings and decreasing drying times, there is an ongoing need for increasingly higher performing brushes. To meet this need, DuPont Filaments continues to innovate and help customize solutions. For example, we developed filaments with stiffer cross-section that can push higher viscosity paints more efficiently. We also changed the shapes of the filaments so that they not only pick up more paint from the can for faster application, but are easier to clean.
Recognition for being the global leader in filaments comes from our customers. You inspire us to make a difference in the world. We will continue to advance our innovations because we believe your BRUSH deserves the best FILAMENTS.





The ABMA’s Webinar Series is scheduled to resume in January with Downtime Tips presented by Adam Moran, Vice President for Sales of Vorne Industries, from 1:00 to 2:00 p.m. EST on Wednesday, January 25, 2023.

Downtime continues to be a huge source of lost productivity for the vast majority of manufacturers, but downtime is also often where the biggest gains can be made. Vorne knows that companies have the resources to improve, but they need the tools to leverage their resources, and this starts with understanding the corporate strategy. Vorne works with leaders at multiple levels of manufacturing companies to implement technology to turbo-charge continuous improvement and change management initiatives.
With more than twenty years of projects across thousands of companies in dozens of countries, Moran has helped companies, analyze, quantify and optimize stalled or failing continuous improvement initiatives through data and process change. Through this ABMA webinar, Moran will present ten simple and practical strategies for reducing downtime to help brush manufacturers regain lost productivity.
Wednesday, January 25, 2023
1:00 p.m. - 2:00 p.m. EST
REGISTRATION
www.abma.org/abmaeducationalinstitute
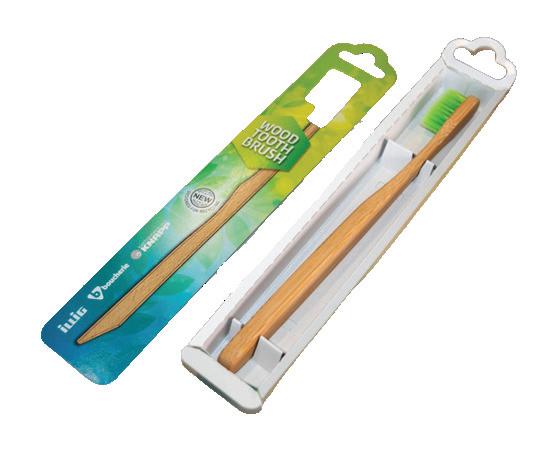
Boucherie’s partner ILLIG has expanded its product portfolio of modern and sustainable packaging solutions with the new HSU 650 — a customizable and modular packaging machine. The machine was designed with a quick and ergonomic change-over in mind, and the user-friendliness was improved with a new HMI. Furthermore, a 30 percent reduction in energy consumption was achieved with a new sealing station that is much more energyefficient. The output is high because of the generous forming and sealing area of 650 x 300 mm combined with a speed of 20 cycles per minute.
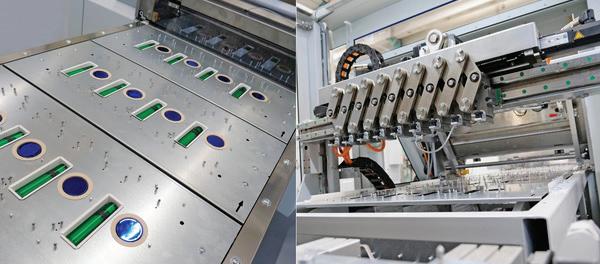

• Paper-to-paper blisters
• No glue required
• Side flap sealing
• Inlay as an option
• Automatic infeed available
• Forming/sealing area: 650 x 300 mm
• Speed: Up to 20 cycles per minute
• Blister depth: Up to 80 mm
• Sealing force: Up to 6 tons
For more information, visit www.boucherie.com.
The fourth annual Brushware Digital 40 utilizes statistics from www.brushwaremag.com to rank the top brands and influencers in the brush industry for 2022. We enjoy the opportunity each year to highlight the efforts of companies that are finding new and effective ways to market. Are you looking to make the annual list and get extra exposure for your company? Stay active and engaged with Brushware magazine by sharing press releases with news.brushware@goodwinworldmedia.com. Linkbacks from press releases should be a key part of any brand’s overall marketing and SEO strategy. Get your press releases planned out — we’re already tracking our list for 2023.
01. Interbrush
Industry-leading show ends after 45 years.
02. Zahoransky Machine maker’s exit from Interbrush was a top story.
03. India Brush Expo
New tradeshow was able to launch in May 2022.
04. The Inspired Home Show
The Show returned to action in March with more than 1,000 exhibitors.
05. Ken Rakusin CEO of Gordon Brush.
06. Nextstep Commercial Products
Cleaning products manufacturer with plants in Illinois and Ohio.
07. FEIBP
FEIBP Congress returned with a live event in Prague in September.
08. Nick Mallinger
President and CEO of Tanis Incorporated.
09. Ulrich Zahoransky Managing Director at ZAHORANSKY.
10. Robert Dous
Managing Director of ZAHORANSKY Automation & Molds GmbH and Chief Sales Officer of the ZAHORANSKY GROUP.
11. Loris Maestrutti
CEO of MGG Group.
12. Carlos Petzold
President of Bodam International/Borghi USA and former ABMA president.
13. Interclean
Amsterdam cleaning and hygiene show returned in May.
14. Phillip M. Perry
Brushware’s leading correspondent on economic issues.
15. Hillbrush
UK-based brush manufacturer celebrated 100 years in 2022.
16. Perlon
Filament supplier jumped up from 40th in 2021.
17. Bob Lawrence
Brushware’s senior industry correspondent offered a three-part series on inflation this fall.
18. Bart Boucherie Jr. General Manager for Boucherie.
19. Manfred Roth Owner of Roth Industries.
20. Bart Pelton President of the PelRay International Company.
21. Gordon Brush Brush manufacturer based in the City of Industry, Calif.
22. IHA International Housewares Association.
23. Andrew McIlroy Sales and Marketing Director at Perlon-Hahl and FEIBP President.
24. ABMA American Brush Manufacturers Association.
25. Greg Miller
President of The Mill-Rose Company and ABMA.
26. Global Shop Solutions Leading ERP platform for manufacturers.
27. Lisa Anderson
Brushware’s supply chain and business manufacturing strategy columnist.
28. Matthias Peveling General Manager for Wöhler Brush Tech.
29. Messe Freiburg Organizers of Interbrush.
30. PelRay International Company
Brush industry supplier for natural fibers and more.
31. Boucherie
Full-service manufacturer of brush manufacturing machinery.
32. World Brush Expo
New brush industry tradeshow set to fill the gap left by Interbrush.
33. Borghi USA
Borghi’s USA operation based out of Aberdeen, Md.
34. Fons Ceelaert General Manager for the FEIBP.
35. Wooster Brush Company
One of the oldest manufacturers of paint applicators in the U.S.
36. Coronavirus
Still impacted the industry in 2022.
37. ABMA Annual Convention
Returned with a live event in Bonita Springs, Fla.
38. Jeff Malish President of Malish Corp.
39. John C. Cottam Co-president at the Industrial Brush Corporation.
40. MGG Srl
Brush machine maker had a big presence at the 2022 ABMA Convention.

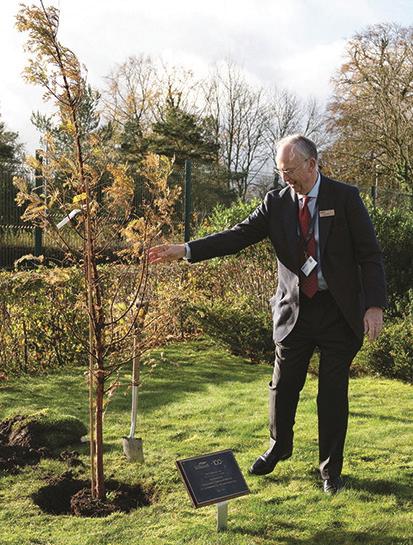
Hillbrush, the U.K.’s largest manufacturer of brushes and specialist cleaning tools, has rounded off a year of centenary celebrations with the official opening of a new warehouse and planting of a commemorative tree at Wiltshire headquarters. The new environmentally friendly “Centenary Warehouse” was declared officially open by Rt Hon Dr. Andrew Murrison, MP for Southwest Wiltshire, at a special reception held on Friday, November 18, 2022, for Hillbrush customers and suppliers. The celebratory event offered a hog roast, tours of the brush manufacturing facility and a chance to network with colleagues in the brush-making industry.
Hillbrush’s new 1,800 square meter Centenary Warehouse will provide the company with significantly more space to hold product on site and therefore ensure high stock availability to customers. Hillbrush currently manufactures more than 2,000 product lines at Mere. In line with Hillbrush’s focus on building a sustainable and environmentally friendly business, lighting inside the warehouse is movement activated to reduce energy and provide cost efficiency.
Hillbrush’s milestone birthday was also marked by the planting of a Redwood tree at the front of the offices by company Chairman, Philip Coward. Hillbrush was founded in 1922 by Fred and Bill Coward, Philip’s father and uncle. Today, Hillbrush is still independent, familyowned and run with Philip’s
son, Charlie Coward, and nephew, Andy Coward, as current joint managing Directors.
“Who would have thought when Fred and Bill Coward set up the original Hill Brush Company in 1922 to serve the needs of the many farms and agricultural businesses surrounding Mere that we would be celebrating 100 years on,” says Charlie Coward. “Hillbrush is a British manufacturing institution that has stayed true to its family values while innovating and diversifying to stay ahead of the times. It was a delight to celebrate the company’s centenary with our loyal customers and suppliers. We were delighted that our local MP the Rt Hon Dr. Murrison was able to share the day with us and officially open our new warehouse.”
Developing homegrown leaders is one of the most important things companies can do to pave the way for continued success. Global Shop Solutions, a global leader in ERP software for manufacturers, is proud to announce Cynthia Ashby and Ryan Carpenter were identified as Emerging Leaders by the National Tooling and Machining Association (NTMA).

NTMA is a U.S.-based trade association with 1,200 tool and die and precision manufacturing companies representing more than $35 billion in sales. Each year NTMA selects 15 individuals for recognition in the association’s Emerging Leaders Rising program. This program recognizes the hard work and accomplishments of future leaders in manufacturing.


“We’re very proud to have Cynthia and Ryan on our team,” says Dusty Alexander, President and CEO of Global Shop Solutions. “Cynthia attained her current position as Manager of the Financial Data Analysis Team by earning the respect, admiration and trust of senior leaders, supervisors, fellow employees and customers. As an operations consultant on our Continuous Improvement Team, Ryan has greatly impacted our customers by continuously helping them improve their fluency with our software and resolving issues from quote to cash. It’s employees like Cynthia and Ryan that have made Global Shop Solutions great today and into the future.”
Each Emerging Leaders class is profiled in The Record, NTMA’s Monthly Precision Manufacturing Magazine and are invited to attend Manufacturing Engage — the annual precision manufacturing conference — where they are recognized on stage during the awards ceremony. They are also invited to attend the annual Emerging Leaders Conference where they can connect with each other and continue to develop their leadership skills.
“It’s an honor to receive this award, but I wouldn’t be where I am today without the guidance of others,” says Ashby. “Becoming an Emerging Leader has motivated me to work harder and continue growing in my career while helping others succeed.”
“I am honored to be chosen as an Emerging Leader,” says Carpenter. “Every day I do my best to ensure our customers’ needs are met, and I hope to pioneer a path for new hires by demonstrating the effectiveness of young leaders.”

As part of our 125th-anniversary celebration, Brushware is offering an article related to the history of the magazine in each edition for 2023. For our first installment in the series, we present the following interview with the magazine’s previous owner, Norman Finegold.

Age: 74
Current Location: Fairway, Kansas (Kansas City Metro)
Role with Brushware: Owner from 1999 to 2019

When I graduated college, I went to work for Arthur Andersen, which was a big public accounting firm and I hated the life of a public accountant. I then got a job with a company called Cadence Industries as a corporate analyst — going into the divisions and doing internal audits. I was assigned to the publishing divisions and one of their divisions was Marvel Comics. The other company was Magazine Management. They were both in the same building on Madison Avenue in New York City. About two years later, they fired the controller of Marvel and put me in that role. So I was the controller of Marvel Comics for about five years. At the time, they didn’t do anything with movies, but they would produce 60 comic books a month — from Captain America to Hulk to Spiderman. I reported to Stan Lee.
Then, before buying Brushware, I moved around to various other publishing companies. I worked for Worldwide Magazines, which was the biggest exporter of US magazines. I was a controller there for a number of years but I got sick and tired of corporate America.
I married my wife, Karen, in June 1999. She had no experience whatsoever in magazine publishing but was game to learn. So we went out and bought Brushware magazine. Karen was the designer and did everything except, magazine sales, advertising sales and subscriptions. We became a good team and so in 2004, we bought a second trade publication called the American Window Cleaner Magazine
From the day-to-day perspective, what was your favorite part of working on Brushware?
My favorite part was working with the advertisers, they were so nice. I didn’t enjoy the actual travel to conventions, but once I was there I so enjoyed mingling with the advertisers. Yeah, I was there to sell advertising, but it was also wonderful just to BS with them.
From a day-to-day standpoint, it was always a challenge to keep an advertiser in or try to get a new one, and I sort of enjoyed that.
What would you say was the strength of Brushware during your time running the magazine?
Well, we had the highest circulation, so we had the strength of circulation and also the strength of great editorial. We focused on what we thought our advertisers and subscribers wanted to read, and I think that separated us.
Is there anything about the Brushware workflow/process that might come as surprise to readers and advertisers?
There was a lot of conversation and discussion about what articles to run. The editorial calendar took a lot more time than I think any advertiser or reader
would really realize. Bob Lawrence, Mark Battersby and every single writer would contribute ideas for what we should do each August. Karen and I would do that as well. Then Karen and I sat down and looked it all over, and I would ultimately decide which stories we would go with.
What have you been doing since moving on from Brushware?
I got myself involved in umpiring for high school baseball, which I totally love. I started with the lower-grade kids and got frustrated. However, at the same time that I was frustrated, it was imperative I learn the rules better than I knew. When I started, my knowledge of baseball and the rules came from watching the Yankees play baseball on TV, but there were so many more rules that I had to learn. There are so many rules that I probably still don’t know.
Now I’m doing a lot of seventh through 12th-grade baseball games and the higher you go, the more competitive is. It’s just wonderful, I so enjoy it.
I also do volunteer work at the University of Kansas Health System at the Cancer Center on Friday mornings. I have a beverage cart for the patients and families … they’re there for chemo or other treatments. The funniest thing happened to me while I was doing that. When somebody asks me for a cup of coffee, I say, “How do you take it?” Normally, the answer is black or one cream, 2 sugars, Sweet and Low, or something like that. About two months, a guy asked me for a coffee and I said, “How do you take it?” He said, “In a cup.”
I’ve also been going to grandkids’ soccer games and basketball games, watching them grow up. That’s fun. When I grew up, no one played soccer. I grew up in New York City, so … you know, we had beaches and we had other stuff to do. There are no beaches here in Kansas or Missouri, as you know, and the sports here are just amazing. It’s every sport in the world and they play it and everybody plays.
Is there anything about the current Brushware that stands out to you?
I love the publisher’s page. I like the length of it, the detail of it and you know, and I’m enjoying the articles.
What are your thoughts on Brushware celebrating 125 years?
Well, it’s absolutely amazing that the magazine is that old and I’m so happy that I was a part of the history of Brushware. I’m happy that you’re doing well with it and that I passed the baton to somebody who took it and is running with it. Karen and I were happy to be part of the industry and to meet some wonderful, wonderful people.


The supply chain has become an excuse. Although there has certainly been a slew of supply chain challenges that carry on with baby formula shortages, rail backlogs, computer chip issues, hurricane-induced delays, fertilizer scarcity and China’s zero-COVID policy delays, the supply chain should no longer be the excuse. Only the proactive will thrive in the years to come.
Start with the simple. Assess your end-to-end supply chain. Focus on your strengths and identify what must be shored up quickly, or should you completely change your supply chain strategy to better support your target customers’ needs? Why invest money in the bottom 20% of your customers or products that utilize precious resources that should be invested to take market share in what will be the largest opportunity since the Great Depression to solidify your position in your industry?
Instead, identify your target customers and ideal future state customers. Determine which products and services will meet their needs this year, next year and five years from now. Quickly assess a directionally correct path forward, and incorporate these findings into your SIOP (Sales, Inventory, Operations Planning, also known as S&OP) process. Your SIOP process will provide clarity on changes in customer demand patterns, the potential misalignment of demand and supply, decisions required (such as pricing and the reallocation of capacity) and manufacturing and supply chain adjustments needed to support your growth and profitability goals.
If you are heavily reliant on manufacturing in other countries, it is time to reevaluate. How confident are you that you will be able to support your key customers? Most likely, you should assess reshoring, nearshoring, friendly-shoring, expanding capacity or simply finding new partners closer to your customers. You must gain control over your ability to execute to support your customer’s needs.
Collaborate with your supply chain partners. Partner with customers in unique and creative ways for win-win solutions. For example, when working as VP of Operations for a mid-market manufacturer, we partnered with our number two customer to share demand information, coordinate agreements to share warehouse space and build collaborative truckloads. Rethink how to partner with customers and suppliers.
Evaluate your use of technology. Although more than 90 percent of clients can better leverage their ERP system and related technologies to a greater degree to drive customer service, on-time-in-full (OTIF), profitability and working capital improvements, it is no longer enough. Upgrading to a modern ERP system with advanced data analytics and business intelligence capabilities has become the new baseline to automate, digitize, predict and provide a superior customer experience. It is likely you’ll need to think bigger with artificial intelligence (AI), the internet of things (IoT), additive manufacturing and digital twins.
Stop using the supply chain as an excuse and start acting. There is no doubt the world is disrupted and will not realign on its own. Only the resilient and strong will survive, but most importantly, only the proactive and forward-thinking will thrive. Get ahead of the supply chain disruptions, or better yet, be disruptive and solidify your market position and EBITDA strength.
Lisa Anderson is the founder and president of LMA Consulting Group Inc., a consulting firm that specializes in manufacturing strategy and end-to-end supply chain transformation that maximizes the customer experience and enables profitable, scalable, dramatic business growth. She's released several eBooks which can be found at www.lma-consultinggroup.com/lma-books/







COMPANY: Pennelli Cinghiale

LOCATION: Cicognara-Mantova-Italy
TITLE: Managing Director
When did you start working in this industry and how did you get started?
My career started in 2004, but I have practically lived and breathed Pennelli Cinghiale since I was born. Ours is a traditional Italian family-run business that was founded in 1945 with the bold and visionary undertaking of my grandfather.
What aspect of working in the paintbrush industry do you enjoy the most?
The perfect balance between technique and creativity, which has allowed us, through years of experience, to develop a global brand that designs all the products necessary for painting.
What aspect of Pennelli Cinghiale makes you the most proud?
We have been acknowledged as a historic brand of national interest for Italy, and we have created a company museum where our history intertwines with pop art.
What are the main challenges you have faced in recent years and how is Pennelli Cinghiale facing them?
The main and constant challenge is to keep up with the development of paints. Chemical formulas are constantly evolving and we have to design products that are always up-to-date in order to achieve the best performance for their application. A good paint is not enough; you need a suitable tool to achieve perfect results, especially for professionals, who represent our main target group.
Do you foresee any permanent changes for Pennelli Cinghiale and the paintbrush industry in general?
The world of paints is moving more and more towards water-based formulations, requiring increasingly detailed research into synthetic filaments, which are the best to use with this type of formulation, and high-tech materials for a quick and easy application. Another essential aspect is the choice of components: we are now heading towards the use of FSC wood, recyclable plastic and recycled plastic.

Are there any news or initiatives taking place at Pennelli Cinghiale that you would like to share with us?
Over the past few years, we have invested heavily in research into new synthetic filaments which can guarantee the excellent performance of our paintbrushes with new-generation paints. Each filament mixture is produced – and their application is tested – in our laboratories. We are very proud of the results we have obtained, which is why we are very keen to protect our “recipes,” as in the case of Boartex®: a high-performance filament mixture that guarantees extraordinary results with both water and solvent-based paints.
The recruitment of skilled labor in general and young workers has been said to be a concern for the industry. In your opinion, how should this problem be addressed?
We have such a strong connection with our area, which is the industrial paintbrush and brush district, that this problem has never arisen. We have staff from different generations of the same family who have chosen to continue working with us; this is very important as well as significant.
Do you have any key advice in terms of business/leadership for young people whose aim is to reach a leadership role in this industry?
Develop a deep technical knowledge by listening to experience, but be brave enough to dare and innovate. Invest in digital even for a seemingly simple product like a paintbrush. Today’s consumers live in the digital world and they collect information before making any purchase decisions. This is why it is important to create strong cross-selling within the painting industry so that nobody is disappointed by the wrong toolpaint combination.
This year, Pennelli Cinghiale attended the EISENWARENMESSE International Hardware Fair in Cologne, one of the main events for our industry. On this occasion, we presented new products that we have designed according to international building trends and based on the technical requirements of different countries, with a special focus on environmental impact.
What do you like to do when you are not at work?
I am a contemporary art lover, perhaps because art is the most creative and lofty result originating from a paintbrush. I cannot
help but try to imagine the brush stroke and the artist’s gesture lying behind each mark on the canvas.
I love attending live shows and I have missed them a lot over the past two years. I caught up with summer concerts: from Tears for Fears and Ben Harper to Dua Lipa and Lady Gaga. The energy you feel when listening to live music cannot be compared to streaming on Spotify.
My favorite team is our team of Cinghiale professionals. Joking aside, our brand has had strong connections with excellent sports teams, my grandfather being a super fan. Our museum still houses important memorabilia of Inter FC since my grandfather was a huge fan, as well as that of the great cycling champions.
Do you have any advice for business trips?
Yes! Never forget a piece of Parmesan cheese in your luggage for your customer, it is the best gift you can give! Everyone appreciates the real taste of Italy.
Can you tell us one thing about you that people might find surprising?
I am a young woman, isn’t that enough for this industry?
What have you learned in life or in the industry?
People are stronger than products. Creating excellent products designed and manufactured in Italy is what Pennelli Cinghiale has been doing in the factory every day since 1945; but above all, I have learned that being a partner to your customer and not just a supplier makes the real difference.
Is there any question or topic we have not covered that you would like to comment on?
Pennelli Cinghiale can count on a strong heritage thanks to TV advertising, which is still alive in the Italian culture. My grandfather started right after the Second World War and now we are the third generation of a family-run business based on ethics and reliability. Today our goal is to bring the company to the international market with high-quality Made-in-Italy products, 4.0 production technology and digital marketing.
Learn more about Pennelli Cinghiale at www.pennellicinghiale.com.

The economy will slow perceptively in 2023. Less robust activity in sectors such as housing, retailing and manufacturing will put downward pressure on growth and contribute to a deceleration in profits. Companies can prepare for a tougher environment by tracking cash flow closely, investing selectively and hiring prudently.
Businesses are preparing for a more challenging operating environment in 2023. After two years of frenetic commercial activity fueled by a post-pandemic recovery, strengthening headwinds will tap the brakes on a robust economy. Among the culprits: rising inflation, higher interest rates, a softening housing market, continuing supply chain disruptions, declining capital investments and escalating costs for wages and energy.

The loss of some helpful economic initiatives is only adding to the downward pressure. “Government stimulus packages, ultra-low interest rates and strong money supply creation had been helping to compel business activity until mid2022,” says Anirban Basu, Chairman and CEO of Sage Policy Group (www. sagepolicy.com). “All those fundamentals have been inverted.”
Economists are adjusting their forecasts to reflect the new normal. “We project real Gross Domestic Product (GDP) will increase by 1.4% in 2023,” says Bernard Yaros Jr., Assistant Director and Economist at Moody’s Analytics (www.economy.com). “The expectation for 2022 is 1.6%. Both figures represent much slower activity than the 5.7% increase of 2021.” (GDP, the total of the nation’s goods and services, is the most commonly accepted measure of economic growth. “Real” GDP adjusts for inflation.)
All of the above conditions should have a depressing effect on corporate profits, projected by Moody’s Analytics to increase at a 5.2% clip in 2023. That represents a decline from the 7.9% figure anticipated for 2022. Both estimates are much lower than the 25% increase of 2021.
Reports from the field reflect early glimmers of a less robust business environment. “In the first half of 2022 many of our members were still experiencing high demand,” says Tom Palisin, Executive Director of The Manufacturers’ Association, a York, Pa., based regional organization with more than 390 member companies (www.mascpa.org). “But as the year progressed there was a significant slowdown caused by the labor shortage, inflationary issues and global events.”
With its diverse membership in food processing, defense, fabrication and machinery building, Palisin’s association is something of a proxy for all American industry. The good news is that a strong employment environment at the association’s members — as well as at companies elsewhere in the nation — is helping alleviate the negative impact of the economy’s headwinds. Moody’s Analytics expects a continuation of that favorable condition, forecasting an unemployment rate of 4.1% by the end of 2023. That’s not much higher than the 3.7% rate of late 2022. (Many economists peg an unemployment rate of between 3.5% and 4.5% as the “sweet spot” that balances the risks of wage escalation and economic recession).
On the downside, low unemployment usually increases business costs by forcing employers to boost wages to attract scarce workers. Today is no exception. “Our organization surveys members annually on their baseline entry-level hourly wage figure,” says Palisin. “Increases typically run around 2.5% to 3%, but the figure was 8% in 2022.” While Moody’s Analytics forecasts a continuation of labor cost increases, they should moderate to 3.5% in 2023, down from their current 5%. Even so, those increases are expected to affect business profitability.
The tight labor market hits business profitability not only in the form of higher wages but also in a scarcity of the very workers needed to produce goods and services. “Employers will be very focused on labor availability in 2023 as Baby Boomers continue to retire and the supply of immigrant labor has yet to fully recover from severe pandemic-related disruptions,” says Yaros. “Despite a slowing economy, layoffs are low, indicating that businesses are holding onto labor in a reaction to the hiring difficulties they encountered during the pandemic.”
When will workforce availability increase? Not anytime soon, say observers. “The labor market is going to be tight for years to come,” says Bill Conerly, Principal of his own consulting firm in Lake Oswego, Oregon (www.conerlyconsulting.com). “The decade from 2020 to 2030 is expected to have the lowest growth of working age population since the Civil War. One reason is the retirement of the Baby Boomers; another is the low rate of immigration over the last few years.”
Palisin agrees that a labor shortage is going to be a long-term condition and says his members are making moves to lessen the effect. “Employers are trying to be creative in the way they keep and retain workers not only by offering higher salary rates but also by extending benefits and encouraging work flexibility. They are also investing more in automation for labor-intensive tasks.”
The accompanying article suggests an economic slowdown as the likeliest scenario for 2023. But what are the chances of a recession or an actual decline in business activity?
While Moody’s Analytics sets the odds at 50-50, avoiding a recession will require a bit of luck. “The U.S. economy will enter 2023 being vulnerable to anything that might go wrong,” says Bernard Yaros Jr., Assistant Director and Economist at Moody’s Analytics (www.economy.com). He pointed to risks such as a resurgence of the pandemic in China, a worsening of the Ukraine war and another energy supply shock that would hit consumer pocketbooks.
“Avoiding a recession will also depend on a couple of things going right,” adds Yaros. “The ebullient labor market will need to cool down at a pace that softens wage increases without sparking economic turmoil. Most important, the Federal Reserve will need to successfully tame inflation without allowing interest rates to spike the economy.”
Yaros, however, is optimistic. “We think inflation will steadily slow from more than 8% to a pace that is consistent with the central bank’s 2% target by the end of 2023.”
2.3
1.7
Sources:
If high employment levels can stress the bottom lines of many employers, they can also fill workers’ pockets with spendable cash and flush consumers can help drive a robust retail sector, an important slice of the economic pie. “Wage rates, as measured by the Employment Cost Index (ECI), remain very high by the standards of the last couple of decades,” says Scott Hoyt, Senior Director of Consumer Economics for Moody’s Analytics (www.economy.com).
Even so, activity is decelerating at the nation’s stores. “2023 is likely to be a challenging year for retail, with growth only at 2.8%,” says Hoyt. The projected growth is well below the sector’s historic 4.3% average as well as the 8.3% increase expected when 2022 numbers are finally tallied. The recent trend is well below 2021 when a 17.5% increase was fueled by a consumer shift away from services and toward goods.
A slowing economy is contributing to retail’s deceleration, as is a penchant for post-pandemic consumers to shell out less cash on merchandise and more on services such as hotels, travel and restaurants. Any softening of inflation from recent highs should also depress results since retail activity is measured in nominal terms.
Higher wages and scarce workers are not the only forces depressing business profits. Another major factor is a rise in interest rates — the Fed’s favorite tool for fighting inflation. “The purpose of increasing interest rates is to drive down demand,” says Palisin. “So, our members are expecting to see a decrease in new orders that will impact the overall economy. Also, many of our companies have lines
World Bank; projections by Moody’s Analytics.
of credit that rely on floating interest rates. Rising rates will take a hit to the bottom line as companies decide whether to utilize those lines to support their cash flow and investments.”
Adding further downward pressure are disruptions in the delivery of goods that continue to plague companies large and small. “Supply chain problems have improved over the past year, but there hasn’t been the significant resolution we had hoped for,” says Palisin. “Random shortages in materials and deliveries are still plaguing our members and that’s leading to backlogging of orders; companies just can’t get the materials or parts.”
The Russia-Ukraine war has worsened the situation, notes Palisin. “The war has created an energy crunch and a disruption in raw materials from that region that have trickled through the economy to exacerbate the supply chain issues.” Companies are responding by moving to reduce their reliance on China, he adds. “They’re sourcing from additional countries to reduce disruptions.”
Housing, a key driver of the economy, has also entered a period of correction. “The underlying dynamics of the housing market are changing as lower affordability spurred by higher prices and mortgage rates is starting to significantly weigh on demand,” says Yaros.
affordability has sunk to its lowest level since late 2007, the 30-year fixed mortgage rate is within striking distance of its highest level in over a decade, leading to a decline in purchase applications.
A tight housing supply is only adding to upward pricing pressure. The inventory of for-sale homes remains historically low and new ones will be scarce on the ground. “We expect housing starts to fall by 1.8% and 2% in 2022 and 2023 respectively,” says Yaros. “This compares with a 15.1% increase in 2021.”
There’s only so much the industry can do to bolster the housing supply — one big reason being the above-mentioned labor shortage. “The unemployment rate for experienced construction workers is about as low as it’s ever been,” said Yaros. “Capacity limits have delayed housing completions and contributed to a record number of housing units in the pipeline.”

One bright spot in the housing picture: mortgage credit quality has never been better. “The percent of loans delinquent and in foreclosure is at a record low,” says Yaros. “This goes to the stellar underwriting standards since the financial crisis and borrowers’ credit scores are much higher.” While lending standards for mortgage loans are now tightening, the credit spigot is unlikely to seize up as it did during the financial crisis of 2008.
Given the above concerns, it’s little wonder corporate confidence is taking a hit. As the calendar turns to a new year, companies are responding to soaring interest rates and inflation by scaling back the capital investments that help fuel the economy. “Up until the second
half of 2022 most companies were taking advantage of low rates to plan ahead for equipment purchases and expansion opportunities,” says Palisin. “Now, though, many are taking second looks at anything planned for 2023.”
Businesses are also taking steps to increase their liquidity to cushion against tough times. “We are all going to need to watch our cash flow,” says Palisin. “Most of our members anticipate a slowdown in orders; and as a result, they are holding off on some future investments and pulling back in hiring.”
Uncertainty is the name of the game, and that makes planning difficult. “We are faced with a kind of a two-sided coin,” says Palisin. “The positive side represents strong current orders and a continuing need for more workers; while the negative side represents inflationary pressures and global headwinds.”
Which side of the coin will show its face in 2023? Economists advise watching a few key indicators. “In the early part of the year companies should keep an eye on what is happening with the cost of money,” says Basu of Sage Policy Group. “Inflation is the driver of near-andmedium term economic outlooks.” A second vital element, he says, is the employment picture. “Employers should watch for any emerging weakness in the labor market.” Finally, what about consumers? “Any softening of spending would point to a looming recession.”
0502100000 Pigs, Hogs, Boars Bristles & Hair & Waste Thereof (kg)
September 2022 YTD September 2021 YTD YTD Growth%
Country Value Qty Value Qty Value Qty
China 4,553,493 131,338 4,753,445 95,486 -4.21 37.55
Germany 3,686 5 -100.00 -100.00
World Total 4,553,493 131,338 4,757,131 95,491 -4.28 37.54
0502900000
September 2022 YTD September 2021 YTD YTD Growth%
Country Value Qty Value Qty Value Qty
China 117,846 605 12,335 118 855.38 412.71
New Zealand 5,326 45
United Kingdom 165,381 768
World Total 288,553 1,418 12,335 118 2239.30 1101.69
4417002000
September 2022 YTD September 2021 YTD YTD Growth %
Country Value Qty Value Qty Value Qty
Belgium 46,310 37,800
Brazil 4,150,088 4,917,747 1,997,698 2,076,637 107.74 136.81
Cambodia 166,649 305,695
Canada 2,950 10,000 -100.00 -100.00
China 1,095,950 2,061,779 886,530 1,753,645 23.62 17.57
Colombia 12,098 27,856 4,478 13,020 170.17 113.95
El Salvador 6,948 10,035
Honduras 3,486,275 6,445,805 3,183,554 6,276,831 9.51 2.69
Hong Kong 18,900 100,000 16,154 106,000 17.00 -5.66
India 2,646 668
Indonesia 682,962 778,192 470,548 445,869 45.14 74.53
Japan 3,572 288
Mexico 273,489 468,811 64,720 130,447 322.57 259.39
Pakistan 8,320 18,684 -100.00 -100.00
Sri Lanka 8,260 21,550
Thailand 16,958 39,901
World Total 9,971,105 15,216,127 6,634,952 10,831,133 50.28 40.49
4417004000 Paint Brush And Paint Roller Handles, Of Wood (x)
September 2022 YTD September 2021 YTD YTD Growth% Country Value Qty Value Qty Value Qty
Australia 4,949 49 -100.00 -100.00
Belgium 6,776 1 -100.00 -100.00
China 870,159 238,374 1,233,741 279,868 -29.47 -14.83
Czech Republic 24,328 1,407 -100.00 -100.00
Germany 82,318 7,368 95,476 7,953 -13.78 -7.36
Indonesia 552,416 172,939 561,598 111,616 -1.63 54.94
Italy 11,794,861 677,355 11,706,350 689,769 0.76 -1.80
Kyrgyzstan 18,761 1,882
Poland 1,492,804 164,510 896,444 105,010 66.53 56.66
Sri Lanka 22,106 9,676
Thailand 54,469 4,609 23,562 1,513 131.17 204.63
World Total 14,887,894 1,276,713 14,553,224 1,197,186 2.30 6.64
4417006000
Brush Backs, Of Wood (no)
September 2022 YTD September 2021 YTD YTD Growth%
Country Value Qty Value Qty Value Qty
Canada 610,793 1,317,946 529,572 1,407,940 15.34 -6.39
China 150,632 516,953 125,727 376,557 19.81 37.28
Indonesia 524,498 1,260,454 377,901 793,951 38.79 58.76
Spain 5,464 116 -100.00 -100.00
Sri Lanka 731,815 1,362,519 535,586 1,037,080 36.64 31.38
World Total 2,017,738 4,457,872 1,574,250 3,615,644 28.17 23.29
4417008010
September 2022 YTD September 2021 YTD YTD Growth%
Country Value Qty Value Qty Value Qty
Austria 45,635 2,833 -100.00 -100.00
Brazil 336,995 131,594 132,438 78,595 154.45 67.43
Canada 237,670 4,414,486 143,975 1,835,330 65.08 140.53
China 1,388,919 1,284,746 1,288,795 1,487,885 7.77 -13.65
El Salvador 7,554 1,550
Finland 2,034 252
Germany 26,043 1,345 19,240 1,404 35.36 -4.20
Honduras 120,960 58,500 267,201 137,162 -54.73 -57.35
India 135,692 25,228 20,500 5,203 561.91 384.87
Indonesia 44,046 21,671 -100.00 -100.00
Italy 37,657 452,286 60,178 6,124 -37.42 7285.47
Japan 8,186 125
Mexico 1,989,864 513,453 1,895,746 611,126 4.96 -15.98
Netherlands 2,775 136
Spain 136,783 50,130 149,758 48,489 -8.66 3.38
Sri Lanka 18,834 3,840 20,826 15,522 -9.56 -75.26
Sweden 39,700 1,219,961 72,770 2,359 -45.44 51615.18
Switzerland 21,563 799 -100.00 -100.00
Taiwan 192,932 594,078 521,764 59,591 -63.02 896.93
Ukraine 4,590 206 -100.00 -100.00
United Kingdom 4,898 100
Vietnam 68,029 13,575 84,265 10,578 -19.27 28.33
World Total 4,755,525 8,765,385 4,793,290 4,324,877 -0.79 102.67
4417008090 Tools Tool/brush/broom Bodies Shoe Last/tree, Wood (x) September 2022 YTD September 2021 YTD YTD Growth%
Country Value Qty Value Qty Value Qty
Australia 8,610 950
Austria 28,541 1,055 17,457 530 63.49 99.06
Brazil 84,385 30,112 35,947 20,063 134.75 50.09
Canada 1,233,341 194,436 523,404 114,955 135.64 69.14
Chile 4,299,337 1,703,557 3,070,040 1,273,134 40.04 33.81
China 6,082,040 1,005,269 5,337,959 1,156,690 13.94 -13.09
Colombia 3,170 1
Croatia 6,968 45 11,151 80 -37.51 -43.75
Czech Republic 19,704 630 40,808 1,566 -51.72 -59.77
Estonia 92,373 810 31,707 423 191.33 91.49
Finland 20,834 1,423 -100.00 -100.00
France 62,847 1,828 14,563 435 331.55 320.23
Germany 120,806 968 141,007 930 -14.33 4.09
Hong Kong 2,050 103 -100.00 -100.00
India 1,517,120 23,316 1,500,013 25,318 1.14 -7.91
Indonesia 83,763 31,829 77,657 28,498 7.86 11.69
Israel 4,828 324 2,639 493 82.95 -34.28
Italy 35,803 1,088 11,709 113 205.77 862.83
Japan 1,558,950 19,728 2,281,694 30,920 -31.68 -36.20
Lithuania 3,269 10 -100.00 -100.00
Malaysia 7,793 69 -100.00 -100.00
Mexico 418,193 83,047 322,805 155,740 29.55 -46.68
Nepal 1,132,072 18,009 452,971 7,209 149.92 149.81
Netherlands 2,301 75
Pakistan 2,425 58 -100.00 -100.00
Philippines 62,375 10,153 8,555 1,296 629.11 683.41
Poland 13,440 244
Spain 44,093 1,563 24,441 432 80.41 261.81
Sri Lanka 539,688 254,155 313,968 200,520 71.89 26.75
Switzerland 5,270 29 12,328 62 -57.25 -53.23
Taiwan 110,629 10,133 109,600 9,012 0.94 12.44
Tanzania 7,165 50
Thailand 3,000 38
Turkey 11,834 16
Ukraine 136,604 4,780 93,563 5,289 46.00 -9.62
United Kingdom 30,475 272 23,959 646 27.20 -57.89
Vietnam 10,389 102 4,132 22 151.43 363.64
World Total 17,770,114 3,398,612 14,500,448 3,036,039 22.55 11.94
9603100500
Wiskbrooms,brm Corn,lt=.96 Ea,lt 61,655 Dz Cal Yr (no)
September 2022 YTD September 2021 YTD YTD Growth%
Country Value Qty Value Qty Value Qty
China 19,666 29,500 10,922 14,500 80.06 103.45
Mexico 15,845 23,460 10,680 15,840 48.36 48.11
Vietnam 2,900 5,800
World Total 38,411 58,760 21,602 30,340 77.81 93.67
9603101500
September 2022 YTD September 2021 YTD YTD Growth%
Country Value Qty Value Qty Value Qty
Australia 3,950 1 -100.00 -100.00
China 57,167 205,256 62,757 231,056 -8.91 -11.17
Colombia 15,636 22,200
Japan 7,471 139 32,660 130,640 -77.12 -99.89
Mexico 4,688 6,250
Vietnam 5,232 9,600 5,191 9,984 0.79 -3.85
World Total 90,194 243,445 104,558 371,681 -13.74 -34.50
9603103500
September 2022 YTD September 2021 YTD YTD Growth%
Country Value Qty Value Qty Value Qty
China 104,229 106,604 57,453 54,175 81.42 96.78
Germany 3,764 2,000 -100.00 -100.00
Israel 12,622 775 -100.00 -100.00
Korea, South 7,755 1,704 -100.00 -100.00
Mexico 167,563 168,805 729,549 373,910 -77.03 -54.85
Sweden 2,993 300
Taiwan 3,000 1,000 4,113 356 -27.06 180.90 Thailand 4,600 2,500
Vietnam 5,712 1,200 17,963 18,400 -68.20 -93.48
World Total 288,097 280,409 833,219 451,320 -65.42 -37.87
9603105000 Brooms,of Brm Corn,lt=.96 Ea,gt=121,478 Dz,cal Yr (no)
September 2022 YTD September 2021 YTD YTD Growth%
Country Value Qty Value Qty Value Qty
China 10,230 47,000
Mexico 7,526 8,160 2,019 3,300 272.76 147.27 Vietnam 2,390 2,950 -100.00 -100.00
World Total 17,756 55,160 4,409 6,250 302.72 782.56
9603106000 Other Brooms,of Broomcorn,valued Over .96 Each (no)
September 2022 YTD September 2021 YTD YTD Growth%
Country Value Qty Value Qty Value Qty
China 18,048 8,460 25,850 15,960 -30.18 -46.99
Latvia 8,230 1,290
Mexico 7,310,210 2,975,326 8,195,048 3,664,168 -10.80 -18.80 World Total 7,336,488 2,985,076 8,220,898 3,680,128 -10.76 -18.89
9603109000 Brooms & Brushes,of Twigs Or Veg Material,nesoi (no)

September 2022 YTD September 2021 YTD YTD Growth%
Country Value Qty Value Qty Value Qty
Australia 4,704 5 Bangladesh 2,522 50 3,225 55 -21.80 -9.09 Brazil 2,514 1,005
Cambodia 10,493 1,590 Canada 17,784 3,703 China 299,966 320,996 262,600 389,641 14.23 -17.62
Colombia 15,607 29,059 6,116 9,592 155.18 202.95 Denmark 4,883 5 -100.00 -100.00 Germany 19,314 27,290 85,556 40,352 -77.43 -32.37
Guatemala 3,582 2,700
Guyana 2,205 1,000 -100.00 -100.00
India 28,574 17,886 58,264 45,776 -50.96 -60.93
Israel 41,070 47,012 6,690 3,400 513.90 1282.71
Italy 3,881 2,451
Japan 8,181 229 6,951 186 17.70 23.12
Korea, South 33,353 9,760 44,883 83,022 -25.69 -88.24
Lebanon 2,450 98
Mexico 143,076 126,321 30,988 10,881 361.71 1060.93
Netherlands 26,179 31 8,017 12 226.54 158.33
Philippines 87,696 73,544 82,946 55,600 5.73 32.27
Spain 9,702 1,320
Sri Lanka 685,697 565,317 812,829 964,549 -15.64 -41.39
Sweden 10,754 603 2,048 200 425.10 201.50
Switzerland 5,102 40 -100.00 -100.00
Taiwan 16,852 4,432 10,278 606 63.96 631.35
Thailand 81,238 34,073 61,674 51,033 31.72 -33.23
Turkey 7,075 3,500 -100.00 -100.00
Ukraine 20,620 5,313 2,020 450 920.79 1080.67
UAE 7,808 20
United Kingdom 42,695 34,648 2,498 360 1609.17 9524.44
Vietnam 255,370 222,221 179,452 134,981 42.31 64.63
World Total 1,881,682 1,531,677 1,686,300 1,795,241 11.59 -14.68
September 2022 YTD September 2021 YTD YTD Growth%
Country Value Qty Value Qty Value Qty
Cameroon 3,059 21,528
China 8,399,904 45,504,903 7,680,412 37,672,545 9.37 20.79
Germany 12,698 150,000
Hong Kong 2,880 24,000 -100.00 -100.00
Italy 4,871 710 -100.00 -100.00
Korea, South 12,941 58,828 9,715 44,160 33.21 33.22
Malaysia 240,666 389,656 333,157 703,280 -27.76 -44.59
Mexico 1,518,900 12,001,056 790,377 5,999,712 92.17 100.03
Taiwan 18,750 52,096 -100.00 -100.00
United Kingdom 44,338 218,414 5,508 1,224 704.97 17744.28
Vietnam 2,106 14,040 -100.00 -100.00
World Total 10,232,506 58,344,385 8,847,776 44,511,767 15.65 31.08
September 2022 YTD September 2021 YTD YTD Growth%
Country Value Qty Value Qty Value Qty
China 5,211,058 65,832,909 4,823,301 40,336,713 8.04 63.21
France 2,728 12,500 18,167 370,225 -84.98 -96.62
Germany 911,704 5,531,393 337,643 2,154,118 170.02 156.78
Hong Kong 8,226 66,320 6,510 21,000 26.36 215.81
India 23,598 124,200 4,435 201,600 432.09 -38.39
Ireland 36,673 164,889 -100.00 -100.00
Italy 50,485 1,760,406 124,189 2,143,197 -59.35 -17.86
Japan 56,784 153,960 12,062 31,680 370.77 385.98
Korea, South 64,756 395,670 80,139 2,163,785 -19.20 -81.71
Malaysia 19,132 61,726 5,651 1,600,000 238.56 -96.14
Mexico 21,292 262,614
Netherlands 61,767 197,000 -100.00 -100.00
Pakistan 52,149 313,128
Poland 18,013 47,626 -100.00 -100.00
Spain 3,336 2,520 -100.00 -100.00
Taiwan 7,864 164,988 25,161 1,679,020 -68.75 -90.17
Thailand 6,540 200,000 -100.00 -100.00
UAE 4,000 32,000
Vietnam 4,064 10,512
World Total 6,437,840 74,722,326 5,563,587 51,313,373 15.71 45.62
Country Value Qty Value Qty Value Qty
Australia 17,888 4,580 5,884 690 204.01 563.77
Austria 17,336 1,623 33,965 3,293 -48.96 -50.71
Brazil 6,120 1,224 8,138 11,500 -24.80 -89.36
Canada 258,140 90,104 171,716 57,572 50.33 56.51
China 24,463,073 24,103,201 26,774,860 25,601,146 -8.63 -5.85
Colombia 26,405 8,100 16,905 5,370 56.20 50.84
Denmark 2,178 92 22,914 2,315 -90.49 -96.03
Estonia 5,882 503 -100.00 -100.00
France 84,872 8,174 58,818 11,063 44.30 -26.11
Germany 2,311,975 1,056,887 1,412,279 233,342 63.71 352.93
Guinea 3,078 133
Hong Kong 62,480 10,930 30,686 11,856 103.61 -7.81
Hungary 25,546 20,000 -100.00 -100.00
India 7,770 1,416
Ireland 90,391 8,653 -100.00 -100.00
Israel 47,135 10,900 -100.00 -100.00
Italy 262,364 38,280 138,065 16,753 90.03 128.50
Japan 176,309 24,456 289,205 38,608 -39.04 -36.66
Korea, South 549,947 367,835 385,106 429,775 42.80 -14.41
Malaysia 47,072 8,167 22,991 4,124 104.74 98.04
Mexico 62,927 39,371 31,863 3,736 97.49 953.83
Netherlands 105,242 9,192 25,156 7,184 318.36 27.95
Norway 2,113 1,656 -100.00 -100.00
Philippines 23,300 2,532
Portugal 2,071 144
Romania 4,410 615 -100.00 -100.00
Russia 41,844 51,702 6,113 2,050 584.51 2422.05
Singapore 3,500 1,000
Slovenia 3,748 155 -100.00 -100.00
Spain 11,047 3,712 37,183 7,896 -70.29 -52.99
Sri Lanka 140,937 26,446 85,482 10,905 64.87 142.51
Sweden 23,988 2,194 101,372 13,873 -76.34 -84.19
Switzerland 32,943 10,524 60,600 22,386 -45.64 -52.99
Taiwan 289,755 145,776 244,195 124,700 18.66 16.90
Turkey 16,754 4,984 6,314 2,002 165.35 148.95
UAE 90,272 8,777 4,442 1,810 1932.24 384.92
United Kingdom 828,036 119,607 790,641 139,727 4.73 -14.40
Vietnam 31,502 57,332 87,411 51,497 -63.96 11.33
World Total 30,001,125 26,208,495 31,031,529 26,857,655 -3.32 -2.42
9603302000 Artists Brushes,writing Brush,cosmet Br,lt=.05 Ea (no)
September 2022 YTD September 2021 YTD YTD Growth% Country Value Qty Value Qty Value Qty
China 2,137,255 87,062,916 2,948,387 112,362,075 -27.51 -22.52
France 61,122 1,849,962 237,030 5,589,000 -74.21 -66.90
Germany 222,685 8,485,056 55,541 2,852,400 300.94 197.47
India 84,793 5,018,094 119,614 6,239,710 -29.11 -19.58
Italy 1,328,515 88,879,400 1,283,448 83,695,250 3.51 6.19
Japan 50,700 2,150,000 2,250 100,000 2153.33 2050.00
Korea, South 147,733 5,635,000 8,302 265,462 1679.49 2022.71
Mexico 347,033 11,114,732
Taiwan 47,905 1,964,400 68,861 2,688,952 -30.43 -26.95
Thailand 67,931 2,612,731
United Kingdom 3,174 122,077 11,822 454,692 -73.15 -73.15
World Total 4,498,846 214,894,368 4,735,255 214,247,541 -4.99 0.30
9603306000 Artists Brushes,writing Br,cosmetic Br,gt.10 Ea (no)
September 2022 YTD September 2021 YTD YTD Growth%
Country Value Qty Value Qty Value Qty
Australia 35,087 6,521 6,565 431 434.46 1412.99
Austria 15,474 3,126
Bangladesh 435,976 3,332,771 542,021 3,884,517 -19.56 -14.20
Belgium 19,191 5,040 44,660 110,000 -57.03 -95.42
Burma 8,786 73,764 -100.00 -100.00
Cambodia 27,331 14,152
Canada 49,989 3,898 90,667 4,657 -44.87 -16.30
China 204,488,461 341,738,934 199,401,926 360,818,815 2.55 -5.29
Cyprus 9,774 186 2,551 69 283.14 169.57
Denmark 398,031 32,526 112,915 17,661 252.50 84.17
Dom. Republic 931,405 1,150,195 918,633 1,059,990 1.39 8.51
France 1,170,335 1,316,028 1,472,387 711,915 -20.51 84.86
Germany 3,093,634 1,929,767 4,443,966 5,452,580 -30.39 -64.61
Hong Kong 213,244 179,621 1,325,546 848,508 -83.91 -78.83
India 3,734,951 6,127,449 4,293,863 5,857,735 -13.02 4.60
Indonesia 25,696 69,600 25,582 179,808 0.45 -61.29
Ireland 37,358 36,706 -100.00 -100.00
Israel 19,066 6,498 55,591 31,678 -65.70 -79.49
Italy 1,153,985 388,863 1,100,614 329,025 4.85 18.19
Japan 4,540,298 947,320 4,759,152 1,404,729 -4.60 -32.56
Korea, South 733,265 1,195,546 2,270,346 2,613,253 -67.70 -54.25
Lithuania 27,695 59,737 84,934 266,894 -67.39 -77.62
Malaysia 81,026 73,273 10,781 55,200 651.56 32.74
Mauritius 1,318,754 189,871 923,679 179,214 42.77 5.95
Mexico 23,495,781 133,955,663 17,499,175 109,524,806 34.27 22.31
Montenegro 4,289 1,945 -100.00 -100.00
Netherlands 14,571 1,870 366,274 26,079 -96.02 -92.83
Pakistan 13,500 6,000 3,800 2,000 255.26 200.00
Poland 38,361 4,664 19,025 7,374 101.63 -36.75
Russia 6,906 4,773 57,914 12,642 -88.08 -62.24
Singapore 5,548 752
Spain 317,840 38,811 670,698 389,507 -52.61 -90.04
Sri Lanka 1,288,180 1,560,675 1,434,695 1,087,173 -10.21 43.55
Sweden 2,489 636 12,000 375 -79.26 69.60
Switzerland 2,376 216
Taiwan 1,592,412 2,662,325 516,620 1,464,897 208.24 81.74
Thailand 1,628,387 3,214,367 1,431,922 3,836,297 13.72 -16.21
Turkey 9,025 8,500 -100.00 -100.00
United Kingdom 1,913,815 807,142 1,518,932 481,840 26.00 67.51
Vietnam 630,713 1,404,218 1,023,230 3,321,337 -38.36 -57.72
World Total 253,473,547 502,433,034 246,500,122 504,101,921 2.83 -0.33
September 2022 YTD September 2021 YTD YTD Growth%
Country Value Qty Value Qty Value Qty
Australia 8,130 1,366
Belgium 45,593 163,702 4,181 38 990.48 430694.74
Brazil 40,257 30,552 113,987 126,276 -64.68 -75.81
Cambodia 3,155,427 6,756,728 3,825,352 7,931,882 -17.51 -14.82
Canada 409,970 230,774 619,972 318,124 -33.87 -27.46
China 19,124,687 47,147,859 20,941,133 48,777,417 -8.67 -3.34
Czech Republic 209,582 1,309,600 418,441 2,637,532 -49.91 -50.35
Germany 227,252 135,138 247,395 48,269 -8.14 179.97
Guatemala 28,833 26,904 -100.00 -100.00
India 27,251 10,344
Indonesia 1,043,300 6,050,712 627,620 3,913,212 66.23 54.62
Italy 193,049 114,194
Japan 249,081 296,479 8,258 4,106 2916.24 7120.63
Korea, South 2,170 40
Country Value Qty Value Qty Value Qty
Bangladesh 466,556 7,025,788 628,766 9,866,800 -25.80 -28.79
China 9,721,903 133,607,160 12,687,640 185,297,479 -23.38 -27.90
France 78,138 1,230,000 77,363 1,141,556 1.00 7.75
Germany 1,438,329 27,264,662 1,340,839 25,626,800 7.27 6.39
Italy 29,275 372,000 -100.00 -100.00
Korea, South 8,925 131,900 45,903 902,300 -80.56 -85.38
Mexico 195,523 2,301,518 948,696 13,558,145 -79.39 -83.02
Taiwan 16,467 191,600 49,972 728,610 -67.05 -73.70
Thailand 4,003 68,727 -100.00 -100.00
Vietnam 28,325 459,162
World Total 11,954,166 172,211,790 15,812,457 237,562,417 -24.40 -27.51
Mexico 1,748,313 2,866,759 1,665,540 3,205,210 4.97 -10.56
Netherlands 7,376 133 2,527 100 191.89 33.00
Poland 8,965 10,120
Sweden 20,189 10,220 24,262 13,120 -16.79 -22.10
Taiwan 33,372 58,282 21,221 26,224 57.26 122.25
Thailand 127,485 34,119 -100.00 -100.00
Turkey 33,715 65,200 18,962 34,850 77.80 87.09
United Kingdom 261,907 412,009 490,288 1,044,309 -46.58 -60.55
Vietnam 23,356 6,457 21,351 13,708 9.39 -52.90
World Total 26,872,942 65,676,668 29,206,808 68,155,400 -7.99 -3.64
Country
China 5,123,882 12,584,109 4,752,696 17,592,606 7.81 -28.47
Mexico 2,200 1,210 4,840 2,640 -54.55 -54.17
Pakistan 22,573 249,800 13,757 151,800 64.08 64.56
Taiwan 122,735 156,480 422,272 891,808 -70.93 -82.45
United Kingdom 237,625 152,200 903,450 1,070,275 -73.70 -85.78
World Total 5,509,015 13,143,799 6,097,015 19,709,129 -9.64 -33.31
9603404040
Natural Bristle Brushes, Exc Subhdg 9603.30 (no)
September 2022 YTD September 2021 YTD YTD Growth%
Country Value Qty Value Qty Value Qty
Canada 2,242 2,592 82,399 7,608 -97.28 -65.93
China 9,408,121 48,657,678 11,474,859 54,317,644 -18.01 -10.42
Denmark 2,743 1 -100.00 -100.00
France 6,791 621 2,886 500 135.31 24.20
Germany 69,633 4,859 37,139 2,283 87.49 112.83
India 3,400 4,000 54,946 52,502 -93.81 -92.38
Indonesia 4,774,940 25,709,824 3,672,676 22,699,904 30.01 13.26
Italy 144,165 22,771 -100.00 -100.00
Mauritius 91,784 18,418 -100.00 -100.00
Netherlands 74,903 5,838 24,307 2,896 208.15 101.59
Poland 2,656 114
Sri Lanka 18,132 3,061 4,200 700 331.71 337.29
Taiwan 13,150 23,616 26,072 108,360 -49.56 -78.21
Turkey 1,070,532 287,260 1,357,969 349,568 -21.17 -17.82
United Kingdom 9,778 2,831 40,875 6,088 -76.08 -53.50
Vietnam 2,140 320 -100.00 -100.00
World Total 15,454,278 74,702,294 17,019,160 77,589,563 -9.19 -3.72
Paint,distemper/siml Brushes Exc Subhdg 960330,nes (no)
September 2022 YTD September 2021 YTD YTD Growth%
Country Value Qty Value Qty Value Qty

Australia 2,709 392
Austria 4,604 1 -100.00 -100.00
Bangladesh 39,160 197,376 474,886 2,209,020 -91.75 -91.06
Belgium 7,268 2,138
Brazil 90,175 121,056 332,146 248,508 -72.85 -51.29
Bulgaria 3,605 550 -100.00 -100.00
Canada 135,234 90,000 143,563 51,260 -5.80 75.58

China 60,410,479 199,803,609 68,889,009 233,744,353 -12.31 -14.52
Czech Republic 2,327 4,000 -100.00 -100.00
Dom. Republic 14,240 145,200 -100.00 -100.00
France 4,294 595
Germany 327,670 497,244 366,275 147,219 -10.54 237.76
Guatemala 49,557 40,280 48,302 55,103 2.60 -26.90
Hungary 2,760 800 6,413 1,495 -56.96 -46.49
India 4,296 586 48,131 91,947 -91.07 -99.36
Indonesia 2,560,991 12,102,660 2,385,395 12,310,778 7.36 -1.69
Ireland 6,205 8,808
Israel 9,017 248
Italy 326,658 754,480 536,929 325,684 -39.16 131.66
Japan 92,361 98,227 140,514 196,011 -34.27 -49.89
Korea, South 6,950 160 4,215 2,625 64.89 -93.90
Mexico 101,422 139,899 30,498 56,939 232.55 145.70
Netherlands 58,586 6,707 44,139 4,469 32.73 50.08
Philippines 22,658 81,354 -100.00 -100.00
Poland 41,275 61,764 6,005 220 587.34 27974.55
Romania 2,892 600 2,303 404 25.58 48.51
Singapore 7,800 16,020 -100.00 -100.00
Spain 2,917 666 9,427 1,748 -69.06 -61.90
Sri Lanka 340,533 135,464 193,266 76,968 76.20 76.00
Sweden 116,959 119,299 122,201 82,420 -4.29 44.75
Switzerland 5,629 167 -100.00 -100.00
Taiwan 113,555 458,878 274,911 745,044 -58.69 -38.41
Turkey 228,386 80,340 521,128 809,617 -56.17 -90.08
United Kingdom 104,501 92,228 223,564 395,257 -53.26 -76.67
Vietnam 730,638 1,093,744 616,789 732,283 18.46 49.36
World Total 65,917,448 215,908,248 75,480,872 252,536,664 -12.67 -14.50
Country
Armenia 25,715 395
Australia 504,424 4,432 631,381 3,040 -20.11 45.79
Austria 308,182 422,904 344,863 37,739 -10.64 1020.60
Belgium 100,452 7,763 167,378 4,289 -39.98 81.00
Brazil 18,774 241 25,959 179 -27.68 34.64
Bulgaria 86,699 3,293 2,344 200 3598.76 1546.50
Cambodia 59,588 9,478 -100.00 -100.00
Canada 9,974,283 266,632 7,799,419 613,942 27.88 -56.57
Chile 2,083 90 3,600 80 -42.14 12.50
China 28,195,885 50,421,447 29,393,877 64,274,272 -4.08 -21.55
Czech Republic 282,968 3,407 234,919 862 20.45 295.24
Denmark 202,131 31,537 153,856 26,664 31.38 18.28
Estonia 207,155 23,601 147,470 19,510 40.47 20.97


Finland 227,338 14,826 89,430 5,631 154.21 163.29
France 403,960 13,215 318,416 223,006 26.87 -94.07
Germany 16,376,214 1,974,359 14,708,298 1,426,422 11.34 38.41
Greece 25,220 123 -100.00 -100.00

Hong Kong 26,491 89,200 34,124 10,217 -22.37 773.05
Hungary 27,035 191 51,903 282 -47.91 -32.27
India 37,267 13,380 67,418 119,073 -44.72 -88.76
Indonesia 350,277 92,868 376,202 57,581 -6.89 61.28
Ireland 22,535 4,240 65,036 2,450 -65.35 73.06
Italy 10,276,386 806,078 8,002,267 666,427 28.42 20.96
Japan 6,567,151 149,961 8,413,693 220,461 -21.95 -31.98
Korea, South 1,191,864 267,380 664,449 153,163 79.38 74.57
Lithuania 408,542 3,950
Luxembourg 45,667 26 17,350 8 163.21 225.00
Malaysia 590,384 65,382 1,268,089 310,733 -53.44 -78.96
Mexico 3,590,471 2,289,422 3,584,227 2,382,983 0.17 -3.93
Netherlands 1,407,241 24,276 1,471,398 36,356 -4.36 -33.23
New Zealand 40,200 2,166 -100.00 -100.00
Norway 18,371 1,669 14,380 1,494 27.75 11.71
Poland 231,191 12,651 99,308 25,266 132.80 -49.93
Portugal 333,241 755,485 299,247 4,131 11.36 18188.19
Romania 14,819 1,550 29,016 3,691 -48.93 -58.01
Russia 10,167 3
San Marino 174,358 4,949
Sao Tome & Principe 3,779 560
Serbia
4,774 244 -100.00 -100.00
Singapore 3,260 8 -100.00 -100.00
Slovakia 4,965 900 4,896 4 1.41 22400.00
Slovenia 63,982 10,759 13,330 55 379.98 19461.82
Spain 3,613,619 822,673 3,726,314 997,949 -3.02 -17.56
Sri Lanka 18,107 5,488 16,193 7,668 11.82 -28.43
St Kitts/Nevis 252,207 5,692,764 232,494 4,982,839 8.48 14.25
Sweden 1,160,332 97,755 861,069 85,947 34.75 13.74
Switzerland 1,132,506 80,014 870,991 24,034 30.02 232.92
Taiwan 1,624,295 705,571 1,687,639 1,289,724 -3.75 -45.29
Thailand 89,651 4,155 197,527 222,923 -54.61 -98.14
Turkey 17,500 4,375 41,453 1,113 -57.78 293.08
United Kingdom 1,499,299 196,832 1,411,712 215,246 6.20 -8.55

Vietnam 1,561,442 987,302 2,160,502 1,463,662 -27.73 -32.55
World Total 93,281,405 66,379,951 89,836,479 79,933,335 3.83 -16.96
September 2022 YTD September 2021 YTD YTD Growth%
Country Value Qty Value Qty Value Qty
Canada 920,773 235,745 708,968 191,260 29.88 23.26
China 5,463,024 2,903,759 7,903,997 2,369,180 -30.88 22.56
Germany 75,136 19,722 2,885 4 2504.37 492950.00
Indonesia 67,016 23,920 97,631 27,351 -31.36 -12.54
Israel 87,570 43,522 -100.00 -100.00
Korea, South 2,167 109
Lebanon 98,053 18,371 17,745 3,494 452.57 425.79
Mexico 2,652 82 2,110 1,548 25.69 -94.70
Portugal 22,936 2,100 -100.00 -100.00
South Africa 818,273 258,263 1,462,955 433,283 -44.07 -40.39
Taiwan 96,021 31,578 -100.00 -100.00
United Kingdom 11,141 3,985 11,956 3,956 -6.82 0.73
World Total 7,458,235 3,463,956 10,414,774 3,107,276 -28.39 11.48
September 2022 YTD September 2021 YTD YTD Growth%
Country Value Qty Value Qty Value Qty
Bangladesh 122,586 900,048 27,689 135,244 342.72 565.50
Cambodia 10,224 10,224 2,448 2,448 317.65 317.65
Canada 3,663 482 -100.00 -100.00
China 450,489 570,819 367,467 1,032,798 22.59 -44.73
Colombia 116,667 89,400 84,015 75,828 38.86 17.90
Germany 4,873 1,410 -100.00 -100.00
India 13,227 8,833 2,682 2,353 393.18 275.39
Italy 2,574 1
Mexico 8,477 8,056 -100.00 -100.00
Sweden 2,251 250 -100.00 -100.00
Taiwan 52,532 42,000
Vietnam 11,880 11,880 17,127 13,194 -30.64 -9.96
World Total 780,179 1,633,205 520,692 1,272,063 49.84 28.39
9603908020 Upright Brooms (no)

September 2022 YTD September 2021 YTD YTD Growth%
Country Value Qty Value Qty Value Qty
Brazil 1,104,506 596,594 786,983 418,556 40.35 42.54
Cambodia 66,325 14,288 46,547 12,664 42.49 12.82
Canada 2,205 336
China 14,671,006 11,808,832 15,273,679 12,793,364 -3.95 -7.70
Colombia 175,715 195,400 106,480 85,986 65.02 127.25
Denmark 2,928 180
Dom. Republic 16,620 11,208 6,273 400 164.95 2702.00
El Salvador 170,827 102,608 345,935 22,540 -50.62 355.23
Germany 17,879 5,640 2,540 120 603.90 4600.00
Guatemala 155,626 121,860 191,293 157,872 -18.65 -22.81
Honduras 433,525 623,362 348,236 529,746 24.49 17.67
Hong Kong 47,330 35,640 81,887 92,736 -42.20 -61.57
India 15,499 3,572 11,680 5,370 32.70 -33.48
Israel 18,315 3,827 -100.00 -100.00
Italy 482,329 168,547 538,356 215,262 -10.41 -21.70
Jordan 8,550 130 -100.00 -100.00
Mexico 2,224,111 613,426 1,124,134 424,379 97.85 44.55
Poland 16,324 2,356 14,435 2,016 13.09 16.87
Portugal 2,715 1,800 5,447 2,000 -50.16 -10.00
Sri Lanka 786,991 385,768 726,784 417,371 8.28 -7.57
Vietnam 5,348 10,944 15,372 18,720 -65.21 -41.54
World Total 20,397,809 14,702,361 19,652,926 15,203,059 3.79 -3.29
September 2022 YTD September 2021 YTD YTD Growth%
Country Value Qty Value Qty Value Qty
Brazil 3,381 4,348 Cambodia 22,231 19,668 Canada 21,525 1,802 China 1,231,511 1,973,632 1,533,803 2,353,126 -19.71 -16.13 Germany 56,782 15,878 -100.00 -100.00
Hong Kong 14,000 100,000 -100.00 -100.00
Italy 78,607 26,154 32,165 17,124 144.39 52.73 Mexico 3,744 2,400 -100.00 -100.00 Poland 26,760 9,798 3,516 936 661.09 946.79 Sri Lanka 1,358,522 460,185 2,026,417 730,502 -32.96 -37.00
World Total 2,742,537 2,495,587 3,670,427 3,219,966 -25.28 -22.50
September 2022 YTD September 2021 YTD YTD Growth%
Country Value Qty Value Qty Value Qty
Australia 110,884 18,636 142,961 11,423 -22.44 63.14
Belgium 5,702 606
Brazil 667,558 275,110 612,331 446,782 9.02 -38.42
Cambodia 99,272 25,312 81,600 22,616 21.66 11.92
Canada 200,518 18,489 155,907 7,471 28.61 147.48
China 4,348,617 2,794,252 3,771,597 2,186,551 15.30 27.79
Colombia 201,821 130,813 162,580 127,607 24.14 2.51
Czech Republic 45,721 114,080 238,731 706,908 -80.85 -83.86
Denmark 5,465 318
Dom. Republic 6,284 3,240 2,526 1,800 148.77 80.00
Ecuador 14,466 13,260
El Salvador 201,605 212,458 230,497 208,001 -12.53 2.14
France 2,441 84 -100.00 -100.00
Georgia 22,423 2,567
Germany 46,706 54,253 57,315 3,666 -18.51 1379.90
Greece 13,677 15,976 -100.00 -100.00
Honduras 121,948 179,520 180,951 279,953 -32.61 -35.87
India 47,960 42,501 32,042 4,545 49.68 835.12
Israel 2,162 760 22,838 13,886 -90.53 -94.53
Italy 187,870 64,000 329,898 169,975 -43.05 -62.35
Japan 6,068 468 13,864 996 -56.23 -53.01
Korea, South 293,966 51,042 2,381 810 12246.33 6201.48
Mexico 27,839,741 9,851,871 30,757,225 11,671,436 -9.49 -15.59
Netherlands 7,898 36 -100.00 -100.00
Philippines 5,227 3,400 3,680 2,200 42.04 54.55
Poland 13,516 8,238
Portugal 19,512 14,400
Spain 16,998 468 -100.00 -100.00
Sri Lanka 2,656,837 1,109,976 2,129,950 1,088,581 24.74 1.97
Sweden 10,465 300 -100.00 -100.00
Taiwan 52,992 8,704 38,718 5,920 36.87 47.03
Thailand 75,002 36,732 20,075 10,600 273.61 246.53
Turkey 29,633 22,594 85,573 94,844 -65.37 -76.18
United Kingdom 30,114 2,631 25,686 2,799 17.24 -6.00
Venezuela 36,630 4,397 23,728 36,204 54.37 -87.85
Vietnam 419,291 284,002 375,193 308,235 11.75 -7.86
World Total 37,815,511 15,348,630 39,549,326 17,430,673 -4.38 -11.94
9603908050 Brooms,brushes,squeegees,etc,nesoi (x)
September 2022 YTD September 2021 YTD YTD Growth%
Country Value Qty Value Qty Value Qty
Argentina 7,285 2,138
Australia 693,773 2,479 733,867 1,273 -5.46 94.74
Austria 13,209 802 32,251 11,153 -59.04 -92.81
Bangladesh 624,527 528,132 276,153 130,336 126.15 305.21
Belgium 1,599,232 531,976 1,536,265 654,058 4.10 -18.67
Bosnia/Herzeg. 7,651 260 -100.00 -100.00
Brazil 415,883 480,803 264,199 229,235 57.41 109.74
Cambodia 3,966,046 2,330,601 2,952,861 1,616,864 34.31 44.14
Cameroon 2,700 6,000
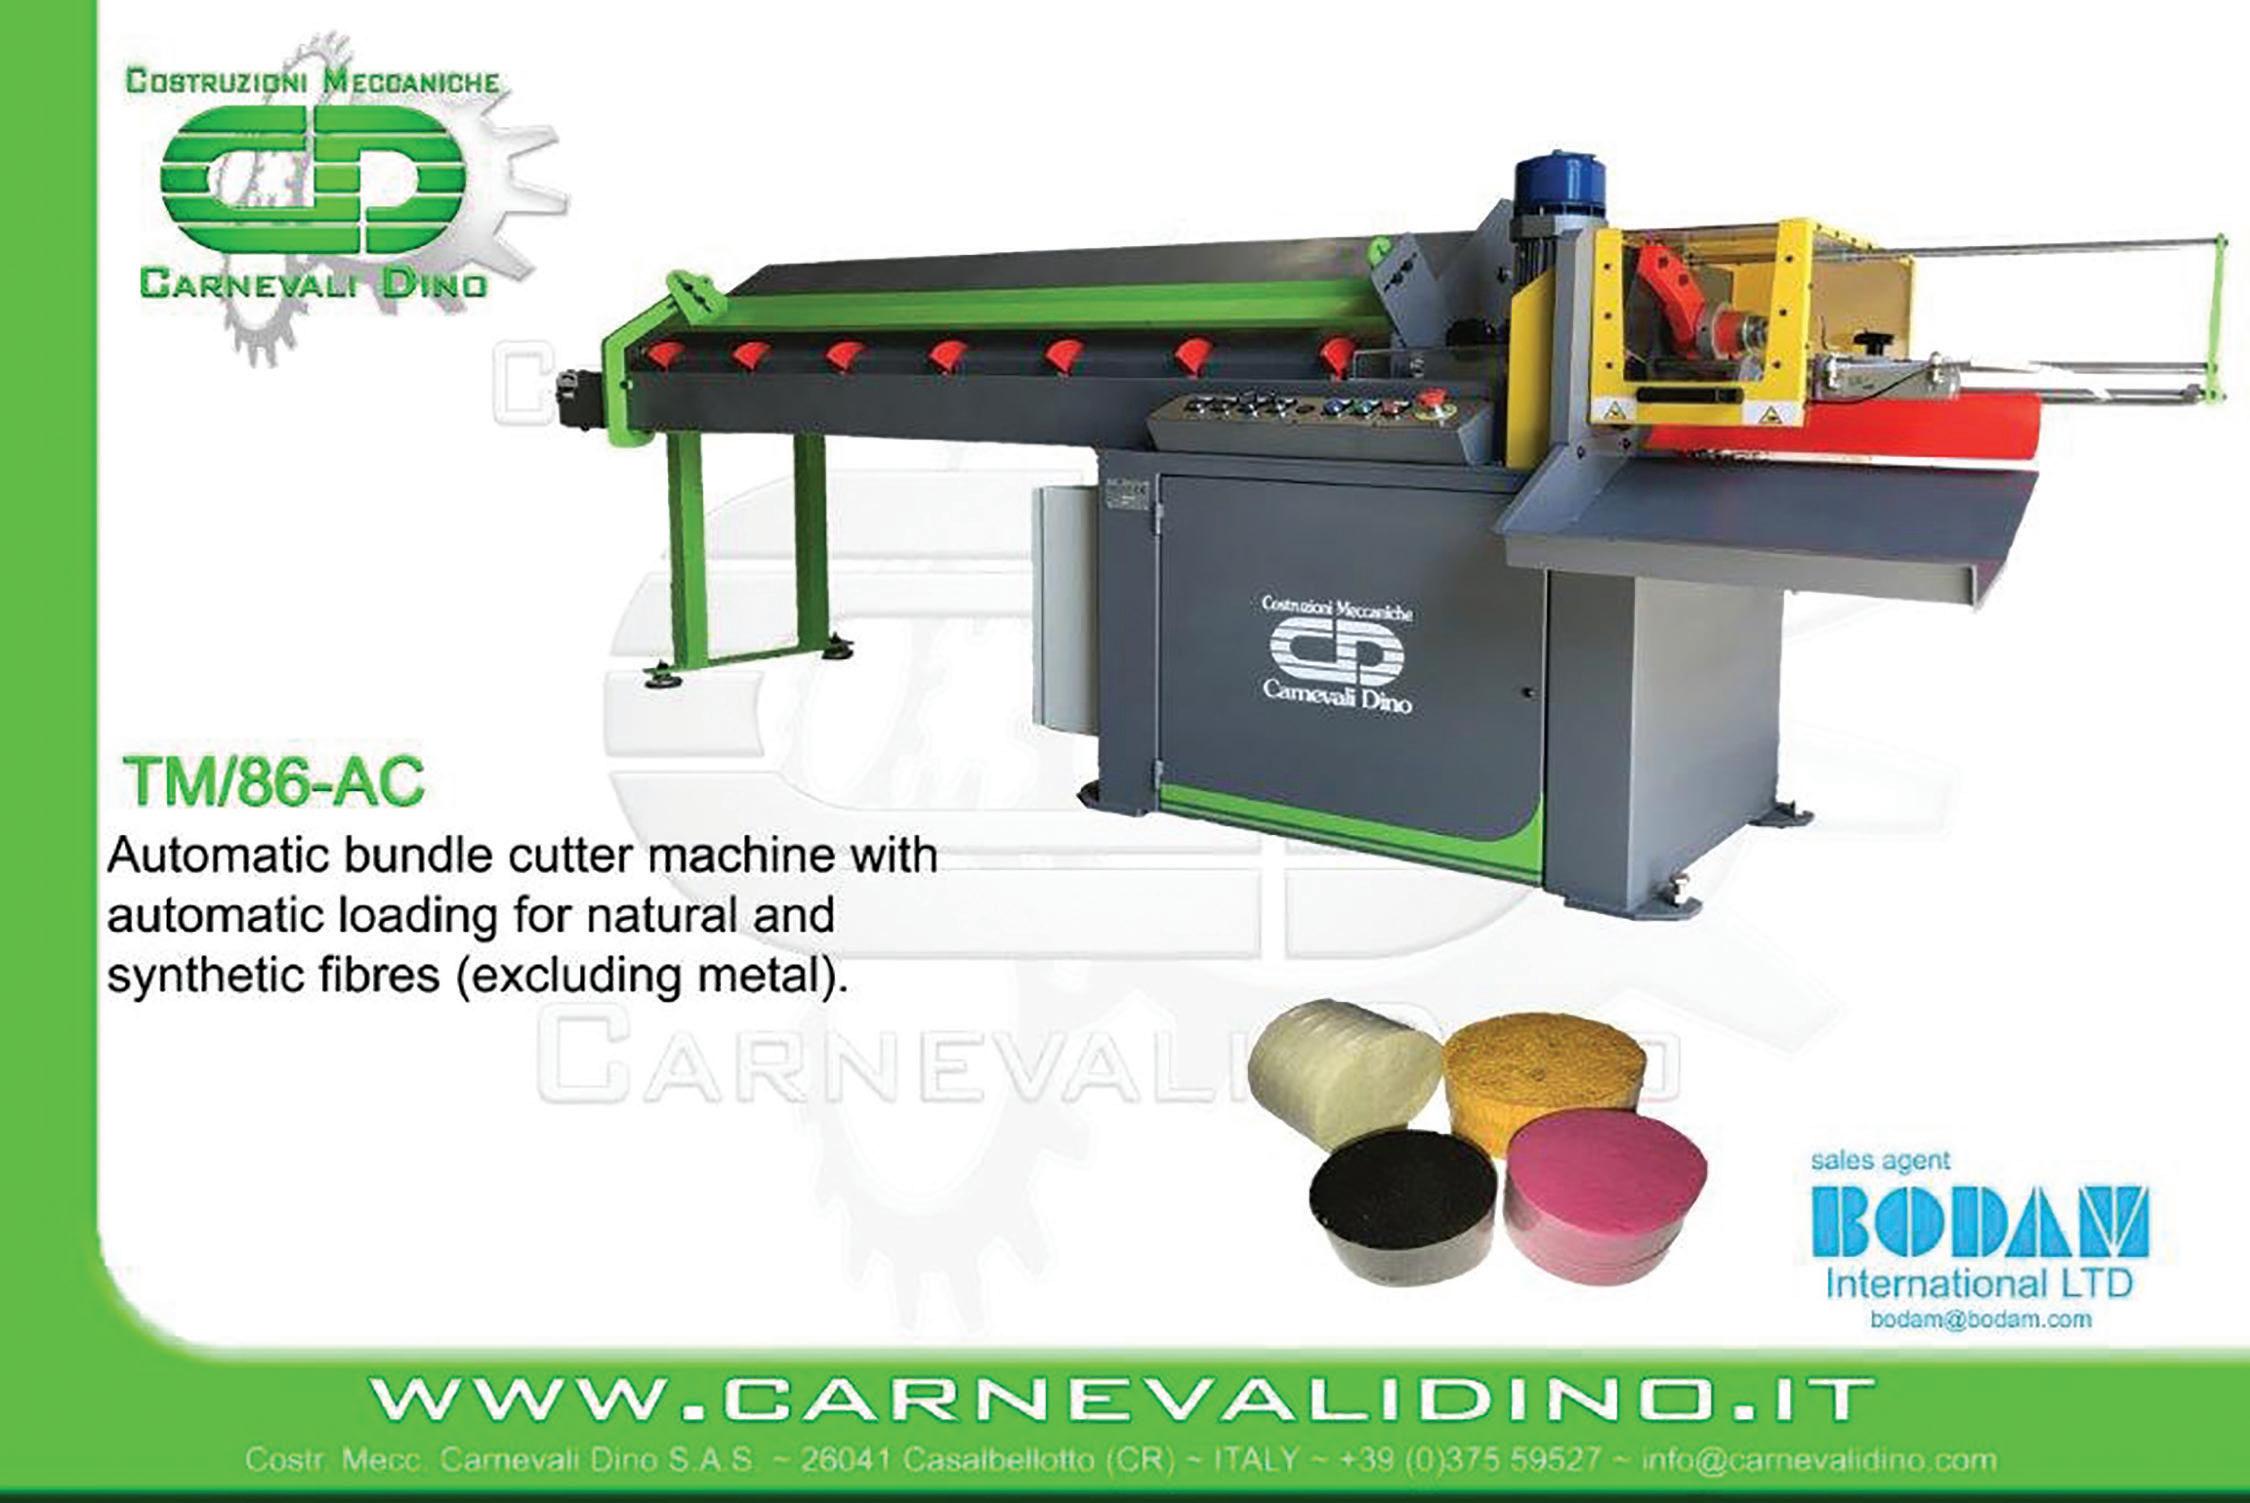
Canada 3,883,129 275,406 2,733,416 268,838 42.06 2.44
China 430,309,307 278,841,387 423,106,736 276,074,340 1.70 1.00
Colombia 1,047,490 591,117 602,248 412,466 73.93 43.31
Czech Republic 284,365 182,012 34,742 28,882 718.50 530.19
Denmark 4,448,391 714,338 4,239,329 655,866 4.93 8.92
Dom. Republic 53,251,276 10,182,078 47,777,803 9,862,260 11.46 3.24
Ecuador 4,044 4,800
Egypt 93,374 154,092 100,825 147,588 -7.39 4.41
El Salvador 83,225 85,899 99,874 115,426 -16.67 -25.58
Estonia 3,184 126 59,934 1,555 -94.69 -91.90
Finland 451,809 19,825 517,259 19,575 -12.65 1.28
France 486,775 67,593 527,310 63,007 -7.69 7.28
Germany 5,903,717 1,226,507 5,517,674 1,273,100 7.00 -3.66
Greece 18,408 12,340 -100.00 -100.00
Guatemala 17,472 1,200 -100.00 -100.00
Honduras 21,969,137 11,119,070 15,783,269 9,848,872 39.19 12.90
Hong Kong 542,071 232,367 365,136 167,983 48.46 38.33
Hungary 2,178 80 -100.00 -100.00
India 1,915,236 1,318,454 1,681,246 1,684,789 13.92 -21.74
Indonesia 340,113 201,449 371,427 111,724 -8.43 80.31
Ireland 13,682 156 27,790 324 -50.77 -51.85
Israel 181,591 84,751 152,627 32,580 18.98 160.13
Italy 2,270,742 816,439 2,579,545 880,095 -11.97 -7.23
Japan 3,478,325 226,794 3,089,712 172,884 12.58 31.18
Korea, South 1,042,118 84,882 1,044,566 168,736 -0.23 -49.70
Lebanon 6,656 720
Lithuania 717,424 8,087 855,001 7,451 -16.09 8.54
Luxembourg 2,450 2 -100.00 -100.00
Malaysia 851,739 949,636 797,367 629,292 6.82 50.91
Mexico 35,771,157 20,451,029 33,649,217 20,269,125 6.31 0.90
Netherlands 604,070 77,235 432,932 100,996 39.53 -23.53
New Zealand 834,192 371,906 736,871 7,697 13.21 4731.83
Norway 33,990 22 12,160 9 179.52 144.44
Pakistan 4,440,160 3,104,755 3,356,686 2,844,875 32.28 9.14
Philippines 2,907 3,230
Poland 422,755 416,362 2,301,817 370,580 -81.63 12.35
Portugal 87,481 24,761 93,023 58,969 -5.96 -58.01
Romania 2,368 2,000 -100.00 -100.00
San Marino 3,885 135
Singapore 2,985 150 8,655 170 -65.51 -11.76
Slovakia 2,091 500
South Africa 11,911 600 -100.00 -100.00
Spain 1,206,621 906,543 1,043,270 853,162 15.66 6.26
Sri Lanka 2,667,972 1,615,884 1,970,028 1,177,224 35.43 37.26
Sweden 66,129 16,585 48,109 6,449 37.46 157.17
Switzerland 475,318 97,057 395,195 65,080 20.27 49.13
Taiwan 11,343,380 5,386,969 12,099,813 6,195,814 -6.25 -13.05
Thailand 2,333,389 1,880,657 3,045,078 2,239,322 -23.37 -16.02
Turkey 904,839 586,655 1,002,514 660,034 -9.74 -11.12
UAE 169,525 2,680 295,319 492 -42.60 444.72
United Kingdom 603,207 125,699 560,092 134,059 7.70 -6.24
Venezuela 4,230 650 -100.00 -100.00
Vietnam 14,112,430 4,565,611 10,757,797 2,780,792 31.18 64.18
World Total 616,990,058 350,905,341 589,735,676 343,052,533 4.62 2.29
0502100000 Pigs, Hogs, Boars Bristles & Hair & Waste Thereof (kg)
September 2022 YTD September 2021 YTD YTD Growth%
Country Value Qty Value Qty Value Qty
Bahamas 41,158 4,604
Canada 20,576 2,322
Chile 9,196 450 -100.00 -100.00 China 16,137 1,805
Dom. Republic 108,298 12,113 -100.00 -100.00 Mexico 146,059 16,336 -100.00 -100.00
Trinidad/Tobago 330,676 65,716 162,612 22,074 103.35 197.71
World Total 408,547 74,447 426,165 50,973 -4.13 46.05
050290000 Badger Hair & Other Brushmaking Hair, Waste Therof (kg)
September 2022 YTD September 2021 YTD YTD Growth%
Country Value Qty Value Qty Value Qty
China 28,290 1,615 140,829 8,042 -79.91 -79.92
Denmark 5,000 118 -100.00 -100.00 Germany 29,735 2,557 -100.00 -100.00 Mexico 3,038 177
World Total 31,328 1,792 175,564 10,717 -82.16 -83.28
4417000000 Tools/tool & Broom Bodies Etc Shoe Last/trees Wood (x)
September 2022 YTD September 2021 YTD YTD Growth%
Country Value Qty Value Qty Value Qty
Anguilla 3,650 54
Antigua/Barbuda 12,168 4,245 -100.00 -100.00
Aruba 3,658 2 -100.00 -100.00
Australia 93,056 6,083 227,595 26,591 -59.11 -77.12
Bahamas 21,534 1,842
Bahrain 3,000 592 -100.00 -100.00
Barbados 41,214 13,773 2,556 171 1512.44 7954.39
Belgium 5,202 72 12,668 1,508 -58.94 -95.23
Belize 5,887 85 -100.00 -100.00
Bermuda 5,688 180 3,660 175 55.41 2.86
Brazil 592,026 27,391 711,108 31,707 -16.75 -13.61
British VI 67,744 11,489
Canada 3,725,818 172,021 3,846,049 177,368 -3.13 -3.01
Cayman Islands 13,906 1,250
Chile 9,399 375 46,973 3,032 -79.99 -87.63
China 128,957 2,431 175,887 2,029 -26.68 19.81
Colombia 13,600 162 394,050 17,994 -96.55 -99.10
Costa Rica 252,580 30,719 345,069 41,997 -26.80 -26.85
Czech Republic 7,601 11
Denmark 15,172 532 4,003 14 279.02 3700.00
Dom. Republic 33,200 2,123 32,720 227 1.47 835.24
Ecuador 5,080 391 -100.00 -100.00
El Salvador 30,653 2,626
Ethiopia 3,300 4
Finland 30,826 289 13,753 46 124.14 528.26
France 35,875 123 17,008 43 110.93 186.05
Germany 192,007 3,373 330,125 2,339 -41.84 44.21
Grenada 4,144 18
Guatemala 28,884 2,684
Guyana 3,112 254
Haiti 3,156 146 -100.00 -100.00
Honduras 41,246 1,479 9,032 378 356.67 291.27
Hong Kong 7,719 100 -100.00 -100.00
India 25,000 84 12,471 578 100.47 -85.47
Iraq 117,700 3,003 442,256 16,325 -73.39 -81.60
Ireland 5,200 693 9,567 628 -45.65 10.35
Israel 28,793 14,042 6,057 602 375.37 2232.56
Italy 14,925 234 45,000 1,338 -66.83 -82.51
Japan 65,285 3,390 136,558 4,160 -52.19 -18.51
Korea, South 208,656 4,649 214,706 6,598 -2.82 -29.54
Kuwait 5,506 7
Lithuania 47,607 317 3,437 27 1285.13 1074.07
Malaysia 7,595 240 18,479 303 -58.90 -20.79
Mexico 11,809,598 2,671,158 12,894,002 3,712,353 -8.41 -28.05
Netherlands 145,704 8,641 93,304 2,003 56.16 331.40
New Zealand 92,221 3,003 64,048 749 43.99 300.93
Nicaragua 3,879 242 -100.00 -100.00
Norway 43,215 392 83,041 425 -47.96 -7.76
Pakistan 25,000 226 -100.00 -100.00
Panama 25,236 2,217
Peru 3,921 237 131,728 116,713 -97.02 -99.80
Philippines 11,099 514 -100.00 -100.00
Poland 45,049 1,780 163,396 8,642 -72.43 -79.40
Portugal 3,050 21 12,750 82 -76.08 -74.39
Russia 30,517 174 167,795 18,657 -81.81 -99.07
Saudi Arabia 34,983 2,958 80,809 1,429 -56.71 107.00
Singapore 32,394 288
Slovenia 5,975 15
South Africa 4,374 1
Spain 54,828 1,886 2,501 1 2092.24 188500.00
Sri Lanka 31,380 9,619 7,860 40 299.24 23947.50
St Kitts/Nevis 17,496 912
St Lucia 5,557 1,250 53,360 7,618 -89.59 -83.59
Suriname 60,656 8,500
Sweden 7,926 44
Switzerland 17,238 340
Taiwan 37,967 321 4,455 236 752.23 36.02
Thailand 10,677 16
Trinidad/Tobago 127,923 34,645 10,407 3,786 1129.20 815.08
UAE 66,197 1,579 2,655 1 2393.30 157800.00
United Kingdom 135,831 6,586 340,207 3,340 -60.07 97.19
Uruguay 15,746 18 -100.00 -100.00
Venezuela 5,279 372 -100.00 -100.00
Vietnam 2,617 35
World Total 18,779,191 3,064,635 21,274,776 4,219,186 -11.73 -27.36
9603100000 Brooms & Brushes, Of Twigs/oth Veg Mat Bound (doz)
September 2022 YTD September 2021 YTD YTD Growth% Country Value Qty Value Qty Value Qty
Argentina
3,735 10 -100.00 -100.00
Australia 116,290 1,733 20,025 229 480.72 656.77
Austria 5,400 135
Bahamas 107,270 3,246 63,298 203 69.47 1499.01
Belgium 5,985 182
Bermuda 14,176 203 15,741 242 -9.94 -16.12
Brazil 11,473 131
Canada 1,914,708 50,883 2,010,832 60,215 -4.78 -15.50
Cayman Islands 13,849 84 4,410 485 214.04 -82.68
Chile 13,030 9 81,083 2,002 -83.93 -99.55
China 21,305 646
Costa Rica 15,267 351 43,114 691 -64.59 -49.20
Curacao 4,473 2
Czech Republic 9,280 176 9,716 83 -4.49 112.05
Denmark 8,040 366 -100.00 -100.00
Dom. Republic 21,126 641 8,083 300 161.36 113.67
Ecuador 24,646 748
Egypt 4,703 3
El Salvador 4,016 8 -100.00 -100.00
France 3,676 384 15,704 276 -76.59 39.13
Germany 146,901 4,282
Guatemala 6,240 75
Guinea 5,347 2
Haiti 6,609 200 -100.00 -100.00
Honduras 14,654 177 7,310 6 100.47 2850.00
Hong Kong 6,050 48 2,593 79 133.32 -39.24
Iceland 2,792 5
India 218,566 6,630 -100.00 -100.00
Ireland 65,309 1,182 3,349 102 1850.10 1058.82
Israel 9,258 206 14,689 147 -36.97 40.14
Italy 29,037 1,343 6,309 43 360.25 3023.26
Japan 8,985 229 9,600 54 -6.41 324.07
Jordan 33,072 192 5,763 99 473.87 93.94
Korea, South 41,121 596 146,093 2,859 -71.85 -79.15
Kuwait 3,190 20 9,008 154 -64.59 -87.01
Lithuania 9,897 7
Luxembourg 20,114 799 -100.00 -100.00
Mauritania 6,150 150
Mexico 58,863 1,592 74,157 2,209 -20.62 -27.93
Netherlands 123,021 1,453 119,411 1,621 3.02 -10.36
Nicaragua 2,930 2
Norway 15,324 226 3,996 37 283.48 510.81
Oman 3,380 103 -100.00 -100.00
Panama 131,589 6,104 7,035 152 1770.49 3915.79
Paraguay 3,996 63
Peru 22,385 615 12,186 234 83.69 162.82
Philippines 5,341 14 -100.00 -100.00
Poland 4,629 140 -100.00 -100.00
Qatar 57,828 2,315
Saudi Arabia 143,220 1,981 17,075 148 738.77 1238.51
Singapore 11,615 62
Spain 3,132 50
St Kitts/Nevis 9,588 238 5,256 200 82.42 19.00
St Lucia 10,287 341 10,807 620 -4.81 -45.00
St Vin./Grenadines 3,424 30 3,736 90 -8.35 -66.67
Sweden 18,512 1,119 10,397 316 78.05 254.11
Switzerland 88,071 1,768 12,815 43 587.25 4011.63
Thailand 13,271 125
Trinidad/Tobago 56,268 1,796 39,721 1,352 41.66 32.84
Turks & Caicos 7,335 222
UAE 31,500 955 18,650 122 68.90 682.79
United Kingdom 121,569 2,282 217,008 8,772 -43.98 -73.99
Venezuela 10,915 37
Vietnam 12,740 232 -100.00 -100.00
World Total 3,639,303 91,447 3,316,140 92,687 9.75 -1.34
September 2022 YTD September 2021 YTD YTD Growth%
Country Value Qty Value Qty Value Qty
Anguilla 6,012 2,004 -100.00 -100.00

Antigua/Barbuda 3,513 2,300 -100.00 -100.00
Argentina 1,070,173 1,355,911 1,239,746 2,350,697 -13.68 -42.32
Aruba 4,032 780 2,577 60 56.46 1200.00
Australia 155,762 49,671 156,859 50,038 -0.70 -0.73
Austria 33,652 6,553 -100.00 -100.00
Bahamas 52,930 1,686 65,589 2,389 -19.30 -29.43
Bangladesh 4,025 36 -100.00 -100.00
Barbados 41,308 15,615 77,360 100,002 -46.60 -84.39
Belgium 466,376 2,348,083 -100.00 -100.00
Belize 59,232 20,023 29,519 17,116 100.66 16.98
Bermuda 5,499 990 2,557 2,724 115.06 -63.66
Brazil 488,255 739,407 824,486 1,890,774 -40.78 -60.89
British VI 14,331 217
Canada 45,893,332 31,151,078 42,606,136 24,802,580 7.72 25.60
Cayman Islands 9,902 76 17,830 10,949 -44.46 -99.31
Chile 44,532 12,222 447,190 48,416 -90.04 -74.76
China 2,639,431 4,222,383 3,508,384 5,791,229 -24.77 -27.09

Colombia 421,505 1,326,125 470,045 2,686,469 -10.33 -50.64
Costa Rica 120,316 18,946 210,805 28,656 -42.93 -33.88
Curacao 163,689 10,314 165,140 27,866 -0.88 -62.99
Czech Republic 13,308 26,016 -100.00 -100.00
Dom. Republic 258,875 44,578 350,508 41,036 -26.14 8.63
Ecuador 104,770 3,457 -100.00 -100.00
El Salvador 289,677 26,664 181,684 123,703 59.44 -78.45
Fiji 8,731 11,868
Finland 47,729 55,768 26,899 44,096 77.44 26.47
France 13,925 8,626 41,667 5,985 -66.58 44.13
Gambia 7,920 21,480
Germany 2,016,109 8,095,234 3,432,402 13,958,968 -41.26 -42.01
Greece 62,206 2,741 -100.00 -100.00
Grenada 4,500 456 -100.00 -100.00
Guatemala 68,333 4,380 17,870 1,583 282.39 176.69
Guyana 201,006 123,983 192,591 124,054 4.37 -0.06
Haiti 17,330 727 115,595 13,608 -85.01 -94.66
Honduras 52,943 18,321 13,296 3,408 298.19 437.59
Hong Kong 556,306 536,678 1,669,715 2,713,760 -66.68 -80.22
Hungary 8,151 9,096
Iceland 8,103 3,794 -100.00 -100.00
India 1,616,436 1,755,439 1,075,130 2,495,668 50.35 -29.66
Indonesia 145,327 132,625 231,176 304,756 -37.14 -56.48
Ireland 55,698 151,516 359,019 26,508 -84.49 471.59
Israel 3,089 1,080 7,207 2,220 -57.14 -51.35
Italy 10,997 175 23,814 11,141 -53.82 -98.43
Jamaica 427,096 175,595 142,594 49,142 199.52 257.32
Japan 431,241 777,720 405,612 1,386,926 6.32 -43.92
Korea, South 826,029 276,382 491,865 195,085 67.94 41.67
Kuwait 12,628 2,257 16,349 7,144 -22.76 -68.41
Latvia 21,970 6,735 25,972 3,319 -15.41 102.92
Lithuania 13,897 6,840 51,774 17,085 -73.16 -59.96
Malaysia 8,305 5,823 13,044 180 -36.33 3135.00
Maldives 7,066 901 8,064 126 -12.38 615.08
Mexico 7,827,353 8,235,554 9,429,615 11,969,695 -16.99 -31.20
Netherlands 313,061 91,441 278,583 62,302 12.38 46.77
New Zealand 40,015 11,272 44,747 21,526 -10.58 -47.64
Nicaragua 19,236 7,356 3,133 527 513.98 1295.83
Norway 57,494 5,195 9,101 1,924 531.73 170.01
Oman 10,862 341
Pakistan 5,000 15,000 -100.00 -100.00
Panama 469,046 104,197 504,609 159,554 -7.05 -34.69
Paraguay 22,710 42,204 45,924 163,740 -50.55 -74.22
Peru 15,657 36,720 27,336 12,300 -42.72 198.54
Philippines 322,371 39,177 195,038 10,490 65.29 273.47
Poland 6,440,642 17,423,687 4,718,926 12,444,498 36.49 40.01
Qatar 7,410 3,190 7,196 100 2.97 3090.00
Romania 3,822 2,760 7,092 5,160 -46.11 -46.51
Russia 4,756 2,153 11,286 3,286 -57.86 -34.48
Saudi Arabia 242,832 7,084 -100.00 -100.00
Sierra Leone 6,300 200

Singapore 24,708 51,368 116,334 15,760 -78.76 225.94
Sint Maarten 11,207 10,035 7,618 1,467 47.11 584.05
South Africa 28,305 21,584 5,428 4,018 421.46 437.18
Spain 83,259 65,335 65,473 22,600 27.17 189.09
St Lucia 25,169 479 15,766 500 59.64 -4.20
St Vin./Grenadines 3,137 480
Suriname 49,807 4,347 10,014 23,073 397.37 -81.16
Sweden 16,969 10,000 34,162 31,232 -50.33 -67.98
Switzerland 167,253 545,050 18,743 28,330 792.35 1823.93
Taiwan 81,984 47,647 71,588 91,332 14.52 -47.83
Tanzania 2,614 200
Thailand 70,937 209,558 103,445 256,520 -31.43 -18.31
Togo 44,280 2,730
Trinidad/Tobago 198,787 23,145 793,104 97,572 -74.94 -76.28
Turkey 10,080 2,880
Turks & Caicos 3,087 95
UAE 57,039 6,886 85,575 21,249 -33.35 -67.59
United Kingdom 126,701 37,603 184,242 41,359 -31.23 -9.08
Uruguay 207,708 449,978 180,483 183,082 15.08 145.78
Venezuela 25,900 2,285
Vietnam 23,992 1,730 11,772 2,970 103.81 -41.75
World Total 75,134,701 78,674,797 76,658,700 87,433,156 -1.99 -10.02
Country Value Qty Value Qty Value Qty
Argentina 388,402 1,221,660 252,560 630,083 53.79 93.89
Australia 318,856 114,707 360,736 106,787 -11.61 7.42
Barbados 3,595 2,544 -100.00 -100.00
Belgium 118,433 42,049 181,025 31,644 -34.58 32.88
Bermuda 9,358 6,984 5,509 42 69.87 16528.57
Bolivia 25,383 14,304 18,338 3,044 38.42 369.91
Brazil 416,856 1,108,080 383,335 1,104,674 8.74 0.31
Canada 9,832,064 5,975,621 7,289,335 4,275,285 34.88 39.77
Cayman Islands 25,620 1,000
Chile 120,503 26,423 83,421 39,996 44.45 -33.94
China 899,245 191,809 15,900 1,739 5555.63 10929.84
Colombia 315,851 786,124 181,769 633,940 73.77 24.01
Costa Rica 177,103 53,081 41,313 15,104 328.69 251.44
Curacao 10,832 4,653
Cyprus 8,886 2,856 21,841 2,844 -59.32 0.42
Czech Republic 10,807 2,518 23,283 52,774 -53.58 -95.23
Denmark 3,280 1,600 3,010 552 8.97 189.86
Dom. Republic 123,986 96,821 76,080 49,310 62.97 96.35
Ecuador 36,667 19,780 476,399 77,103 -92.30 -74.35
El Salvador 171,645 229,978 17,509 9,668 880.32 2278.75
Estonia 9,239 4,068
Fiji 4,810 2,722
Finland 3,034 672
France 43,760 18,696 107,355 12,642 -59.24 47.89
French Guiana 4,585 5,500 -100.00 -100.00
French Polynesia 2,625 2,500
Germany 624,868 197,865 514,649 556,178 21.42 -64.42
Greece 6,954 792 6,400 616 8.66 28.57
Guatemala 195,091 20,330 29,539 2,910 560.45 598.63
Guyana 34,474 3,606
Haiti 5,951 185 5,987 158 -0.60 17.09
Honduras 7,221 3,408 15,689 15,840 -53.97 -78.48
Hong Kong 243,168 28,578 545,450 73,118 -55.42 -60.92
Hungary 29,318 5,976 3,864 2,088 658.75 186.21
India 37,042 3,989 14,900 3,735 148.60 6.80
Ireland 44,269 11,756 -100.00 -100.00
Israel 14,397 5,077 16,486 1,289 -12.67 293.87
Italy 94,523 219,529 111,644 67,692 -15.34 224.31
Jamaica 10,016 1,256 -100.00 -100.00
Japan 879,965 179,529 987,993 356,368 -10.93 -49.62
Korea, South 435,167 87,585 618,862 162,942 -29.68 -46.25
Kuwait 119,870 58,873 159,047 6,145 -24.63 858.06
Lebanon 11,471 1,254 -100.00 -100.00
Lithuania 48,342 18,097 11,264 5,688 329.17 218.16
Luxembourg 5,382 600
Malaysia 70,415 5,245 14,974 1,621 370.25 223.57
Mexico 4,210,353 7,984,792 4,994,566 6,244,334 -15.70 27.87
Mozambique 2,527 2,808 -100.00 -100.00
Netherlands 172,077 31,589 259,863 133,376 -33.78 -76.32
New Zealand 15,863 2,698 3,931 2,016 303.54 33.83
Nicaragua 14,637 8,858 -100.00 -100.00
Nigeria 2,981 3,312 -100.00 -100.00
Norway 14,098 2,134 21,575 3,852 -34.66 -44.60
Panama 138,863 43,382 104,899 43,974 32.38 -1.35
Paraguay 3,678 1,512 5,150 1,286 -28.58 17.57
Peru 28,297 18,456 53,878 30,845 -47.48 -40.17
Philippines 44,423 21,552
Poland 143,620 21,366 166,041 26,954 -13.50 -20.73
Portugal 12,908 11,904
Qatar 2,799 306 13,849 7,632 -79.79 -95.99
Romania 4,772 2,312
Russia 19,480 20,006 -100.00 -100.00
Saudi Arabia 263,948 157,192 28,419 3,921 828.77 3908.98
Serbia 5,986 2,880 8,099 4,248 -26.09 -32.20
Singapore 70,438 12,584 69,436 87,806 1.44 -85.67
Sint Maarten 4,543 2,376 3,214 1,968 41.35 20.73
South Africa 378,917 127,806 116,394 57,384 225.55 122.72
Spain 21,962 2,185 17,468 12,184 25.73 -82.07
Sweden 18,267 2,990 11,142 4,600 63.95 -35.00
Switzerland 1,046,948 158,856
Taiwan 532,914 56,472 335,440 33,223 58.87 69.98
Thailand 112,073 29,216 81,222 28,742 37.98 1.65
Trinidad/Tobago 199,547 58,818 84,520 44,327 136.09 32.69
Turkey 14,904 12,168 9,600 3,500 55.25 247.66
UAE 349,603 91,825 339,418 179,435 3.00 -48.83
United Kingdom 966,105 357,594 767,766 307,136 25.83 16.43
Uruguay 20,184 8,914 17,661 9,240 14.29 -3.53
Venezuela 519,280 26,155 938,933 122,280 -44.69 -78.61
Vietnam 7,800 60
West Bank-Israel 5,581 1,548
World Total 25,260,144 20,019,612 21,161,511 15,755,176 19.37 27.07
9603300000 Artists Brushes, & Similar Brushes For Cosemtics (no)
September 2022 YTD September 2021 YTD YTD Growth%
Country Value Qty Value Qty Value Qty
Argentina 133,770 29,055 83,296 37,929 60.60 -23.40
Australia 2,553,768 387,128 2,412,371 363,821 5.86 6.41
Austria 2,903 45
Bahamas 3,834 248 3,225 15 18.88 1553.33
Barbados 6,321 3,789 6,832 4,116 -7.48 -7.94
Belgium 1,791,515 761,473 1,416,103 689,440 26.51 10.45
Bermuda 4,212 1,440
Bolivia 6,270 1,200
Brazil 1,481,808 388,769 1,247,190 502,510 18.81 -22.63
Bulgaria 3,930 10
Canada 22,161,367 5,637,285 15,407,837 4,947,966 43.83 13.93
Cayman Islands 7,350 70
Chile 50,382 10,088 302,057 71,459 -83.32 -85.88
China 1,337,605 221,701 1,544,183 195,765 -13.38 13.25
Colombia 79,990 22,213 98,759 46,307 -19.00 -52.03
Costa Rica 85,152 18,833 78,060 27,626 9.09 -31.83
Cote d’Ivoire 16,790 1,182 -100.00 -100.00
Czech Republic 385,001 83,601 310,555 75,850 23.97 10.22
Denmark 10,721 2,748 108,783 12,196 -90.14 -77.47
Dom. Republic 42,651 2,421 36,267 3,519 17.60 -31.20
Ecuador 93,533 22,679 25,641 12,680 264.78 78.86
Egypt 19,872 3,040 4,979 770 299.12 294.81
El Salvador 38,664 17,097 177,182 42,561 -78.18 -59.83
Estonia 30,535 3,706 13,311 3,036 129.40 22.07
Faroe Islands 2,797 206 -100.00 -100.00
Finland 41,645 5,727 -100.00 -100.00
France 1,417,496 588,821 1,541,761 212,904 -8.06 176.57
Georgia 126,728 15,172 -100.00 -100.00
Germany 1,238,756 305,615 996,566 293,320 24.30 4.19
Guatemala 33,029 7,345 51,680 16,710 -36.09 -56.04
Honduras 87,892 10,356 78,865 9,126 11.45 13.48
Hong Kong 197,785 23,044 122,926 7,610 60.90 202.81
Hungary 2,819 648 11,258 2,122 -74.96 -69.46
India 1,920,295 1,760,965 411,669 56,292 366.47 3028.27
Indonesia 83,660 29,705 14,689 6,690 469.54 344.02
Iraq 14,356 1,312 -100.00 -100.00
Ireland 23,882 5,045 62,816 7,166 -61.98 -29.60
Israel 23,444 1,624 60,237 15,330 -61.08 -89.41
Italy 18,667 971 66,914 1,527 -72.10 -36.41
Jamaica 35,117 2,106 -100.00 -100.00
Japan 1,129,141 92,943 2,071,533 58,167 -45.49 59.79
Kazakhstan 23,290 13,491 62,681 33,772 -62.84 -60.05
Korea, South 173,368 22,487 277,246 18,662 -37.47 20.50
Kuwait 19,147 2,008 76,446 19,998 -74.95 -89.96
Kyrgyzstan 57,510 185 73,735 190 -22.00 -2.63
Lithuania 2,802 70 2,592 1 8.10 6900.00
Malaysia 66,349 12,841 406,895 127,704 -83.69 -89.94
Malta 17,653 1,404 -100.00 -100.00
Mauritius 10,689 325
Mexico 5,732,978 879,242 3,243,675 868,066 76.74 1.29
Morocco 4,875 150
Netherlands 411,864 49,542 396,275 42,677 3.93 16.09
New Zealand 45,908 21,652 56,736 39,638 -19.08 -45.38
Nicaragua 96,181 933
Norway 24,028 285 34,097 2,300 -29.53 -87.61
Oman 15,309 3,520 -100.00 -100.00
Pakistan 3,490 1,824
Panama 104,610 33,568 54,329 17,298 92.55 94.06
Paraguay 4,004 1,401
Peru 62,487 15,961 27,716 11,259 125.45 41.76
Philippines 12,429 3,207 20,391 4,136 -39.05 -22.46
Poland 311,948 66,924 479,769 98,553 -34.98 -32.09
Qatar 7,449 445 64,928 13,955 -88.53 -96.81
Romania 16,289 558 13,999 1,971 16.36 -71.69
Russia 25,768 21,272 224,444 142,634 -88.52 -85.09
Saudi Arabia 16,214 1,517 158,456 36,095 -89.77 -95.80
Serbia 4,283 1,440 18,136 11,196 -76.38 -87.14
Singapore 346,321 68,401 201,110 21,392 72.20 219.75
Slovenia 24,899 3,078 8,646 1,400 187.98 119.86
South Africa 250,907 108,632 241,490 128,834 3.90 -15.68
Spain 93,204 23,178 269,420 118,081 -65.41 -80.37
Suriname 2,870 48 -100.00 -100.00
Sweden 484,888 86,039 299,108 53,243 62.11 61.60
Switzerland 245,936 2,401 24,609 780 899.37 207.82
Taiwan 75,990 13,812 41,778 3,488 81.89 295.99
Thailand 470,454 23,097 685,326 11,485 -31.35 101.11
Trinidad/Tobago 12,784 2,710 6,013 663 112.61 308.75
Turkey 3,443 1,100
Ukraine 3,505 1,980 40,495 25,572 -91.34 -92.26
UAE 556,379 73,119 900,171 119,412 -38.19 -38.77
United Kingdom 3,202,989 474,949 4,749,936 643,494 -32.57 -26.19
Uruguay 11,012 2,174 9,682 529 13.74 310.96
Venezuela 50,896 3,584 -100.00 -100.00
Vietnam 7,402 1,003
World Total 49,536,093 12,482,722 42,262,036 10,377,269 17.21 20.29
9603402000 Paint Rollers (no)
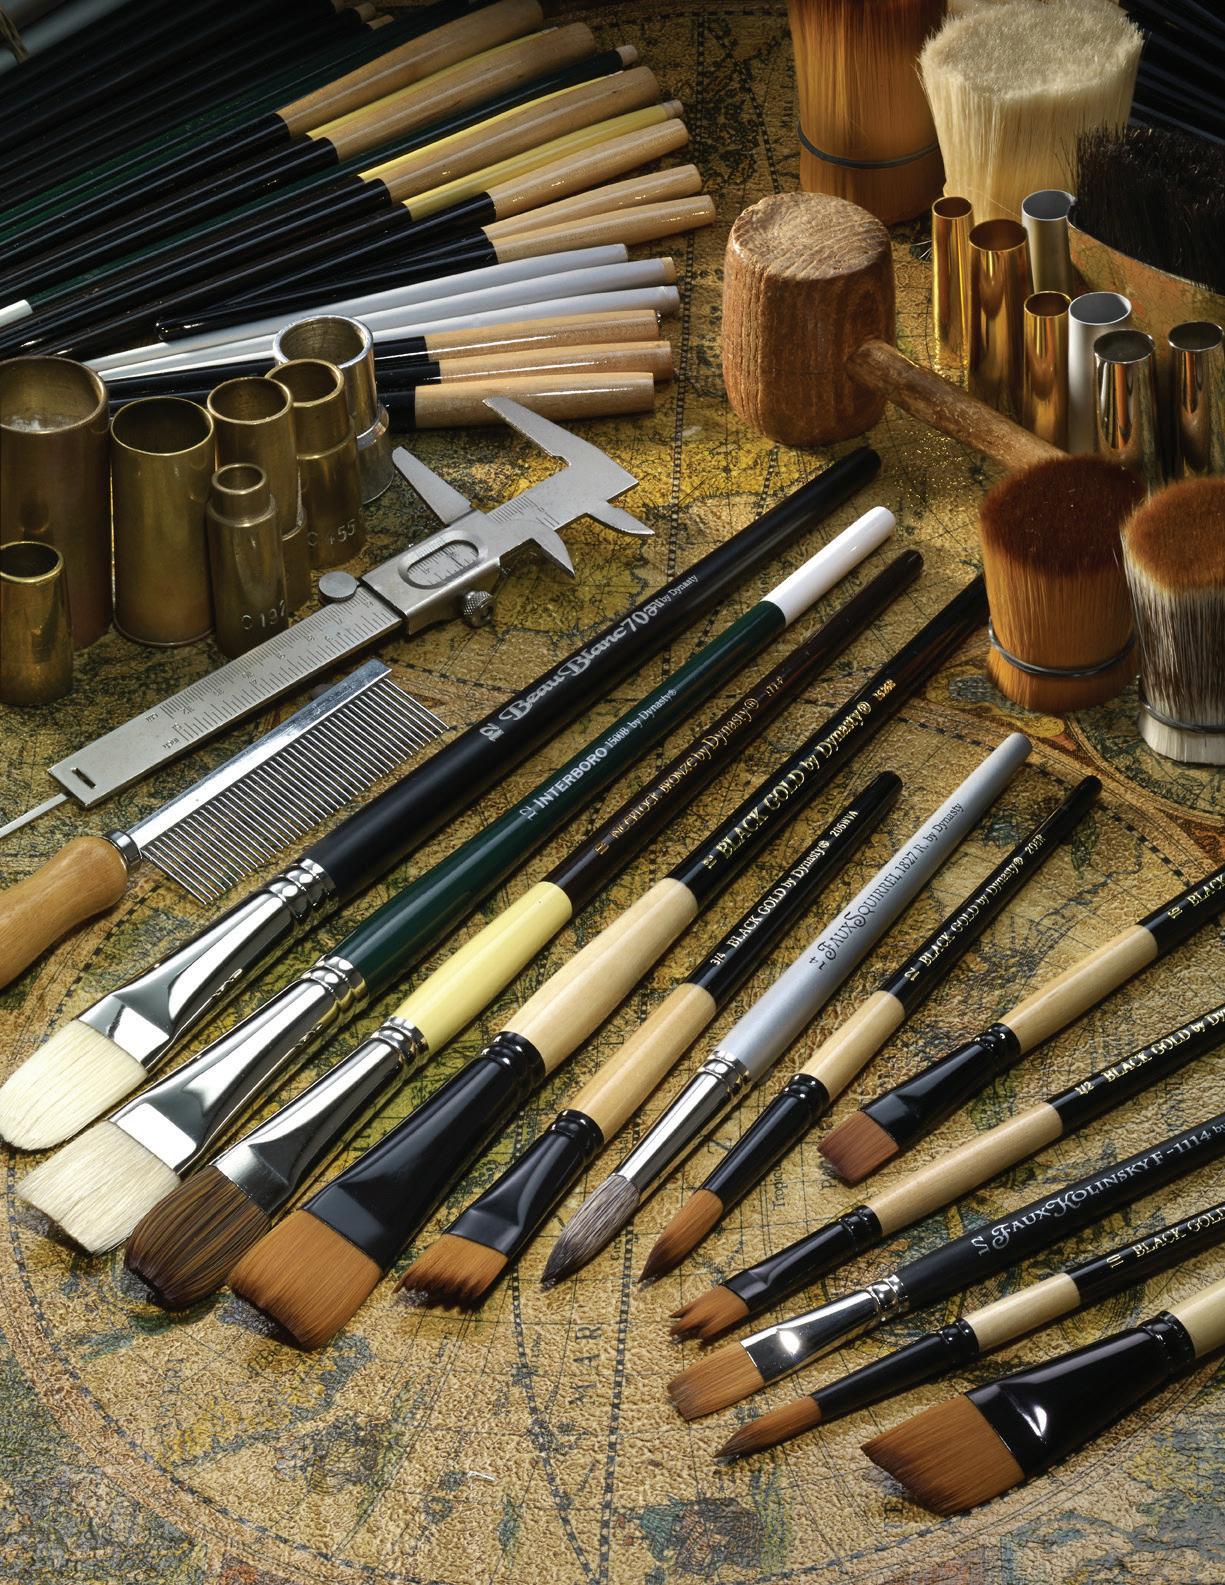
September 2022 YTD September 2021 YTD YTD Growth%
Country Value Qty Value Qty Value Qty

Aruba 5,462 4,554
Australia 70,767 19,882 63,549 5,256 11.36 278.27
Bahamas 3,784 1,346 9,975 1,775 -62.07 -24.17
Bahrain 10,255 4,350 -100.00 -100.00
Barbados 4,589 348 10,018 2,295 -54.19 -84.84
Belarus 32,317 15,792 22,905 10,250 41.09 54.07
Belgium 240,629 21,640 2,725 2,508 8730.42 762.84
Bermuda 19,615 6,673 10,858 3,892 80.65 71.45
Brazil 51,068 16,100 23,721 10,404 115.29 54.75
British VI 9,429 7,426 -100.00 -100.00
Canada 1,666,986 638,753 1,816,736 773,591 -8.24 -17.43
Cayman Islands 28,056 8,153 40,275 2,784 -30.34 192.85
Chile 13,445 2,366 -100.00 -100.00
China 16,613 552 6,084 200 173.06 176.00
Colombia 4,338 329
Costa Rica 42,284 18,823 49,497 874 -14.57 2053.66
Denmark 65,301 19,122 -100.00 -100.00
Dominica 7,607 1,836 -100.00 -100.00
Dom. Republic 249,265 6,277 477,130 36,443 -47.76 -82.78
El Salvador 55,037 9,533 77,805 17,703 -29.26 -46.15
Equatorial Guinea 6,588 600 -100.00 -100.00
Fiji 18,002 6,451 22,655 9,501 -20.54 -32.10
Finland 2,935 500 -100.00 -100.00
France 55,343 6,948 7,224 300 666.10 2216.00
French Polynesia 2,541 825
Germany 84,096 20,996 89,622 20,394 -6.17 2.95
Greece 11,649 4,008
Grenada 3,930 1,474 4,099 2,393 -4.12 -38.40
Guatemala 10,135 1,046 25,868 4,711 -60.82 -77.80
Haiti 3,607 360
Honduras 26,481 9,950 32,077 18,151 -17.45 -45.18
India 162,024 36,369 191,753 30,419 -15.50 19.56
Ireland 39,519 7,335 55,749 16,096 -29.11 -54.43
Israel 101,857 9,659 25,523 504 299.08 1816.47
Italy 17,898 2,000 -100.00 -100.00
Jamaica 56,767 14,261 12,225 1,835 364.35 677.17
Japan 7,000 92 54,914 7,050 -87.25 -98.70
Korea, South 99,319 36,397 66,612 14,475 49.10 151.45
Liberia 2,850 600
Lithuania 24,820 4,924 11,753 2,538 111.18 94.01
Malaysia 46,686 9,898 37,362 7,560 24.96 30.93
Mexico 2,088,139 915,304 1,231,429 718,071 69.57 27.47
Netherlands 8,897 330 3,195 120 178.47 175.00
New Zealand 88,660 20,413 129,303 45,674 -31.43 -55.31
Norway 2,804 218 -100.00 -100.00
Oman 7,996 165
Panama 52,281 12,752 57,774 22,981 -9.51 -44.51
Peru 2,943 350
Philippines 19,974 6,974
Romania 4,451 1,608 -100.00 -100.00
Russia 34,153 15,732 -100.00 -100.00
Samoa 7,149 4,303 2,754 624 159.59 589.58
Saudi Arabia 46,387 48,666 12,300 12,928 277.13 276.44
Singapore 5,000 500
Sint Maarten 3,485 10 -100.00 -100.00
South Africa 181,795 235,862 94,039 118,949 93.32 98.29
Spain 6,589 1,100 10,483 576 -37.15 90.97
St Kitts/Nevis 4,242 2,812
St Lucia 2,869 1,771 -100.00 -100.00
St Vin./Grenadines 16,308 6,117
Sweden 3,228 245 -100.00 -100.00
Taiwan 3,860 50
Thailand 8,718 83 28,990 228 -69.93 -63.60
Trinidad/Tobago 24,409 13,566 8,640 1,000 182.51 1256.60
Turkey 8,926 720 -100.00 -100.00
Ukraine 6,840 1,732 3,366 255 103.21 579.22
UAE 19,297 302 -100.00 -100.00
United Kingdom 312,850 103,427 296,672 93,168 5.45 11.01
Vietnam 4,480 5 World
6,144,953 2,314,859 5,340,330 2,077,282 15.07 11.44
9603404020 Paint Pads (no)
September 2022 YTD September 2021 YTD YTD Growth%
Country Value Qty Value Qty Value Qty
Australia 32,857 14,399 -100.00 -100.00
Bahamas 10,895 2,524
Belize 2,757 40 -100.00 -100.00
Cayman Islands 5,925 1,258 -100.00 -100.00
China 4,029 1,141 -100.00 -100.00
Colombia 3,055 3,027 9,104 7,428 -66.44 -59.25
Costa Rica 2,688 761
Dom. Republic 4,227 39
Finland 17,372 10,960 2,683 1,680 547.48 552.38
France 4,924 14 -100.00 -100.00
Germany 13,529 1,272 5,240 630 158.19 101.90
India 23,773 12,324
Israel 17,164 3,652 35,490 8,705 -51.64 -58.05
Japan 2,836 430 5,702 3,312 -50.26 -87.02
Malaysia 2,643 576
Mexico 56,255 9,913 23,701 3,877 137.35 155.69
Netherlands 5,625 924 -100.00 -100.00
New Zealand 2,775 4 -100.00 -100.00
Norway 2,875 814 -100.00 -100.00
Peru 3,287 3,480 -100.00 -100.00
Singapore 10,615 2,856 6,663 1,872 59.31 52.56
Thailand 10,200 2,890 -100.00 -100.00
United Kingdom 91,979 7,027 50,274 7,849 82.96 -10.47
Venezuela 3,024 10
World Total 260,055 55,371 214,111 60,317 21.46 -8.20
September 2022 YTD September 2021 YTD YTD Growth%
Country Value Qty Value Qty Value Qty
Antigua/Barbuda 3,945 716
Argentina 12,429 2,012
Australia 11,484 1,988 35,439 4,585 -67.60 -56.64
Austria 5,703 1,402
Bahamas 37,621 14,548 30,771 5,840 22.26 149.11
Bahrain 3,658 158 -100.00 -100.00
Barbados 25,084 1,087 41,786 9,367 -39.97 -88.40
Belarus 19,319 5,802 19,078 5,442 1.26 6.62
Belgium 119,870 11,157
Belize 4,052 1,870
Bermuda 25,169 8,558 13,080 3,755 92.42 127.91
Brazil 74,317 5,071 4,752 206 1463.91 2361.65
British VI 30,556 4,026 -100.00 -100.00

Canada 6,360,106 1,523,632 6,388,622 1,402,335 -0.45 8.65
Cayman Islands 27,231 4,346 28,814 1,708 -5.49 154.45
Chile 30,057 2,348 22,388 3,081 34.25 -23.79
China 1,285,894 86,351 729,802 27,651 76.20 212.29
Colombia 14,429 1,027 7,354 318 96.21 222.96
Costa Rica 18,988 822 17,746 1,284 7.00 -35.98
Croatia 6,347 275
Czech Republic 100,341 14,886 38,159 3,655 162.96 307.28
Denmark 180,011 7,793
Dominica 83,279 3,057 -100.00 -100.00
Dom. Republic 3,128 135 44,618 1,521 -92.99 -91.12
Ecuador 5,508 25 9,364 2,656 -41.18 -99.06
El Salvador 114,730 3,131 30,755 1,774 273.05 76.49
Estonia 6,583 1,124 45,503 6,530 -85.53 -82.79
Fiji 8,259 358 15,479 670 -46.64 -46.57
Finland 18,968 2,636 20,320 297 -6.65 787.54
France 180,500 26,282 145,906 19,398 23.71 35.49
Germany 123,176 15,634 67,097 5,917 83.58 164.22
Ghana 4,000 68 -100.00 -100.00
Greece 44,487 8,214 20,158 2,718 120.69 202.21
Grenada 28,865 4,318 2,659 115 985.56 3654.78
Guatemala 14,850 510 -100.00 -100.00
Honduras 28,440 399
Hong Kong 252,875 958 -100.00 -100.00
Hungary 7,823 339 11,042 2,050 -29.15 -83.46
Iceland 32,209 1,634 -100.00 -100.00
India 22,562 936 661,155 29,110 -96.59 -96.78
Indonesia 6,700 290
Ireland 224,756 16,641 328,556 35,584 -31.59 -53.23
Israel 73,923 2,289 26,930 1,227 174.50 86.55
Italy 107,376 7,376 16,966 1,121 532.89 557.98
Jamaica 69,020 19,384 48,512 8,518 42.27 127.57
Japan 75,790 4,192 27,134 1,960 179.32 113.88
Kazakhstan 10,738 788
Korea, South 920,376 58,860 713,073 36,773 29.07 60.06
Kuwait 5,049 6
Liberia 4,471 800 -100.00 -100.00
Lithuania 34,167 2,147
Luxembourg 39,243 1,699
Malaysia 14,816 1,929 10,983 2,900 34.90 -33.48
Mexico 484,137 64,092 931,002 116,951 -48.00 -45.20
Netherlands 92,896 17,326 193,999 27,233 -52.12 -36.38
New Zealand 37,349 7,751 74,233 23,805 -49.69 -67.44
Norway 7,591 329 -100.00 -100.00
Oman 3,088 6
Panama 29,830 9,334 159,001 22,882 -81.24 -59.21
Peru 5,291 1,540 7,591 1,660 -30.30 -7.23
Philippines 8,462 366 5,482 897 54.36 -59.20
Poland 183,276 9,834 27,589 4,848 564.31 102.85
Russia 2,881 1,788 60,001 2,885 -95.20 -38.02
Samoa 3,103 1,947 -100.00 -100.00
Saudi Arabia 3,045 87 21,938 3,151 -86.12 -97.24
Singapore 15,445 1,644 21,622 1,239 -28.57 32.69
Sint Maarten 4,186 966
Slovakia 88,132 14,516 7,937 1,500 1010.39 867.73
Slovenia 36,544 6,600 25,695 4,500 42.22 46.67
South Africa 4,673 24 6,324 1,200 -26.11 -98.00
Spain 12,322 3,704 11,680 1,706 5.50 117.12
St Kitts/Nevis 3,638 157 -100.00 -100.00
St Vin./Grenadines 6,528 644 5,443 3,470 19.93 -81.44
Suriname 64,180 2,778 -100.00 -100.00
Sweden 6,342 1,636 24,014 1,040 -73.59 57.31
Switzerland 8,200 1,000
Taiwan 26,608 7,336 4,260 2,100 524.60 249.33
Thailand 11,786 1,435 28,151 2,136 -58.13 -32.82
Trinidad/Tobago 147,944 42,806 174,292 27,446 -15.12 55.96
Turkey 9,827 3,100
Turks & Caicos 2,548 1,069 -100.00 -100.00
Ukraine 4,570 720
UAE 33,848 2,120 14,301 882 136.68 140.36
United Kingdom 3,146,768 574,055 1,819,300 391,322 72.97 46.70
Vietnam 136,078 5,891 -100.00 -100.00
World Total 14,951,358 2,649,253 13,890,892 2,296,301 7.63 15.37
Country
Angola 23,588 623 14,223 382 65.84 63.09
Argentina 138,974 6,037 97,205 5,340 42.97 13.05
Aruba 2,532 12
Australia 873,456 50,410 867,209 74,377 0.72 -32.22
Austria 8,425 395 101,628 2,479 -91.71 -84.07
Azerbaijan 14,212 400 10,968 300 29.58 33.33
Bahamas 5,581 151 -100.00 -100.00
Bahrain 12,670 40
Barbados 13,084 115 4,776 63 173.95 82.54
Belgium 685,663 17,427 1,223,607 29,587 -43.96 -41.10
Belize 2,933 288
Bolivia 22,079 2,516 11,104 420 98.84 499.05
Brazil 469,500 58,079 480,026 44,729 -2.19 29.85
Bulgaria 10,561 224
Cameroon 5,475 50
Canada 28,523,138 1,477,094 25,176,019 1,303,152 13.29 13.35
Chile 413,996 82,470 188,773 29,823 119.31 176.53
China 3,497,686 531,067 3,461,943 438,601 1.03 21.08
Colombia 406,269 143,712 329,416 36,155 23.33 297.49
Costa Rica 38,303 3,208 57,988 5,009 -33.95 -35.96
Curacao 3,403 30
Czech Republic 146,719 3,892 78,982 2,798 85.76 39.10
Denmark 8,998 2,343 29,114 8,585 -69.09 -72.71
Dom. Republic 129,380 26,590 36,594 23,049 253.56 15.36
Ecuador 96,856 4,596 67,988 2,495 42.46 84.21
Egypt 60,944 1,636 20,579 170 196.15 862.35
El Salvador 31,825 676 42,437 2,809 -25.01 -75.93
Estonia 5,098 380 4,876 1 4.55 37900.00
Finland 132,194 2,160 41,250 3,188 220.47 -32.25
France 1,030,987 837,507 771,704 519,841 33.60 61.11
French Polynesia 2,850 150 -100.00 -100.00
Germany 7,420,959 2,880,937 7,835,856 3,258,439 -5.29 -11.59
Ghana 27,947 300 -100.00 -100.00
Greece 27,673 66 2,632 320 951.41 -79.38
Guatemala 82,751 3,216 46,009 95 79.86 3285.26
Honduras 6,737 12 45,196 1,135 -85.09 -98.94
Hong Kong 416,741 559,753 294,875 664,250 41.33 -15.73
Hungary 9,260 300 9,214 11 0.50 2627.27
Iceland 5,737 150
India 359,937 26,319 197,974 49,400 81.81 -46.72
Indonesia 98,764 16,462 71,388 5,119 38.35 221.59
Iraq 23,036 3,582
Ireland 252,335 9,215 246,433 10,424 2.39 -11.60
Israel 782,890 7,723 812,602 6,080 -3.66 27.02

Italy 353,593 41,059 361,694 46,256 -2.24 -11.24
Japan 3,072,539 805,894 2,289,817 576,976 34.18 39.68
Jordan 8,248 8 26,189 1,356 -68.51 -99.41
Kazakhstan 23,099 823 13,914 223 66.01 269.06
Korea, South 9,018,755 665,478 6,202,791 459,245 45.40 44.91
Kuwait 20,280 7,395 128,735 3,613 -84.25 104.68
Latvia 7,141 11 -100.00 -100.00
Liberia 3,800 1 -100.00 -100.00
Libya 21,254 120 2,740 400 675.69 -70.00
Lithuania 16,318 1,450 25,194 468 -35.23 209.83
Luxembourg 4,116 2 2,570 1 60.16 100.00
Macau 5,120 1,600 -100.00 -100.00
Macedonia 3,180 50
Malaysia 787,176 134,944 646,017 87,482 21.85 54.25
Maldives 7,333 230
Malta 21,224 2,800 -100.00 -100.00
Mexico 14,477,155 4,782,238 14,835,202 7,613,770 -2.41 -37.19
Morocco 3,818 20 -100.00 -100.00
Mozambique 6,108 8 -100.00 -100.00
Netherlands 567,341 15,554 701,250 85,311 -19.10 -81.77
New Zealand 55,379 1,280 82,845 1,374 -33.15 -6.84
Nicaragua 14,838 710 12,939 548 14.68 29.56
Norway 74,848 2,871 106,902 2,659 -29.98 7.97
Oman 62,496 4,287 19,474 1,111 220.92 285.87
Pakistan 11,979 125 33,946 302 -64.71 -58.61
Panama 100,866 11,316 412,425 40,083 -75.54 -71.77
Peru 130,866 2,332 88,273 6,491 48.25 -64.07
Philippines 32,562 10,320 40,713 165 -20.02 6154.55
Poland 259,534 174,700 256,876 149,905 1.03 16.54
Portugal 13,138 2,600 22,699 2,083 -42.12 24.82
Qatar 110,552 4,927 105,848 8,828 4.44 -44.19
Romania 16,069 1,501 29,502 3,259 -45.53 -53.94
Russia 22,436 1,867 53,977 1,100 -58.43 69.73
Saudi Arabia 250,653 27,066 276,268 59,633 -9.27 -54.61
Singapore 3,501,971 237,006 3,258,006 191,173 7.49 23.97
Slovakia 2,751 4
Slovenia 252,237 112,876 389,861 637,997 -35.30 -82.31
South Africa 87,038 7,351 119,583 8,427 -27.22 -12.77
Spain 236,834 17,690 219,875 9,625 7.71 83.79
Sri Lanka 6,962 40 -100.00 -100.00
Suriname 31,873 3,418 -100.00 -100.00
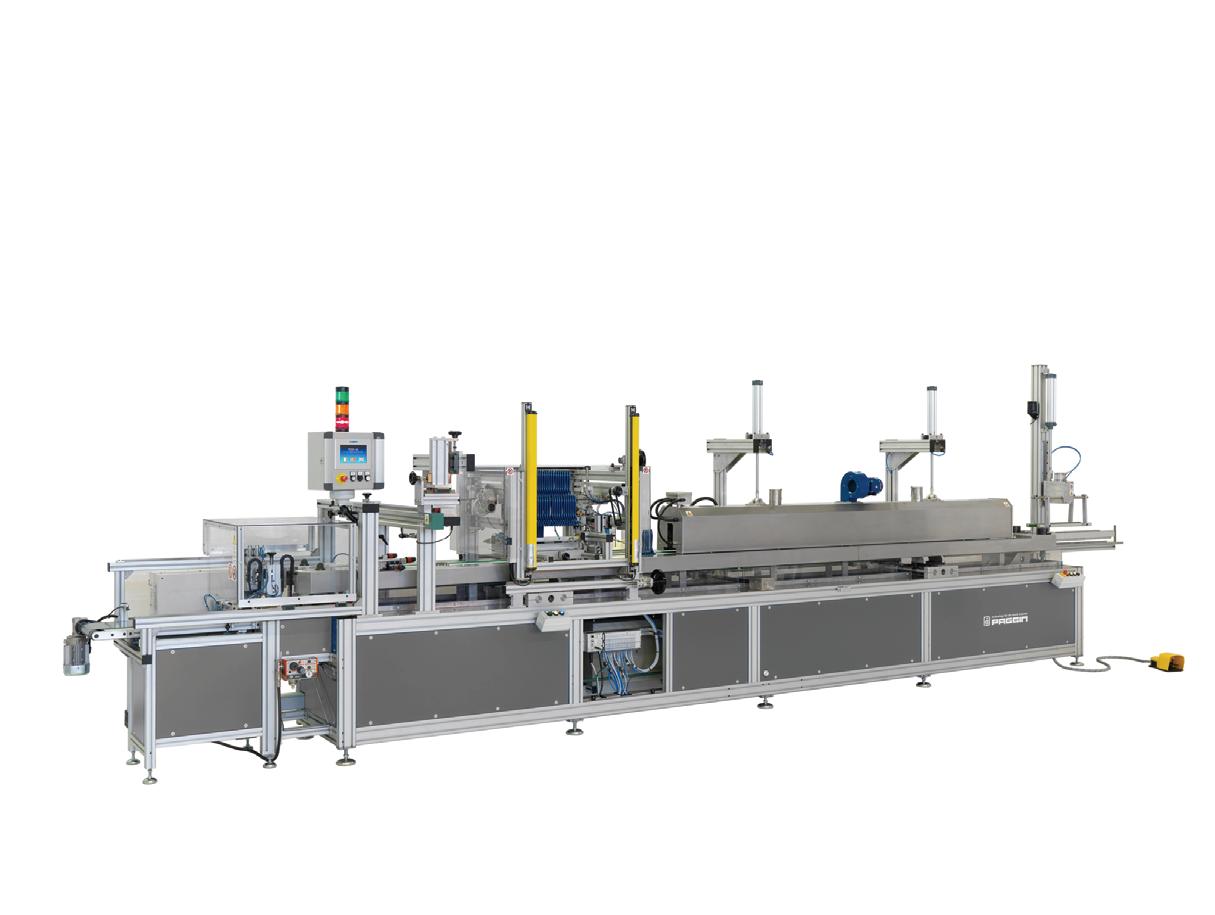
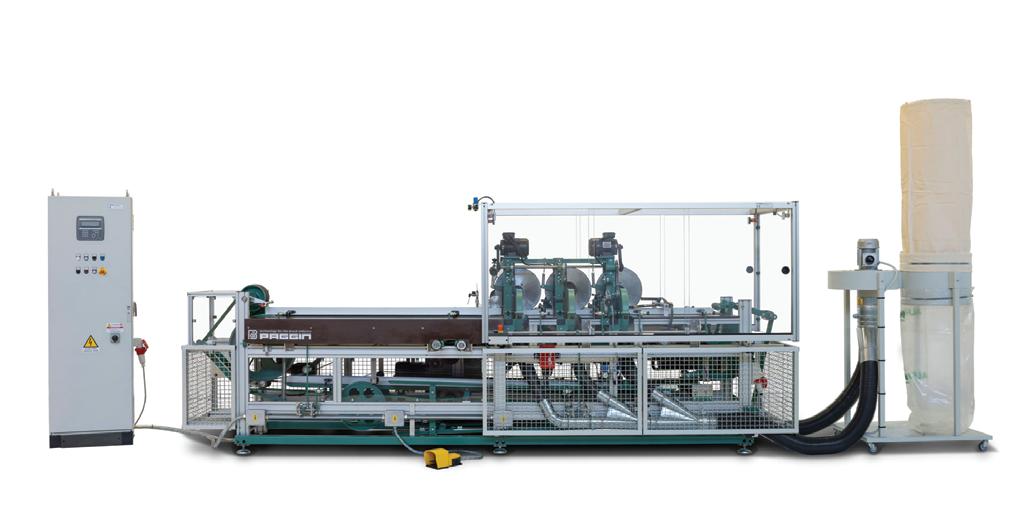
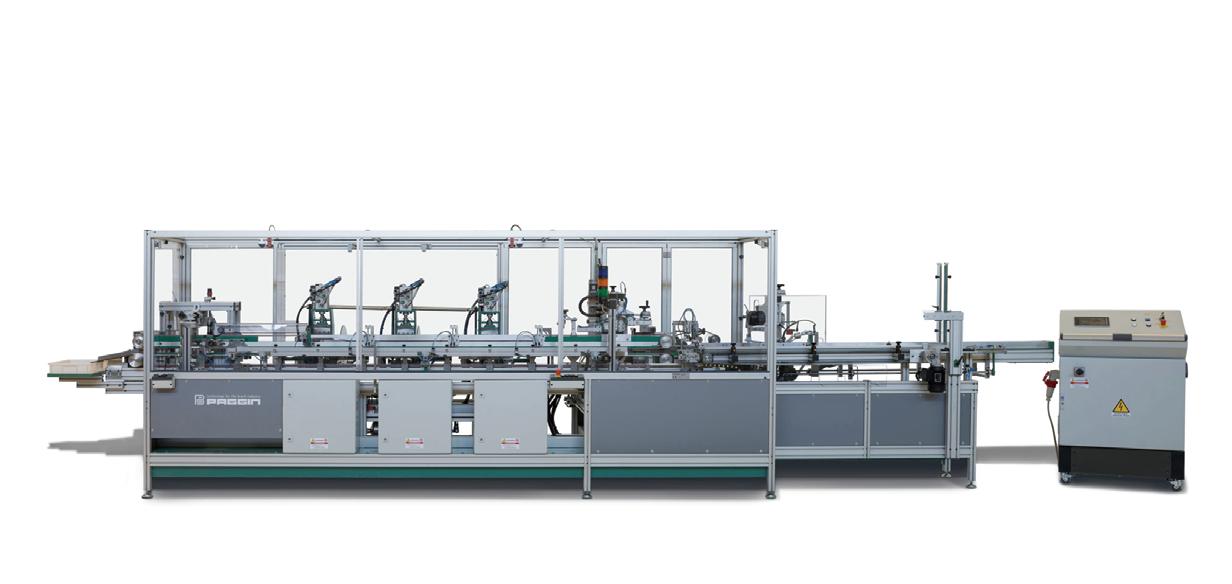
Sweden 193,486 11,321 163,043 8,008 18.67 41.37
Switzerland 39,181 3,610 18,882 1,060 107.50 240.57
Taiwan 5,497,278 150,471 3,865,930 37,680 42.20 299.34
Tanzania 7,306 4 -100.00 -100.00
Thailand 266,310 284,120 232,365 136,612 14.61 107.98
Trinidad/Tobago 17,073 1,143 50,705 2,047 -66.33 -44.16
Turkey 152,919 4,974 140,376 7,112 8.94 -30.06
Turks & Caicos 7,335 1 -100.00 -100.00
Uganda 8,815 71
Ukraine 8,402 230
UAE 651,764 52,070 551,590 36,213 18.16 43.79
United Kingdom 1,104,074 71,047 972,865 121,577 13.49 -41.56
Uruguay 9,292 2 12,369 29 -24.88 -93.10
Venezuela 53,394 23,087 5,610 12 851.76 192291.67
Vietnam 62,873 3,125 57,404 1,568 9.53 99.30
Zambia 11,295 585 -100.00 -100.00
World Total 87,978,063 14,443,057 79,666,212 16,889,497 10.43 -14.48
September 2022 YTD September 2021 YTD YTD Growth%
Country Value Qty Value Qty Value Qty
Afghanistan 8,203 200 -100.00 -100.00
Angola 3,243 130 3,385 840 -4.19 -84.52
Antigua/Barbuda 10,099 1,254
Argentina 101,639 9,726 150,969 4,034 -32.68 141.10
Armenia 6,285 144
Aruba 101,217 4,092 74,130 4,505 36.54 -9.17
Australia 3,909,564 826,106 2,078,265 180,831 88.12 356.84
Austria 55,124 5,001 26,871 3,996 105.14 25.15
Azerbaijan 11,385 345 -100.00 -100.00
Bahamas 129,744 15,022 125,876 21,062 3.07 -28.68
Bahrain 31,066 6,828 21,343 4,340 45.56 57.33
Bangladesh 10,090 1,023
Barbados 34,628 1,161 62,447 6,044 -44.55 -80.79
Belarus 6,200 775 30,234 1,286 -79.49 -39.74
Belgium 2,236,004 847,380 2,513,029 876,242 -11.02 -3.29
Belize 12,428 161 15,515 15,444 -19.90 -98.96
Bermuda 21,020 2 22,577 1,017 -6.90 -99.80
Bolivia 11,783 1,172 7,532 1,092 56.44 7.33
Brazil 421,787 74,642 413,794 77,197 1.93 -3.31
British VI 666,000 39,907 15,909 3,848 4086.31 937.08
Brunei 2,549 30 -100.00 -100.00
Bulgaria 21,054 1,698 -100.00 -100.00
Burkina Faso 8,000 7 -100.00 -100.00
Canada 63,817,081 13,900,778 49,769,040 13,384,230 28.23 3.86
Cayman Islands 75,734 4,600 50,636 4,376 49.57 5.12
Chile 799,548 604,193 424,205 144,794 88.48 317.28
China 1,275,073 186,504 2,194,033 218,763 -41.88 -14.75
Colombia 2,078,648 87,343 238,753 8,512 770.63 926.12
Costa Rica 524,581 111,841 406,100 72,192 29.18 54.92
Curacao 25,527 2,853 5,182 1,560 392.61 82.88
Cyprus 36,264 1,070 -100.00 -100.00
Czech Republic 97,413 9,784 66,180 20,670 47.19 -52.67
Denmark 379,696 41,686 299,525 65,268 26.77 -36.13
Djibouti 2,600 2
Dom. Republic 406,048 49,635 248,001 39,870 63.73 24.49
Ecuador 260,088 128,417 127,569 66,406 103.88 93.38
Egypt 11,004 69 13,020 60 -15.48 15.00
El Salvador 112,385 17,696 105,762 31,914 6.26 -44.55
Estonia 27,119 3,562 28,820 3,877 -5.90 -8.12
Fiji 7,244 4,434 4,297 1,200 68.58 269.50
Finland 100,905 17,755 69,430 10,458 45.33 69.77
France 1,118,573 73,033 914,572 68,453 22.31 6.69
Georgia 2,670 20
Germany 1,625,255 225,922 1,994,970 306,589 -18.53 -26.31
Ghana 9,400 10
Greece 36,475 10,355 63,526 12,021 -42.58 -13.86
Greenland 7,410 690 -100.00 -100.00
Grenada 13,451 672 4,983 255 169.94 163.53
Guadeloupe 4,037 13
Guatemala 121,538 8,288 109,939 13,395 10.55 -38.13
Guyana 10,173 133 2,986 2 240.69 6550.00
Haiti 3,156 1,057 34,270 2,037 -90.79 -48.11
Honduras 111,111 24,972 40,790 6,312 172.40 295.63
Hong Kong 236,106 62,193 493,799 42,282 -52.19 47.09
Hungary 24,143 1,226 -100.00 -100.00
Iceland 5,968 129
India 212,707 17,037 195,663 33,357 8.71 -48.93
Indonesia 98,312 17,685 86,845 14,169 13.20 24.81
Ireland 1,208,703 56,148 2,313,359 92,230 -47.75 -39.12
Israel 274,248 23,196 225,124 8,783 21.82 164.10
Italy 375,659 93,696 253,781 61,405 48.02 52.59

Jamaica 67,484 4,371 6,939 239 872.53 1728.87
Japan 2,799,254 299,091 2,240,210 223,368 24.95 33.90
Jordan 47,479 6,098 49,777 7,335 -4.62 -16.86
Kazakhstan 3,280 2,365 9,299 456 -64.73 418.64
Kenya 13,758 150 3,842 1 258.09 14900.00
Korea, South 1,420,897 1,547,789 1,560,699 2,369,414 -8.96 -34.68
Kuwait 39,909 7,145 58,778 8,120 -32.10 -12.01
Latvia 16,485 602 14,217 673 15.95 -10.55
Lithuania 15,943 2,671
Madagascar 2,645 198 -100.00 -100.00
Malaysia 157,061 31,413 145,906 37,182 7.65 -15.52
Maldives 12,391 1,092 6,046 522 104.95 109.20
Mali 3,695 1
Mexico 10,045,746 3,314,240 10,890,454 4,934,620 -7.76 -32.84
Monaco 11,583 456 -100.00 -100.00
Morocco 11,577 222 16,298 1,000 -28.97 -77.80
Netherlands 889,583 222,646 631,413 175,058 40.89 27.18
New Caledonia 5,896 745
New Zealand 188,928 24,561 211,904 27,489 -10.84 -10.65
Nicaragua 116,555 15,104 36,801 2,898 216.72 421.19
Niger 3,070 350
Nigeria
2,700 15 -100.00 -100.00
Norway 398,429 33,924 133,354 12,377 198.78 174.09
Oman 2,690 1,000
Pakistan 12,497 6,040 27,809 4,824 -55.06 25.21
Panama 180,070 72,696 324,632 72,720 -44.53 -0.03
Paraguay 42,589 3,145 7,491 1,034 468.54 204.16
Peru 148,337 44,492 142,242 21,857 4.28 103.56
Philippines 564,778 122,858 312,183 119,213 80.91 3.06
Poland 268,142 25,155 101,479 8,003 164.23 214.32
Portugal 12,814 20,502 37,454 21,206 -65.79 -3.32
Qatar 26,126 1,417 37,048 2,675 -29.48 -47.03
Romania 5,528 1,181 14,041 2,301 -60.63 -48.67
Russia 123,955 8,734 179,379 51,250 -30.90 -82.96
Saudi Arabia 655,711 36,864 1,418,721 94,194 -53.78 -60.86
Senegal 20,492 88
Serbia 6,640 175 -100.00 -100.00
Singapore 590,032 582,211 647,998 1,097,038 -8.95 -46.93
Sint Maarten 3,536 426 8,464 208 -58.22 104.81
Slovakia 8,899 1,713
Slovenia 12,555 2,140 21,050 4,608 -40.36 -53.56
Somalia 3,900 260 11,580 772 -66.32 -66.32
South Africa 167,705 21,118 252,837 21,194 -33.67 -0.36
Spain 96,576 15,352 138,096 27,340 -30.07 -43.85
St Kitts/Nevis 23,840 5,295
St Lucia 7,991 1,240 54,413 6,789 -85.31 -81.74
St Vin./Grenadines 2,761 457
Suriname 2,883 150
Sweden 145,334 11,927 93,279 17,694 55.81 -32.59
Switzerland 85,468 9,244 69,608 10,382 22.78 -10.96
Taiwan 393,454 32,766 217,795 12,394 80.65 164.37
Thailand 94,604 12,892 149,006 17,028 -36.51 -24.29
Trinidad/Tobago 126,852 11,955 129,223 14,319 -1.83 -16.51
Tunisia 17,745 2,100 -100.00 -100.00
Turkey 60,760 6,731 3,288 100 1747.93 6631.00
Turks & Caicos 11,089 61 -100.00 -100.00
Ukraine 26,851 8,282 76,553 18,170 -64.92 -54.42
UAE 506,126 105,766 315,096 59,151 60.63 78.81
United Kingdom 1,326,057 288,321 1,558,418 237,368 -14.91 21.47
Uruguay 11,064 7 13,030 2,261 -15.09 -99.69
Venezuela 37,821 553 491,341 52,545 -92.30 -98.95
Vietnam 72,931 5,355 62,363 11,212 16.95 -52.24
Zambia 6,600 800
Zimbabwe 3,003 438
World Total 105,374,909 24,604,388 89,450,300 25,756,091 17.80 -4.47
Indian Manufacturing PMI edges up to remain in growth territory for 17th straight month
The November Institute for Supply Management® Report On Business® reported a PMI reading of 49 percent for U.S. manufacturers which represented a move into contraction territory for the first time since May 2020. The new figure supported an overall downward trend that started in November of 2021 for U.S. manufacturers.
“Manufacturing contracted in November after expanding for 29 straight months,” says Timothy R. Fiore, Chair of the ISM® Manufacturing Business Survey Committee. “Panelists’ companies continue to judiciously manage hiring. Other than October 2022, the month-over-month supplier delivery performance was the best since February 2012, when it registered 47 percent. Material lead times declined approximately nine percent from the prior month and approximately 18 percent over the last four months. Managing head counts and total supply chain inventories remain primary goals. Order backlogs, prices and now lead times are declining rapidly, which should bring buyers and sellers back to the table to refill order books based on 2023 business plans.”
Survey panelists reported new softening of new order rates over the previous six months with the November composite PMI (purchasing manager index) figure indicating that companies are preparing for lower output in the future. Demand eased,
with new orders remaining in contraction territory and the new export orders index registering below 50 percent for a fourth consecutive month. The customer inventory index was effectively in “just right” territory, as it climbed 7.1 percentage points. Order backlogs decreased and employment fell as panelists say companies are managing headcount through a combination of hiring freezes, employee attrition and now layoffs. The supplier delivery index indicated faster deliveries and the inventories expanded at a slower rate as panelists’ companies continued to manage the total supply chain inventory.
ISM® GROWTH SECTORS (6): Apparel, Leather and Allied Products; Nonmetallic Mineral Products; Primary Metals; Miscellaneous Manufacturing; Petroleum and Coal Products; and Transportation Equipment.
ISM® CONTRACTION SECTORS (12): Printing and Related Support Activities; Wood Products; Paper Products; Textile Mills; Fabricated Metal Products; Furniture and Related Products; Chemical Products; Plastics and Rubber Products; Computer and Electronic Products; Food, Beverage and Tobacco Products; Machinery; and Electrical Equipment, Appliances and Components.
“General economic uncertainty has created a slowdown in orders as we approach the end of the year; and many of our key customers are reducing their capital expenditures spend.”
“The market remains consistent: sales match expectations; there are concerns about the impact of rising interest rates on customers; most suppliers have recovered on labor, but some are still struggling; and inflation seems to have peaked, but commodity price decreases have not been passed through to us. Lots of unknowns regarding impact to the European Union from the Russia-Ukraine war and questions about customer behavior in 2023.” Miscellaneous Manufacturing
“Future volumes are on a downward trend for the next 60 days.” Chemical Products
“Looking into December and the first quarter of 2023, business is softening as uncertain economic conditions lie ahead.”
Plastics and Rubber Products
“Slight improvement on overall business conditions from the previous month.”
“Customer demand is softening, yet suppliers are maintaining high prices and record profits. Pushing for cost reductions based on market evidence has been surprisingly successful.”
Computer and Electronic Products
“Orders for transportation equipment remain strong. Supply chain issues persist, with a minimal direct effect on output.”
Transportation Equipment
“Consumer goods are slowing down in several of our markets, although the U.S. economy seems decent. Cannot say the same for the European economy.”
Food, Beverage and Tobacco Products
“Overall, things are worsening. Housing starts are down. We’re doing well against our competitors, but the industry overall is down. We’re sitting on cash (that is) tied up in inventory.”
Electrical Equipment, Appliances and Components
“There is caution going into 2023, but the commercial section of construction seems to still be going strong.”
Nonmetallic Mineral Products
EUROPE: The S&P Global Eurozone Manufacturing PMI for November was reported as 47.1 percent, which did represent a move up from the October reading of 47.3 percent (the lowest since May 2020). Despite the uptick, it represented a fifth straight month of falling factory activity as output continued to shrink and the incoming orders dropped off with demand decreasing. That eased inflationary pressure, but companies in Europe offered a pessimistic outlook for the next year.
INDIA: The S&P Global India Manufacturing PMI pushed up to 55.7 percent for November after registering a solid 55.3 percent mark in October. Demand spurred growth as manufacturers saw a strong increase in new orders and output. The purchasing rate also accelerated with inflation pressure easing and notably employment grew for a ninth straight month. Additionally, supplier delivery times improved and materials were delivered on time to improve overall manufacturer performance. With the strong demand, companies were optimistic about the business outlook as sentiment hit an eight-year high.
CHINA: The Caixin China General Manufacturing PMI had a second straight month of improvement registering 49.4 percent for November, but the continuing struggles with COVID containment kept manufacturers in contraction territory for a fourth straight month. Output fell, new orders were weak and export sales were also disappointing. Companies cut back on purchasing and that impacted employment, which also fell. The business outlook was still pessimistic but did hit a three-month high.
ITALY: The S&P Global Italian Manufacturing PMI bumped up to 48.4 percent in November to reach a four-month high. However, manufacturing in the country still remains in contraction territory dating back to July of this year. Inflation and recession concerns impacted new orders and client demand. Employment did improve as firms were anticipating increased demand. Cost inflation did continue to increase and the business outlook remained weak.
GERMANY: The S&P Global/BME Germany Manufacturing PMI came in at 46.2 percent for November. The reading kept German manufacturers in contraction territory for the fifth straight month, but it was the first positive move for the German index since May of 2022. Headwinds for the country include weaker demand related to higher energy costs resulting from the Russia-Ukraine War.
UNITED KINGDOM: The S&P Global/CIPS U.K. Manufacturing PMI moved up slightly in November to register 46.5 percent. That was up 0.3 percent from 46.2 percent for October. Even with the upward move, the figure continues a ninth straight month of an overall downward trend and the fourth month in contraction territory for factory activity for U.K. manufacturing. Issues include lower output, a decrease in new work and lower employment. New exports took a dive as demand fell from many key trading partners. Inflation pressure decreased; however, business outlook hit the lowest mark since April 2020 as recession fears are weighing on U.K. companies.
Credits: Institute for Supply Management®, PMI® (Purchasing Managers' Index), Report On Business®. For more information, visit the ISM® website at www.ismworld.org.
45
40
36 MONTHS | MOVING AVERAGE: SIX MONTHS 35
Dec-19 Jan-20 Feb-20 Mar-20 Apr-20 May-20 Jun-20 Jul-20 Aug-20 Sep-20 Oct-20 Nov-20 Dec-20 Jan-21 Feb-21 Mar-21 Apr-21 May-21 Jun-21 Jul-21 Aug-21 Sep-21 Oct-21 Nov-21 Dec-21 Jan-22 Feb-22 Mar-22 Apr-22 May-22 Jun-22 Jul-22 Aug-22 Sep-22 Oct-22 Nov-22
Source data: Institute for Supply Management®, ISM®, PMI®, Report On Business®
EURO AREA MANUFACTURING PMI 36 MONTHS | MOVING AVERAGE: SIX MONTHS
55 60 65
50
INDIA MANUFACTURING PMI 36 MONTHS | MOVING AVERAGE: SIX MONTHS 35
30 35 40 45 50 55 60 40
45
Source data: S&P Global
CHINA MANUFACTURING PMI
36 MONTHS | MOVING AVERAGE: SIX MONTHS
ITALY MANUFACTURING PMI
36 MONTHS | MOVING AVERAGE: SIX MONTHS
Source data: Caixin Manufacturing PMI
GERMANY MANUFACTURING PMI
36 MONTHS | MOVING AVERAGE: SIX MONTHS
Source data: S&P Global
UK MANUFACTURING PMI 36 MONTHS | MOVING AVERAGE: SIX MONTHS
Source data: S&P Global
Source data: S&P Global























January 31–February 2, 2023
National Hardware Show | Las Vegas, Nevada
The National Hardware Show is the most comprehensive event, education and networking platform serving the hardware and home improvement industries. www.nationalhardwareshow.com
February 4-7, 2023
Creativeworld | Frankfurt, Germany
Creativeworld is the world’s most important trade fair for the international hobby, craft and artists’ supplies sector and an inspiring treasure chest for the creative community. www.creativeworld.messefrankfurt.com
March 4-7, 2023
The Inspired Home Show | Chicago, Illinois
We connect not only buyer to seller, but also product to lifestyle and the industry to the consumer mindset. Over 52,000 home and housewares professionals from more than 130 countries converge upon Chicago for the Show. www.theinspiredhomeshow.com
March 5-7, 2023
IBS New York | New York, New York
See and test the quality of beauty products before making a purchasing decision at the Internation Beaty Show in New York. Salon professionals flock to this event to stock up on their high-end product needs and check on the latest developments that have come about in the beauty industry. www.ibsnewyork.com
March 16-20, 2023
Cosmoprof Worldwide Bologna | Bologna, Italy
As the most influential global event dedicated to all facets of the beauty industry, Cosmoprof Worldwide Bologna has been a landmark event for more than 50 years. www.cosmoprof.com
March 22-25, 2023
ABMA Annual Convention | San Diego, California
The American Brush Manufacturer Association’s 2023 Annual Convention is planned for San Diego, California. For 2023, we look to why leadership matters as we celebrate our 106th Anniversary. We delve into what drives us and our teams with an eye on shaping and driving our organizations forward. www.abma.org/abma-annual-convention
April 2-4, 2023
Creativation by Namta | Columbus, Ohio
Creativation by Namta is an Industry Trade Show for Artist and Craft Materials. www.namta.org/creativation-by-namta
May 9-11, 2023
Interwire | Atlanta, Georgia
INTERWIRE will bring you back to the future of wire making with an Industry 4.0 theme. Automation, AI, robotics, data analytics and machine learning affect the way wire is made and how well companies compete on the world stage. Ready or not, change has arrived. www.interwire23.com
May 25–27, 2023
2nd Edition INBRUSH 2023
Chennai Trade Centre | Chennai, India
India’s only B2B event for brush manufacturing machinery and finished brushes. The event provides a unique opportunity for the brush industry – brush product manufacturers, brushmaking machinery suppliers, raw material suppliers, component suppliers, etc. to showcase their product range and services to a focused audience of B2B end users and OEMs. www.indiabrushexpo.com
September 20-23, 2023
The Annual Congress of the European Brushware Federation is a great opportunity to meet fellow manufacturers, contact suppliers and receive up-to-date information on the brush industry in Europe. www.eurobrush.com
October 17-19, 2023
ISSA Show North America | Las Vegas, Nevada
Staying up to date on the latest trends and solutions for cleaning, disinfection, and infection prevention and pursuing accreditation, training, and certification helps us further evolve the industry and change the way the world views cleaning. www.issashow.com
November 21-22, 2023
National Painting and Decorating Show | Coventry, UK
The National Painting and Decorating Show is the industry’s biggest annual U.K. event held at Ricoh Arena. If you use, sell, stock or specify P&D products, the exhibition is one you can’t afford to miss. www.paintshow.co.uk
2024ABMA Annual Convention
Dates for The American Brush Manufacturer Association’s annual convention for 2024 are still to be determined. www.abma.org/abma-annual-convention
March 3-6, 2024
EISENWARENMESSE 2024 | Cologne, Germany
The INTERNATIONAL HARDWARE FAIR boasts approximately 1,400 exhibitors from 50 countries. The spectrum of products ranges from tools and accessories to fasteners and fixings all the way through to fittings and building and DIY supplies. www.eisenwarenmesse.com
May 14-17, 2024
Interclean Amsterdam | Amsterdam, The Netherlands
From May 10-13, 2022, RAI Amsterdam will turn into the capital of cleaning and hygiene. Join us for a four-day journey of forward-thinking, doing business with leading manufacturers and meeting industry professionals from all over the world. www.intercleanshow.com/amsterdam
May 22-24, 2024
World Brush Expo | Bologna, Italy
New expo set to launch in 2024 to serve the brush, broom, mop and paint applicator industry. The event is being held as a joint effort of the American Brush Manufacturers Association and the European Brush Federation. www.worldbrushexpo.com
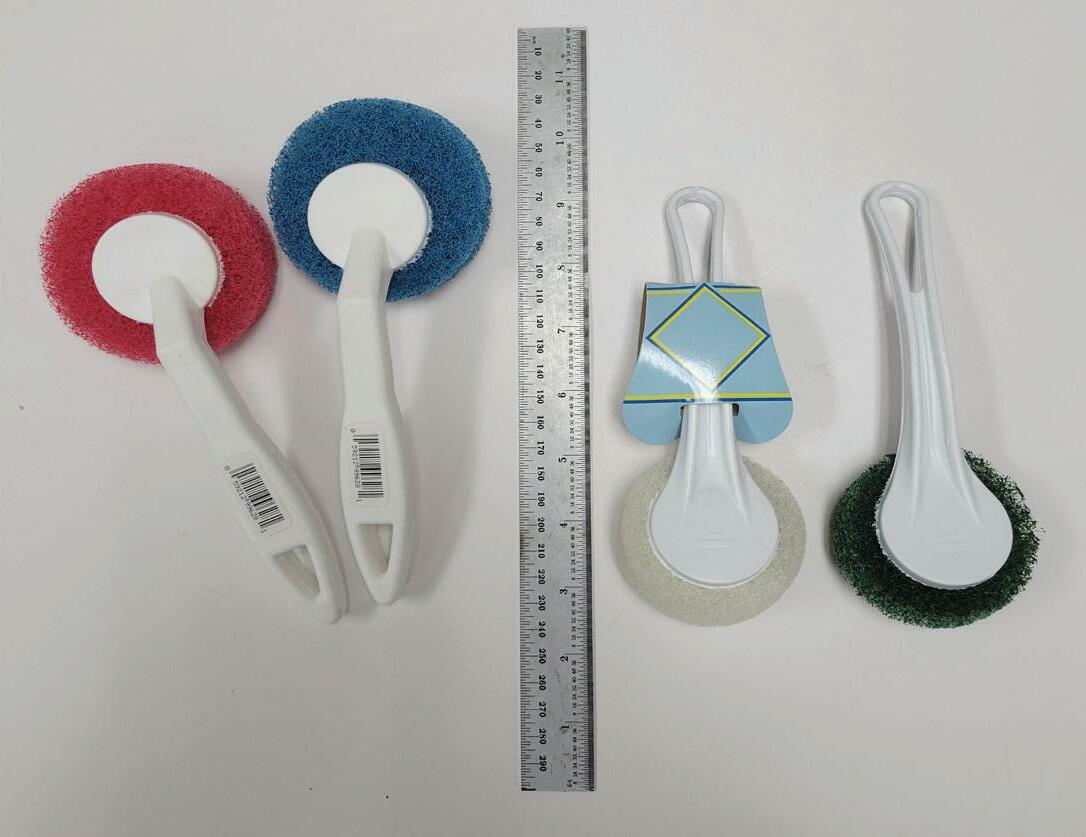
2 plastic injection moulds with MSM 30 ton moving head press. Includes assembly machine to manufacture 2 sizes of pot scrubbers in picture. $50,000 USD or Best Offer
CONTACT: Gemicor Products Inc. Montreal Canada PHONE: 514-747-9856
WHATSAPP: 514-445-9725 EMAIL: gemicor@Qc.aira.com
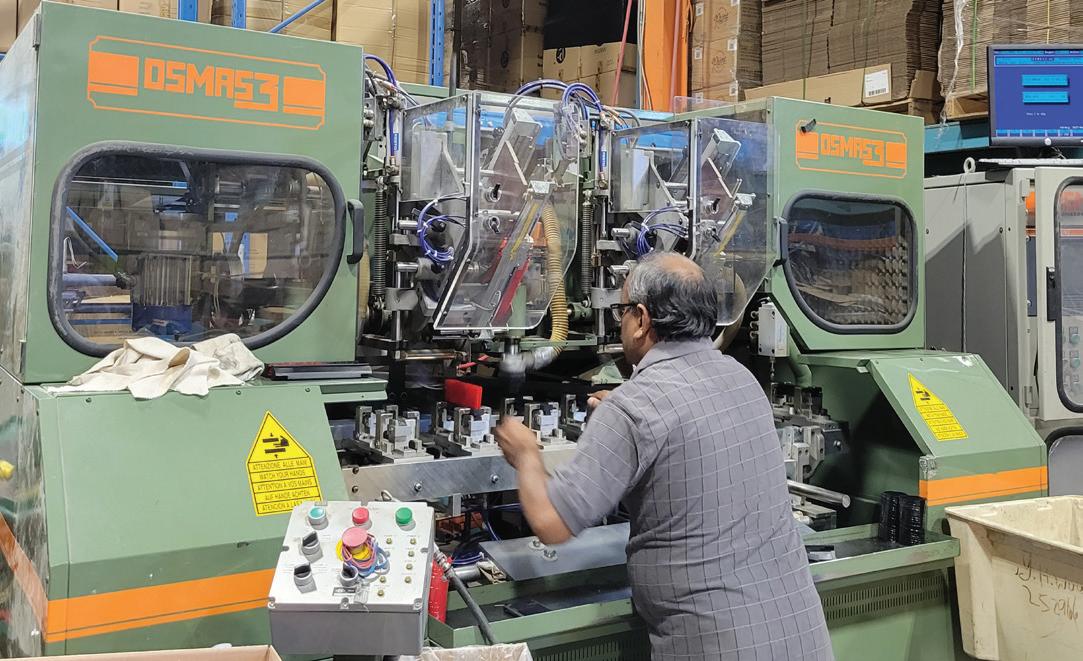
Wright-Bernet Brush Company is offering a brand new drum of 15 gauge wire for street brooms. The asking price is $500 plus shipping and Wright-Bernet is based in Hamilton, Ohio.
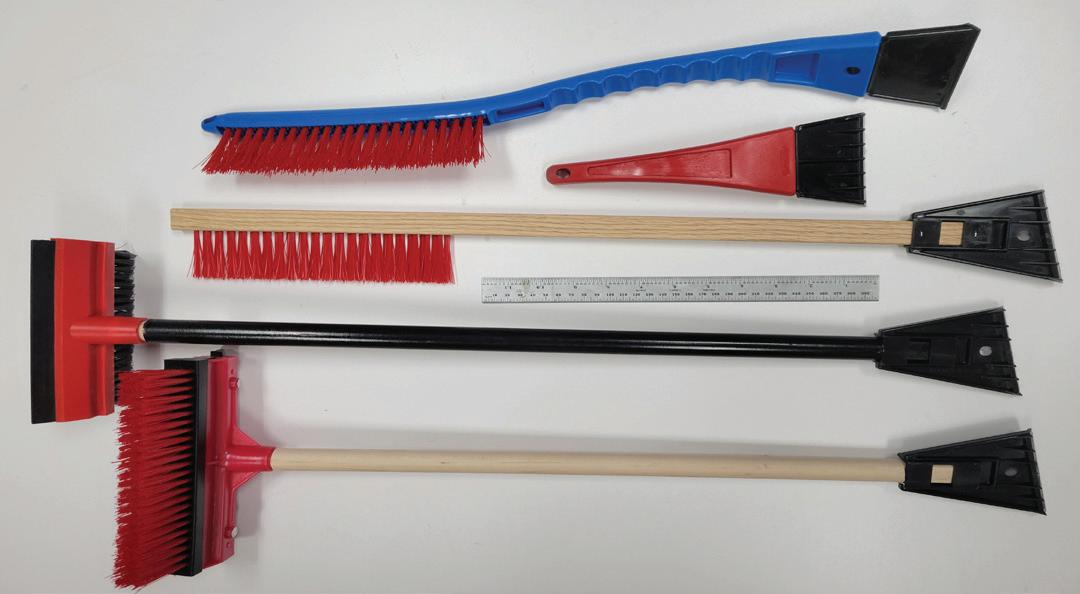
CONTACT: James Cox PHONE: 513-889-0500
EMAIL: Jimnwestern1@aol.com
3 plastic injection moulds and assembly machine for the manufacture of 3 styles of dish mops in picture. $50,000 USD or Best Offer
CONTACT: Gemicor Products Inc. Montreal Canada PHONE: 514-747-9856
WHATSAPP: 514-445-9725
EMAIL: gemicor@Qc.aira.com
OSMAS Filling Machine Model A2E-90-FM610. Set up for different styles of Snow Brushes in picture. Includes 9 moulds for all plastic injection parts Stapling and Rivet machines included. $100,000 USD or Best Offer
CONTACT: Gemicor Products Inc. Montreal Canada PHONE: 514-747-9856 WHATSAPP: 514-445-9725 EMAIL: gemicor@Qc.aira.com

Schlesinger AM-1 push broom and brush trimmer. $1,000 USD or Best Offer
CONTACT: Gemicor Products Inc. Montreal Canada PHONE: 514-747-9856
WHATSAPP: 514-445-9725
EMAIL: gemicor@Qc.aira.com
Classified ads are available to subscribers or advertisers of Brushware; note that only listings of merchandise/machinery wanted or for sale (used), and job opportunities, are acceptable. Classified ads include a headline (10-word) limit, description (100word limit), one image (photo or logo) and contact detail fields (phone, email, etc.). Additional images are charged at a rate of $95 per image to be printed in the magazine.
Brushware reserves the right of refusal for publication. Classified ads will appear in the weekly newsletter for eight issues.
Fill out your request form at: www.brushwaremag.com/classifieds
CONTACT: Susan Goodwin
EMAIL: info.brushware@goodwinworldmedia.com
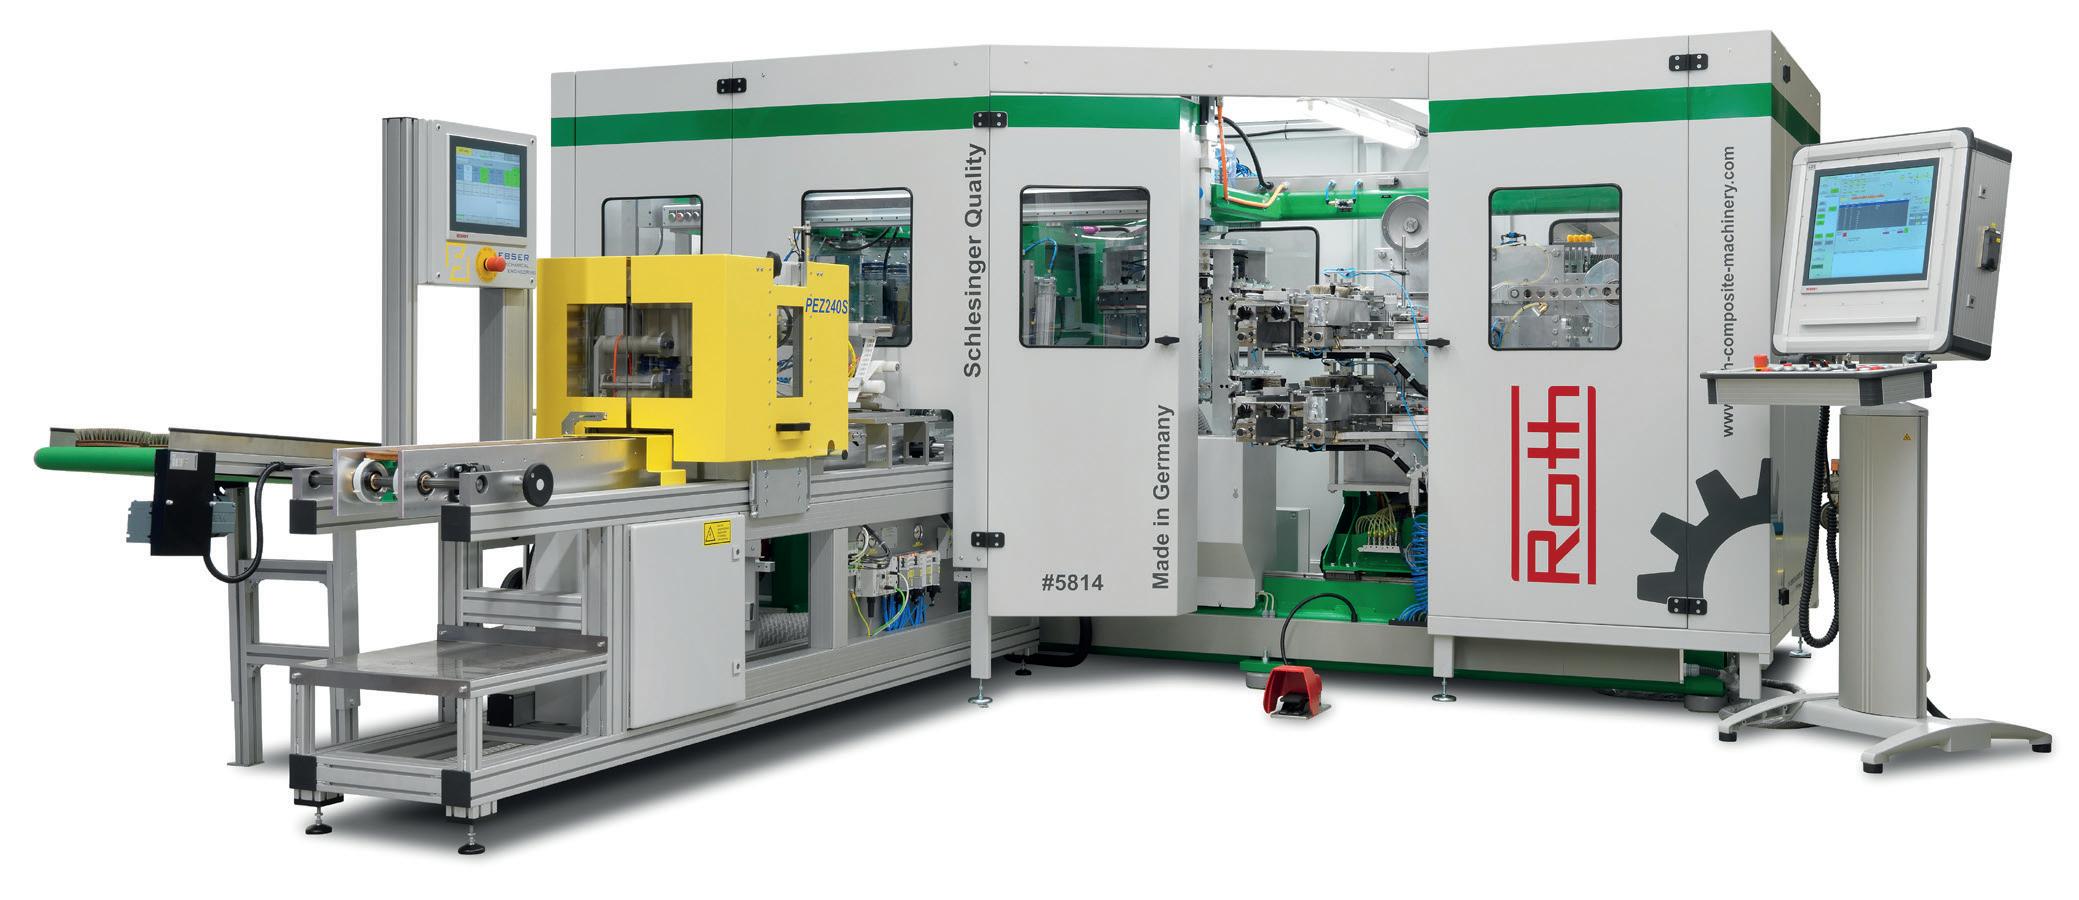

www.brushwaremag.com/enewsletter


ABMA .............................................................................. 04 www.abma.org
ArroWorthy ...................................................................... 30 www.arroworthy.com
Brush Fibers ............................................ Inside Back Cover www.brushfibers.com
Carnevali Dino ................................................................ 31 www.carnevalidino.it
DKSH .............................................................................. 03 www.dksh.com/ch-de/home
DuPont Filaments 08-09 www.filaments.dupont.com
FM Brush ........................................................................ 35 www.fmbrush.com
Gordon Brush.................................................................. 25 www.gordonbrush.com
Gornell Brush .................................................................. 38 www.gornellbrush.com
Leistner Drills ................................................................. 33 www.leistner-gmbh.de MFC ................................................................................ 21 www.mfc-usa.com
MGG North America ................................. Inside Front Cover www.mggmeccanica.com Mill-Rose Co., The ........................................................... 01 www.millrose.com
Monahan Filaments ........................................................ 29 www.monahanfilaments.com
Paggin ............................................................................ 37 www.paggin.it
Perlon/Hahl ........................................................ Back Cover www.perlon.com
PMM Brightline 13 www.pmmbrightline.com
Roth Composite Machinery GmbH ................................... 47 www.roth-composite-machinery.com
Royal Paint Roller Mfg. Corp. ........................................... 48

Schaefer Brush ............................................................... 27 www.schaeferbrush.com
Stainless Steel Products ................................................. 15 www.stainlesswires.com Young & Swartz, Inc. ....................................................... 36 www.youngandswartz.com
