Waterbirds in the UK 2021/22


The annual report of the Wetland Bird Survey and the Goose & Swan Monitoring Programme


Waterbirds in the UK 2021/22
The annual report of the Wetland Bird Survey and the Goose & Swan Monitoring Programme
The Wetland Bird Survey (WeBS) is the principal scheme for monitoring the UK’s wintering waterbird populations, providing an important indicator of their status and the health of wetlands. Waterbirds in the UK 2021/22 is the 40th WeBS annual report and comprises this summary report and data at: www.bto.org/webs-reporting
British Trust for Ornithology
The Nunnery
Thetford
Norfolk IP24 2PU www.bto.org
Joint Nature Conservation Committee
Quay House
2 East Station Road, Fletton Quays
Peterborough
PE2 8YY www.jncc.gov.uk
Royal Society for the Protection of Birds
The Lodge
Sandy Bedfordshire
SG19 2DL www.rspb.org.uk
NatureScot

Great Glen House Leachkin Road
Inverness IV3 8NW
www.nature.scot
We are indebted to the time and skills of the thousands of WeBS and GSMP Counters who collected the data used in this report and to the invaluable efforts of the WeBS Local Organisers who are listed on the back cover.
The WeBS Local Organiser Advisory Committee (LOAC) (members listed on page 43) provided advice on behalf of Counters and Local Organisers. The BTO Information Systems team delivered essential technical assistance and continues to develop and provide assistance for WeBS Online and WeBS Report Online.
THE WeBS PARTNERSHIP
WeBS is a partnership jointly funded by BTO, RSPB and JNCC, with fieldwork conducted by volunteers and previous support from WWT.
The permanent members of the WeBS Steering Committee in 2021/22 were Teresa Frost (BTO), Dawn Balmer (BTO), James Pearce-Higgins (BTO), Anna Robinson (JNCC), Kirsi Peck (JNCC), Simon Wotton (RSPB) and Colette Hall (WWT).
THE GSMP PARTNERSHIP
GSMP is a partnership, run by and jointly funded by BTO, JNCC and NatureScot with fieldwork conducted by both volunteer and professional surveyors.


THE WeBS AND GSMP TEAM AT BTO
Teresa Frost – WeBS Manager
Gillian Birtles – WeBS Counter Network Organiser
Neil Calbrade – Wetland Bird Surveys Officer
Graham Austin – Senior Research Ecologist
Steve Pritchard – Database Developer
Oliver Barrett – Web Software Developer
Mark Hammond – Web Software Developer
Dawn Balmer – Head of Surveys
Email: firstname.surname@bto.org
General enquiries to WeBS and GSMP: BTO, The Nunnery, Thetford, Norfolk IP24 2PU
Email: webs@bto.org or gsmp@bto.org
Tel: 01842 750050
WeBS website: www.bto.org/webs
GSMP website: www.bto.org/gsmp
We are also grateful to the following for providing supplementary information, data inputting, proof-reading and particularly invaluable help in 2021/22: Deborah Newman, Justin Walker, Niall Burton, James PearceHiggins, Royal Air Force Ornithological Society (RAFOS) and Chris Waltho. Grateful thanks to all and apologies to anyone who has been inadvertently missed.
Report content and production was by Graham Austin, Teresa Frost, Gillian Birtles and Neil Calbrade. The article on the Echoes project was by Katharine Bowgen (BTO Cymru). Analysis of the GSMP data was carried out by Kirsi Peck (JNCC).
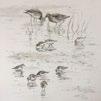
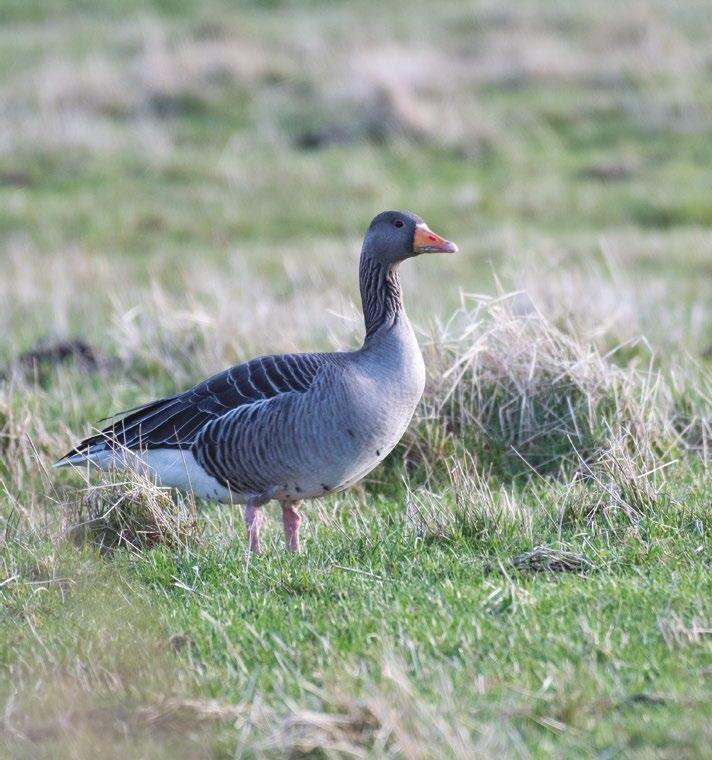
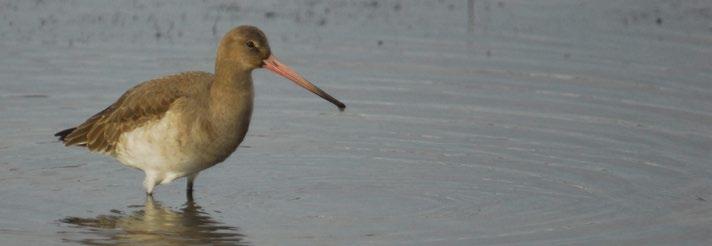
The painting of the Black-tailed Godwit and Dunlin used on the cover of this report is by Immy Hathaway. For more of Immy’s work, see https://www.instagram.com/immyhathaway_ artwork. All other artists and photographers are acknowledged on the pages of this report.
Maps in this report contain Ordnance Survey data © Crown Copyright and database right 2023. This report was printed by Swallowtail Print, Norwich.
More information, including site tables and trends for all regular WeBS species, is available online at: www.bto.org/webs-reporting
This summary report can be downloaded from the WeBS website at: www.bto.org/webs-publications
The online and summary outputs in conjunction constitute the report Waterbirds in the UK 2021/22.
Austin, G.E., Calbrade, N.A., Birtles, G.A., Peck, K., Wotton, S.R., Shaw, J.M., Balmer, D.E. & Frost, T.M. 2023. Waterbirds in the UK 2021/22: The Wetland Bird Survey and Goose & Swan Monitoring Programme . BTO/ RSPB/JNCC. Thetford.
Published by the British Trust for Ornithology, Royal Society for the Protection of Birds, Joint Nature Conservation Committee and NatureScot, April 2023.
© British Trust for Ornithology, Royal Society for the Protection of Birds, Joint Nature Conservation Committee and NatureScot, 2023.
ISBN 978-1-912642-50-2
ISSN 1755-6384
Just a small selection of notable stories from 2021/22.
3,694 registered WeBS volunteers
Welcome back to the 40th WeBS annual report, Waterbirds in the UK 2021/22. Whilst the focus of this report is the July 2021 – June 2022 WeBS year, the WeBS Report Online has also been updated in this report with site peak count data for the 2020/21 WeBS year. It was not analytically possible to produce statistics for the 2020/21 dataset as usual. In place of the usual report, a newsletter, WeBS News 2020/21 Special Edition, was published, containing a report on a simulation study of the impacts COVID-19 restrictions in early 2021 had on the usual WeBS indices and trends. Now, with some minor adjustments (see pages 10 and 40), the usual production of WeBS statistics has been resumed. Dr Graham Austin has led or been involved with WeBS data analysis for the past 30 years and is planning for a well-deserved retirement this summer; adapting to the COVID-19 impacts on the dataset has kept the production of his final production of WeBS annual statistics as challenging as ever.
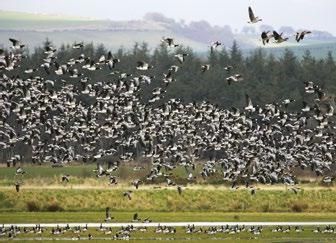
In this report we focus particularly on migratory species that link us with Iceland, Greenland and eastern Canada. With Highly Pathogenic Avian Influenza (HPAI) having had worrying impacts on waterbirds, seabirds and domestic birds over the past two years, this migratory route has been highlighted as a possible pathway for how the latest H5N1 virus strain reached the Americas. New threats like avian flu add to those of climate change and habitat loss, so understanding the migration and needs of the component of our wintering waterbird communities that head north-west to breed has never been more relevant. Effective monitoring of these populations in the UK is critical, and so it is reassuring that Core Count visits were made to a record 3,326 sites in 2021/22.
Waterbirds in the UK has always included summary results from the Goose & Swan Monitoring Programme, but with recent changes to the partnership, this report is now the primary reporting mechanism for GSMP results. This includes the Icelandic-breeding Goose Census (IGC) and Age Assessments, as well as bringing together results for special surveys and surveys led by other groups. The 2021/22 field season was coordinated by WWT and the reporting and analysis was led by JNCC; the results can be found in pages 34–36. The impact of avian influenza was particularly felt in the Svalbard Barnacle Goose population, as reported on page 37.
Core Counts were carried out at 5,772 WeBS sectors (count units) at 3,326 sites from July 2021 to June 2022.
Not all Core Counts are linked to individual Counters in the WeBS Online database, but some are; 2,633 Counters named as the lead counter were associated with WeBS Core Count visits made in 2021/22. Including additional team members, the number of registered WeBS volunteers was 3,694.
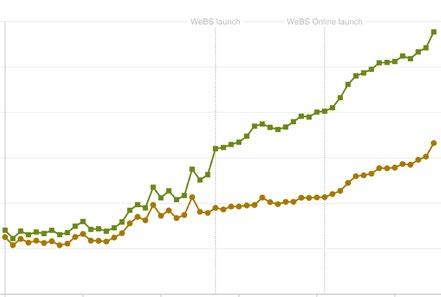
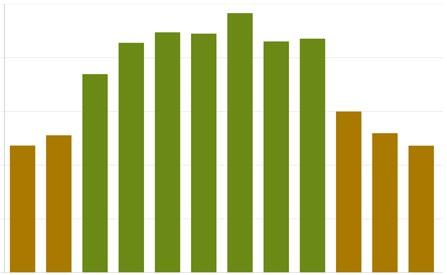
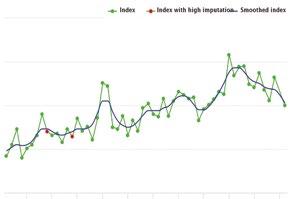
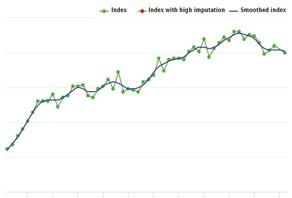
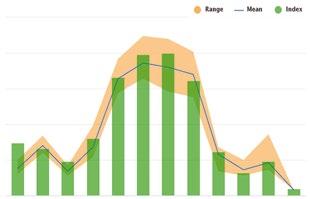
There were 44,149 count visits, 70% in the core September–March period (green bars on lower graph).
Number of WeBS count sectors (green squares) and sites (gold circles) covered annually 1966/67–2021/22.
Number of WeBS Core Count visits in 2021/22 by month during the core winter period (green bars) and the rest of the year (gold bars).
A record-breaking 44,149 Core Counts were made in 2021/22 — an incredible 10% increase on the previous record in 2018/19!
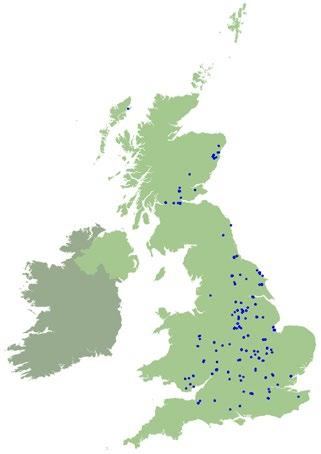
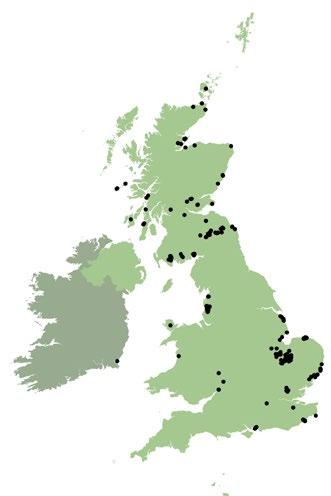
Counts were carried out at 3,326 wetlands in 2021/22 .
Areas shown in black were counted at least once by WeBS Core Counts – providing a picture of the excellent geographical coverage achieved.
For sites covered by I-WeBS in Ireland, please see the I-WeBS pages at birdwatchireland.ie


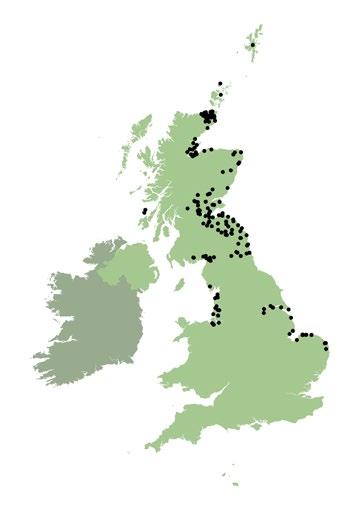
Twenty UK estuaries were counted at low tide, generating important data about feeding areas.
The WeBS Low Tide Count scheme facilitates the collection of information about use of the UK’s estuaries by waterbirds at low tide. The scheme has flourished since its inception in the winter of 1992/93, with all the major estuaries in the UK having been counted at least once since then. The scheme aims to monitor, assess and regularly update information on the relative importance of intertidal feeding areas of UK estuaries for wintering waterbirds, and in doing so complements information gathered on populations through the WeBS Core Counts.
Information collected at low tide represents an important contribution to the conservation of waterbirds, by providing supporting information for the management of UK Ramsar Sites and Special Protection Areas (SPAs), other site designations, and whole estuary conservation plans. Numbers of waterbirds present in predefined sectors are counted. Most individual estuaries are counted at low tide once every six years, although on some sites more frequent counts are undertaken.
Further information about WeBS Low Tide Counts is available online via www.bto.org/websreportinglowtide including data summaries and dot density distribution maps for different estuaries and species. Dot density maps are now available for all species and years, including the facility to show any combination of site, species and year side by side for comparison. Presentation of WeBS low tide information typically takes two forms: (i) tabulated statistics of peak numbers and mean densities, and
(ii) dot density maps to give a visual representation of species’ foraging densities across a site. Dots do not represent the precise positions of
birds; they are assigned to habitat components proportionally and placed randomly within those areas. No information about distribution of birds at a finer scale than the count sector level should be inferred. For all maps on the online reporting interface, one dot is equivalent to one bird.
During 2021/22, complete WeBS Low Tide Counts were carried out
at 19 estuaries, and on selected sectors on a further estuary. On several sites – Poole Harbour, Kingsbridge Estuary, Blyth Estuary, Wyre Estuary and Helford Estuary – Core Counts are carried out annually at low tide and data feed into both schemes, allowing assessment of distributional changes. Results from the counts on the Swale Estuary are presented on pages 38 – 39 of this report.
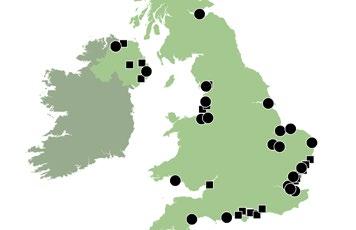
Estuaries counted as part of the WeBS Low Tide Count scheme in 2021/22.
The winter of 2021/22 was the UK’s eighth mildest recorded, with December starting off cold, but then becoming milder with few frosts and average rainfall. January was dry, but February was unsettled with frequent rain and a stormy period in the week up to and including the WeBS Core Count date. Despite some cold nights in January in England and Wales, the overall temperatures for December, January, and February were above the long-term average, with the monthly mean temperatures 1.1, 0.8 and 1.5 degrees celsius above average respectively.
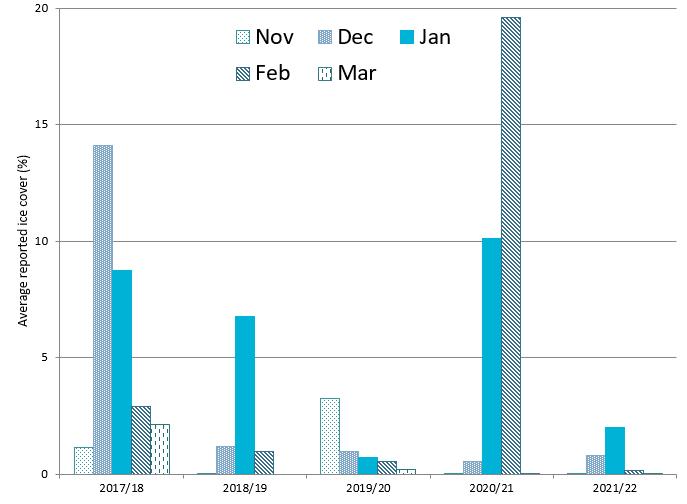
The mild conditions were reflected in ice cover reported by WeBS Counters, with no months having significant ice reported. The highest proportion was around the Core Count on 23 January occurring on various sites in Great Britain, but the national average was only 2% ice cover, so overall ice cover during core counts was even lower than 2019/20.
December temperatures in the Baltic were cold, with a marked contrast between the north-east of Europe with the mild conditions in the south and west of the continent; but as the winter continued, the north-east became warmer than average.
Few research station reports on the 2021 Arctic breeding season were available, but it was noted at Pura station in Taimyr, Russia that fewer waders were present than in 2015–2017 and breeding success was average.
WeBS sites counted between Thursday 20th and Wednesday 26th January 2022 with recorded ice cover of 5% or more.
Average WeBS sector ice cover for 2017/18–2021/22, as reported by Counters for the months November–March. Note that in 2020/21 proportionally more counts carried out than normal were in Scotland due to COVID-19 restrictions.
Climate summaries from: metoffice.gov.uk, en.ilmatieteenlaitos.fi and climate.copernicus.eu/surface-airtemperature-maps
Hydrological summaries from: nrfa.ceh.ac.uk
Arctic breeding from: www.arcticbirds.net
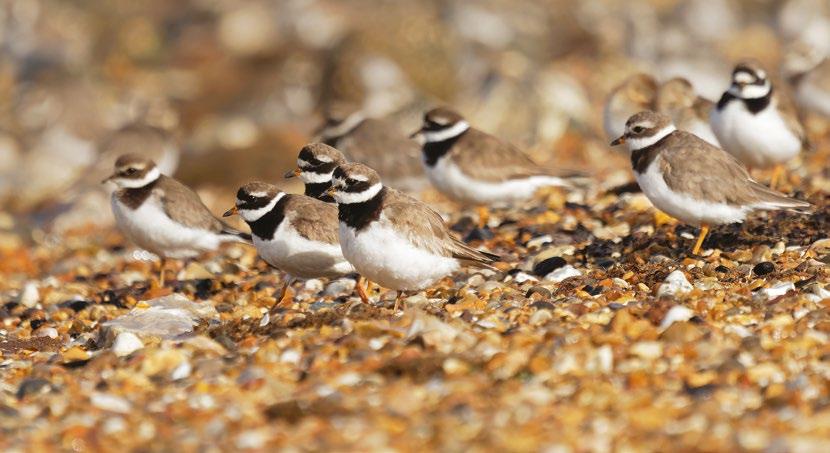
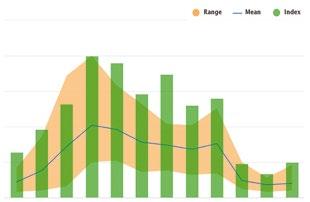
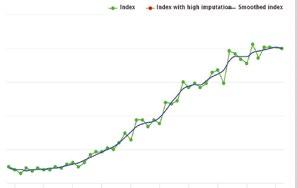
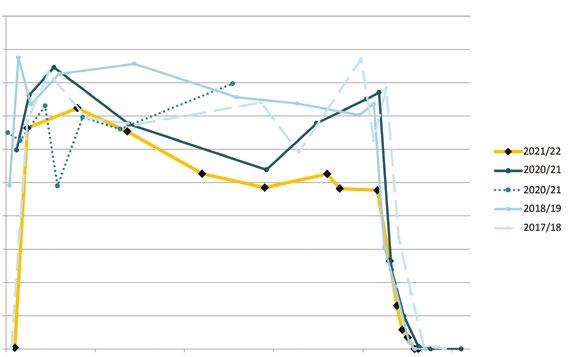
The UK Ringed Plover month index plot suggests high passage in August and September, whereas winter numbers were similar to recent years. BirdTrack reporting rates suggest the peak might have been a week earlier than usual, possibly increasing the number present during the August Core Count. Green bars = 2021/22; blue line/orange hatched area = previous five-year mean/range.
Following the addition of an age recording facility in WeBS, three sites provided breakdowns for Ringed Plover, with 159 adults and 68 young recorded between August and October 2021. WeBS Counters are encouraged to start adding this extra information when they can, to improve productivity monitoring in future.
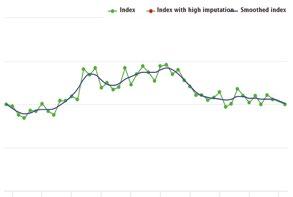
As an increasing resident, it is unsurprising that the Great White Egret UK monthly index was higher than the recent five-year average in every month.
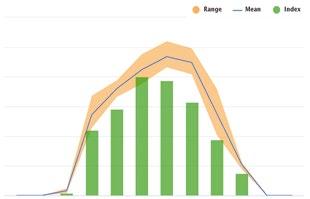
Green bars = 2021/22; blue line/orange hatched area = previous five-year mean/range.
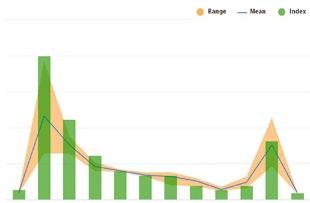
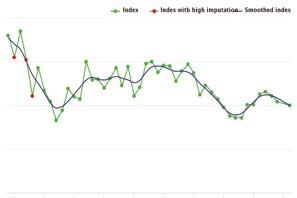
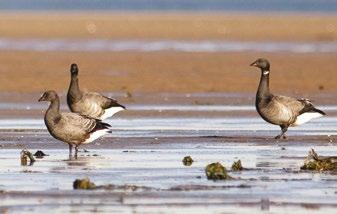
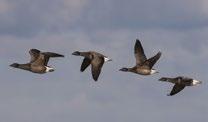
The UK Dark-bellied Brent Goose month index plot indicates some individuals may have left early, with numbers dropping faster than usual after January.
Green bars = 2021/22; blue line/orange hatched area = previous five-year mean/range.
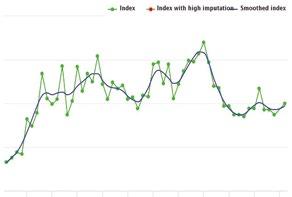
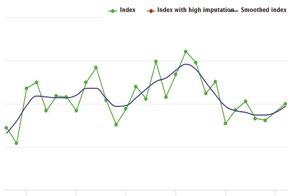
Indices and smoothed indices are plotted in the WeBS Report Online for all waterbird species with sufficient data for the UK, Great Britain, Scotland, Northern Ireland, England and Wales. Annual species indices, smoothed indices, and 25- and 10- year trends are available under an Open Government Licence from www. bto.org/webs-annual-report as a spreadsheet download.
Table 1 contains 25- and 10-year trends for the most abundant waterbird species for the UK and Table 2 contains the equivalent trends for Scotland, Northern Ireland, England and Wales.
Uncertainty due to low numbers and incomplete coverage means some species are not included in Table 1 and 2 but are available online. For further detail, please refer to the WeBS Report Online and spreadsheet download.
Index values for 2020/21 are not available due to data limitations related to COVID-19 restrictions (Frost & Calbrade, 2022). However, the 25- and 10-year trends up to 2020/21 can be presented, as this is part of a longer smoothed trend.
The 25-year trend for Moorhen is available for the first time and shows a trend of -13%.
Resident geese continue to do well with Canada Goose, Naturalised Barnacle Goose, British/Irish Greylag Goose and Egyptian Goose all having positive trends. The Mute Swan population appears to be declining slightly, with a 10-year trend of -3% and is one to observe closely over the next few years, as this species is known to have suffered avian influenza mortalities.
The Greenland (10-year trend +24%) and Svalbard (10year trend +10%) Barnacle Goose populations are also known to have had significant avian influenza mortality events and continued monitoring will be essential to see if there are population level impacts.
Bewick’s Swan (10-year trend -90%) saw another record low index value in 2021/22 but Whooper Swan (10-year trend +27%) reached another high.
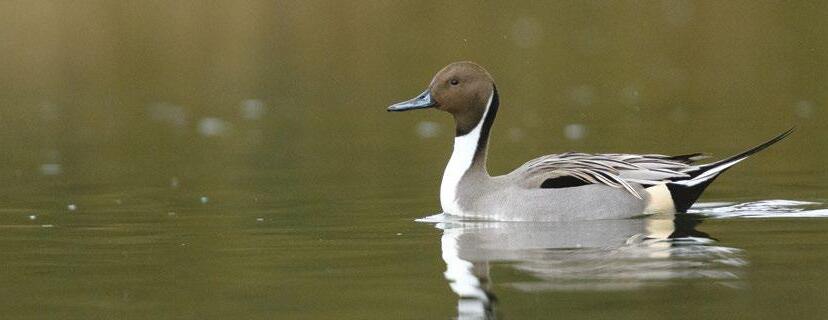
Twelve of the species in Table 1 have declining 10-year trends, with increases for only Mandarin Duck, and Shoveler, which reached a record high. The Pintail 10-year trend is now stable, but the 25-year trend is still down by 28%. The indices for Pochard (10-year trend -39%) and Mallard (10-year trend -22%) again reached record lows as did Smew (10-year trend -77%).
Ten-year trends were mixed for waders, with positive values for Avocet, Black-tailed Godwit, Golden Plover, Knot and Sanderling. Conversely, Bar-tailed Godwit, Curlew, Purple Sandpiper, Oystercatcher, Grey Plover and Ringed Plover all had declines of 10% or more over the decade. The Bar-tailed Godwit (10-year trend -30%) index was a record low; this index has historically shown large fluctuations but in recent years has shown a small, steady decline. The Sanderling (10-year trend +7%) index was a record high.
OTHER WATERBIRDS
Declines continued for Coot (10-year trend -27%) and Red-necked Grebe (10-year trend -20%) which both saw record low index values. Egrets continued to do well with record highs for Little Egret (10-year trend +59%), Cattle Egret and Great White Egret.
For all trend graphs see the online report:
www.bto.org/webs-reporting

A concise summary of how the UK’s most familiar waterbirds fared in 2021/22
Trends are % changes of smoothed population index values for the most abundant waterbirds in the UK. *Eider trends exclude birds on Shetland (of faeroeensis race).
The longer term smoothed trend refers to the 25-year period 1995/96 to 2020/21. The shorter term smoothed trend refers to the 10-year period 2010/11 to 2020/21. Note, it is customary to truncate the final year when reporting smoothed trends, so whilst data from 2021/22 have been used in creating the smoothed index values, the trend period assessed and reported is until 2020/21.
Preceding each species is an indication of flyway population trend, based on: Nagy, S. & Langendoen, T. 2018. Seventh AEWA Report on the Conservation Status of Migratory Waterbirds in the Agreement Area. Wetlands Int., NL. increasing, decreasing, stable, n/a not applicable as population is non-native (Canada Goose, Egyptian Goose, Mandarin) or non-migratory (Mute Swan, British/Irish Greylag Goose, Naturalised Barnacle Goose and Eider*).
Trends use WeBS data except for Pink-footed Goose, Greenland White-fronted Goose, Icelandic Greylag Goose, Greenland Barnacle Goose, Svalbard Barnacle Goose and Canadian Light-bellied Brent Goose, for which dedicated censuses are undertaken (see pages 35–37).
Pintail down 28% since 1995/96.
Trends are % changes of smoothed population index values for the most abundant waterbirds in the UK; note these may only be present in small numbers in some countries. *Eider trends exclude birds on Shetland (of faeroeensis race).
The longer term smoothed trend refers to the 25-year period 1995/96 to 2020/21. The shorter term smoothed trend refers to the 10-year period 2010/11 to 2020/21. Note, it is customary to truncate the final year when reporting smoothed trends, so whilst data from 2021/22 have been used in creating the smoothed index values, the trend period assessed and reported is until 2020/21.
Trends use WeBS data except for Pink-footed Goose, Greenland White-fronted Goose, Icelandic Greylag Goose, Greenland Barnacle Goose, Svalbard Barnacle Goose and Canadian Light-bellied Brent Goose, for which dedicated censuses are undertaken (see pages 35–37).
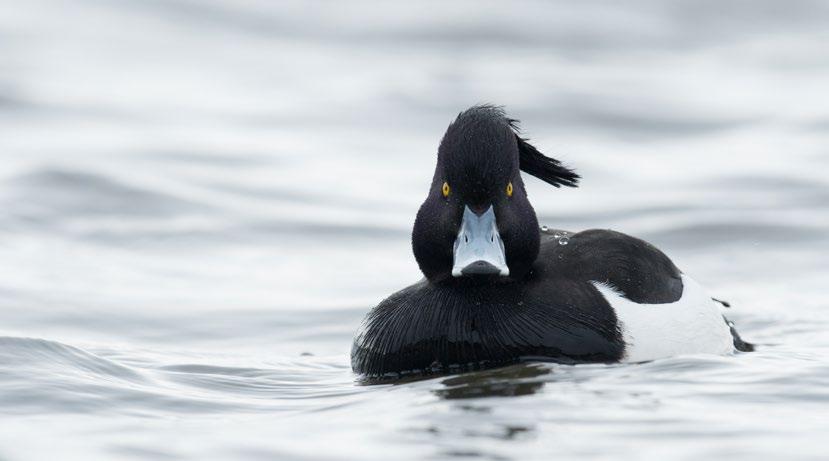
Tufted Ducks have seen a 76% decline in Northern Ireland and a 10% decline in Scotland since 1995/96, but a 19% increase in both England and Wales in the same period. The differences are likely to be caused by the breeding origin of the birds wintering around the UK, and the greater availability of favoured artificial waterbodies in southern Britain.
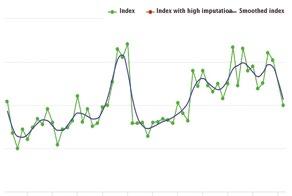
WeBS trend for Tufted Duck in England. Green dots = annual index; blue line = smoothed trend.
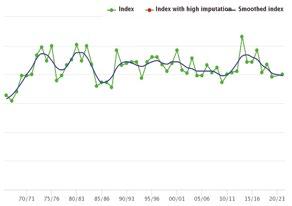
WeBS trend for Tufted Duck in Scotland. Green dots = annual index; blue line = smoothed trend.
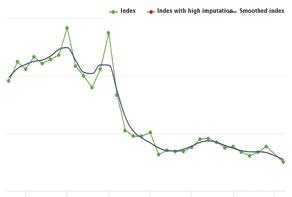
WeBS trend for Tufted Duck in Wales. Green dots = annual index; red dots = sparse data; blue line = smoothed trend.
WeBS trend for Tufted Duck in Northern Ireland. Green dots = annual index; blue line = smoothed trend.
 TUFTED DUCK BY SARAH KELMAN/BTO
The UK’s wetlands support millions of waterbirds each winter.
WeBS site totals indicate which sites support the largest aggregations of waterbirds each year. Understanding precisely how many individual birds use a site is clearly very difficult to ascertain from counts alone, as many sites are used by migrants on passage and consequently there can be high turnover rates.
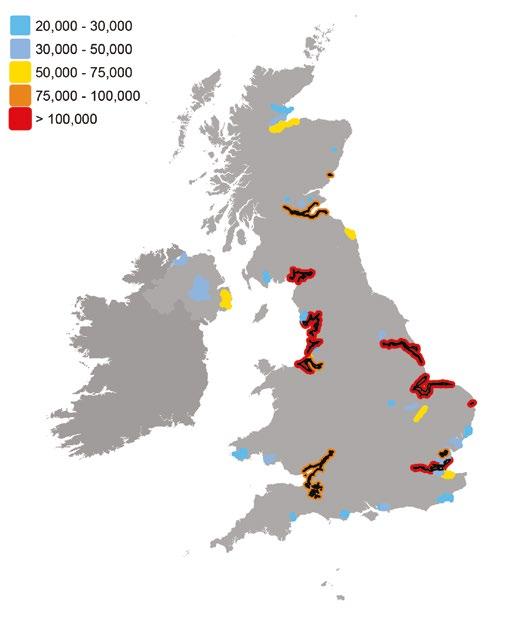
Table 3 lists the Principal Sites for non-breeding waterbirds. The totals are the summed counted maxima for each species during the course of the WeBS year (missing counts are not imputed; supplementary counts are included). Sites with a fiveyear average of 20,000+ waterbirds are listed. Non-native species (e.g. Canada Goose and Mandarin) have been excluded from the totals. Although an important component of a site’s waterbird fauna, gulls and terns are also excluded, since the recording of them during WeBS Counts is optional.
In addition to Table 3, it is possible to view the totals for all WeBS sites via the WeBS Online Report ‘Site Totals’ tab. In the interactive table of sites, non-native species, gulls and terns and supplementary counts can be included or omitted as desired by the user. By default only the major sites with over 1,000 birds are listed, but the filter can be changed to all sites in a county or country. Selecting a site will show the species for which that site holds more than the national or international importance thresholds.
Some monthly surveys in 2020 and 2021 were affected by COVID-19 restrictions. As a result, this may have depressed site-species peaks, and in turn, the site waterbirds aggregation total for the 2019/20 and 2020/21 years, and hence the five-year mean for certain sites in Table 3. The sitespecies peak for each site is available on the WeBS Report Online. If
the species peak for a given site has typically been from a month affected by COVID-19 restrictions during 2019/20 or 2020/21, the month of the peak is bracketed online. Furthermore, the peak count value itself has been bracketed to indicate that it would be expected to have been higher had complete counts been available from the months affected by the covid restrictions and may in turn have affected (generally depressing) the five-year mean. See page 41 for more information.
The number of sites with a fiveyear average in excess of 100,000 birds remained at nine. In 2021/22, 49 sites had a five-year average in excess of 20,000 birds, which is one fewer than in 2019/20. The Loch of Strathbeg and West Water Reservoir no longer appear in Table 3, however, The Wilderness - Ladybank is now listed, due to increasing numbers of Pink-footed Geese counted during the Icelandicbreeding Goose Census counts.

• Totals are the sum of species maxima during the WeBS year at each site, using data from all months. This summary does not account for missed visits or reduced coverage, from COVID-19 restrictions or otherwise.
• Some totals may differ slightly from those published in previous annual WeBS reports due to late or amended data.
• Non-native species (such as Canada Goose and Mandarin), are excluded, as are gulls and terns due to incomplete coverage.
• A more comprehensive table showing all sites is available online via: www.bto.org/webs-reporting-site-totals.
A look at UK waterbird connections with Iceland, Greenland and Canada.

In spring, migratory waterbirds that have been monitored in the UK by WeBS and GSMP Counters during the winter, head to their breeding areas. Whilst many migrate to Fennoscandia or Russia, others go north-west. The breeding areas to the northwest are in Iceland, which, like the UK, is part of the Palearctic global region, and in Greenland and Canada within the Nearctic global region.
Iceland alone is estimated to be home to over 5,000,000 breeding waders and 800,000 wildfowl that migrate south, most either wintering in or passing through the UK. Many of these birds breed in landscapes such as river deltas near the Icelandic coast, but some, for example Pinkfooted Goose, use the inland highlands. Iceland is relatively small compared to Greenland, the world’s largest island, but Greenland’s interior is still covered in a vast ice sheet, so birds there are confined to – still sizeable – coastal regions.
Species familiar to us from our WeBS counts mingle with glamorous Arctic residents such as King Eider, Barrow’s Goldeneye and Harlequin Duck. There are also overlaps with waterbird populations that migrate south along the North American coast, connecting our own East
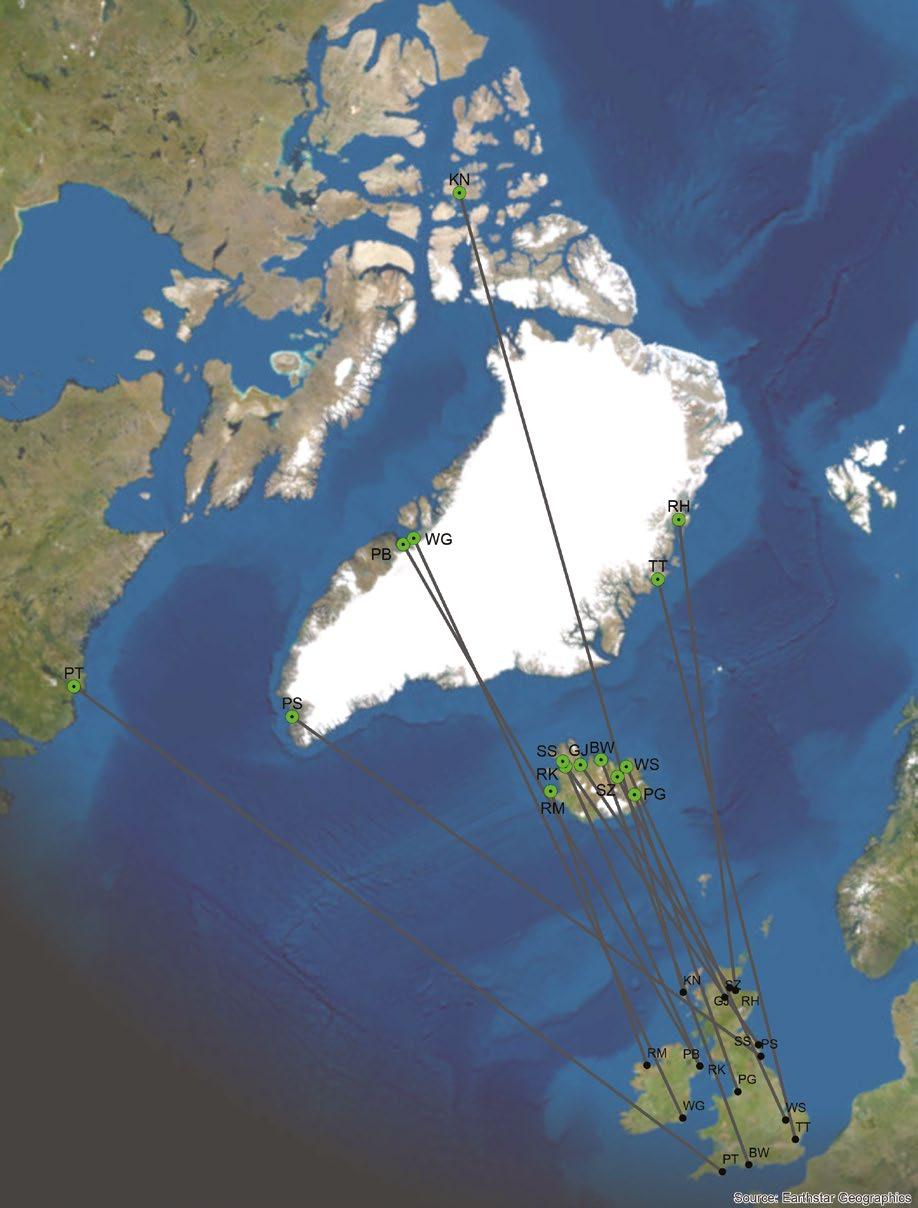
Code Species
Ringed
BW Black-tailed Godwit Langhús, Fljót, Iceland (Jun 2002)
GJ Greylag Goose Loch Eye, Highland (Oct 1998)
KN Knot Ardivachar Point, South Uist (Aug 1985)
PB Light-bellied Brent Goose Mahee Island, Strangford Lough (Feb 2004)
PG Pink-footed Goose Brekka, Fljótsdalur, Iceland (Apr 2016)
PS Purple Sandpiper St Marys Island, Tyne and Wear (Mar 1981)
PT Pintail Tinker Harbour, Hamilton Inlet, Canada (Aug 1948)
RH Red-throated Diver Hvalrosodden, Greenland (Jul 1969)
RK Redshank Mahee Island, Strangford Lough (Oct 2008)
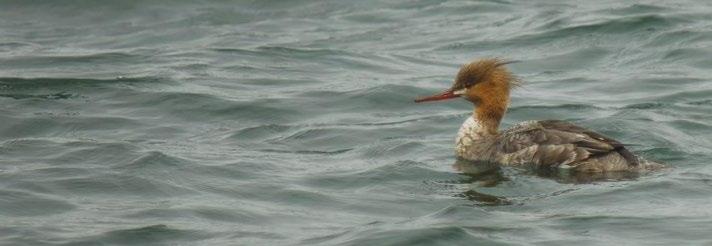
RM Red-breasted Merganser Sandgerði, Iceland (Jun 1962)
SS Sanderling Low Newton-by-the-Sea, Northumb (Dec 2008)
SZ Slavonian Grebe
Atlantic Flyway with the Atlantic Americas Flyway. For example, Canada Geese and Greenland White-fronted Geese are known to interact on their breeding grounds.
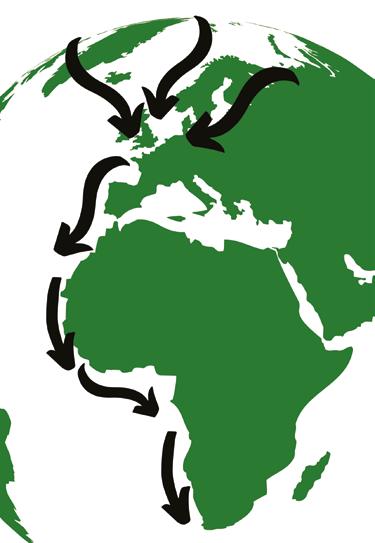
The movement of Highly Pathogenic Avian Influenza (HPAI) around the globe
Sighting
Poole Harbour, Dorset (Apr 2021)
Bergsstaðir, Vatnsnes, Iceland (Sep 2015)
North West Territories, Canada (Jul 1987)
Qasigiannguit, Disko Bay, Greenland (Oct 2006)
Scarisbrick, Lancashire (Oct 2019)
Greenland (Jun 1981)
Stoke Gabriel, Totnes, Devon (Sep 1948)
Burghead, Moray (Feb 1972)
Villingadalur, Iceland (Jun 2016)
Lackan Bay, Mayo (Jan 1969)
Breiðafjörður, Iceland (Jun 2014)
Loch Ashie, Inverness (Oct 2004) Ytrifloi, Myvatn, Sudur-Thingeyjar, Iceland (Jun 2008)
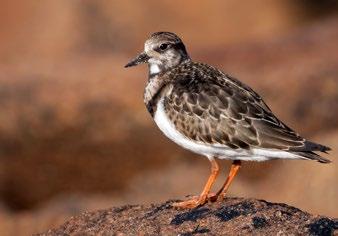
TT Turnstone Bradwell on Sea, Essex (Aug 1958)
WG Greenland White-fronted Goose North Slob, Wexford (Nov 1994)
Daneborg, Young Sound, Greenland (Jun 1956)
Greenland (May 1997)
WS Whooper Swan Welney, Norfolk (Feb 2008) Thvera, Oxarfjordur, Nordur Thingeyjar, Iceland (Apr 2008)
Locations of example ringing records (see Table 4) for 15 waterbird species that breed to the north-west of Britain and Ireland, illustrating some of the migratory links known to exist.
demonstrates the strategic importance of the places where flyways meet, with Iceland a suspected stepping stone between Europe and the Americas (Krone et al . 2022). New and emerging threats such as this demonstrate the value of understanding the migrations of our familiar wetland species.
No less fascinating are the links to the past – prehistoric Branta and Anser goose remains have been found dating to 4,000 years ago in north-western Greenland, and through recent environmental DNA research we have learned ancestral Branta were present in north-eastern Greenland two million years ago, in a warmer boreal forest ecosystem (Kjær et al . 2022, Gotfredsen 2002). Waterbirds have been using these Arctic areas for a
long time, and one wonders whether they were using similar wintering areas then as they do today.
Tracking is greatly increasing our understanding of the migration routes species take, including stopover locations and wintering areas, and is particularly valuable where there are several different populations present in the UK. For example, a recent track for a Greylag Goose tagged in Iceland headed down the west coast of Scotland to Morecambe Bay. Overlapping with British native/re-established populations makes it increasingly difficult to monitor these through the Icelandic-breeding Goose Census, but understanding the distributions of the birds involved is a critical first step.
It is not just geese where populations mingle. Many of the duck and wader species that breed in Iceland and further west pass through the UK, together with individuals from other populations.
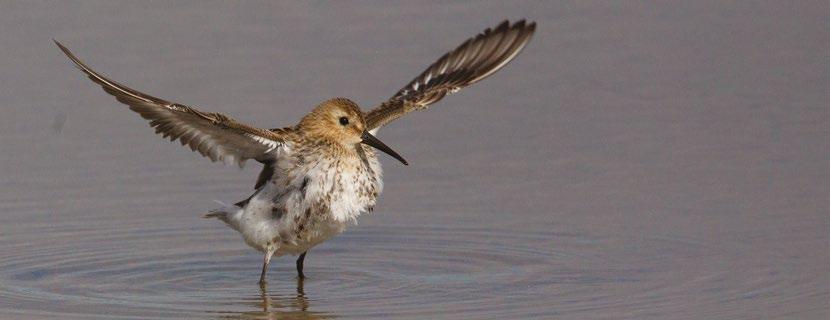
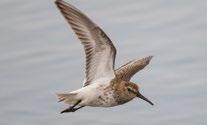
In some cases, it is possible to identify individuals to races that breed in different regions in the field or in the hand during the ringing process. For example, three races of Dunlin are found in the UK, and are separable by bill length and the brightness of the upperparts. Race schinzii breeds mainly in south east Greenland and Iceland as well as Britain and Ireland, and race arctica breeds in north-east Greenland. Both these races mostly winter in West Africa; wintering birds in the UK are mostly race alpina that breed in Fennoscandia. The WeBS trend of -45% (25-year) and -7% (10-year) will thus mostly represent alpina as it is calculated
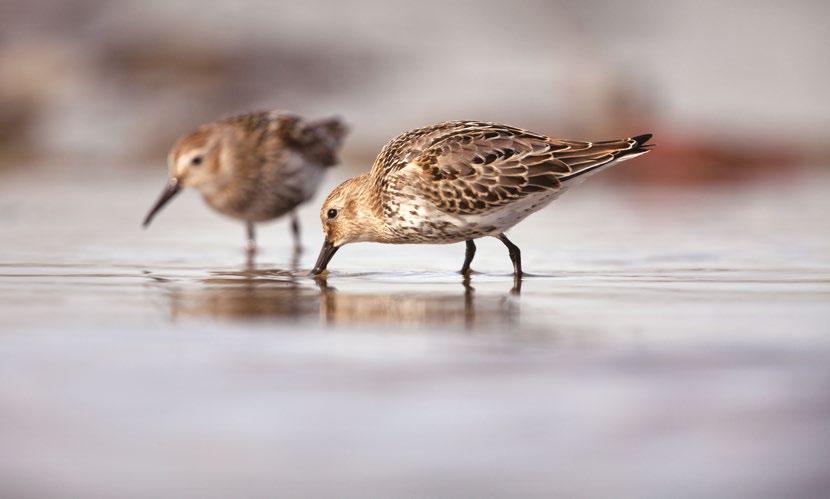
using data from November to March. The pulses of schinzii and arctica birds in May and travelling through can be most clearly seen in the BirdTrack reporting rate of the percentage of complete lists where Dunlin are present, as numerically there are more birds present in midwinter on the WeBS month index chart.
There is also a significant passage of Sanderling and Turnstone that breed as far away as Canada and wintering in southern Europe or Africa as well as some birds wintering in the UK. Sanderling, in particular, occur in greatest numbers in the UK in May and August, and so monitoring outside the winter period will continue to be essential for knowing how Nearctic populations are faring, especially if autumn age ratio monitoring in conjunction with WeBS counts take-up increases, to give extra information on breeding success. BirdTrack reporting rate for
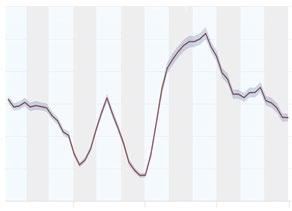
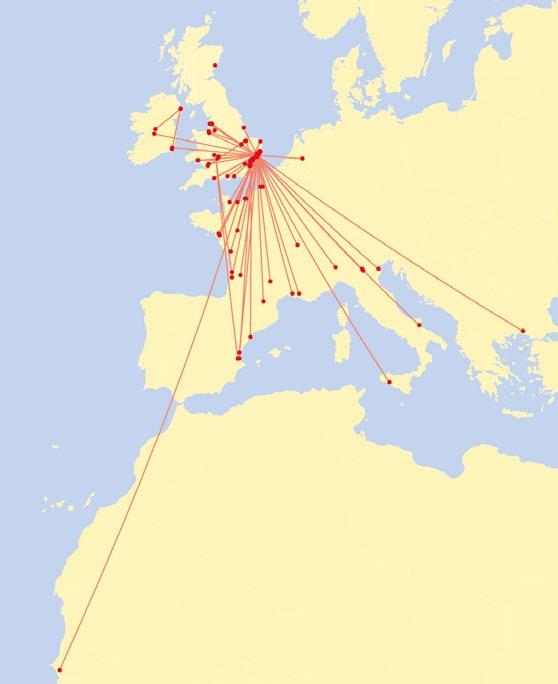
Pintail has no identifiable races, and occurs across the northern hemisphere, so we are reliant on ringing and tracking data to connect breeding, passage and wintering areas. Unfortunately, relatively little ringing is carried out, but there have been recoveries from as far as Canada in the west and the Caspian Sea in the east, although North American outliers may be occasional vagrants. It is thought likely that Icelandic birds pass through early in the season and analysis of ringing data suggests that, perhaps unlike other dabbling ducks dispersing south-south-west, birds travel across the Mediterranean (Wernham et al . 2002). There is much more to learn about the movements of this elegant species.
WeBS trend for Pintail in the UK. Green dots = annual index; blue line = smoothed trend.
Recovery locations, and movements of over 20-km, of 98 Pintail ringed in Britain and Ireland during autumn and recovered before the end of the following winter. From Wernham et al. 2002.
Two populations of Light-bellied Brent Geese winter in the UK and Ireland. One population, of about 3,400 birds, breeds on Svalbard and winters largely on Lindisfarne. The second population, of about 35,000 birds of Nearctic origin, breeds mostly on the Arctic tundra of Canada and Greenland, the majority of which spends the winter in Ireland, with smaller numbers in northwest England and Wales.
Light-bellied Brent Geese (of Nearctic origin) nest on the Arctic tundra, where they have about two months of good weather in which to breed. They leave their breeding grounds by mid September, and arrive in the UK and Ireland in early October. They undertake one of the longest migrations of any Western Palearctic goose population, some 4,500 miles, staging at sites in Greenland and Iceland before crossing the North Atlantic to Ireland. They spend the winter on estuarine sites, where they feed mainly on eelgrass, but also on nearby arable crops.
Strangford Lough is by far the most important site for these birds during the late autumn, with a five-year average of 26,108 birds. Lough Foyle too is an increasingly important site, while other Northern Irish sites such as Dundrum Inner Bay, Carlingford Lough and Killough Harbour also hold internationally important numbers. As the winter progresses, the geese disperse around the coast of Ireland, with notably high numbers at Dublin Bay and Wexford Harbour and Slobs.
In spring, Brent Geese leave the UK and Ireland and head north again, stopping over again in Iceland. where they fatten up, increasing their weight by up to 40% in preparation for the final 1,865 miles to their breeding grounds in Canada.

Gotfredsen, A.B. 2002. Former occurrences of geese (Genera Anser and Branta) in ancient West Greenland: morphological and biometric approaches. Acta Zoologica Cracoviensia, 45 (special issue): 179—204.
Günther A., Krone O., Svansson V. & 9 co-authors. 2022. Iceland as Stepping Stone for Spread of Highly Pathogenic Avian Influenza Virus between Europe and North America. Emerging Infectious Diseases 28: 2383—2388
Kjær, K.H., Winther Pedersen, M., De Sanctis, B. & 36 co-authors. 2022. A 2-million-year-old ecosystem in Greenland uncovered by environmental DNA Nature 612: 283—291.
Wernham, C.V., Toms, M.P., Marchant, J.H., Clark, J.A., Siriwardena, G.M. & Baillie, S.R. (eds.). 2002. The Migration Atlas: Movements of the Birds of Britain and Ireland. Poyser, London.
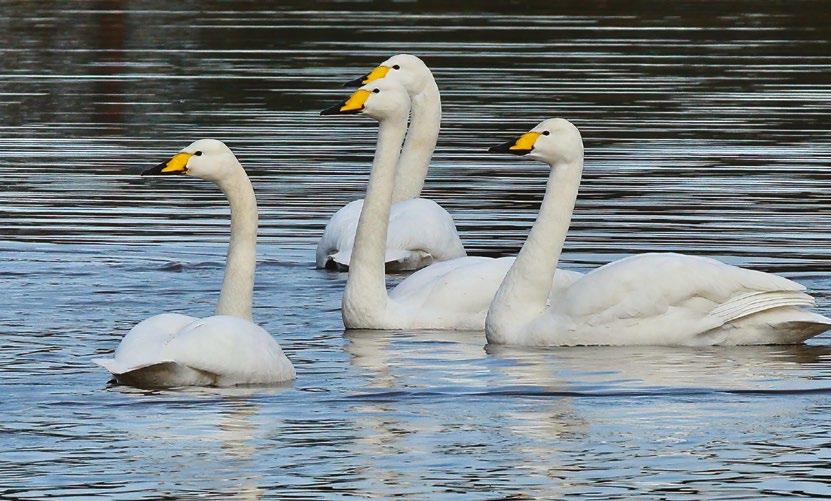
The population of Whooper Swans breeding in Iceland has steadily grown since the early 1980s, which has resulted in an increase in numbers wintering here.
Whooper Swans undertake what is probably the longest sea crossing of any swan species as they travel to winter in the UK and Ireland from their Icelandic breeding grounds. They arrive from Iceland in late autumn, returning north again in the spring, migrating up to 870 miles non-stop between the UK and Ireland and Iceland, often flying at very high altitudes. Small numbers also breed in northern Scotland and Ireland.
Two different breeding populations of Whooper Swan occur in Europe: one in Iceland, which accounts for virtually all the birds that winter in Britain and Ireland, and another in Fennoscandia and the Baltic countries and Poland. However, recent research has shown that there is very little interchange between these two populations (Brides et al. 2023).
The International Swan Census (ISC) has taken place at roughly five-year intervals since 1986 to update the estimates of the size, mid winter distribution, habitat use and breeding success of the Icelandic Whooper Swan population wintering in Britain, Ireland and Iceland (also including the Isle of Man and the Channel Islands). The eighth ISC took place in January 2020, with a total of 43,255 Whooper Swans counted, representing a 27.2% increase in numbers since the previous census in 2015 (Brides et al. 2021).
Recent research led by the universities of Exeter and Helsinki found that survival rates of Whooper Swans were higher on nature reserves, particularly those in
low-lying coastal areas. The population growth was so strong that it could lead to a further increase in numbers wintering in the UK in the future (SorianoRedondo et al . 2023).
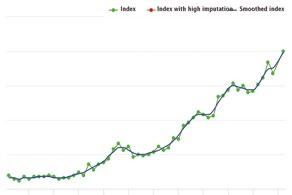
This increase in the Whooper Swan population is reflected in the UK annual trend which has also steadily climbed, with a 244% increase in the last 25 years, though regionally, the trends are much different. The English trend shows a similar pattern to that of the UK with increasing numbers of birds now wintering further south with a 25-year increase of 433%, but the Scottish and Northern Irish trends show much smaller increases of 71% and 70% respectively in the same period.
Twelve sites hold internationally important numbers (above 340 individuals) of Whooper Swan in the UK (see Table 5). The Ouse Washes remains the main site in the UK with a five-year mean of 7,831 birds, while the Nene Washes, Loughs Neagh and Beg, Lough Foyle and WWT Martin Mere also have five-year means of over a thousand birds.
They will often feed on fields during the day, grazing on root crops, before heading to roost on open water, so using WeBS counts alone, which are traditionally carried out during the day, will underestimate the numbers of birds using a site. At key sites such as the Ouse Washes and Nene Washes, additional counts are made of birds using these non-wetland areas, often as they fly in to roost on waterbodies.
Annual peaks and month in 2021/22 when recorded are shown. Brackets indicate incomplete coverage. Five-year mean is for period 2017/18 to 2021/22. † = Counts include supplementary data.
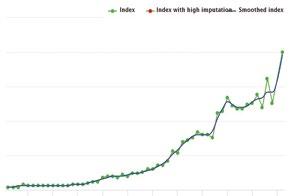
WeBS trend for Whooper Swan in England. Green dots = annual index; blue line = smoothed trend.
WeBS trend for Whooper Swan in Scotland. Green dots = annual index; blue line = smoothed trend.
Brides, K., Wood, K.A., Hall, C., Burke, B., McElwaine, G., Einarsson, Ó., Calbrade, N., Hill, O. & Rees, E.C. 2021. The Icelandic Whooper Swan Cygnus cygnus population: current status and long-term (1986—2020) trends in its numbers and distribution. Wildfowl Journal 71: 29—57.
Brides, K. & 20 co-authors. 2023. Interchange of individuals between two Whooper Swan Cygnus cygnus populations, and its effect on population size estimates. Ringing & Migration. doi.org/10.1080/03078698.2022.2161004.
Soriano-Redondo, A. & 12 co-authors. 2023. Demographic rates reveal the benefits of protected areas in a long-lived migratory bird. Proceedings of the National Academy of Sciences doi.org/10.1073/pnas.221203512.
WeBS trend for Whooper Swan in the UK. Green dots = annual index; blue line = smoothed trend.
Many waterbird species are widely hunted, and some recently published research looks at how sustainable this is for some species.
Uncertainties or lack of data for waterbird population sizes, productivity and harvest data makes it challenging to know if the numbers of birds being hunted in the UK are sustainable. A new approach by researchers from the University of Essex and the British Association for Shooting & Conservation (BASC) attempts to use the best available information for an initial sustainability assessment.
The research used a technique called the demographic invariant method to estimate the potential excess growth of populations of UK wintering waterbird quarry species and calculated a sustainable harvest index for each species.
The study found evidence for potential overharvest of several bird species; however, the species predicted to be exposed to the most unsustainable levels of take were experiencing the highest population growth. This suggests that waterbird hunting in the UK is not a primary driver of population trends, although the authors note this does not necessarily mean the same is true for the sum of harvests across the flyway. It was noted that Icelandic Greylag Goose, for example, is subject to additional hunting mortality outside the UK,
but assessment is made more difficult by uncertainties in the UK of estimating both the population size and the harvest breakdown between the Icelandic and British resident populations of Greylag Goose – with a total estimated flyway harvest of 66,500 from a total estimated pre-breeding population of 60,000.
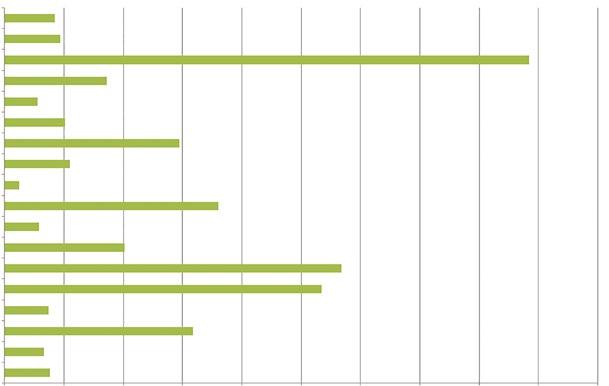
Where there were data gaps or uncertainties, the authors experimented with different assumptions. The figure reproduced here, for example, compares sustainable harvest index values estimated from models considering observed survival rates – which can be biased for huntable species – and estimated survival rates, and different assumptions about life histories. The model choice can affect whether the species is predicted to be overharvested or not.
Comparing the calculated sustainable hunt index with the Birds of Conservation Concern (BoCC) categorisation of each species indicated no correlation, which was not unexpected since species can be Redor Amber-listed for a variety of factors. The lack of a relationship between a conservation classification such as BoCC and the sustainable hunt index was used to suggest that such classifications are not an appropriate
At a site level, hunting is closely controlled on SSSIs and SPAs, which are often estuarine sites, but the majority of harvest is taken on inland sites, including of released Mallard.
tool for making decisions about harvest management. The research gives the basis for a framework to make informed decisions on sustainable harvest levels in the face of incomplete data, and the researchers suggest that a policy instrument is urgently needed to ensure the UK can adapt to changing pressures and ensure the sustainable use of its wildlife populations.
The study used WeBS data extensively, including the WeBS-based waterbird population estimates (Frost et al. 2019) and recent 10- and 25-year WeBS trends
for the analyses. From the early days of the National Wildfowl Counts, waterbird monitoring has been a key component of the evidence base for ensuring the sustainability of hunting in the UK. This study shows that improving monitoring of breeding productivity, survival and hunt bag statistics, combined with WeBS population monitoring, would support more informed decision making in future.
Figure reproduced from Ellis & Cameron 2022 under a CC BY 4.0. licence and shows the mean (and 95% confidence interval) sustainable harvest index (SHI) for selected huntable waterbirds in the United Kingdom modelled using survival rates estimated from mass and (a) a long life history or (b) a short life history, and survival rates reported in the literature and a (c) long life history or (d) short life history. SHI is calculated with safety factor = 0.5 of the calculated potential excess growth for all species and the dotted line at SHI = 1 represents the threshold for overharvest. Species were selected to represent the most well‐studied huntable species.
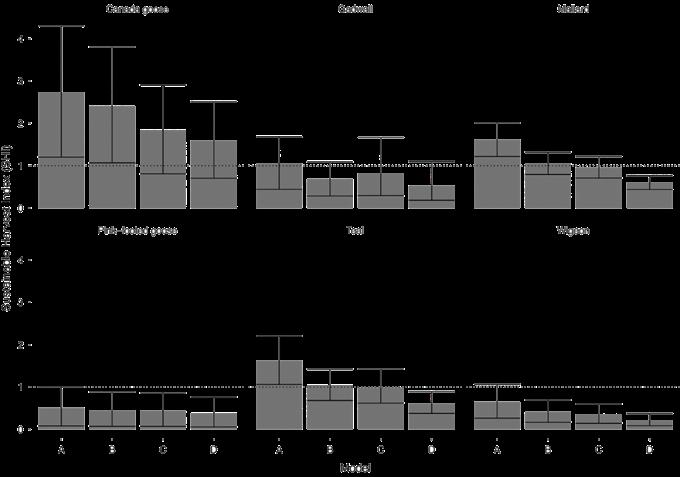
Ellis, M.B. & Cameron, T.C. 2022. An initial assessment of the sustainability of waterbird harvest in the United Kingdom. Journal of Applied Ecology 59: 2839—2848.
Frost, T.M., Austin, G.E., Hearn, R.D., McAvoy, S.G., Robinson, A.E., Stroud, D.A., Woodward, I.D. & Wotton, S.R. 2019. Population estimates of wintering waterbirds in Great Britain. British Birds 112: 130—145.
The East Atlantic Flyway is a migration route used by birds passing from their breeding areas in Canada, Siberia and northern Europe to wintering areas from western Europe to southern Africa.
The third edition of the East Atlantic Flyway (EAF) Assessment documents the flyway trends for more than 80 populations of 66 coastal waterbird species. The Wadden Sea Flyway Initiative again coordinated a total count in January 2020, with WeBS contributing data for the UK and support for the monitoring in Sierra Leone in west Africa.
Long-term (20–40 years) trends of most populations were favourable. However, on the short-term (10-year) timescale, 26% of populations showed an increase, 26% were stable, 29% were in decline and 19% were uncertain. Compared to other global flyways of migratory waterbirds, population trends in the EAF are relatively favourable.
Waders still show the least favourable trends of the taxonomic groups, along with gulls for short-term trends. When looking at breeding regions, those breeding in the Arctic, particularly the Siberian tundra, and in southern Africa stood out as having many species with unfavourable short-term trends.
Spatial patterns in the trends in January numbers of waders were also noted, in particular along the African coast where there was a stronger decline in the southern parts of the EAF. Hypotheses include habitat impacts, specific breeding populations that winter in southern areas having greater population decline, declining populations concentrating in the best sites, or climate related short-stopping. No one explanation fits all the data, and it is likely that several may be involved and that it varies by different species and populations.
It is becoming evident that distributional shifts along the flyway are a challenge to effective monitoring. Knowledge of boundaries of biogeographic populations is largely based on ringing data from the 1980s and 1990s, but shifts since then may be undetected; there is a need to extend and refresh research into migratory connectivity and flyway population boundaries of waterbirds.
Birds changing their distributions into areas that are better monitored can create a false impression of population increase, even if the population is stable. Perhaps this could partly explain the difference in trends between wintering data
and breeding trends where the trend direction differs, as with Curlew. Maintaining and improving monitoring throughout the flyway is critical for overcoming these biases. The indepth report includes an assessment of pressures along the flyway, where direct anthropogenic pressures dominate but climate change is also becoming increasingly evident. There are chapters on some key African wetlands and detailed species trends and accounts.
van Roomen M., Citegetse G., Crowe O., Dodman T., Hagemeijer W., Meise K. & Schekkerman H. (eds). 2022. East Atlantic Flyway Assessment 2020.The status of coastal waterbird populations and their sites. Wadden Sea Flyway Initiative p/a CWSS, Wilhelmshaven, Germany, Wetlands International, Wageningen, The Netherlands, BirdLife International, Cambridge, United Kingdom. www.waddensea-worldheritage.org/resources/ east-atlantic-flyway-assessment-2020
 By Katharine Bowgen BTO Cymru
The Greenland White-fronted Goose ( Anser albifrons flavirostris ) population that winters in Ireland and Britain has sadly become a rarity within Wales (Welsh 10-year trend -34%). It is currently only present in a couple of small groups in mid Wales (Dyfi Estuary) and on Anglesey. Their cryptic nature and small populations mean that remote tracking via GPS can provide an alternative to traditional field observations and ringing studies and add to the wider picture of the species’ behaviours.
As part of the ECHOES project, three Greenland White-fronted Geese were tagged with GPS transmitters in south-west Anglesey in January 2021. The aim of ECHOES was to understand the effect of climate change on bird habitats around the Irish Sea. The tracks provided by our study species of Greenland White-fronted Geese and Curlew help reveal their winter habitat preferences. Species modelling outputs were also able to be incorporated into the project analyses of climate change impacts.
The tracking devices used provided amazingly detailed location data. The geese showed regular movements between two wetland roosting sites in Wales and this informed analysis of how habitats will fare under climate change. The geese also took their tags on migration and we were lucky enough to have one of them return the

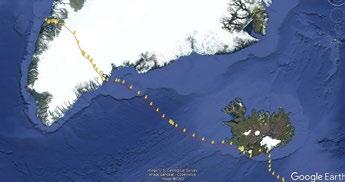
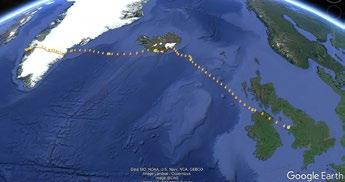
following autumn within reach of the base station and provide us with a track to Greenland (see maps). This individual, a female, made significant use of Iceland on passage, stopping over for a month before making the journey to Greenland in just 24 hours. Arriving on the eastern shores, she soon headed west again to north of Nuuk, where the subsequent movements indicated this was potentially her breeding site.
The bird made it safely back to Anglesey and downloaded her outward track to our on-site receivers, but sadly she didn’t stay around long enough to pass over her return tracks. It is hoped that the remaining data will be able to be downloaded in future, to see if a similar migration strategy is used on the return migration.
The use of Iceland stopover sites on migration routes was already known for Greenland White-fronted Goose, but the confirmation that Anglesey birds use it as well has emphasised its importance, as we research what climate change impacts there might be on the habitats used by bird populations around the Irish Sea throughout their annual cycle.
ECHOES project: https://echoesproj.eu
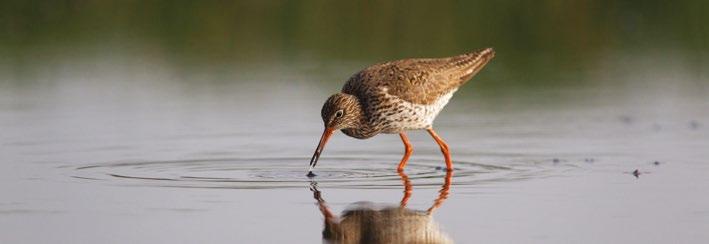
Affectionately known as the ‘Warden of the Marshes’ from its penchant for announcing intruders on its favoured saltmarsh breeding grounds, it would be easy to take Redshank for granted as one of our most familiar waders. In fact, the UK is an important area for breeding, wintering and passage Redshank from several breeding populations. The greatest numbers are present on the Dee Estuary, with peak counts of over 10,000 birds in early autumn in recent years. The UK midwinter population estimate is 90,000.
As the headline WeBS 25-year trend of -20% could potentially be made up of some populations that are stable, some that are short-stopping, and others experiencing strong declines, monitoring data from other countries and ringing studies are needed to understand the trends and pressures on this species.
It is believed many of the 22,000 breeding pairs of Redshank in the UK are resident, some moving from inland breeding areas to the coast. The BTO/JNCC/RSPB UK Breeding Bird Survey reveals a 49% decline in the breeding population between 1995 and 2020 and -14% between 2010 and 2020 (Harris et al. 2022). There is good evidence to suggest that the decline in numbers of breeding Redshank is related to changes in habitat management, in particular drainage and agricultural intensification.
The larger race present in the UK in winter, robusta breeds in Iceland and the Faroe Islands. Analyses of ringing data suggest that most Redshank wintering in Scotland are robusta by midwinter, whereas those in England and Wales are a mixture of Icelandic robusta and British breeding totanus birds (Summers 1988). It seems likely that the
+7% 10-year trend in Scotland compared to -2% in England, and the more steady decline visible since the 1990s in the England index, similar to the BBS index, could potentially indicate better fortunes of Icelandic breeding birds compared to UK breeding birds, but more information from the breeding grounds is needed to understand what is happening.
Harris, S.J., Massimino, D., Balmer, D.E., Kelly, L., Noble, D.G., Pearce-Higgins, J.W., Woodcock, P., Wotton, S & Gillings, S. 2022. The Breeding Bird Survey 2021. BTO Research Report 745. British Trust for Ornithology, Thetford.
Summers, R. W., Nicoll, M., Underhill, L. G. & Petersen A. 1988. Methods for estimating the proportions of Icelandic and British Redshanks Tringa totanus in mixed populations wintering on British coasts. Bird Study 35: 169—180.
WeBS trend for Redshank in Scotland. Green dots = annual index; red dots = sparse data; blue line = smoothed trend.
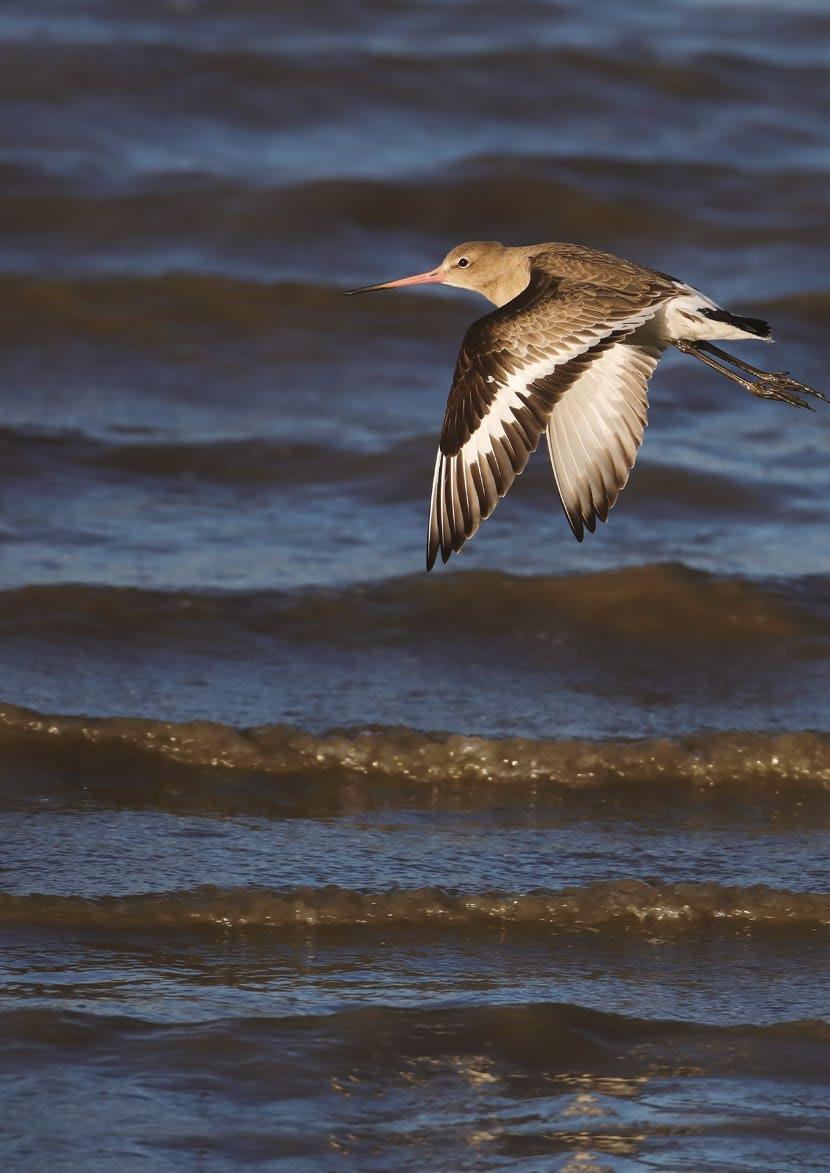
Black-tailed Godwit was previously a focus species in the 2011/12 report, when it was noted that there had been a levelling in numbers. Unexpectedly, the following year in 2012/13 there was a marked rise in the index, and since then another plateau seems to have been reached, a further jump in 2016/17 not being sustained. The latest UK wintering population estimate is 41,000 birds.
Most birds wintering here, rather than on passage, are of the islandica race, which breeds near exclusively in Iceland. The breeding population there has increased nearly ten-fold over the past 100 years, with the breeding range extending throughout lowland Iceland. The cause is thought to be warmer springs leading to earlier hatching dates and in turn more successful breeding and population growth (Alves et al 2019). It is thus no surprise that in the UK we have observed an increase of 159% in the past 25 years.
The fortunes of islandica birds contrast with limosa populations breeding in west Europe, in particular the Netherlands, where they have declined by 75%. In the UK, as in Iceland, breeding productivity has been found to be key, with predation pressure important here (Verhoeven et al. 2021). The small number of breeding pairs of limosa in the Ouse and Nene Washes in the UK are being helped by a project of habitat management to increase provision of suitable wet grassland and ‘headstarting’, which involves collecting eggs (under licence), rearing the chicks in captivity and releasing just after fledging. This has increased the breeding population on the Ouse and Nene Washes from 38 pairs in 2017 to 53 pairs in 2021 (Project Godwit 2022).
From the latest WeBS fiveyear averages, 23 sites have internationally important totals (above 1,100 individuals) and a
further 20 sites hold more birds than the relevant all-Ireland or British threshold.
Most are estuarine sites, but inland sites including Nene Washes, Ouse Washes, Loughs Neagh and Beg, Martin Mere, Arun Valley and Leighton Moss also support important numbers.
Alves, J.A, Gunnarsson, T.G., Sutherland, W.J., Potts, P.M. & Gill, J.A. 2019. Linking warming effects on phenology, demography, and range expansion in a migratory bird population. Ecology and Evolution 9: 2365—2375.
RSPB & WWT. Project Godwit. https:// projectgodwit.org.uk accessed March 2023.
Verhoeven, M., Smart, J., Kitchin, C., Schmitt, S., Whiffin, M., Burgess, M. & Ratcliffe, N. 2021. Diagnosing the recent population decline of Black-tailed Godwits in the United Kingdom. Wader Study 128 10.18194/ws.00216.
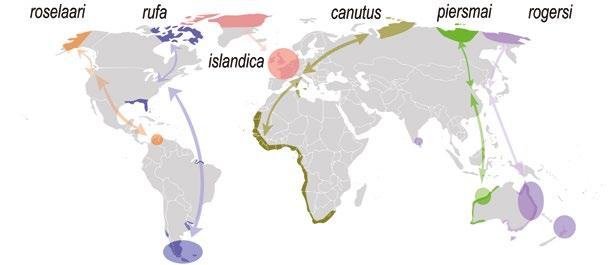
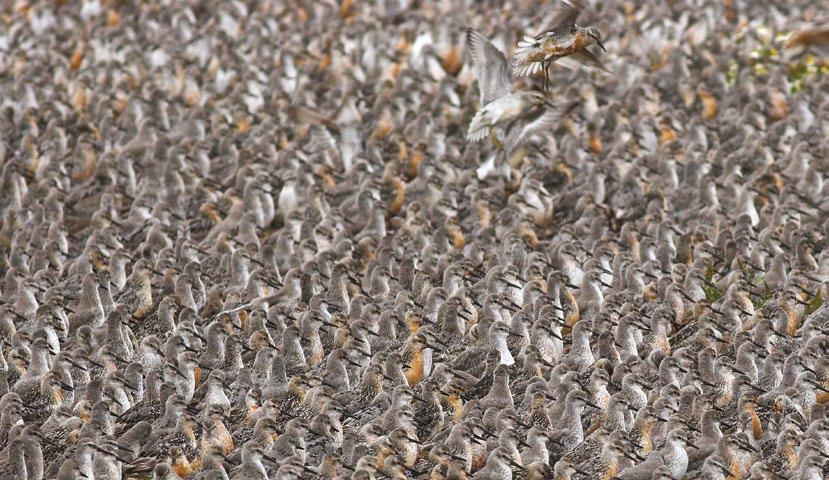
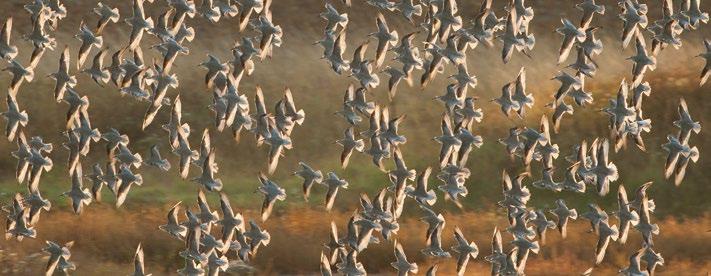
Swirling flocks of Knot are a spectacular sight on many UK estuaries, where these travellers gather in vast flocks.
Knot have fascinated and been highly prized by people for centuries. During Medieval times, Knot and other waders were caught on estuaries such as The Wash and sold for food, due to their fatty meat, which is characteristic of long-distance migratory species. Therefore, they are thought to have gained both their common and scientific names (canatus) from King Canute’s partiality for this meat (Davidson & Piersma 1992).
Knots are still caught on estuaries but for scientific purposes. Efforts by groups such as The Wash Wader Research Group, who colour mark Knots as part of a wider movement study across north-west Europe and Fennoscandia, enable us to better understand their movements during the spring and autumn migration.
Knot has one of the longest migrations of any bird. Every year, birds of the rufa race travel more than 9,000 miles from Arctic Canada to the southern tip of South America and back again. There are two populations that frequent the UK – birds that breed in Siberia (race canutus) pass through on their way to wintering areas in Africa, while birds that breed in Greenland and Canada (race islandica) spend the winter in the UK, and have the shortest migration of the six races.
Knot feed on small clams, snails and worms buried just below the mud surface, so are often seen feeding on muddy shores close to the tide edge of estuaries. They are easiest to see in the two–three hours either side of high-tide (between December and March), when they stop to feed and come in to roost at favoured sites, often creating a magnificent spectacle of huge, whirling flocks filling the sky.
In 2021/22, two sites in the UK – The Wash and the Dee Estuary, yielded peak counts of Knot in excess of 30,000 birds. The Wash is by far the most important site in the UK, with a five-year average of 209,300 birds and is one of 13 sites that holds internationally important numbers (above 5,300 individuals) of the species (see Table 6). A further six sites surpass the British national importance threshold (2,600). Five sites surpass the national threshold for Northern Ireland (160), where the most important is Strangford Lough, which has a five-year average of 2,972 birds.
Due to their dependence on our estuary sites, Knot winter populations are vulnerable to changes on estuaries, such as barrages, industrial development, sealevel rise and human disturbance.
Dog-walking has become a particular issue in recent years with light being shed on the harm that constant disturbance can do to localised wader populations. Saunders & Liley (2020) found that dog-walking was a clear issue when it came to disturbance of winter waterbirds in Poole Harbour and that action needed to be taken to educate the public about the disturbance that dogs can create.
Northumberland County Council have set up ‘Space for Shorebirds’, a project aimed at addressing the impacts of recreational disturbance to shorebirds, primarily through education and engagement. Rangers here are now able to give dog walkers fines for disturbing shorebirds, such is the concern for the stress they can cause on wild birds.
It can’t be overemphasised just how important the UK is for Knot, with 80% of the islandica race being found on just 15 British estuaries in midwinter. With the threats to this species and their estuarine habitats increasing
over the years, it has never been more important for WeBS to monitor this species and support Counters at our estuary sites.
• Annual peaks and month in 2021/22 when recorded are shown. Brackets indicate incomplete coverage. Five-year mean is for period 2017/18 to 2021/22. † = Counts include supplementary data.
Buehler D.M., Baker A.J. & Piersma T. 2006. Reconstructing palaeoflyways of the late Pleistocene and early Holocene Red Knot Calidris canutus Ardea 94: 485—498.
Davidson, N. & Piersma, T. 1992. The Migration of Knots. Wader Study Group Bulletin 64. Wader Study Group, Tring. Northumberland County Council. 2023. Space for Shorebirds. http://spaceforshorebirds.co.uk
Saunders, P. & Liley, D. 2020. Poole Harbour Disturbance Study 2019/20. Unpublished report by Footprint Ecology.
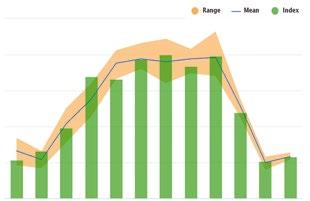
In the UK, Red-throated Divers are confined to remote Scottish lochs for breeding, though more widely they are circumpolar in their distribution, breeding in more remote parts of Canada, Greenland, Fennoscandia and Russia. During the winter, they can be found around the entire UK coastline, though their detectability on WeBS counts, as with other divers, grebes and seaducks, is governed by the sea state.
Given how the sea state can affect WeBS counts, it is unsurprising that the annual index fluctuates widely between years. On a site level, this illustrates the value of additional supplementary counts, carried out when more suitable conditions permit, to give a truer reflection of the numbers of birds present. In calm conditions, at some sites, large concentrations of birds can be recorded, with a peak supplementary count of 736 in Allonby Bay, in the outer Solway
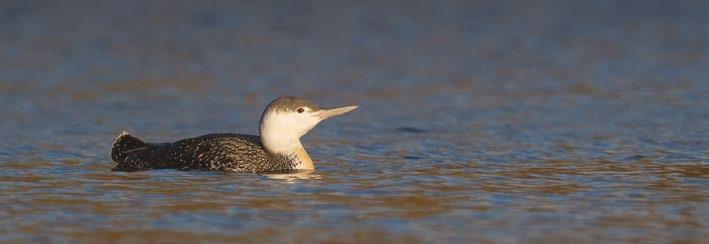
Firth, in October 2021, being the largest count in the WeBS database.
The inshore population estimate from the Non-Estuarine Waterbird Survey (NEWS) of 2,765 birds gives an indication of the importance of the coastline outside WeBS sites is for this species. However, occasional offshore surveys have revealed most birds are not visible from shore and so are missed in WeBS and NEWS counts. Large numbers of Redthroated Divers are now known to winter in our seas; the UK winter population estimate, calculated using data from offshore surveys, is 21,000 birds, with the majority of these using the North Sea off the east coast of England.
Wintering and migrating birds face many threats, with most of the ringing recoveries with a known cause of death being attributed to either entanglement in fishing nets, or from pollution. A study carried out between 2015 and 2017 of birds fitted with satellite tags revealed a generally high individual site fidelity with respect to spring staging, breeding and moulting sites (Kleinschmidt et al. 2022), which indicates the need for conservation planning to consider all sites which they use.
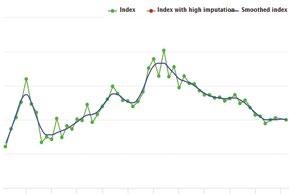
Kleinschmidt, B., Burger, C. & 7 coauthors. 2022. Annual movements of a migratory seabird—the NW European redthroated diver Gavia stellata—reveals high individual repeatability but low migratory connectivity. Marine Biology 169: 114. WeBS trend for Red-throated Diver in the UK. Green dots
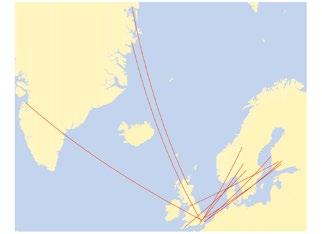
Ringing recoveries of Red-throated Divers has shown that birds wintering in the North Sea may originate from either Greenland to the north-west, or from Fennoscandia and Russia to the north-east (Wernham et al. 2002).
Migration routes of Red-throated Divers in the UK. From Wernham et al. (2002).
Red-breasted Mergansers can be seen all around the UK’s coastline, with some living here all year round and many migrating from their breeding grounds in northern Europe in lateautumn to over-winter in our coastal waters, returning northeast in March.
In 2021/22, nationally important numbers of Red-breasted Mergansers, were recorded at 19 WeBS sites, with the highest numbers in Scotland, with 429 counted in the Sound of Gigha and Rhunahaorine, and a peak of 622 here in 2020/21. However, these numbers pale when compared to previous counts, with the historical peak count being 3,005 on the Forth Estuary in February 1970.
In Waterbirds in the UK 2013/14, we reported that much remained to be learnt about this species to fully understand the drivers behind their steady decrease within the UK. It is
thought that the effects of climate change, which is affecting many other migratory species, has a part to play with birds less likely to travel as far west as the UK, as warmer winters across Europe are decreasing the need to do so.
Other features of climate change, such as storm surges and sea-level rise, have the potential to affect this species too. In 2015, a study into how these events may impact their nesting habitats on low-lying landforms, such as barrier islands, in New Brunswick, Canada concluded that predicted sea-level rise in the region over the next century threatens the habitat and survival of waterbird nests (Craik et al. 2015).
With sea-levels set to increase further across the world, it is reasonable to assume that this will play a risk to the European Redbreasted Merganser populations too,
especially as it is thought that most of the Icelandic breeding population (and a small number from eastern Greenland) migrate south to over-winter off the northern UK coastline (Wernham et al. 2002).
There still remains a lot to be learned about Red-breasted Mergansers and the effects of external factors, which can be achieved by continuing and increasing WeBS coverage of coastal sectors during the core winter period.
Craik, S. R., Hanson, A.R., Titman, E.D., Mahoney, M.L. & Tremblay, É. 2015. Potential Impacts of Storm Surges and Sea-level Rise on Nesting Habitat of Redbreasted Mergansers (Mergus serrator) on Barrier Island in New Brunswick, Canada. Waterbirds 38: 77—85.
Censuses and age assessments of migratory goose and swan species were carried out in 2021/22.
 By Kirsi Peck JNCC and Neil Calbrade BTO
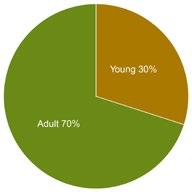
Age assessments comprise two measures of annual breeding success (or productivity): the proportion of young (firstwinter birds in non-breeding flocks), and the mean brood size (number of young produced by successful breeding pairs).
Table 7 shows the number of birds aged and the breeding success of goose and swan populations wintering in the UK, recorded during various surveys in 2021/22.
The timing of migration and post-juvenile moult differs between species, meaning that the time period in which data can be collected also varies between species. Plumage differences also vary between species and are more subtle for some species than others, meaning that a high level of experience is required by observers.
The Icelandic-breeding Goose Census (IGC) annually monitors two migratory goose populations: the Greenland/Iceland Pink-footed Goose and the Icelandic Greylag Goose, the results from which can be found in Table 8.
During the October census, 361,210 Pink-footed Geese were counted, whilst a total of 225,726 was recorded in November. Estimates were made for eight core sites from where no counts were received in October, bringing the total to 418,501, which has been selected
as the population estimate for 2021. This represents a 13.8% decline on the previous year (458,509 birds).
Age assessments of Pink-footed Geese were carried out in Scotland and England, with 11% young being found among those flocks sampled, the lowest proportion since 8.5% in 2011. The mean brood size of successful pairs was 1.93 goslings (see Table 7).
Counts of over 4,000 Pink-footed Geese were received from 32 sites in 2021/22, the highest count being 31,200 at Montrose Basin in October, representing 7.5% of the population estimate.
A total of 96,008 Greylag Geese were counted during the November census. This figure was adjusted to account for the estimated number of British/Irish Greylag Geese likely to have been counted at sites during the census, resulting in an amended population estimate of 65,693 Icelandic Greylag Geese. This represents a 9.4% increase in the population compared with the previous year (60,061 birds). Orkney holds the largest proportion of the wintering Icelandic Greylag Goose population, with 68.4% found here, with 23.7% remaining in Iceland.
The separating of Icelandic Greylag Geese from British/Irish Greylags is becoming much more difficult as the native 'North-west Scotland' population of Greylags has expanded east and the re-established population has expanded north into areas where traditionally Icelandic Greylag Geese dominated in the winter (Brides 2021). Given the difficulties in carrying out age assessments of Icelandic Greylag Geese on their wintering grounds in Britain, no age assessments were carried out in the winter of 2021/22.
Two flocks of Taiga Bean Geese winter in the UK and were monitored during the winter of 2021/22; on the Slammanan Plateau, Falkirk by Bean Goose Action Group and the Yare Valley, Norfolk by RSPB reserve wardens. The peak count on the Slammanan Plateau was 217 birds, seven birds more than in 2020/21, and of the 151 birds aged, only 17 were young respresenting 11.3% of the flock. Five broods were assessed where there was a mean bood size of 1.8 goslings.
The Yare Valley population has dwindled considerably over the last two decades, from 485 in 1990/91 to only five birds in 2021/22. This last year represents the lowest count ever conducted for the Yare Valley population.
The 2021/2022 survey represented the 40th annual census of Greenland White-fronted Geese, coordinated in Great Britain by the Greenland White-fronted Goose Study Group and in Northern Ireland and the Republic of Ireland by the National Parks and Wildlife Service. Table 9 shows the most recent five seasons of total census data, broken down by totals for Wexford and the rest of Ireland, and from Islay and the rest of Britain.
The coordinated count in spring 2022 found a total of 18,027 Greenland White-fronted Geese, made up of 9,738 in Britain and 8,289 in Ireland, a decline of 10.7% on the previous population estimate of 20,186 in spring 2021. Numbers at Wexford, SE Ireland, fell by 901 birds (14.3%) to 5,361, while numbers counted on Islay also fell again by 1,581 (23%) to 5,297. This was balanced by an increase of 780 in the rest of Ireland, but a decrease of 457 in the remainder of Britain away from Islay.
Reproductive success was among the lowest on record in Ireland at 5.6% first winter birds, though it was better in Britain (11.2%), but it still fell below the long-term average.
As reported in WeBS News 38, Highly Pathogenic Avian Influenza (HPAI) made a noticeable impact on the wintering population of Svalbard Barnacle Geese around the Solway Estuary in the winter of 2021/22.
Birds began arriving in mid October 2021, and by the time of the count on 10 November, HPAI had started to kill birds. Monthly counts were made on the Solway Estuary throughout the winter. The peak total during the main period of HPAI deaths in November was 36,185 birds, but by January, the peak count had fallen to 26,333 birds, a decline of 17.3% in just three months. Even prior to the HPAI outbreak, the peak count was well below that of 2020/21, when the peak was 42,303 birds.
Age Assessments were carried out during the winter, with 11,928 birds assessed, which is equivalent to 35% of population wintering on Solway. The results revealed 3.94% young birds recorded amongst the flocks, which was the lowest proportion since 2004/05. Mean brood sizes per successful pair too were the lowest since 2004/05 at just 1.9 goslings per brood.
The poor 2021 breeding season would have potentially resulted in a c.5% drop in population, so the decline is not solely due to HPAI (Griffin 2022).
We are extremely grateful to the many IGC Local Organisers and counters, without whom the annual monitoring of Pink-footed and Icelandic Greylag Goose populations would not be possible.
The Greenland White-fronted Goose counts were provided by the Greenland White-fronted Goose Study Group. The Taiga Bean Goose counts were supplied by the Bean Goose Action Group.
The 2021/22 GSMP counts were organised by WWT, in partnership with JNCC and NatureScot
Monthly counts of Svalbard Barnacle Goose for the most recent five years, showing within winter variation and the impact of HPAI on the Solway Estuary resulting in reduced counts in the later surveys in 2021/22.
Brides,
two populations of the same species merge. Waterbirds in the UK 2019/20: The Wetland Bird Survey 39: 18—19.
Fox, A., Francis, I., Walsh, A., Norriss, D. & Kelly, S. 2022. Report of the 2021/22 international census of Greenland White-fronted Geese G reenland White-fronted Goose Study report.
Griffin, L. 2022. Svalbard Barnacle Goose distribution around the Solway Firth 2021-2022: Flock counts from the Solway Goose Managemant Scheme area. Final Report to NS. Prepared by ECO-LG Ltd., Dumfries, Scotland. 38 pp.
Low Tide Counts on UK estuaries have been carried out in the UK since 1992/93, with repeat visits to sites enabling a comparison of data between years.
The Swale Estuary separates the Isle of Sheppey from the Kent mainland and adjoins the Medway Estuary to the west. At low tide there are extensive inter-tidal flats, with a relatively narrow water channel.
The inner zones are muddy and the sediments become increasingly sandy towards the south. Most of the site is surrounded by saltmarsh, with the most substantial expanses along the northern shore. There is a sand and shingle spit at Shell Ness, behind which is a mixture of saltmarsh grading into grassland. Industrial activity includes port and harbour facilities, a paper mill at Kemsley and boat building facilities at Conyer Creek. Most leisure activities are centred on sailing and other water sports and there are three marinas within the estuary. Much of the area is subject to active wildfowling.
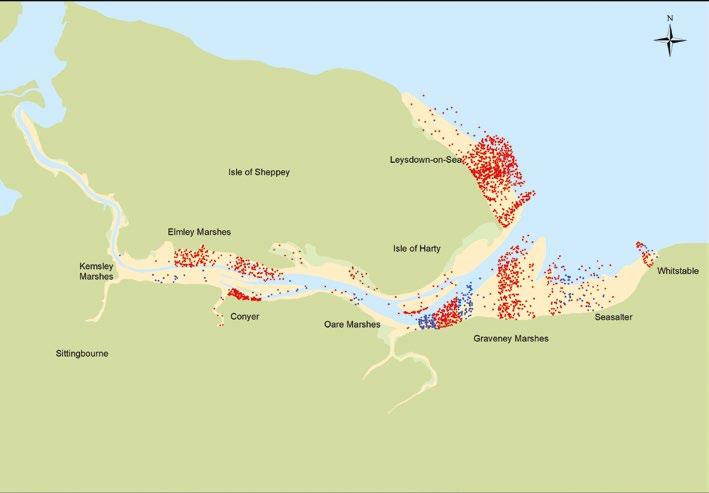
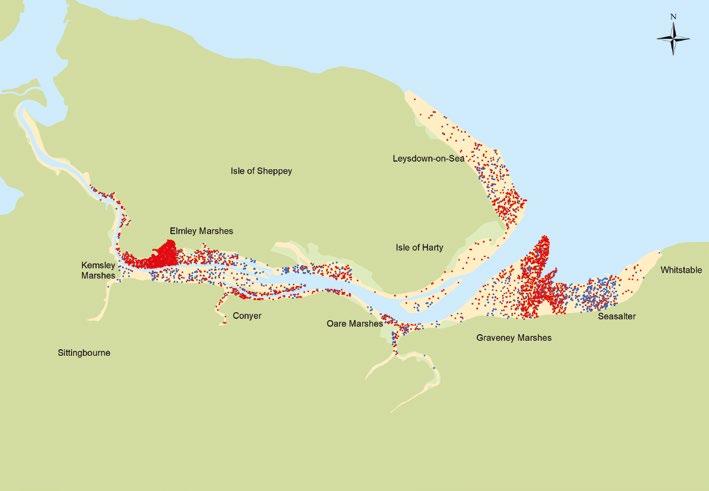
The distribution of two species are mapped on the opposite page: Darkbellied Brent Goose and Dunlin distributions based on WeBS Low Tide Counts undertaken in 2021/22 are displayed for comparison with the respective distributions from 2011/12.
Internationally important numbers of Dark-bellied Brent Geese occur on the Swale Estuary. Although numbers of Brent Geese recorded on Core Counts has decreased slightly, the mean winter counts on the Low Tide Counts have not reflected this with 1,688 in 2021/22, compared with 586 in 2011/12. The largest concentrations of Brent Geese in 2021/22 were found on the east side of the Isle of Sheppey, around Elmley Marshes, Conyer and Graveney Marshes, whereas in 2011/12 the majority of birds were around Graveney Marshes.
Dunlin occur in nationally important numbers on the Swale Estuary, and numbers on the SPA have seen a decrease of 38% in the long-term (Woodward et al. 2019). The mean winter counts at low tide have reflected this with 5,622 (2.67 birds per ha) in 2021/22, compared with 7,407 (3.59 birds per ha) in 2011/12. Dunlin are widely distributed throughout the estuary, but typically the largest numbers were found around Elmley, Kemsley and Graveney Marshes.
Area covered: 4,084 ha
Mean total birds: 30,389
Mean bird density: 7.44 birds per ha
The Wetland Bird Survey (WeBS) monitors non-breeding waterbirds in the UK in order to provide the principal data on which the conservation of their populations is based. To this end, WeBS has three main objectives:
• to assess the size of non-breeding waterbird populations in the UK;
• to assess trends in their numbers and distribution; and
• to assess the importance of individual sites for waterbirds.
These results also form the basis for informed decision-making by conservation bodies, planners and developers, and contribute to the sustainable use and management of wetlands and their dependent waterbirds. The data and this annual WeBS report also fulfil some of the objectives of relevant international Conventions and Directives to which the UK is a signatory. WeBS also provides data to Wetlands International to assist their function of coordinating and reporting upon waterbird status at an international flyway scale.
WeBS continues the traditions of two longrunning count schemes which formed the mainstay of UK waterbird monitoring since 1947.
WeBS Core Counts are carried out at a wide variety of wetlands. Coordinated, synchronous counts are advocated to prevent doublecounting or birds being missed. Priority dates are recommended nationally, but due to differences in tidal regimes around the UK, counts take place at some estuaries on other
dates in order to match the most suitable local conditions. Weather and counter availability also sometimes result in counts being undertaken on alternative dates.
In addition, WeBS Low Tide Counts are undertaken on selected estuaries with the aim of identifying key areas used during the low tide period, principally by feeding birds. It also identifies areas not otherwise noted for their importance from data collected during Core Counts which are normally conducted at, or close to, high tide.
The success and growth of these count schemes reflects the enthusiasm and dedication of the several thousands of participating volunteer ornithologists. It is largely due to their efforts that waterbird monitoring in the UK is held in such high regard internationally.
Full details of WeBS field and analytical methodologies are available via the WeBS website: www.bto.org/webs
Waterbirds in the UK 2021/22 (comprising this summary report together with numbers and trends available from WeBS Report Online at www.bto.org/webs-reporting ) presents the results of WeBS in 2021/22. Data from other national and local waterbird monitoring schemes, notably the BTO/JNCC/NatureScot Goose & Swan Monitoring Programme, are included where WeBS data alone are insufficient to fulfil specified aims. The annual WeBS report therefore provides a single, comprehensive source of information on waterbird status and distribution in the UK.

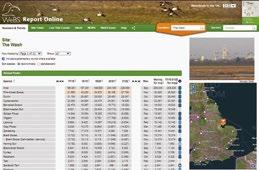
This annual report, Waterbirds in the UK 2021/22, combines an extensive online data resource, WeBS Report Online, with this summarised written report.
The WeBS Report Online interface provides access to the latest tables of WeBS Core Count data at site and species level via the 'Numbers & Trends' and ‘Site Totals’ tabs, together with low tide summaries and distribution density maps for estuaries via the 'Low Tide Counts' tab. Results from the Non-Estuarine Waterbird Survey (NEWS) are in the 'NEWS' tab and WeBS Alerts in the ‘Alerts’ tab.
COVID-19 restrictions in 2020 and 2021 had a large impact on data completeness at many sites. Normally the five-year mean of peaks calculated in the ‘Numbers & Trends’ section does not take the month of the peak into account. However, a special adaptation has been added, for the 2019/20 and 2020/21 years only, to allow for COVID-19 restrictions. If the peak count is lower than expected (based on average of topical peaks), and the site was not visited during months when the peak typically occurs due to official restrictions, the peak has been bracketed as incomplete to indicate that it is likely to be an underestimate of the true peak had data been available. The month of the peak (viewable by stepping back the table by one or two years) is also bracketed, to indicate it is not typical for the site and quite likely not the month of the true peak and the reason for the count bracketing. The usual rules with the calculation of the five-year average and completeness are then followed (full details available in the WeBS Survey Methods, Analysis and Presentation documentation).
In the ‘Numbers & Trends’ section, searching for a site of interest from the menu allows users to explore which species have ever been recorded at the site. Users can view and download the peak numbers of each species recorded at the site throughout the year, the five-year mean peak count and the month in which the peak count was recorded. The table can be sorted alphabetically or taxonomically by species or by the peak counts. By scrolling back
through the years, contemporary counts and associated five-year averages can be compared with historical counts at the site.
In the Low Tide section, up to four interactive distribution density maps can be viewed simultaneously and maps can be viewed for all waterbird species recorded during the survey. Estuaries can be chosen from the Location menu and the survey year from the Low Tide Count year menu. Selecting a species will display a map with count sectors separated into intertidal, subtidal and non-tidal habitats and random dots indicating the count of birds in the sector.
The ‘Site Totals’ tab summarises waterbird aggregations at WeBS sites. The default view shows a table of sites with 1,000 or more birds and includes supplementary counts but excludes gulls and terns and non-native species, as is standard in the Principal Sites table (see page 14–15). Users can choose to view all sites, including those with fewer than 1,000 birds, for a county or country and optionally include gulls/terns, non-native species and supplementary counts. Selecting a site name brings up a list in the right-hand panel of species at the site where counts exceed national or international importance thresholds.
For those looking for information on a particular species (or biogeographic population) of waterbird, every species ever recorded by WeBS features on its own page, with every site where the species has been recorded listed. As well as offering the functionality to sort sites in tables either alphabetically, by annual peak, or by five-year average, the interface also allows the user to filter sites by country, county and/or habitat. Annual and monthly trend plots for the UK and constituent countries are shown (where applicable) and the data and plots downloaded. There are also links to other sources of web-based information. Supplementary counts can be included or excluded in the tables. For reference purposes, data from reports for previous years can be accessed by choosing the appropriate WeBS year from the ‘Waterbirds in the UK’ drop-down menu.
The Numbers & Trends section features species trends (for the UK and constituent countries) and site tables for all species (with facility to filter by country, county and habitat), alongside sections on NEWS, Low Tide Counts, Site Totals and WeBS Alerts. There is also a Help section containing tutorials, to help you make the most of the resource.

With the UK host to internationally important numbers of wintering waterbirds, one of the principal aims of WeBS is to provide data to facilitate their conservation. Indeed, there have been many high-profile examples over the years in which WeBS data have proved to be fundamental in securing the protection of important wetland sites.
A summary of site-based WeBS information is presented on the WeBS Report Online and available for use with an Open Government Licence. Data at a finer level (both spatial and temporal) are available in a user-friendly format through a bespoke WeBS Data Request. We recommend that WeBSbased information that is to be incorporated into site evaluation work, such as Environmental Impact Assessments (EIAs), should be sourced through a WeBS Data Request.
The graph shows the number of Data Requests processed by the WeBS office each year since 2011/12. These are from a range of stakeholder groups, including country conservation agencies, environmental consultancies, academic researchers and bird clubs. Summarised WeBS data are also provided to several online environmental data portals e.g. National Biodiversity Network (NBN) Atlas.
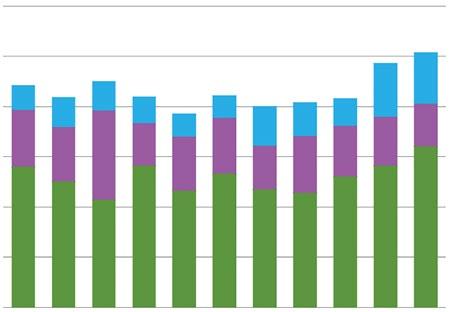
In addition to bespoke data requests, there were 1,968 downloads of raw data from WeBS Online by Counters, organisers and county bird recorders and 155 downloads by WeBS partners. Data downloads of Open Government Licenced data from the WeBS Report Online are not currently tracked.
January WeBS data are supplied to Wetlands International for inclusion in the International Waterbird Census, and summaries are used in outputs such as waterbird population estimates and AfricanEurasian Migratory Waterbird
Agreement (AEWA) Conservation Status reports.
The WeBS Partnership is keen to encourage WeBS data use within environmental research. A number of scientific papers and reports that have used WeBS data in recent years are referenced within the pages of this annual report, and there is of course an extensive suite of other research questions relating to waterbird ecology and wider wetland management issues to which WeBS data would lend themselves, at both national and international scales.
More information about the WeBS Data Request Service is available from www.bto.org/webs-data where you can see coverage by WeBS of different sites, check data request charges, and view examples of the data that can be provided.
Continued from back page
Anglesey
Breconshire
Burry Inlet
Caernarfonshire
Caernarfonshire (Foryd Bay)
Carmarthenshire
Ceredigion (incl Dyfi Estuary)
Clwyd (coastal)
Clwyd (inland)
East Glamorgan
Gwent (excl Severn Estuary)
Merioneth (estuaries)
Merioneth (other sites)
Montgomeryshire
Pembrokeshire
Radnorshire
Severn Estuary (Wales)
West Glamorgan
Antrim (Larne Lough)
Antrim (other sites)
Armagh (excl Loughs Neagh and Beg)
Belfast Lough
Down (Carlingford Lough)
Down (Dundrum Bay)
Down (other sites)
Down (Outer Ards)
Down (South Down Coast)
Down (Strangford Lough)
Fermanagh
Londonderry (Bann Estuary)
Londonderry (Lough Foyle)
Londonderry (other sites)
Loughs Neagh and Beg
Tyrone (excl Loughs Neagh and Beg)
Upper Lough Erne
Alderney
Guernsey Coast
Jersey (inland)
Jersey Coast
Isle of Man
Ian Sims
Andrew King
Lyndon Jeffery
Rhion Pritchard
Simon Hugheston-Roberts
VACANT (now Alan Seago)
Russell Jones
Henry Cook (now VACANT)
VACANT
Daniel Jenkins-Jones
Al Venables
Jim Dustow
Jim Dustow
Jane Kelsall
Annie Haycock
Peter Jennings
Al Venables
Lyndon Jeffery
Doreen Hilditch
Adam McClure
Stephen Hewitt
Shane Wolsey
Aiobheann Morrison
Andrew Crory
Kez Armstrong
NIEA
Kez Armstrong
Kerry Mackie
Michael Stinson
John Clarke (now Dean Jones)
Matthew Tickner
Stephen Hewitt (now Claire Hassan)
NIEA
Ciara Laverty
NIEA
Alderney Wildlife Trust Ecologist
Mary Simmons
VACANT
Roger Noel
David Kennett
We would be grateful for help organising WeBS in areas currently without a Local Organiser (marked VACANT). If you live in one of these areas and would be interested in taking on the role, please let us know. Email: webs@bto.org
In 2021/22, the WeBS Local Organiser Advisory Committee (WeBS LOAC) comprised Allan Brown, Eve Tigwell, Chris Gunn, Brian Moore, Bob Swann and Kerry Mackie. Many thanks to them for representing the wider LO network. Further information about the WeBS LOAC can be found at: www.bto.org/webs/loac
Frost, T.M., Calbrade, N.A., Birtles, G.A., Hall, C., Robinson, A.E., Wotton, S.R., Balmer, D.E. & Austin, G.E. 2021. Waterbirds in the UK 2019/20: The Wetland Bird Survey. BTO/RSPB/JNCC. Thetford.
Frost, T.M. & Calbrade, N.A. (eds.). 2022. Wetland Bird Survey News 2020/21 Special Edition. BTO, RSPB and JNCC. British Trust for Ornithology, Thetford.
Bowgen, K.M., Wright, L.J., Calbrade, N.A., Coker, D., Dodd, S.G., Hainsworth, I., Howells, R.J., Hughes, D.S., Jenks, P., Murphy, M.D., Sanderson, W.G., Taylor, R.C. & Burton, N.H.K. 2022. Resilient protected area network enables species adaptation that mitigates the impact of a crash in food supply. Marine Ecology Progress Series 681: 211—225.
Brides, K., Thorstensen, S., Einarsson, Ó., Boiko, D., Petersen, Æ., Auhage, S. N. V, McElwaine, G., Degen, A., Laubek, B., Andersen-Harild, P., Helberg, M., Vangeluwe, D., Nienhuis, J., Wieloch, M., Luigujõe, L., Morkunas, J., Bogomolova, Y., Bogdanovich, I., Petrek, S.W., Rees, E.C. (2023). Interchange of individuals between two Whooper Swan Cygnus cygnus populations, and its effect on population size estimates. Ringing & Migration. doi.org/10.1080/03078698.2022.2161004.
Burke, B., Lewis, L.J., Fitzgerald, N., Frost, T., Austin, G. & Tierney, T.D. 2018. Estimates of waterbird numbers wintering in Ireland, 2011/12–2015/16. Irish Birds 41: 1—12.
Clewley, G.D., Calbrade, N.A., Austin, G.E., Frost, T.M. & Burton, N.H.K. 2022. A review of the BTO/RSPB/JNCC Wetland Bird Survey (WeBS) Low Tide Counts Scheme with recommendations for its future operation. BTO Research Report 744, BTO, Thetford.
Ellis, M. B. & Cameron, T. C. 2022. An initial assessment of the sustainability of waterbird harvest in the United Kingdom. Journal of Applied Ecology 59 : 2839—2848.
Frost, T.M., Austin, G.E., Hearn, R.D., McAvoy, S.G., Robinson, A.E., Stroud, D.A., Woodward, I.D. & Wotton, S.R. 2019. Population estimates of wintering waterbirds in Great Britain. British Birds 112: 130—145.
Stanbury, A., Eaton, M., Aebischer, N., Balmer, D., Brown, A., Douse, A., Lindley, P., McCulloch, N., Noble, D. & Win, I. 2021. The fifth Birds of Conservation Concern in the United Kingdom, Channel Islands and Isle of Man and second IUCN Red List assessment of extinction risk for Great Britain. British Birds 114: 723—747.
van Roomen M., Citegetse G., Crowe O., Dodman T., Hagemeijer W., Meise K., & Schekkerman H. (eds). 2022. East Atlantic Flyway Assessment 2020.The status of coastal waterbird populations and their sites. Wadden Sea Flyway Initiative p/a CWSS, Wilhelmshaven, Germany, Wetlands International, Wageningen, The Netherlands, BirdLife International, Cambridge, United Kingdom.
Woodward, I., Aebischer, N., Burnell, D., Eaton, M., Frost, T., Hall, C., Stroud, D. & Noble, D. 2020. Population estimates of birds in Great Britain and the United Kingdom. British Birds 113: 69—104.
Woodward, I.D., Austin, G.E., Boersch-Supan, P.H., Thaxter, C.B. & Burton, N.H.K. 2022. Assessing drivers of winter abundance change in Eurasian Curlews Numenius arquata in England and Wales. Bird Study 68: 289—301.
Woodward, I.D., Frost, T.M., Hammond, M.J., & Austin, G.E. 2019. Wetland Bird Survey Alerts 2016/2017: Changes in numbers of wintering waterbirds in the Constituent Countries of the United Kingdom, Special Protection Areas (SPAs), Sites of Special Scientific Interest (SSSIs) and Areas of Special Scientific Interest (ASSIs). BTO Research Report 721. BTO, Thetford.
Further information, including site tables and trends for all the regular WeBS species, is available in the online report at: www.bto.org/websreporting
We wish to thank all surveyors and Local Organisers for making WeBS the success it is today. Unfortunately space does not permit all observers to be acknowledged individually, but we would especially like to credit the Local Organisers for their efforts.

Avon (excl Severn Estuary) Rupert Higgins
Bedfordshire Richard Bashford
Berkshire Sean Murphy
Buckinghamshire (North) Martin Routledge
Buckinghamshire (South) VACANT
Cambridgeshire (incl Huntingdonshire) Bruce Martin
Cambridgeshire (Nene Washes) Charlie Kitchin
Cambridgeshire (Ouse Washes) Paul Harrington
Cheshire (North) Phil Hampson
Cheshire (South) Paul Miller
Cleveland (excl Tees Estuary) Chris Sharp
Cleveland (Tees Estuary) Adam Jones
Cornwall (excl Tamar Complex) Derek Julian
Cornwall (Tamar Complex) Charles Nodder
Cotswold Water Park VACANT
Cumbria (Duddon Estuary) Colin Gay
Cumbria (excl estuaries) Dave Shackleton
Cumbria (Irt/Mite/Esk Estuary) Dave Shackleton
Dee Estuary Colin Wells
Derbyshire Phil Hampson
Devon (other sites) Pete Reay
Oxfordshire (South) Ben Carpenter
Severn Estuary (England) Harvey Rose
Shropshire Michael Wallace (now Martin George)
Solway Estuary (inner South) David Blackledge
Solway Estuary (outer South) Dave Shackleton
Somerset (other sites) Eve Tigwell
Somerset (Somerset Levels) Eve Tigwell
Staffordshire Scott Petrek
Suffolk (Alde Complex) Ian Castle
Suffolk (Alton Water) John Glazebrook
Suffolk (Blyth Estuary) Will Russell
Suffolk (Deben Estuary) Nick Mason
Suffolk (Orwell Estuary) Mick Wright
Suffolk (other sites) Alan Miller
Suffolk (Stour Estuary) Rick Vonk
Surrey Penny Williams
Sussex (Chichester Harbour) Peter Hughes
Sussex (other sites) Helen Crabtree & Dave Boddington
Thames Estuary (Foulness) Chris Lewis
The Wash Jim Scott
Warwickshire Matthew Griffiths
West Midlands Nick Lewis (now VACANT)
Devon (Exe Estuary)
Devon (Taw/Torridge Estuary) Martin Overy Chris Dee
Dorset (excl estuaries) Malcolm Balmer (now Nicola Hoar)
Dorset (Poole Harbour) Paul Morton
Dorset (Radipole and Lodmoor) Stephen Hales
Dorset (The Fleet and Portland Harbour) Steve Groves
Durham Anne Donnelly
Essex (Crouch/Roach Estuaries and South Dengie) Sean Murphy
Essex (Hamford Water) Leon Woodrow
Essex (North Blackwater) John Fell
Essex (other sites) Anthony Harbott
Essex (South Blackwater & North Dengie) Anthony Harbott
Gloucestershire Michael Smart
Greater London (excl Thames Estuary) Rob Innes (now VACANT)
Greater Manchester Tim Wilcox
Hampshire (Avon Valley) John Clark
Hampshire (estuaries/coastal) John Shillitoe
Hampshire (excl Avon Valley) Keith Wills
Herefordshire Chris Robinson
Hertfordshire Jim Terry (now VACANT)
Humber Estuary (inner South) Keith Parker
Humber Estuary (mid South) Barbara Moore
Humber Estuary (North) Nick Cutts
Humber Estuary (outer South) John Walker (now Owen Beaumont)
Isle of Wight Jim Baldwin
Kent (Dungeness area) David Walker
Kent (East) VACANT (now Maria Antonova)
Kent (Medway Estuary)) Bob Knight
Kent (Pegwell Bay) Steffan Walton
Kent (Swale Estuary) Brian Watmough
Kent (Thames Estuary – Hoo) Murray Orchard
Kent (West) VACANT
Lancashire (East Lancs and Fylde) Stephen Dunstan
Lancashire (North inland) Peter Marsh
Lancashire (Ribble Estuary) Ken Abram
Lancashire (River Lune) Jean Roberts
Lancashire (West inland) Phil Hampson
Lee Valley Cath Patrick
Leicestershire and Rutland (excl Rutland Water) Brian Moore
Leicestershire and Rutland (Rutland Water) Tim Appleton
Lincolnshire (North inland) Chris Gunn
Lincolnshire (South inland) Bob Titman
Merseyside (Alt Estuary) Steve White
Merseyside (inland) Phil Hampson
Merseyside (Mersey Estuary) Dermot Smith
Morecambe Bay (North) Mike Douglas
Morecambe Bay (South) Jean Roberts
Norfolk (Breydon Water) Jim Rowe (now Anthony Bentley)
Norfolk (excl estuaries) Mark Clay
Norfolk (North Nofolk Coast) Neil Lawton
Northamptonshire (excl Nene Valley) Barrie Galpin (now VACANT)
Northamptonshire (Nene Valley) Steve Brayshaw
Northumberland (coastal) Kathy Evans
Northumberland (inland) Tim Daley
Northumberland (Lindisfarne) Andrew Craggs
Nottinghamshire David Parkin (now Michael Hill)
Oxfordshire (North) Sandra Bletchly
Wiltshire Jenny Stunnell
Worcestershire Chris North
Yorkshire (East and Scarborough) Jim Morgan (now Alan Burnham)
Yorkshire (Harrogate and Yorkshire Dales) VACANT

Yorkshire (Huddersfield/Halifax area) VACANT
Yorkshire (Leeds area) Paul Morris
Yorkshire (South) Grant Bigg
Yorkshire (Wakefield area) Peter Smith
Aberdeenshire Moray Souter (now Patrick Cook and Lynne McKenzie)
Angus (excl Montrose Basin) Jonathan Pattullo
Angus (Montrose Basin) Anna Cowie
Argyll Mainland Nigel Scriven
Arran Jim Cassels
Ayrshire Dave Grant
Badenoch and Strathspey VACANT
Borders Andrew Bramhall (now Neil Stratton)
Bute Ian Hopkins
Caithness Sinclair Manson
Central (excl Forth Estuary) Neil Bielby
Clyde Estuary John Clark
Dumfries and Galloway (Auchencairn and Orchardtown Bays) Euan MacAlpine
Dumfries and Galloway (Fleet Bay) David Hawker (now Ian Bainbridge)
Dumfries and Galloway (Loch Ryan) Paul Collin
Dumfries and Galloway (other sites) Andy Riches
Dumfries and Galloway (Rough Firth) Andy Riches
Dumfries and Galloway (Wigtown Bay) Paul Collin
Fife (excl estuaries) Allan Brown (now VACANT)
Fife (Tay and Eden Estuaries) Norman Elkins (now Paul Blackburn)
Forth Estuary (inner) Michael Bell
Forth Estuary (outer North) VACANT
Forth (outer South) Duncan Priddle
Glasgow/Renfrewshire/Lanarkshire John Clark
Harris and Lewis Yvonne Benting
Islay, Jura and Colonsay David Wood
Isle of Cumbrae VACANT
Lochaber Kirstie & Callum Ross
Lothian (excl estuaries) Allan Brown (now Shawn Waddoups)
Lothian (Tyninghame Estuary) Tara Sykes
Moray and Nairn (inland) David Law
Moray and Nairn (Lossie Estuary) Bob Proctor
Moray Basin Coast Bob Swann
Mull Nigel Scriven
Orkney Sarah Money (now Tom Wells)
Perth and Kinross (excl Loch Leven) Michael Bell
Perth and Kinross (Loch Leven) Simon Ritchie
Shetland Paul Harvey (now Rory Tallack)
Skye and Lochalsh Jonathan Jones
Solway Estuary (North) Andy Riches
Sutherland (excl Moray Basin) VACANT
Tiree and Coll John Bowler
Uists and Benbecula Yvonne Benting
West Inverness/Wester Ross Andy Douse