

The Breeding Bird Survey 2024 incorporating the Waterways Breeding Bird Survey
Population trends of the UK’s breeding birds


The Breeding Bird Survey 2024 incorporating the Waterways Breeding Bird Survey
Population trends of the UK’s breeding birds
The BTO/JNCC/RSPB Breeding Bird Survey is a partnership jointly funded by the BTO, JNCC and RSPB, with fieldwork conducted by volunteers. The Breeding Bird Survey (BBS) now incorporates the Waterways Breeding Bird Survey (WBBS).
The members of the BBS Steering Committee in 2024 were James Pearce-Higgins (Chair), Dawn Balmer, Simon Gillings, Dario Massimino, David Noble (all BTO), Simon Wotton, Leah Kelly (both RSPB), Ethan Workman, Lucy Baker and Paul Woodcock (all JNCC).
British Trust for Ornithology The Nunnery Thetford Norfolk IP24 2PU
www.bto.org
BTO is a Registered Charity, Number 216652 (England & Wales), SC039193 (Scotland).

Joint Nature Conservation Committee Quay House 2 East Station Road Fletton Quays Peterborough PE2 8YY www.jncc.gov.uk
Royal Society for the Protection of Birds The Lodge Sandy Bedfordshire SG19 2DL www.rspb.org.uk

RSPB is a Registered Charity, Number 207076 (England and Wales), SC037654 (Scotland).
We would firstly like to thank all the volunteers who spend many hours in the field collecting the data for this report. Without their efforts, this scheme would not be possible. We are also grateful to the following people for their help in 2024: Lee Carnihan, Ben Darvill, Jemma Davies, Mark Hammond, Gethin Jenkins-Jones, Andrew Joys, Sorrel Lyall, Drew Lyness, Justin Walker and Steve Willis. Many people have contributed to both the BBS and WBBS schemes’ development and organisation, including Nicholas Aebischer, Mandy Andrews, Mark Avery, Stephen Baillie, Ian Bainbridge, Helen Baker, Richard Bashford, Jessa Battersby, George Boobyer, Andy Brown, Steve Buckland, Nick Carter, Steve Carter, Dan Chamberlain, Rachel Coombes, Humphrey Crick, Sarah Davis, Iain Downie, Mark Eaton, Sarah Eglington, Steve Freeman, Colin Galbraith, David Gibbons, John Goss-Custard, Rhys Green, Jeremy Greenwood, Richard Gregory, Sarah Harris, Rob Keen, John Marchant, Ian McLean, Mike Meharg, Richard Minter, Ian Mitchell, David Morris,
James Heywood is the BBS National Organiser and first point of contact for BBS or WBBS queries. James is responsible for the day-to-day running of these surveys, liaising with BTO Regional Organisers and volunteers, maintaining the databases, promoting the schemes, and producing the annual report. David White, Engagement & Surveys Officer for England, supports the National Organiser, primarily with the volunteer coordination of these surveys.
Caroline Brighton, Research Ecologist and Dario Massimino, Senior Data Scientist, both in the Bioacoustics and Data Science Team, produced the bird and mammal population trends for 2024. David Noble is the Principal Ecologist for Monitoring, responsible for strategic developments in biodiversity monitoring. Dawn Balmer is Head of Surveys, which includes both BBS and WBBS among other surveys. Maria Knight, Secretary in the Science Department, works closely with James and David assisting with the running of the surveys. Simon Gillings oversees the BBS and WBBS research programmes, and James Pearce-Higgins is the Director of Science.
Contact the BBS National Organiser: James Heywood, British Trust for Ornithology
Email: bbs@bto.org Tel: 01842 750050
The Official Statistics for BBS are formally published at: https://jncc.gov.uk/our-work/bbs-official-statistics
Further information, including graphs of population change, can be found at www.bto.org/bbs and www.bto.org/wbbs. A full species-by-species discussion of these results, and those from other surveys, can be found on the BirdFacts website at: www.bto.org/birdfacts
This report can be downloaded from: www.bto.org/bbs-report
Dorian Moss, Stuart Newson, Nancy Ockendon, Will Peach, Ken Perry, Mike Raven, Brenda Read, Warren Read, Angela Rickard, Kate Risely, Anna Robinson, William Skellorn, Ken Smith, Sandra Sparkes, David Stroud, Pierre Tellier, Chris Thaxter, Richard Thewlis, Derek Thomas, Mike Toms, Lawrence Way, Richard Weyl, Andy Wilson (BBS and WBBS logos), Mark Wilson, Karen Wright and Lucy Wright.
We acknowledge the support of the Northern Ireland Environment Agency, who fund professional fieldworkers to cover squares in Northern Ireland. Natural England, NatureScot and Forestry Commission Scotland (now Scottish Forestry) have contributed to additional surveys on Upland BBS and Scottish Woodland BBS squares in previous years. We are very grateful to the RSPB for funding the initial development of BBS Online, and to the BTO Information Systems Team who have continued to develop the system and provide technical support.
The founder sponsors of the 1998 WBBS pilot year were Thames Water, British Waterways, Severn Trent, Hyder (Welsh Water) and Anglian Water. Since then surveys have been funded by the Environment Agency, BTO, JNCC and RSPB, and sponsored by Severn Trent, Anglian Water and by Essex & Suffolk Water. The WBBS was adopted into the BBS Partnership in 2017.
The report was produced by James Heywood. The cover photo of a Raven was kindly supplied by Edmund Fellowes/BTO images and the report was printed by Swallowtail Print, Norwich, using carbonbalanced paper from responsible sources.
This is the 30th annual report of the BTO/JNCC/RSPB Breeding Bird Survey (BBS) and Waterways Breeding Bird Survey (WBBS), documenting the population trends of widespread UK breeding bird species during the periods 1994–2024 and 1998–2024 respectively. These are the main schemes for monitoring the population changes of the UK’s widespread breeding birds, providing an important indicator of the health of the countryside. Trends are produced each year for 119 species based on BBS data, and for 28 waterway specialist species based on WBBS data. Population trends are published as Official Statistics and have been produced to the high professional standards set out in the Code of Practice for Statistics. The results are used widely to set priorities and to inform conservation action.
17
Heywood, J.J.N., Massimino, D., Baker, L., Balmer, D.E., Brighton, C.H., Gillings, S., Kelly, L., Noble, D.G., Pearce-Higgins, J.W., White, D.M., Woodcock, P., Workman, E. & Wotton, S. 2025. The Breeding Bird Survey 2024. BTO Research Report 787. British Trust for Ornithology, Thetford.
Published by the British Trust for Ornithology, the Joint Nature Conservation Committee and the Royal Society for the Protection of Birds, May 2025.
© British Trust for Ornithology, Joint Nature Conservation Committee and Royal Society for the Protection of Birds, 2025.
BTO Research Report 787
ISSN 1368-9932 (print), ISSN 2756-0864 (online)
ISBN 978-1-912642-83-0
Below is a round up of the latest news for BBS and its partner projects.
In January of this year, BBS expanded its social media presence and is now posting both on BlueSky and X (formerly Twitter). Whist BTO has decided to move exclusively to BlueSky, our partnership survey accounts – including SMP and WeBS – will continue on both for the time being. BBS will stay on @BBS_birds on X and is now posting on @bbs-birds.bsky.social .


For this year’s report, we have updated the methods for calculating trends for Golden Plover. Golden Plover, along with five other species of wader, have always been subject to count filters; any count greater than 10 birds on an individual 200 m sector is assumed to be a late-wintering or passage flock and is excluded. For Golden Plover, data are also excluded if they fall within 18 100-km squares in the south and east of Britain. This approach was simple and computationally undemanding – a necessary requirement when processing millions of records annually to quickly generate and update official statistics (see the 2019 BBS report). However, with continual improvements in computational performance, we can now consider a more tailored approach. A number of scenarios were compared by BTO Research Ecologist, Caroline Brighton, and the best – first employed in this report – involved a spatial filter based on the combined 1988–91 and 2007–11 Bird Atlas breeding distributions, plus a 10 km buffer (Figure 1). Importantly, the increased spatial resolution of the filter means more squares contribute to population trends, with an all-time trend now available for England and an increase in precision of the five- and 10-year change estimates (p20).
Could other species benefit from this approach? Caroline also ran a similar spatial filter for Whinchat and Wheatear, migrants that are seen on BBS squares in both breeding and non-breeding areas. A spatial filter based on Atlas distributions for these species made no difference –the inclusion of relatively small numbers of passage birds in south-east Britain has no impact on population trends. This more tailored approach is therefore likely to have more of an impact for flocking species, so waterfowl is a likely target for more research. Equally, this method
won’t be effective for species with fast-expanding distributions; Atlases are conducted periodically, with the next BTO-led atlas to start in winter 2027! Importantly, there is always a balance between ever more fine-grained modelling and greater precision versus the need to produce answers quickly to inform conservation decision making.

Figure 1: The distribution of 10-km squares with breeding Golden Plover from the second and third Bird Atlases combined (dark blue), plus the 10-km buffer around this range (light blue). Points show the locations of Golden Plover 1-km BBS squares (1994—2023) within (black) or outside (red) its combined Atlas range. Note this is after applying the 10-bird-rule (i.e. a count threshold of >10 in the same section and distance band).
Readers of our end-of-year newsletter will recall the blog article ‘ From landscape to soundscape ’ by William Gough of the University of East Anglia (UEA), where he describes his PhD research within UEA’s wider ‘Economics of Biodiversity’ programme.
At the time of writing, 58 volunteers have sound recorders deployed on 61 BBS squares to help William gather enough data for the project. Thank you to everyone who is taking part.


Last year was a really poor year for butterflies, with Butterfly Conservation declaring a Butterfly Emergency on the back of results from the Big Butterfly Count. Data from The UK Butterfly Monitoring Scheme (UKBMS) have subsequently confirmed that 2024 was one of the worst years on record for UK butterflies; 51 out of the UK’s 59 species declined between 2023 and 2024.
For the Wider Countryside Butterfly Survey (WCBS), coverage on BBS squares was up to 316, an increase of 10% compared with 2023 and the highest coverage for a decade. Thirty-eight butterfly species were recorded on BBS squares as part of WCBS, with seven seen on just the one square. A highlight is a colony of Marsh Fritillary on the island of Islay, west Scotland. Islay supports one of the strongest populations of this species in the UK.


One of the 61 acoustic recorders collecting data as part of the UEA study.
Continuing on the topic of sound, we were delighted when Cathy Shaw, a BBS volunteer in the Yorkshire Dales, got in touch to advertise an episode of ‘Nature Tripping’, a podcast published by Cathy’s partner, Jo Kennedy, on our interaction with sound in nature. Cathy spoke about her experiences of 14 years of BBS surveying in the Dales and the evocative sound of the Curlew (episode 27 – tinyurl.com/bdf7mjuy ).

2025 will be the 50th year of fieldwork for the UKBMS, one of the longest running insect monitoring schemes in the world. WCBS forms an important part of this scheme; whilst the long-standing and traditional Pollard Walks (or ‘Transects’) are on self-selected sites, WCBS provides an important representative picture of the wider countryside. To celebrate this landmark for UKBMS, a series of events will be held throughout the year. Local Branches up and down the country will be hosting events in their area. BTO, who are part of the UKBMS partnership by virtue of the link with WCBS, will also be hosting an event at the Nunnery in July or August, with more details to come in due course. The year will culminate in a 50th anniversary conference on 11 October at Nottingham University. For more details on the year’s events, including the end of year conference, please visit: https://ukbms.org.
Small Tortoiseshell already had a poor year in 2023, with overall UKBMS figures showing a one-year decline of 50%. But 2024 was the worst year ever for this species and it is in significant long-term decline in all four countries of the UK.
Many BTO regions saw record coverage to go alongside some very impressive individual contributions.
2024 was the best year for BBS coverage this decade and the fourth best of all time (Table 1). As usual, there was fluctuation in coverage; whilst there was only a relatively small increase of 31 squares covered overall, there were more obvious gains in some areas and losses in others. Of particular note was the terrific increase in coverage in the Merseyside region from 10 to 18 squares, and tripling in the space of two years. There is currently no Regional Organiser (RO) for Merseyside and this increase followed a successful series of BBSfocused training events in the north-west of England in the spring of 2024 (see p8–9).
It was also a record year for many regions. Sussex became the first ever region to reach 200 squares, and the Scottish Borders the first mainland region to achieve 100% coverage – all 68 squares – in 2024, many of them in some very remote places indeed. In all, 17 regions achieved their best or joint best coverage in 2024: Argyll (Mull, Coll, Tiree & Morvern); Arran; Ayrshire & Cumbrae; Borders; Buckinghamshire; Cornwall; Dorset; Essex (northeast); Glamorgan (south); Gwent; Islay, Jura & Colonsay; Isle of Wight; Lothian; Moray & Nairn; Oxfordshire (south); Sussex and York.
As well as these superb collective efforts, there were some very impressive individual contributions. Two volunteers achieved some staggering personal coverage, with Steve Davies (RO West Midlands & Worcestershire) completing 50 visits for BBS and WBBS, and Neil Stratton (RO for the Scottish Borders) completing 38 visits.
The boost given to coverage in Scotland by Upland Rovers continues; 2024 was the third best year north of the border and 84 Upland Rover squares were covered in what was a particularly challenging year for weather. In Wales, there are some encouraging signs, with an additional nine squares covered since 2023, and follows the first year of a new full-time engagement post in Wales. On the other side of the Irish Sea and also benefiting from a new Engagement Coordinator, Northern Ireland achieved its second highest coverage. This was aided by the coverage of 52 squares by three professional surveyors, largely in the west of
Table 1: The number of BBS squares with data received to
participating by
and the
the country, and in the first year of a new funding agreement which sees DAERA support for professional surveyors as well as mentoring of new volunteers.
A total of 236 species were seen across all 3,967 squares. The square with the most species recorded was, once again, in the Cotswold Water Park in Wiltshire (71 species), followed closely by a Cambridgeshire square at the head of the Ouse Washes (68 species). Both were
particularly noteworthy for their herons, with six species recorded between them – Grey Heron, Little Egret, Great White Egret, Cattle Egret, Bittern and Purple Heron! It was a record year for Bittern on BBS, being heard (and occasionally seen) on nine squares in 2024, 50% more than the previous record in 2019. At the other end of the scale, nine upland squares held two or fewer species (though some of these squares had just a single visit). Thankfully no one had the ignominy of having no birds, though nine visits – again, all in the uplands – recorded only Meadow Pipit. Whether it is one or 71 species you observe, data from all squares are equally valuable!
Twenty-seven species were seen on just one square and included the Purple Heron above, along with Marsh Warbler, Little Gull and Garganey. Three species seen rarely on BBS squares – at least in the past – are the subject of this year’s BTO/RSPB/Natural England Heathland Birds Survey Woodlark, formerly seen on just one in 200 BBS squares, now has a five-year trend in England and is seen on one in 85 squares across the UK, thanks in part due

BBS data shows that Woodlark has increased by 75% in England in the last five years and is one of the subjects of this years Heathland Birds Survey
The map (Figure 2) illustrates where coverage changed between 2023 and 2024 within 10-km squares. Whilst there was only an increase of 31 squares overall, there are more localised changes with some gains and losses. As well as Merseyside and Lancashire, there were local gains in south-east Wales, southern Scotland and across the west of Northern Ireland. The 84 Upland Rover squares from 2024 ● are also shown. Alongside these were 3,755 ‘core’ BBS squares, 89 ‘add-on’ Upland Adjacent squares and 36 Scottish Woodland (SWBBS) squares.
Other squares from separate ‘add-on’ schemes (Upland BBS and SWBBS-Adjacent) no longer included in BBS coverage (having been surveyed from 2006 to 2013 by professional fieldworkers) are not included in Table 1. However, data from these squares in the years covered are included in the data analysis and trend calculations for the years they were surveyed. Ongoing, professional coverage of squares in Northern Ireland is included in the map and table. Please see pages 16 and 17 for more information on these surveys and square types.
to growth in coverage in counties of southern England, but also due to its recent expansion into farmland from its more traditional wooded heath habitat. By the time this report is published, national survey visits for Woodlark will be complete. Dartford Warbler was seen on 26 squares in 2024 and – as in BBS – visits for the Heathland Birds Survey will go on to the end of June. The third focal species is Nightjar, with visits to survey this crepuscular migrant being in June and July. If you would like some evening bird surveying to go with your early morning BBS, then please visit the taking-part pages of the survey’s website www.bto.org/heathland-birds-survey. The survey aims to provide updated population estimates for these three species – all of which are reliant to a large degree on the UK’s network of protected lowland heathland sites (see p12–14).

Figure 2:
Change in the number of BBS squares surveyed per 10km grid between 2023 and 2024. Upland Rover squares surveyed in 2024 are green circles.

BTO is blessed with a skilled and dedicated Engagement Team, directed by Ieuan Evans. Here, we hear how one arm of this unit — the Country Operations Engagement Team — tackles the perennial challenge of recruiting, training and retaining survey volunteers.
David White, Engagement & Surveys Officer, BTO

BTO is often asked what we are doing as an organisation to increase participation in surveys like BBS and WBBS across the UK. One priority of the Country Operations Engagement Team is just that. So, how do we do it?
BTO has an established record in providing a range of training resources and options for people of all abilities and motivations. The use of online training has really grown in the last few years and the Engagement Team run various events, ranging from courses on identification, to more informal ‘Meet the BTO’ evening sessions, where supporters can learn more about BTO’s surveys.
As well as doing their fair share of engagement activities virtually, the County Operations (CO) Engagement Team – led by Ben Darvill – prioritises leading face-toface sessions about BTO surveys for small groups of people. These sessions are limited to around a dozen participants each, and offer the opportunity to ‘learn by doing’ in a supportive environment.
The fundamental aim of BBS training sessions is to demonstrate to participants that taking part in the survey isn’t as complicated as it may initially seem, and it allows them to try out the survey with others. Where possible, the sessions are held entirely in the field. The team sends attendees off to survey mock transect sections and as they go, talk about the nuts and bolts of the survey methodology that surveyors need to know.
As I am sure you can appreciate, surveying a BBS square in an upland area is a vastly different experience to surveying a square in lowland farmland! As a result, the team delivers these sessions at a wide variety of venues in a range of habitats, with those in more upland environments taking account of the additional challenges of navigation with a nod towards potential Upland Rover volunteers.
An important question to address at this point is how the team prioritises where in the UK to deliver these sessions? A large part of this is based upon analysing BBS coverage across the 130 UK ‘BTO regions’. If it looks like BBS coverage could benefit from a boost, the team will focus on those areas.
An absolutely crucial part of maintaining BBS coverage across the UK is the Regional Network and specifically the 100 or so BBS Regional Organisers who coordinate the survey on behalf of BTO in their respective regions (see back cover). They are all volunteers, and without them, the survey would cease to operate very quickly. We also often find that if a region is without a BBS Regional Organiser or a Regional Representative (RR), BBS coverage tends to drop. The team therefore spends a lot of time focusing on these so-called ‘vacant’ regions, in an effort to boost BBS coverage in them.
We also work with both new and existing Regional Organisers to deliver these types of sessions in their regions. This not only serves to get to know potential and existing surveyors, it also allows them to meet members of the team in person. This helps to build relationships between our volunteers and BTO staff. This is especially important, and it definitely helps with volunteer retention going forward.
Please read on to find out what some of the members of the team did during 2024 to try to increase participation in BBS in their respective countries across the UK.

With dedicated engagement staff focusing on all four UK nations, BTO can reach and better support volunteers — be they surveyors or Regional Organisers — and provide training and help that is tailored to the individual needs of those countries. The Upland Rover and upland-themed training is a great example. Below, each of the four BTO Country Operation Engagement Coordinators give a snippet of the work they have been doing for BBS.
Northern Ireland: Jemma Davies & Sorrel Lyall
We offered two options for spring training in 2024 — specific BBS training and more relaxed bird identification training walks to build confidence in song and call identification for those who didn’t yet feel ready to take the plunge into BBS surveying. We offered both options in four locations, with 22 people signing up for BBS training and 33 for bird identification training. We also trialled a Spring Birding Support scheme, involving both small group sessions where participants worked together on identification and mock BBS transects, and one-toone support for new BBS surveyors. These approaches helped 2024 to be the second best year ever for BBS coverage in Northern Ireland.


If you are interested in helping out, especially in one of the VACANT regions in orange (see back cover), then please get in touch!
Figure 3: As well as promoting BBS to potential new surveyors, the CO Engagement Team also support members of the Regional Network and work to fill vacancies. BBS ROs are critical to the successful running of the survey.
Wales: Gethin Jenkins-Jones


Being my first spring working for BTO, I was very excited to engage with new people about BBS. I organised four training events across Wales, often with BTO Regional Representatives. It was great meeting the attendees whilst discussing and practising the survey, before finishing with some nice refreshment of hot drinks and cookies! We had a growth in BBS coverage in Wales in 2024, with 309 squares covered across the country. Now slightly more confident, for 2025 I plan on doing nine training events, tweaking things slightly to make the sessions even more enjoyable for those wishing to join us in 2025, and years beyond.

Scotland: Steve Willis
Upland habitats cover a huge proportion of Scotland and we have known for a long time that they are under-recorded. 2024 saw BTO Scotland continue to offer upland-specific training, and we spent time with existing and prospective volunteers in Skye, Lochaber, Aberdeenshire, Dumfries & Galloway and even in the Ochils just above the BTO Scotland Office in Stirling. Whilst there are obvious challenges in terms of terrain in the uplands, a major benefit of carrying out BBS in upland areas is that there are fewer species of birds, lower numbers overall, and birds are more likely to be visible. Upland surveys make for a great starting point in a volunteer’s BBS journey.
For all the latest in-person or online BTO events and training please visit: www.bto.org/events
In similar style to other UK countries, we’ve offered separate face-to-face sessions in the spring focusing on ‘Demystifying BBS’ and ‘Birdsong ID practice’ — delivering four of each sessions in north-west England and Devon respectively. In the face of challenges and unforeseen distractions delivered by gale-force winds, medieval battle re-enactments and parkruns, we had 24 people sign up across the very enjoyable BBS engagement sessions, and 38 people for the bird songs and calls practice events, which was fantastic to see. These sessions resulted in a spike in BBS uptake in north-west England especially, with a few BBS squares and a also WBBS stretch being allocated to participants in Devon.

Regular readers of the BBS report will realise just how valuable BBS data is and how much it is used. Now, accessing and using these data has just got a lot easier.
Dario Massimino, Senior Data Scientist, BTO, Simon Gillings, Head of Data Science & Bioacoustics, BTO and James Heywood, BBS National Organiser, BTO
BBS and WBBS data form an invaluable dataset that is often used for national and international scientific research. Up until now, scientists and other groups interested in using BBS and WBBS data have had to request these data. This approach — whilst enabling the BBS partners to monitor and easily describe how the data are used, as well as be involved in collaborations — has its drawbacks. But since December 2024, BBS data have become more accessible, via the publication of the BBS data paper.
Every year, BBS reports on the population trends of the UK’s common terrestrial birds with 119 species currently reported (p18–19). The trends produced – which are official government statistics – can be combined with those from the BBS’s predecessor, the Common Birds Census (CBC). The resulting composite trends stretch from the 1960s and are a major contributor to the annual Wild Bird Indicators (also official statistics), which have highlighted the longterm declines of our farmland birds and more recent declines of woodland species. BBS data are widely used in research, including work on the value of protected areas for birds (p12–14).
The 2023 BBS Report marked the 30th year of BBS fieldwork, with over 100 volunteers contributing data – all collected from randomly selected 1-km squares across the UK – in each year of the scheme. Together, nearly 9,000 people from across the UK surveyed over 7,000 different squares over the course of those 30 years. Typically, each square demands two visits per year and, following the 2024 field season, 15 of those volunteers each amassed over 180 visits. That is the equivalent of surveying three squares a year for 30 years! In total, the BBS dataset represents well over 300,000 hours of recording by a committed and skilled set of volunteers and in a given year, approximately 15,000 km are trodden (and occasionally waded) by volunteers on their transects.

The Goldfinch is synonymous with BBS, being the scheme’s logo — designed by Andy Wilson — since the very beginning. The new published dataset sees 146,766 records of Goldfinch, which puts it in 19th place in terms of number of records. Woodpigeon, Blackbird and Carrion Crow have the greatest number of records in the new dataset with over one million between them.
Over time, these volunteers have generated over eight million biological records (birds, mammals and habitat). However, although these data have formed the backbone of over 180 peer-reviewed papers by researchers far and wide over the decades, until now they have not been readily accessible to everyone, available only on request. These requests place a significant time constraint on the staff that support them. Working with our colleagues at BTO and BBS partner organisations, we decided to address this. Now, for the first time, the raw data generated over the 30 years of BBS have been published. This move makes BBS one of the only structured national bird recording schemes which makes the data collected by the tremendous efforts of its volunteers available in this way.
The published dataset contains 7,070,577 records of 26,375,773 individual birds of 217 species. Aside from a small number of passage migrants, the majority (158 species, 73%) are regular UK breeding bird species and account for 64% of the UK breeding birds (Figure 4). Some restrictions or constraints apply; for example, over 39,000 records of 78 sensitive species – as defined by the National Biodiversity Network – were not included for welfare reasons.

Figure 4: Which species does BBS monitor effectively? Bars show the UK population size of all breeding species; the blue bars show the 119 species with BBS trends, the dark grey bars show seabirds (not covered by the BBS which is a terrestrial survey), and the light grey bars show the species for which there are not enough BBS data to reliably estimate population trends. Population size is on a logarithmic scale.
The published data are available at a relatively fine spatial scale; volunteers submit data on up to 10 200 m ‘transect sections’ and record over one of three distance bands, plus in-flight birds, and it is at this level that the data have been published. In addition to the data, our paper describes the development of the survey, the analytical methods we use to calculate population trends, and information on how these are used. This publication now becomes the single, citable reference point for all aspects of the survey, including its field protocol, sampling design and analytical methods.
Data from BBS have been used to support a number of important developments. As well as the annual production of official statistics, BBS data are pivotal to the production of periodic assessments of bird populations, via the Avian Population Estimates Panel (APEP), and for setting conservation priorities via Birds of Conservation Concern. In addition to the recent work on protected areas, BBS data have a long association with research into our farmed land and land management via assessments into the effectiveness of agri-environment schemes, as well as threats to woodland birds and assessing the effects of climate change. By opening up this rich seam of information, we hope and expect BBS data to be put to yet more impactful use.
Whilst the North American Breeding Birds Survey has already been releasing site-level data, to the best of our knowledge, the publication of the BBS dataset is the first breeding season dataset to be made available in this way in Europe.
To publish the entire dataset, down to the 200 m transect section level is another step entirely, and a decision that was not straightforward and came with some challenges. For example, some of the running costs of BBS are supported by income from data services and contract work that we are well suited to do, having first-hand experience of these data. It may also reduce the degree to which the BBS partners – BTO, JNCC and RSPB – can collaborate with other organisations, now they no longer have to request these data. But, making the data more widely available of course gives them much added potential; the range of applications for BBS data is large. The data will act as a rich source for those interested in analytical considerations –the advancement of statistical techniques, and integration of other taxa to study species interactions. Above all, we expect that the publication of BBS data will pave the way for more impactful science by a greater range of people to provide better futures for birds and other wildlife.

BBS volunteers record every species they see or hear when completing their surveys, including Dotterel, which are seen on around two to three squares per year. Records for rarer species like this one are not included in the published dataset for welfare reasons. Dotterel — alongside Ptarmigan and Snow Bunting — are the subject of the 2025 Montane Bird Survey, run by RSPB and NatureScot.
Massimino, D. et al. 2024. The Breeding Bird Survey of the United Kingdom. Global Ecology and Biogeography 34: e13943. doi.org/10.1111/geb.13943
Pearce-Higgins, J.W. et al. 2018. Overcoming the challenges of public data archiving for citizen science biodiversity recording and monitoring schemes. Journal of Applied Ecology 55: 2544—2551. doi.org/10.1111/1365-2664.13180
The 2022 Breeding Bird Survey report highlighted the work of BTO and RSPB on assessing the effectiveness of the UK’s network of protected sites for bird conservation. Here we report on a follow up to this work.
The results of the work published at the start of 2023 were encouraging; protected area extent was positively related to bird occurrence and abundance. But does the quality of these protected areas matter as well?
As recently as December 2022, a landmark agreement called the Kunming-Montreal Global Biodiversity Framework was established by world leaders from 196 nations to halt nature loss and prevent ecosystem collapse. Among the key ambitions of the Framework were global targets to protect 30% of land, coastal waters and ocean by 2030 (known as ‘30 by 30’). As a result, this has led to a rapid expansion of land and sea globally being designated as protected. But how effective are protected areas (PAs; see Box 1) at reducing biodiversity loss?
This question was the premise for previous BTO- and RSPB-led research using BBS data, which assessed how the size of PAs affects biodiversity metrics, using UK birds on terrestrial sites as a case study. The study found strong evidence that PA extent was associated with increases in the occurrence and abundance of bird species, with benefits being greatest for species of highest conservation concern. However, to achieve the greatest possible benefits for wildlife, we also need to understand the relationship between biodiversity metrics and the quality of the protected areas. Hence, it is not just the size and quantity of PAs that is likely to be important in meeting the biodiversity targets, but also their management and condition. Therefore, as a BTO follow-on study, we used BBS data to explore the relationship between PA condition and bird biodiversity.
Box 1: Protected Sites in the UK — a recap.
• Special Protection Areas (SPA): These are selected to protect one or more rare, threatened or vulnerable bird species listed in Annex I of the Birds Directive, or certain regularly occurring migratory species.
• Special Areas of Conservation (SAC): These protect one or more special habitats and/or non-avian species — terrestrial or marine — listed in the Habitats Directive.
• Site/Area of Special Scientific Interest (SSSI/ASSI): These are a GB-/NI-based designation and may be based on particular flora, fauna, habitats or geology.
We tested whether improving site condition (a current policy target) would also improve species counts (abundance) and changes in abundance through time (population trends) within UK PAs. We used BBS population data combined with condition data provided by the Statutory Nature Conservation Bodies (SNCBs – Natural England, Natural Resources Wales, Northern Ireland Environment Agency and NatureScot), as the best indicator of changes in PA quality. The SNCBs monitor the status of PAs on a sixyear reporting cycle by evaluating condition with respect to standardised ecological interest features (habitats, species or geology) for which the PAs have been designated (i.e. in accordance with SSSI/ASSI selection guidelines). For example, for habitats, they might be heathland or woodland; for species, they might be butterflies or breeding birds; and geological features, might be fossils or landforms. For each feature, performance indicators are developed by identifying the key attributes which describe its condition (e.g. habitat extent or quality, species population size or distribution).

An example Protected Area is the Breckland SPA in East Anglia — close to the BTO Head Office — designated for Woodlark, Stone-curlew and Nightjar. The reliance on protected sites by Woodlark and Nightjar — as well as Dartford Warbler — provides a major motivation for this year‘s Heathland Birds Survey.

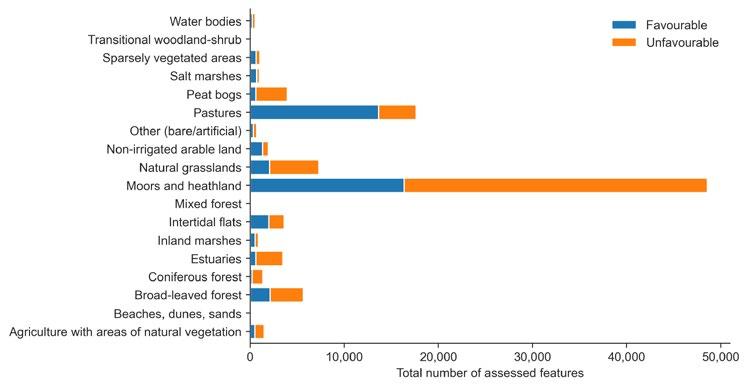
PAs may have multiple features of interest, and Figure 5 shows how the assessments are divided between the various feature types. For Northern Ireland, Wales and Scotland, data are provided for the condition of each individual whole feature within the PA, whereas for England, condition is summarised across PA units (PA is subdivided by historical tenure) and data is provided for the combined condition of each unit. This is an important consideration which impacts the results, since the England condition assessments are less likely to reflect overall condition of the protected site as they are measured across multiple features. The results of the latest condition monitoring indicate that many PAs are in poor condition, with certain land cover types being more adversely affected (e.g. moors and heathland, peat bogs, estuaries; Figure 6).
The condition data are referenced to the whole PA (or PA unit in England), while the BBS data is per 1-km grid square, so we had to spatially match the two datasets. Due to the multiplicity of feature assessments, we created variables that reflected the average condition of each PA (the proportion of favourable and proportion of unfavourable condition assessments) that contained
Figure 6: Total number of favourable and unfavourable land cover related condition assessments. Land cover data were derived from the CORINE Land Cover inventory, using the dominant land cover type per PA with an intersecting BBS square from our analysis. A protected area is counted more than once if it intersects more than one BBS square.
Figure 5 : Two different breakdowns of the number of feature types which were assessed for condition, per protected area (PA) designation: By (a) broad classification of Habitat- or Species-based (and also Geology, which is unique to SSSIs), or (b) by the type of habitat or species. SPAs are designated only for birds, and there is a dominance of bird designation for SSSIs. Upland habitats form a significant proportion of SAC feature designation.
an overlapping BBS square. We then tested whether favourable site condition was associated with an increase in species’ abundance and/or a more positive trend, while controlling for differences in climate, land cover, and elevation. Due to the different methods of assessing PA condition across countries, we separately analysed i) the UK, ii) Northern Ireland, Wales and Scotland combined (NI/WA/SC) and iii) England only (ENG).
Our analysis used statistical modelling (mathematical representation of observed data) to determine the relationship between bird abundance/trend and the proportion of the PA in favourable condition in a BBS square. This allowed us to test whether PAs in favourable condition have better species’ abundance and/or trends, on average, than unfavourable sites (Figure 7). Overall, we found some evidence that protected sites in favourable condition were associated with greater bird abundances than PAs in unfavourable condition in Wales, Scotland and Northern Ireland combined. We also found evidence that PAs in favourable condition were associated with increased population trends compared to unfavourable PAs in Wales,

Scotland and Northern Ireland combined (Figure 7b). These results were not apparent in England – which represented the bulk of the data – or consequently, the UK, likely due to the different assessment method.
We also tested the hypothesis that favourable PA condition will benefit the same species that were found to benefit from PAs in general in the previous study (i.e. rare, specialist and cold-adapted species, those of high conservation concern and those of certain habitats). We found that the abundance trends of Red-listed species in the UK and English data were more positive within PAs (regardless of the extent to which these were in favourable or unfavourable condition) than outside PAs. This suggests that species of conservation concern benefit from PAs whatever their condition. There was also some evidence that favourable PA condition was more beneficial for habitat specialists and cold-adapted
Brighton, C.H. et al. 2024. Protected areas in good condition have a positive effect on bird population trends. Biological Conservation 292: 110553. doi.org/10.1016/j.biocon.2024.110553
Figure 7: Summarising the effect of PA condition on abundance and trend dynamics of UK breeding bird species. The point plots represent the means (±95% CIs) of all modelled species with negative and positive associations for each population measure (abundance and trend in abundance) and favourable or unfavourable PA condition (weighted by area that intersects the monitored 1-km square). The bar graphs represent the percentage of species with a significant (bold colours) or nonsignificant (pale colours) positive or negative relationship with PA condition. (a) For the whole UK; (b) for Northern Ireland, Wales and Scotland combined; and (c) England only.
species than for generalists. This makes sense given that the rare habitats on which the specialists depend are likely to be found only within PAs.
Our findings suggest that improving protected areas in unfavourable condition can deliver benefits to global species recovery and biodiversity, and highlights the importance for policy actions to include effective conservation management. Considering the Global Biodiversity Framework’s ambition of ‘30 by 30’, simply achieving coverage – without ensuring those areas are of sufficient quality – may not be sufficient to restore biodiversity. Therefore, this study provides new knowledge to inform policy objectives, both with respect to the Convention on Biological Diversity (CBD) framework and for UK governments. It is important to note that while the creation of PAs is the main way the biodiversity targets are being realised in Europe, other effective areabased conservation measures also play a crucial roleincluding set-aside within agriculture areas, military areas or watersheds. Designating and managing protected areas must be addressed in combination with anthropogenic activities outside of these areas, otherwise, we run the risk of exacerbating unsustainable land management and undermining the benefit of the protected areas.
Davies, J.G. et al. 2023. Spring arrival of the common cuckoo at breeding grounds is strongly determined by environmental conditions in tropical Africa. Proceedings of the Royal Society B. 290: 20230580. doi.org/10.1098/rspb.2023.0580
Denerley, C. et al. 2019. Breeding ground correlates of the distribution and decline of the Common Cuckoo Cuculus canorus at two spatial scales. Ibis 161: 346—358. doi.org/10.1111/ibi.12612
Douglas D.J.T. et al. 2010. How important are climate-induced changes in host availability for population processes in an obligate brood parasite, the European cuckoo? Oikos 119: 1834—1840 doi.org/10.1111/j.1600-0706.2010.18388.x
Hewson, C.M. et al. 2016. Population decline is linked to migration route in the Common Cuckoo? Nature Communications 7: 12296 doi.org/10.1038/ncomms12296
Mills, L.J. et al. 2020. Using molecular and crowd-sourcing methods to assess breeding ground diet of a migratory brood parasite of conservation concern. Journal of Avian Biology 51 : e02474 doi.org/10.1111/jav.02474
Cuckoo numbers are changing in different ways in different parts of the UK. Studies both at home and abroad shed light on how and why this variation exists.
Chris Hewson, Senior Research Ecologist, BTO
This focus on Cuckoo reviews more than a decade of work undertaken by BTO and RSPB on UK Cuckoo population changes, and looks at some of the most recent trends.
Until around 2010, the declines seen in Cuckoo were one of the many stories of UK bird decline. Since then, Cuckoos have been on the up in parts of the UK, increasing by 20% in the last 10 years and 7% in the last five. Looking within Great Britain, there is substantial difference between different countries, with Cuckoo in Scotland having increased by two-thirds since 1995 and 40% in the last 10 years. In Wales, a decline of 34% between 1995 and 2010 has been reversed in the subsequent decade, with a 44% increase seen between 2012 and 2022. Only in England has the decline continued, where Cuckoo numbers are now a third of what they were in the mid 1990s and less than a quarter compared to the mid 1960s (Figure 8).
A programme of tagging studies has revealed that this geographical pattern correlates to differences in mortality seen during migration back to the non-breeding grounds south of the Sahara (Hewson et al. 2016). During postbreeding migration, tracked Cuckoos in the uplands of Scotland and Wales migrated via a south-easterly route, whereas in England varying proportions of birds take either this route or a south-westerly route. It has been shown that there is a significantly increased mortality on the southernwesterly route and that its use correlates with the degree of local population decline. It is known that Cuckoos have not advanced their date of arrival in the UK, contrary to other species, and these tracking studies show that environmental

Figure 8: Cuckoo population indices in Scotland, Wales and England. Cuckoos have increased in both the north and west of Great Britain, especially since 2010. See p17 for details on interpreting graphs.

conditions on stopover locations in West Africa limit their ability to do so. This timing constraint appears to increase mortality risk at multiple stages of the annual cycle as the birds attempt to compensate (Davies et al. 2023).
As well as variation in migratory behaviour, there is also variation in habitat preference, diet, and host species. A study investigating both local and national scale variation in Cuckoo abundance found that Cuckoos were now more likely to occur in semi-natural habitats with more Meadow Pipits and fewer Dunnocks, compared with intensively farmed landscape with fewer Meadow Pipits and more Dunnocks (Denerley et al. 2019). Cuckoos are also increasingly associated with wetlands, specifically reedbeds (or reed-lined waterways) where Reed Warbler is the main host species. Whilst Cuckoo in lowland Britain/England is still in decline, one region of England where Cuckoos are increasing is in the East of England (17% increase in the last five-years). This region also has both 10- and five-year increases in Reed Warbler populations, though previous work published prior to this more recent increase in Cuckoos has shown that host populations are not a limiting factor (Douglas et al. 2010).
There is also an impact of Cuckoo prey availability. The moth species favoured by Cuckoo have declined faster than other moth species (Denerley, et al. 2019) and are the species most vulnerable to intensive land management (Mills et al. 2020). These moths are becoming increasingly confined to areas of semi-natural habitat and wetland, as well as – for example, the Garden Tiger – shifting range northwards.
These studies cover a wide range of aspects of Cuckoo lifehistory, from diet, host population, habitat preference and migratory strategy. Together, they paint a complex picture, and indicate that conditions in the UK and on migration contribute to Cuckoo population changes.
The BBS was launched in 1994 to provide more representative habitat and geographical coverage than the main survey running at the time, the CBC. The CBC ended in 2000, and the overlap period between 1994 and 2000 allowed BTO to develop methods for calculating long-term trends (from the 1960s to the present) using data from both schemes. The BBS National Organiser, based at BTO HQ, is responsible for the overall running of the scheme, and is the main point of contact for the network of volunteer Regional Organisers (ROs). ROs are responsible for finding new volunteers and allocating squares to observers in their region. At the end of the season they validate submissions made online, and collect paper submissions for inputting.
The BBS is a line-transect survey based on randomly located 1-km squares. Squares are chosen through stratified random sampling, with more squares in areas with more potential volunteers. The difference in sampling densities is taken into account when calculating trends. BBS volunteers make two early-morning visits to their square during the April–June survey period, recording all adult birds encountered while walking two 1-km transects across their square. Each transect is divided into five 200-m sections for ease of recording. Birds are recorded in three distance categories, or as ‘in flight’, in order to assess detectability and estimate species density. To assess further the detectability of species the option of recording how birds were first detected (by song, call or visually) was introduced in 2014. Observers also record the habitat along the transects, and may record any mammals seen during the survey. Surveying a BBS square involves around six hours of fieldwork per year, and the aim is for each volunteer to survey the same square (or squares) every year.
As BBS squares are selected randomly, they can turn up within any kind of habitat. Some squares can never be surveyed, and these truly ‘uncoverable’ sites are removed from the system. However, squares that are temporarily inaccessible, or which are not taken up due to their remote location, are retained in order to maintain the integrity of the sampling design.
The BBS provides reliable population trends for a large proportion of our breeding species. Trends can also be produced for specific countries, regions or habitats. For these analyses, we take the higher count from the two visits for each species, summed over all four distance categories and 10 transect sections. Only squares that have been surveyed in at least two years are included in the analyses. Population changes are estimated using a log-linear model with Poisson error terms. Counts are modelled as a function
of year and site effects, weighted to account for differences in sampling densities across the UK.
Since 2009, data from additional randomly selected 1-km squares surveyed as part of the Scottish Woodland BBS and the Upland BBS have been included in the BBS sample. These squares were surveyed using the same methodology as standard BBS squares, and results were incorporated into the trends, accounting for additional sampling effort. Since 2010, the option of adding an Upland Adjacent square to an existing ‘Eligible Upland’ BBS square has been encouraged, with the aim of increasing coverage in upland areas. These data are treated separately during analysis.
The ‘Upland Rovers’ initiative was introduced in 2017, with the aim of further increasing coverage in remote areas. Carefully selected squares are available to be surveyed just once by ‘roving’ volunteers. These are ‘core’ BBS squares with poor to no previous coverage, upland in habitat type and remote as identified by a combination of distance from road and local human population.
Work has been carried out to assess the reliability of BBS trends, to ensure that reported trends are based on reliable data and sufficient sample sizes. This work has resulted in the following exclusions and caveats:
• We do not report population trends for six species of gull (Black-headed, Mediterranean, Common, Great Black-backed, Herring and Lesser Black-backed), as a large proportion of the records are of non-breeding, wintering or migratory individuals.
• Trends for rare breeding species with substantial wintering populations (e.g. Fieldfare) are excluded.
• Trends for Common Tern, Cormorant, Grey Heron and Little Egret are reported with the caveat that counts may contain a high proportion of birds away from breeding sites.
• Trends for Barn Owl and Tawny Owl are reported with the caveat that the BBS monitors nocturnal species poorly.
• Counts for six wader species (Oystercatcher, Lapwing, Golden Plover, Curlew, Snipe and Redshank) are corrected to exclude transient and other non-breeding individuals or flocks. Spatial filters (based on Bird Atlas distributions) are also applied to observations of Golden Plover to exclude birds outside of suitable breeding areas (see p4 for further details).
As for reports since 2021, we use the standard methods and omit all data from 2001 and 2020 to prevent the coverage biases in those years from affecting the trends we produce (see the 2021 BBS Report). Although we omit the underlying data, we can estimate trend values for 2001 and 2020 by interpolating the smoothed trend line over the remaining years.
Pages 18—31 contain the annual bird and mammal population trend statistics for BBS, and pages 34—35 cover WBBS results. Some guidance on reading and interpreting these tables and graphs is provided below.
To ensure robust results, we produce trends only for species with sufficient data. To judge this, we look at the average number of squares on which a species has been recorded per year during the trend period. For UK BBS trends, we consider species above a reporting threshold of 40 squares. For countries within the UK, English Regions and UK WBBS trends, the threshold is an average of 30 squares during the trend period. The one-year change for 2023–24 is shown where the sample size reaches the reporting threshold for one of the longer trend periods. Therefore, if there is a 10-year or ‘all-time’ (28-year) trend, a one-year change is presented.
‘Add-on’ squares surveyed during the lifetime of the BBS, using BBS methodologies, have been included in these trends. These include Upland BBS, Upland Adjacent and Scottish Woodland squares. Upland BBS and Scottish Woodland squares were originally surveyed by professional fieldworkers: Scottish Woodland squares are now surveyed by volunteers. Upland Adjacent squares are also covered by volunteers during visits to survey their core BBS square: these were introduced as an option to increase coverage in remote upland areas.
TRENDS AND TABLES EXPLAINED
• Trends for species in brackets are reported with caveats (explanation on pages 16 , 31 and 34).
• For bird trends, Red-listed and Amber-listed species from Birds of Conservation Concern 5 (BoCC5) are shown in the relevant colour. The exception to this is in the Wales Population trends, where the Birds of Conservation Concern 4 Wales (BoCC4 Wales) assessments are used.
• The sample size refers to the mean number of squares per year on which the species was recorded during BBS or WBBS. The figure shown in the tables, ‘Min. Sample’, is the smaller of these sample size figures for the 10-year and all-time trends, per species, per region.
• Trends are presented as the percentage change over three periods: one-year, 10-year and all-time.
• The short-term change covers the most recent years of the survey, i.e. for BBS and WBBS: 2023 to 2024.
• The long-term changes for both BBS and WBBS, cover the lifetime of the survey (BBS birds: 1994–2024, BBS mammals: 1995–2024, WBBS: 1998–2024). The 10-year trends cover 2013–23 for both surveys. All-time and 10-year periods have been smoothed, and the end years truncated.
• Trends with statistically significant changes are marked with an asterisk (*), where the 95% confidence limits of the change do not overlap zero.
• LCL and UCL are the lower and upper 95% confidence limits for the longest BBS bird trend: 1995–2023, BBS mammal trend: 1996–2023 and WBBS bird trend 1999–2023. Any confidence limit greater than 10,000 is displayed as ‘inf’.
All BBS and WBBS graphs are displayed in the same way throughout the report. Beware, however, that the index and time period axes do vary in scale.
Single region BBS and WBBS index graphs show:
• smoothed trend – dark line
• confidence interval (85%) – pale shading
• annual index values – dots
In addition to these, we produce plots of multiple countries or regions for the same species on the same graph. This is used to illustrate where trends differ among geographical areas, either in their direction, or in the timing of particular changes. Care should be taken interpreting these; higher or lower indices for one region compared to another do not necessarily mean higher or lower abundance or prevalence.
In the example below, House Sparrow have – until recently – been increasing in Scotland and are decreasing in England. However, occupancy (number of squares observed as a percentage of the number surveyed) is still higher in England (59%) compared with Scotland (34%). For comparisons of countries and some regions, occupancy rates from 2024 are presented in the figure legend for reference. For clarity, annual index values are not shown in multi-region plots.

BBS BIRD TREND GRAPHS ONLINE: www.bto.org/bbs-graphs
BBS BIRD TREND TABLES ONLINE: www.bto.org/bbs-tables
BBS MAMMAL TRENDS ONLINE: www.bto.org/bbs-mammals
WBBS RESULTS ONLINE: www.bto.org/wbbs-results
This report and online tables document the population trends of 119 UK species, and are calculated from BBS squares in England, Scotland, Wales, Northern Ireland, the Channel Islands and the Isle of Man. The non-native Egyptian Goose reaches the UK reporting threshold of an all-time average of 40 squares, whereas Firecrest now has a 10-year trend.

Figure 9: The number of birds with significant long-term declines and increases by BoCC5 assessment status (NA=Not assessed).
The declines of farmland species are regularly reported in the BBS report and this year is no exception. Species in this assemblage have experienced some of the largest declines of any UK species dating back to the 1960s when monitored by the CBC. Several farmland species have significant 28and 10-year declines, but have either experienced little change in the last five years (e.g., Grey Partridge) or have even increased (Skylark).
However, Yellow Wagtail and Yellowhammer have shown a relatively steep and worrying decline over the last five years, with 2024 being the third consecutive drop in the annual index. For Yellow Wagtail, this comes after a period of relative stability in the 2010s, following a steep decline starting in the 1970s. In the case of Yellowhammer, this is the latest episode in a long decline dating back to at least the 1960s. Whereas Yellow Wagtail is a migratory species seen mostly in
England, Yellowhammer is a resident in all parts of the UK. As reported last year, it has dropped below the normal threshold for reporting in Wales –evidence of steep decline there – and it is also now in decline in Scotland as well as England. This follows on from a period of population growth in Scotland between 2002 and 2012.
Following decades of decline in the UK and in Europe, another farmland bird – Turtle Dove – is showing signs of recovery along the Western European Flyway as a result of hunting moratoria (Carboneras, et al. 2024). There appears to be no signs of recovery in the UK, at least not yet.


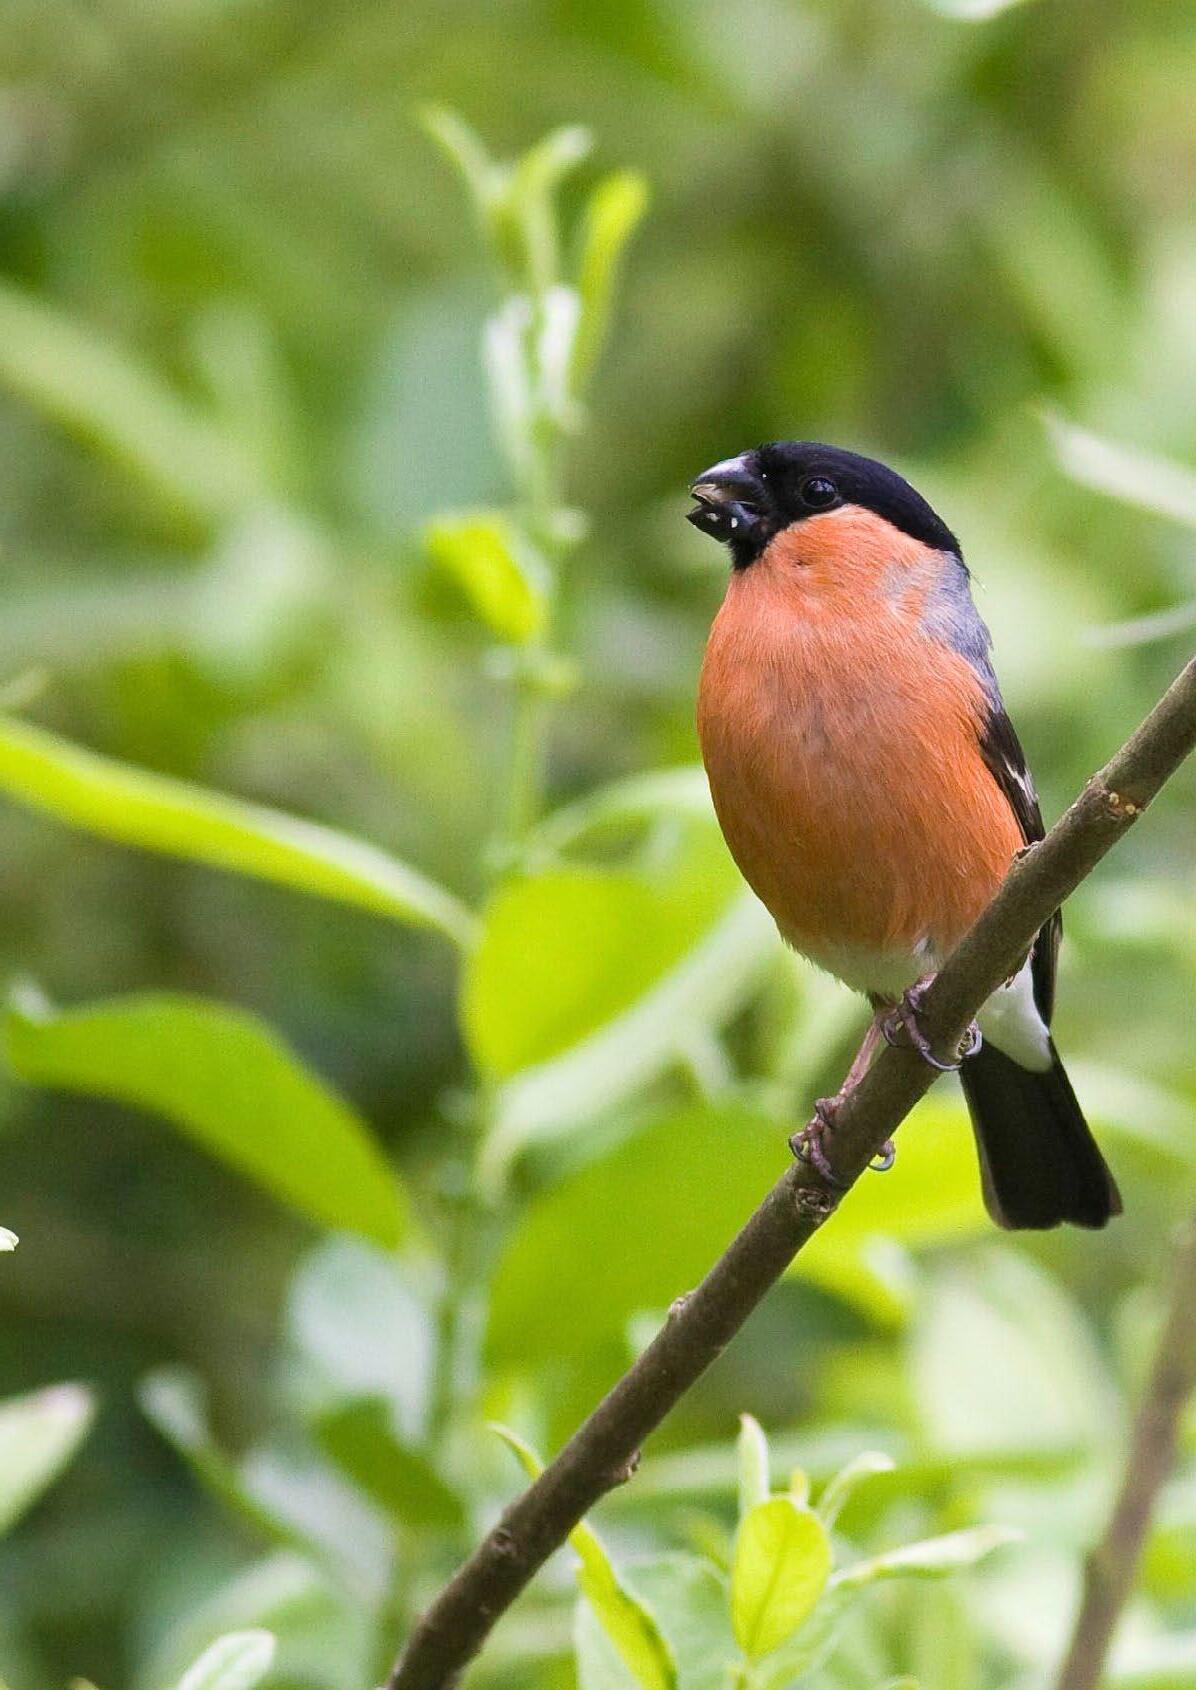
Figure 10: Bullfinch have experienced a decline of nearly 40% in the last five years in England.
There is a mixed picture for the UK’s finches. Chaffinch declines have been reported in these pages previously in the context of the epidemic of Trichomonosis that had first hit Greenfinch and then Chaffinch (2019 BBS Report), the five-year decline 2013–18 being reported at 24%. Chaffinch numbers have continued to decrease since then, with the latest five-year decline reported at 20%. Meanwhile, this report is the first where there has not been a five-year decline for Greenfinch since 2017, when five- and 10-year trends were first reported.
Another finch in decline is Bullfinch; the overall UK trend 1995–2023 shows a decline of 15%. The population has fluctuated over that time, with the last five years showing a decline of nearly a quarter following a period of increase between 2000 and 2015. In England, the decline is even more obvious, with Bullfinch down by nearly 40% since 2018 and 2024 seeing the fourth successive drop in the unsmoothed annual index. Meanwhile, in Scotland, Bullfinch are faring rather better, with numbers having increased by 46% since the start of BBS (Figure 10).
The population trends for 116 species are reported for England. Whilst several species are in decline in England, many — particular woodland birds — are increasing farther north in Britain.
(23—24)
Two new all-time trends for species in England are published in this report for Golden Plover and Marsh Harrier . They arise for very different reasons. Golden Plover is afforded an all-time trend in England due to a change in analytical methods (see p4). The change in spatial filtering rules means that many important breeding areas – including the North York Moors and Pennines – are now included in calculating population trends and boost sample sizes. The new trends reveal a significant decline of Golden Plover in England over the last 10 years. Previously, there had been more uncertainty around these estimates.
Meanwhile, Marsh Harrier can rightly be considered one of the UK’s recent conservation success stories. Down to just a single pair in 1971 (RBBP, 2023), the species has increased to such an extent that it is now seen on 47 English squares per year. Since the start of BBS, numbers have trebled across England, with the majority of that increase seen between 1994 and 2015. Like Bittern , which is detected rarely on BBS, Marsh Harrier has benefitted from the creation, expansion and restoration of reedbeds and can be seen foraging over adjacent farmland.
Bullfinch and Chaffinch (see ‘UK Population Trends’, p18) are two species on the UK and England Woodland Indicators. As well as the long-term declines of farmland species, the most recent set of indicators again highlighted
a shorter-term (five-year) decline in woodland birds. As ever, the picture is not uniform – some woodland species are doing well, like Blackcap and Chiffchaff, but others, like Bullfinch and Chaffinch are in decline. Many of the woodland species in decline include specialists like Spotted Flycatcher, Pied Flycatcher, Wood Warbler, Willow Tit, Marsh Tit and Tree Pipit. Several of these are longdistance migrants. Even then, some generalists, including the almost ubiquitous Dunnock are showing more recent declines, down by 12% in the last five years (Figure 11).

Figure 11: Dunnock, one of our most familiar generalist species is experiencing a decline in England.

Nightingale, another woodland edge/ scrub species, has declined by 90% since 1967, as reported by combined CBC and BBS trends. A new study has shown that the UK and continental populations –the latter being relatively stable – have two separate wintering areas, with UK birds wintering in a very restricted area of West Africa centred on the Gambia. Continental breeders, meanwhile, winter in a much larger area of West Africa (Kirkland et al. 2025).
The non-breeding area used by UK Nightingale, as well as being smaller, was also found to be of lower habitat suitability compared to the areas used by continental populations. Together, this makes UK Nightingales much more vulnerable. This builds on previous work which had identified that Nightingale declines were also linked to breeding season habitat changes (e.g., Holt et al. 2010). Whilst the small recent upturn in Nightingale in England – up by 32% in the last five years – might indicate that local conservation efforts are being effective, conditions in the non-breeding grounds are clearly a major factor influencing population trends.
Eaton, M.A. & The RBBP 2023. Rare Breeding Birds in the UK in 2021. British Birds 116: 609—684.
Holt, C.A. et al 2010. Experimental evidence that deer browsing reduces habitat suitability for breeding Common Nightingales Luscinia megarhynchos. Ibis 152: 335—346. doi.org/10.1111/j.1474-919X.2010.01012.x
Kirkland, M. et al. 2025. Extreme migratory connectivity and apparent mirroring of non-breeding grounds conditions in a severely declining breeding population of an Afro-Palearctic migratory bird. Scientific Reports 15:330. doi.org/10.1038/s41598-025-86484-z
2013—23 and 1995—2023.
There are four new species trends for Scotland published in this report. Five-year trends are now available online for Nuthatch and Grey Partridge, with Canada Goose and Red Kite graduating to ten-year trends. This takes the total number of species monitored by BBS in Scotland to 77.
The latest Scottish Terrestrial Wild Bird Indicators, published in February, show that the Scottish Upland Indicator has declined the most since 1994, with an overall decline of 20%. The Scottish indicators are based largely – as is the case for UK and English indicators –on BBS data. The production of the upland indicator is especially reliant on the Upland Rover scheme and we extend our thanks to those trekking great heights and/or long distances, often without seeing many birds.
One species that will be familiar to almost all Upland Rover volunteers is the Meadow Pipit. Whilst the population has fluctuated considerably over time, Meadow Pipit has been in decline for many years in parts of its UK range, particularly in England where it has declined by 24% since 1995. This decline seems to be driven by losses in lowland areas; in upland areas of England, there has been relatively little change (Figure 12). In Scotland, there has been a 14% decline overall since 1994, with a significant decline of 32% between 1994 and 2010.
One of the species for which Upland Rovers has made a positive impact on our ability to produce population trends is Whinchat, which we reported last year as having a new 10-year trend for Scotland. RSPB-led research, published in 2021 and 2023 revealed that Whinchat declines were greatest in areas near woodland, but least severe in unenclosed grassland habitats which are common in upland areas. Another study, whilst conducted many miles away on Dartmoor in south-west England, also shows that
Whinchat territory persistence was more likely to occur in steeper sided valleys with more Bracken (especially with heathland vegetation), areas with fewer trees and away from enclosed, intensively managed grasslands. (Hawkes, et al. 2024).
Wheatear, another species of chat familiar to many in upland areas, has also declined across the UK, including in Scotland where it is down by 31% over the period 1995–2023 (Figure 13).
Waders were a major focus of the results reported in the 2021 BBS report. The UK’s uplands, especially in Scotland, support many of the UK’s breeding waders. Some species use sites in both upland and lowland settings, whereas others like Golden Plover are almost entirely reliant on upland sites for nesting. The declines of Curlew have been reported in both the popular and scientific press. In England, there are signs that Curlew are stable in some northern

regions (see p28, English Regions). In Scotland, there is a decline of 62%, compared with 32% overall in England. In Wales, the situation is worse, where a decline of threequarters has been seen since 1995. Other waders in England and Scotland are struggling too, with Lapwing having declined by 43% in England and 62% in Scotland.
Meanwhile, the Oystercatcher increase in England continues, up by 61% in the last 28 years, compared with a 38% decline in Scotland. No overall change in numbers have been detected for Snipe since 1995 in either England or Scotland.

Wheatear abundance has fluctuated over the course of BBS, with the last peak around 2010. It has declined since, with most of this concentrated between 2010 and 2018.
Hawkes, R.W. et al. 2024. Environmental correlates of Whinchat Saxicola rubetra breeding territory retention in a declining upland population. Bird Study 71: 241—255. doi.org/10.1080/00063657.2024.2375383

Figure 12: Meadow Pipit habitat specific trends in Scotland (left) and England (right) in its three most associated habitats:
GHU = Upland grass- or heathland; GHL = Lowland grassor heathland; PAS = Pastoral habitat. Uplands are defined as those higher than 300 m above sea-level.
Habitat specific trends are calculated using the method of Sullivan et al. (2015).

Figure 13: Like Meadow Pipit, Wheatear has experienced fluctuations in populations, but the overall trend since 1994 is one of decline.
Trends for 60 species in Wales are reported and displayed in these pages. There is a mixed picture for birds of prey in Wales, whereas House Sparrow, beleaguered across much of the UK, is on the up.
(95—23)
Long-term (95—23) decreases 15
Short-term (23—24) increases 3 Chiffchaff 19%
Short-term (23—24) decreases 4 Red Kite
* Species are colour coded by the BoCC4 Wales assessment.
The picture for birds of prey in Wales is a mixed one. Red Kite, the national bird of Wales, has increased in the last 10 years on the back of a six-fold increase since the beginning of BBS. That these increases sound so impressive is due to the their starting from a low base following years of persecution, with Wales being a refuge. But, it also showed the largest one-year decrease in Wales between 2023 and 2024.
A UK wide study – led by RSPB – has shown that the overall predicted impact of the growth of on-shore renewable energy isn’t likely to lead to significant changes in habitat available for birds (Copping et al. 2024). Nevertheless, at an individual site level, species like Red Kite are sensitive to the impacts of on-shore wind development. Using BBS data, along with Bird Atlas and APEP data, a joint study between BTO Cymru and BSG Ecology modelled the potential impacts of current and proposed wind developments on Welsh Red Kite populations (Hereward et al. 2024a). The results suggest that the current growth of the Red Kite population in Wales is unlikely to be affected, though more caution is likely to be needed when considering developments close to SPAs – see p12.
Meanwhile, Buzzard, the second bird of prey for which Welsh population trends are published, has declined by 17% in the last 10 years. Buzzard is in decline in other parts of the UK too; the species has been in decline in Scotland since 2002, whereas in England we report the first five-year decline – a modest 6% since 2018 –this following a more than three-fold increase between 1995 and 2018. Whether this change in England is the start of a natural plateauing, or instead a signal of the effects of High Pathogenicity Avian Influenza (HPAI) remains to be seen. Irrespective, it is clear that long-term schemes like BBS, WeBS and SMP will form an important tool to monitor the effects of HPAI for many species.
Kestrel and Sparrowhawk are not observed on a sufficient number of BBS squares to have Wales-specific trends. To bridge the gap in some of our knowledge of Wales’ raptors, in particular aspects of their breeding success and productivity, 2024 saw the launch of Cudyll Cymru, the Welsh Raptor Monitoring Scheme, which uses a ‘patch based’ approach. The target species are Buzzard, Kestrel, Raven, Red Kite and Sparrowhawk. Volunteers will have a range of

monitoring options to choose from, depending on their experience level and/or time commitments. These range from vantage point counts to nestrecording and ringing. To find out more, visit: www.bto.org/cudyll-cymru

House Sparrow has nearly doubled in Wales since 1995, faring much better than other parts of the UK, particularly in England where populations have declined by a quarter in the last 28 years (Figure 14) and by 71% between 1977 and 2022. Much of this decline occurred between 1980 and 1995 and is measured by CBC. It is unknown why the Welsh population of House Sparrow is doing so well, but it is certainly a cause for hope and reflects its Amber-listed status in Wales, compared with the overall UK Red-list status.
The results of the All Wales Rook Survey were published in 2024 (Hereward et al.2024b), with the previous survey being in 1996. Since that time, Rooks have declined in abundance (the new estimate is of 44,127 pairs) and in occupancy, being lost from an estimated 5.6% of tetrads since 1996. The number of nests per rookery also declined by 20%, with much regional variation. However, 2024 sees the third successive annual increase in the unsmoothed BBS index from a low in 2021.

Figure 14: House Sparrow in Wales has doubled in number over the period 1995—2023, compared with England where the species has suffered declines going back to at least the 1970s.


Figure 15: Great Spotted Woodpecker has more than trebled in Wales since 1995. There has also been a substantial increase in Scotland. Meanwhile, following a more than four-fold increase in England between 1965 and 2010, there has been a 10% decline since 2013.
Copping, J.P. et al. 2024. Ambitious onshore renewable energy deployment does not exacerbate future UK landuse challenges. Cell Reports Sustainability 1 : 100122. doi.org/10.1016/j.crsus.2024.100122
Hereward, H.F.R. et al. 2024a. Modelling population-level impacts of wind farm collision risk on Welsh Red Kites BTO Research Report 766. BTO, Thetford, UK
Hereward, H.F.R. et al. 2024b. Status and distribution of Rook Corvus frugilegus in Wales 2022/23. Milvus: the Journal of the Welsh Ornithological Society 4: 32—50.
Table 5 : Trends in Wales during 2023—24,
We report trends on 39 species for Northern Ireland. In addition to the 38 species from previous years, a five-year trend is reported for the first time for Raven. A 10-year trend is also added for Feral Pigeon.
A five-year trend is now published for Raven in Northern Ireland, meaning that this species has a published trend in all parts of the UK. Raven is returning to many parts of its former range following centuries of persecution. In Northern Ireland, the new five year trend shows a 43% increase since 2018, most likely continuing on from gains throughout the 1990s. Raven has also shown a moderate increase in the Republic of Ireland, where it is monitored by the Countryside Bird Survey. Here too, there has been a recent increase since around 2015. Across the entire island of Ireland, Raven have increased their breeding range, with changes between the 1988–91 and 2007–11 Atlases being seen particularly in the lower lying centre of the island, following earlier recolonisation of more upland areas.
Raven are also monitored by the Northern Ireland Raptor Study Group.
Several species monitored in Northern Ireland have trends that differ from populations in Great Britain. Blackbird, having been relatively stable for the period 2000 to 2020, has undergone an increase of nearly a third in the last five years in Northern Ireland. Meanwhile, Blackbird has declined in England and the UK overall in the last decade, whilst continuing to do well in Wales.
Woodpigeon has seen a steady increase in the country since the start of BBS, compared with England, where an increase of 45% during 1995–2010 has been followed by a very slight decline of 3% in 2013–23. Finally, Meadow Pipit – in decline in England and Wales – shows no overall
change in Northern Ireland, although all UK populations show large fluctuations, with the period 2003–10 seeing a drastic drop across all parts of the UK, followed by partial recovery.
Several other species are doing well, in Northern Ireland with Blackcap numbers continuing to soar and Skylark increasing by 63% in the last 10 years. Blackcaps are on the increase in all parts of the UK, and there is evidence that the long-term Skylark declines in the UK are also being reversed (p19).
Woodpigeon in Northern Ireland has shown the greatest relative increase of any UK country.

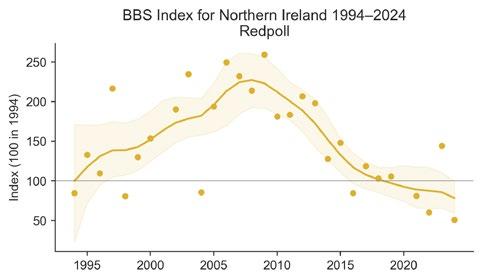
Figure 16: The 65% decline of Redpoll from 2023—24 follows a similarly large increase (161%) from 2022— 23. Lesser Redpoll, now a subspecies under Redpoll, increased rapidly in both the Republic of Ireland and Northern Ireland from the mid 1990s to 2010, but have since declined in Northern Ireland by 50%.

Figure 17: Northern Ireland has seen the greatest relative increase in Woodpigeon numbers of any UK country since 1994.
Eight squares were surveyed in 2024 by seven different volunteers, maintaining the consistent coverage of the last six years.
There were a number of ‘BBS firsts’ for the Isle of Man in 2024, with Redshank , Dunlin , Sandwich Tern and Common Gull all seen for the first time on a BBS survey in the Isle of Man. It was also the year in which the highest number of Cormorants were seen during an Isle of Man BBS (82) as well as Woodpigeon (52), Robin (58), Wheatear (8) and House Sparrow (36). Greenfinch was not recorded on a BBS survey for the first time since 2020.
Much as Great Spotted Woodpecker has increased across Wales and Scotland (p25, Figure 15), so too has this species’ westward spread been seen at a smaller scale on the Isle of Man. 2024 was the third consecutive year that this species was seen on a BBS square, having never previously been recorded during the survey. The same is true in Northern Ireland; only since 2016 has it been reported via BBS.
Twenty-two squares were surveyed on the Channel Islands in 2024, the best coverage since 2017, with a welcome boost in Alderney, courtesy of Alderney Wildlife Trust. These squares, along with those in the Isle of Man, contribute to the UK population trends.
Whilst Firecrest occupancy on Guernsey and Jersey on BBS squares has been increasing in the last five years, 2024 was the first year since 1996 that no Goldcrests were reported on the Channel Islands during a BBS survey visit.
A Black Kite was recorded for the second time in BBS, with a single bird seen during an early visit on Guernsey. It was also the fourth consecutive year of Nightjar being recorded on the island of Jersey. All records come from a single square in the south of the island.
Seventy-eight species were recorded across Jersey, Guernsey and Alderney in 2024 by 15 volunteers, bringing the total number of species recorded over 31 years of BBS to 147.
Based on simple occupancy rates since 2006, when BBS coverage has been consistently over 15 squares, a number of species appear to be increasing, including Buzzard and Goldfinch, whereas Swallow and House Martin –as in England – appear to be decreasing.

2024 was the fifth consecutive year that a Buzzard was recorded during BBS on the Isle of Man. Prior to 2020, it had never been recorded before on a BBS visit.
New trends over the three different time periods continue to be made available for English Regions. One such species is Corn Bunting with an increasing all-time trend of 184% in southwest England.
The Curlew declines seen in many parts of the UK (see p22) are not uniform. Between the three countries of Great Britain, there is variation in this change, with England seeing the smallest change and the only country where Curlew has been relatively stable in the last decade.
However, even within England, and in particular in the north – which supports the bulk of the English population –there is variation between BBS regions. In North West and North East there have been significant declines (48% and 32% long-term declines respectively), though with some signs of stabilisation in the last decade, whereas in the region covering Yorkshire & Humberside, (hereafter ‘Yorkshire’) Curlew numbers have not changed (Figure 18a).
Yorkshire contains both the North York Moors and Yorkshire Dales national parks, where there is an abundance of moorland habitat managed as grouse moors. Using BBS data, Franks et al. 2017 showed Curlews were more abundant in areas likely managed for Red Grouse (a correlation with higher Red Grouse numbers) and they declined less where crows were less numerous.
have varied in their habitat and management type. Whilst managing predation is important, other aspects, including intensification of agricultural breeding habitats and the location of woodland planting also play pivotal roles influencing Curlew productivity.
Curlew is currently the focus of much targeted conservation work across the UK. Many local partnerships in England are part of the larger Curlew Recovery Partnerships England (CRP), of which BTO and RSPB are members of the steering group.


Figure 18: Curlew (a) remains stable in Yorkshire but has declined in other regions in the north of England. Following nearly 10 years of increase in Yorkshire, Lapwing (b) have since declined here as well.
Baines, D. et al. 2023. Lethal predator control on UK moorland is associated with high breeding success of curlew, a globally near-threatened wader. Eur. Journal of Wildlife Research 69: doi.org/10.1007/s10344-022-01631-5
A more recent study comparing Curlew breeding success on moorland managed for grouse with paired non-grouse moorland sites found that productivity was four times higher on grouse moors. Active predator control, particularly of corvids and Red Fox, which is practiced on grouse moors was identified as the main factor driving this difference. The study also showed a similar difference in Lapwing productivity. However, Lapwing do not show the same regional-level population differences as Curlew, with evidence of 20-year declines in all three regions (Figure 18b).
Whether the relative stability of Curlew seen in the Yorkshire region is as a result of this type of management would need further work, including establishing how BBS squares from which these trends are produced
Franks, S.E. et al. 2017. Environmental correlates of breeding abundance and population change of Eurasian Curlew Numenius arquata in Britain. Bird Study 64: 393–409 doi.org/10.1080/00063657.2017.1359233
Table 7: Coverage and trends in each English Region

BBS mammal data are used to produce population trends for nine mammal species for the UK as a whole, its constituent countries and English regions.
Recording mammals is an optional part of BBS. Here, we present the population trends of nine species of mammal as well as ponder what we might be able to document in the future.
In recognition of the damage caused by trampling and browsing by deer, especially in woodlands, NatureScot has launched two pilot schemes to support deer management. The schemes, first opened in August 2024, aim to support the additional culling of deer in Scotland, an activity that is largely undertaken by private landowners and individuals out of their own pocket.
Both R ed Deer and Roe Deer have increased substantially across the UK, both having more than doubled in number since BBS surveyors started recording mammals in 1995. In Scotland, the long-term trends for Roe Deer and Red Deer are 77% and 52% increases respectively, though in the case of Red Deer, there has been relatively little change in the last 10 years (Figure 19). The incentive schemes are available in specific areas of Scotland’s central belt and the Highlands. In both of
NatureScot 2024. Deer cull incentive schemes launch to help tackle nature and climate crisis.
www.nature.scot/deer-cullincentive-schemes
[accessed 14/11/2024]
these areas, the growing numbers of deer (Red Deer and Roe Deer as highlighted here, but also Sika Deer ), are considered problematic. Whilst Sika Deer may be some way from having a UK BBS trend reported, being seen on 22 squares in 2024, Chinese Water Deer was recorded on 35 UK squares in 2024, a record for this species. A five-year trend is not far around the corner.
Whilst all deer species in the UK –native or otherwise – are relatively common and widespread, not all mammal species that could be described as such are regularly seen on BBS squares. Common (Harbour) Seals and Grey Seals are typically only seen on coastal stretches, though this is not universally the case – a Grey Seal was observed as far inland as Earith, Cambridgeshire in 2022. Seals do make their way upstream into river systems and are seen periodically in the River Great Ouse some 56 km from The Wash. That it was seen during a BBS survey was all the more surprising!
Table 9: All mammal species recorded in 2024.
‘Squares recorded’ include counts of live mammals, field signs, dead mammals and local knowledge.


Figure 19: Red Deer (a) and Roe Deer (b) population indices in Scotland 1995—2024.

Table 15: Mammal trends in English regions
Table 10: Mammal trends in UK.
Table 11: Mammal trends in England.
Table 12: Mammal trends in Scotland
Table 13: Mammal trends in Wales.
Table 14: Mammal trends in Northern Ireland.
NOTE: Trends are displayed in the same way as they are for the birds. Page 17 covers interpreting trends. Trends for Red and Fallow Deer are reported with caveats. These are herding species and trends should be interpreted with caution, the presence or absence of a herd on a given BBS visit could influence the overall trend.
Brighton, C.H., Massimino, D., Boersch-Supan, P., Barnes, A.E., Martay, B., Bowler, D.E., Hoskins, H.M.J. & Pearce-Higgins, J.W. 2024. Protected areas in good condition have a positive effect on bird population trends. Biological Conservation 292: 110553. doi.org/10.1016/j.biocon.2024.110553
Burns, F., Groom, A., Hawkes, R., Peach, W. & Gregory, R.D. 2024. Analysis of the effectiveness of Agri-environment schemes on farmland bird species abundance. RSPB Research Report 78. RSPB Centre for Conservation Science, RSPB, The Lodge, Sandy, Bedfordshire ISBN: 978-1-905601-74-5
Copping, J.P., Field, R.H., Bradbury, R.B., Wright, L.J. & Finch, T. 2024. Ambitious onshore renewable energy deployment does not exacerbate future UK land-use challenges. Cell Reports Sustainability 1 : 100122. doi.org/10.1016/j.crsus.2024.100122
Evans, L.C.E., Burgess, M.D., Potts, S.G., Kunin, W.E. & Oliver, T.H. 2024. Population links between an insectivorous bird and moth abundance disentangled through national-scale monitoring data. Ecology Letters. 27: e14362 doi.org/10.1111/ele.14362
Hereward, H.F.R., Brenchley, A., Facey, R.J., Hughes, J., Lindley, P.J., Taylor, R.C., Wilson, M.W. & Macgregor, C.J. 2024. Status and distribution of Rook Corvus frugilegus in Wales 2022/23. Milvus: the Journal of the Welsh Ornithological Society 4: 32—50.
Hereward, H.F.R., Macgregor, C.J., Gabb, O., Connell, A., Thomas, R.J., Cross A.V. & Taylor, R.C. 2024. Modelling population-level impacts of wind farm collision risk on Welsh Red Kites. BTO Research Report 766 . BTO, Thetford, UK.
Massimino, D., Baillie, S.R., Balmer, D.E., Bashford, R.I., Gregory, R.D., Harris, S.J., Heywood, J.J.N., Kelly, L.A., Noble, D.G., PearceHiggins, J.W., Raven, M.J., Risely, K., Woodcock, P., Wotton, S.R. & Gillings, S. 2024. The Breeding Bird Survey of the United Kingdom. Global Ecology and Biogeography 34: e13943 doi.org/10.1111/geb.13943
Pigot, A.L., Dee, L., Richardson, A.J., Cooper, D., Eisenhauer, N., Gregory, R.D., Lewis, S., Macgregor, C.J., Massimino, D., Maynard, D., Phillips, H.R.P., Rillo, M., Loreau, M. & Haegeman, B. 2025. Macroecological rules predict how biomass scales with species richness in nature. Science. 87: 1272 1276 doi: 10.1126/science.adq3278
Tirozzi, P., Massimino, D. & Bani, L. 2024. Avian responses to climate extremes: insights into abundance curves and species sensitivity using the UK Breeding Bird Survey. Oecologia 204: 241—255 doi.org/10.1007/s00442-023-05504-9
BTO 2024. BirdTrends 2023: trends in numbers, breeding success and survival for UK breeding birds. www.bto.org/birdtrends
Defra 2024. Wild bird populations in the UK and England, 1970 to 20223. Available at: www.gov.uk/government/statistics/wild-bird-populations-in-the-uk
Johnstone, I.G., Hughes, J., Balmer, D.E . et al. 2022. Birds of Conservation Concern Wales 4: the population status of birds in Wales . Milvus: the Journal of the Welsh Ornithological Society 2 : 1—34. Available at: tinyurl.com/BoCCW4
NatureScot 2025. Official Statistics — Scottish Terrestrial Breeding Birds 1994 — 2023. Available at: www.nature.scot/doc/official-statistics-scottish-terrestrial-breeding-birds-1994-2023
PECBMS 2024. Trends of wild birds in Europe, 2024 update Pan-European Common Bird Monitoring Scheme pecbms.info/trends-of-wild-birds-in-europe-2024-update
Stanbury, A., Eaton, M., Aebischer, N., Balmer, D., Brown, A., Douse, A., Lindley, P., McCulloch, N., Noble, D. & Win I. 2021. The status of our bird populations: the fifth Birds of Conservation Concern in the United Kingdom, Channel Islands and Isle of Man and second IUCN Red List assessment of extinction risk for Great Britain. British Birds 114: 723—747. britishbirds.co.uk/content/status-our-bird-populations
Sullivan, M.J.P., Newson, S.E. & Pearce-Higgins, J.W. 2015. Using habitat-specific population trends to evaluate the consistency of the effect of species traits on bird population change. Biological Conservation 192: 343—353. doi.org/10.1016/j.biocon.2015.10.009

The Waterways Breeding Bird Survey forms part of the BTO/JNCC/RSPB Breeding Bird Survey partnership agreement and uses BBS-style transects along waterways — targeting the population monitoring of waterway specialists.
James Heywood, BBS National Organiser, BTO
We report on coverage and sightings for WBBS for 2024, and overleaf provide an update on the ongoing development of the survey.
Coverage across the UK received a small but welcome boost in 2024 (Table 16), thanks to a renewal of activity in Scotland. Over the course of the year, 1,753 different 500-m transect sections were covered on WBBS (Figure 20), amounting to 1,660 km walked along watercourses by WBBS volunteers. That amounts to over four and half times the length of the river Severn, the UK’s longest river.
A total of 167 species were recorded on WBBS transects during the year. A single Fulmar was seen on a stretch in North Yorkshire and a Turnstone in Caithness,
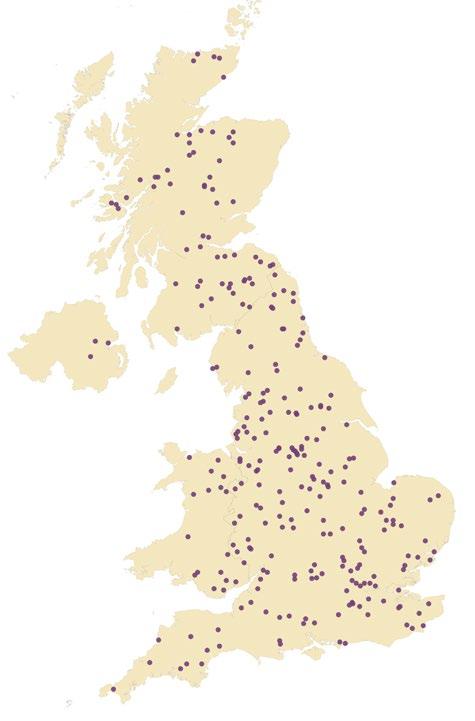
both on the handful of stretches that extends all the way to the coast. Further inland, there were single records of Hen Harrier in the north of Scotland and Goshawk in Shropshire.
Table 16: The number of WBBS stretches with data received to date and the total number of volunteers participating, by year.
The WBBS continues to produce population trends for 28 species associated with waterways where the reporting threshold of being recorded on an average of 30 stretches or more since the survey began in 1998 is met. Gadwall is the latest to have a 10-year trend.
The all-time, 10-year and oneyear trends are displayed here and online. Further five-year trends are published online at www.bto.org/ wbbs-results . Of the 28 waterway specialists for which trends were possible, four species (reported in brackets) carry a caveat, explained on page 17
Whilst WBBS reports on the population trends of species associated with waterways, only a few of these can be said to be truly waterway specialists. Dipper is one of these species and – like so many of the species listed in Table 17 – is in decline (Figure 21).
On the basis of UK WBBS transect data, Dipper have declined by 32% in the period 1998–2023. Of particular concern is a 31% decline in the last year alone. The trend for Dipper on BBS transects is down by 53% in the period 1995–2023. Across both BBS and WBBS, the pattern remains the same – following decline throughout the 1990s and 2000s, there was a sign of increase up until 2015, following which the decline has continued.
There has been a general trend towards earlier breeding in Dipper (Crick & Sparks 1999), possibly as a result of climate change. Breeding performance has increased over time. Meanwhile, findings from a long-term study in Norway –where Dipper is the national bird
– have identified that population fluctuations have been associated with winter temperature; frozen conditions lead to reduced foraging opportunities (Nilsson et al . 2011). High winter river discharges have also been linked to changes in phenology, with higher discharges in the winter preceding the breeding season leading to earlier breeding (Nilsson et al. 2020). In the UK, Royan et al. (2015), which used WBBS data, predicted that the occurrence of Dipper in Wales and Scotland would

Figure 21: WBBS derived UK population trend of Dipper.
decrease in response to climate change induced alteration in river flow, which in turn would impact habitat suitability. Are we seeing these changes already?

Crick, H.Q.P. & Sparks, T.H. 1999. Climate change related to egg-laying trends. Nature 399: 423—423. www.nature.com/articles/20839
Nilsson, A.L.K. et al. 2011. Climate effects on population fluctuations of the whitethroated dipper Cinclus cinclus Journal of Animal Ecology 80 : 235–243. doi.org/10.1111/j.1365-2656.2010.01755.x
Nilsson, A.L.K. et al. 2020. Hydrology influences breeding time in the whitethroated dipper. BMC Ecology 20: 70. doi.org/10.1186/s12898-020-00338-y
Royan, A. et al. 2015. Climate-induced changes in river flow regimes will alter future bird distributions . Ecosphere 6: 70. doi.org/10.1890/ES14-00245.1
WBBS volunteers, ROs and data users – including many of the Statutory Nature Conservation Bodies, the Environment Agency and others interested in freshwater conservation – were sent a questionnaire during the spring and summer of 2024 on their views on any potential development of WBBS. Out of 390 volunteers, 171 replied, along with 82 WBBS Regional Organisers and 60 stakeholders from 27 different organisations. As well as comparing WBBS trends with BBS trends calculated from sectors that run alongside the same type of habitats, BTO has undertaken a review of the responses of the questionnaires. A number of options or recommendations are already taking shape, including:
• An urgent need to develop a new site-selection method. Whilst some areas continue to struggle to achieve coverage, others are ‘full’.
• Potential changes to the protocol:
◦ Having more flexibility in skill level/species identification needs. Instead of recording all species, a two-tier system could be introduced, whereby volunteers can opt to record everything or just a set list of riparian species;
◦ Removing the need to record in distance bands;
◦ Allowing surveyors to survey non-contiguous sections of a watercourse;
◦ Adopting – at least for certain sites or regions – a ‘rover’ style approach that has proved so successful for BBS in the uplands; and
◦ Greater capacity to record information on habitat management and disturbance, which was very strongly favoured by all volunteers and stakeholders.
The next steps will be a wider workshop involving organisations with interests in freshwater conservation, where the needs of data users will also be addressed.
As is the case with the BBS (see back cover), the WBBS also relies on the dedication and enthusiasm of Regional Organisers who manage the survey locally. Without these volunteers, it would not be possible to manage such large surveys and we are in debt to them all.
The back cover shows a complete list of the ROs who manage the Breeding Bird Survey locally; many of these ROs also co-ordinate the WBBS. For the list of those WBBS Regional Organisers who focus solely on managing WBBS (and are therefore not listed on the back page), please see the table opposite. If you would like to find out more about becoming a Regional Organiser and what is involved, please email: wbbs@bto.org
Table 17: UK population trends during 2023 24, 2013 23 and 1999 2023.
INTERPRETING THE RESULTS: see page 17 RESULTS ONLINE: www.bto.org/wbbs-results

ENGLAND
Huntingdon & Peterborough VACANT
Staffordshire (North, South, West) VACANT
NORTHERN IRELAND
Antrim & Belfast, Armagh, Down, Londonderry and Tyrone
WALES
Michael Stinson
Montgomery VACANT
We currently have vacancies for WBBS Regional Organisers in Anglesey, Cambridgeshire, Carmarthen, Devon, Essex (North-West), Huntingdon & Peterborough, Lincolnshire (South), Merseyside, Montgomery, Radnorshire, Staffordshire (North, South & West), The Wirral and Yorkshire (Leeds & Wakefield, Richmond).
In addition to the ROs, we offer our sincere thanks to all the volunteers and landowners who enable these surveys to take place and have continued impact.

We would like to thank all surveyors and ROs for making the BBS the success it is today. Space does not permit all observers to be acknowledged individually, but we would especially like to thank the ROs for their efforts.
ENGLAND
Avon Dave Stoddard
Bedfordshire VACANT (now Phil Cannings)
Berkshire Sean Murphy
Birmingham & West Midlands
Steve Davies
Buckinghamshire Phil Tizzard (now VACANT)
Cambridgeshire VACANT
Cheshire (Mid) Paul Miller
Cheshire (North-East and South) Hugh Pulsford
Cleveland Michael Leakey
Cornwall Michael Williams
Cumbria Colin Gay
Derbyshire (North, South) Simon Roddis
Devon VACANT
Dorset Pete Cadogan
Durham David Sowerbutts
Essex (North-East) Rod Bleach
Essex (North-West) VACANT
Essex (South) VACANT (now Sean Murphy)
Gloucestershire Gordon Kirk
Hampshire George Batho
Herefordshire Chris Robinson
Hertfordshire Martin Ketcher
Huntingdon & Peterborough Mick Twinn
Isle of Wight Teresa Tearle
Isles of Scilly Will Wagstaff
Kent Bob Knight
Lancashire (East) VACANT
Lancashire (North-West, South) Mark & Heather Walsh
Leicestershire & Rutland Dave Wright
Lincolnshire (East) Phil Espin
Lincolnshire (North) Chris Gunn
Lincolnshire (South) VACANT
Lincolnshire (West) VACANT (now Howard Gannaway)
London (North) Ben Hillier
London (South) Richard Arnold
Manchester Nick Hilton
Merseyside VACANT
Norfolk (North-East) Chris Hudson
Norfolk (North-West) Jonathan Martin
Norfolk (South-East) Rachel Warren
Norfolk (South-West) Vince Matthews
Northamptonshire Barrie Galpin
Northumberland Muriel Cadwallender
Nottinghamshire VACANT (now Jo Whitley)
Oxfordshire (North) Frances Buckel
Oxfordshire (South) John Melling
Shropshire Jonathan Groom
Somerset Eve Tigwell
Staffordshire (North, South, West) Gerald Gittens
Suffolk Mick Wright
Surrey
Sussex
Penny Williams
Helen Crabtree
The Wirral Paul Miller
Warwickshire Annette Jarratt-Knock
Wiltshire (North, South) Polly Marino
Worcestershire Steve Davies
Yorkshire (Bradford) Mike Denton
Yorkshire (Central) Mike Brown
Yorkshire (East, Hull) Brian Walker
Yorkshire (Leeds & Wakefield) VACANT
Yorkshire (North-East) Nicholas Gibbons
Yorkshire (North-West) VACANT (now Richard Candeland)
Yorkshire (Richmond) VACANT
Yorkshire (South-East, South-West) Grant Bigg
Yorkshire (York) Rob Chapman
SCOTLAND
Aberdeen David Gregory
Angus Ron Lawie
Argyll (Mull, Coll, Tiree & Morven) Ewan Miles
Argyll (mainland & Gigha) & Bute Nigel Scriven
Arran James Cassels
Ayrshire Dave McGarvie
Benbecula & The Uists
Yvonne Benting (now VACANT)
Borders Neil Stratton
Caithness
Central
Donald Omand
Neil Bielby
Dumfries Andy Riches
Fife & Kinross Paul Blackburn
Inverness (East & Speyside, West) Hugh Insley
Islay, Jura & Colonsay
David Wood
Kincardine & Deeside Claire Marsden
Kirkcudbright Andrew Bielinski
Lanark, Renfrew & Dunbarton Gordon Brady
Lewis & Harris Emma Niederberger
Lothian Stephen Metcalfe
Melvin Morrison
Moray & Nairn
Orkney Joseph Gilman
Perthshire Mike Bell
Rhum, Eigg, Canna & Muck Bob Swann
Ross-shire
Shetland
Simon Cohen
VACANT
Skye Carol Hawley
Sutherland Bob Swann
Wigtown Andrew Bielinski
WALES
Anglesey Ian Hawkins
Brecknock Andrew King
Caernarfon Rhion Pritchard
Cardigan Naomi Davis
Carmarthen VACANT
Clwyd (East) Anne Brenchley
Clwyd (West) Mel ab Owain
Glamorgan (Mid, South) Daniel Jenkins-Jones
Glamorgan (West) Lyndon Jeffery
Gwent Richard Clarke
Merioneth
Dave Anning
Montgomery Margaret Town
Pembrokeshire
Haycock
Radnorshire VACANT
NORTHERN IRELAND
Antrim & Belfast
Mawhinney Armagh
McIlwain Fermanagh
Stinson
Fyffe
CHANNEL ISLANDS
Channel Islands (excl. Jersey) Chris Mourant
Jersey Tony Paintin
ISLE OF MAN
Isle of Man David Kennett
We would be grateful for help organising the BBS in regions currently without a Regional Organiser (marked VACANT). If you live in one of these regions and would be interested in taking on the role, please let us know.
Many thanks are due to the following ROs who retired during the past year, having supported the BBS in their regions: Yvonne Benting and Phil Tizzard.
We would like to thank and welcome Richard Candeland, Phil Cannings, Howard Gannaway and Jo Whitley, who have taken over as ROs during the past year.
Finally, we would like to thank all the landowners who kindly allow volunteers to walk BBS and WBBS transects on their land.

