


Welcome to Seabird Population Trends and Causes of Change: 1986–2023, the annual report of the Seabird Monitoring Programme. This report presents the latest seabird population trends in breeding abundance and productivity using data from the Seabird Monitoring Programme (SMP). We are grateful to everyone involved in the SMP, from the surveyors that monitor each breeding season, to those in the offices that coordinate the programme and to the organisations providing knowledge, experience and advice to steer the programme forward. Thank you.
Sarah Harris, SMP Organiser, BTO
SMP Governance and Partnership
The SMP is funded jointly by BTO and JNCC, in association with RSPB, with fieldwork conducted by both nonprofessional and professional surveyors. The programme is also supported by a wide network of organisations that form an Advisory Group and by the SMP Steering Group comprised of Helen Baker (JNCC), Dawn Balmer (BTO), Mark Bolton (RSPB), Niall Burton (BTO), Tim Dunn (JNCC) and Tom Evans (RSPB). Steering Group meetings are also attended by the Statutory Nature Conservation Bodies: Department of Agriculture, Environment and Rural Affairs, Northern Ireland (DAERA), Natural Resources Wales (NRW), Natural England (NE) and NatureScot.
Advisory Group members:
BirdWatch Ireland National Trust for Scotland British Trust for Ornithology Natural Resources Wales Department of Agriculture, Environment and Rural Affairs Natural England Department of Housing, Local Government and Heritage NatureScot Fair Isle Bird Observatory Trust
Royal Society for the Protection of Birds Highland Ringing Group
Isle of Man Government
Joint Nature Conservation Committee
Scottish Wildlife Trust
The Seabird Group
Shetland Oil Terminal Environmental Advisory Group Manx BirdLife States of Guernsey
Manx National Heritage
UK Centre for Ecology and Hydrology
Marine Directorate University of Gloucestershire
National Trust Wildlife Trust of South and West Wales
The SMP team
The team from BTO includes Sarah Harris, the SMP Organiser and first point of contact for SMP queries. Sarah is responsible for running the programme, liaising with professional and voluntary participants, maintaining the database, promoting the programme, and producing the annual report, newsletter and other outputs. Nina O’Hanlon, Senior Research Ecologist in the Wetland and Marine Research Team, is responsible for data analysis and annual trend production. Hala Haddad and Andrew Upton (previously Katherine Booth Jones), support the Seabird Network in Northern Ireland. Dawn Balmer, Head of Surveys, provides project management to the SMP, alongside other monitoring schemes. Niall Burton, Head of Wetland and Marine Research, and Liz Humphreys, Principal Ecologist –Seabirds, both in the Wetland and Marine Research Team, are responsible for strategic development of the programme and marine research at BTO. James Pearce-Higgins is the BTO Director of Science and therefore responsible for all survey and research work at BTO. In addition to those above, representatives from a total of 24 organisations form the SMP Advisory Group (listed above).


British Trust for Ornithology
www.bto.org
Joint Nature Conservation Committee www.jncc.gov.uk
Royal Society for the Protection of Birds
www.rspb.org.uk
This report documents changes in the abundance and productivity of breeding seabird species in Britain and Ireland from 1986 to 2023 and provides a detailed account of the 2021, 2022 and 2023 breeding seasons. This includes both inland and coastal populations and trends from the Channel Islands, England, Isle of Man, Northern Ireland, Scotland, Wales and the Republic of Ireland which are presented where sufficient data are available. The results from this report are used more broadly to assess the health of the wider environment, to inform policy and for conservation action.
Skua
54 Great Skua
58 Mediterranean Gull
60 Black-headed Gull
64 Common Gull
68 Lesser Black-backed Gull
74 Herring Gull
80 Great Black-backed Gull
84 Kittiwake
90 Sandwich Tern 94 Roseate Tern
98 Common Tern 104 Arctic Tern 110
Harris, S.J., Baker, H., Balmer, D.E., Bolton, M., Burton, N.H.K., Caulfield, E., Clarke, J.A.E., Dunn, T.E., Evans, T.J., Hereward, H.R.F., Humphreys, E.M., Money, S. and O'Hanlon, N.J. 2024. Seabird Population Trends and Causes of Change: 1986–2023, the annual report of the Seabird Monitoring Programme. BTO Research Report 771. British Trust for Ornithology, Thetford.
Published by the British Trust for Ornithology, the Joint Nature Conservation Committee and the Royal Society for the Protection of Birds, November 2024. © British Trust for Ornithology, Joint Nature Conservation Committee and Royal Society for the Protection of Birds, 2024.
BTO Research Report 771
ISSN 2976-8950 (online)
ISBN 978-1-912642-68-7
SMP email: smp@bto.org
SMP website: www.bto.org/smp
SMP Report: www.bto.org/smp-publications
SMPnews: www.bto.org/smp-news
Trends Explorer: https://data.bto.org/trends_explorer
X account: @smp_seabirds
Here we review the importance of the SMP for assessing the health of seabird populations in the UK and informing their conservation in a changing world.
By Sam Langlois, Research Ecologist, BTO
Seabirds are generally long-lived with low reproductive outputs, often taking several years to reach breeding age. This type of life history means that any changes in the breeding productivity of seabirds may not be immediately reflected in the size of their breeding populations (Croxall & Rothery 1991). Therefore, monitoring demographic parameters such as productivity, survival, and breeding abundance is key to assessing the health of seabird populations. The objective of the SMP is to gather breeding abundance and productivity data from all 25 seabird species that regularly breed in the UK ensuring that the data are representative at a national scale. These data are stored in a publicly accessible database that can be used for research, policymaking and management.
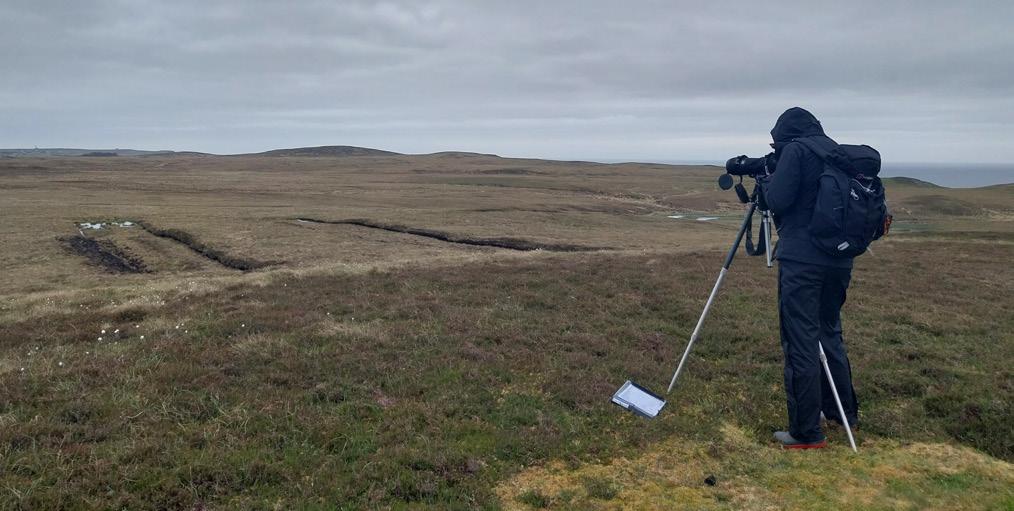
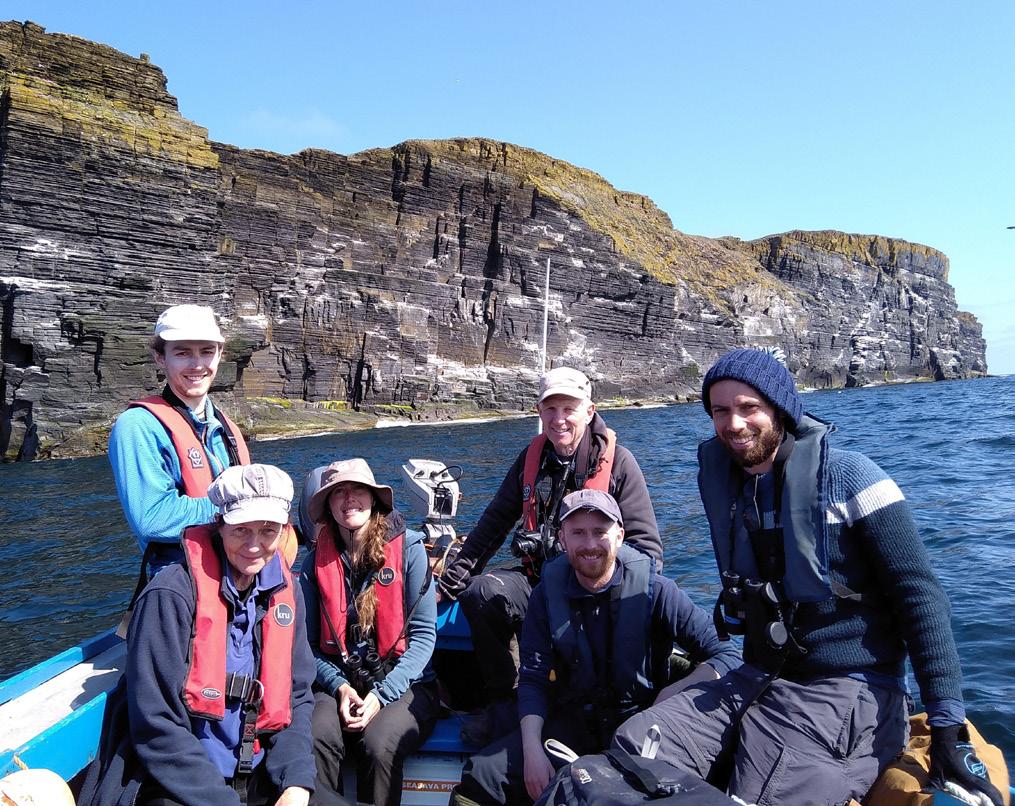
Every year, professionals and skilled non-professionals head out to seabird colonies throughout Britain and Ireland to collect two main types of data: Colony Counts (whole-colony or plot counts) and Breeding Success data. Colony Counts record the number of breeding adults present and Breeding Success is the number of chicks that fledge from the nests monitored (per pair). Both Colony Counts and Breeding Success can be recorded at the whole-colony scale, or by using plots. Monitoring using plots aims to produce a breeding abundance trend or productivity figure by surveying fixed plots, consistently, each year which are representative of the whole colony. These data come from a large sample of colonies and bridge the gap between years when a complete, countrywide census is undertaken. The consistency with which SMP data are collected provides a platform to assess changes in the population size and demography of seabirds at a high temporal resolution, aiming to be representative of trends within Britain and Ireland’s seabird breeding population as a whole.
Intensive monitoring is conducted annually at four Key Sites (Fair Isle, Canna, the Isle of May, and Skomer Island) where data on phenology (timing of life-cycle events), diet, adult survival, abundance and productivity increase our ability to understand the drivers of seabird population change.
SMP data are used to produce government Official Statistics every year, providing trends in seabird abundance and productivity. Data from 13 seabird species, for which valid trends can be produced, feed directly into several biodiversity indicators, including the UK and Scottish Biodiversity Indicators, the Marine Online Assessment Tool, Convention for the Protection of the Marine Environment of the North-East Atlantic (OSPAR Convention) indicators, the Convention on Biological Diversity National Report, Welsh State of Natural Resources Report (SoNaRR) and the State of UK Birds indicator. SMP data are also used to assess the status of designated Special Protection Areas (SPAs) in the UK, and to inform the consenting process for renewable energy projects.
Data collected for the SMP are highly valuable and are open access. Numerous scientific publications have utilised SMP data, contributing to a better understanding of, for example, how climate change is expected to affect population growth and productivity in North Sea seabird populations (Searle et al. 2022); the importance of major sandeel aggregations for the breeding success of Kittiwakes (Frederiksen et al. 2005); the vulnerability of different species to climate change (Davies et al. 2021); and the importance of considering long-term directional changes in demographic parameters within environmental impact assessments (Horswill et al. 2022).
The SMP is a critical tool for evaluating changes in seabird abundance. In 2019, the breeding seabird Biodiversity Indicator index (grouping trends for 13 well-monitored species) was 24% lower than the 1986 baseline (Defra 2023). The SMP also provides evidence for the Birds of Conservation Concern (BoCC) assessment.
Currently, the majority of UK breeding seabird species have a Red or Amber BoCC listing – signifying that these species have undergone a moderate (Amber) or severe (Red) decline or have a restricted distribution (Stanbury et al. 2024).
The value of long-term monitoring is now more important than ever to be able to track changes in seabird populations. Taking part in the SMP is a great way to connect with seabirds whilst knowing you are contributing to monitoring the health of their populations and providing the evidence required for their management and conservation. Thank you to everyone who supports and contributes to the SMP. Please spread the word, mentor friends and colleagues in the art of seabird monitoring where you can, and help us to monitor more seabird colonies. Join the SMP at: www.bto.org/smp-taking-part
species
SMP and seabird census* data have contributed to the BoCC Red-listing of the following seabird species in the United Kingdom, Channel Islands and Isle of Man. *Figures in brackets covering 1985—2021 are from Seabirds Count (Burnell et al. 2023).
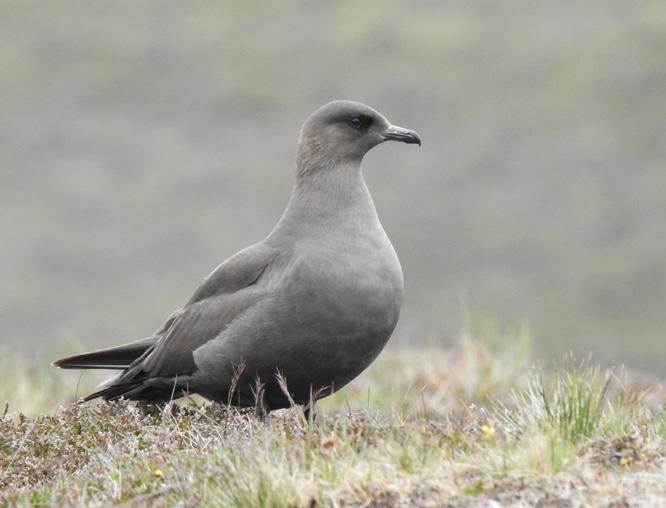
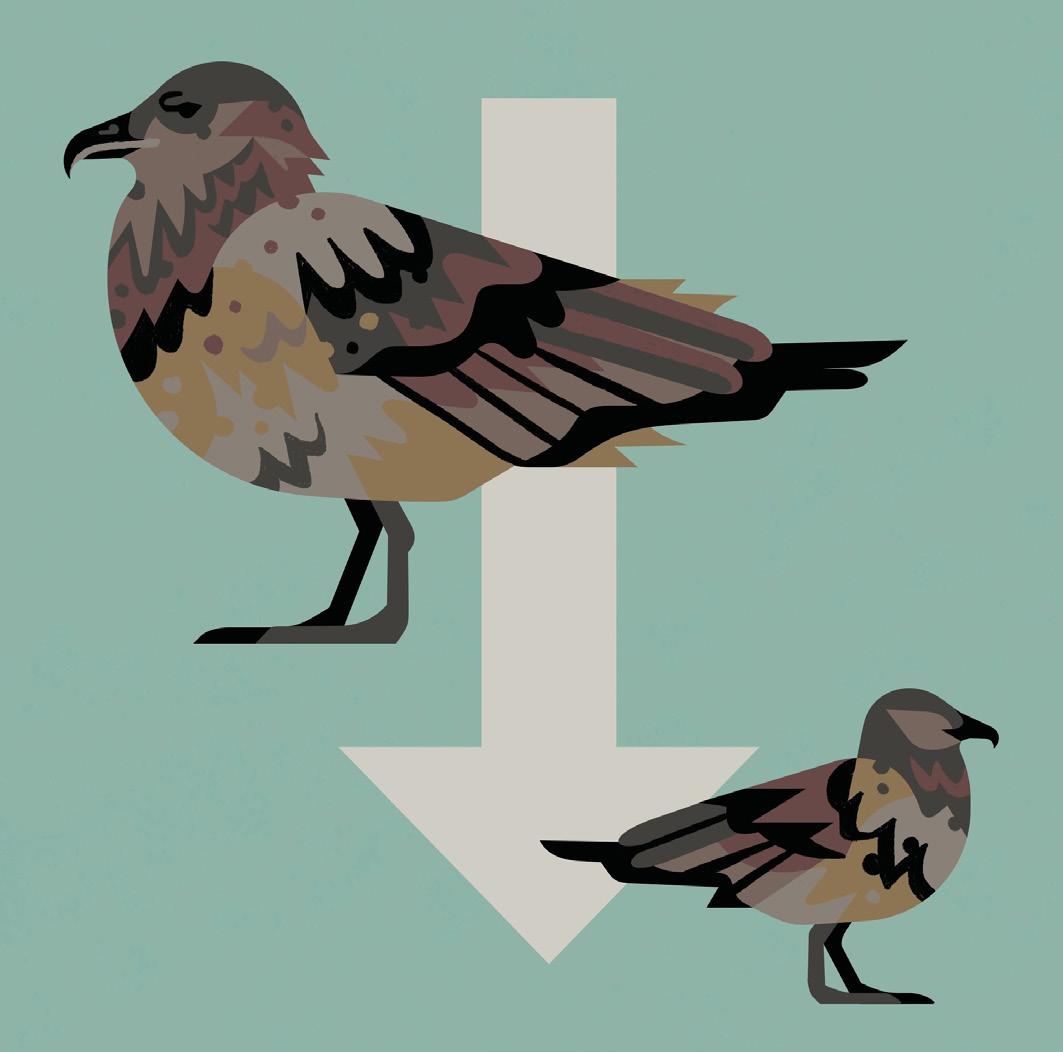
The SMP abundance trend indicated that the UK Arctic Skua population declined by 83% between 1986 and 2023 (-79% Seabirds Count). Monitoring of productivity indicates that poor breeding success across most populations is likely to be a major factor in their decline.
As a species that has long been associated with urban environments, it is perhaps surprising that the SMP reports that natural-nesting Herring Gull abundance, in the UK, has declined by 50% between 1986 and 2023 (-59% Seabirds Count), highlighting that our perception of a species does not always align with empirical evidence. Currently, information relating to urban Herring Gull abundance change is reported via periodic seabird censuses due to the difficulty in monitoring such populations, often requiring aerial surveys. The latest census, Seabirds Count, highlights that urban populations have expanded, however, to what extent these increased offset the declines in natural nesters is uncertain.
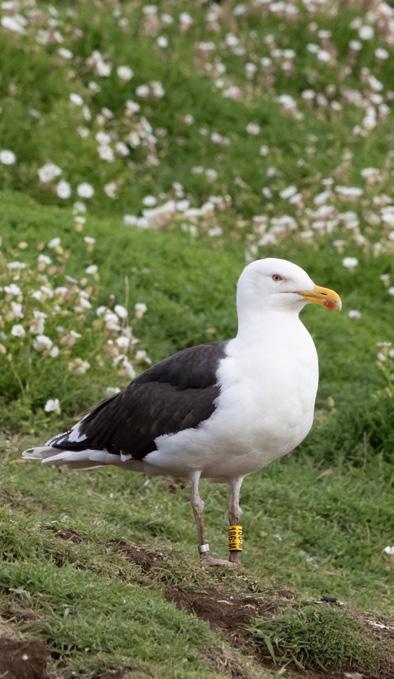
The SMP abundance trend for Great Black-backed Gull has declined in the UK by 42% since 1986 (-54% Seabirds Count). The decline in the Scotland trend is even greater (-70%), but increases have been seen in Wales (62%) over the same time period.
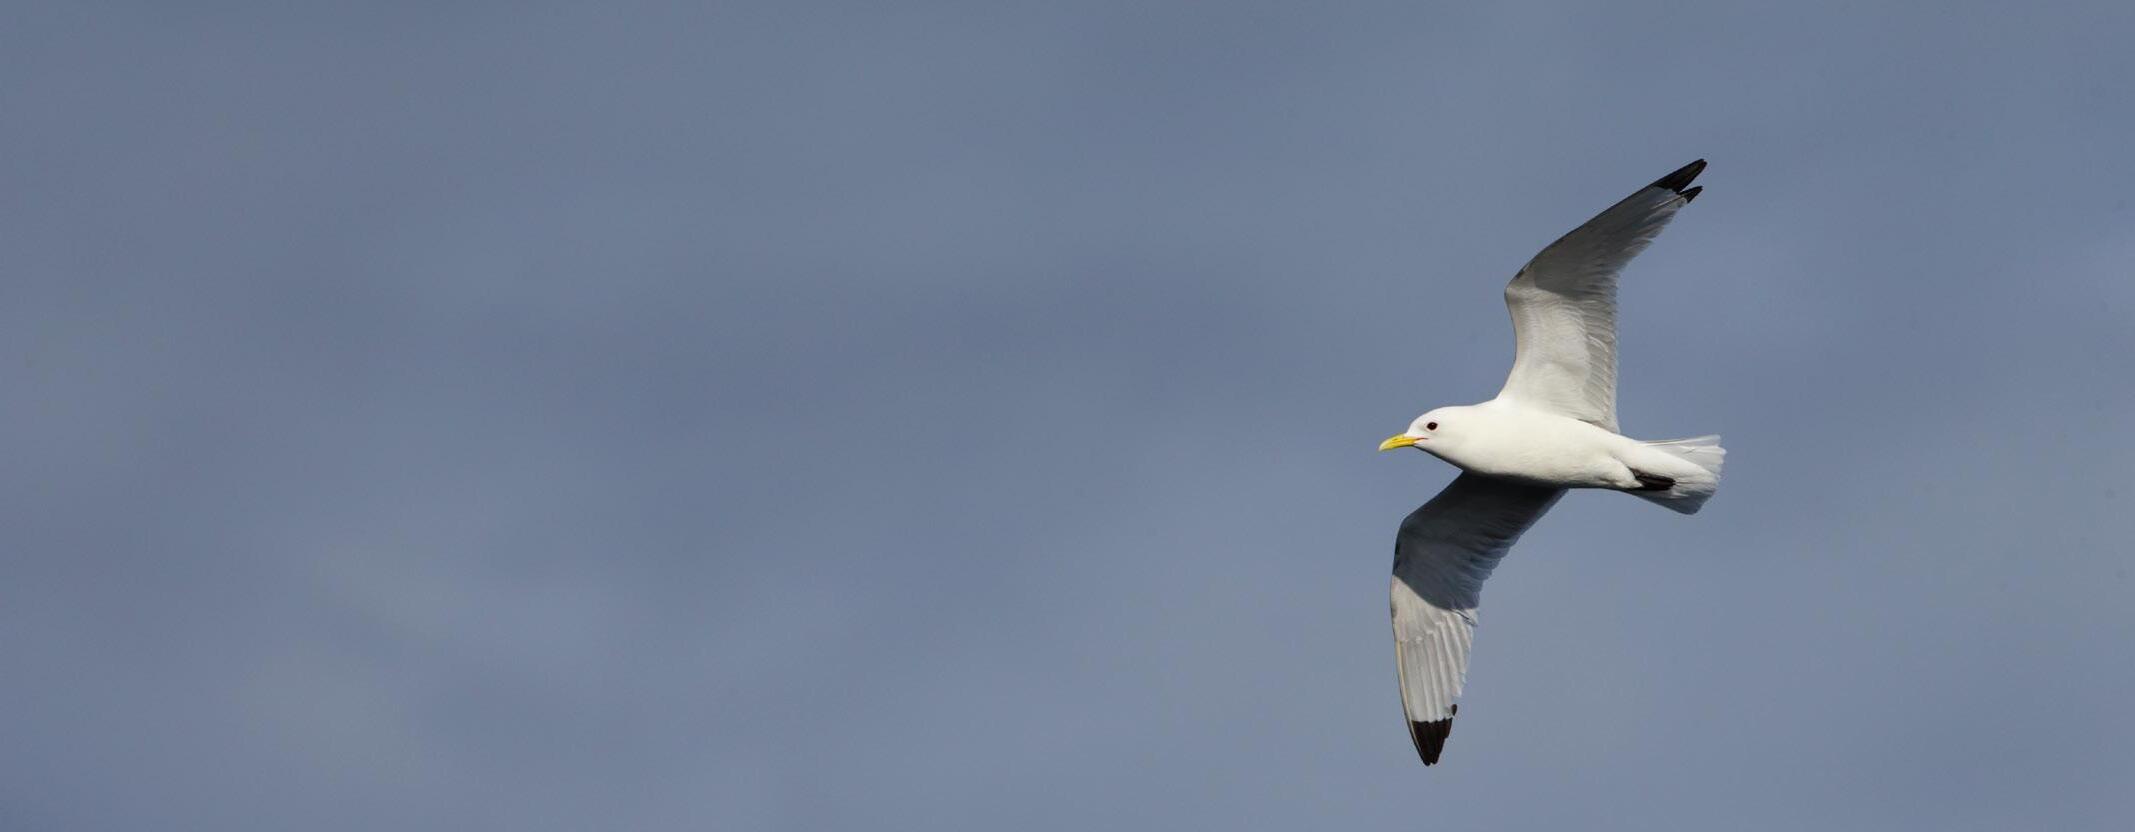
The SMP breeding abundance trend from approximately 120 sites has shown that Kittiwakes have declined fairly steadily for 27 years from 1986 to 2013. Since 2013 moderate increases have been recorded across the UK although breeding numbers in 2023 were still 51% lower than the 1986 baseline (-58% Seabirds Count

A particular strain of bird flu has impacted some of our seabird populations tremendously over the last couple of years. Here we look at how the SMP has helped us understand the impacts of the 2021—22 outbreak on UK seabirds.
By Linda Wilson, Senior Conservation Scientist and Connie Tremlett, Conservation Scientist, RSPB
Highly Pathogenic Avian Influenza (HPAI) affects poultry, wild birds and, more recently, mammals, causing severe disease and high mortality. The unprecedented outbreak in 2021—22 was caused by the H5N1 strain of the virus which originated from intensive poultry operations in Asia in 1996 before spreading to wild birds (Klaassen & Wille 2023). Over 400 species of wild birds worldwide have now been affected by this strain (CMS FAO 2023), and so far, 78 UK bird species have tested positive for HPAI H5N1, including 21 of our 25 regularly breeding seabird species (APHA 2024).
UNPRECEDENTED SEABIRD MORTALITIES IN 2022
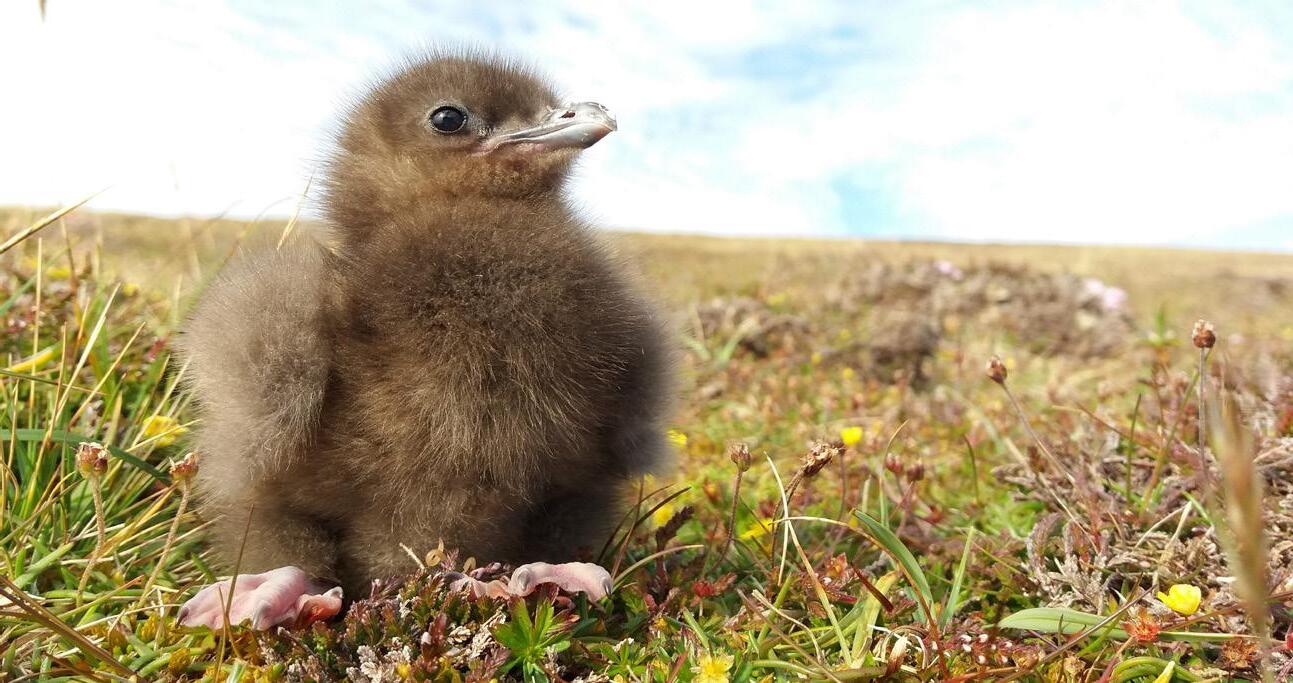
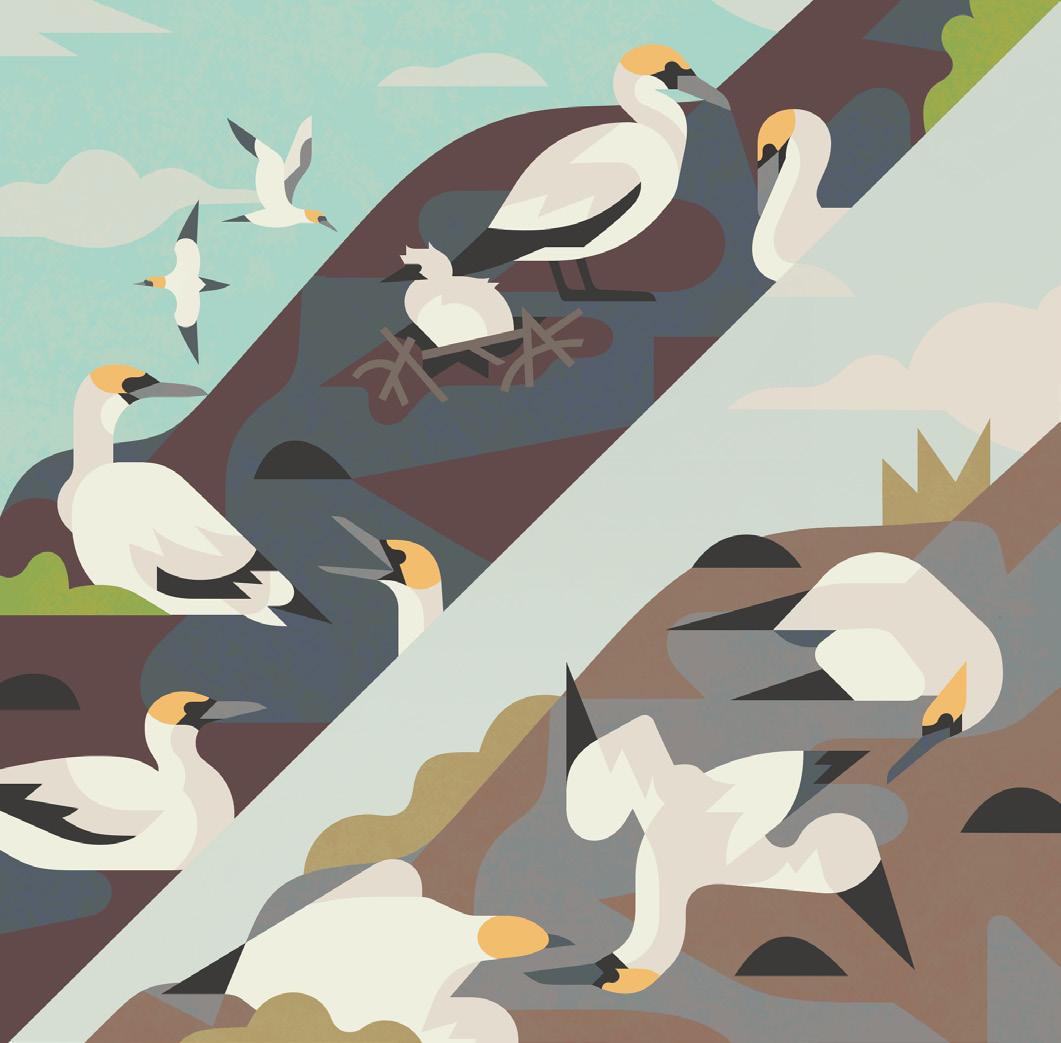
In the UK, HPAI was first recorded in seabirds – in Great Skuas – in summer 2021, with mass mortalities following in waterfowl, particularly Barnacle Geese, in winter 2021/22 (Falchieri et al. 2022; NatureScot 2023). For Great Skua, over 2,500 deaths were reported in 2022 –representing around 10% of the UK breeding population – and over 1,400 of those were recorded on the Scottish island of Foula, which was the largest UK colony at the time of the last census hosting just over 1,800 pairs (Camphuysen et al. 2022; NatureScot 2023). Over 11,000 Gannets were recorded dead in Scotland, and 5,000 at Grassholm in Wales (NatureScot 2023; RSPB unpublished data). In all, thousands of seabird mortalities attributed to HPAI were reported across the UK in 2022, with minimum losses of almost 20,000 in Scotland alone (NatureScot 2023), with many other dead birds likely to have gone unobserved and unreported.
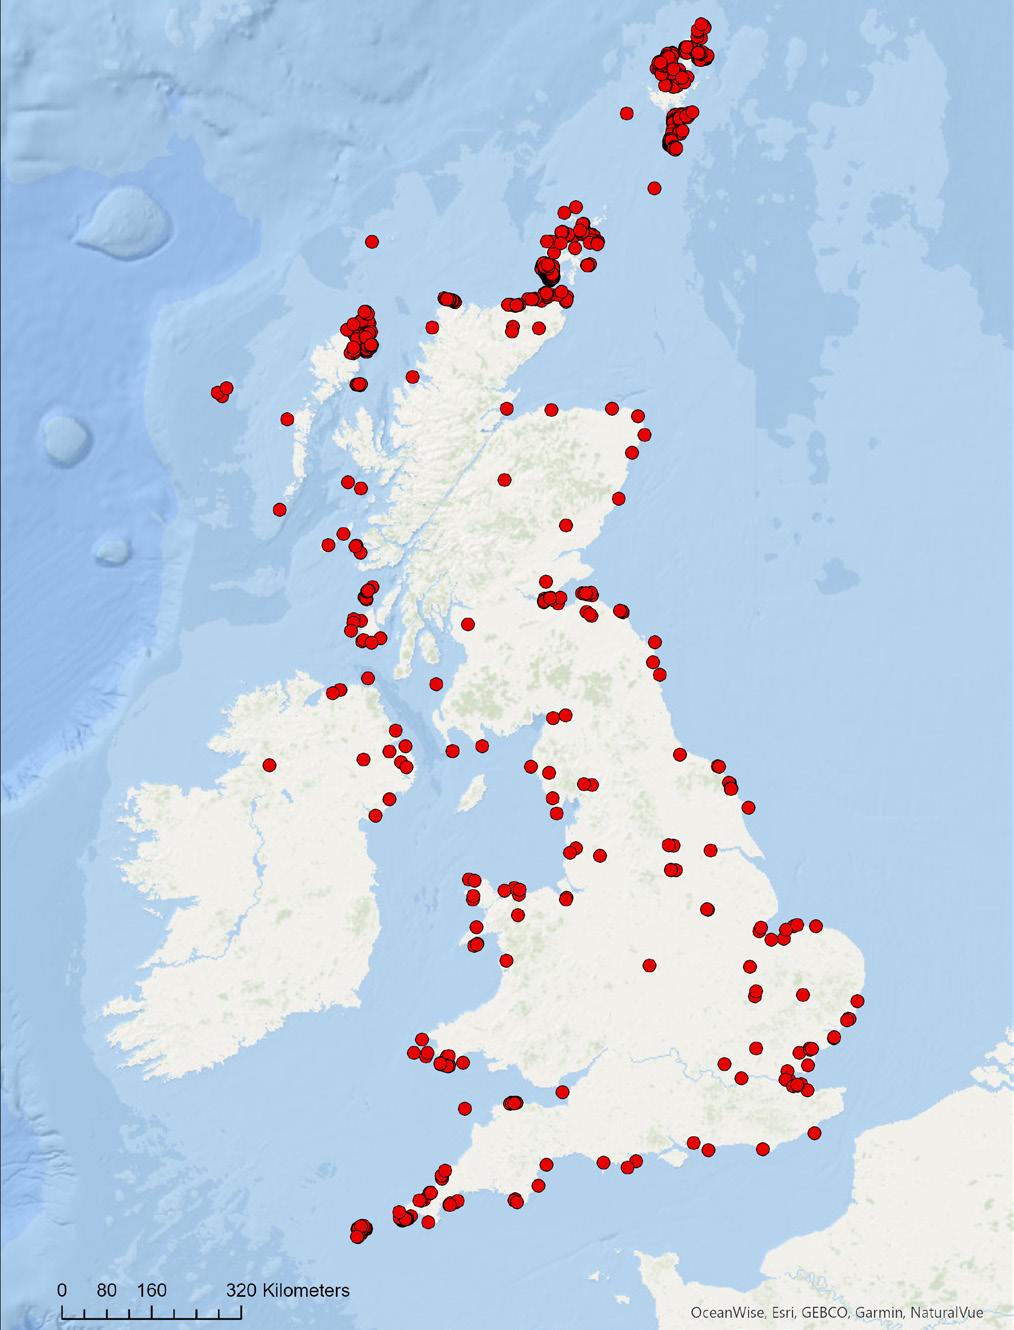
Figure 1: The 857 SMP sites that contributed data to the project. For many of these, multiple species were counted, giving a total of 1,518 species-SMP sites. Around 40% of these data were collected by RSPB, with the remaining from many other, often volunteer, contributors to SMP.
HPAI therefore became one of the biggest immediate conservation threats faced by multiple seabird species, including some for which the UK holds a high proportion of the global breeding population. It was essential to assess how these unprecedented levels of mortalities would translate into impacts on breeding populations, so obtaining updated population counts in 2023 became a top monitoring priority. The Seabirds Count census was completed in 2021 prior to HPAI impacts and provided crucial pre-HPAI baseline data against which updated population estimates could be compared.
SEABIRD COUNTS IN 2023
Fourteen seabird species were prioritised for assessment in 2023 (Table 1) based on their degree of mortality attributed to HPAI, conservation status, the proportion of the global population held in the UK, and the likely accuracy and precision of the achievable dataset.
The SMP was key to underpinning an assessment of HPAI impacts for these key species. By looking at the regularity of recent counts in the SMP database, we were able to make a rapid assessment of which sites were likely to be surveyed in 2023 for each species as part of routine annual monitoring. This ensured that any additional survey effort was targeted towards sites where it was most needed. Proceeding solely with business-as-usual SMP monitoring in 2023 would have given a rather patchy and incomplete picture of HPAI impacts, as only a fraction of seabird colonies are monitored annually due to accessibility issues, funding constraints, and the scale of the task. This was particularly the case for Great Skua and Gannet, the most affected species during 2022, where only a handful of sites were expected to be covered by routine monitoring.
Thanks to swift data entry immediately following the 2023 breeding season, it was possible to make use of the valuable survey data from SMP contributors, which were used to supplement data from the additional targeted gap-filling surveys. This meant that, in total, data from 857 SMP sites contributed to the assessment of HPAI impacts (see Figure 1).
The resulting Colony Count data for 2023, which covered between 22 and 98% of the UK population of each
species, generally showed a highly concerning picture across the target species at the surveyed sites when compared to pre-HPAI baseline figures, with extensive declines across species and sites (Table 1). These declines are particularly alarming given that they either come on top of previous decreases experienced by some seabird species in the two decades prior to the HPAI outbreak, or have reversed trends of previously increasing populations for those few species which the last full census showed to be faring better.
For species that were previously increasing or were relatively stable, the scale of the declines recorded, together with the reported HPAI-related mortalities in 2022, give little doubt that these declines are largely attributable to HPAI (these species are highlighted on page 10). However, for species that were already in decline, further analysis is being undertaken by RSPB to compare the recent short-term changes against previous background trends to better understand the extent to which HPAI may have exacerbated existing declines.
Unfortunately, a further outbreak of HPAI occurred at seabird breeding colonies in 2023, with a different genotype to that predominantly circulating in 2022 (Byrne et al. 2023; EFSA et al. 2023). The 2023 outbreak followed a different pattern of geographical spread to
between 1998—02 and 2015—21c (13—23 year period)
aExcludes urban
Table 1: The % of the UK population surveyed in 2023 for the 14 prioritised seabird species, and the overall % change in numbers across surveyed sites observed since the pre-HPAI baseline count. The pre-HPAI population trend reported by the Seabirds Count census is shown for context but note these trends cover a longer time period.
Three species for which the observed declines since the pre-H5N1 baseline counts are likely to have been caused by HPAI.
Percentage declines are across the surveyed sites only and may not reflect changes elsewhere. SPAs = Special Protection Areas.
• Approximately 75% of the UK population was surveyed in 2023.
• Overall decline of 25% since the H5N1 outbreak.
• Severest declines in SPAs were seen at Grassholm (Wales) and at Hermaness, Shetland (Scotland).
• This follows a previous increase in the UK population of 39% (2003—05 to 2013—21).
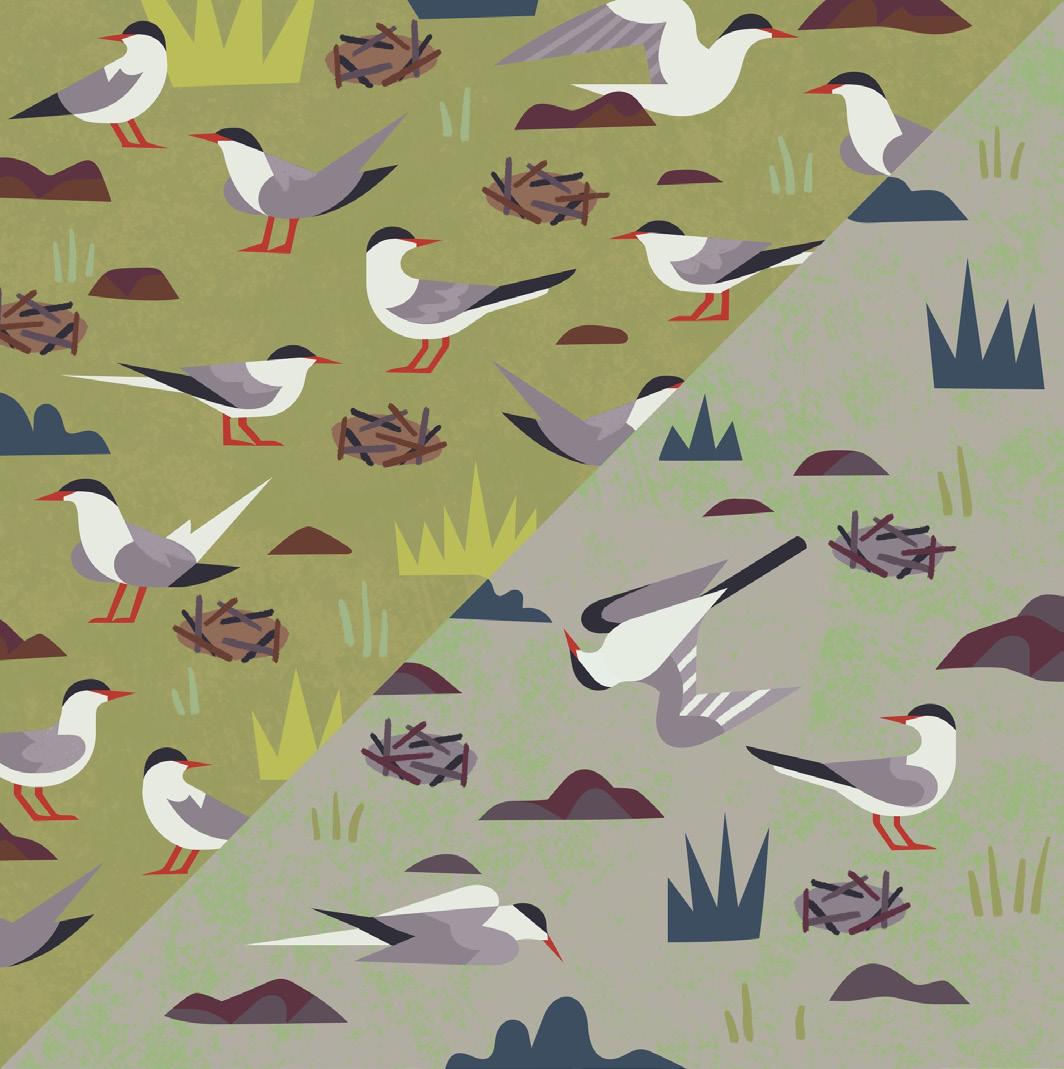
• Approximately 40% of the UK population was surveyed in 2023.
• Overall decline of 42% since the H5N1 outbreak.
• Severest declines at SPAs were seen at Belfast Lough (Northern Ireland) and Teesmouth and Cleveland Coast (England) (both 81%), while the Farne Islands (England) saw an increase of 153%.
• This follows previously stable numbers in the UK population.
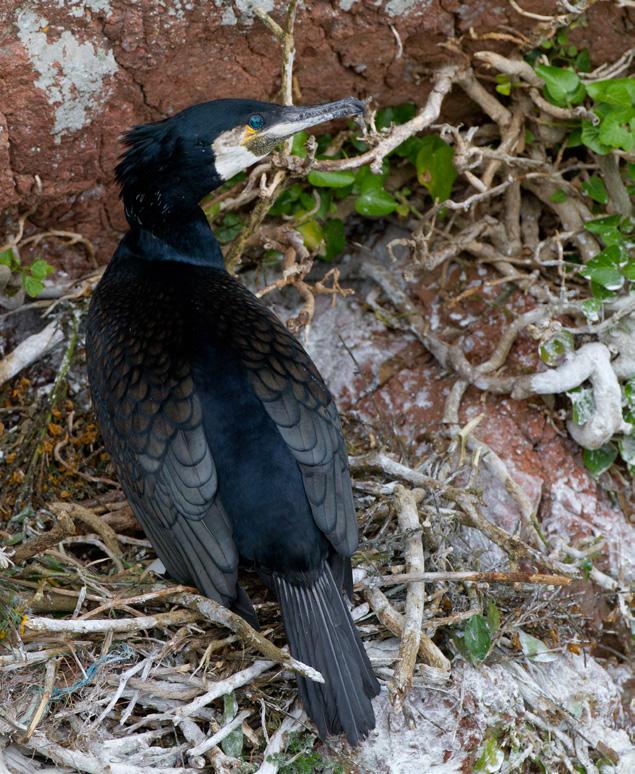
• Approximately 81% of the Scottish population was counted in 2023 — this equates to an area of over 300 km2 surveyed.
• Overall decline of 76% since the H5N1 outbreak.
• Severest declines at SPAs were seen at Noss (86%) and Foula (83%), Shetland (Scotland).
• This follows a previous increase in the UK population of 14% (1998—02 to 2015—21).
that observed in 2022, starting in the Midlands, and with a shift in which species were mainly affected. Mass mortalities in 2023 were observed from March onwards across England, Wales and Northern Ireland. This was initially confined to Black-headed Gulls after they arrived back in the UK from their wintering areas on the Continent, where this genotype had first been detected and where there had already been big impacts on wintering gulls (EFSA et al. 2023).
In the 2023 breeding season, several thousand Blackheaded Gulls died. Significant mortalities then followed among Sandwich, Common and Arctic Terns, which were particularly vulnerable to exposure when breeding in mixed colonies alongside Black-headed Gulls. In Scotland, the first positive tests for HPAI in seabirds were not recorded until the last week of June (these were for Black-headed Gull and Sandwich Tern, APHA 2024), whereas in 2022 impacts in UK seabirds were first observed in Scotland in the spring (initially in Great Skuas and Gannets). In 2023 it was not until June, July, and August that the virus started to affect Kittiwakes and Guillemots in their thousands across the UK.
As far as is known, most of the 2023 surveys were completed before any large-scale HPAI related mortalities occurred during that breeding season. Importantly, this means that the impacts of HPAI on the breeding populations of species further affected by the 2023 outbreak are likely to be worse than this assessment indicates and, as the outbreak is ongoing, there is potential for further impacts in future years.
The gull-adapted genotype that caused mass mortalities in 2023 has not been detected in Europe since September 2023. Although evidence that some seabirds have showed signs of developing immunity is promising, so far this has only been demonstrated in Gannet, Shag and Sandwich Tern (Knief et al. 2024; Lane et al. 2023; Loeb 2023).
It remains unknown what proportion of species and
Report available at: www.rspb.org.uk/birds-and-wildlife/ seabird-surveys-project-report
The 2023 count data commissioned as part of this project are available to download from the SMP database: https://app.bto.org/seabirds/public/data.jsp
Please continue to report birds for HPAI testing: For full guidance on how, visit www.bto.org/avian-flu
Additionally, please also report suspected HPAI mortality on BirdTrack: https://www.bto.org/our-science/projects/birdtrack
individuals may become immune, how long immunity might last, whether this is specific to a particular genotype, and what the long-term impacts on survival and productivity will be.
It is therefore crucial to continue enhanced seabird monitoring, not only to ensure coverage of high priority gaps and monitor the immediate impacts of the ongoing mortalities, but also to provide a time series of data that allows the long-term impacts of this disease to be understood. Various monitoring initiatives are underway across governments, non-governmental organisations, academia and industry, and it is clear that SMP data will continue to play a valuable role.
The HPAI Seabird Survey Project was a one-year emergency project led and coordinated by RSPB and a collaborative effort involving BTO, the Statutory Nature Conservation Bodies, and many other conservation organisations and individuals. This work was funded by: the ScotWind developers of the East and North East plan areas, The Crown Estate (through the Offshore Wind Evidence and Change Programme), Scottish Government (via the ScotMER programme), Natural England, Natural Resources Wales, and the Department of Agriculture Environment and Rural Affairs. The project was also supported by the RSPB Avian Flu Appeal.
Our thanks go to all the SMP contributors who submitted their survey data, many of them doing so as volunteers.
Annual SMP coverage for all species monitored by the programme is summarised here, focusing on 2021 to 2023. Fieldwork is carried out by both professionals and skilled nonprofessionals. It is thanks to everyone who has contributed to the programme since 1986 that it is possible to conduct long-term monitoring of seabirds in Britain and Ireland.
This report focuses on 2021 to 2023, but trends within the report date back to 1986. All the data in the SMP database are exported for use in trend analysis each year. Therefore, Colony Count and Breeding Success data submitted from any year since 1986 are very welcome, and will be used in future breeding abundance and productivity calculations, respectively.
The SMP monitors breeding seabirds throughout the UK, Channel Islands and Isle of Man and this is supported by the SMP Partnership. Collaboration with BirdWatch Ireland and the National Parks and Wildlife Service enables this report to cover ‘Britain and Ireland’ (specifically: all Britain, Ireland, Isle of Man and Channel Islands). Data also feed into the programme from offshore structures, such as oil platforms (Figure 2).
THE HERE AND NOW
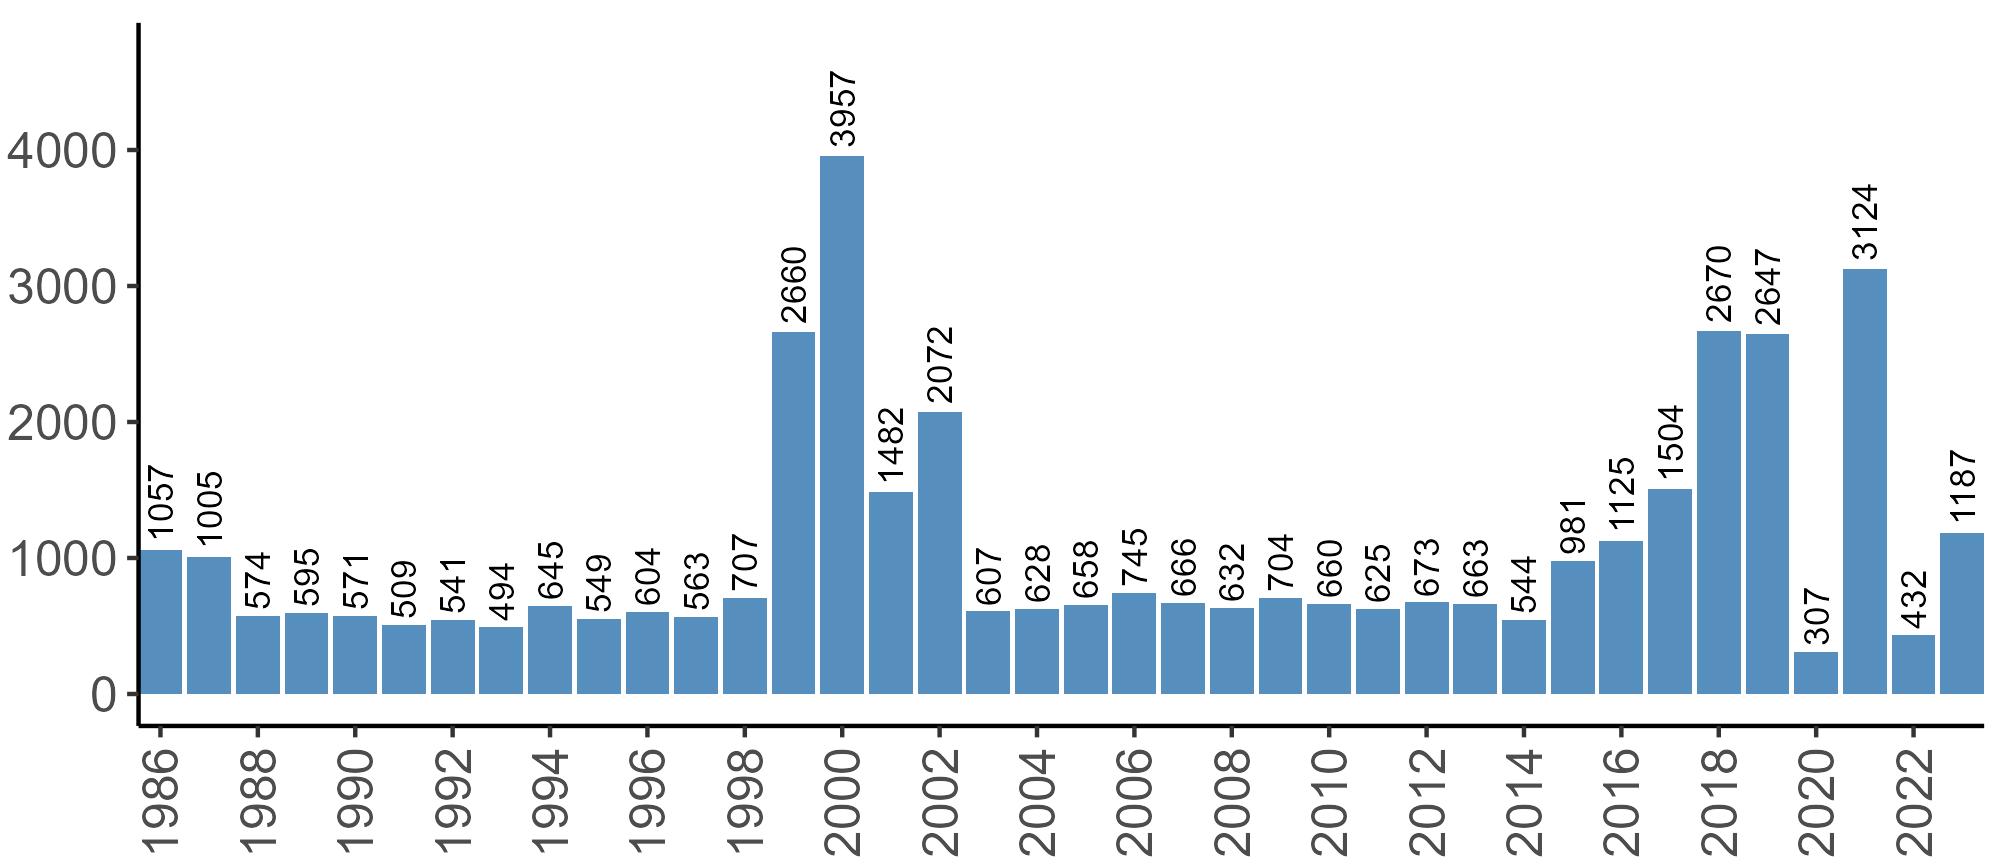
Variation in Colony Count coverage between 2021 and 2023 (Table 2) reflects several factors: the final year of the Seabirds Count (2015–2021) census in 2021, a return to more typical coverage levels in 2022, and an increase in 2023 due to additional monitoring efforts led by RSPB to assess the impact of the recent HPAI outbreak (see pages 8–11). Figure 3 shows survey coverage in 2023 when the additional monitoring to investigate HPAI impacts was undertaken. In Figure 3, the census years are obvious due to the higher number of sites covered, with the exception of 2020 where coverage was low due to COVID-19 restrictions.
Coverage of Breeding Success surveys (collating the number of chicks fledged per pair, which is used to calculate productivity) is displayed in Figure 4. These are more intensive surveys than the Colony Counts, requiring more visits to the colony each year.
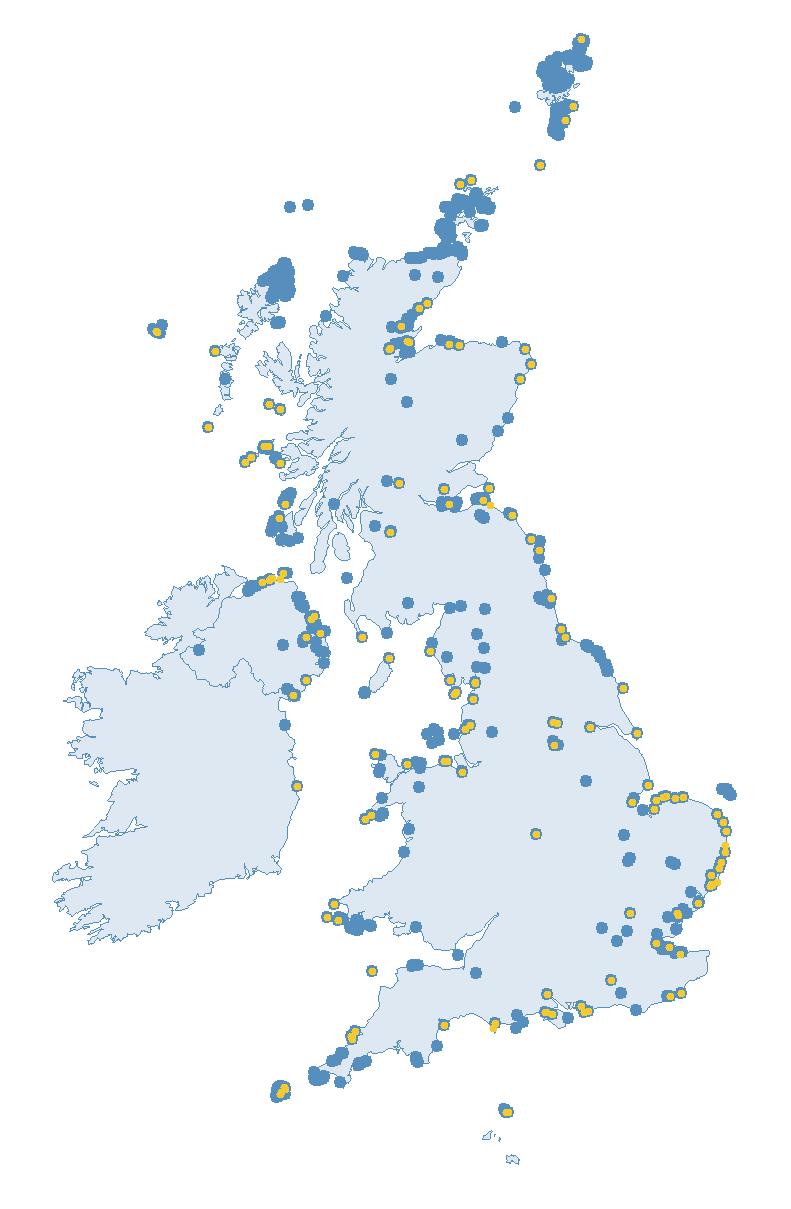
Figure 2: Coverage map for 2023, showing all sites where Colony Count (blue) and Breeding Success (yellow) surveys were conducted.
These data provide an insight into how well a breeding season has fared and allow species which are struggling (i.e. low productivity over several years) to be identified – something which may not be so quickly realised in long-lived seabird species when only using Colony Count data (used to calculate breeding abundance). Breeding Success coverage has dropped since the mid 2000s and the reasons behind this are being investigated currently.
By using information on current survey coverage, a new sampling strategy and by rejuvenating engagement with participants, the SMP will be improved.
The flow of data into the database is currently being improved with fellow organisations, and the gaps in coverage, evident in this report, are being worked through and submitted in readiness for future reporting. Efforts are underway to enhance engagement with individuals monitoring seabird colonies who are not currently submitting data to the SMP online database, while also improving support for existing participants in the scheme. For example, development of the SMP Online data entry portal, along with accompanying guidance and training, aims to improve the user experience. Reversing the decline seen in the collection of Breeding Success data is also a current priority. These advances, alongside an annual newsletter, leaflet and promotion are just part of an extensive Engagement Plan that will be informed by wider development work.
As of June 2024, 263 participants were allocated sites on the SMP Online portal, but the true number of surveyors is much higher, as in many cases, people entering data do so on behalf of a whole team. We are very grateful to all who participate in seabird monitoring.
Table 2: Coverage for 2021—23. This is the total number of sites where Colony Count or Breeding Success surveys for any seabird species were conducted in each of the years and areas stated.
Census years: 1969—1970: Operation Seafarer 1985—1988: Seabird Colony Register Census 1998—2002: Seabird 2000 2015—2021: Seabirds Count
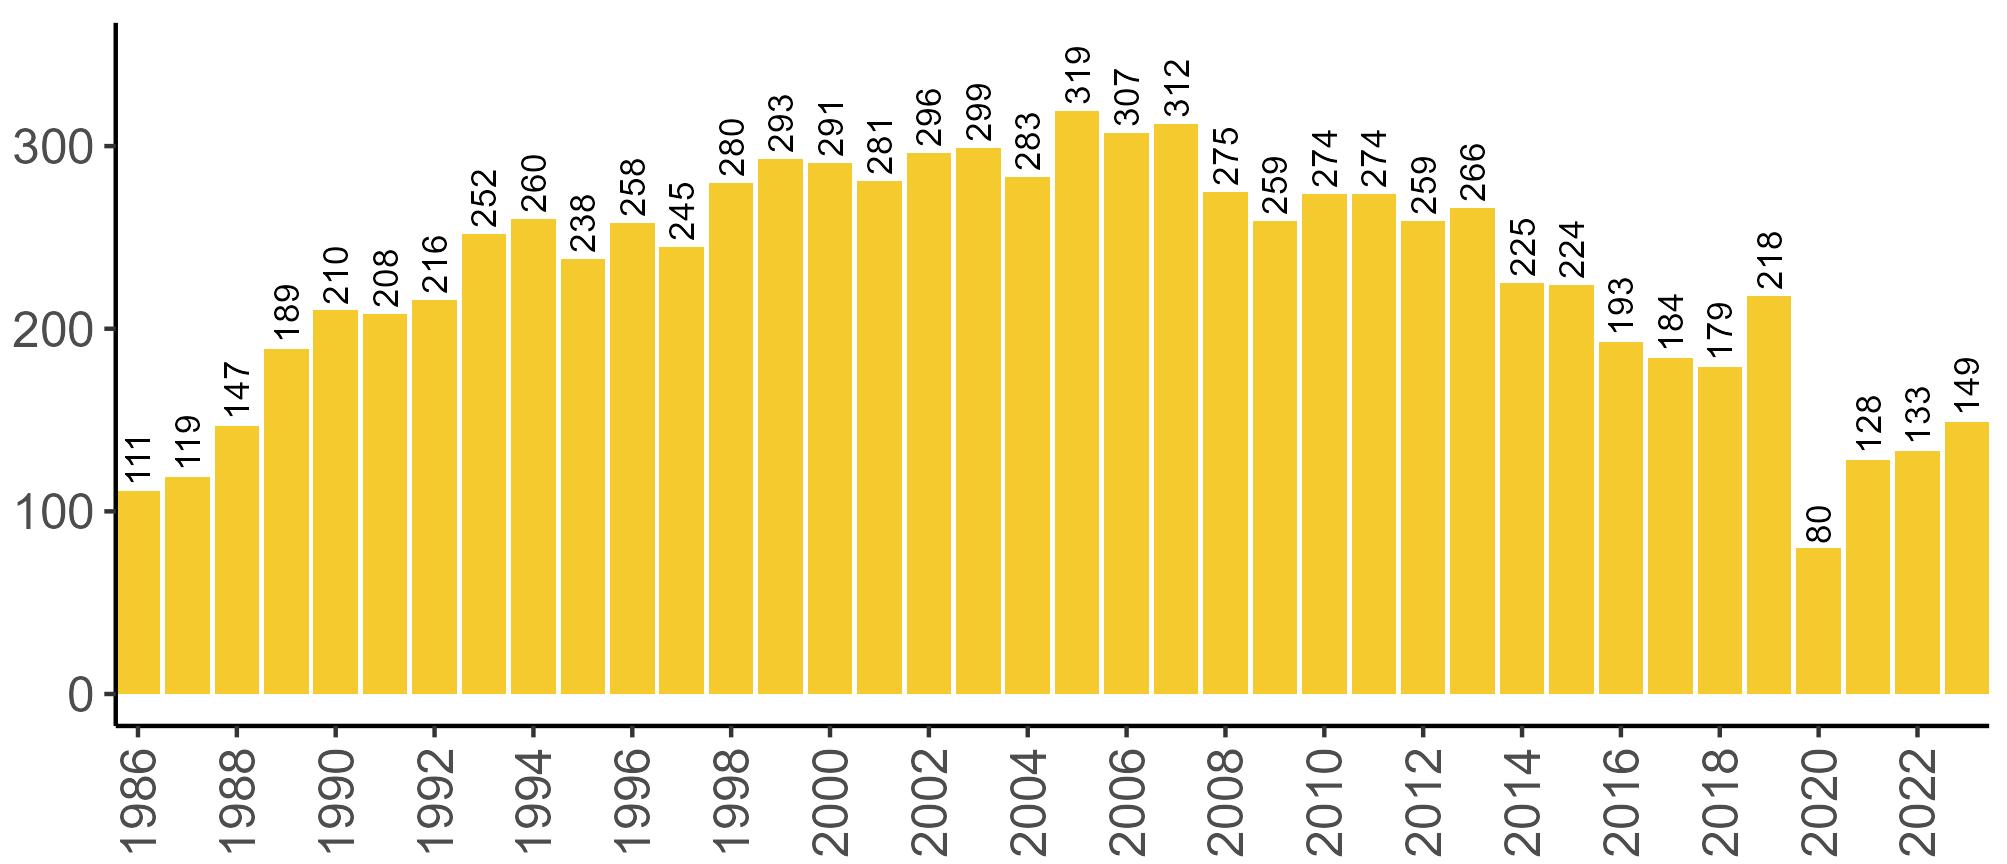
Figures 3 and 4: Site coverage for Britain and Ireland, by year, for Colony Count (blue) and Breeding Success (yellow) monitoring since 1986. Fluctuations in Colony Count coverage has been influenced by census years, COVID-19 and additional HPAI monitoring.
Four geographically dispersed seabird sites around the UK collect additional seabird data to complement core SMP monitoring. These data provide further insights into how and why seabird populations are changing. Information on abundance, productivity, phenology, survival and diet for the species each site monitors can be viewed in annual Key Site reports.
The seabird haven that is the Isle of Canna.
Established in 1969 by students from the University of Aberdeen, this monitoring programme represents one of the longest running seabird studies run by volunteers. Nowadays, monitoring is led by the Highland Ringing Group and is our only entirely volunteer-led and volunteer-surveyed Key Site.
The group survey many of Canna’s breeding seabirds annually, monitoring breeding abundance and productivity for five species. Additionally, ringing is carried out on three species to assess adult survival rates and, in recent years, geolocators have been deployed to study movements. Diet information is also recorded, along with contributions towards additional ad-hoc studies when possible.
The group are grateful to National Trust for Scotland for providing accommodation for each visit.

The Wildlife Trust of South and West Wales (WTSWW) has undertaken detailed seabird monitored on Skomer Island since 1959 in collaboration with other groups.
Currently, WTSWW and the University of Gloucestershire collaborate to provide the SMP with highly detailed data that are used to track breeding abundance, productivity, phenology, diet, body condition, and survival of the range of seabird species that breed on the island. This includes data on the survival and productivity of Manx Shearwaters, with Skomer Island hosting the world’s largest colony of this species.

Established in 1948, Fair Isle Bird Observatory has monitored bird migration and breeding seabirds for over 75 years. As songbird migration wanes in late spring, the observatory’s staff turn their attention to collecting key data from Gannets, Fulmars, Shags, skuas, terns, Kittiwakes and auks. This work includes monitoring breeding abundance, adult survival, productivity and diet.
Alongside long-term seabird monitoring, Fair Isle Bird Observatory regularly collaborates with seabird researchers on other scientific projects; for example, assisting with the deployment of GPS tags and geolocators on Arctic Skuas which has provided insights into the foraging behaviour and migration of this rapidly declining species.
The UK Centre for Ecology and Hydrology (UKCEH) has monitored seabirds on the Isle of May for over 50 years. Their long-term seabird study is one of the most complex and comprehensive of its kind in the UK and has been contributing to the SMP since its foundation in 1986.
Between April and August each year, UKCEH researchers live on the Isle of May to undertake a range of research projects and collect highly detailed monitoring information on up to six seabird species. Productivity is monitored for Fulmar, Shag, Kittiwake and auks, and survival studies are carried out for five species. Labour-intensive observations of prey loads from auks and collection of regurgitates from Shags and Kittiwakes provide valuable information on diet composition and prey biomass.
UKCEH efforts are complemented by those of NatureScot staff and volunteers who monitor several species across the island.

When the Storm Petrels appear on Fair Isle.
The SMP is an ongoing annual monitoring programme, established in 1986, covering 25 seabird species that regularly breed in Britain and Ireland.
The SMP was established by JNCC, (then known as the Nature Conservancy Council) in 1986, working in partnership with 19 other organisations. The aim was to set up an annual monitoring programme for the 25 seabird species which breed regularly in the UK, to allow their conservation status to be assessed. JNCC coordinated the collection, collation, and analysis of data on seabird breeding numbers and success, which were gathered from around the UK, the Channel Islands, the Isle of Man and the Republic of Ireland, by hundreds of skilled non-professional and professional participants. In 2022, JNCC formed a new partnership with BTO and RSPB for funding and management of the SMP. Drawing on its considerable expertise in running bird monitoring projects, BTO now leads on the coordination of the programme, data collation, analysis and outputs.
The SMP (www.bto.org/smp) aims to ensure that sample data on breeding abundance and productivity of a range of seabirds are collected both regionally and nationally, at both the coast and inland, to inform conservation policy and management affecting breeding seabirds.
The SMP Organiser, based at BTO, is responsible for the overall running of the programme, and is the main point of contact for participants. Survey locations are selected by participants based on breeding sites defined within the SMP database. Previously unrecorded sites can also be added to the database. At the end of each breeding season, data entered into the online data entry system, SMP Online (https://app.bto.org/seabirds), are validated, ready for data analysis by a BTO Research Ecologist.
Annual monitoring of breeding abundance and productivity at sample sites forms the core of the SMP and enables annual reporting from the programme. The results published form part of the suite of Government ‘Official Statistics’. SMP data have helped identify possible drivers of seabird population change and, alongside national censuses, have been crucial for informing conservation policy, research and actions for this group of species.
Previously, SMP statistics were published annually in a report – Seabird Numbers and Breeding Success in Britain
and Ireland – but in more recent years were presented on the JNCC website. Reporting from 2021 onwards is published on the BTO’s SMP webpages.
Abundance is recorded using whole or plot Colony Counts; simply by counting the number of breeding individual adults, nests, sites, burrows or territories depending on the species. Productivity is the number of chicks to reach fledging age from a nest site or pair of breeding adults. The methods used to monitor abundance and productivity vary by species, and can be found in the Seabird Monitoring Handbook for Britain and Ireland (Walsh et al. 1995). This also includes the optimum date and time periods when monitoring should be carried out for each species. For some species there are multiple methods that can be used depending on the location and accessibility of colonies. The Seabird Monitoring Handbook for Britain and Ireland also includes details on how to select and monitor abundance and productivity at sites using plots, rather than whole-colony monitoring.
In addition to this widespread data collection, a Triennial Sites monitoring programme is carried out, whereby a range of seabird species are surveyed at three Scottish sites (St Kilda, Orkney and Bullers of Buchan) every three years by JNCC and the National Trust for Scotland. Data are also collected annually at four Key Sites distributed around the UK: Fair Isle, Canna and the Isle of May in Scotland and Skomer Island in Wales (see pages 14–15). Alongside extensive abundance and productivity studies at these sites, information about phenology (timing of the breeding season), diet and adult survival is also collected. Key Site monitoring is part-funded by JNCC, overseen by BTO, and the sites were chosen to be representative of the major part of the range of most seabird species, and to complement the monitoring carried out by the SMP.
The SMP is complemented by periodic national censuses that provide more comprehensive assessments of the size and overall status of breeding seabird populations across the whole of Britain, Ireland, the Isle of Man and the Channel Islands. These censuses began in 1969, take place at approximately 15–20 year intervals, and have been coordinated by JNCC. The latest and fourth census, Seabirds Count, was completed between 2015 and 2021 (Burnell et al. 2023).
Colony Counts (breeding abundance)
Abundance trends are calculated for the majority of seabird species nesting in Britain and Ireland, monitored using Colony Counts at whole or plot-scale. However, for some species, the annual sample is too small or unrepresentative, or the species is too infrequently monitored to allow for accurate trends to be calculated, and this is discussed in the relevant species accounts.
For those species for which the production of annual trends is considered feasible, all sites within the SMP database with at least three colony counts submitted since its inception in 1986 are included in the annual trend analysis. This therefore excludes a large number of sites that have only been counted once or twice (for example, only during the Seabird 2000 or Seabirds Count censuses). However, these counts are still included in calculating the weightings for imputed counts.
To ensure results are reliable, breeding abundance trends are only produced for species and regions with sufficient data. To judge this, the number of colonies where data on abundance have been recorded during the trend period is examined. Specifically, trends must be based on data from at least 15% of colonies present within the SMP database (with at least three counts across the monitoring period) to be published i.e. if a trend uses at least 15% of underlying actual data rather than imputed. However, there can be exceptions to this rule e.g. for Puffins, which are challenging to survey, coverage is biased towards smaller (potentially unrepresentative) sites and thus, although the threshold of 15% of sites being covered is met, there remain very wide confidence intervals around the trend and it is therefore not published.
For sites with missing data for a given year, values are currently estimated using an imputation method (Thomas 1993) implemented in ‘R’, a software used for data science, statistics, and visualization projects (R Core Team 2004). This approach calculates a value for the missing count using a weighted sum of all the nonmissing counts for that site. Equal weights are used to determine the degree of temporal smoothing. For a given year the total abundance across colonies is estimated by summing across the available observed data and imputed counts. Indices of abundance are produced by scaling the total abundance in the base year (1986), with subsequent years represented as a percentage relative to 1986.
This imputation approach can introduce uncertainty, which is quantified by bootstrapping (Marchant et al. 2004), resampling with replacement across the included colonies. This generates confidence intervals for the estimated total abundance in each year that reflect uncertainty in the estimation of missing counts. Further details on the method behind the trend analysis for the indices of abundance, and estimation of productivity values are provided in Methods of analysis for production of indices of abundance and estimation of productivity (JNCC 2014). The analysis therefore produces an estimated trend index for each species with 95% confidence intervals, calculated through bootstrapping with replacement across sites (1,000 iterations), which reflects the confidence of the trend based on uncertainty around the imputed missing counts.
For some gull species, results are only presented for a particular subset of habitats. Due to insufficient
data from inland colonies for Black-headed Gull and Common Gull, SMP reports have only provided trends for their coastal-nesting populations (sites within 5 km of the Mean High-Water Mark). For Lesser Black-backed Gull and Herring Gull, SMP trends are only presented for natural-nesting birds, given the inherent difficulties in accurately surveying urban nesters of these species.
Colony Count coverage was sparse in 2020 due to the COVID-19 pandemic. Calculation of the abundance trends, therefore, omitted 2020 data, but it was still possible to estimate a trend value for 2020 by interpolating the smoothed trend line between 2019 and 2021.
Productivity is estimated using data submitted from Breeding Success monitoring from within site plots which vary in size and number across sites.
Annual estimates of productivity are calculated using Generalised Linear Mixed Models (GLMMs) in the data analysis software Genstat (VSN International Ltd). For species that lay a single egg, the GLMM is run with a binomial error distribution and logit link function, with the sample size included as a binomial denominator. For species that lay more than one egg, the GLMM is run with a Poisson error distribution and log link function with the sample size included as an offset. Site is included as a random intercept to account for repeated measures of productivity for colonies over multiple years (JNCC 2014).
For each species, up to five models are tested:
1. A full interactive model of year and region/regional sea (subdivisions of the UK, formerly adopted as reporting regions in the SMP) effects;
2. Additive effects of year and region/regional sea;
3. Year only;
4. Region/regional sea only; and
5. Constant productivity (null model).
Model fit is tested using F-ratio statistics and a backward elimination approach to arrive at the minimum adequate model. The parameter estimates are extracted from the minimum adequate model and back transformed to produce estimates of productivity. No confidence intervals are currently implemented for this approach (see JNCC 2014 for further details). Therefore, no measure of uncertainty in the productivity estimates is provided.
Due to the COVID-19 pandemic, Breeding Success coverage was very limited in 2020. To prevent this from affecting the trends, all 2020 data were omitted from the analyses presented in this report (see Harris et al. 2021; 2022).
Pages 22—133 provide accounts of the species monitored by the SMP, including breeding abundance and productivity statistics. Guidance on interpreting the tables and graphs is provided here.
Each species account contains an infographic that illustrates key facts and figures. The icons are as follows:


The approximate percentage of the species’ global population breeding in Britain and Ireland. If this figure refers to a subspecies, the scientific name is included below the percentage figure in italics (Burnell et al. 2023).
The status of the species according to the UK Birds of Conservation Concern 5 addendum (Stanbury et al. 2024) and the Birds of Conservation Concern in Ireland 4 (Gilbert et al. 2021) in italics (Red, Amber or Green — from highest to least concern).
International Union for Conservation of Nature (IUCN 2024) Global Red List status. Categories are: Extinct, Extinct in the Wild, Critically Endangered, Endangered, Vulnerable, Near Threatened, Least Concern, Data Deficient and Not Evaluated.
The UK SMP Long-term (LT, 1986—2023) breeding abundance trend (Increase = increase of >10%, Decline = decrease of >10%, Stable = +/- change of up to 10% and n/a = insufficient SMP data to produce a trend), and the productivity figure for 2023, unless specified as otherwise.
The number of sites in Britain and Ireland where Colony Count or Breeding Success monitoring was undertaken in 2023. Not all sites are used in the SMP trend analysis.
The typical lifespan of the species after reaching breeding age, and the average age that they start to breed (BTO 2023a; Burger et al. 2020; Horswill & Robinson 2015).
Each species account includes a map of the coverage for that species in 2023, regardless of whether data from the site could be used in the abundance or productivity trends. It is important to stress that all data are vital for research projects and potentially future trend calculations. Some seabird species, such as the petrels and Manx Shearwater are considered cryptic and difficult to survey, nesting in hard-to-reach locations, therefore coverage is relatively low most years. Developments in surveying methods and sampling could open up new possibilities for annual monitoring and thus trend calculations — so please keep submitting data for all seabird species.
To ensure results are reliable, breeding abundance trends are only presented where they meet the thresholds described in the Background and Methods section of this report (pages 16–17).
Example 1: SMP Breeding Abundance Change and Productivity tables
For each species, region-specific population estimates are provided from the Seabirds Count (2015–2021) census in the ‘Seabirds Count ’ column to provide context to the respective SMP-derived change values. Unit values are abbreviated as: AON (Apparently Occupied Nest), AOS (Apparently Occupied Site), AOT (Apparently Occupied Territory), AOB (Apparently Occupied Burrow) and IND (Individual).
All other values in the table are produced using SMP data. In the ‘Breeding Abundance %’ section of the table, the ‘Sites 2023’ column refers to the total number of sites in that year that were used to produce the most recent
• Sites with Colony Count (breeding abundance) data
• Sites with Breeding Success (productivity) data

abundance or productivity trends for that species and region and this will, therefore, vary from the total coverage figures and coverage maps. The UK total includes sites from England, Scotland, Wales and Northern Ireland. For most species, the UK total will be greater than the sum of sites included for the constituent countries within the table, as trends cannot yet be produced for all four countries (specifically Northern Ireland).
SMP breeding abundance trends are presented as the percentage change over two periods: the long-term (LT) trend and the 23-yr trend. Unless stated otherwise, the LT trend covers the lifetime of the SMP (1986–2023) and the 23-yr trend covers the period 2000 to 2023, with 2000 being the mid-point of the Seabird 2000 (1998–2002) census. Trends with statistically significant changes, where the 95% confidence limits of the change do not overlap 100 (the baseline index in 1986), are marked with an asterisk (*).
The final two columns in the table present the productivity values for 2023 and the number of sites from which these were produced. Where it has only been possible to produce figures for one (breeding abundance or productivity) set of results, the tables have been reduced accordingly. The productivity values for 2021 and 2022 can be found on pages 134–137.
Variations to the table will occur when abundance trends can only be provided for a particular subset of habitats, or where breeding abundance and/or productivity values are not available for a particular species. Where abundance trends can only be provided for specific nesting habitat
Note: Many sites are in close proximity to one another so cannot be individually identified on the map.
types for a given species, this is highlighted in red text in the tables, e.g. COASTAL NESTERS (within 5 km of Mean High Water Mark) or NATURAL NESTERS (on moors, cliffs, marshes, beaches and other areas of semi-natural habitat). See Background and Methods (pages 16–17) for more information.
The SMP sampling and analysis strategy is currently under review to improve the precision and representativeness of future trends. As a result, in the discussions within each species account, fine scale analysis of the breeding abundance and productivity trends has not been carried out.
Note: the term ‘region’, the term is used to describe geographic areas including multiple Crown Dependencies (e.g Channel Islands and Isle of Man) or country groups (e.g. UK, all-Ireland or Britain and Ireland)
Results
This table shows the abundance trend as measured between the Seabird 2000 (1998–2002) and Seabirds Count (2015–2021) censuses, allowing for comparison with the SMP trend. For Gannet, a combined result from the most recent Gannet census and the Seabirds Count census has been provided as per Seabirds Count reporting. As the censuses aim to cover the entire population of each species within the whole of Britain, Ireland, Isle of Man and the Channel Islands, the trends produced are likely to be more accurate than the interim values provided by the SMP trends. This is discussed in more detail in the species accounts (pages 22–133).
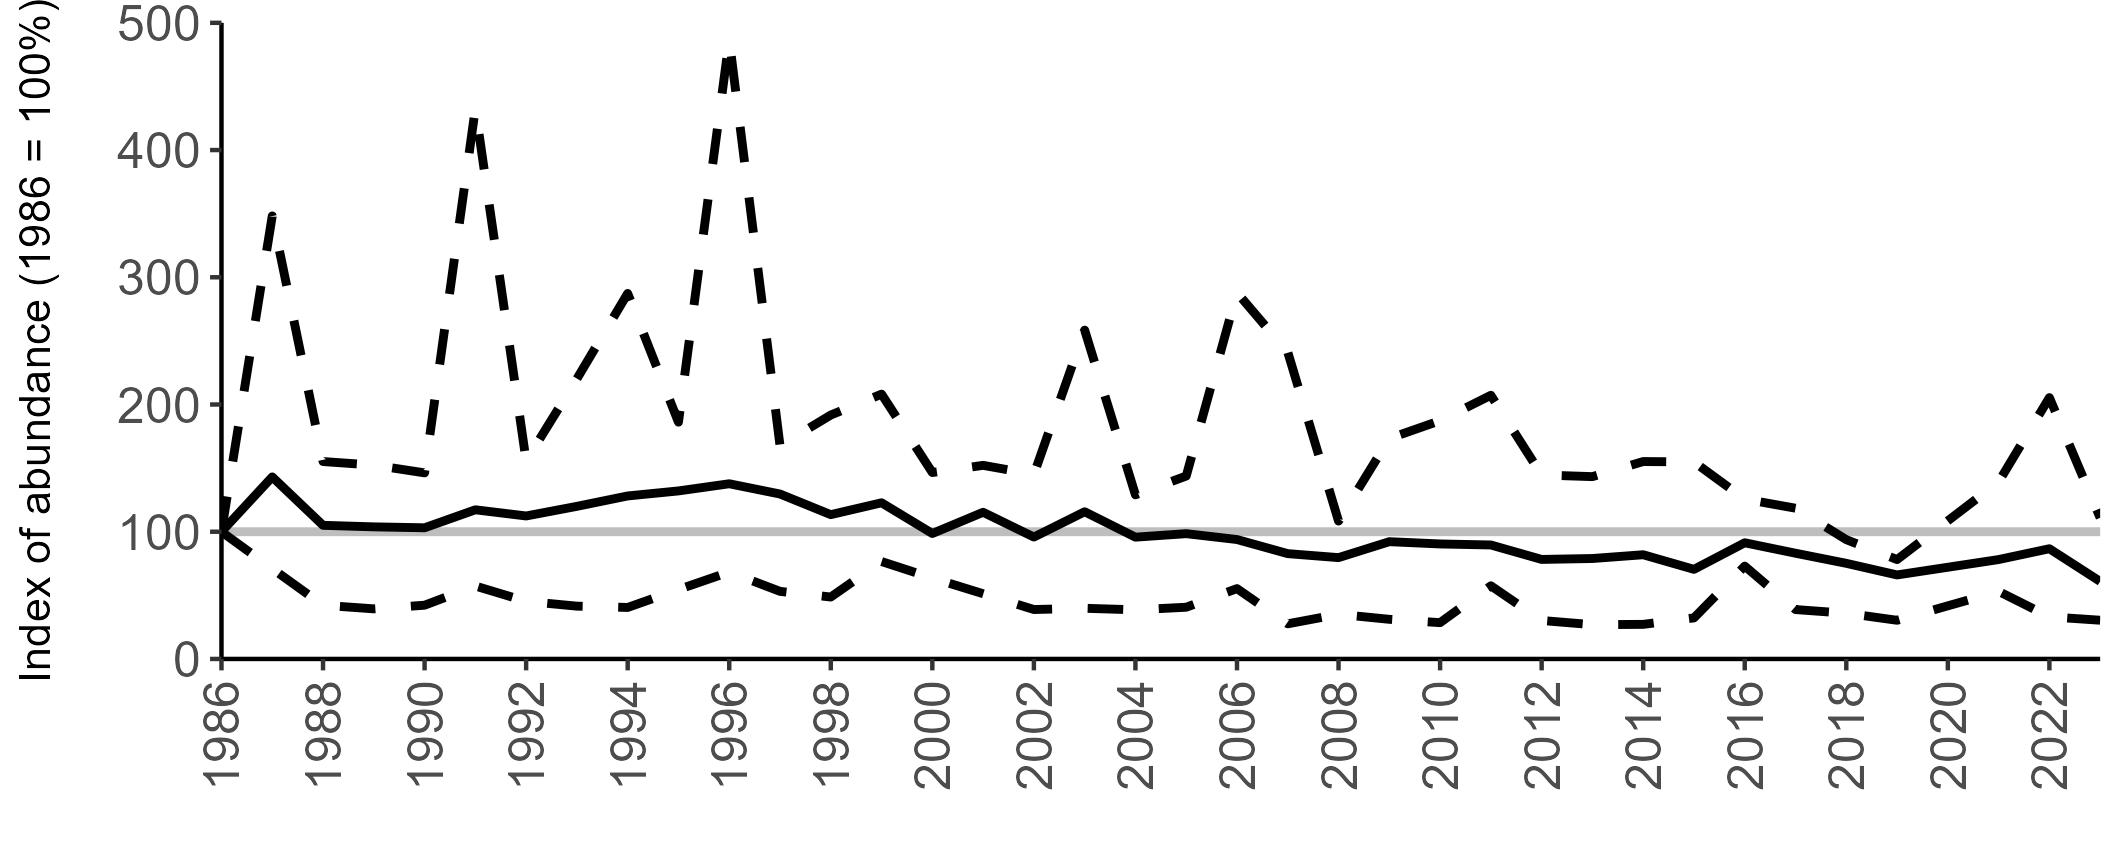
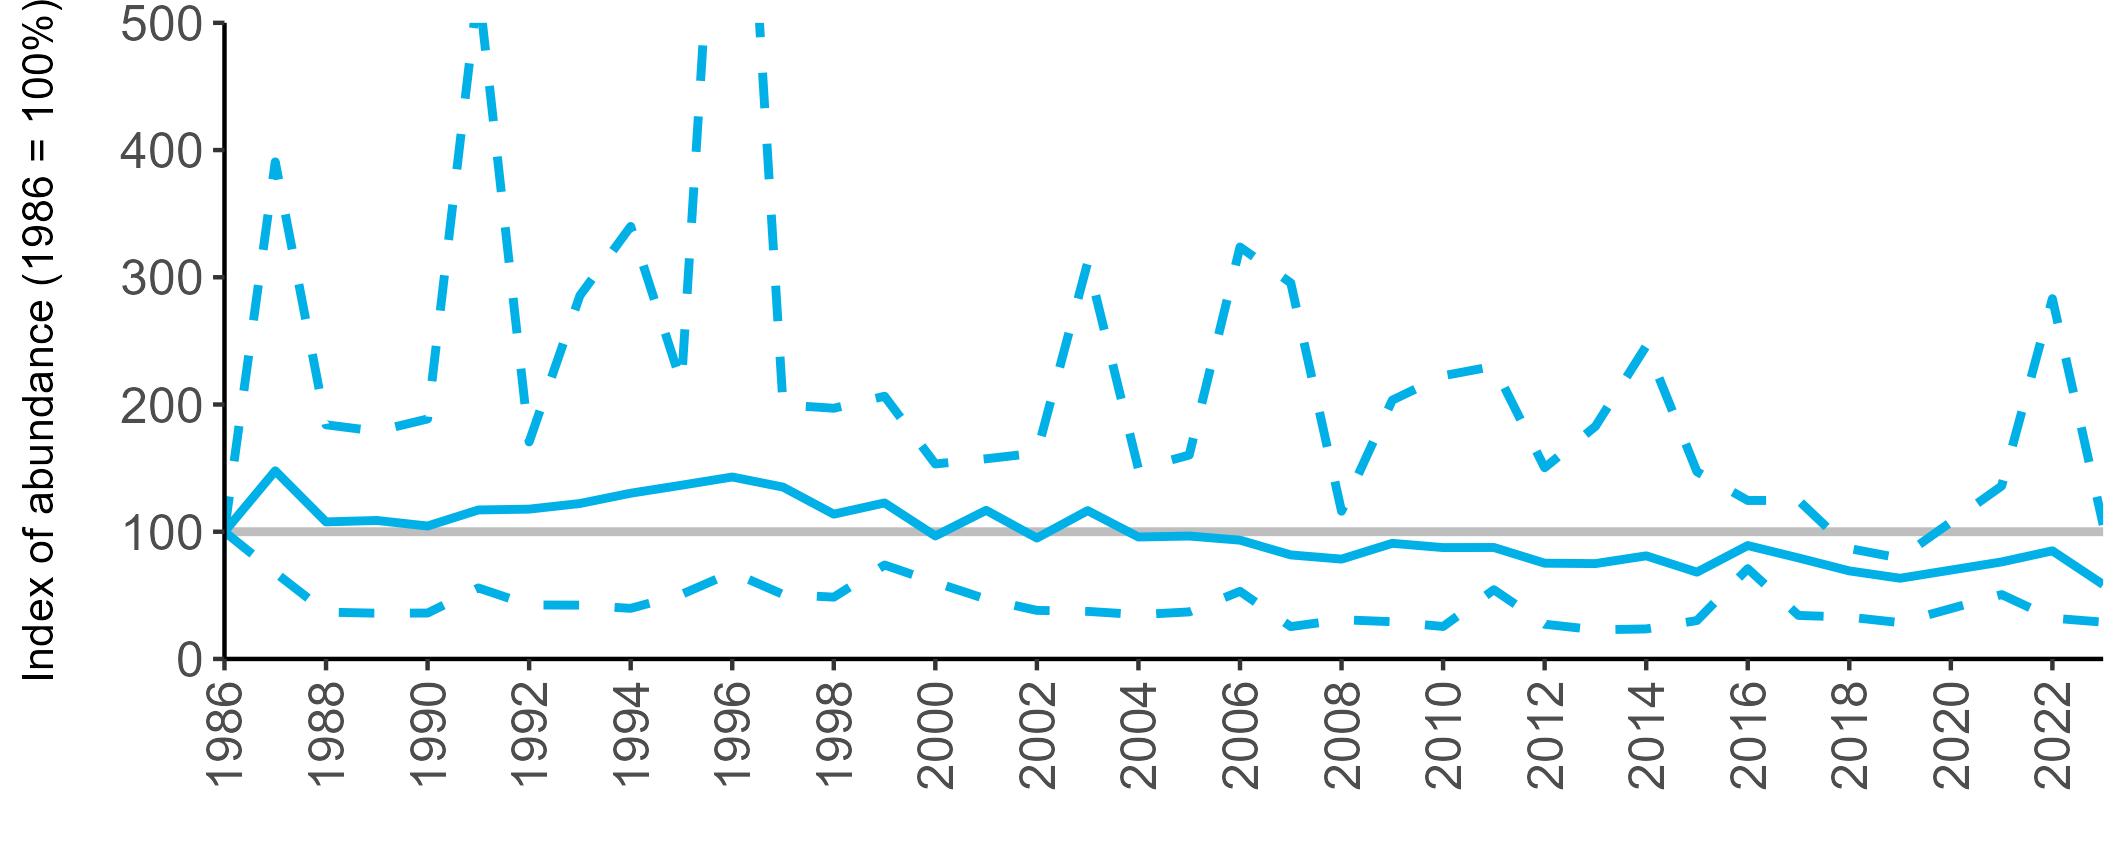
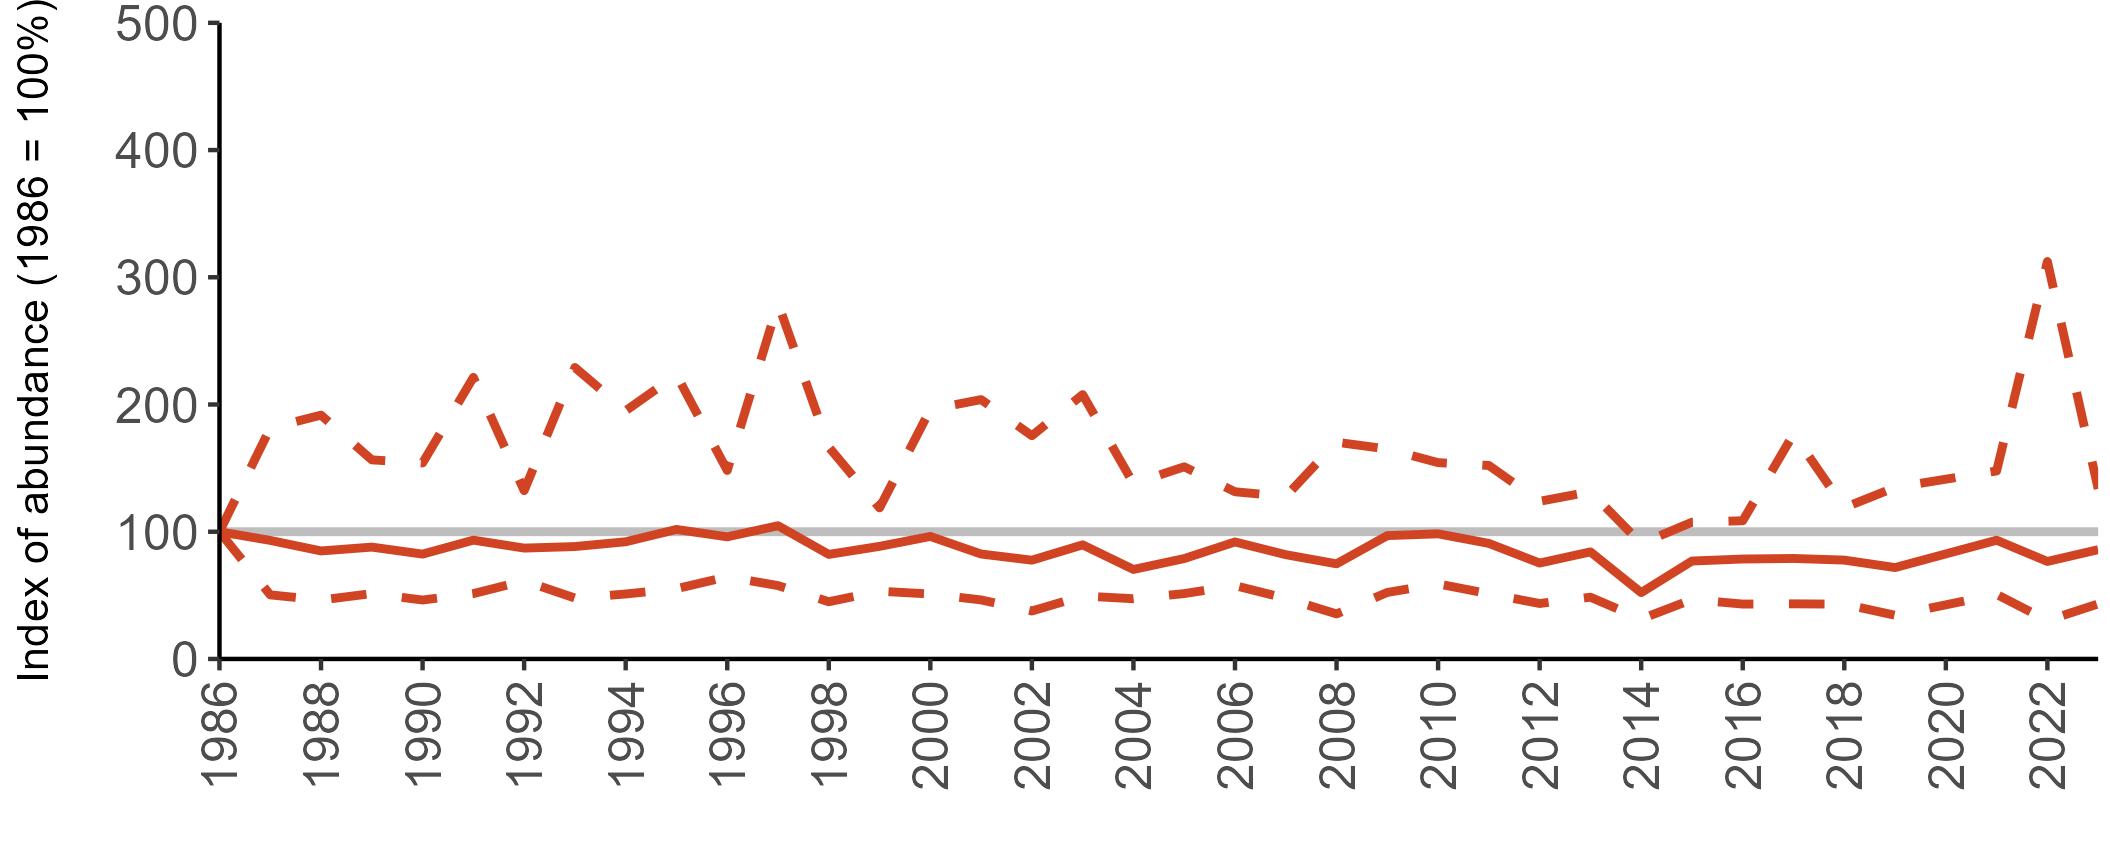
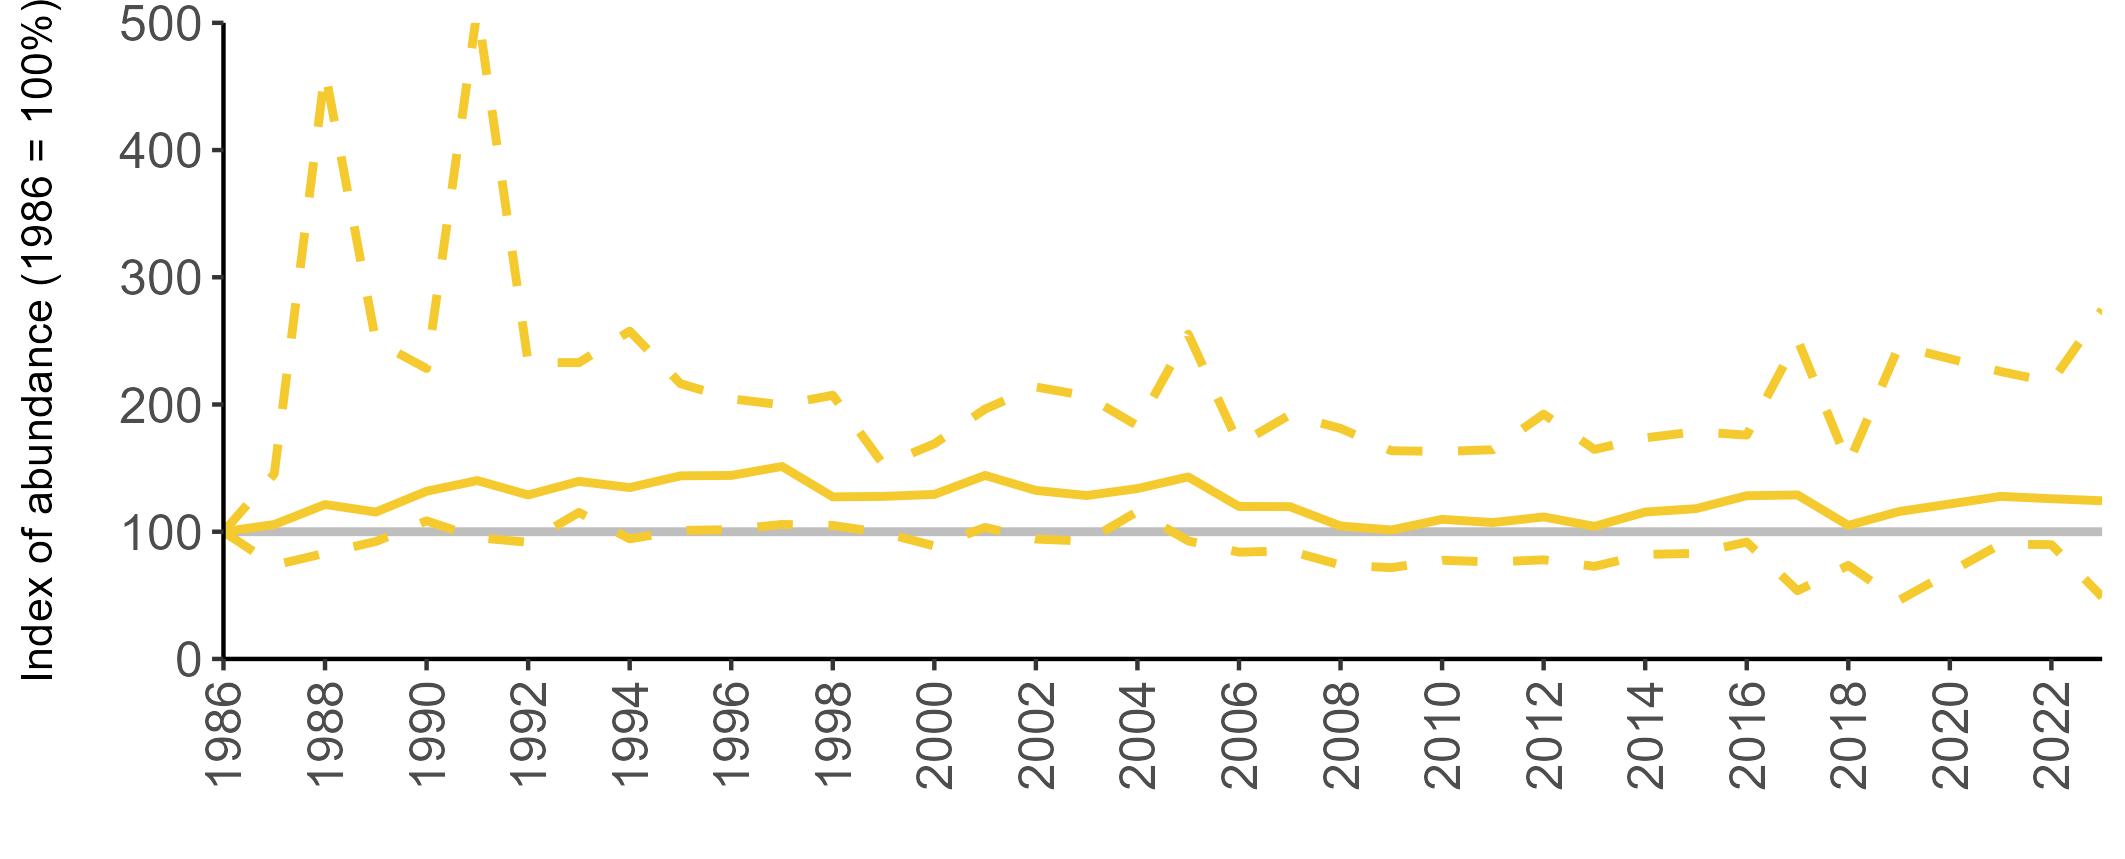
All SMP graphs are displayed in the same way throughout the report. The time period starts at 1986 (the SMP baseline year) and ends in 2023 and is illustrated on the x-axis. Please note that the index of abundance and productivity axes can vary in scale.
Example 3: SMP Breeding Abundance graphs
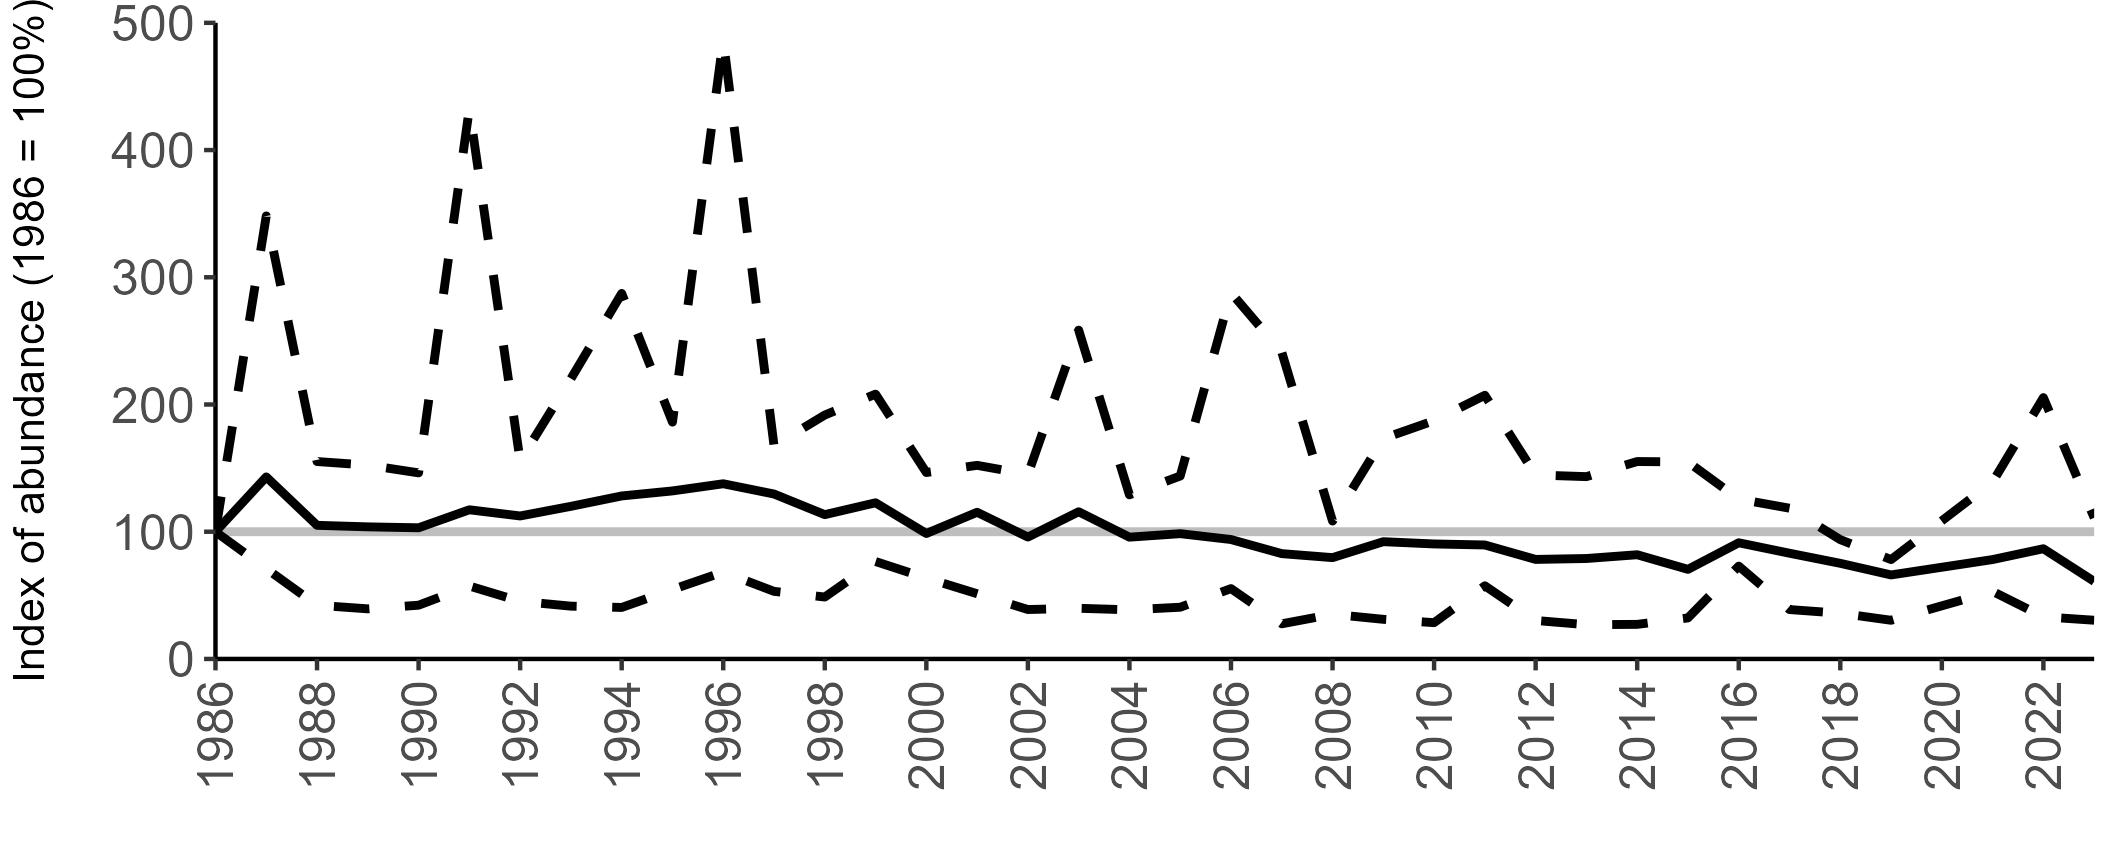
The region-specific abundance index graphs show:
• the abundance trend: solid black line linking values for individual years to illustrate the overall trend over time
• confidence intervals (95%): black dashed line
To make it easier to compare trends between species, breeding abundance is expressed as an 'index', set to 100
in the first year (1986), and shown across the monitoring period by a grey solid line.
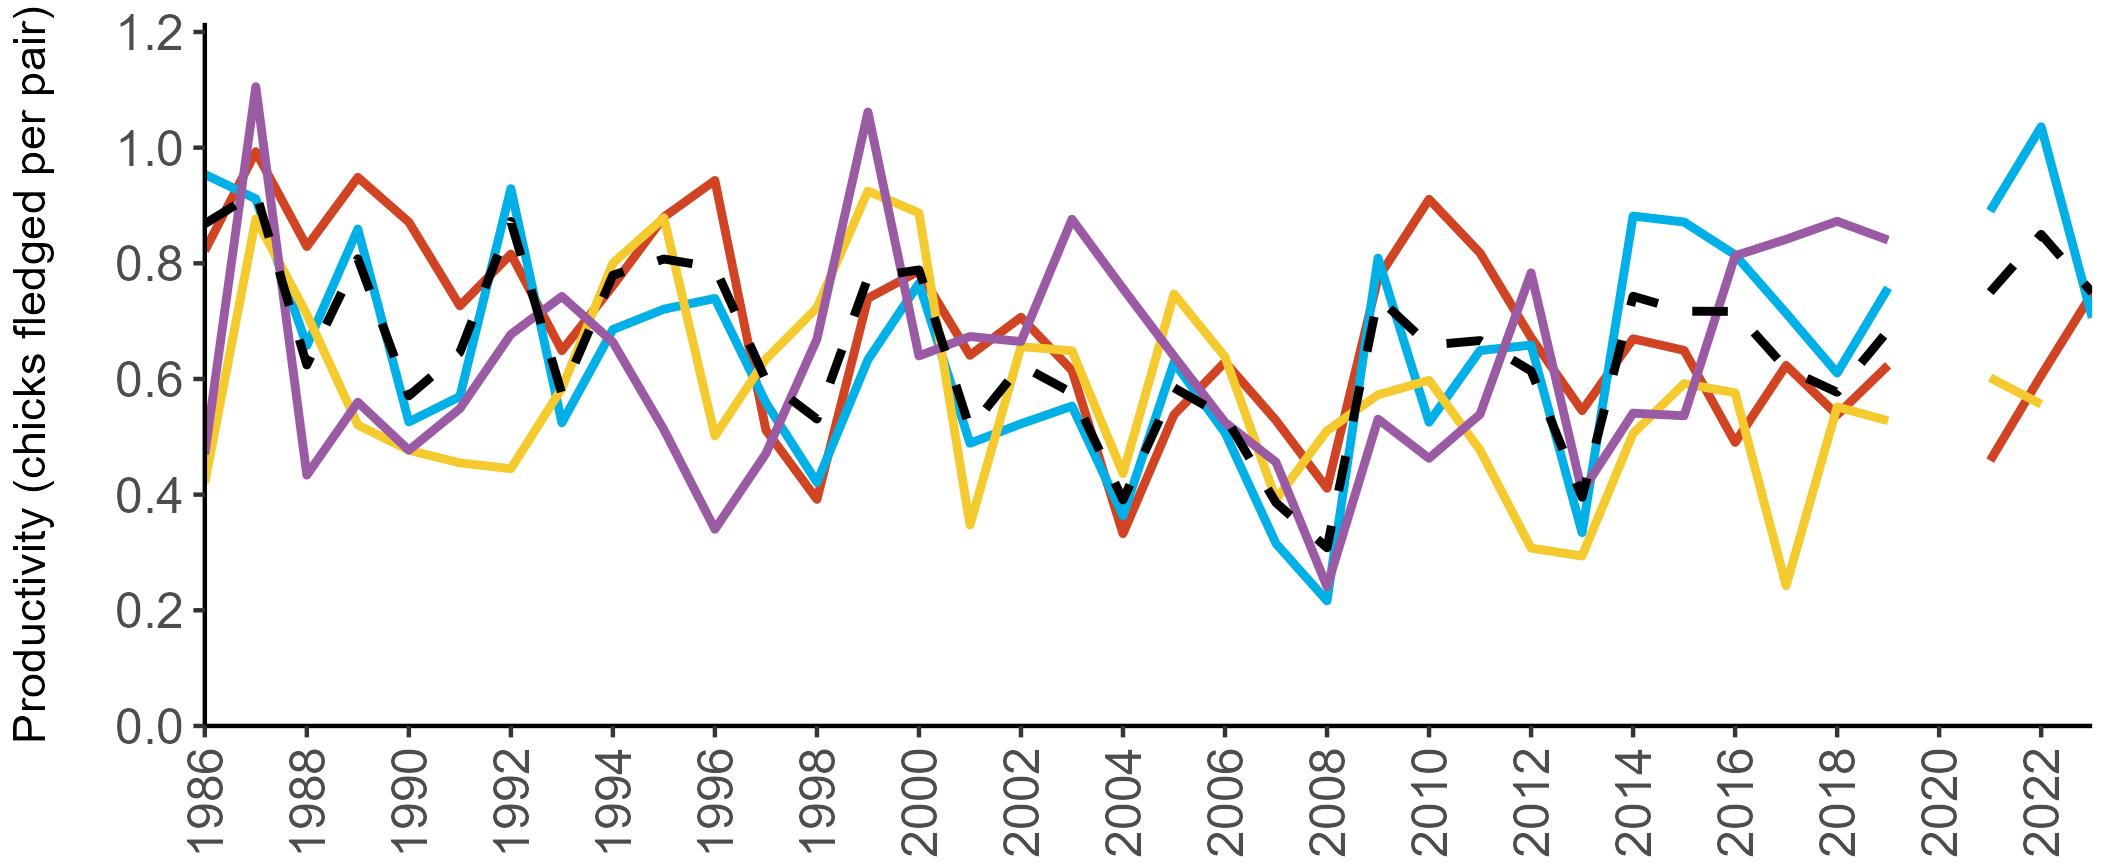
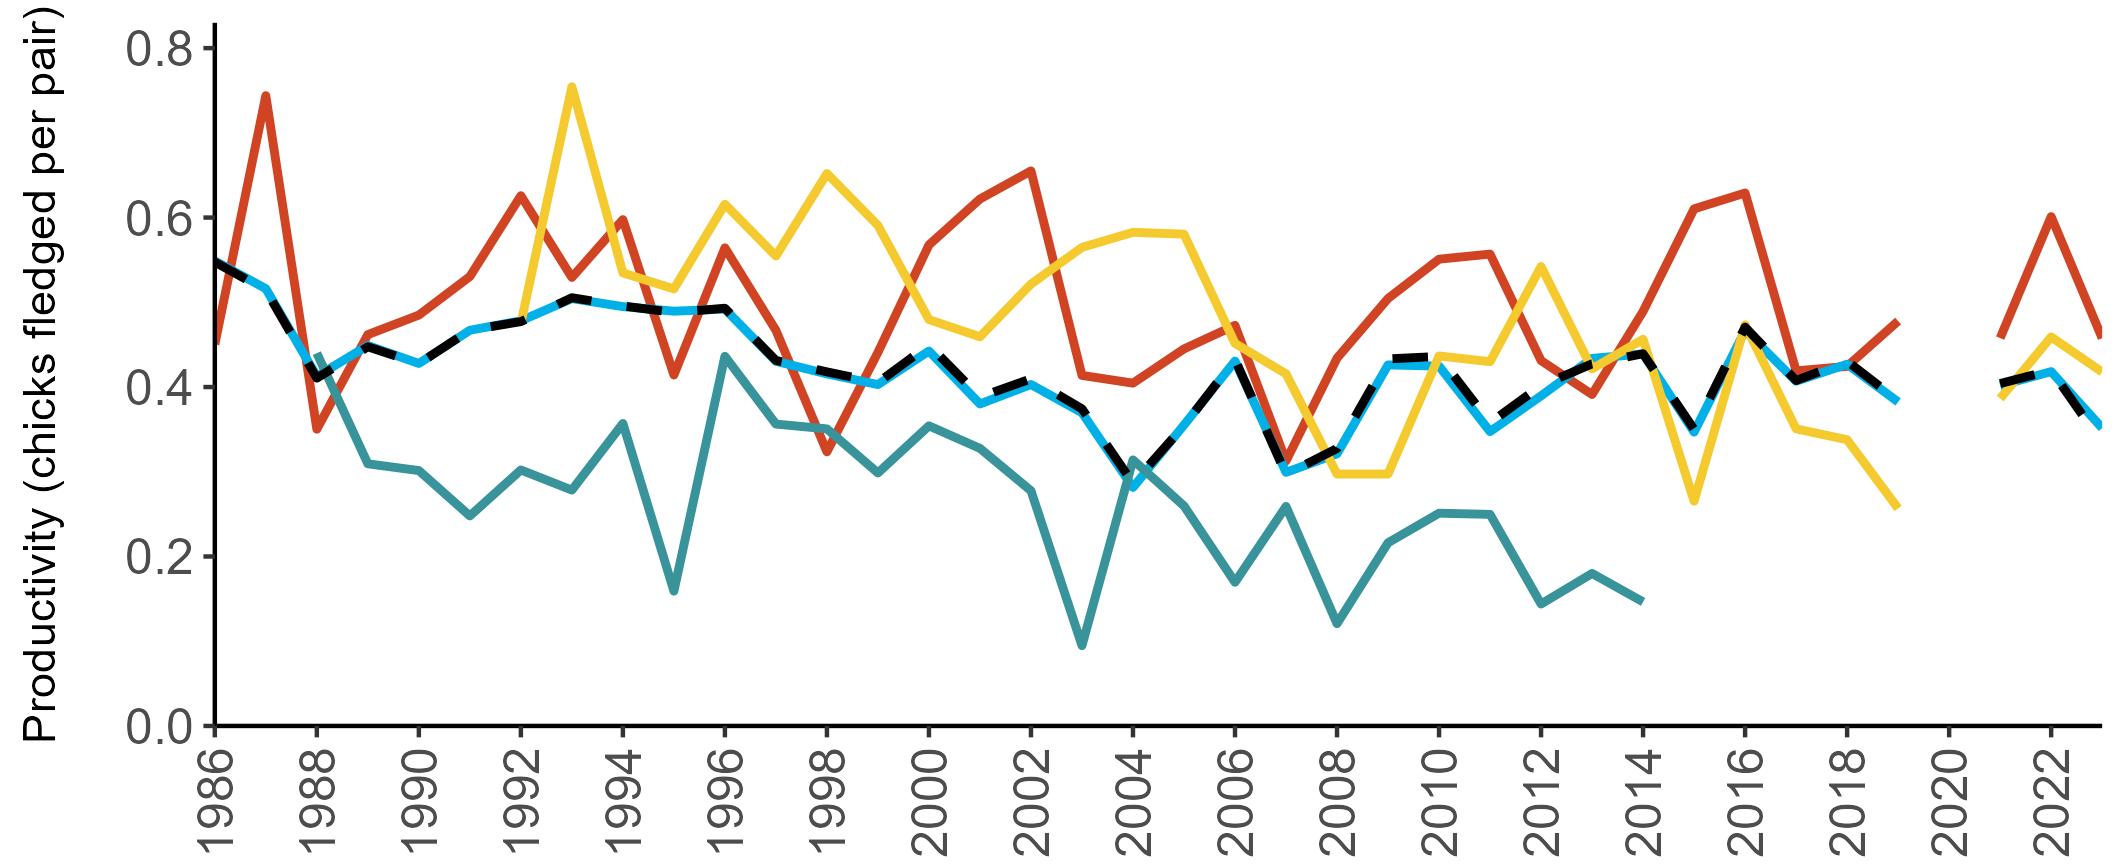
Example 4: SMP Productivity graphs
Multi-country productivity index graphs show the productivity estimates as a dotted line for the UK, with a solid line for each county and ‘all-Ireland’.
This figure is used to illustrate the trend in productivity values over the SMP time period, and also to show where the trends differ between regions, either in their direction or timing.
Due to restricted coverage during the COVID -19 pandemic in 2020 and limited coverage for some species in some years, occasional gaps in productivity results may feature for a given year.

Trends Explorer: The Bird Trends Explorer is an interactive tool for exploring how bird abundance and other key measures of bird population health are changing through time in the UK and constituent countries. The Bird Trends Explorer accompanies BTO BirdFacts, which provides key information about biology, distribution, phenology, trends and conservation of UK bird species.
Visit: https://data.bto.org/trends_explorer
A summary of all seabird species monitored by the SMP follows. This includes survey coverage maps, status, species information, breeding abundance and productivity trends (where possible), causes of change and conservation initiatives.
Please refer to the Interpreting the results pages (18—21) for this section.
Fulmarus glacialis

c.11%
ssp. glacialis
Amber-listed
Amber-listed (I)
Least Concern

Abundance: Decline
Productivity: 0.34
Colony Count sites: 224
Breeding Success sites: 33
Lifespan: 44 years
Breeding age: 9 years

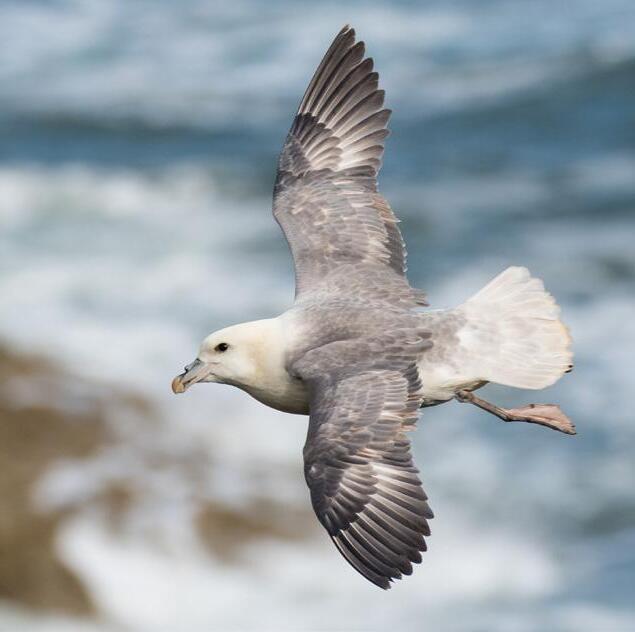
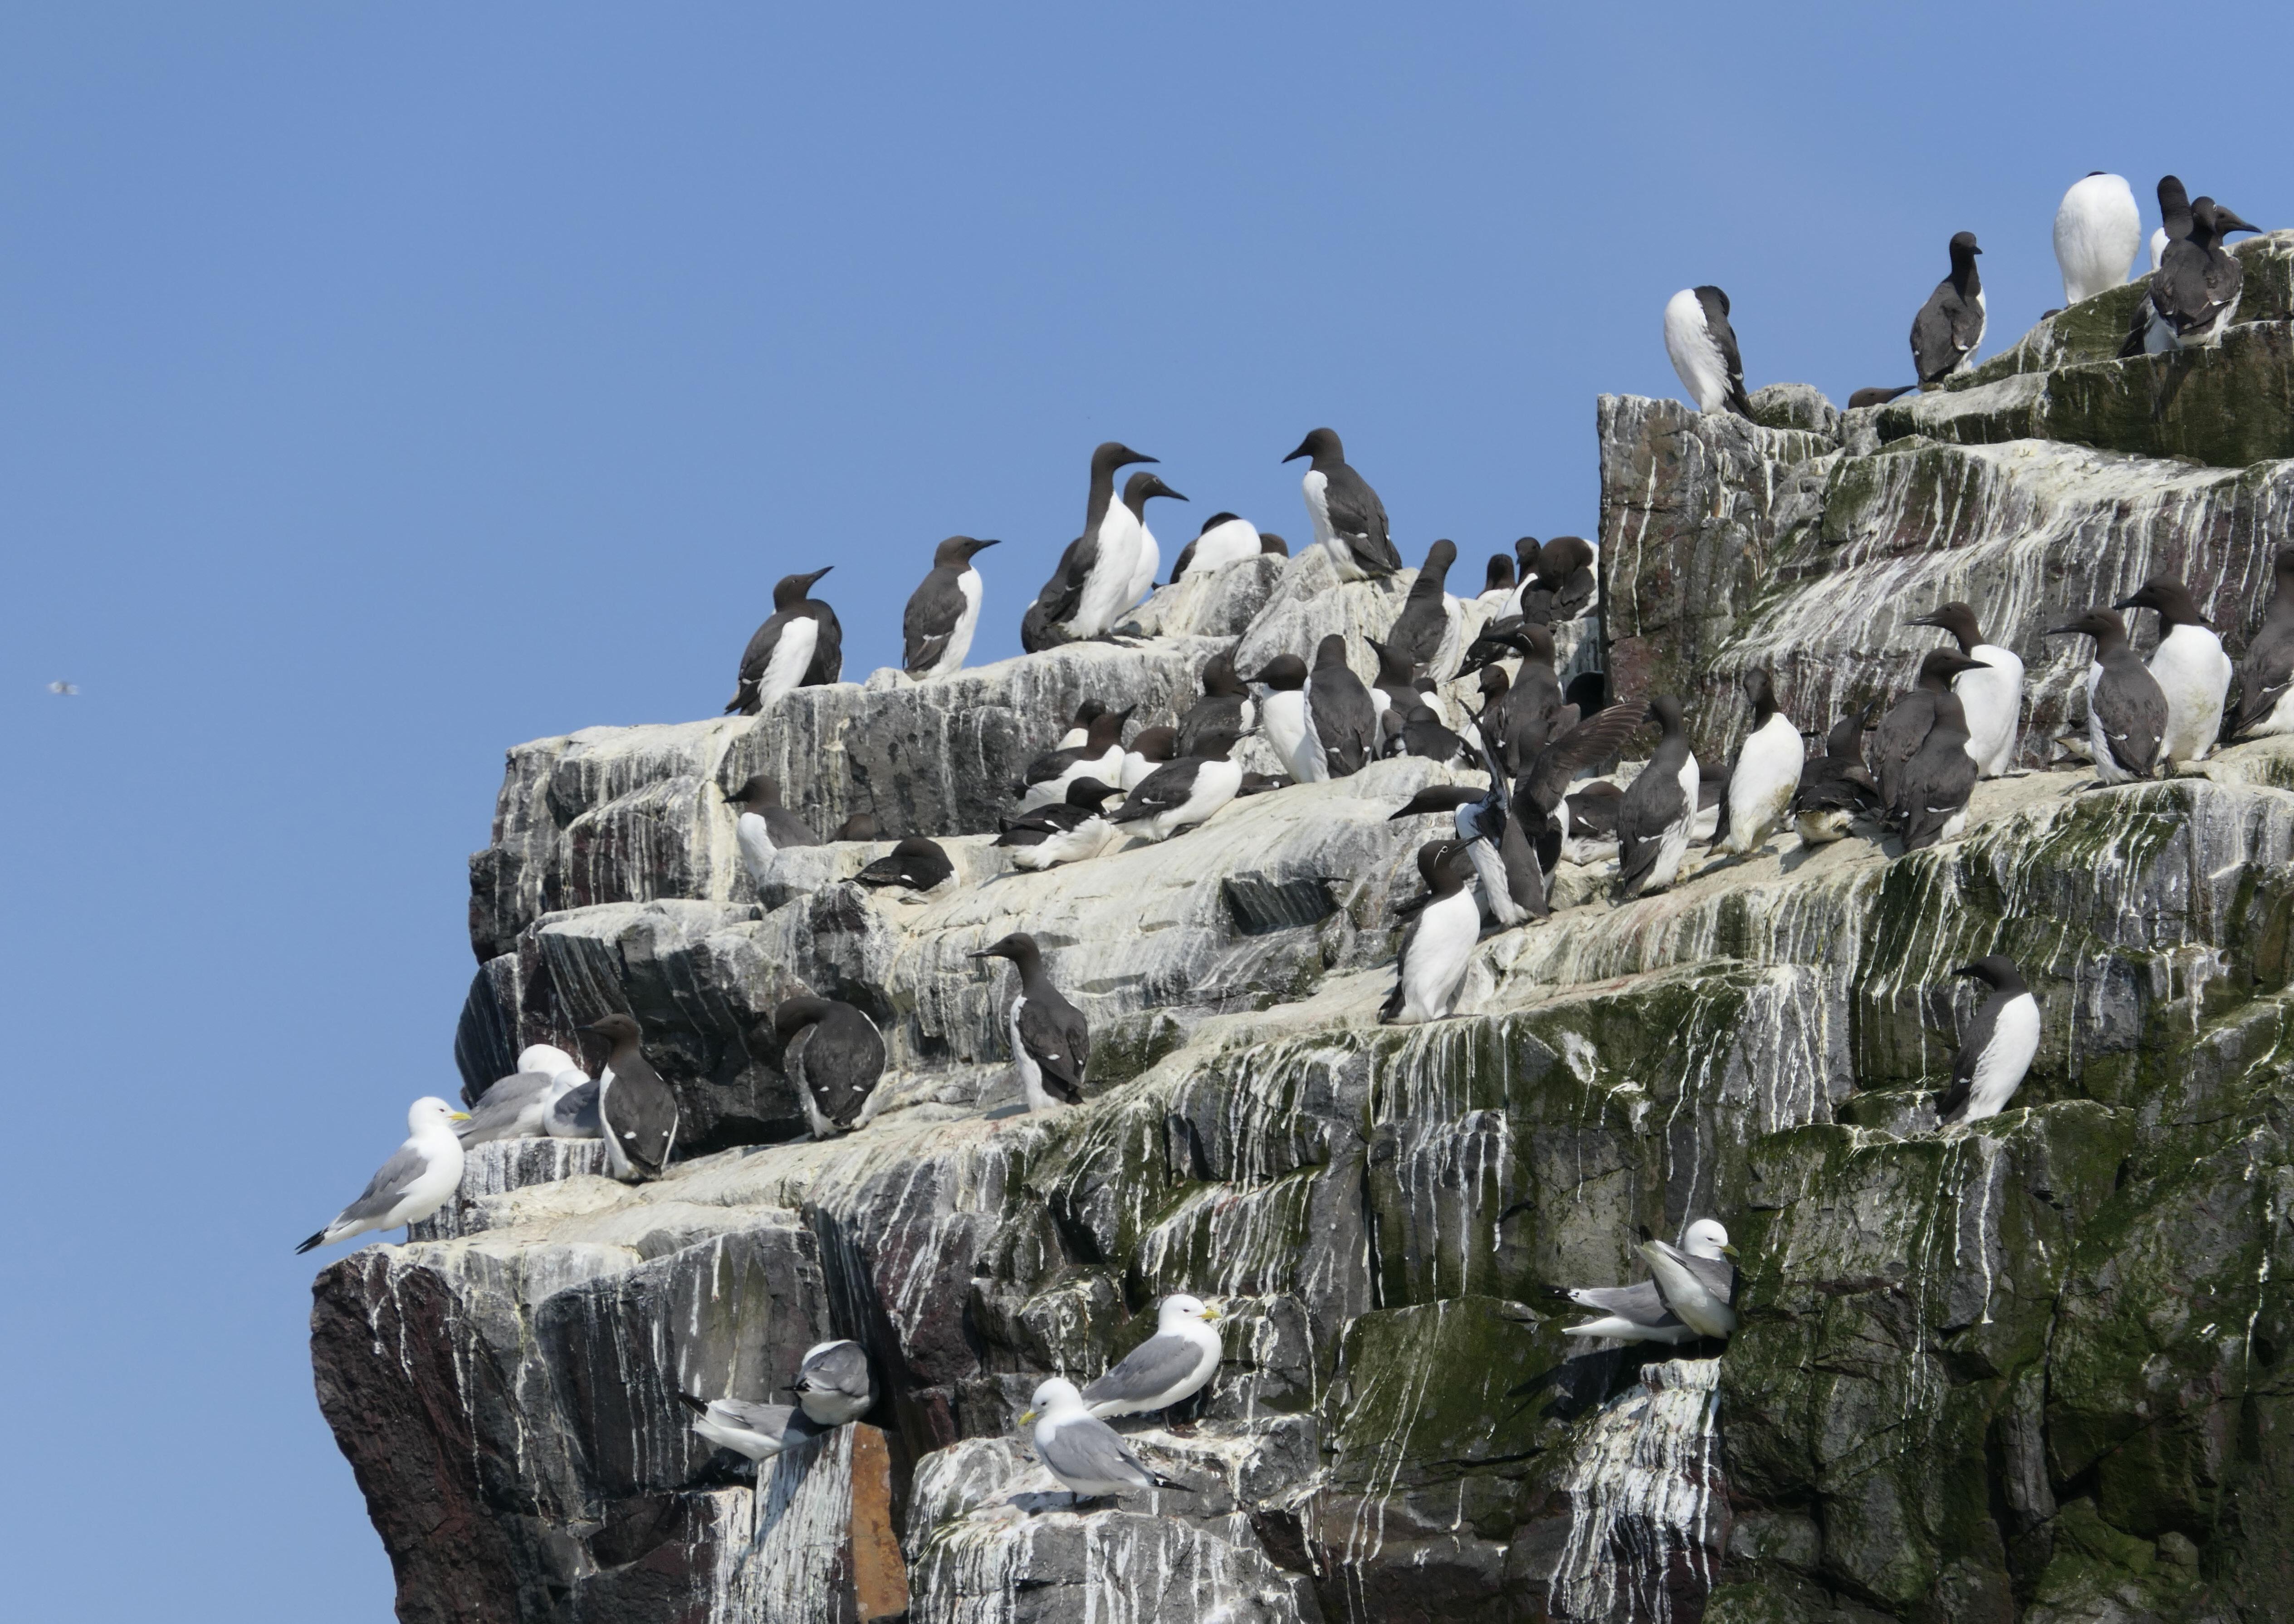
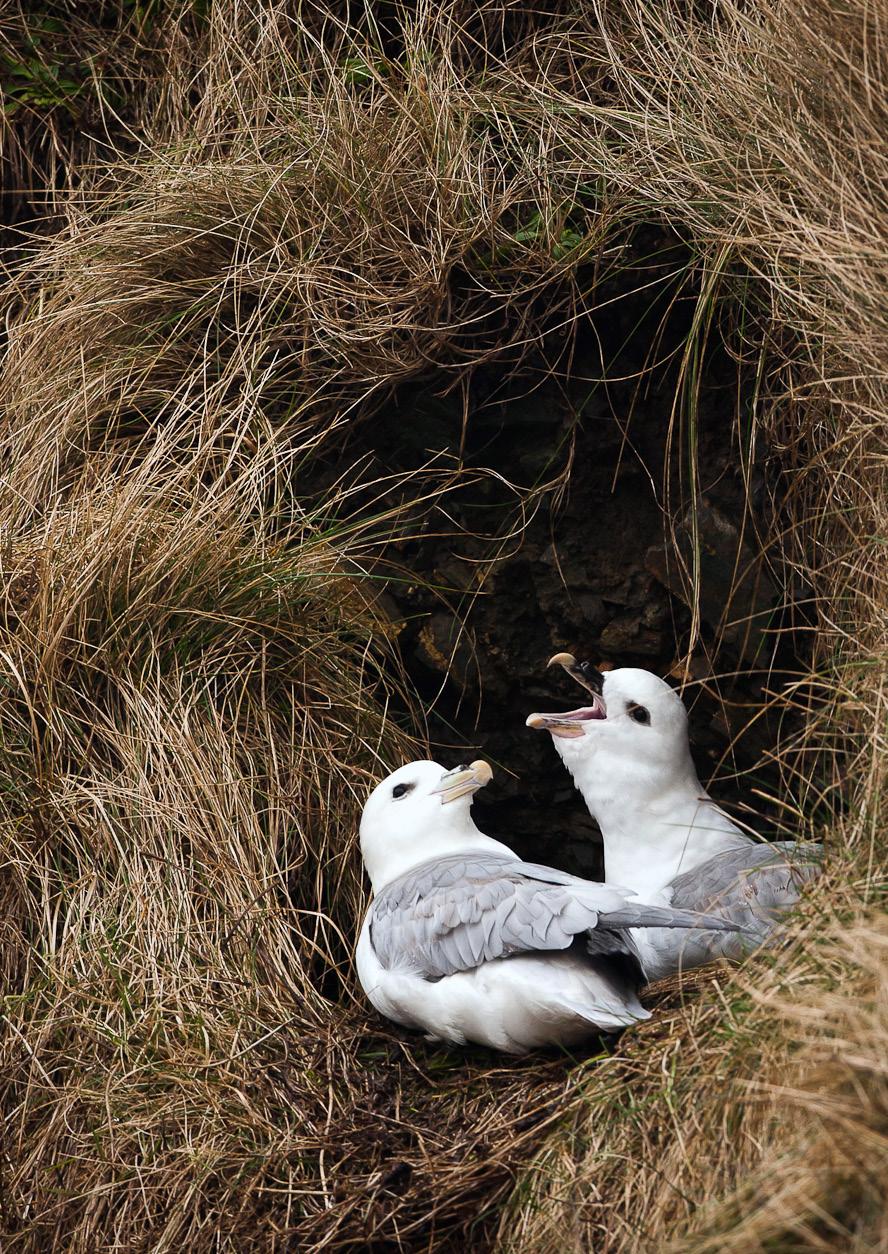
Britain and Ireland host 5% of the world’s breeding Fulmar but around 11% of the subspecies glacialis (Burnell et al. 2023). They have two colour morphs; one pale and most often encountered around the UK, and the other dark. The latter, referred to as a ‘blue Fulmar’, is grey all over, and more prevalent in colonies in the high Arctic (Van Franeker & Wattel 1982).
Within Britain and Ireland, Fulmars were originally restricted to the remote archipelago of St Kilda (Scotland), but the breeding population spread rapidly in the 20th century and they are now found breeding around much of the British and Irish coastline (Burnell et al. 2023; Balmer et al. 2013). An increase in fishery discards at the time has been suggested as one reason for their expansion (Fisher 1952; Bicknell et al. 2013; Cordes et al. 2015).
Globally, Fulmar are found across the North Atlantic and North Pacific, ranging from the UK to Japan in their southern range, and extending north to the high Arctic (BirdLife International 2024).
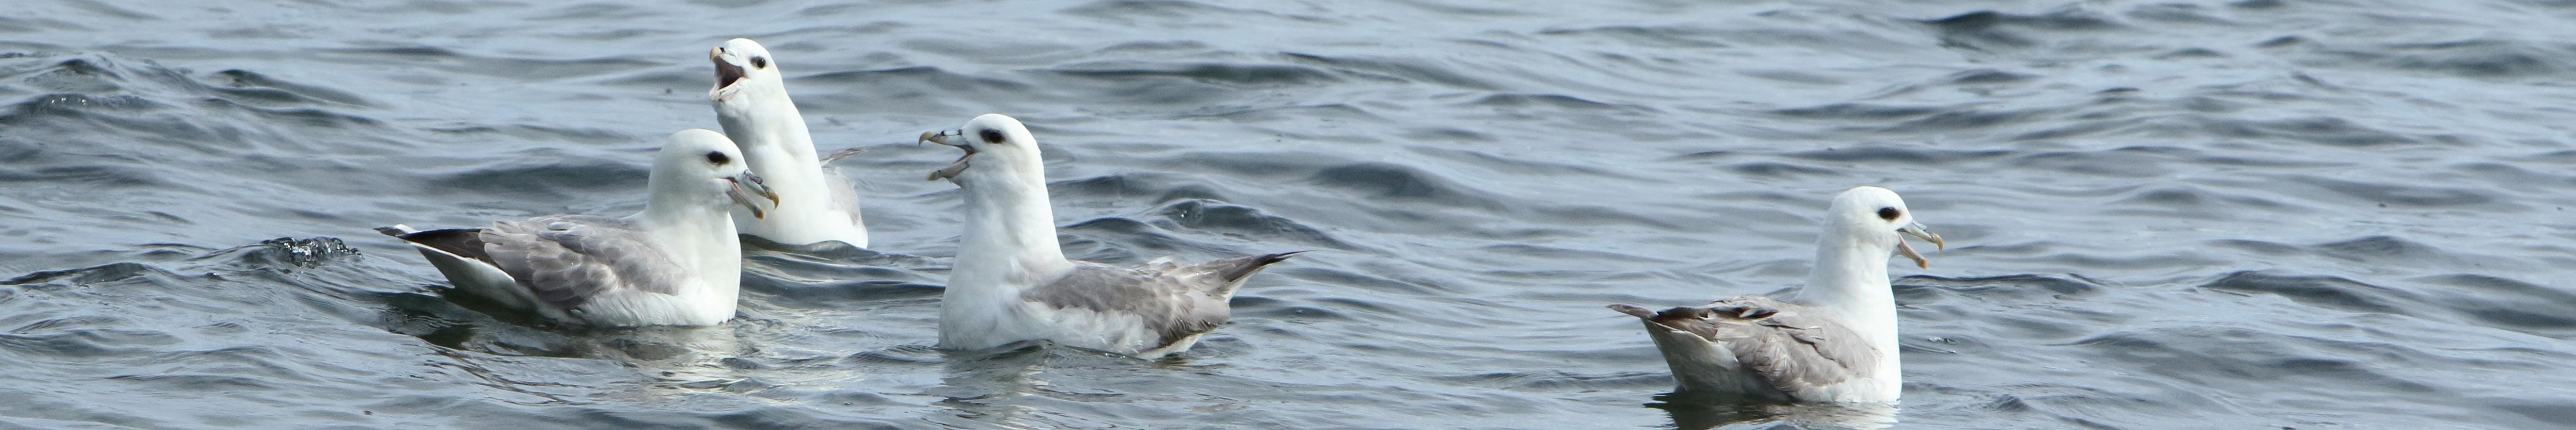
The population in Britain and Ireland has no pronounced migration and birds are present offshore during the winter (Quinn et al. 2016).
Fulmar are predominantly surface feeders (Garthe & Furness 2001) and feed on sandeels and zooplankton, but also scavenge on fishery discards
(Fisher 1952; Phillips et al. 1999; Bicknell et al. 2013; Darby et al. 2021).
BREEDING
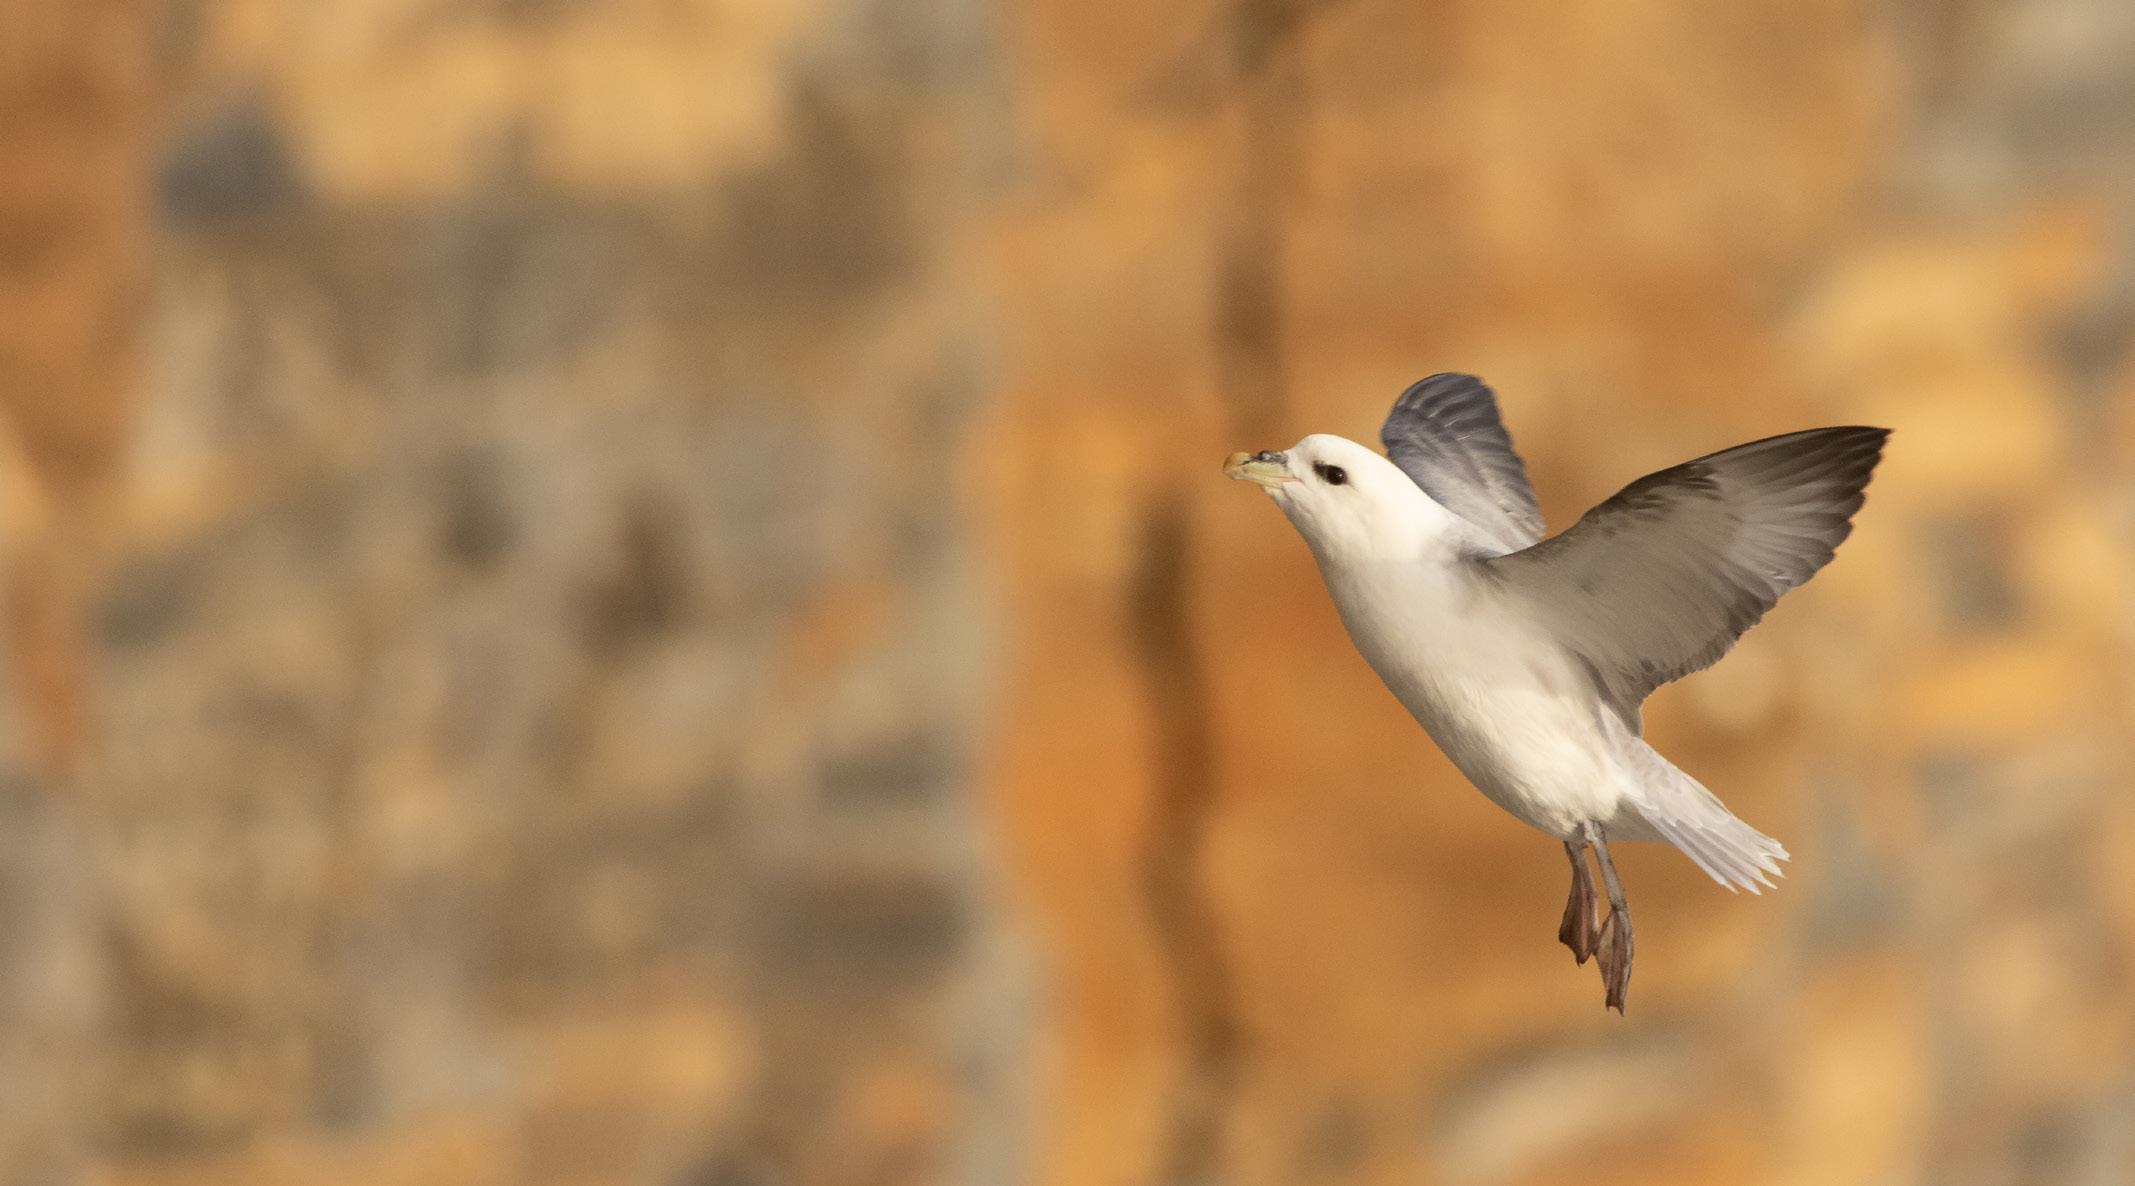
Typically, Fulmars nest on cliffs but will also nest on gentle slopes, under boulders, in the entrance to Puffin burrows, at the base of dry-stone walls or in sand dunes. Nest site opportunities increase on mammalian predator free islands (Anderson 1982; Mitchell et al. 2004).
BREEDING ABUNDANCE
The declines in Fulmar SMP abundance trends since 2000 (Table 3) are largely in agreement with those reported by the Seabirds Count census, with the exception of Wales (Burnell et al. 2023). The decline of 38% at the UK level recorded by the SMP between 2000 and 2023 is similar to the decline of 37% (UK) recorded by the Seabirds Count census since Seabird 2000. For England and Scotland, the SMP trends showed declines of 11% and 40%, respectively, since 2000, whilst the Seabirds Count census reported declines of 22% (England) and 37% (Scotland) since Seabird 2000. For Wales, the SMP
data shows a stable trend, whilst the Seabirds Count census showed a decline of 27% since the Seabird 2000 census (Burnell et al. 2023).
Regional variation has occurred in Fulmar SMP abundance trends since 1986 (Figures 5–8). Across most regions, Fulmar trends generally increased between 1986 and the mid 1990s. However, the Scotland trend has since declined markedly. Given that Scotland holds the majority of the UK Fulmar population, the SMP Fulmar trend for the UK as a whole closely matches that for Scotland.
In the UK and Scotland, after the previous lowest SMP index values in 2019 (of -37% and -42%, respectively) since 1986, the index for 2022 increased slightly to 13% (UK) and 15% (Scotland) below the baseline. However, in 2023, index values again declined to lows of 39% (UK) and 42% (Scotland) below the baseline (Table 3). After the mid 1990s, the abundance trend for Wales has fluctuated between periods of stability and noticeable declines, specifically after 2005 and 2017, whilst the trend for England has been relatively stable.
Abundance (AOS) Seabird 2000 (1998—2002)
All Britain, Ireland, Isle of Man and Channel Islands
The Seabirds Count census also showed declines in Fulmar populations for Northern Ireland, the Isle of Man and the Channel Islands, and a stable population for the Republic of Ireland (Burnell et al. 2023). Unfortunately, current data submitted to the SMP for these regions are too sparse to produce SMP abundance trends.
Considerable variation has occurred in Fulmar productivity trends across the regions monitored (Figure 9).
Abundance (AOS) Seabirds Count (2015—21)
The productivity trends for the UK and Scotland are relatively stable and follow each other closely, as much of the data have been collected in Scotland across the SMP monitoring period (since 1986). The trends for England and Wales have fluctuated more widely between years. In Wales this is likely to be a result of fewer colonies being monitored on an annual basis. Mean productivity estimates were relatively similar for the UK, Scotland, England and Wales in 2023 (ranging between 0.34 and
0.46 chicks fledged per pair; Table 3). However, these 2023 productivity estimates were lower than those recorded in 2022 (range: 0.42–0.60; Figure 9), especially for England where 0.60 chicks fledged per pair in 2022 compared to 0.46 in 2023, whilst 0.42 chicks fledged per pair at the UK level in 2022 compared to 0.34 in 2023.
Monitoring of productivity has been low on the Isle of Man throughout the SMP period and no data have
Wales
been submitted since 2014. Too few data are submitted to the SMP on productivity of Fulmars in other regions to calculate any meaningful average productivity values. However, sites with data in Northern Ireland are included within the UK level trend.
No data have been collected as part of the SMP.
There are a range of pressures Fulmar face, and as a long-lived species, reaching breeding maturity at nine years and laying just one egg per season, populations are particularly vulnerable to pressures acting on adult survival rates and productivity (Burnell et al. 2023).
Fulmar have expanded and increased across their range over the last two centuries, potentially due in part to increases in fishery discards and food availability (Burg et al. 2003). With the recent banning of fisheries discards it is possible that populations might return to historic levels (Bicknell et al. 2013).
Accidental deaths due to bycatch by long-line fisheries in the Norwegian Sea and the North Atlantic (Northridge et
al. 2020) as well as in gillnets (Žydelis et al. 2013) are thought to be having a significant impact on populations. Data analysis on possible future trends identified that if these accidental deaths were stopped, the population could increase between 2 and 17% over a 25year period (Miles et al. 2020).
An increased frequency in extreme weather events has been shown to negatively influence breeding success in high arctic Canada, with egg or chick loss following storms (Mallory et al. 2009), and climate change-induced changes in sea surface temperatures have altered the distribution of Fulmar’s natural prey, such as sandeels, reducing prey availability during the breeding season (MacDonald et al. 2015). On the east coast of Scotland, changes in sea surface temperatures have also been shown to have a negative impact on Fulmar productivity (Burthe et al. 2014).
Plastic pollution is also a potential issue for Fulmars, with recent studies showing that 80–95% of Fulmars sampled in the UK and Svalbard had ingested at least one piece of plastic. These studies encompass historic records from 1980 to recent records from 2020 (Van Franeker et al. 2021; Collard et al. 2022). However, further research is needed to determine
whether this ingestion causes increased mortality (Kühn et al. 2020; Neumann et al. 2021).
Predation pressure by non-native mammalian species, such as American Mink (Neovison vison) (Craik 1997), and from the native White-tailed Eagle (Haliaeetus albicilla), numbers of which have increased since reintroductions started in the 1970s (Evans et al. 2009), also have the potential to have population level impacts on Fulmars, but further study is needed.
The invention and use of bird deterring technology for long-line fisheries has shown to be effective in reducing the accidental catching of Fulmar and other species. These systems include a bird-scaring streamer line, which provides a visual and physical deterrent across the fish bait lines and hooks before they sink (Løkkeborg & Robertson 2002).
As well as general measures to reduce the rate of climate change, Fulmars are likely to benefit from specific policies that aim to reduce pressure caused by other factors e.g. reduction or cessation of commercial fishing for important fisheries.
Amber-listed
Amber-listed (I)
Abundance: n/a
Productivity: 0.60
Colony Count sites: 12
Breeding Success sites: 3
Least concern Lifespan: 15 years
Breeding age: 5 years

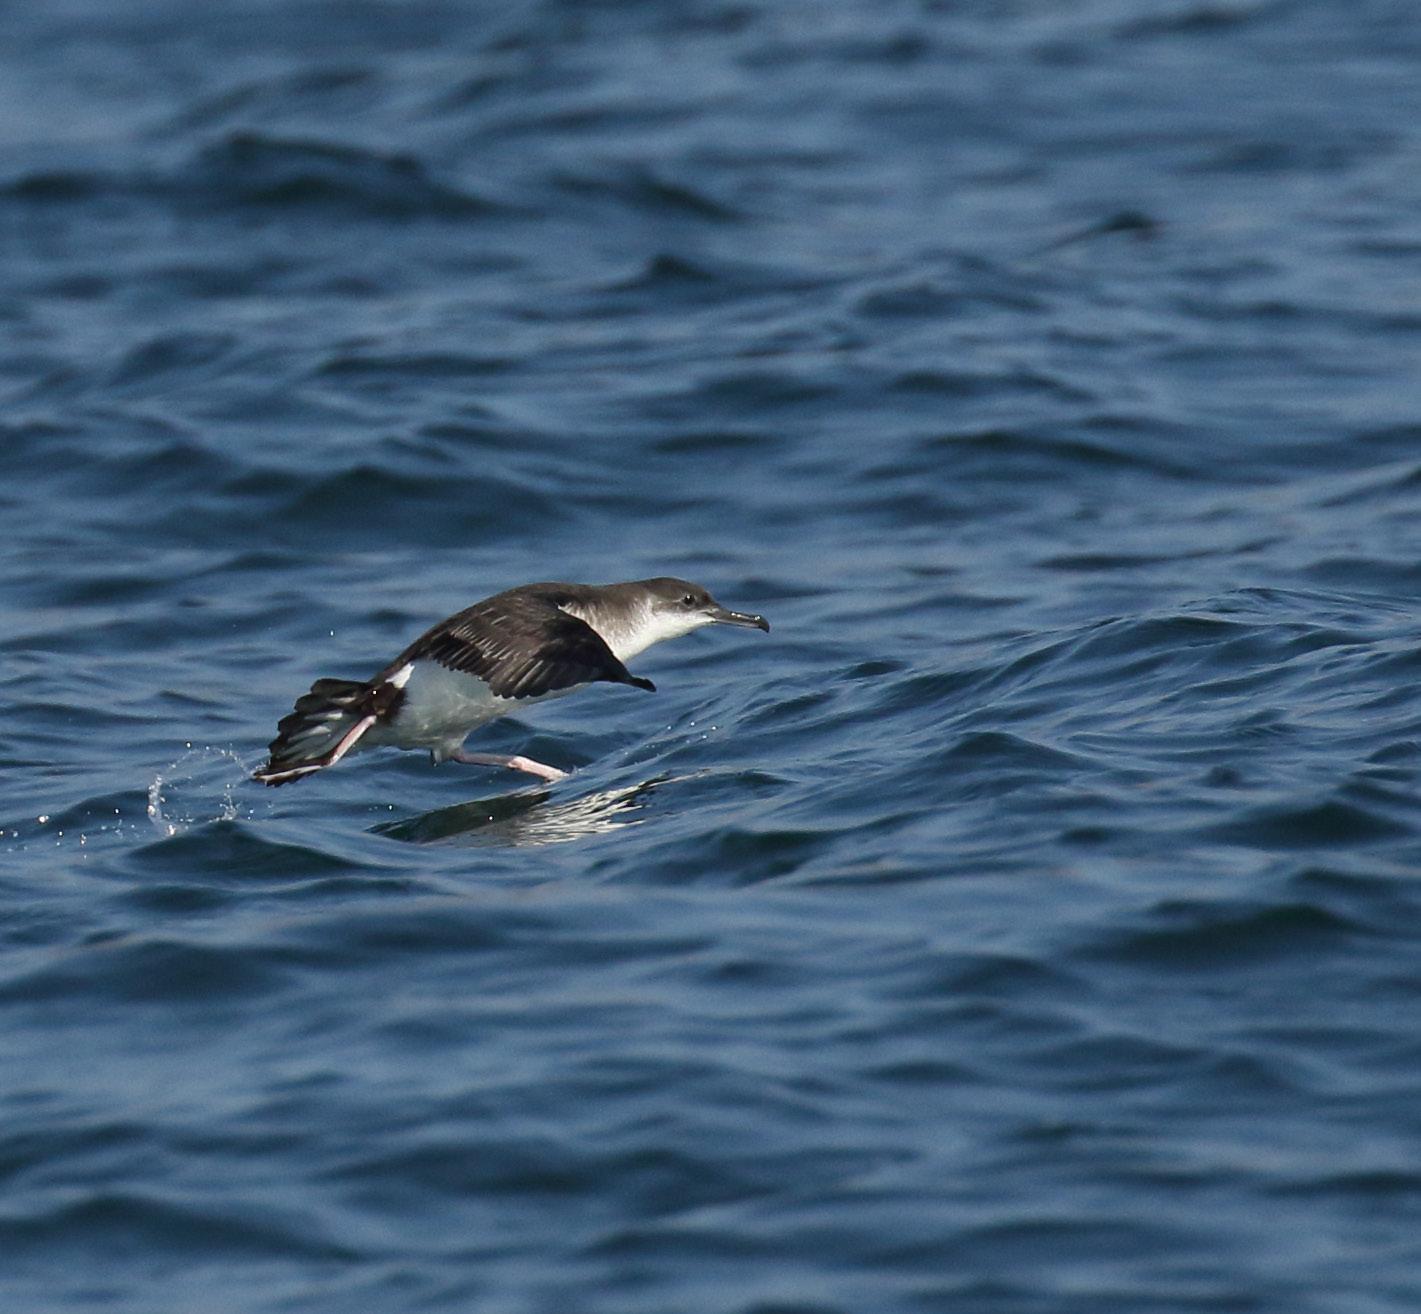
Britain and Ireland host approximately 96% of the world’s breeding population of Manx Shearwater (Burnell et al. 2023). Two island colonies, one on Skomer Island (Wales) and the other on Rum (Scotland), together host around 70% of Britain and Ireland’s breeding population (Burnell et al. 2023).
There are around 50 Manx Shearwater breeding colonies in Britain and Ireland (Burnell at al. 2023). They are all on offshore islands, mainly around the Irish Sea and Atlantic coasts. Manx Shearwaters are wide-ranging foragers and so can be seen offshore around the coast throughout the breeding season, only coming ashore to breed (BTO 2023a).
Globally, Manx Shearwaters also breed in Iceland, France, Spain, Portugal (the Azores and Madeira), Canada, the eastern United States of America, and the Faroe Islands (del Hoyo et al. 1992).
Individuals from the north-east Atlantic, including Britain and Ireland, undertake a clockwise migration of the Atlantic Ocean, migrating south along the west coast of Africa, crossing to Brazil at the narrowest section and overwintering at sites on the Patagonian Shelf off Argentina. They return to breed via the eastern Caribbean, circling near the eastern seaboard of North America before returning to the North Atlantic (Guildford et al. 2009).
Birds from the west coast of the Atlantic migrate there and back along the eastern seaboard of North and South America (Fayet et al. 2020).
Manx Shearwaters feed by plunging into the sea to depths of around 10 m, pursuing squid and small fish (Brooke 1990; Shoji et al. 2016).
BREEDING
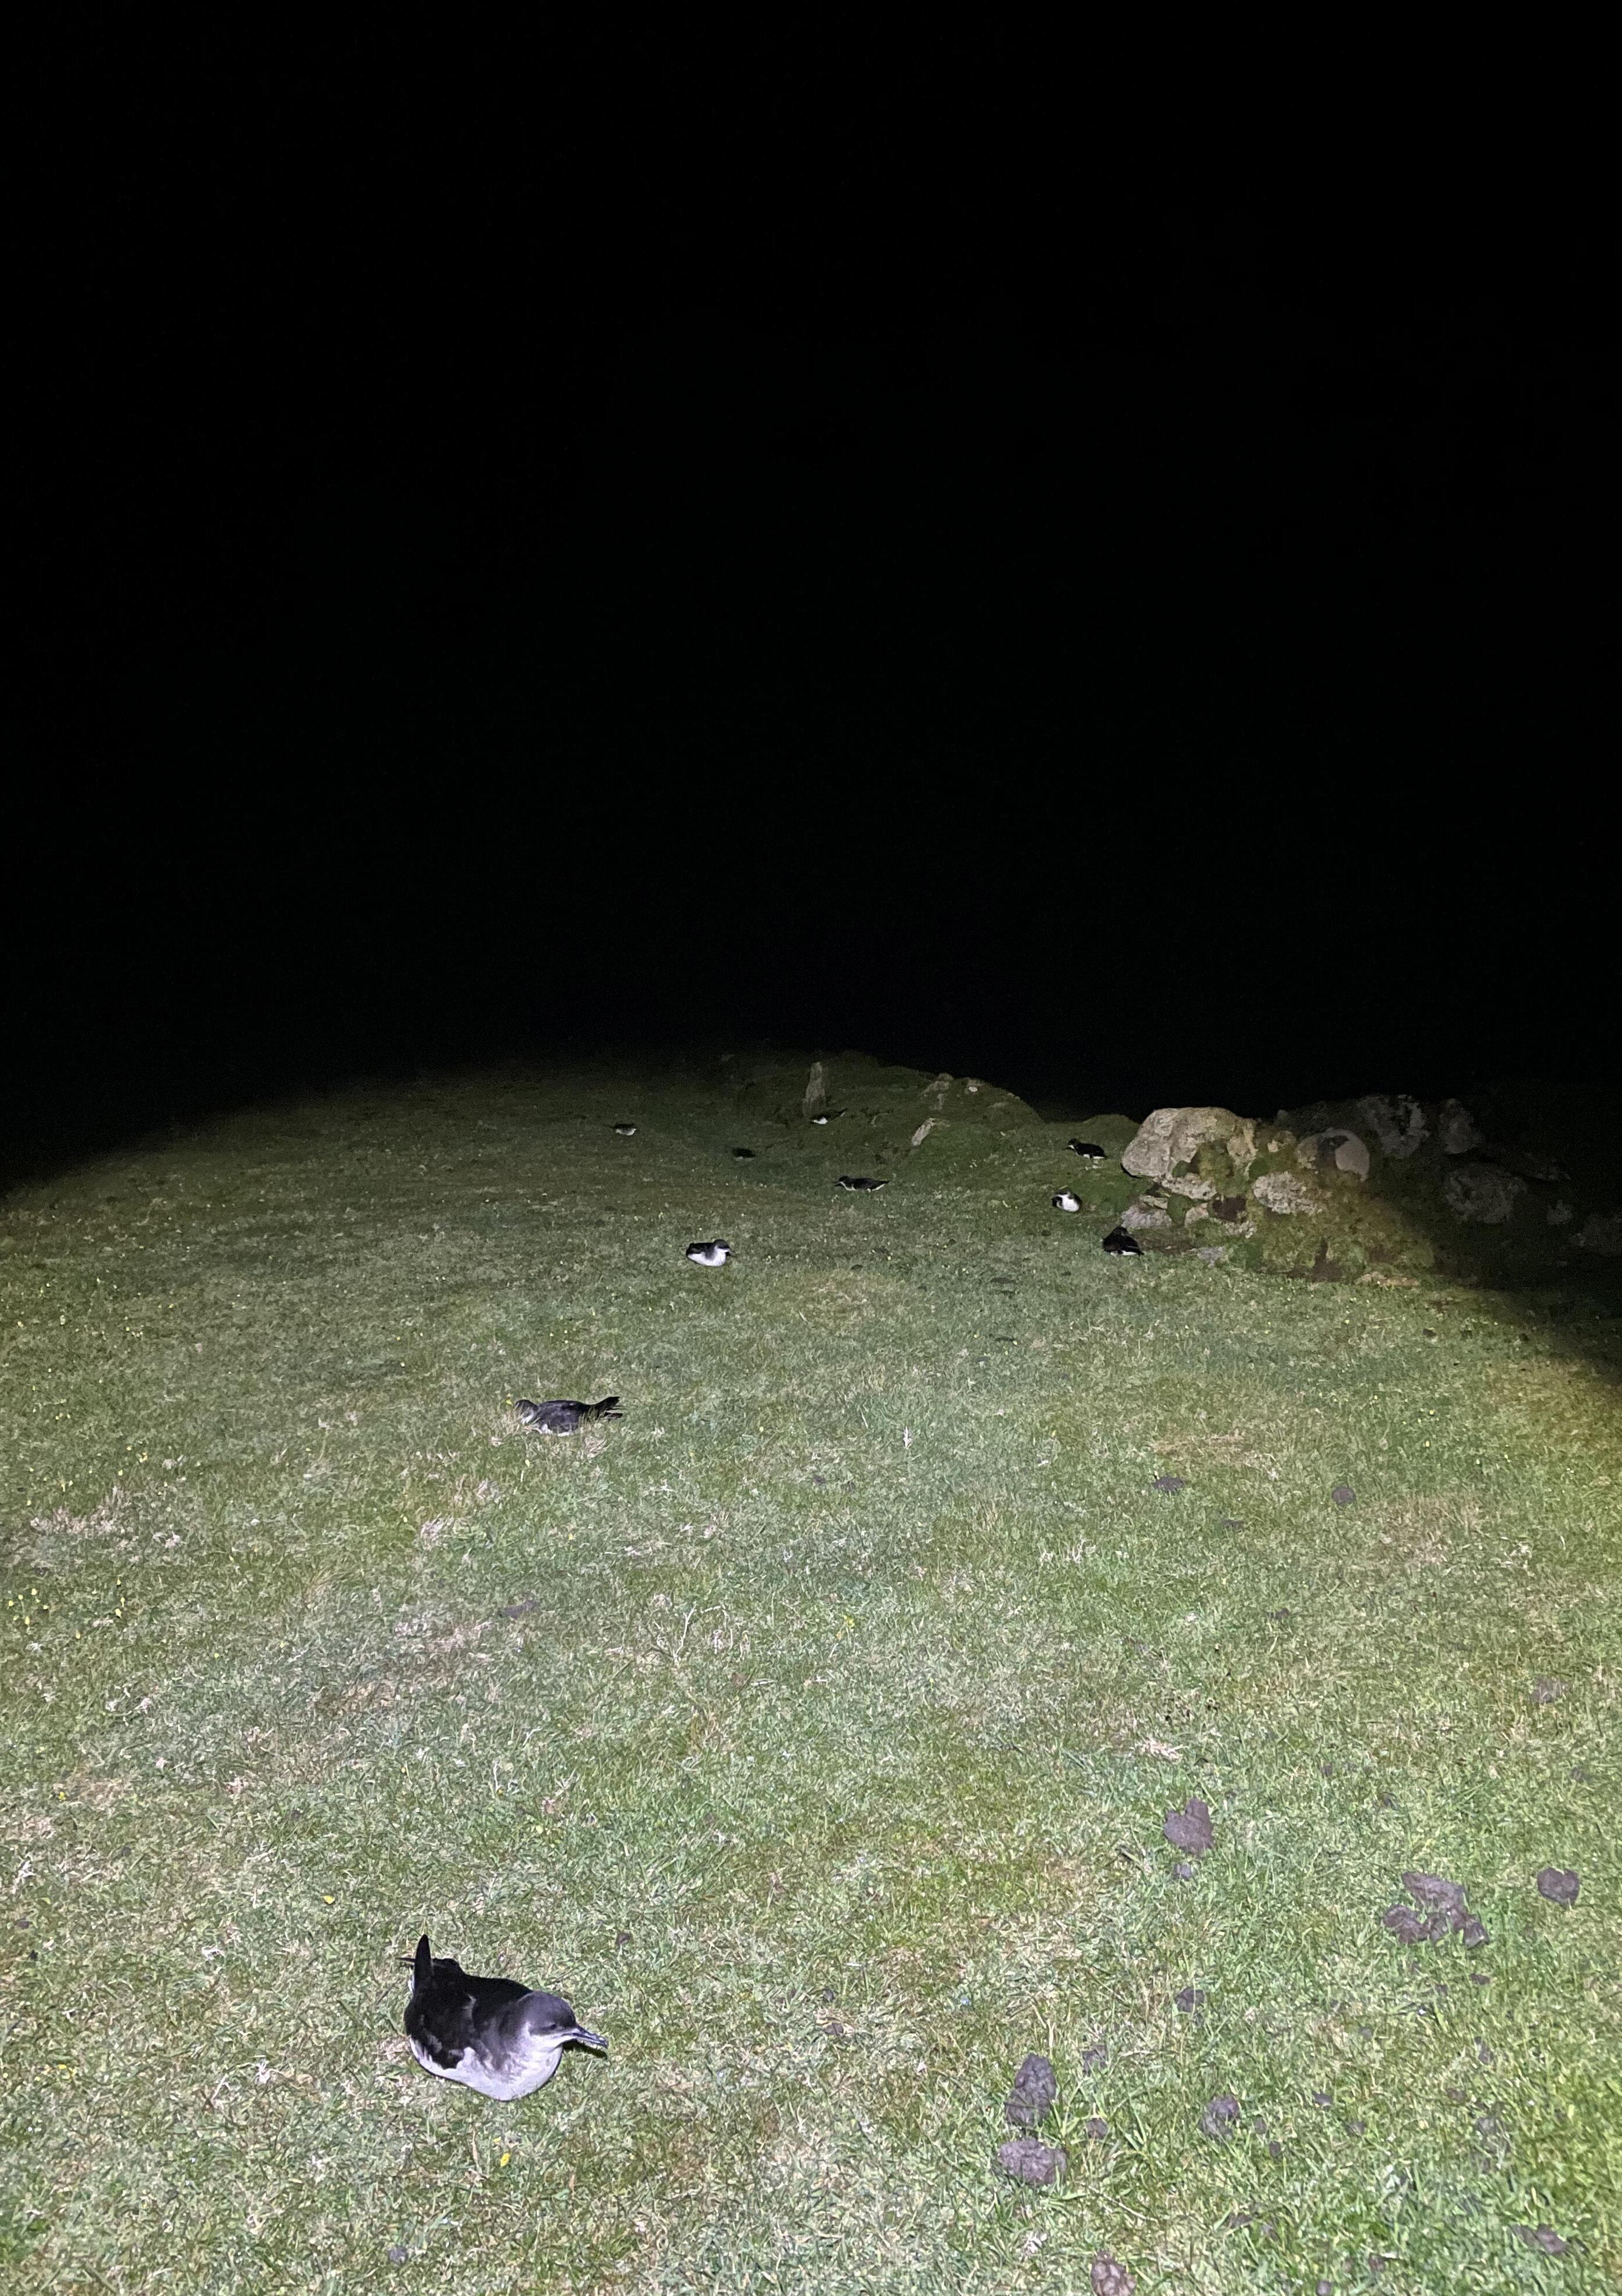
Manx Shearwaters nest in burrows and under boulders, often on steep grassy slopes, and lay a single egg. Their breeding colonies are mainly restricted to invasive species-free islands, where there is reduced predation risk. They only visit colonies at night to avoid predation by aerial predators such as gulls and Great Skuas (Mougeot & Bretagnolle 2000).
BREEDING ABUNDANCE
SMP annual abundance trends could not be produced for Manx Shearwater as too few colonies are monitored regularly to allow production of reliable trends. This is due to the difficulties inherent in accessing remote colonies and the
costly and labour-intensive nature of the surveys. Consistent (possibly using sample plots) annual monitoring of abundance at colonies across their range may allow a trend to be produced in the future. The majority of SMP Colony Counts submitted in 2023 for Manx Shearwater were from the Isles of Scilly (nine sites).
Most Manx Shearwater colonies monitored during the Seabirds Count census showed an increase in population estimates across Britain and Ireland compared to the previous census, Seabird 2000 (Table 5, Burnell et al. 2023). However, many of the counts between the two censuses are not directly comparable due to methodological and analytical differences, therefore considerable caution is required in interpreting these changes.
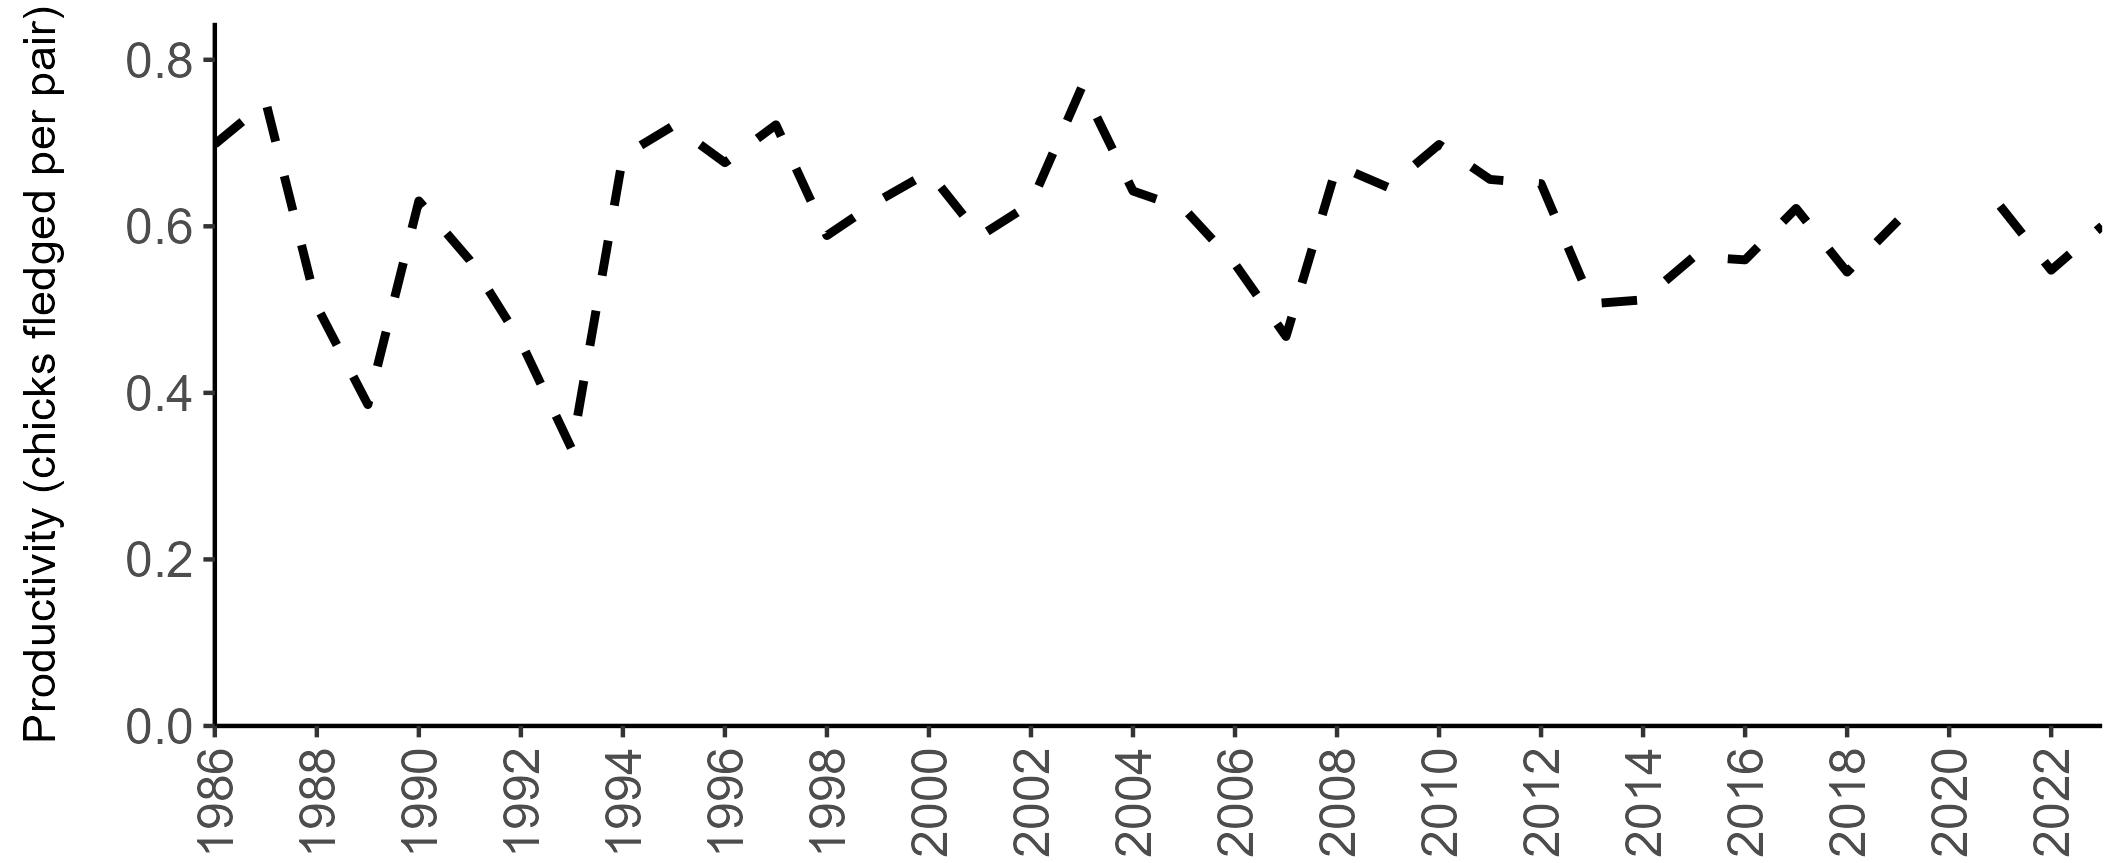
Due to the difficulties involved in monitoring burrow-nesting Manx Shearwaters, productivity is only regularly monitored at a few colonies, but the numbers are sufficient to produce a UK productivity trend.
There has been limited fluctuation across the SMP monitoring period (Figure 10). In 2023, an average of 0.60 chicks were fledged per pair (Table 6), the same as the long-term average.
PHENOLOGY, DIET AND SURVIVAL RATES
Survival estimates of Manx Shearwater are estimated for the
Skomer Island Key Site (see page 15). No systematic data on phenology or diet have been collected as part of the SMP.
CAUSES OF CHANGE
Factors potentially influencing Manx Shearwater numbers include hunting by humans, e.g. legal harvesting in the Faroe Islands (Carboneras et al.
Abundance (AOS) Seabird 2000 (1998—2002)
All Britain, Ireland, Isle of Man and Channel Islands
2014; Thorup et al. 2014), fisheries bycatch in longlines and gillnets (Žydelis et al. 2013) and a change to the discards policy reducing fishery discards as a potential food source, although the latter is not thought to be frequently utalised by Manx Shearwaters (Bicknell et al. 2013).
Abundance (AOS)
Seabirds Count (2015—21) Percentage Change
higher sea surface temperatures (Riou et al. 2011). Burrow flooding due to increased extreme rainfall events in summer could become more frequent with climate change, although the impact that will have on productivity is unknown (Burnell et al. 2023).
to damp nesting burrows causing opportunistic bacterial infections (Esmonde et al. 2022).
The impact of wind farm related collision and displacement is currently unknown for Manx Shearwater (Bradbury et al. 2014; Deakin et al. 2022; Dierschke et al. 2016).
Predation by species such as rats, mice and Domestic Cats (Felis catus) all add to potential pressures (Burnell, 2023; Mitchell et al. 2014). However, the Isle of Rum hosts a large number of breeding Manx Shearwater where they coexist with Brown Rat (Rattus norvegicus). This is thought to be due to the breeding colony being above the altitude at which the rats occur on the island (Lambert et al. 2015).
The shearwaters’ high-efficiency flight and pelagic nature allows them to explore large areas of sea in search of food, potentially limiting the impact of prey distribution change due to climate change. However, research on Skomer Island (Wales) has suggested later breeding seasons and lower chick weight at fledging is linked to
Artificial light at night can attract fledged chicks, causing them to land on flat ground where it is hard for them to take off again, making them more vulnerable to predation e.g. in Scotland (Syposz et al. 2018) and the Canary Islands, (Rodriguez & Rodriguez 2009). Adult Manx Shearwaters can also be affected by light pollution, e.g. lights from buildings near nest sites in foggy conditions can cause collisions (Guildford et al. 2018). At sea, pollution pressures such as oil spills can be detrimental (Votier et al. 2005). A recent study identified 68% of adults and 75% of fledglings had at least one piece of plastic in their stomach contents (Alley et al. 2022). The potential impact this has on mortality is unknown.
Also unknown is the populationlevel impact of Puffinosis, a disease that initially causes blistering of Manx Shearwater feet but which can progress to death (Esmonde et al. 2022). The cause of this infection is still being investigated, but a recent study suggests it is likely due
Various islands around the UK coast have had dedicated eradication programmes for invasive predator species, typically targeting rats. The removal of predators from these islands has often led to the successful return and breeding of Manx Shearwater. Lundy Island and some of the Isles of Scilly archipelago (both England), and the Calf of Man (Isle of Man), have all seen an increase in their Manx Shearwater breeding populations since rats were eradicated (JNCC 2021).
Additional eradication programmes may benefit Manx Shearwaters further. It is also critical that effective biosecurity measures and continued monitoring occurs on islands that have undergone successful eradication programmes, or that are currently free from invasive predators to prevent them reaching these places.
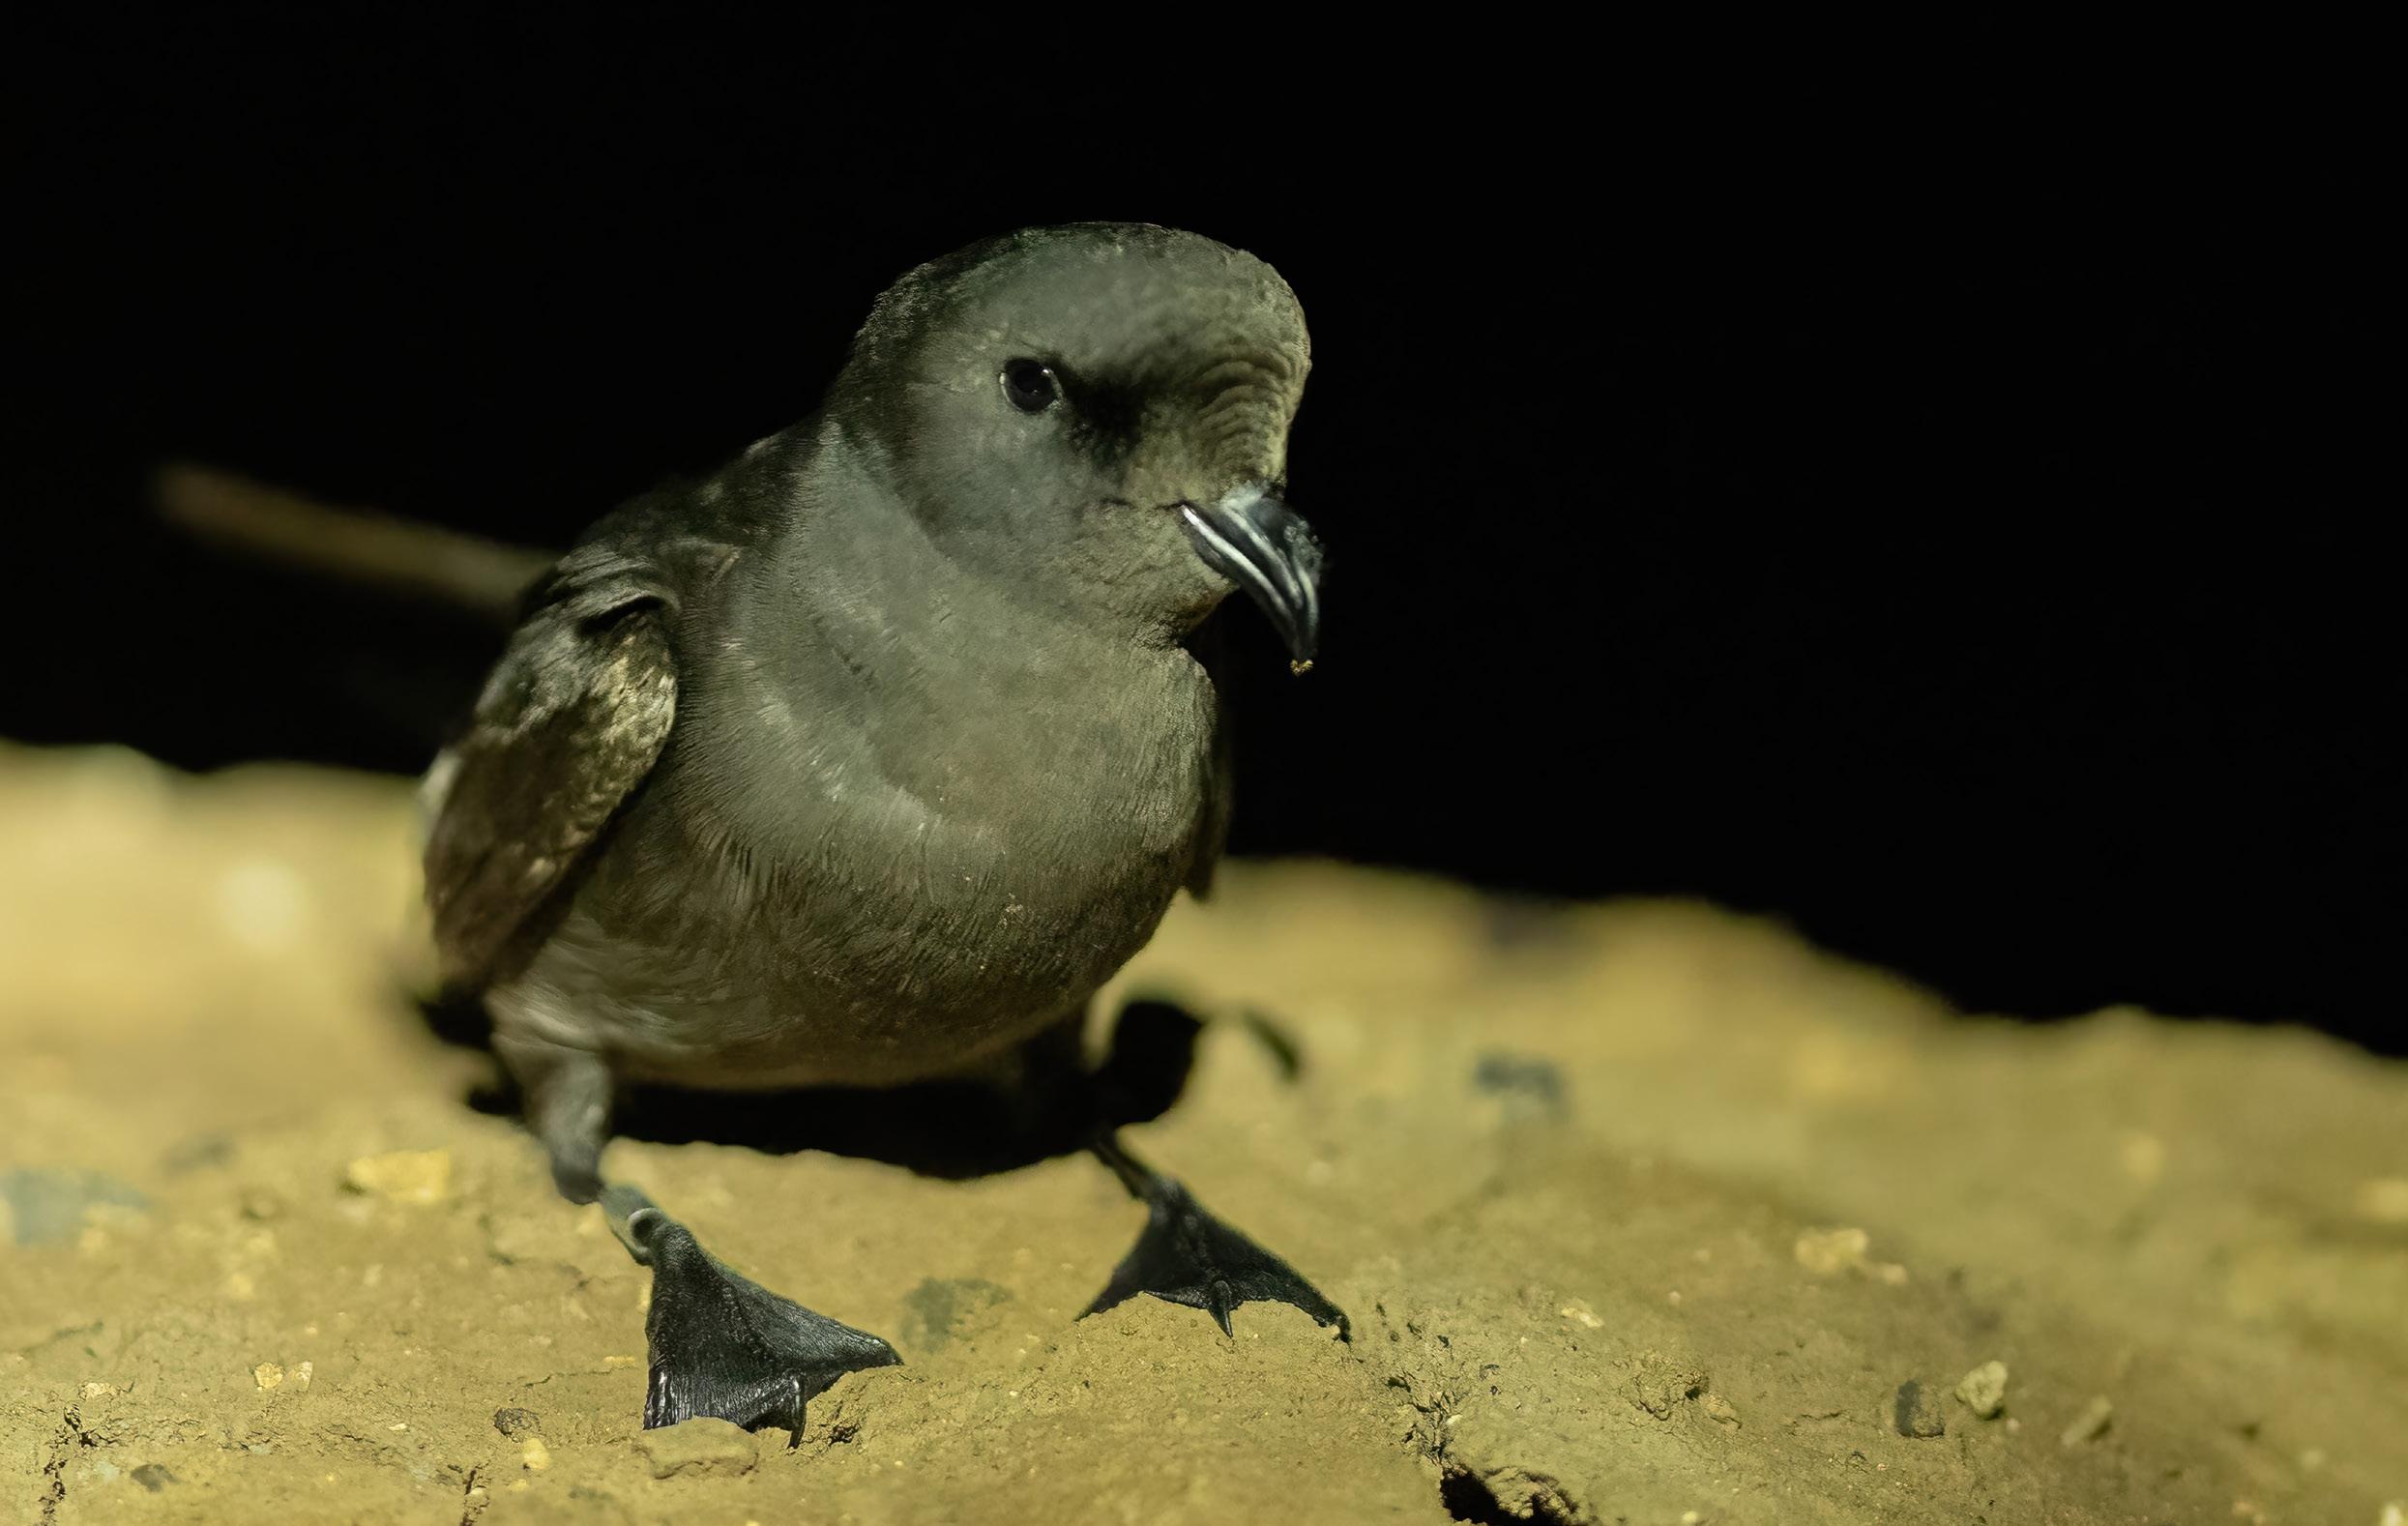
Hydrobates pelagicus
Amber-listed
Amber-listed (I)
Least concern
Abundance: n/a
Productivity: n/a
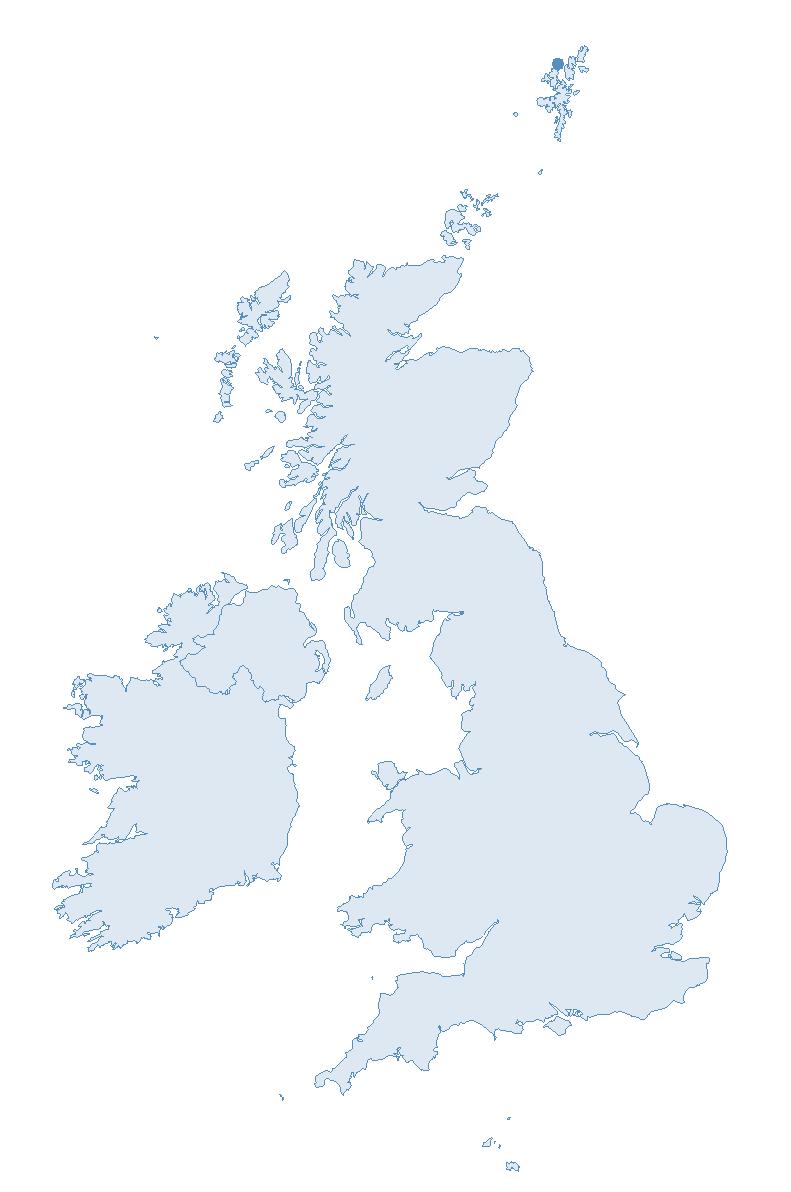
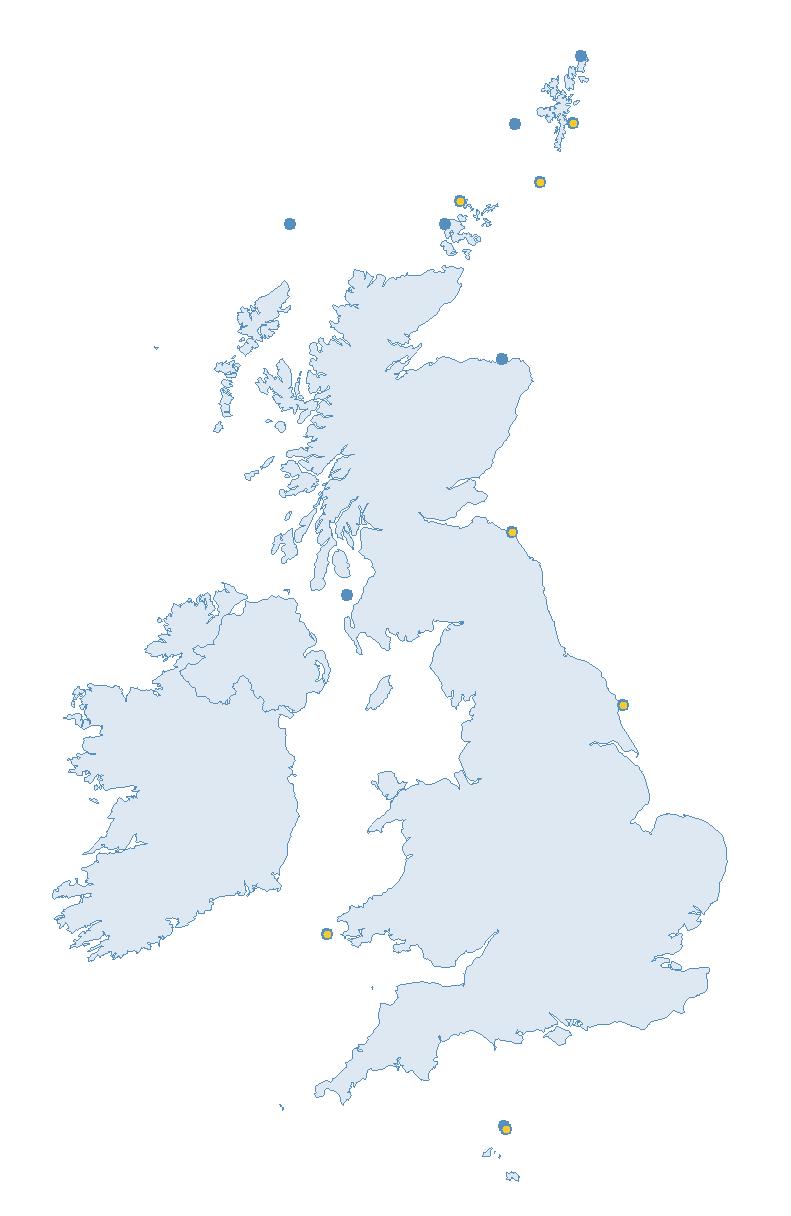
Colony Count sites: 18
Breeding Success sites: 2
Lifespan: 11 years
Breeding age: 4 years

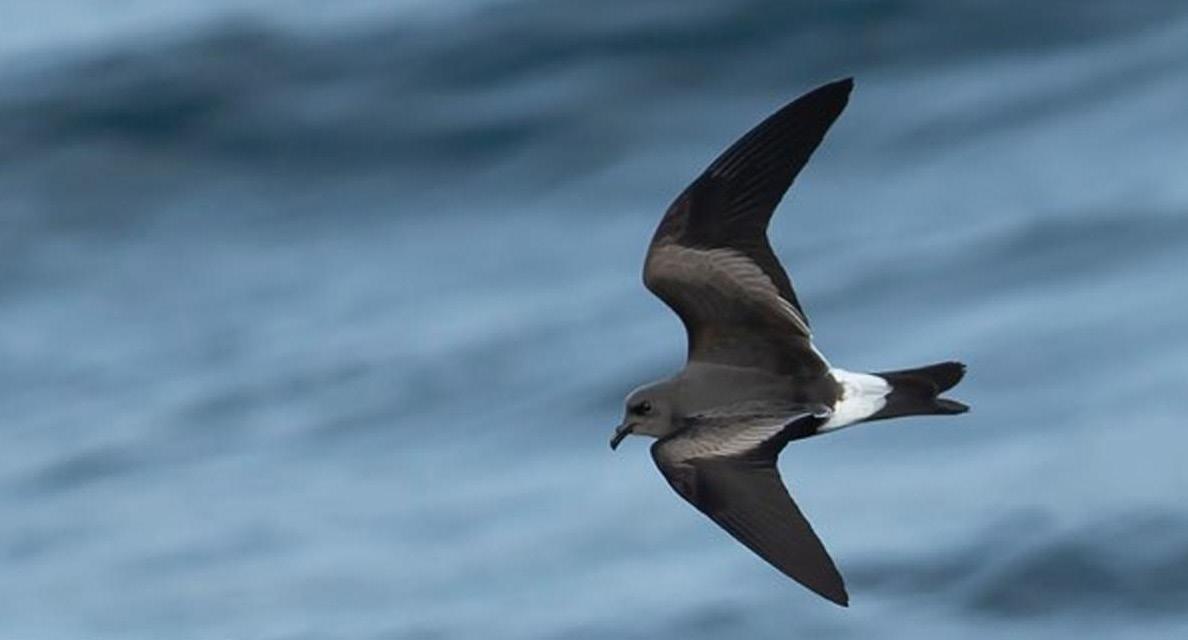
Britain and Ireland host between 27% and 35% of the world’s breeding Storm Petrel population (Burnell et al. 2023). Storm Petrels are the smallest Atlantic flying seabird, weighing on average 25 g, and the maximum age known from bird ringing records is 38 years and 17 days, set in 2017 (BTO 2023a).
In Britain and Ireland, Storm Petrels breed mainly on offshore islands on the Atlantic fringe in the north and west. They are wide-ranging foragers and can be seen at sea around the British and Irish coastlines throughout the breeding season (BTO 2023a).
Globally, the subspecies pelagicus breeds widely across small islands in the North Atlantic Ocean (BirdLife International 2024).
Storm Petrels typically migrate out to sea for the winter within the Atlantic Ocean (Militão et al. 2022). Bird ringing recoveries have shown some individuals have travelled round the Cape of Good Hope (South Africa), and into the Indian Ocean as far as Mozambique (BTO 2023a).
Storm Petrel forage by pattering with their feet on the surface of the water and pecking up prey items. These include small fish, squid and crustaceans, and they have also been known to feed on jellyfish and fishery discards (del Hoyo et al. 1992).
PHENOLOGY, DIET AND SURVIVAL RATES
Storm Petrels spend the majority of their life at sea, only coming to land for a few months of the year to breed (BTO 2023a). They are nocturnally active at colonies and nest in crevices or burrows, laying a single egg (Bolton et al. 2010; BTO 2023a). Their breeding colonies are generally restricted to islands free from mammalian predators, as well as some isolated headlands where there is a reduced predation risk (de León et al. 2016).
BREEDING ABUNDANCE
Too few Storm Petrel colonies are monitored in Britain and Ireland to enable the production of valid annual breeding abundance trends due to the challenges in monitoring a burrow-nesting species which breeds in remote locations and is only active around their colonies at night. New technologies have been trialled at some colonies to improve colony population estimates. If these become a practical survey method in the future, more regular SMP monitoring of colony abundance and the production of abundance trends may be possible. In 2023, the majority
of SMP Colony Counts submitted for Storm Petrel were from the Isles of Scilly (13 sites).
The results from the recent Seabirds Count census indicate that across Britain and Ireland the Storm Petrel population is thought to have moderately increased in abundance since Seabird 2000 (Table 7). However, caution is required as the confidence intervals of the population estimates from the Seabird 2000 and Seabirds Count censuses overlap (Burnell et al. 2023).
Insufficient Storm Petrel colonies are monitored to produce valid SMP productivity trends due to the difficulties involved in monitoring breeding success in this burrow and crevice nesting species. Therefore, very limited productivity data have been submitted to the SMP since 1986. Regular annual monitoring of productivity at colonies across their range would be required to allow productivity trends to be produced in the future.
No data have been collected as part of the SMP.
CAUSES OF CHANGE
Storm Petrels face a range of pressures, one of the major threats being predation. Rat and Domestic Cat (Felis catus) predation, for example on the Isles of Scilly (England), can cause population declines and also, as on Orkney and Shetland (Scotland), influence where Storm Petrel breed (de León et al. 2006; Heaney et al. 2002).
Seabirds such as Great Skuas (Deakin et al. 2018) and gulls (Hey et al. 2020) will opportunistically predate Storm Petrels, and this is one of the reasons they are nocturnally active at their colonies. Once leaving the nest, artificial light at night can also
attract fledged chicks, causing them to land on the ground where they become more vulnerable to predation (Rodriguez & Rodriguez 2009).
Nest site destruction, caused by trampling by humans or livestock, erosion or disturbance, may also impact productivity in some locations (Cadiou et al. 2010; Mitchell et al. 2004).
The effects of pollution, climate change, wind farms and the policy changes to end fishery discards on Storm Petrel populations are not well understood, but all have the potential to place additional pressure on this species (Burnell et al. 2023).
Eradication programmes have been successful in providing rat-free habitat for Storm Petrels to breed again on
Abundance (AOS) Seabird 2000 (1998—2002)
the Isles of Scilly (England), Lundy (England), Ramsey Island (Wales), and the Shiants (Scotland) (Heaney et al. 2002; Tucker & Heath 1994). Biosecurity measures are also key to ensuring islands remain invasive predator-free (Burnell et al. 2023).
The successful uptake of provided nest boxes has benefited Storm Petrel in some locations by providing additional breeding habitat e.g. on Skokholm (Wales), the Shiants (Scotland) and Isles of Scilly (England) (Burnell et al. 2023).
The use of GPS tags to monitor Storm Petrel behaviour and movements at sea during the breeding season has identified key foraging areas north of Scotland (Bolton 2021). Statutory protection of these areas in future could potentially be beneficial for this species.
Abundance (AOS) Seabirds Count (2015—21) Percentage Change
Red-listed
Red-listed (I)
Abundance: n/a
Productivity: n/a
Colony Count sites: 1
Breeding Success sites: 0
Vulnerable Lifespan: 13 years

Breeding age: 5 years
Britain and Ireland host fewer than 1% of the world’s breeding Leach’s Petrel (Burnell et al. 2023). In the BoCC5 seabird update of 2024, Leach’s Petrel moved from Amber to Red-listed due to declines in their breeding populations, restricted breeding range, global status and the international importance of the UK population (Stanbury et al. 2024). Their very restricted range in Britain and Ireland is thought to be limited by the distance from their main foraging grounds at, or beyond, the continental shelf (BTO 2023a).
Only coming to land to breed, Leach’s Petrel spend the rest of the time in remote parts of the ocean, converging on upwellings or over the continental shelf edge (Hedd et al. 2018; Pollet et al. 2014).
They are known to breed on just 11 offshore islands and archipelagos along the Atlantic fringe of Britain and Ireland, all but three of which are in Scotland (Burnell et al. 2023).
Globally, Leach’s Petrel are found across the Atlantic and Pacific Oceans (BirdLife International 2024). Outside of the breeding season, they can be
seen offshore or even blown inshore during autumn and early winter gales (BTO 2023a).
Leach’s Petrel in the North Atlantic migrate south for the winter as far as Brazil and South Africa (del Hoyo et al. 1992; Pollet et al. 2019).
Leach’s Petrel are surface feeders, with their diet including small fish, squid and planktonic crustaceans as well as discards from fishery boats (Watanuki 1985; Hedd & Montevecchi 2006). They are also sometimes seen following marine mammals, feeding on leftovers or faeces (IUCN 2024).
Leach’s Petrel avoid predation by only visiting colonies nocturnally. Nest sites are found on predator-free offshore islands, and they nest in burrows, under vegetation and in rock crevices where they lay a single egg (Burnell et al. 2023; del Hoyo et al. 1992).
During the breeding season, they can travel up to 1,000 km from their colonies, flying over deep parts of the ocean in search of food (Hedd et al. 2018; Pollet et al. 2014).
Very few Leach’s Petrel colonies have been monitored over the
SMP recording period due to the difficulties in surveying this nocturnal, burrow-nesting species, which only breeds in a small number of remote locations across Britain and Ireland. Consequently, no valid annual abundance trends can be produced. New technologies have been trialled at some petrel colonies to improve colony population estimates. If these become a practical survey method in the future, more regular SMP monitoring of colony abundance and the production of abundance trends may be possible. Although some methodological differences between censuses make direct comparisons difficult, the Seabirds Count census indicates that the Leach’s Petrel population has undergone a severe decline of 78% across Britain and Ireland since Seabird 2000 (Table 8, Burnell et al. 2023). The majority of Leach’s Petrel breeding in Britain and Ireland nest on St. Kilda (Scotland) where comparable analytical methods indicate a decline of 68% between 2000 and 2019 (Deakin et al. 2021).
SMP data on Leach’s Petrel breeding success is very limited given the difficulties in monitoring productivity in this burrow and crevice nesting species, therefore, no valid annual productivity trends can be produced. Regular annual monitoring of productivity at colonies would be
required to allow productivity trends to be produced in the future.
PHENOLOGY, DIET AND SURVIVAL RATES
No data have been collected as part of the SMP.
CAUSES OF CHANGE
Native wildlife has the potential to predate Leach’s Petrels. On St Kilda (Scotland), research suggested the population has been predated at an unsustainably high level by Great Skuas, and that this, along with other factors such as changes in food supply, has contributed to the decline recorded within the colony (Newson et al. 2008).
There is some evidence to suggest that grazing can be detrimental to Leach's petrel (Drury 1973; d’Entremont et al. 2020) through modification of the habitat and the risk of trampling. This is supported by the fact that Dun on St Kilda (Scotland), which is ungrazed, has relatively high breeding densities nesting within the dense tussocky grass which has developed there (Burnell et al. 2023), and this may also offer additional protection by being unfavourable nesting habitat for the predatory Great Skuas (Miles 2010).
At-sea pollution can be a problem for Leach's Petrel and it is thought that Leach’s Petrels are attracted to the flares and lights of oil rigs, which
could lead to fatal collisions (Collins et al. 2022; Hedd et al. 2018). Oil spills are also a concern. There are at least five colonies from the western Atlantic which overlap with offshore oil and gas operations, and three of these colonies have declined in recent years (Hedd et al. 2018).
Shifts in prey distributions due to climate change are also considered potential threats to Leach’s Petrel (Burnell et al. 2023; Pollet et al. 2023).
Researchers suggest that local, targeted strategies are likely to be the best approach for the conservation of Leach’s Petrel (Pollet et al. 2023).
Invasive species such as mice, rats, Domestic Cats (Felis catus), and foxes have the potential to create predation risks pressures at breeding colonies (Dias et al. 2019; Mitchell et al. 2004), therefore preventing potential mammalian predator species from reaching the main Leach’s Petrel breeding sites through effective biosecurity programmes will be a key conservation measure for this species (Burnell et al. 2023).
Amber-listed
Amber-listed (I)
Least concern
Abundance: n/a
Productivity: 0.60
Colony Count sites: 14
Breeding Success sites: 7
Lifespan: 17 years
Breeding age: 5 years
The breeding population of Gannet in Britain and Ireland represents 70% of the global total (Burnell et al. 2023). The Gannet’s iconic plunge-dive, by which they can reach depths of up to 20 m (Garthe et al. 2000), makes them a striking feature of British and Irish coastlines.
Gannets are found across the North Atlantic Ocean, and currently are known to breed at 28 colonies around the British and Irish coast (Burnell et al. 2023). They are a wide-ranging species and a dominant feature of the coastline throughout the year (BTO 2023a).
Globally, Gannets breed from the north-west of Russia, up to the island of Bjørnøya, west to Canada and south to Brittany (BirdLife International 2024). A few pairs also nest in the Mediterranean (Giagnoni et al. 2015).
Post-breeding, Gannets move south, with east Atlantic birds typically going to the Bay of Biscay or off the coast of West Africa, and some individuals crossing south of the Equator (Burnell et al. 2023; Kubetzki et al. 2009).
Gannets feed on a wide range of pelagic fish and squid (Garthe et al. 2000), and these are predominantly caught by plunge-diving. They also scavenge fishery discards. Breeding birds have colony-specific foraging ranges based on density-dependent competition, i.e.
birds with the largest colonies forage further from the nest, some with ranges of over 500 km (Hamer et al. 2001; Wakefield et al. 2013).
Gannets breed on offshore islands and stacks, as well as some mainland cliffs, nesting on small mounds built just outside the pecking range of surrounding pairs. Nests are made from seedweed, terrestrial vegetation and marine debris, in which a single egg is laid (BTO 2023a).
BREEDING ABUNDANCE
Up until 2019 an SMP abundance trend was estimated for Gannet at the UK level based on interpolated and extrapolated values from complete censuses since the 1980s (JNCC 2021). This approach was taken, rather than using SMP data, as annual sampling of Gannet is typically only carried out at the smaller, more accessible colonies, which are not representative of the overall trend. Trend values had been extrapolated each year as the Gannet population of Britain and Ireland had been experiencing a long-term increase, with the Seabirds Count
census showing that the population increased by 38% since the previous Gannet census in 2003–05 (Burnell et al. 2023). However, given the extent to which Gannet were negatively impacted by the HPAI outbreak during the 2022 breeding season (see page 9) no extrapolation of the SMP abundance trend was carried out for 2021–23. Too few representative data are submitted to the SMP on abundance of Gannet populations in individual regions to allow for the production of valid abundance trends.
The Gannet productivity trends for the UK and Scotland are closely matched, as a large proportion of monitored sites are in Scotland (Figure 11). The trends have been relatively stable in recent years, but 2022 saw the lowest values recorded since SMP monitoring began in 1986, with 0.30 and 0.22 chicks fledged per breeding pair in the UK and Scotland, respectively (Tables 50 & 52). This poor productivity is attributable to the 2022 HPAI outbreak, and probably due to nest abandonment by adults who either died or deserted the breeding colony (Lane et al. 2023).
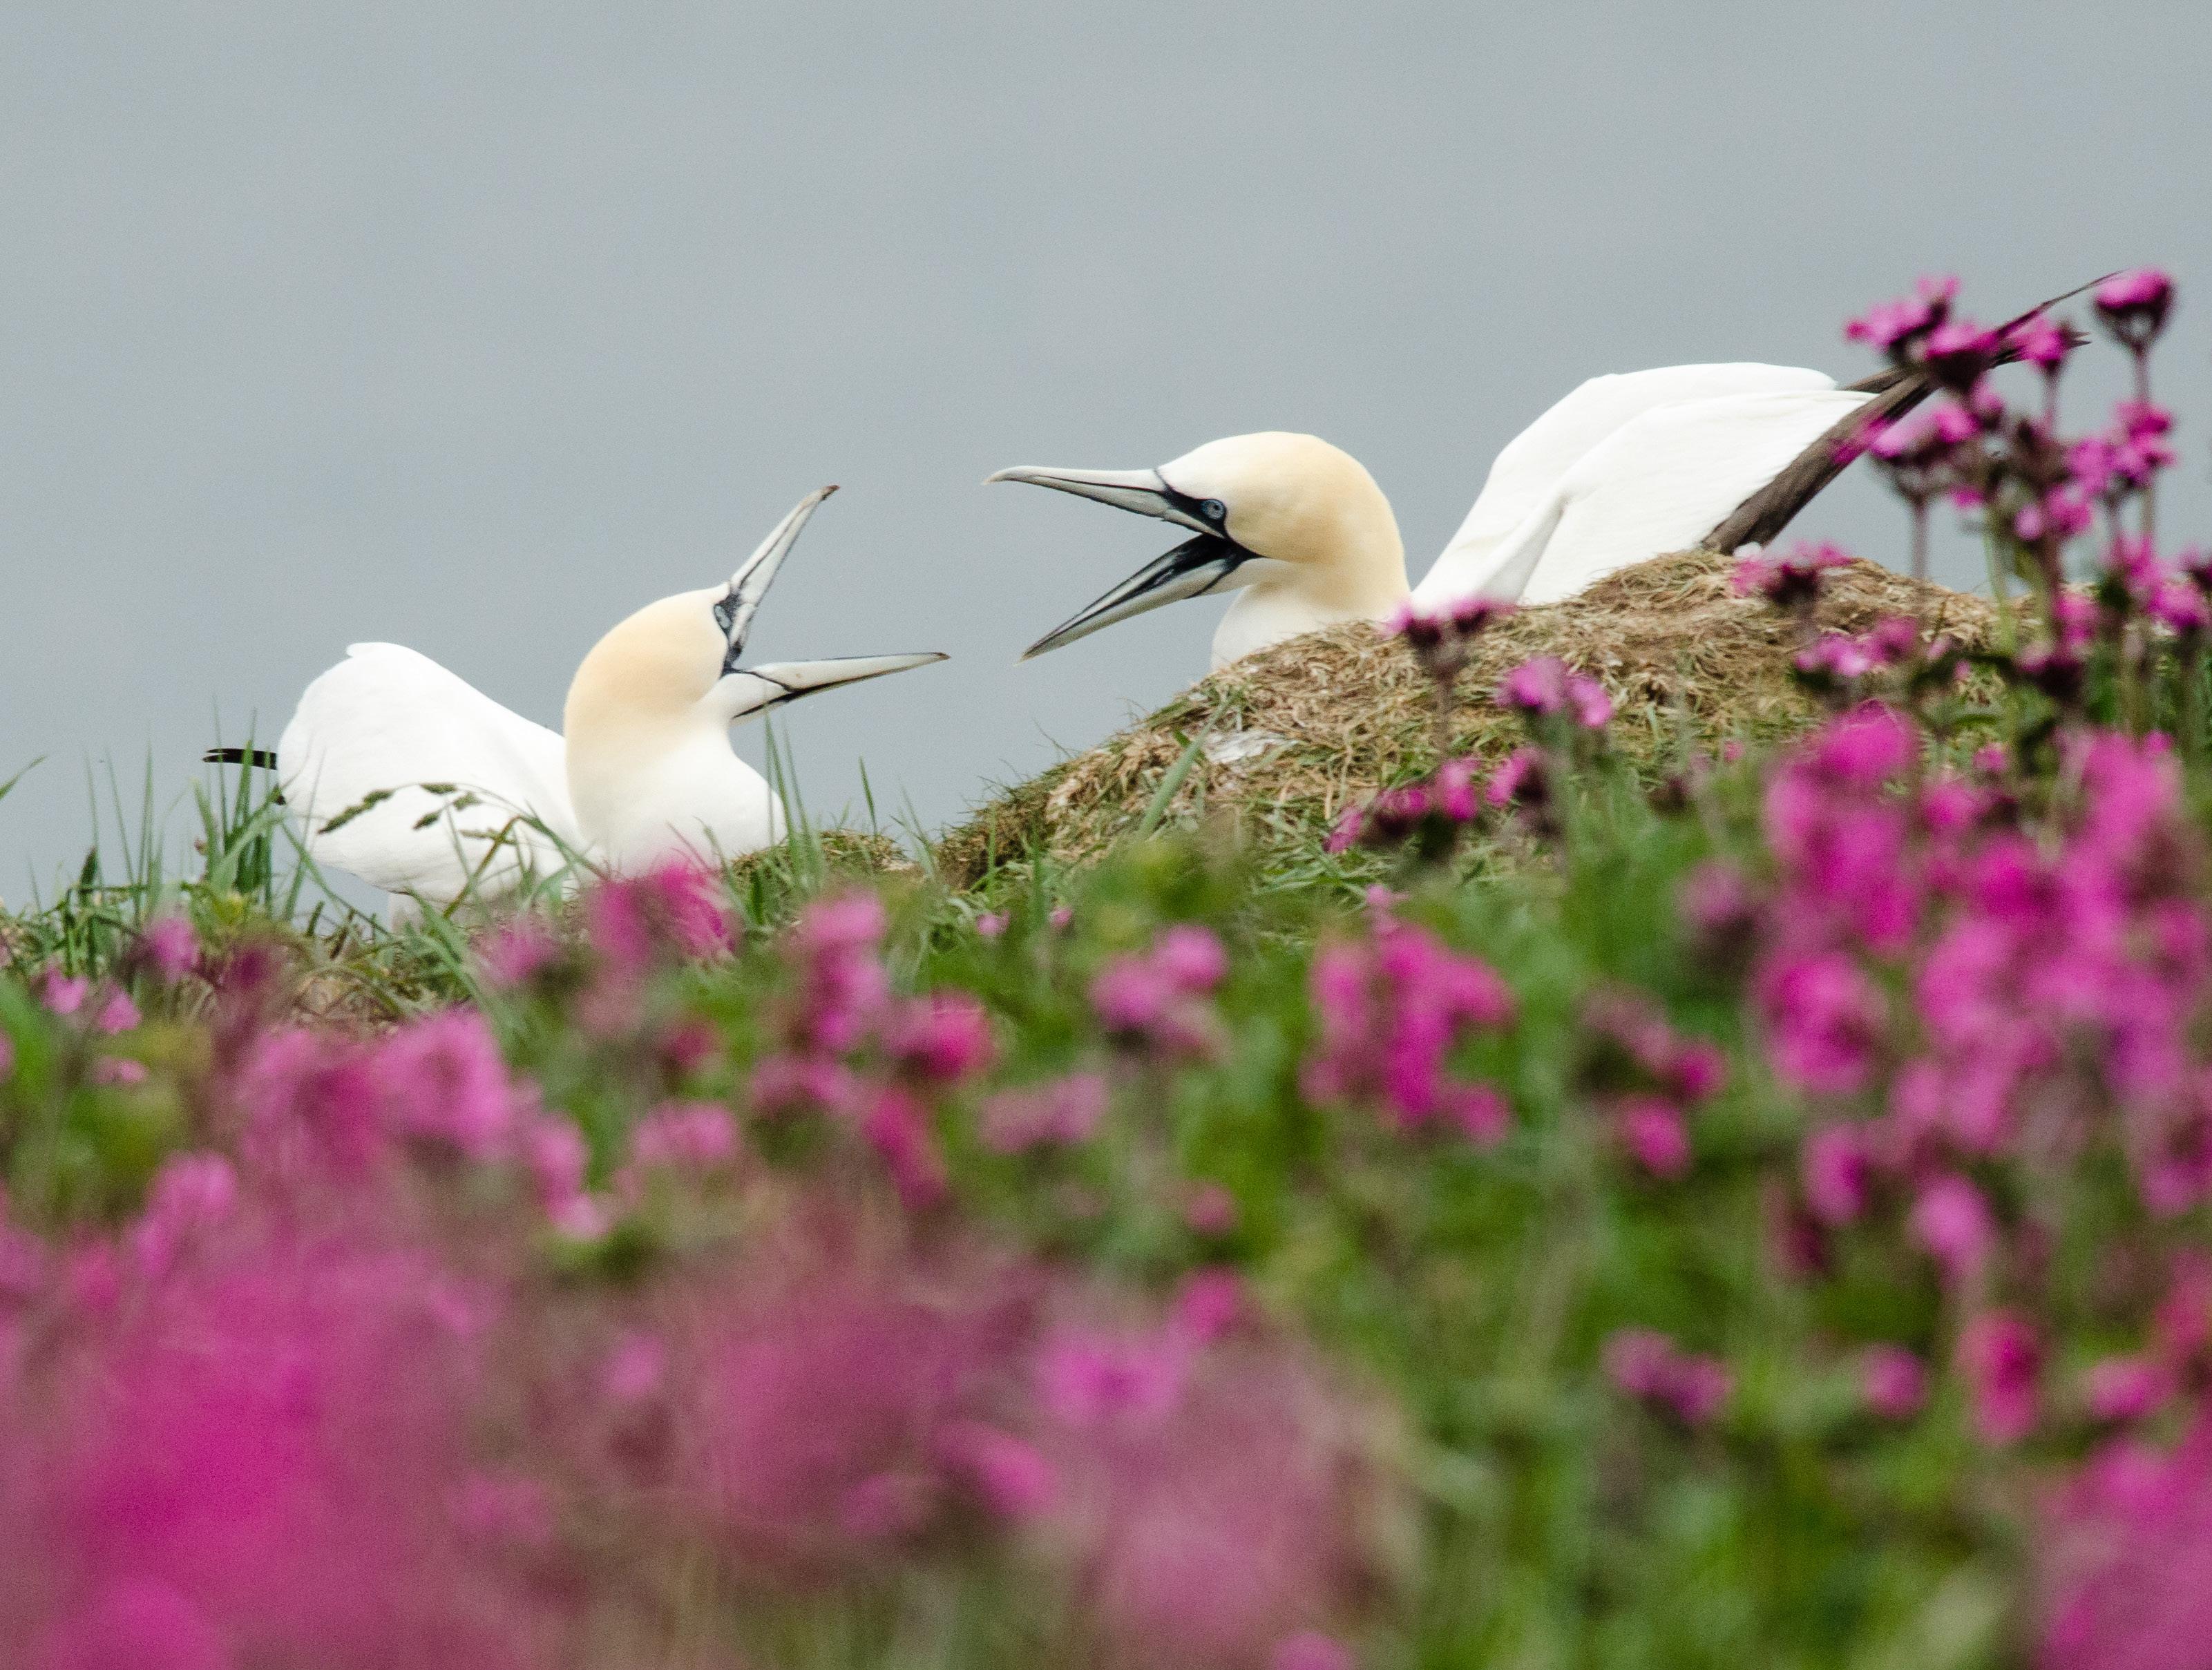
Mean productivity increased in 2023, with 0.60 and 0.59 chicks fledged per pair in the UK and Scotland, respectively (Table 10). Too few productivity data are submitted to the SMP from the other regions with breeding Gannet to allow for the production of valid annual productivity values.
PHENOLOGY, DIET AND SURVIVAL RATES
No data have been collected as part of the SMP.
CAUSES OF CHANGE
Influencing factors for historical population increases include the
cessation of human exploitation during the 19th century and the frequency of oil pollution events decreasing, although mass events still pose a threat (Burnell et al. 2023).
Eggshell thinning caused by dichloro-diphenyl-trichloroethane (DDT) resulted in lower productivity in the 1950s and 1960s, however this now poses little cause for concern (Chapdelaine et al. 1987; Power et al. 2021).
Following decades of population growth, the HPAI outbreak caused a severe population decline of 25% at sites surveyed across the UK in
2023 (which covered 75% of the UK breeding population) compared to pre-HPAI baseline counts undertaken between 2014 and 2021 (Lane et al. 2023; Tremlett et al. 2024), as discussed on pages 8–11. Due to their large foraging range and ability to exploit a wide range of prey species, Gannets have been less affected than many other seabirds by climate change (Johnston et al. 2021). However, increasing sea surface temperatures due to climate change have resulted in a northwards shift in fish prey distribution, especially for Atlantic Mackerel (Scomber scombrus) (Montevecchi 1997).
Abundance (AOS/AON)
Gannet Census (2003—05)
All Britain, Ireland, Isle of Man and Channel Islands
Abundance (AOS/AON)
Gannet Census (2013—14) and Seabirds Count (2015—21) Population Change
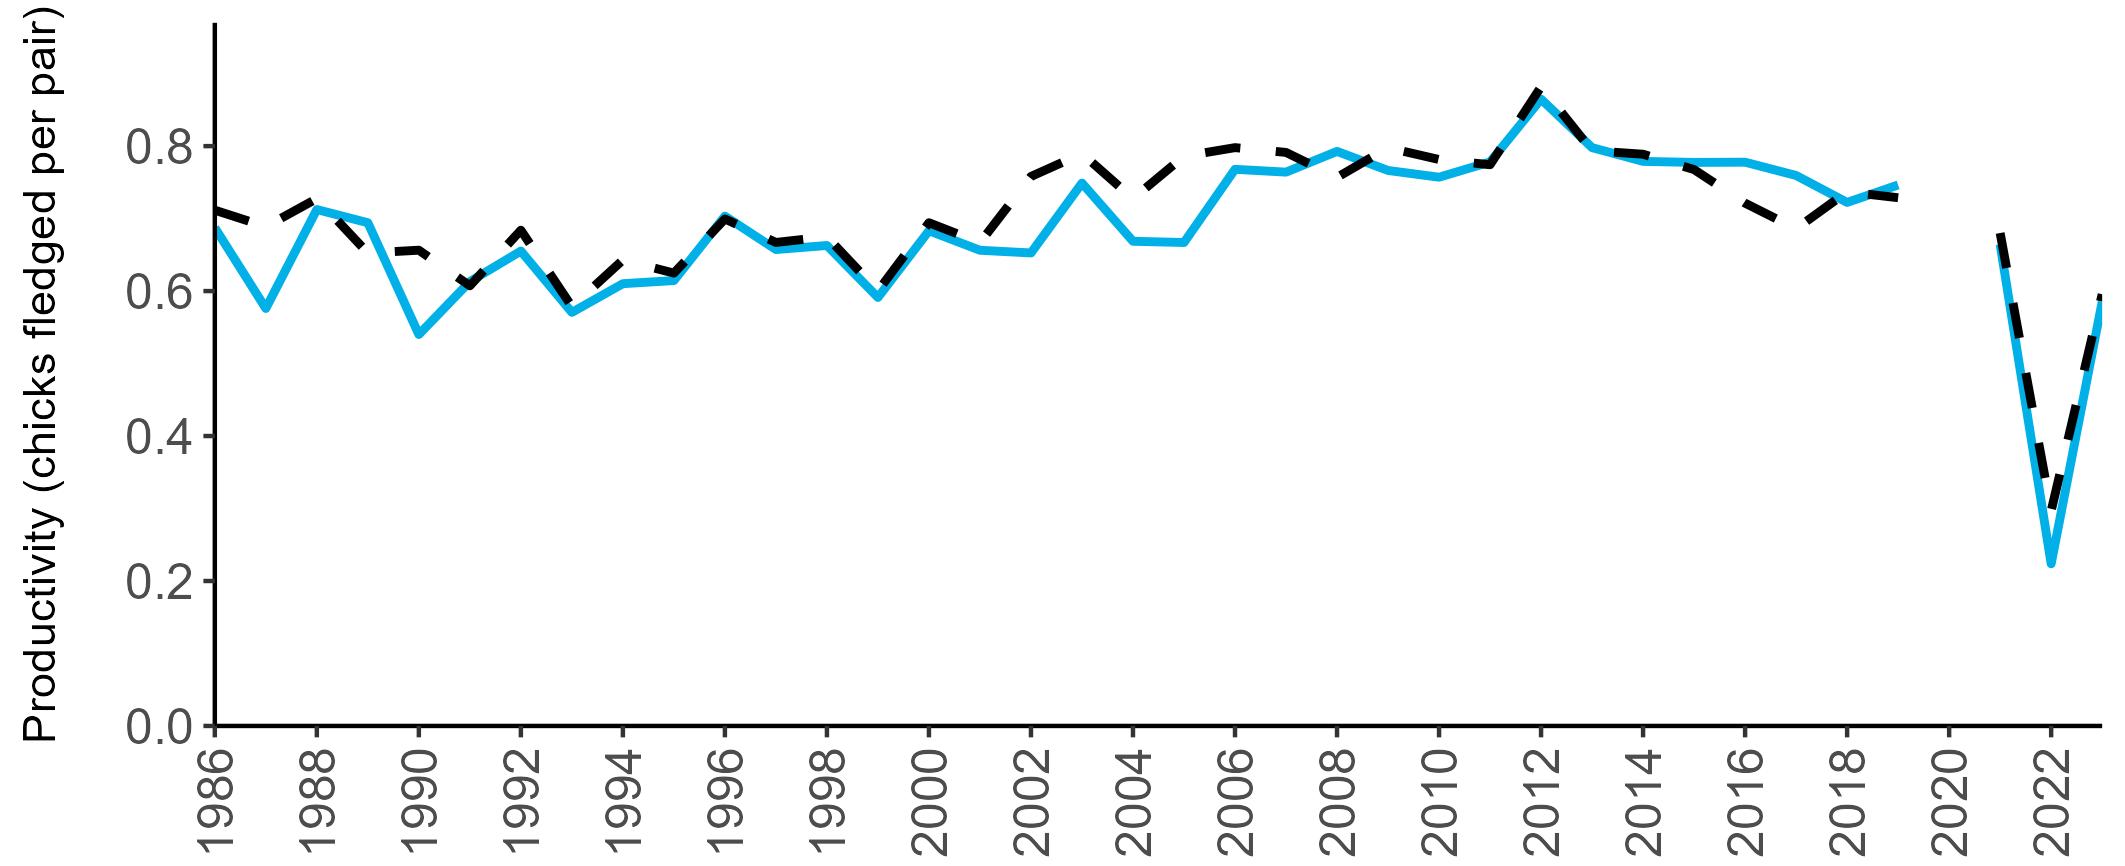
frequently killed bird in bycatch from Portuguese coastal Atlantic waters (Oliveira et al. 2015).
Gannets breeding at the southern limit of their range are particularly at risk in years with higher sea surface temperatures, as they may have to travel further to forage, and a reduction in available prey has been shown to result in fewer chicks fledging (d’Entremont et al. 2022).
Plastics have been increasingly incorporated into Gannet nesting materials, causing some birds to become entangled in their nest (O’Hanlon et al. 2019). The effects of plastic ingestion are largely unknown (Burnell et al. 2023).
Across their range, Gannets are common bycatch in longline and fixed gear fisheries, as they often associate with fishing boats during foraging trips (Araújo et al. 2022; Barcelona et al. 2010; Smith & Morgan 2005), and they have been reported as the most
A tracking study showed that Gannets may avoid offshore wind farms, especially during the breeding season (Peschko et al. 2021) and these displacement effects may reduce the number of available foraging areas. However, they have also been identified as highly vulnerable to collisions with offshore wind farms due to their flight height (Bradbury et al. 2014; Furness et al. 2013). During autumn migration, adult Gannets are at higher risk than juveniles, as young Gannets tend to hug the coastline and thus interact with wind farms less frequently (Pollock et al. 2021).
Fishery-related policy actions have the potential to benefit Gannet populations. For example, gillnet fishery closures in Canada in 1992 led to an increase in breeding populations of Gannet due to the removal of tens of thousands of gillnets known to inflict high levels of seabird mortality through fisheries bycatch (Regular et al. 2013).
Bird deterrent technologies have the potential to reduce bycatch, one example being ‘scarybird’ (a visual deterrent deployed above fishing
nets to keep away species that are vulnerable to being trapped) which was trialled off the coasts of the Berlengas Islands (Portugal) and discouraged Gannets and large gulls from fishing vessels during operations (Almeida et al. 2023).
Monitoring plastics and other debris in Gannet nests using non-invasive methods could provide a useful indication of the effectiveness of any future fisheries-related policy actions put in to place to reduce fisheriesrelated plastic pollution (O’Hanlon et al. 2019).
Continued monitoring and understanding of population-level impacts of HPAI, particularly since 2022, will also be important moving forward (Burnell et al. 2023).
The current development of new methods to automate the detection and counting of Gannets from images taken from Uncrewed Aerial Vehicles (UAVs) is likely to be beneficial for monitoring Gannets in the future. Similar techniques proved useful in monitoring Gannet numbers on the Bass Rock (Scotland) following the 2022 HPAI outbreak (Tyndall et al. 2024).
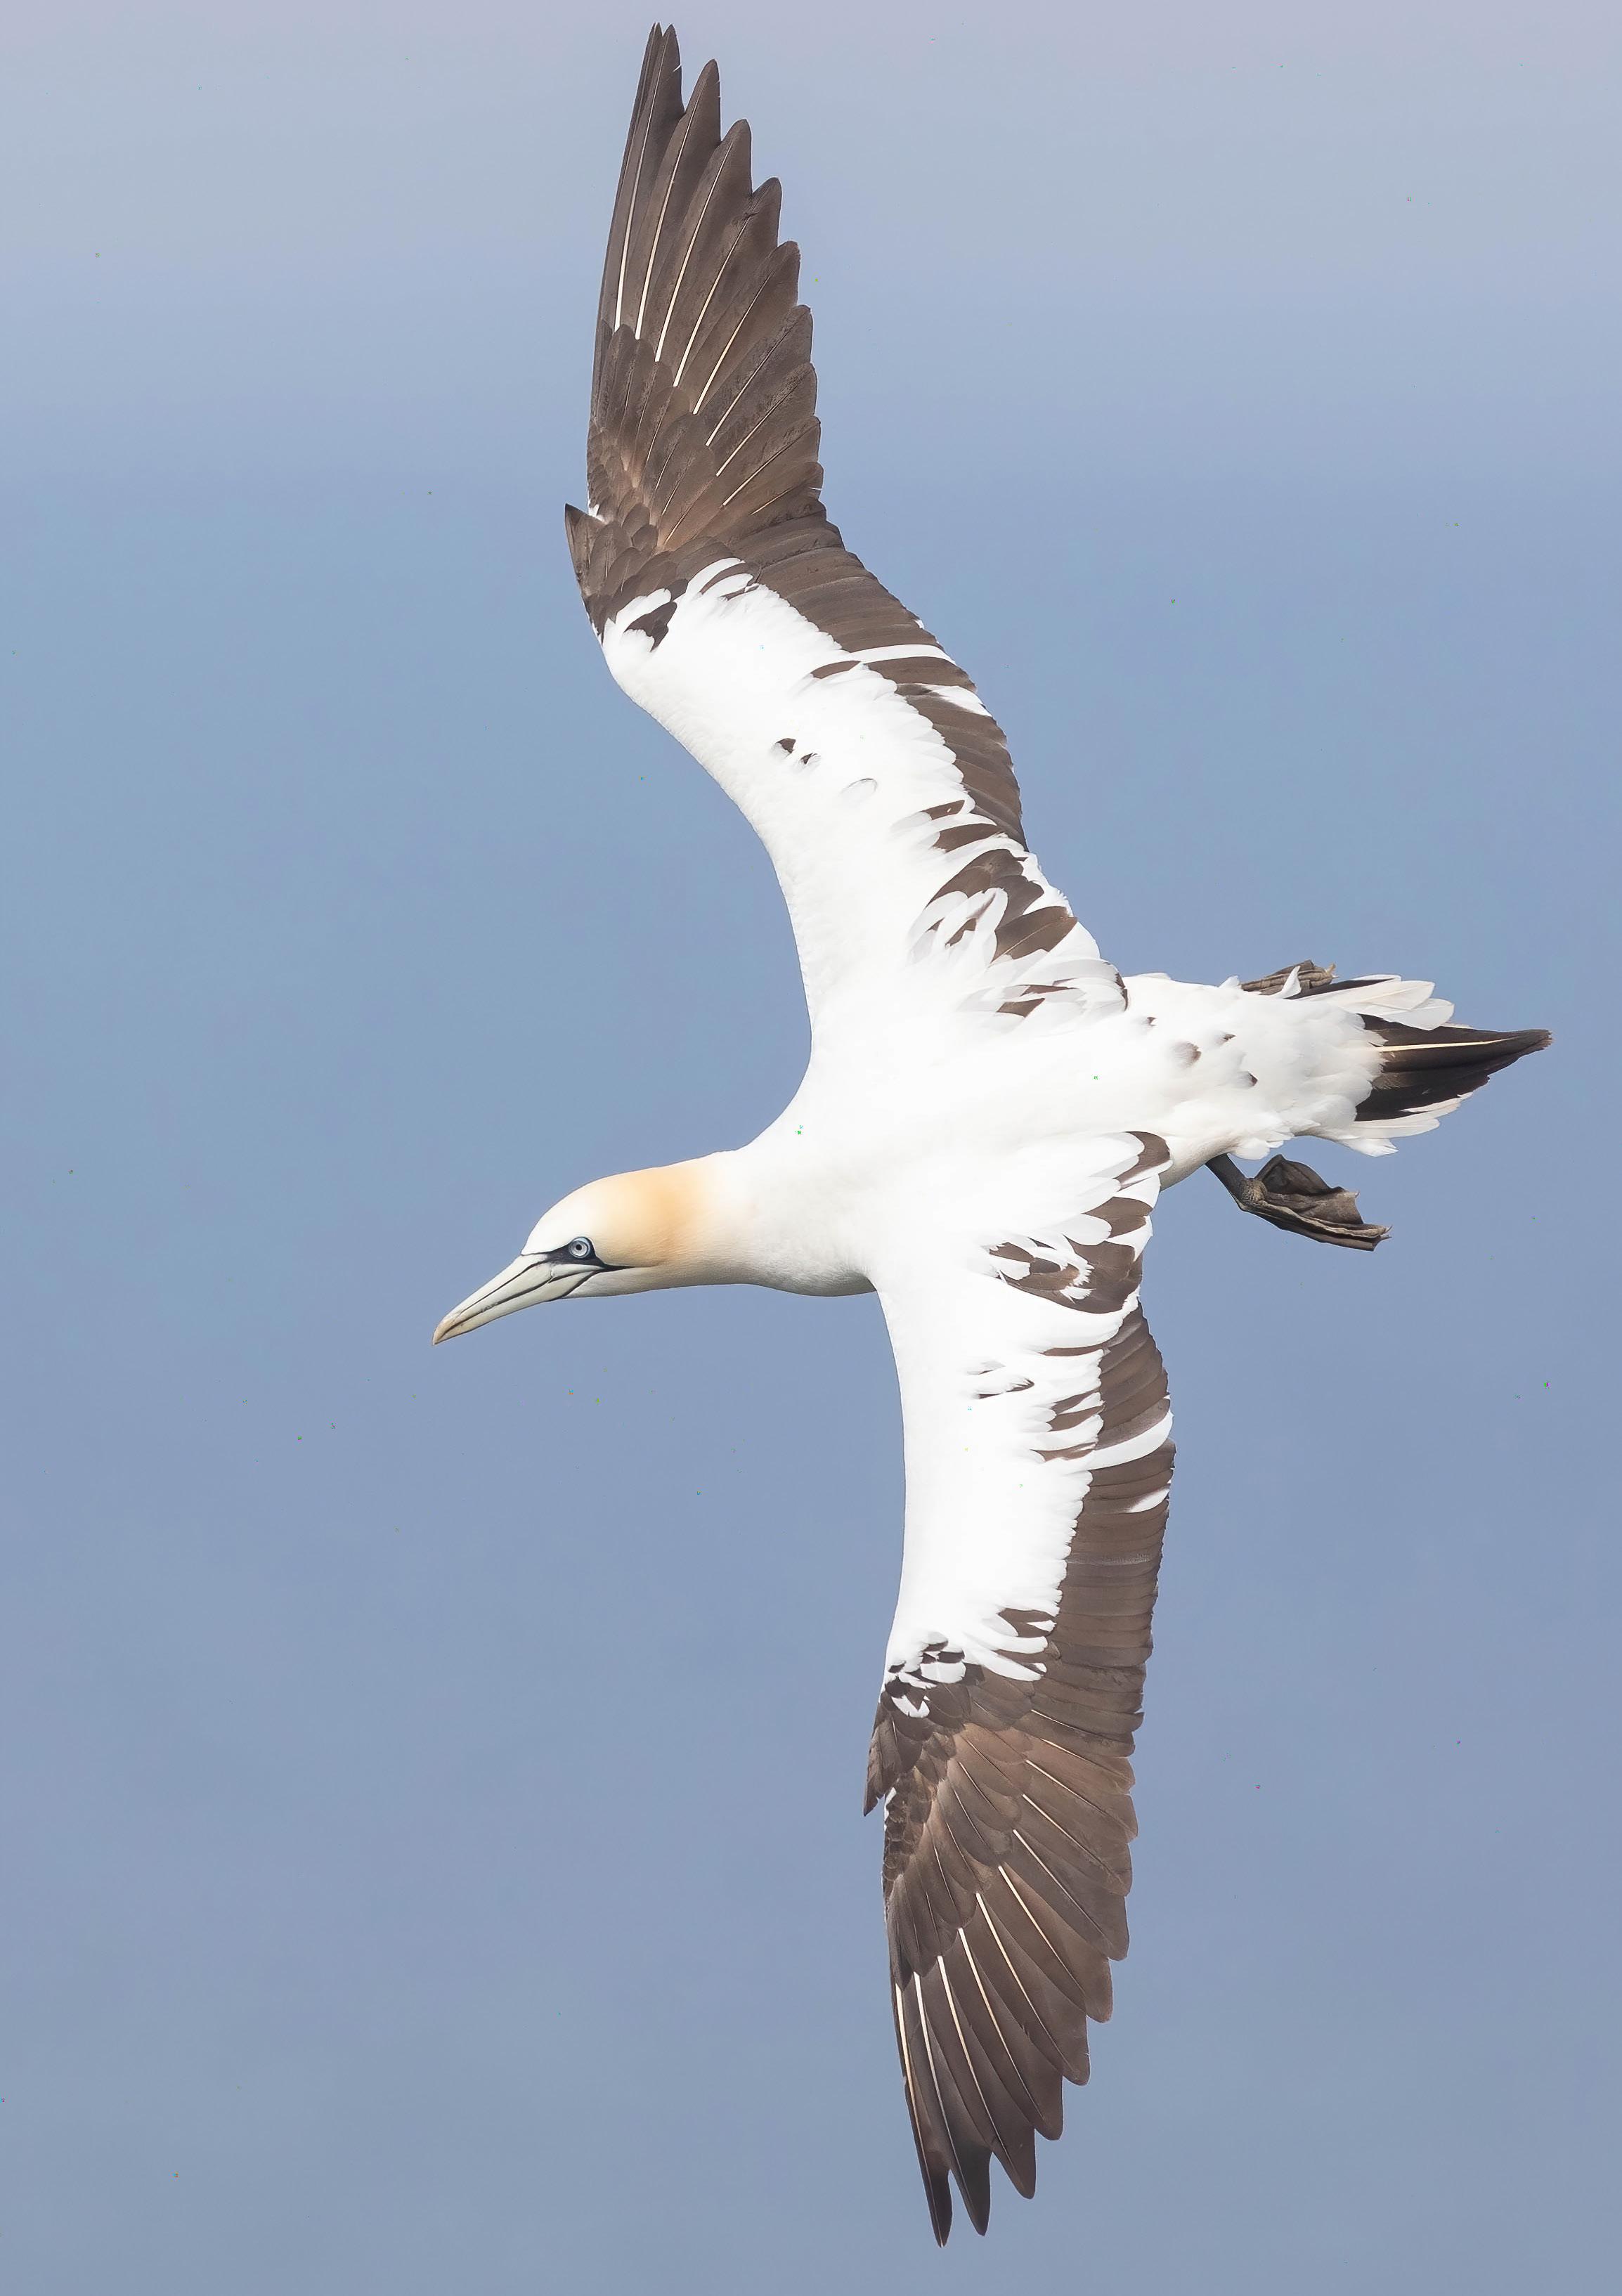
Phalacrocorax carbo
c.3—4% ssp. carbo/sinensis
Green-listed
Amber-listed (I)
Least concern
Abundance: Stable
Productivity: n/a
Colony Count sites: 44
Breeding Success sites: 6
Lifespan: 11 years
Breeding age: 3 years
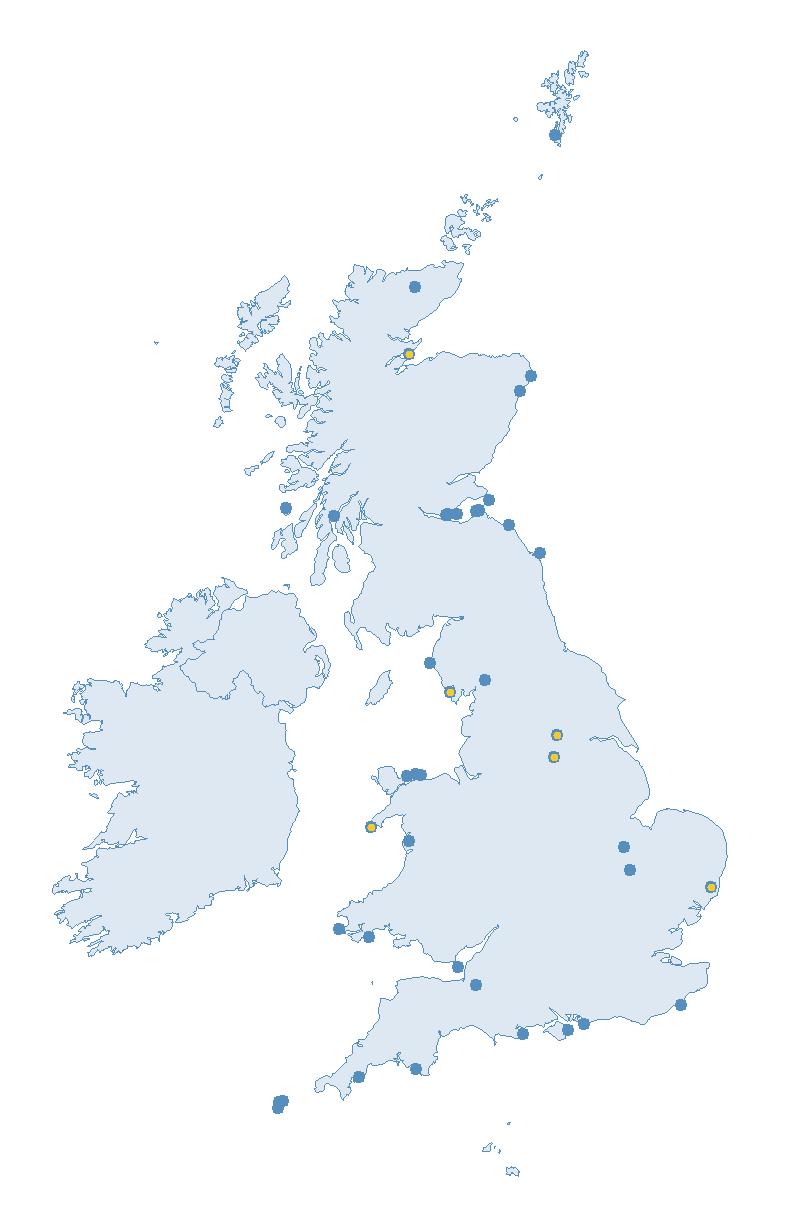
Britain and Ireland host a minimum of 2% of the global breeding population of Cormorant (Burnell et al. 2023). Two subspecies of Cormorant, carbo and sinensis, breed in Britain and Ireland. Throughout the island of Ireland and on coastal Britain, the predominant subspecies is carbo, whereas both subspecies are present in breeding colonies in inland areas of Britain. Combined, these subspecies total approximately 3—4% of the global carbo and sinensis subspecies (BirdLife International 2024).
Since 1981, Cormorants in Britain and Ireland, thought of as primarily coastal birds, have increasingly used inland lowland lakes and rivers throughout the year and also established successful breeding colonies inland. It is thought that these inland colonies were initially established by the immigration of a subspecies from Continental Europe, Phalacrocorax carbo sinensis, although some inland sites are currently also populated by the subspecies Phalacrocorax carbo carbo (Newson et al. 2013).
Today, breeding colonies are widely distributed around the coasts of Britain and Ireland, and many inland colonies occur in England and the Republic of Ireland (Burnell et al. 2023). Cormorant breeding colony locations may remain constant for long periods, but can also suddenly shift in location. (JNCC 2021; BTO 2023a).
With the exception of South America and Antarctica, Cormorants are found across the globe (del Hoyo et al. 1992).
Their movements vary from being preferentially sedentary, dispersing locally, or having longer migrations (del Hoyo et al. 1992).
Cormorants are generalists, feeding on a range of fish which they catch by pursuit diving (Grémillet et al. 2003). This includes species that are popular with anglers, such as Atlantic Salmon (Salmo salar) and Sea Trout (Salmo trutta trutta). Legal control of Cormorants is permitted for a limited number of individuals under specific licences issued by the Statutory Nature Conservation Bodies.
Coastal nesting birds, predominantly of the subspecies carbo, can be found on stacks, rocky islets, cliffs or rocky promontories. Inland, nesting Cormorants of either subspecies (carbo or sinensis), favour lakes and rivers, nesting in trees, bushes, reedbeds or on bare ground, and artificial structures may also be used. Depending on the location, nest type ranges from a
simple depression to a large platform, often using sticks, reeds and seaweed where 3–4 eggs are laid (Bregnballe et al. 2014; del Hoyo et al. 1992; Newson & Austin 2021).
The Cormorant SMP abundance trends since 2000 for the UK and England (Table 11) are largely in agreement with those reported by the Seabirds Count census, with both indicating stable populations (Burnell et al. 2023). However, the 23-year SMP trend for Wales indicates an increase of 14% (Table 11), whereas the Seabirds Count census results report a decline of 17% since the Seabird 2000 census (Burnell et al. 2023). It is possible that the small number of sites monitored in Wales for the SMP accounts for this discrepancy.
The UK SMP abundance index for Cormorant (which includes inland and coastal breeders) has fluctuated over the whole SMP reporting period, with several periods of increase followed by declines (Figure 12). The lowest
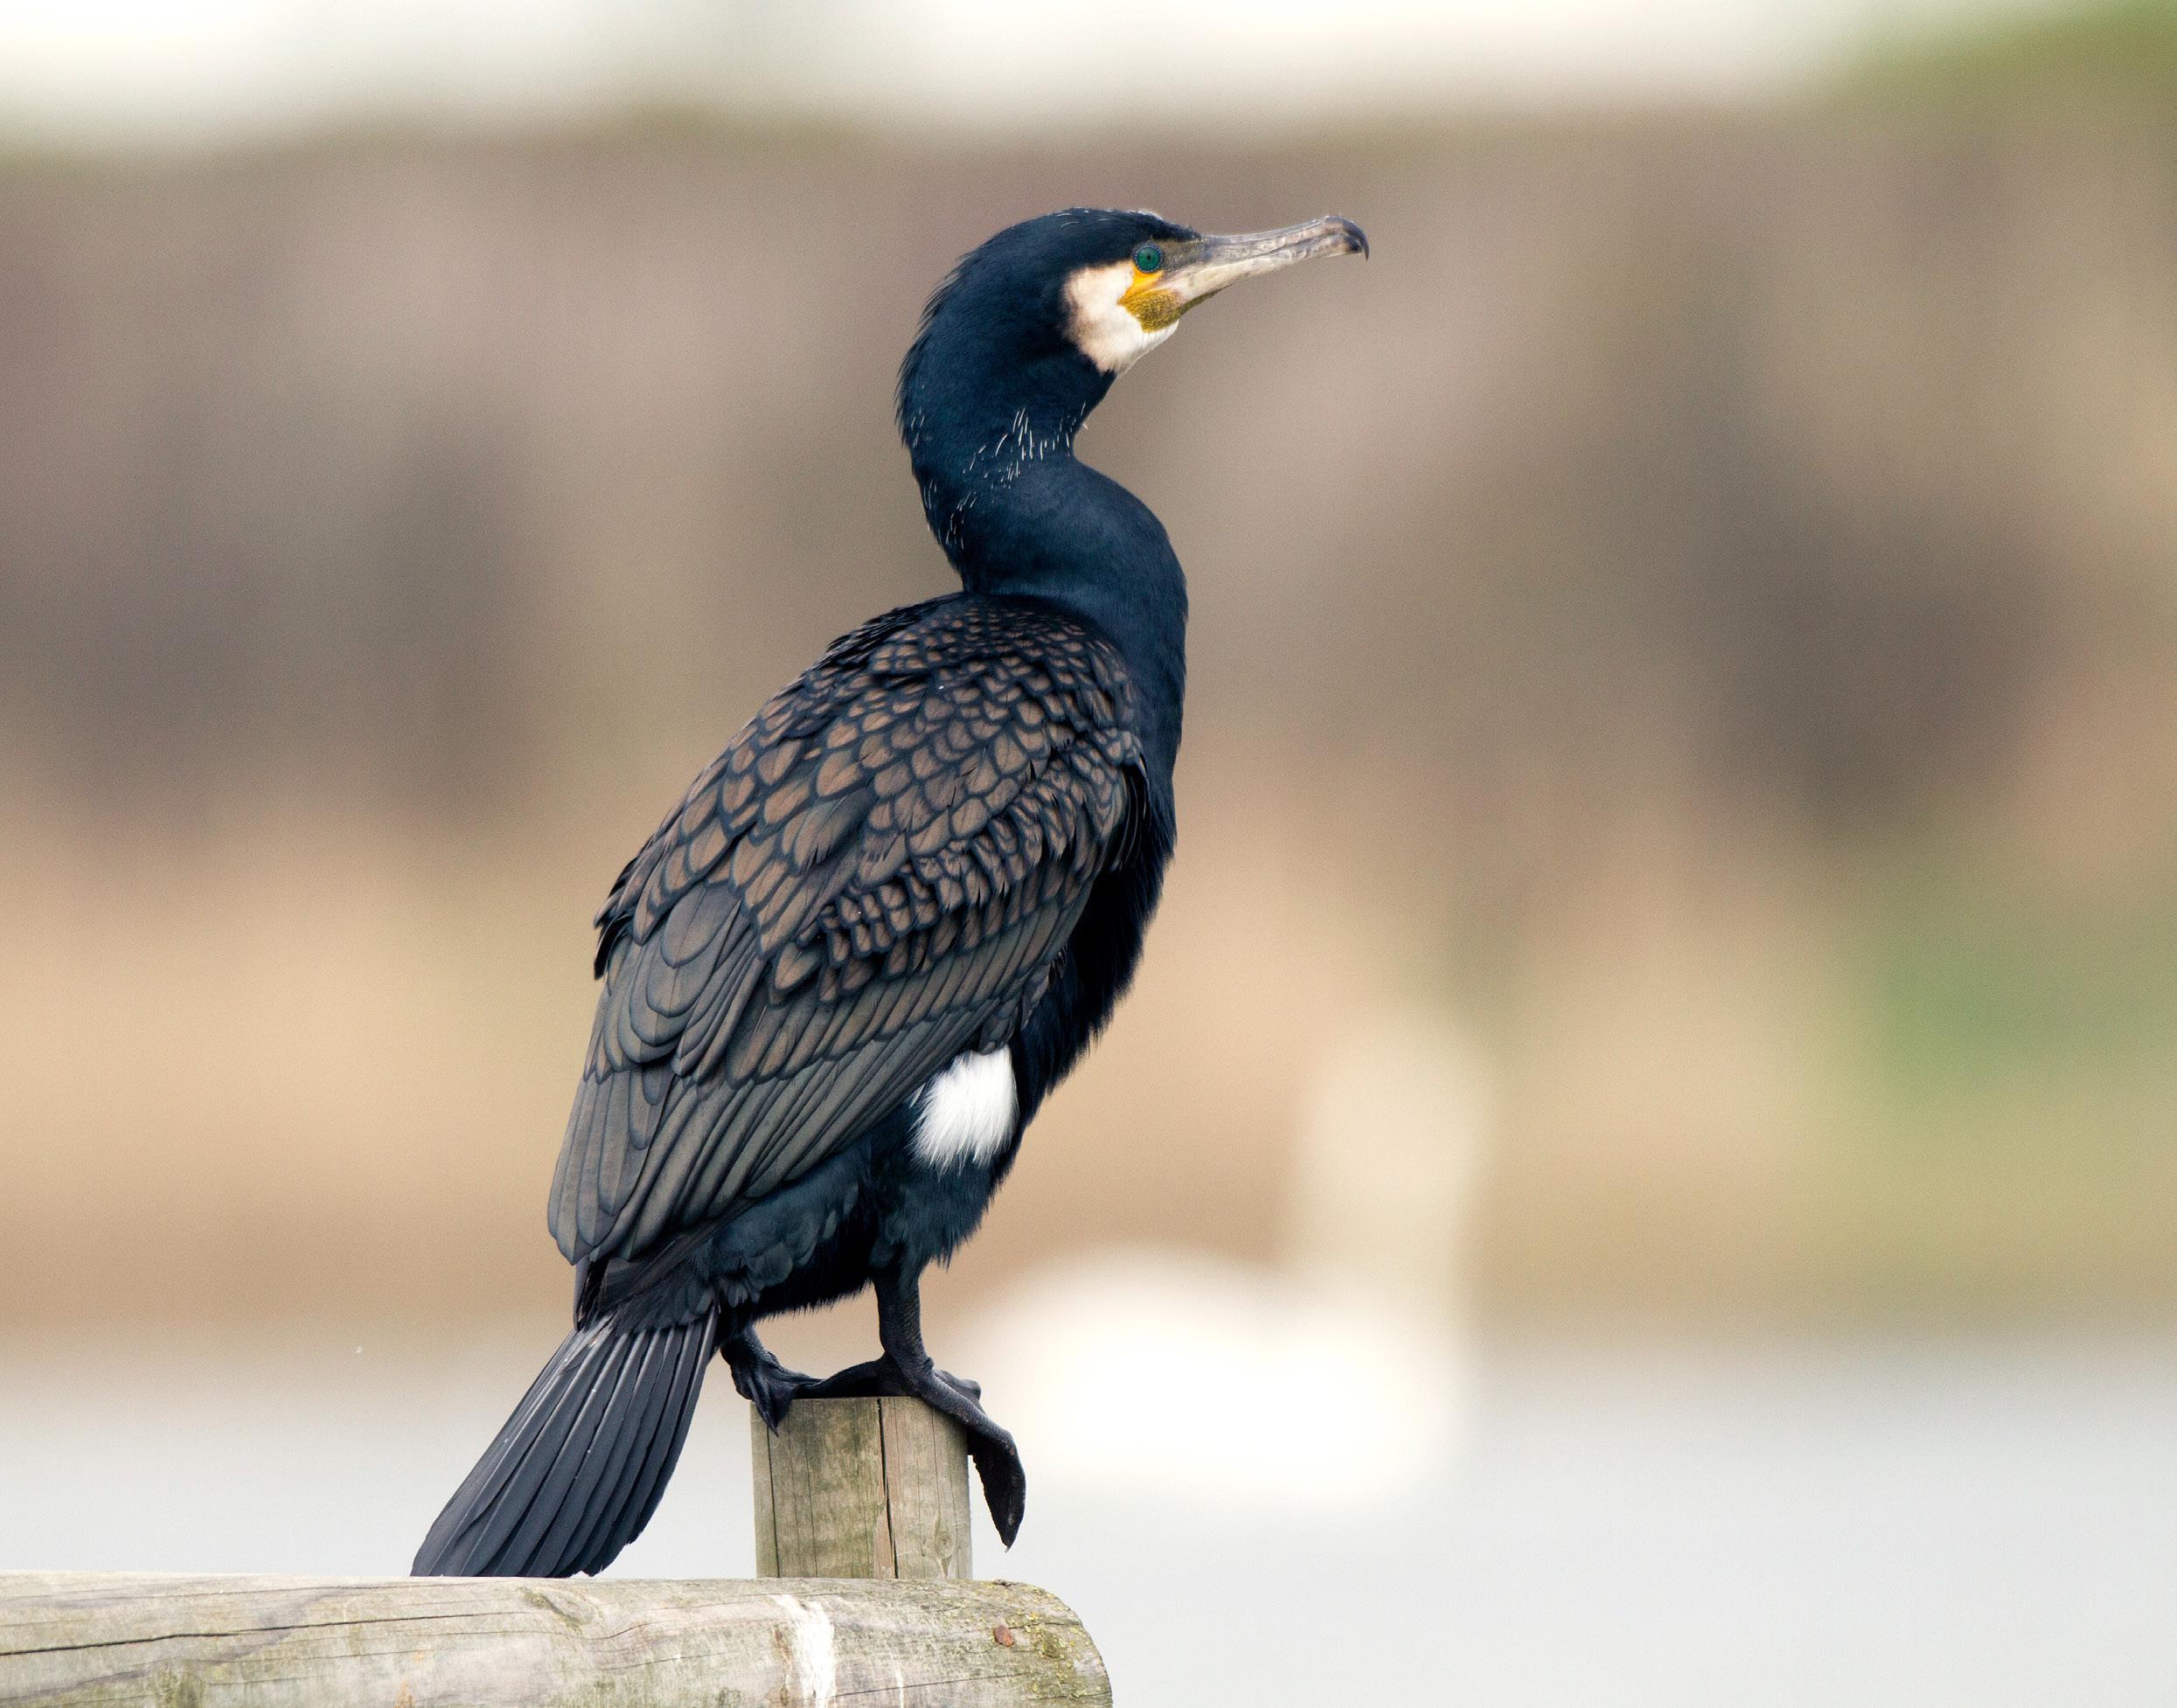
value was recorded in 2013, when the index was approximately 10% below the baseline, although since then, it increased markedly and in 2022 was almost 30% above the baseline. In 2023, however, the long-term UK trend declined to 5% above the baseline. The Cormorant abundance trends for England and Wales have also fluctuated across the SMP reporting period (Figures 13 & 14). In 2023, the England trend index fell slightly to 40% above the baseline. However, there is high uncertainty (reflected by
Abundance (AON)
Seabird 2000 (1998—2002)
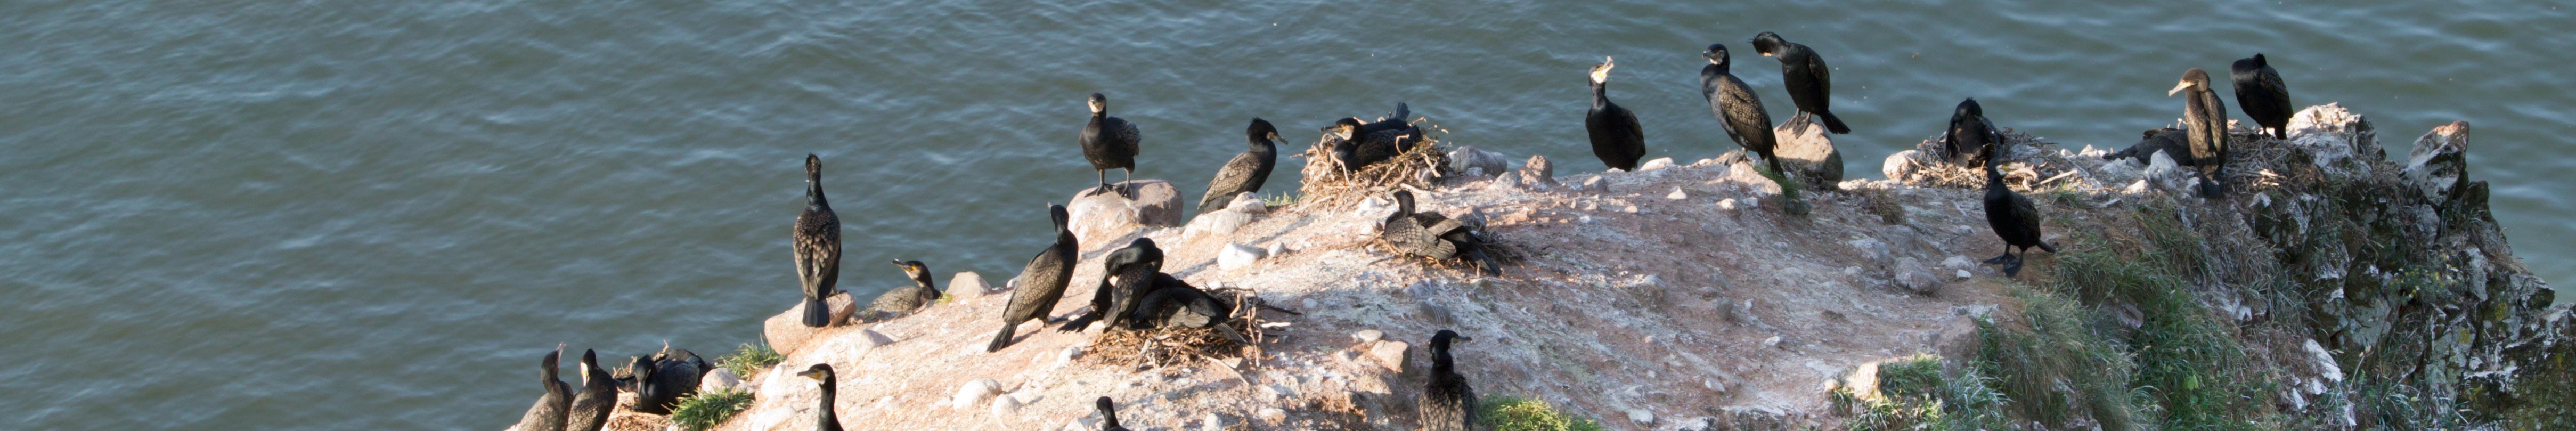
the wide confidence intervals) around the England trend between 2021 and 2023, due to fewer sites monitored compared to previous years (Figure 13). The abundance trend for Wales has remained relatively stable since 1986, albeit with some fluctuation, falling slightly to 13% below the baseline in 2023 (Figure 14).
Too few data are currently submitted to the SMP in other regions to allow for the calculation of meaningful abundance trends.
An insufficient number of Cormorant colonies are monitored across all regions to allow for the production of valid annual productivity trends.
PHENOLOGY, DIET AND SURVIVAL RATES
No data have been collected as part of the SMP.
Licensed lethal control and shooting to scare off piscivorous birds, such as Cormorants, are legal actions that may be used to support salmonid conservation. Analysis of the Welsh Cormorant population viability highlighted that the majority of predicted outcomes of different levels of lethal control were population declines, which could impact on their conservation status (Macgregor et al. 2022). In England, 2,614 individuals on average were killed under licence each year between 2015/16 and 2018/19, which is suggested to be a major threat to populations there (Newson & Austin 2021). However, population level impacts of control are difficult to quantify.
Disturbance at inland colonies and erosion of cliffs at coastal locations can influence availability of suitable
nesting habitat, as can climate-related flooding of nest sites through storms or extreme rainfall (Burnell et al. 2023).
Cormorants are also identified as being susceptible to becoming bycatch in gillnets, longlines and trammel net fisheries during operations. It is thought this could have a population level impact (Bregnballe & Frederiksen 2006).
Cormorant populations could potentially benefit through the reduction of conflicts with anglers. A recent paper from Finland highlights that effective stakeholder engagement at a local scale will be important for the continued conservation of Cormorants in light of the conflicts faced with anglers (Nordberg & Salmi 2019).
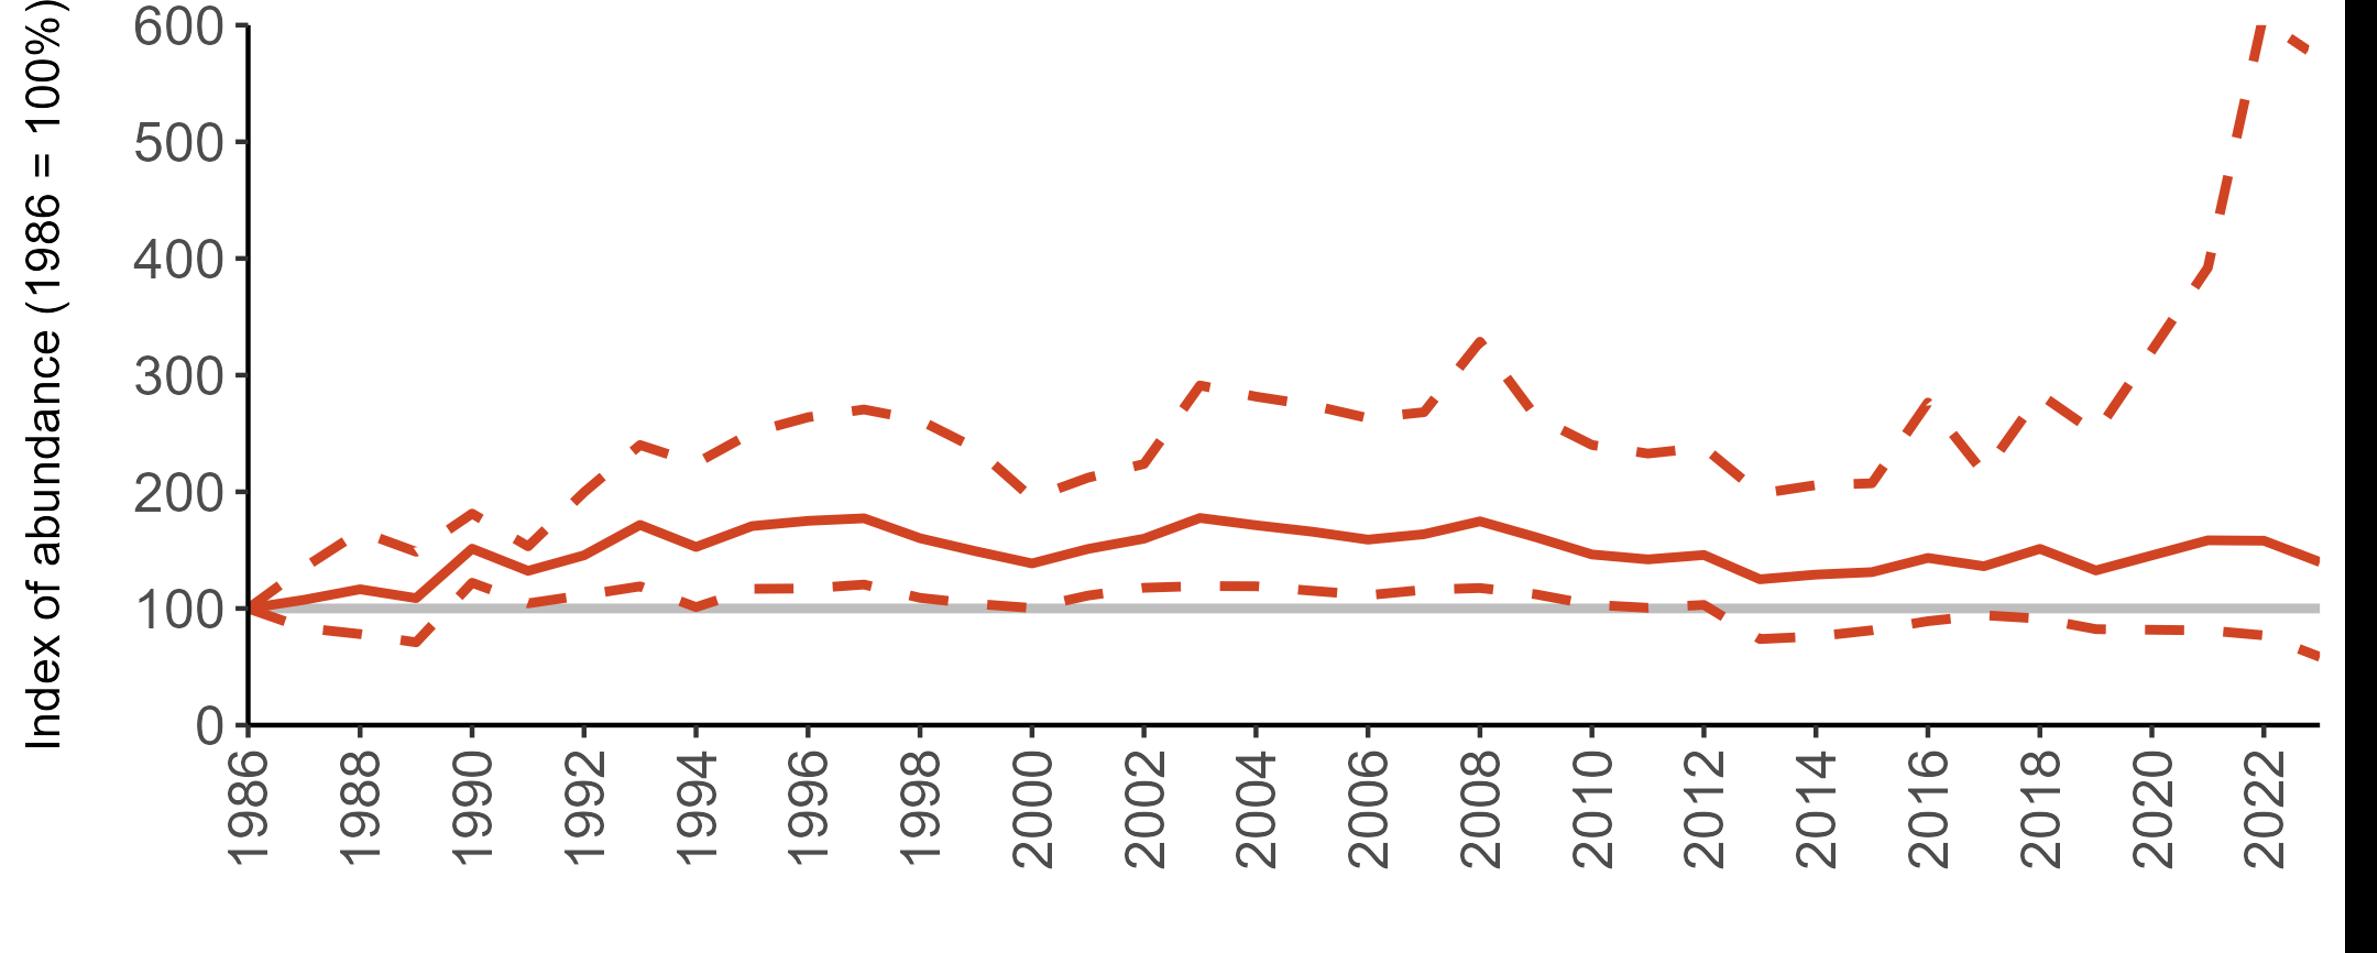
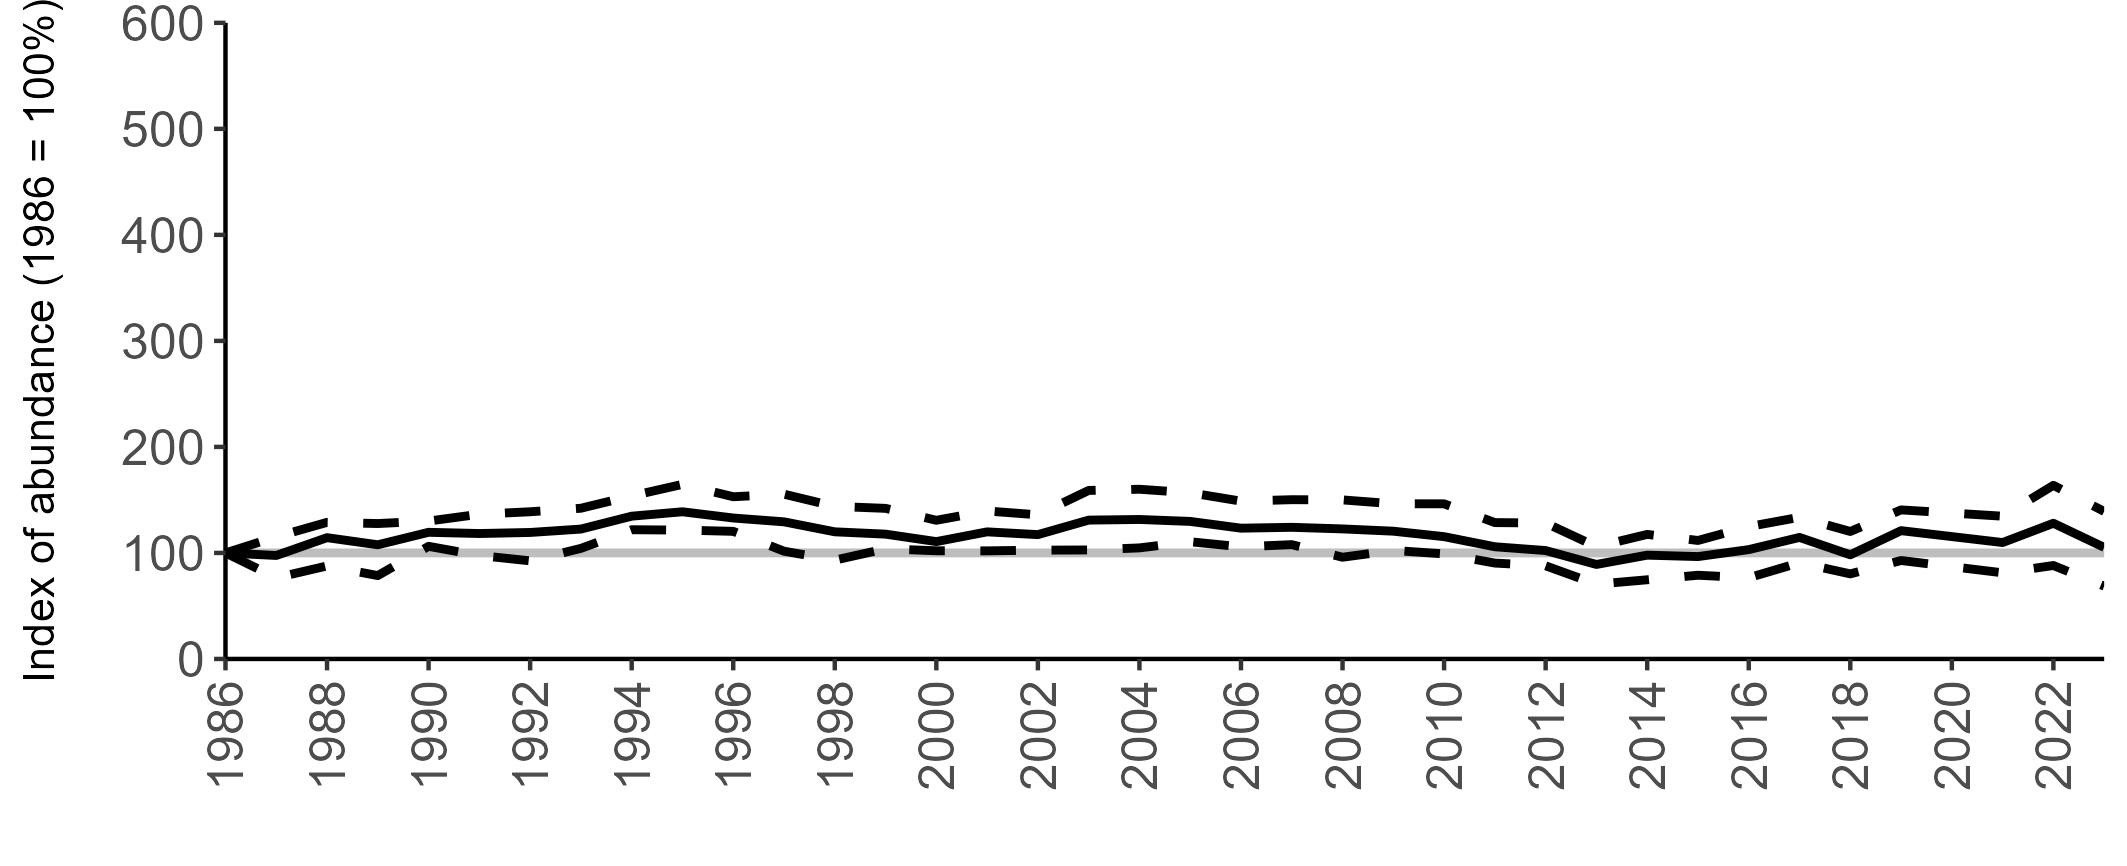
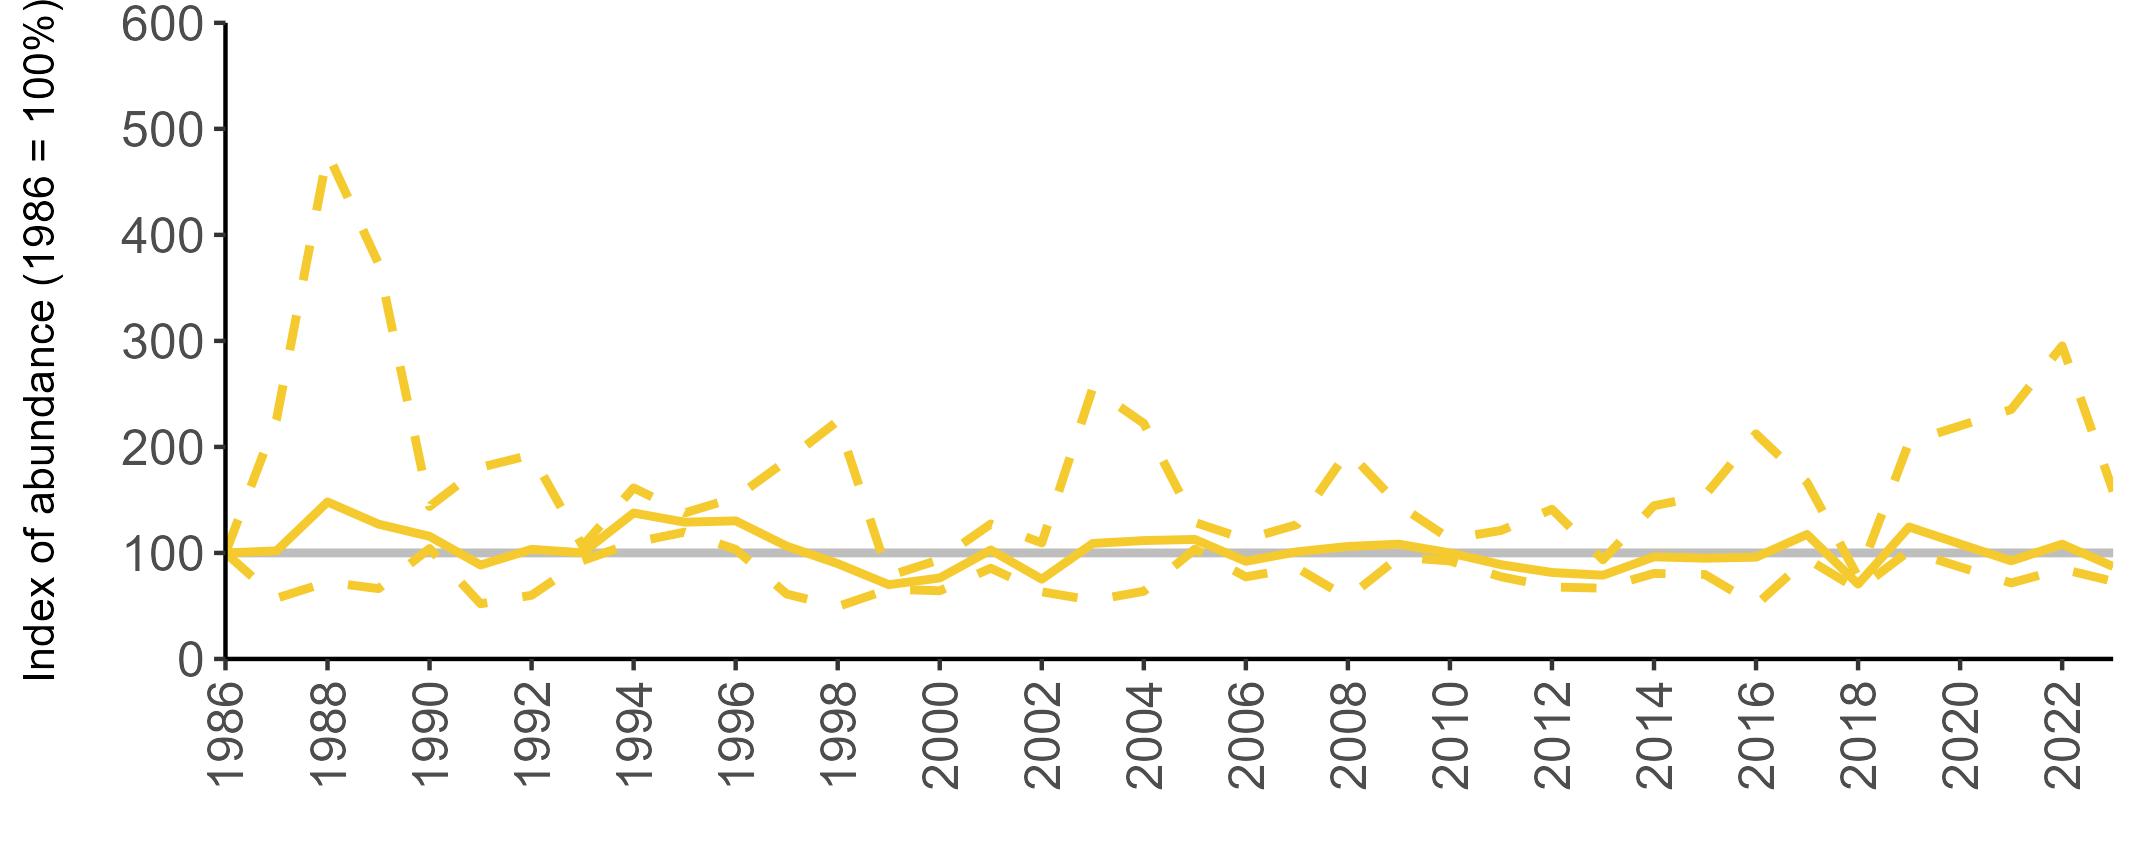
Gulosus aristotelis
c.38%
ssp. aristotelis
Amber-listed
Amber-listed (I)
Abundance: Decline
Productivity: 1.38
Colony Count sites: 163
Breeding Success sites: 18
Least Concern Lifespan: 12 years
Breeding age: 4 years
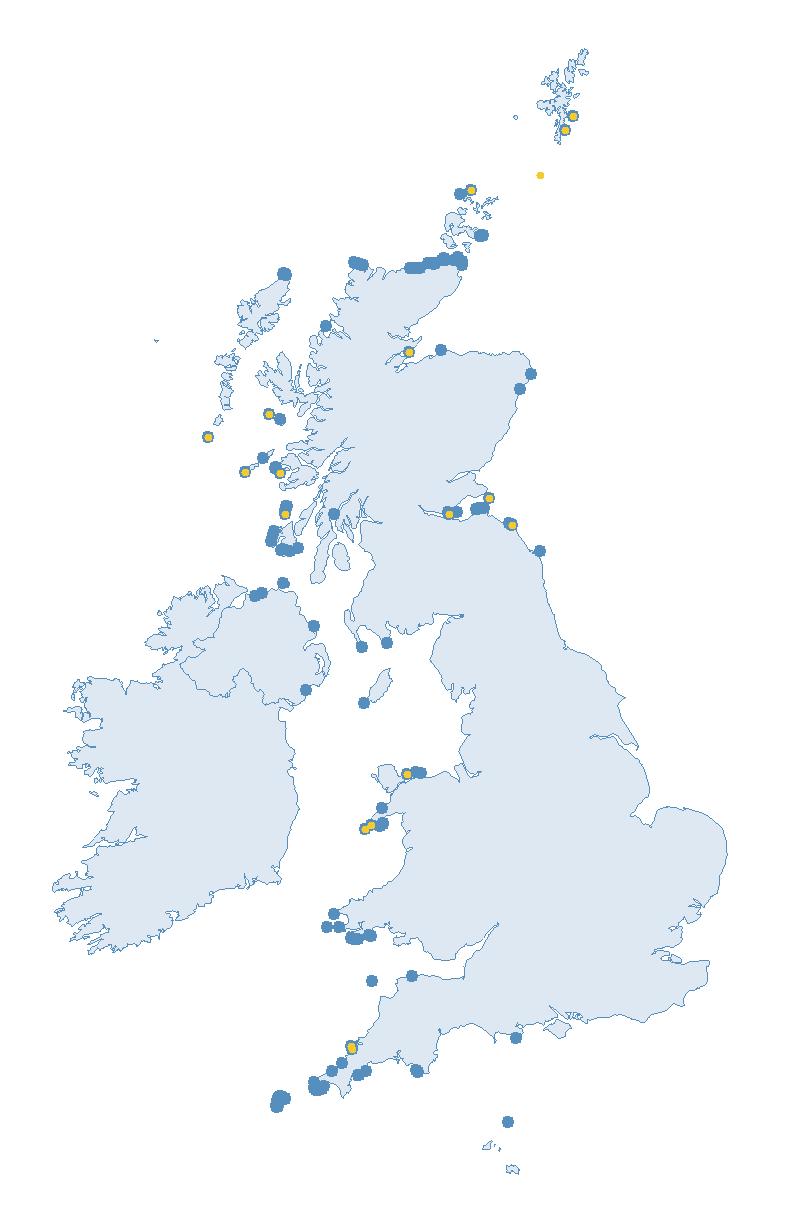
Britain and Ireland host between 22 and 23% of the world’s breeding Shags, and approximately 38% of the subspecies aristotelis (Burnell et al. 2023). Long-term monitoring of Shag at their breeding colonies has revealed they can be long-lived, with the oldest Shag bird ringing record being 29 years, 10 months and 25 days from bird ringing data (BTO 2023a).
In Britain and Ireland, Shag breeding colonies are mainly found on northern and western coastlines, where suitable cliffs are present (Burnell et al. 2023).
They are endemic to the north-east Atlantic, Mediterranean, Black Sea and north Moroccan coasts (BirdLife International 2024). The north and west of Europe is home to the nominate subspecies, aristotelis (Gill et al. 2023).
Shag are not long-distance migrants, instead dispersing within their range during the non-breeding season (del Hoyo et al. 1992). This is true for British and Irish breeding birds, which remain around the coastline, occurring in particularly high densities in northern and western Scotland and western Ireland (BTO 2023a).
Their diet is linked to local prey availability and consists of a range of small fish species, such as sandeel and gadids. Shag forage for prey in open water, with benthic dives over sandy and rocky substrate (Harris & Wanless 1991; BTO 2023a).
Shags nest in colonies which can range in size from just a few pairs to several thousand. Nesting sites are generally found on rocky coastlines and islands, in boulder fields, on ledges or in caves, and they lay between one and four eggs (Burnell et al. 2023; Wanless & Harris 1997).
BREEDING ABUNDANCE
The decline in the UK Shag SMP abundance trend since 2000 is largely in agreement with that reported by the Seabirds Count census, with an SMP index decline of 14% (Table 13) compared to 24% (UK) between censuses (Burnell et al. 2023). The Scotland 23-year trend value of 9% (Table 13) contrasts with the census trend, which showed a decrease of 22% over the same time period. The Welsh 23-year trend of -7% was a less severe decline than the 29% decrease recorded between Seabird 2000 and Seabirds Count (Burnell et al. 2023).
In recent years, the UK SMP longterm trend has increased, following a long period of overall decline, to 27% below the 1986 baseline in 2023
Seabirds Count Breeding Abundance Change % Productivity
Abundance (AON) Seabird 2000 (1998—2002)
Abundance (AON) Seabirds Count (2015—21) Percentage Change
(Figure 15). The SMP abundance trend for Scotland (Figure 16) closely matches the UK trend, as many of the colonies monitored are located in Scotland. However, the increase in recent years has been larger for Scotland, with an index value of 14% below the baseline in 2023 (Table 13).
The UK and Scotland SMP long-term trends contrast with that for Wales, which has largely fluctuated around the baseline since the late 1990s (Figure 17). The Wales index value in 2023 was 13% below the 1986 baseline (Table 13).
Too few data are submitted to the SMP from other regions to allow for the production of valid abundance trends.
The number of Shag sites monitored for productivity in Scotland make up the majority of the UK sample, which has resulted in both regions following a similar, relatively stable, trend since 1986 (Figure 18). In 2023, the productivity estimates were similar for Scotland and the UK, at 1.35 and 1.38 chicks fledged per pair,
respectively (Table 13). There is greater fluctuation in the Welsh productivity trend across the SMP monitoring period (Figure 18), although this has remained higher than the UK and Scotland trends until recent years. The productivity estimate was particularly low for Wales in 2021 compared to previous years, with just 1.13 chicks fledging per pair, but in 2023 the productivity estimate increased to 1.62 chicks fledged per breeding pair (Table 13).
Data submitted to the SMP on the productivity of Shags in other regions are sparse, so no meaningful average productivity values can be given.
PHENOLOGY, DIET AND SURVIVAL RATES
No systematic data on phenology have been collected as part of the SMP. However, diet information has been collected for Shags at the Key Sites of Canna and the Isle of May (Scotland) and adult return rates are estimated for Shags on the Isle of May and are published in the Key Site reports.
Climate change is indirectly impacting seabird populations through temperature-mediated changes in prey populations (Johnston et al. 2021). As a result, Shag diets have changed to adapt to the reduction in available key prey (Howells et al. 2018).
However, the situation is complex due to regional variations in prey abundance and local adaptation to the changes, making the overall impact hard to assess (Burnell et al. 2023).
A further impact of climate change on this species is the increased frequency of extreme weather events. When there is a sustained period of strong onshore winter winds, this can result in a wreck, where seabirds are unable to feed and are washed ashore, dead or dying (Newell et al. 2015). Several pronounced wrecks over the last few decades have involved significant mortality of Shags (Burnell et al. 2023). A wreck of seabirds in the 1990s was shown to significantly reduce the return rate of Shags the following year on the Isle of May, and resulted in a population crash (Harris & Wanless 1996). The impacts on Shag populations is cause for concern given that the frequency of such events is predicted to further increase (Rahmstorf & Coumou 2011).
While the population-level impacts of plastics on Shag remains a topic of research, plastics have been found to occur in their pellets, e.g. 63% of pellets collected from a Shag colony in north-west Spain contained plastic (Álvarez et al. 2018).
An additional potential pressure on the Shag population is accidental bycatch in fisheries (Northridge et al. 2020).
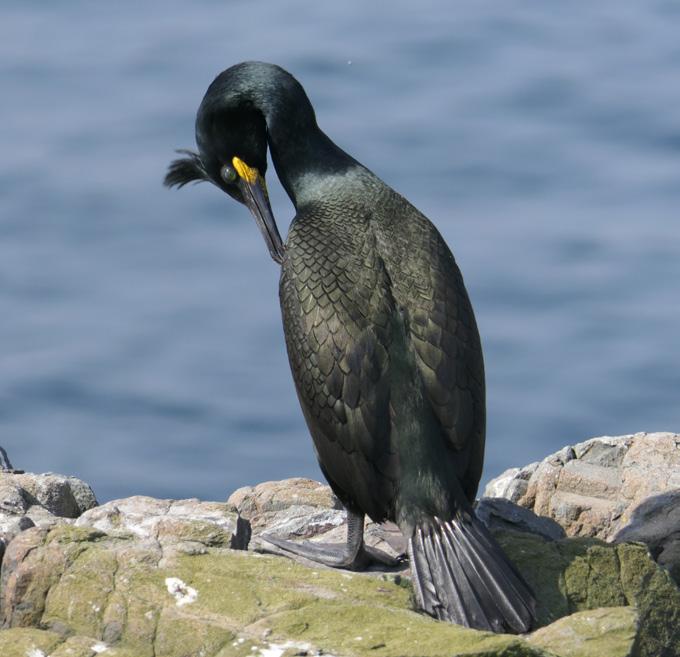
It is possible that Shags benefit from offshore wind farms; individuals from colonies in the Irish, North and Baltic Seas use turbine bases as places to rest between foraging bouts (Dierschke et al. 2016).
As for many other seabird species, measures implemented to reduce climate change, incidental seabird bycatch in the fishing industry and pollution of the marine environment are likely to benefit the UK Shag population.
Only 30% of the British and Irish population of Shag breeds within SPAs (Burnell et al. 2023). Designation of additional protected areas could also potentially have benefits for this declining species. Additional studies to identify important non-breeding areas could also prove valuable (Burnell et al. 2023).
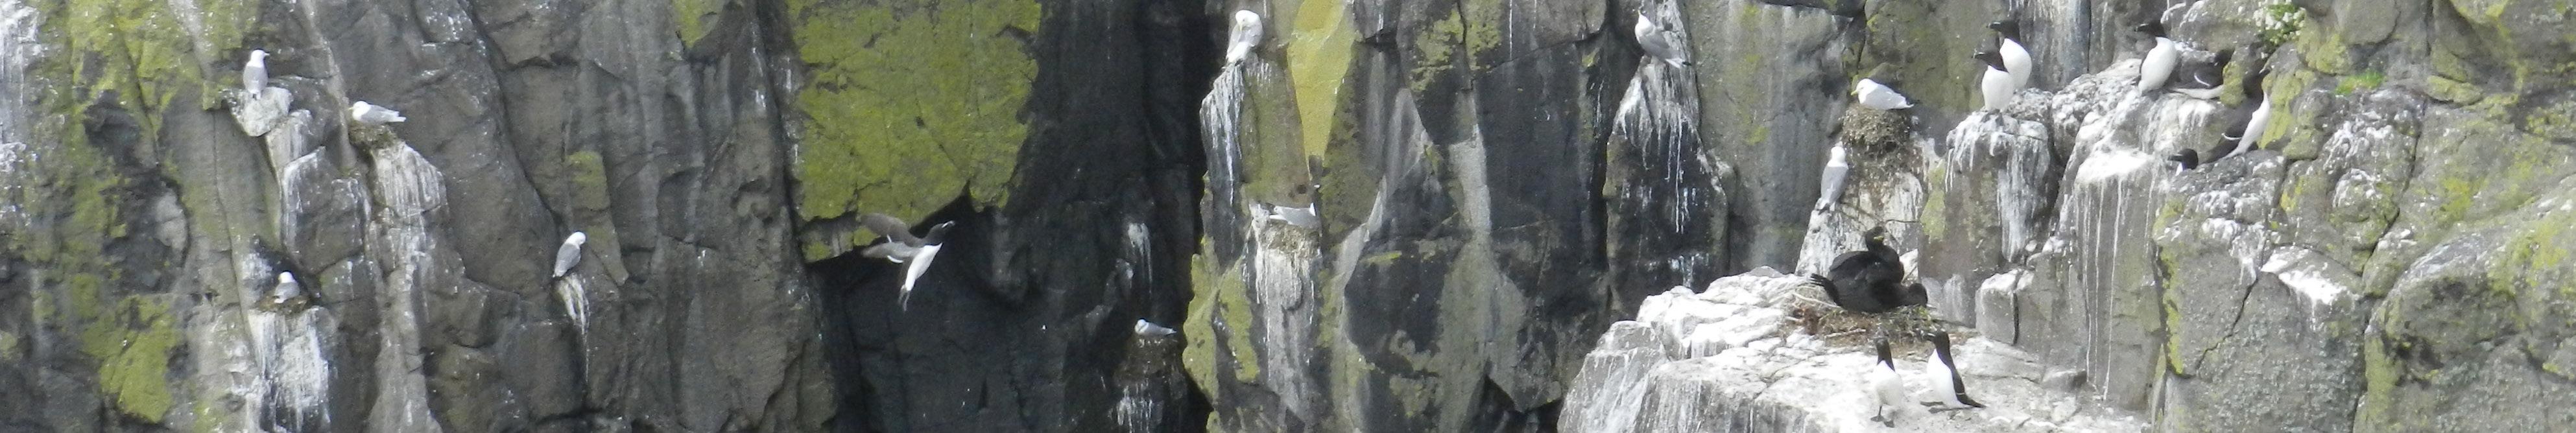
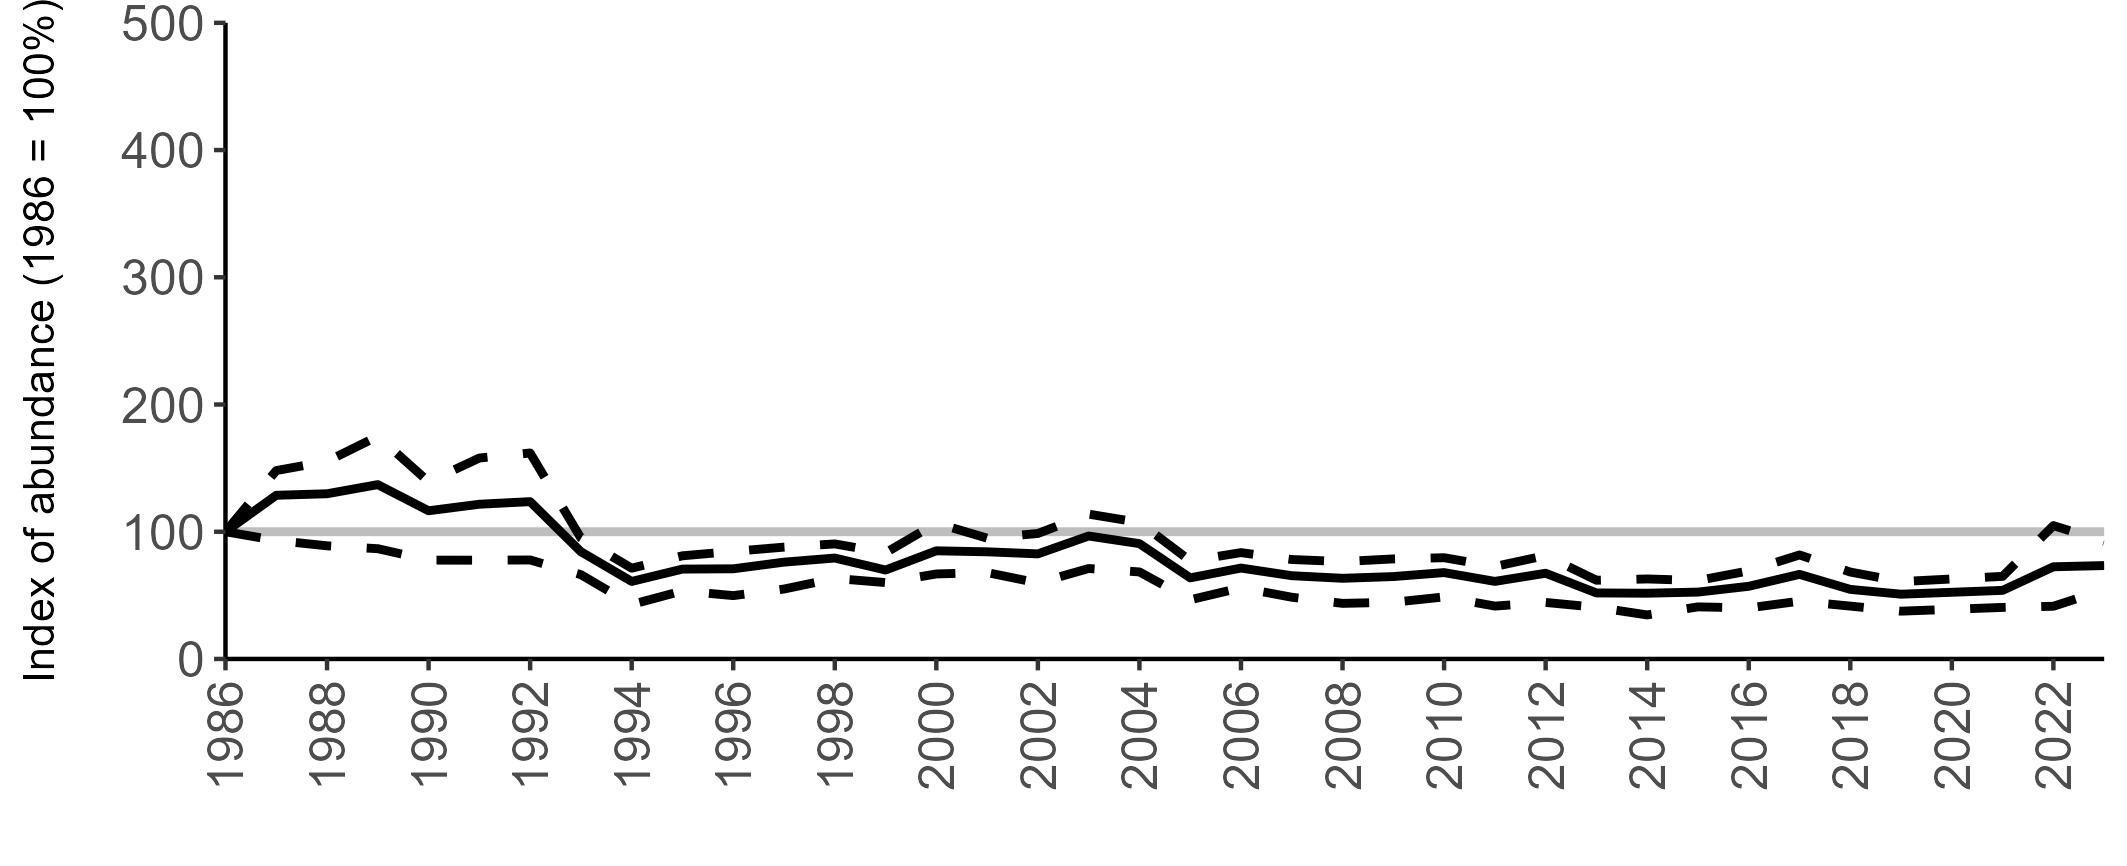
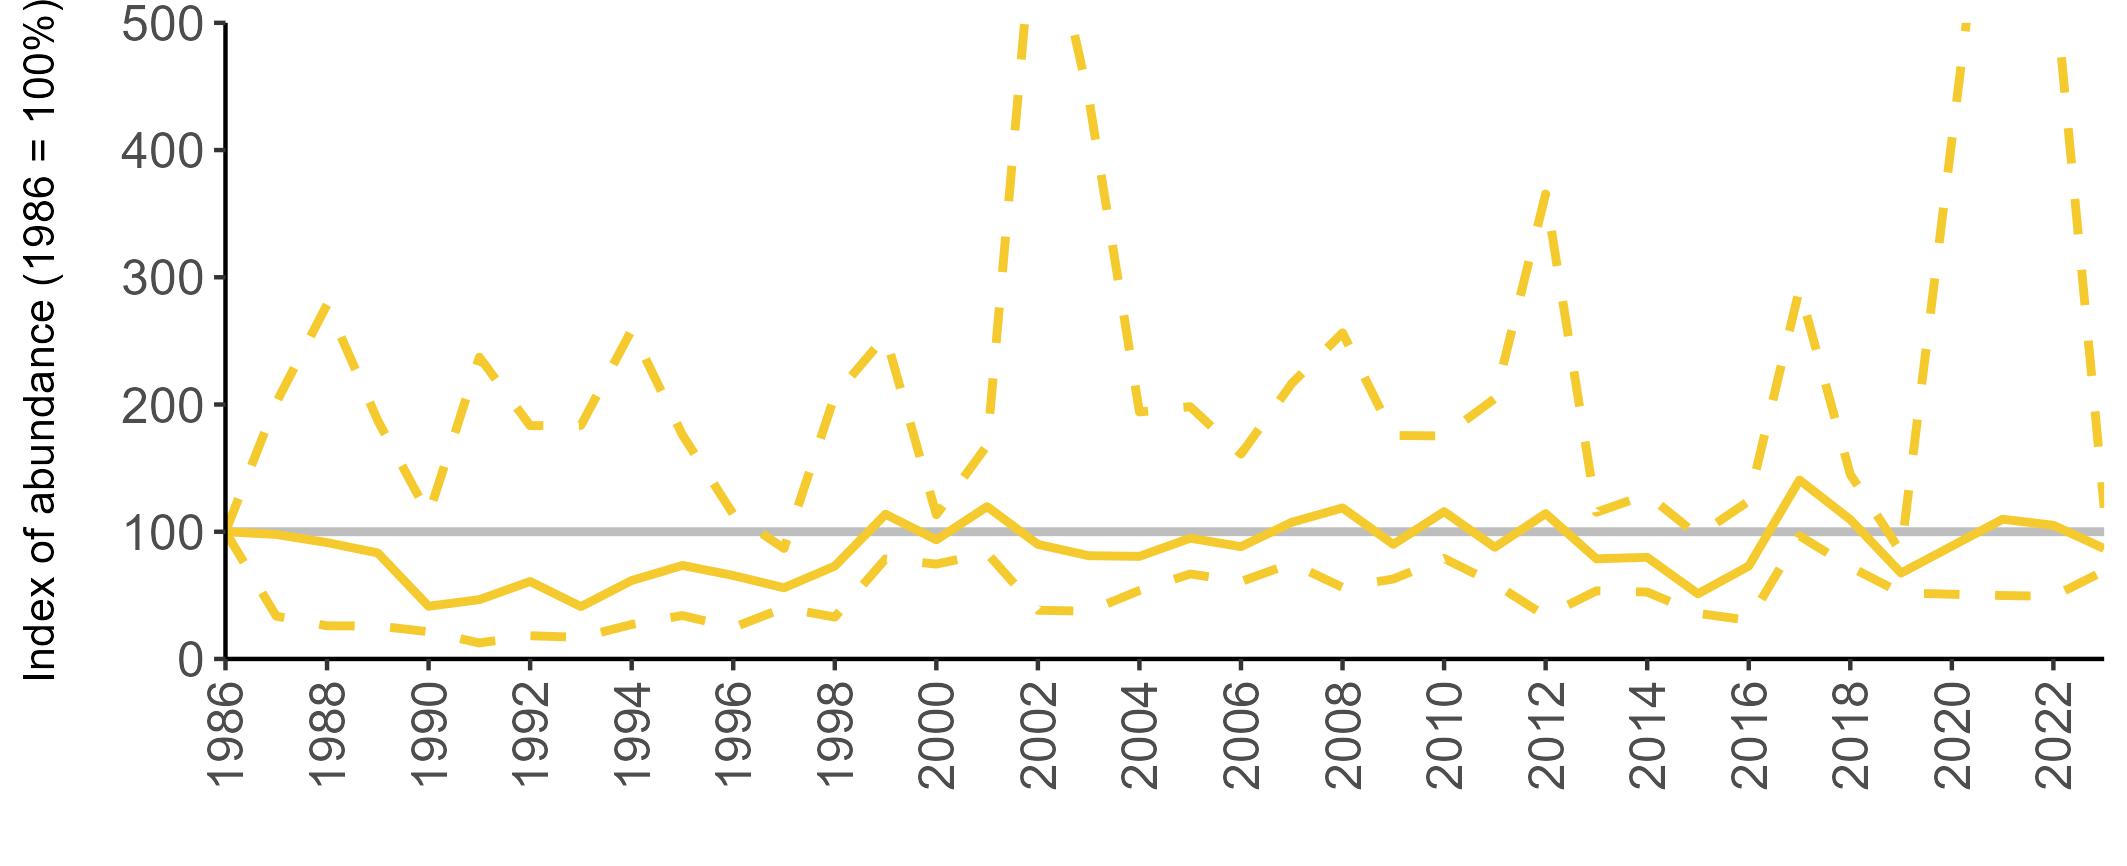
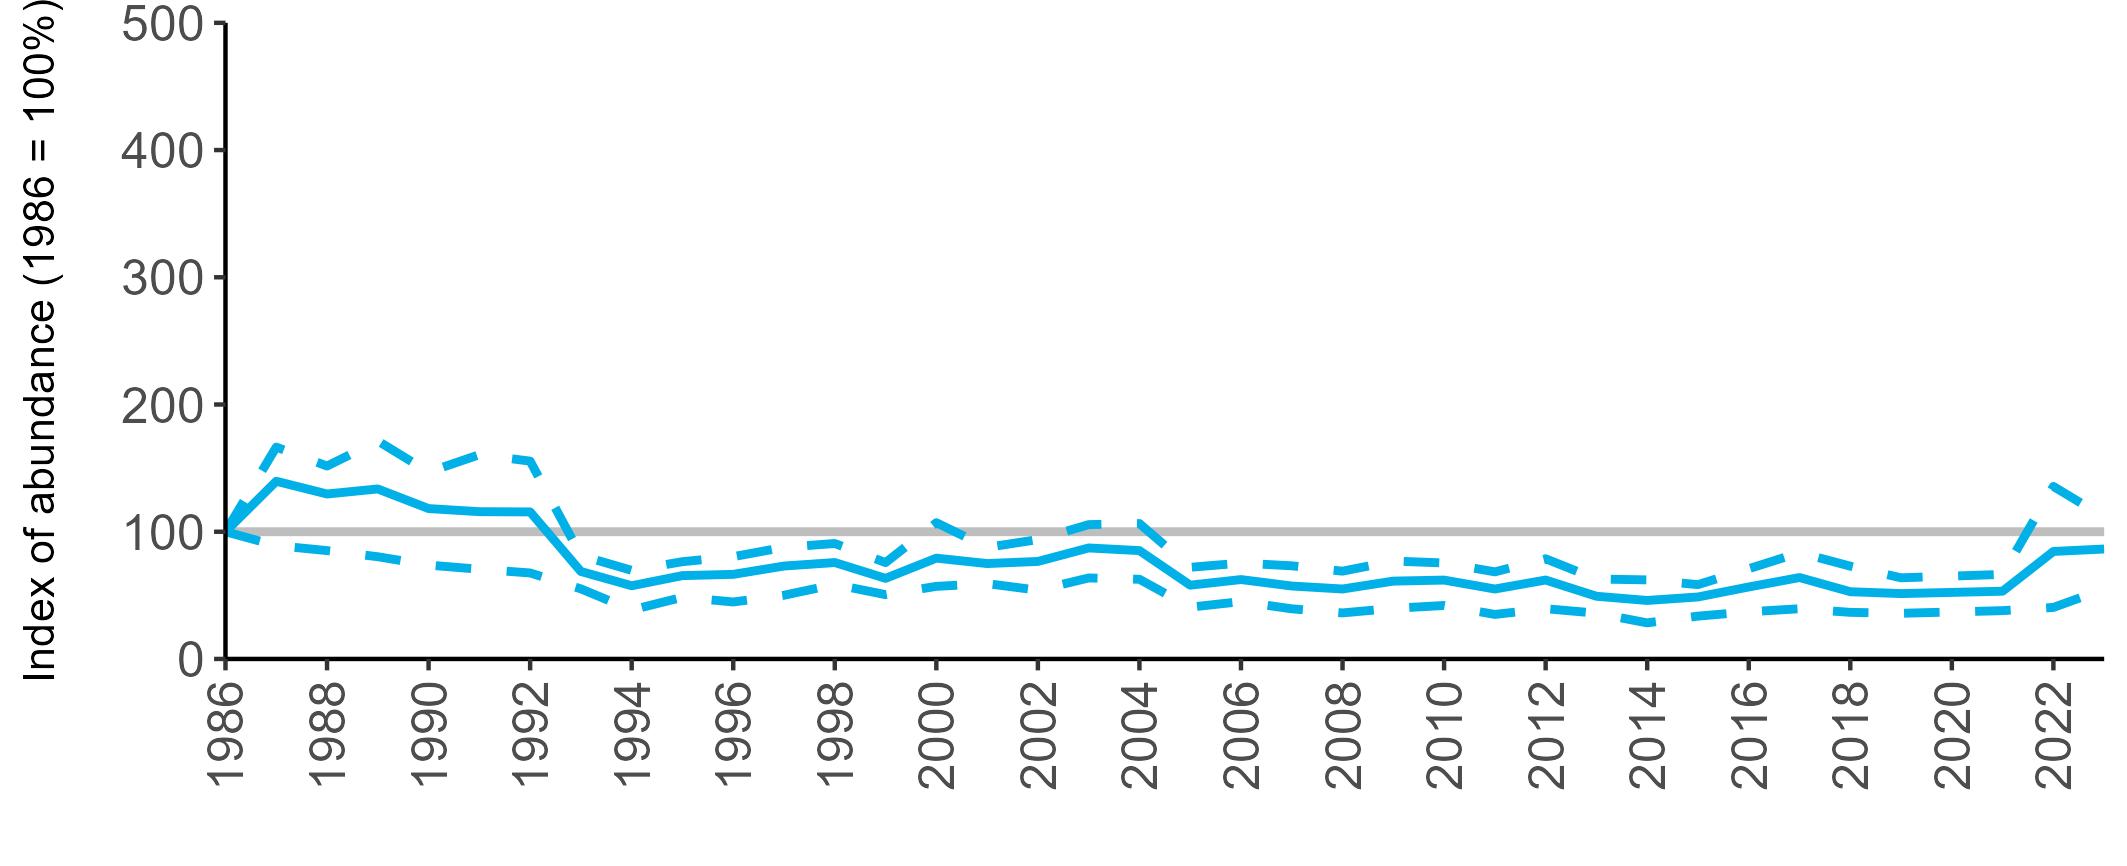
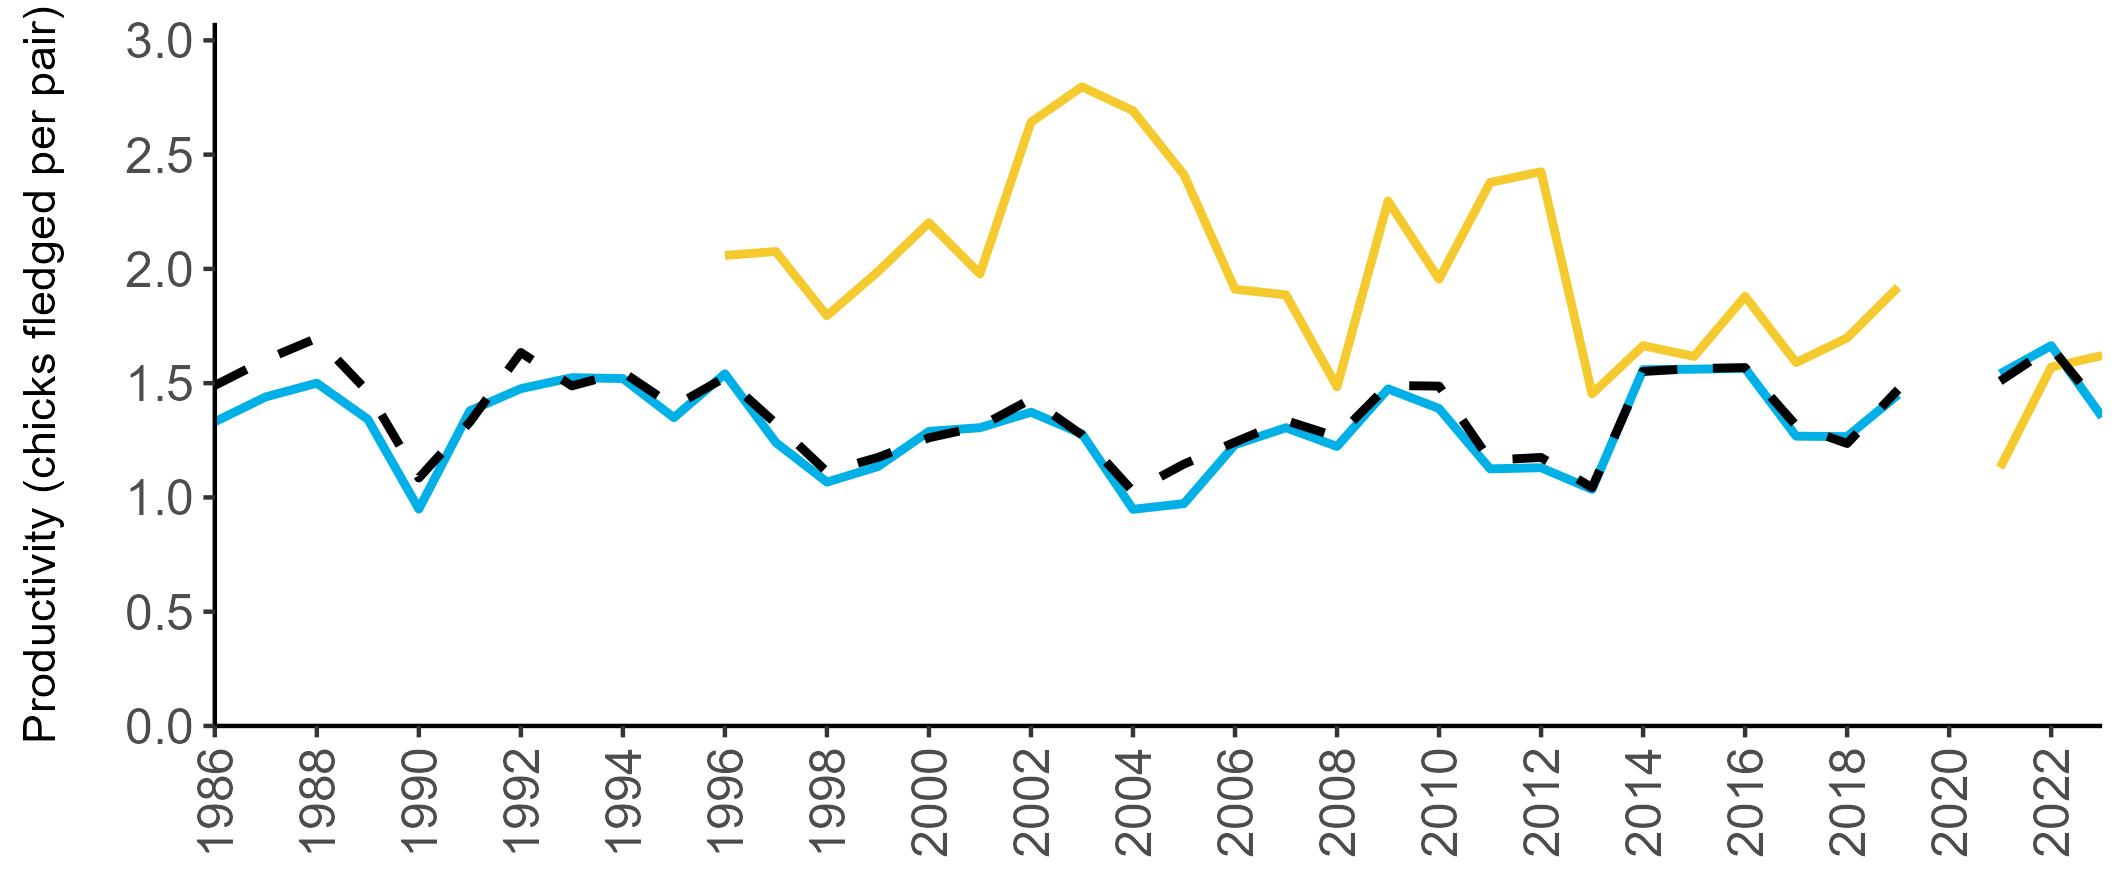
Abundance: Decline Productivity: 0.58
Colony Count sites: 263
Breeding Success sites: 2
Least Concern Lifespan: 12 years
Breeding age: 4 years
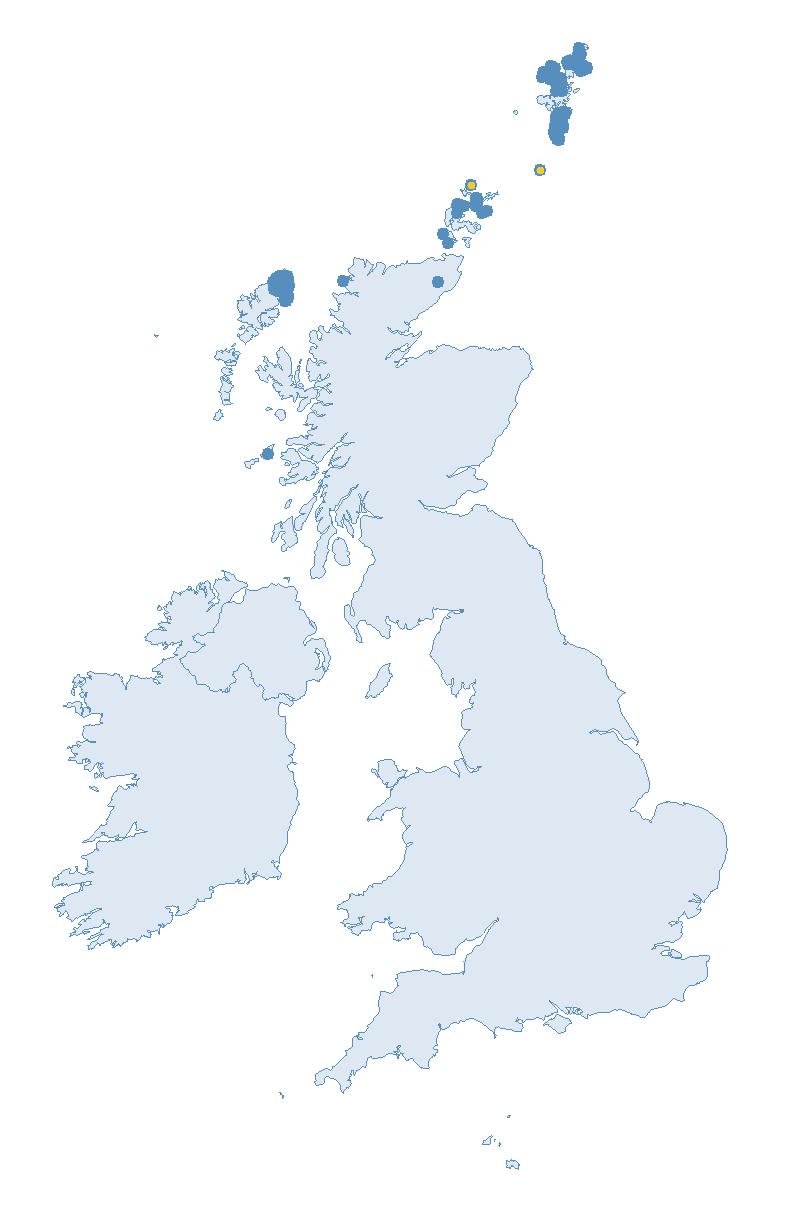
Britain and Ireland host 1—2% of the European population of Arctic Skua and 0.3—0.4% of the global population (Burnell et al. 2023). There are two main colour morphs, pale and dark phase. Pale phase birds dominate the northern latitudes of their global range, whereas dark phase birds are more common at the south of their range.
In Britain and Ireland, breeding Arctic Skuas are restricted to the north and west of Scotland, and they are particularly associated with the Northern Isles (Burnell et al. 2023).
Their global range encompasses the northernmost coasts of Eurasia and North America (del Hoyo et al. 1996), and the Scottish population is on the southern edge of its range.
Arctic Skua are transequatorial migrants wintering around the southern tips of South America, South Africa, Australia and New Zealand (del Hoyo et al. 1996). Scottishnesting birds winter off western and southern Africa, and South America (van Bemmelen et al. 2024).
In Scotland, Arctic Skua mainly forage by stealing fish from other seabirds (kleptoparisitism), but they have a varied diet with eggs, berries, insects, rodents and small birds also being consumed (Furness 1987). Due to their relatively small size, Arctic Skuas are not commonly found scavenging
behind fishing boats alongside larger competitors, or in multi-species feeding flocks (Furness 1987).
BREEDING
Arctic Skuas typically breed in loose colonies on moorlands or coastal grasslands, often close to colonies of the seabirds which they target for food. Between one and three (most commonly two) eggs are laid in a shallow scrape in the vegetation. (Burnell et al. 2023).
BREEDING ABUNDANCE
As the UK distribution of Arctic Skua is entirely restricted to Scotland, the SMP abundance trends for the UK and Scotland are identical, therefore only the graph for Scotland is shown (Figure 19). The decline in the Scotland (and therefore UK) Arctic Skua SMP abundance trend since 2000 is largely in agreement with that reported by the Seabirds Count census, with declines of 71 and 66%, respectively (Table 16, Burnell et al. 2023).
The Scottish population of Arctic Skua has declined steadily since the early 1990s (Figure 19). The long-
term SMP abundance trend showed a decline to 83% below the 1986 baseline in 2023, equal to the previous lowest population index value in 2017.
The Arctic Skua productivity trend for Scotland has shown considerable fluctuation across the recording period, with several years of very poor productivity, especially since 2004 (Figure 20). Compared to recent years, there was an increase in the number of chicks fledged per pair in 2022 and 2023, with 0.69 and 0.58 chicks fledged per breeding pair, respectively (Tables 15 & 52).
No data have been collected as part of the SMP.
Arctic Skuas are reliant on fish species such as sandeels, which they kleptoparasitise from other seabirds. As the distribution of sandeels in response to climate change has reduced their availability as prey for a range of seabirds (Régnier et al. 2017),
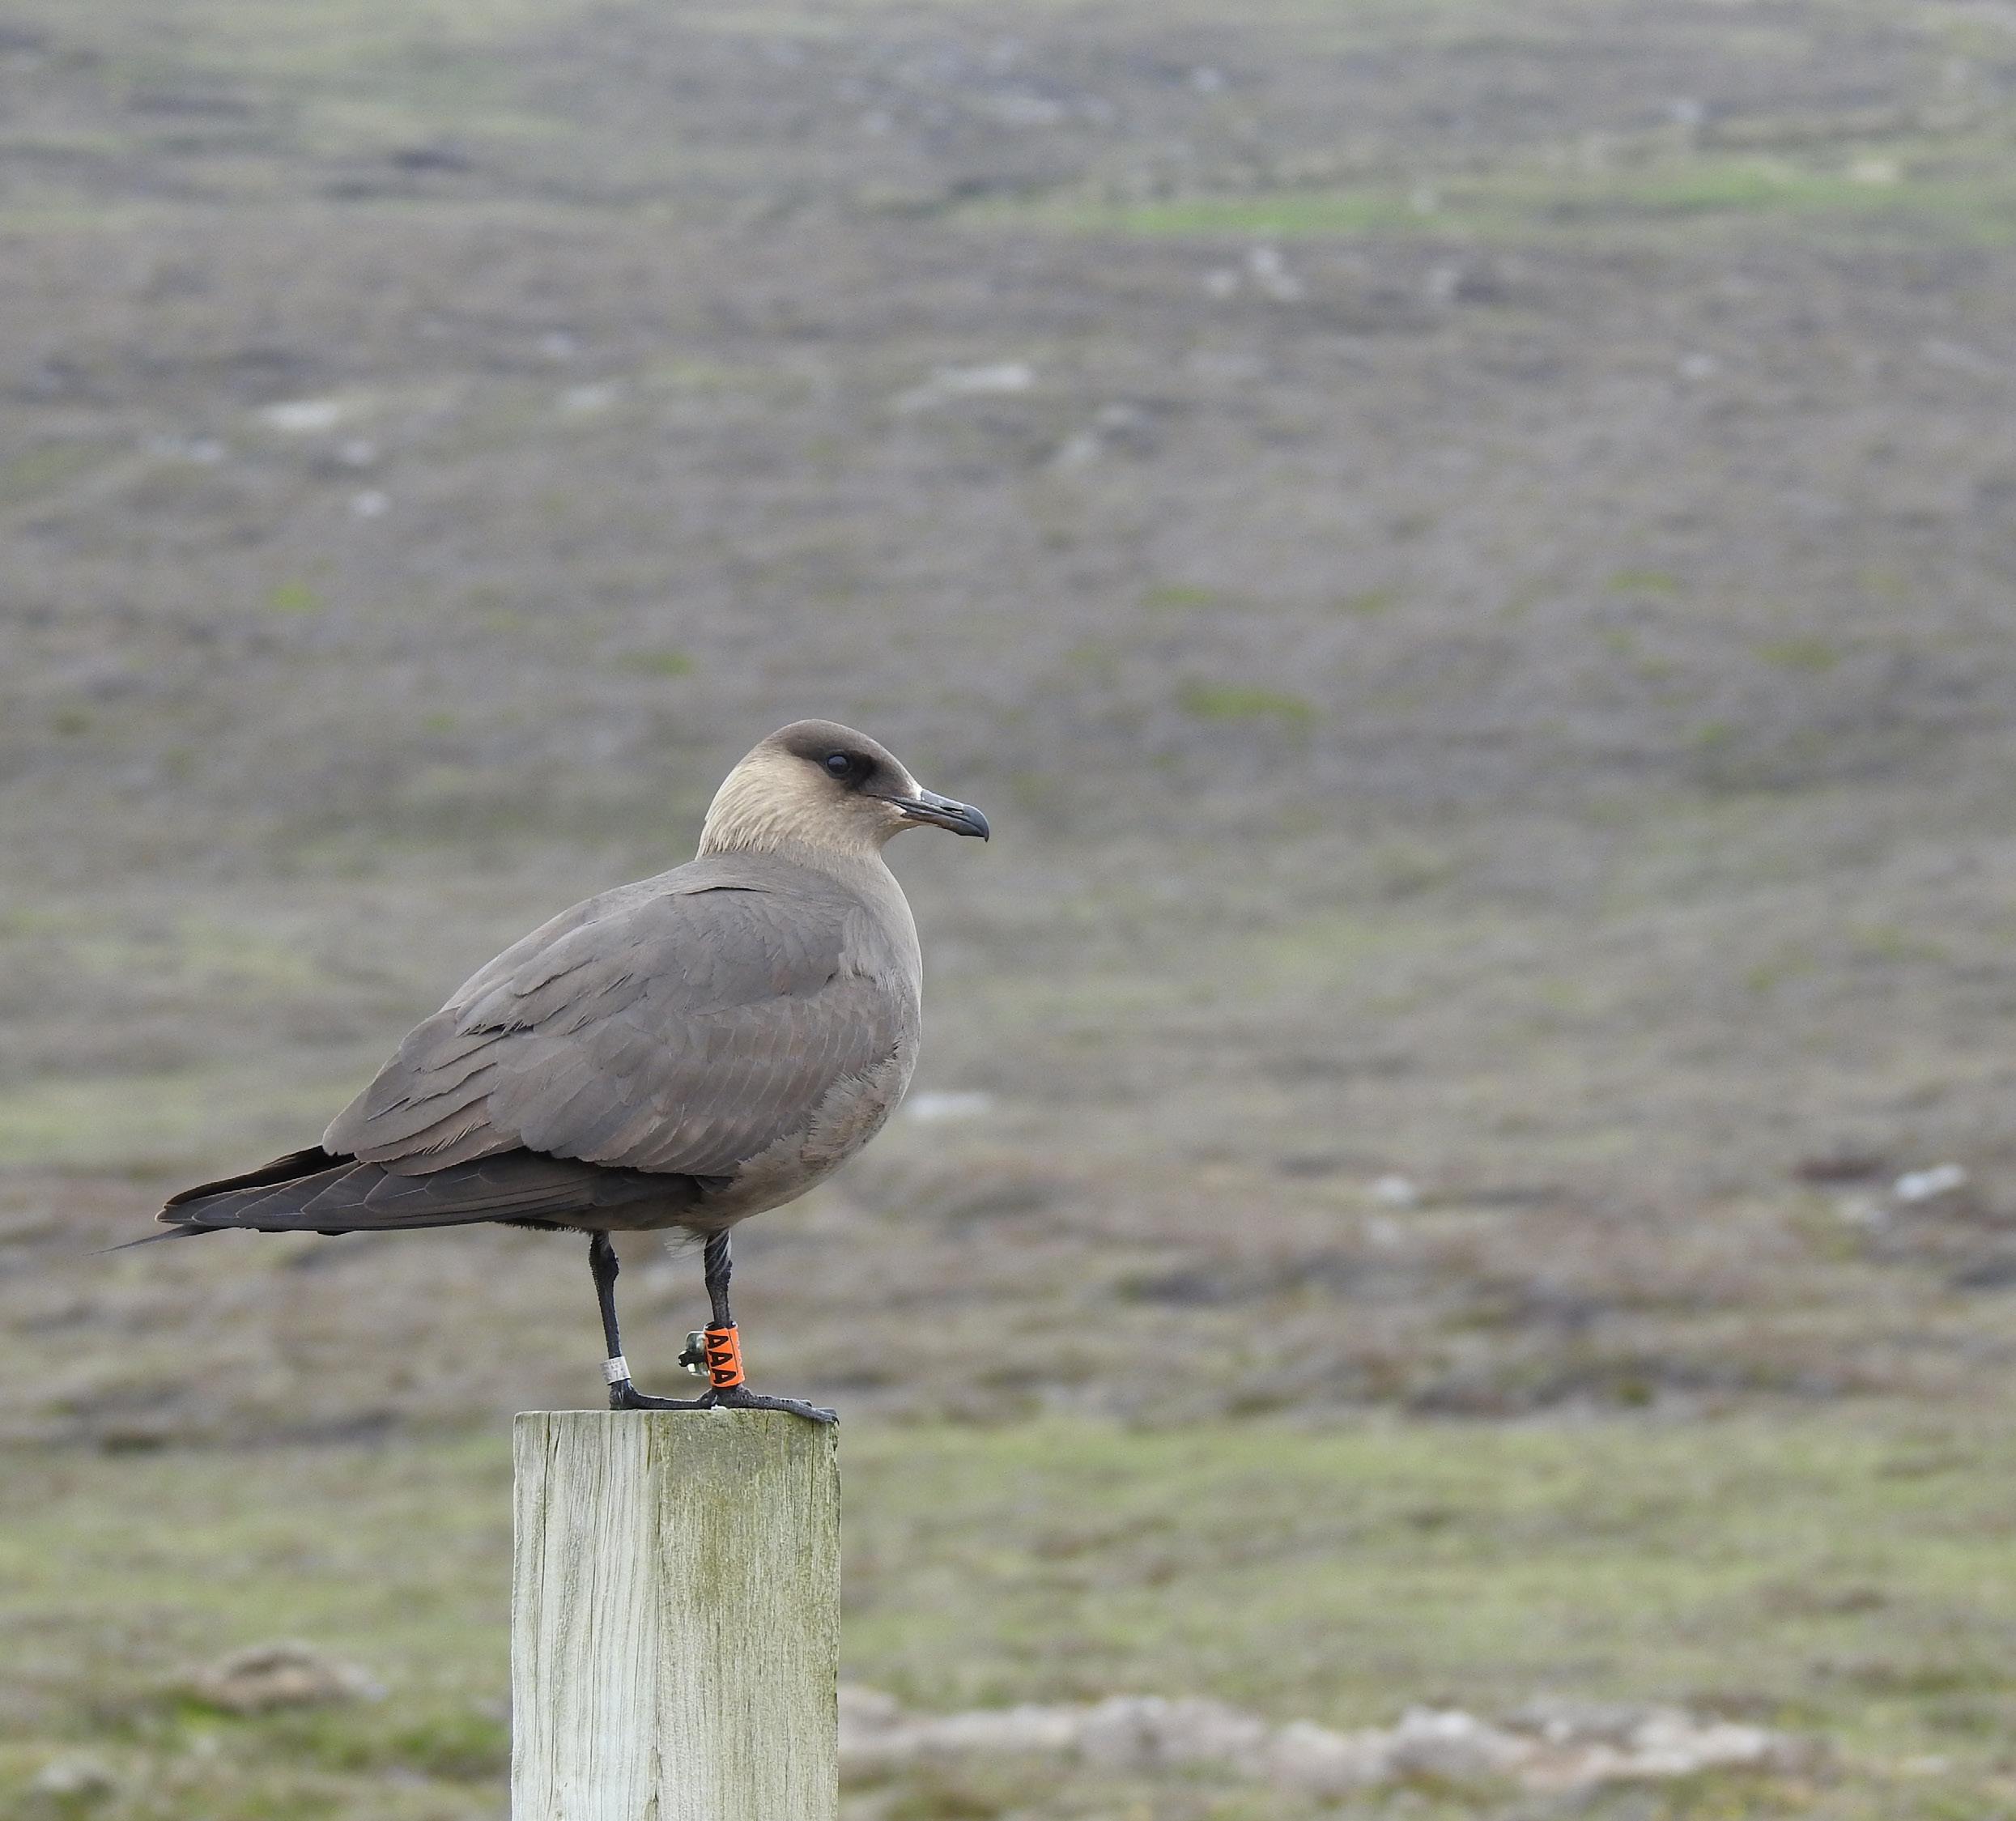
Abundance (AOT) Seabird 2000 (1998—2002)
Abundance (AOT) Seabirds Count (2015—21) Percentage
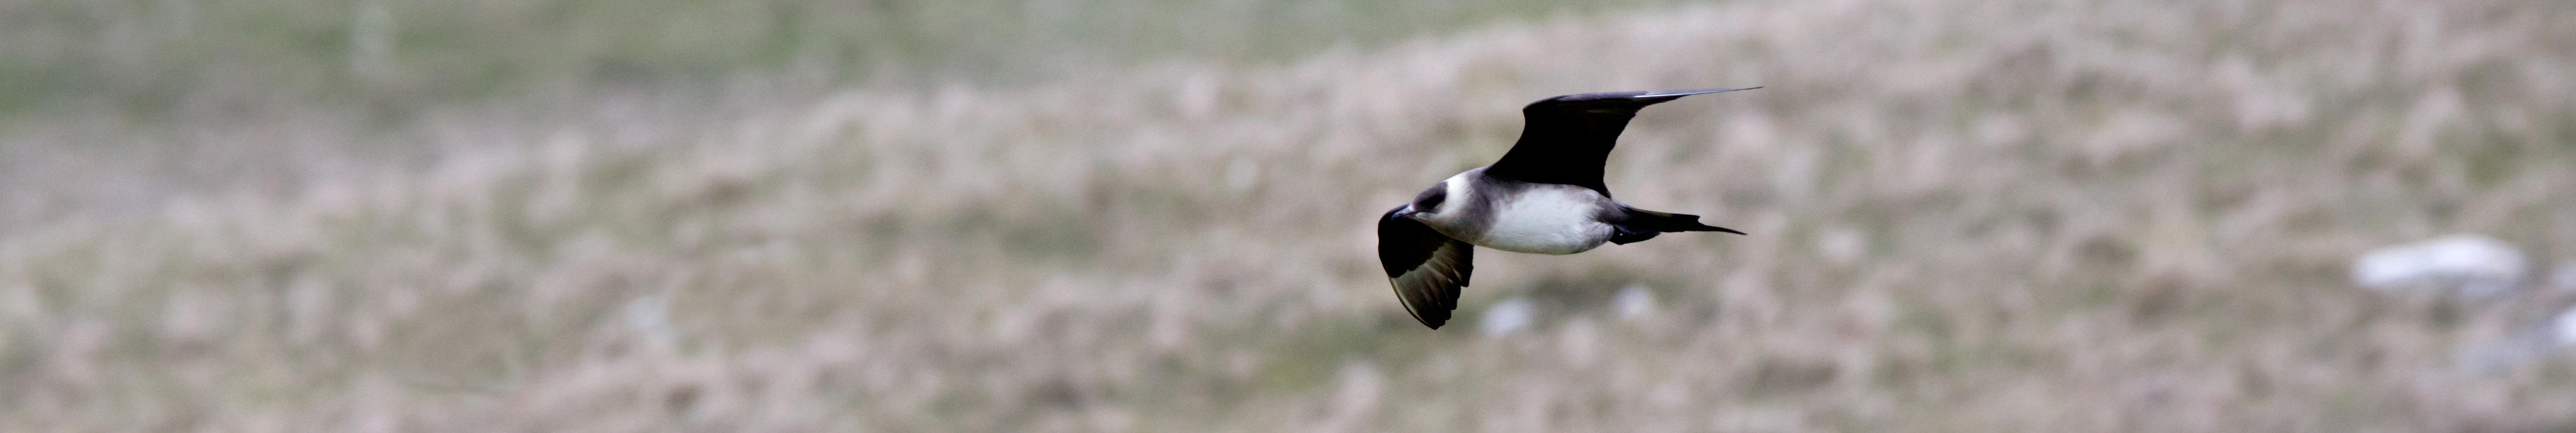
it is thought this knock-on effect is causing Arctic Skua population declines due to poor breeding success (Dawson et al. 2011; Perkins et al. 2018; Phillips et al. 1996). Recent studies have highlighted long foraging trip distances during the nesting period, causing additional pressure during the breeding season (Burnell et al. 2023; van Bemmelen et al. 2021).
An additional climate change-related pressure is heat stress, as Arctic Skua are adapted to colder environments (Oswald & Arnold 2012).
Although installation of onshore wind turbines is designed to reduce the extent of climate change, their placement on the moorland habitats where Arctic Skuas commonly breed may cause detrimental impacts through disturbance and the risk of collision with turbine blades (Burnell et al. 2023).
Predation is an additional issue for Arctic Skuas. Arctic Skua chicks
are known to be predated by Great Skuas, the population of which had been growing in recent years until the recent HPAI outbreak (Perkins et al. 2018; Tremlett et al. 2024). There can also be competition between the two species for breeding territory (Dawson et al. 2011).
In Scotland, species such as Red Fox (Vulpes vulpes), Stoat (Mustela erminea), European Hedgehog (Erinaceus europaeus) and American Mink (Neovison vison) overlap in range with breeding Arctic Skuas, posing a potential risk directly by predating eggs and chicks, or indirectly by adding pressure to the neighbouring breeding seabirds the Arctic Skuas rely on for prey (Burnell et al. 2023).
Preventing invasive predators from reaching islands with breeding Arctic Skuas through implementation of biosecurity measures, and removal of invasive species where they do overlap in range could relieve pressure.
The benefits of eradication programmes was demonstrated by the improvement in Arctic Skua breeding success when the non-native American Mink (Neovison vison) was removed from an archipelago in Finland (Nordström et al. 2003).
Given their favoured moorland nesting habitat, Environmental Impact Assessments for onshore wind farms need to take Arctic Skuas into account, as they pose a risk both through collision and disturbance (Burnell et al. 2023).
Research into year-round and breeding season foraging has been taking place in recent years to better understand Arctic Skua’s annual movements and foraging ranges. By tracking individuals across their annual cycle we can identify important areas worthy of protection for Arctic Skuas and the seabird species on which they rely (O’Hanlon et al. 2024).
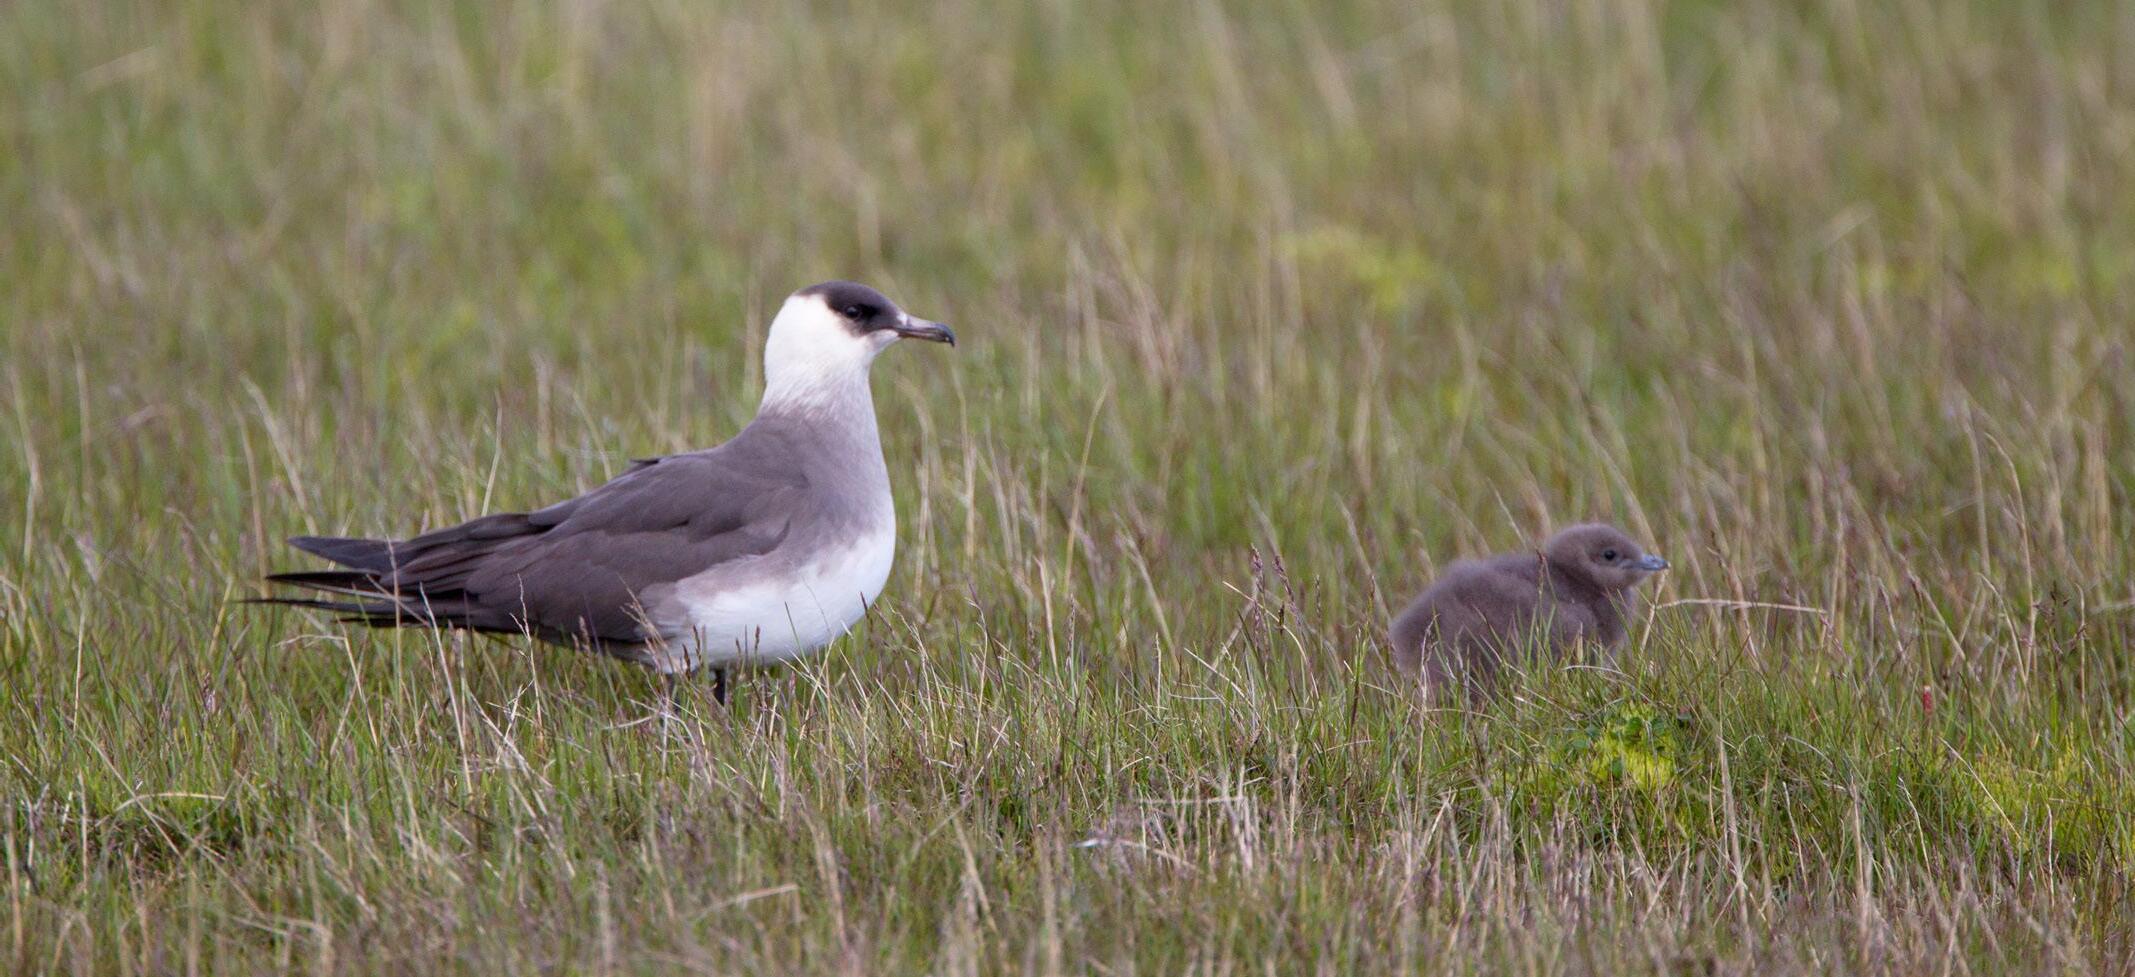
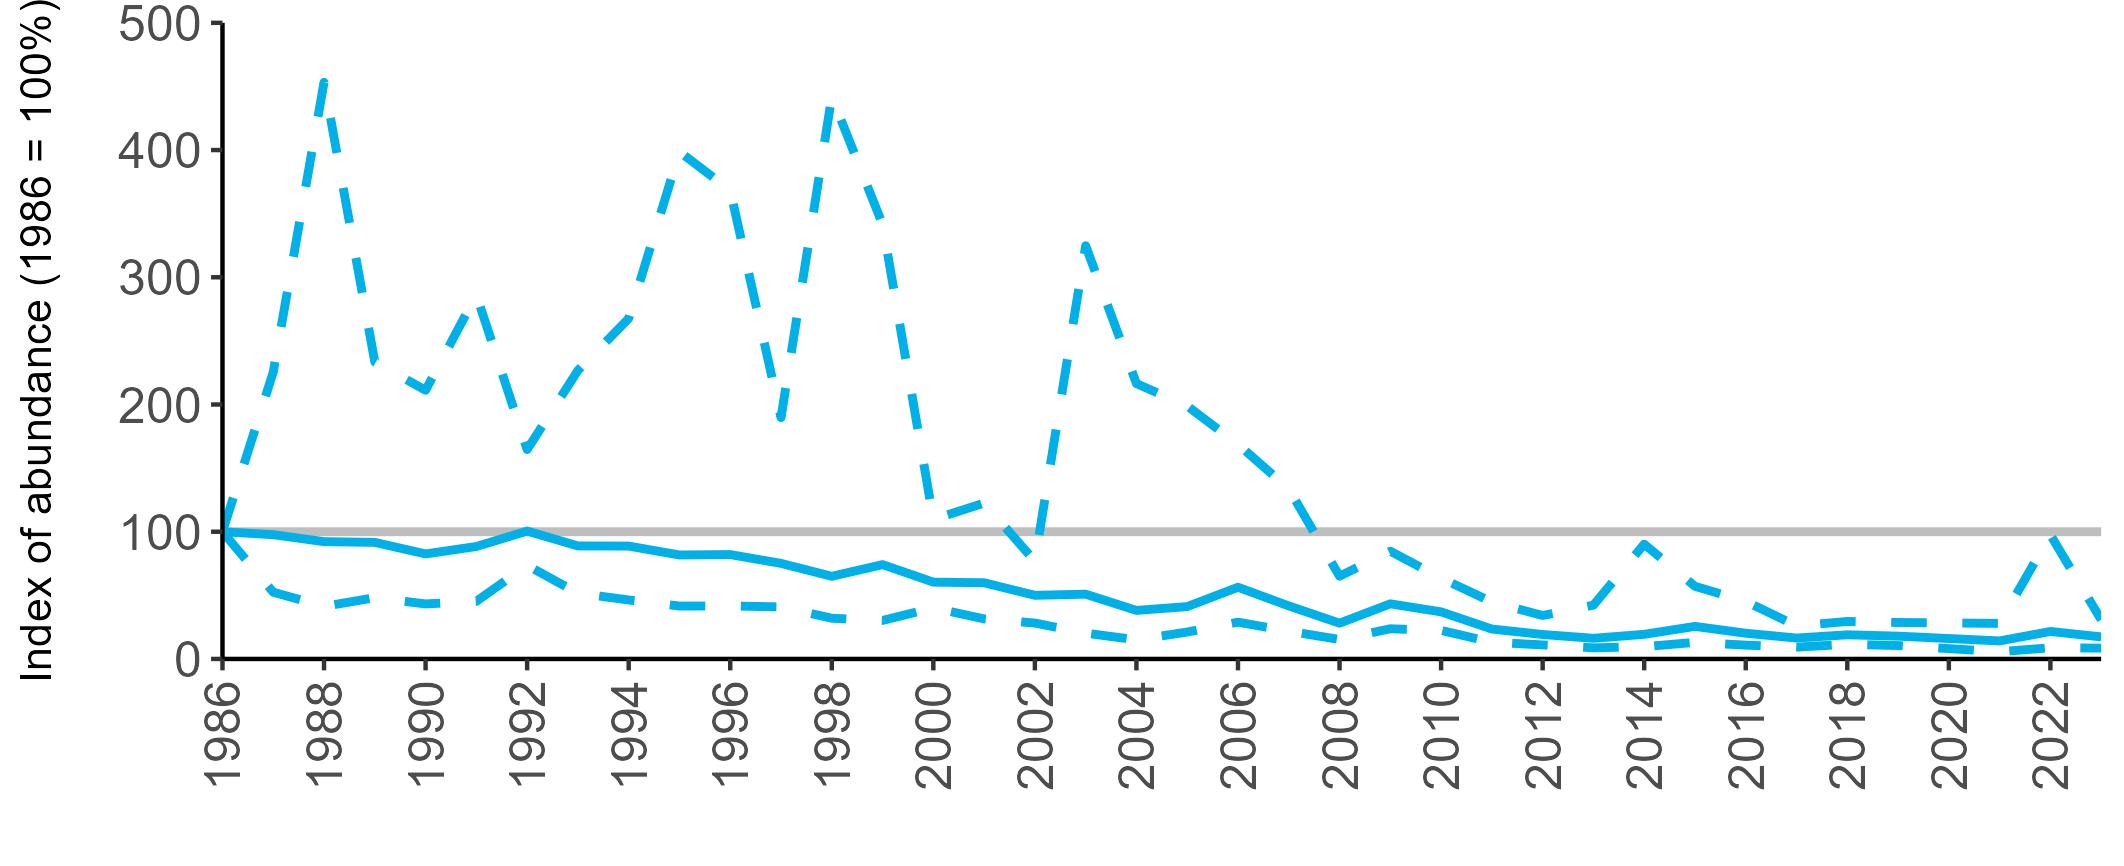
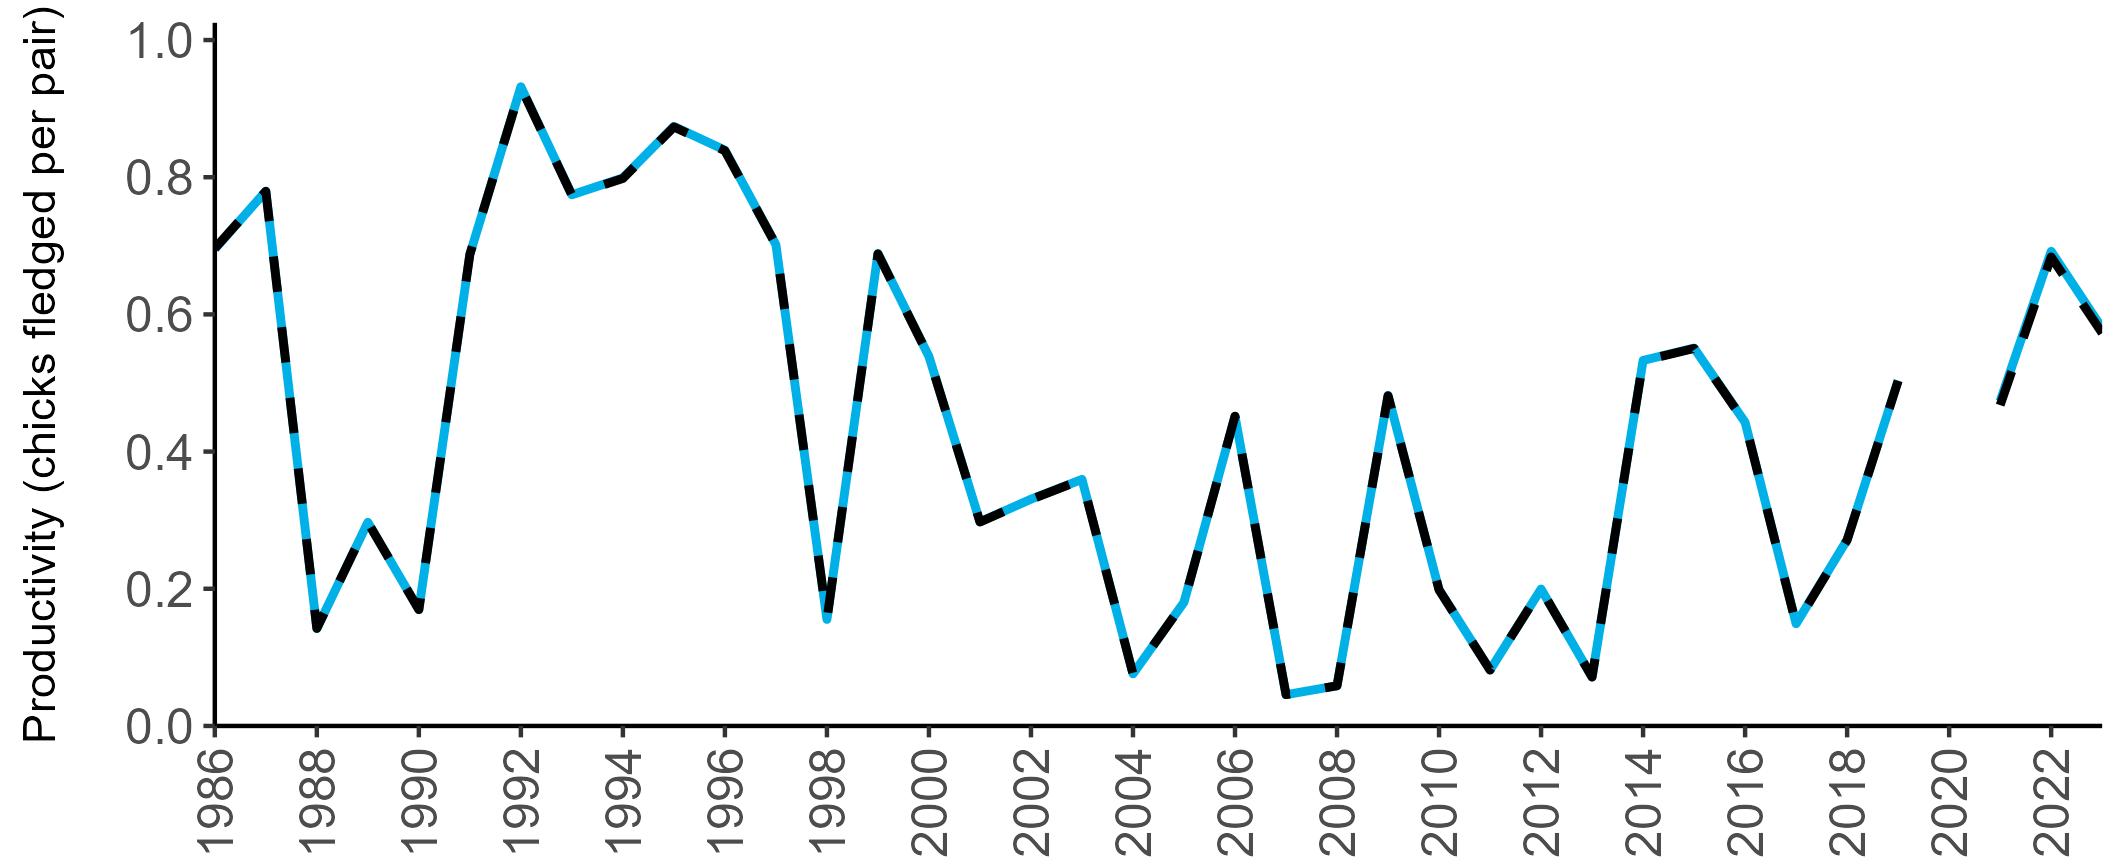
Stercorarius skua
Red-listed Amber-listed (I)
Abundance: n/a
Productivity: 0.44
Colony Count sites: 448
Breeding Success sites: 4
Least Concern Lifespan: 15 years
Breeding age: 7 years

Britain and Ireland host 64—67% of the global breeding population of Great Skua (Burnell et al. 2023). They are a highly territorial species and will swoop down on intruders to breeding colonies. Great Skua are colloquially known as ‘Bonxies’, a Nordic name originating from Shetland and thought to refer to their ‘dumpy’ posture.
Great Skua breeding areas in Britain and Ireland are primarily in the north and west of Scotland, with smaller numbers found on the north and west coasts of Ireland (Burnell et al. 2023).
Globally, Great Skua breeding areas have been restricted to the northeast Atlantic, although their range is currently expanding both northwards into the Barents Sea and south into Ireland (BirdLife International 2024; Burnell et al. 2023), and up to four non-breeding individuals have also spent the summer months on the Calf of Man (Isle of Man) since 2016 (A. Sapsford pers. comm. 2023). Strongholds include Scotland, Iceland, Svalbard and the Faroe Islands (Keller et al. 2020).
In small colonies, Great Skua tend to target other seabirds as prey, whereas in larger colonies the majority of individuals consume mainly a range of fish species, including fishery discards (Votier et al. 2004). However, they are opportunistic feeders and will adapt their diet to local conditions, utilising whatever prey is readily available e.g. Goose Barnacles, eggs or European Rabbits (Oryctolagus cuniculus) (Phillips et al. 1997; Votier et al. 2004).
BREEDING
Great Skua nest on coastal moorland, and colonies can range in size from a loose grouping of a few birds to thousands. The nest consists of a grass-lined scrape in which two eggs are laid (Furness 1987).
BREEDING ABUNDANCE
No SMP abundance trends are produced for Great Skua, as too few large colonies are surveyed regularly or in the same year to produce accurate trends. The recent Seabirds Count
Great Skuas are migratory within the north-east Atlantic Ocean (Magnusdóttir et al. 2011). Birds from breeding colonies in Britain and Ireland can be seen off the coast year-round, albeit in low numbers in winter, but are mainly migratory, travelling as far south as West Africa (BirdLife International 2024; Magnusdóttir et al. 2011; Wernham et al. 2002).
census reported a 14% population increase across Britain and Ireland since Seabird 2000 (Burnell et al. 2023). However, this was before the substantial mortality of Great Skua during the 2021 and 2022 breeding seasons due to HPAI. As discussed on pages 8–11, the RSPB-led project to assess the population impact of the 2021–22 HPAI outbreak indicated a decline in Great Skua breeding numbers of 76% at the sites surveyed across the UK in 2023 (which covered 81% of the UK breeding population) compared to pre-HPAI baseline counts (Tremlett et al. 2024).
The productivity of Great Skua breeding in Scotland (and therefore the UK, as all monitored sites have been in Scotland) has varied considerably over the SMP recording period (Figure 21). There has been an overall decline in productivity since 2006. After low levels of productivity in 2021 and 2022 of 0.10 and 0.09 chicks fledged per pair, respectively (Table 52), attributed to HPAI, the number of chicks fledged per pair increased to 0.44 in 2023 (Table 18).
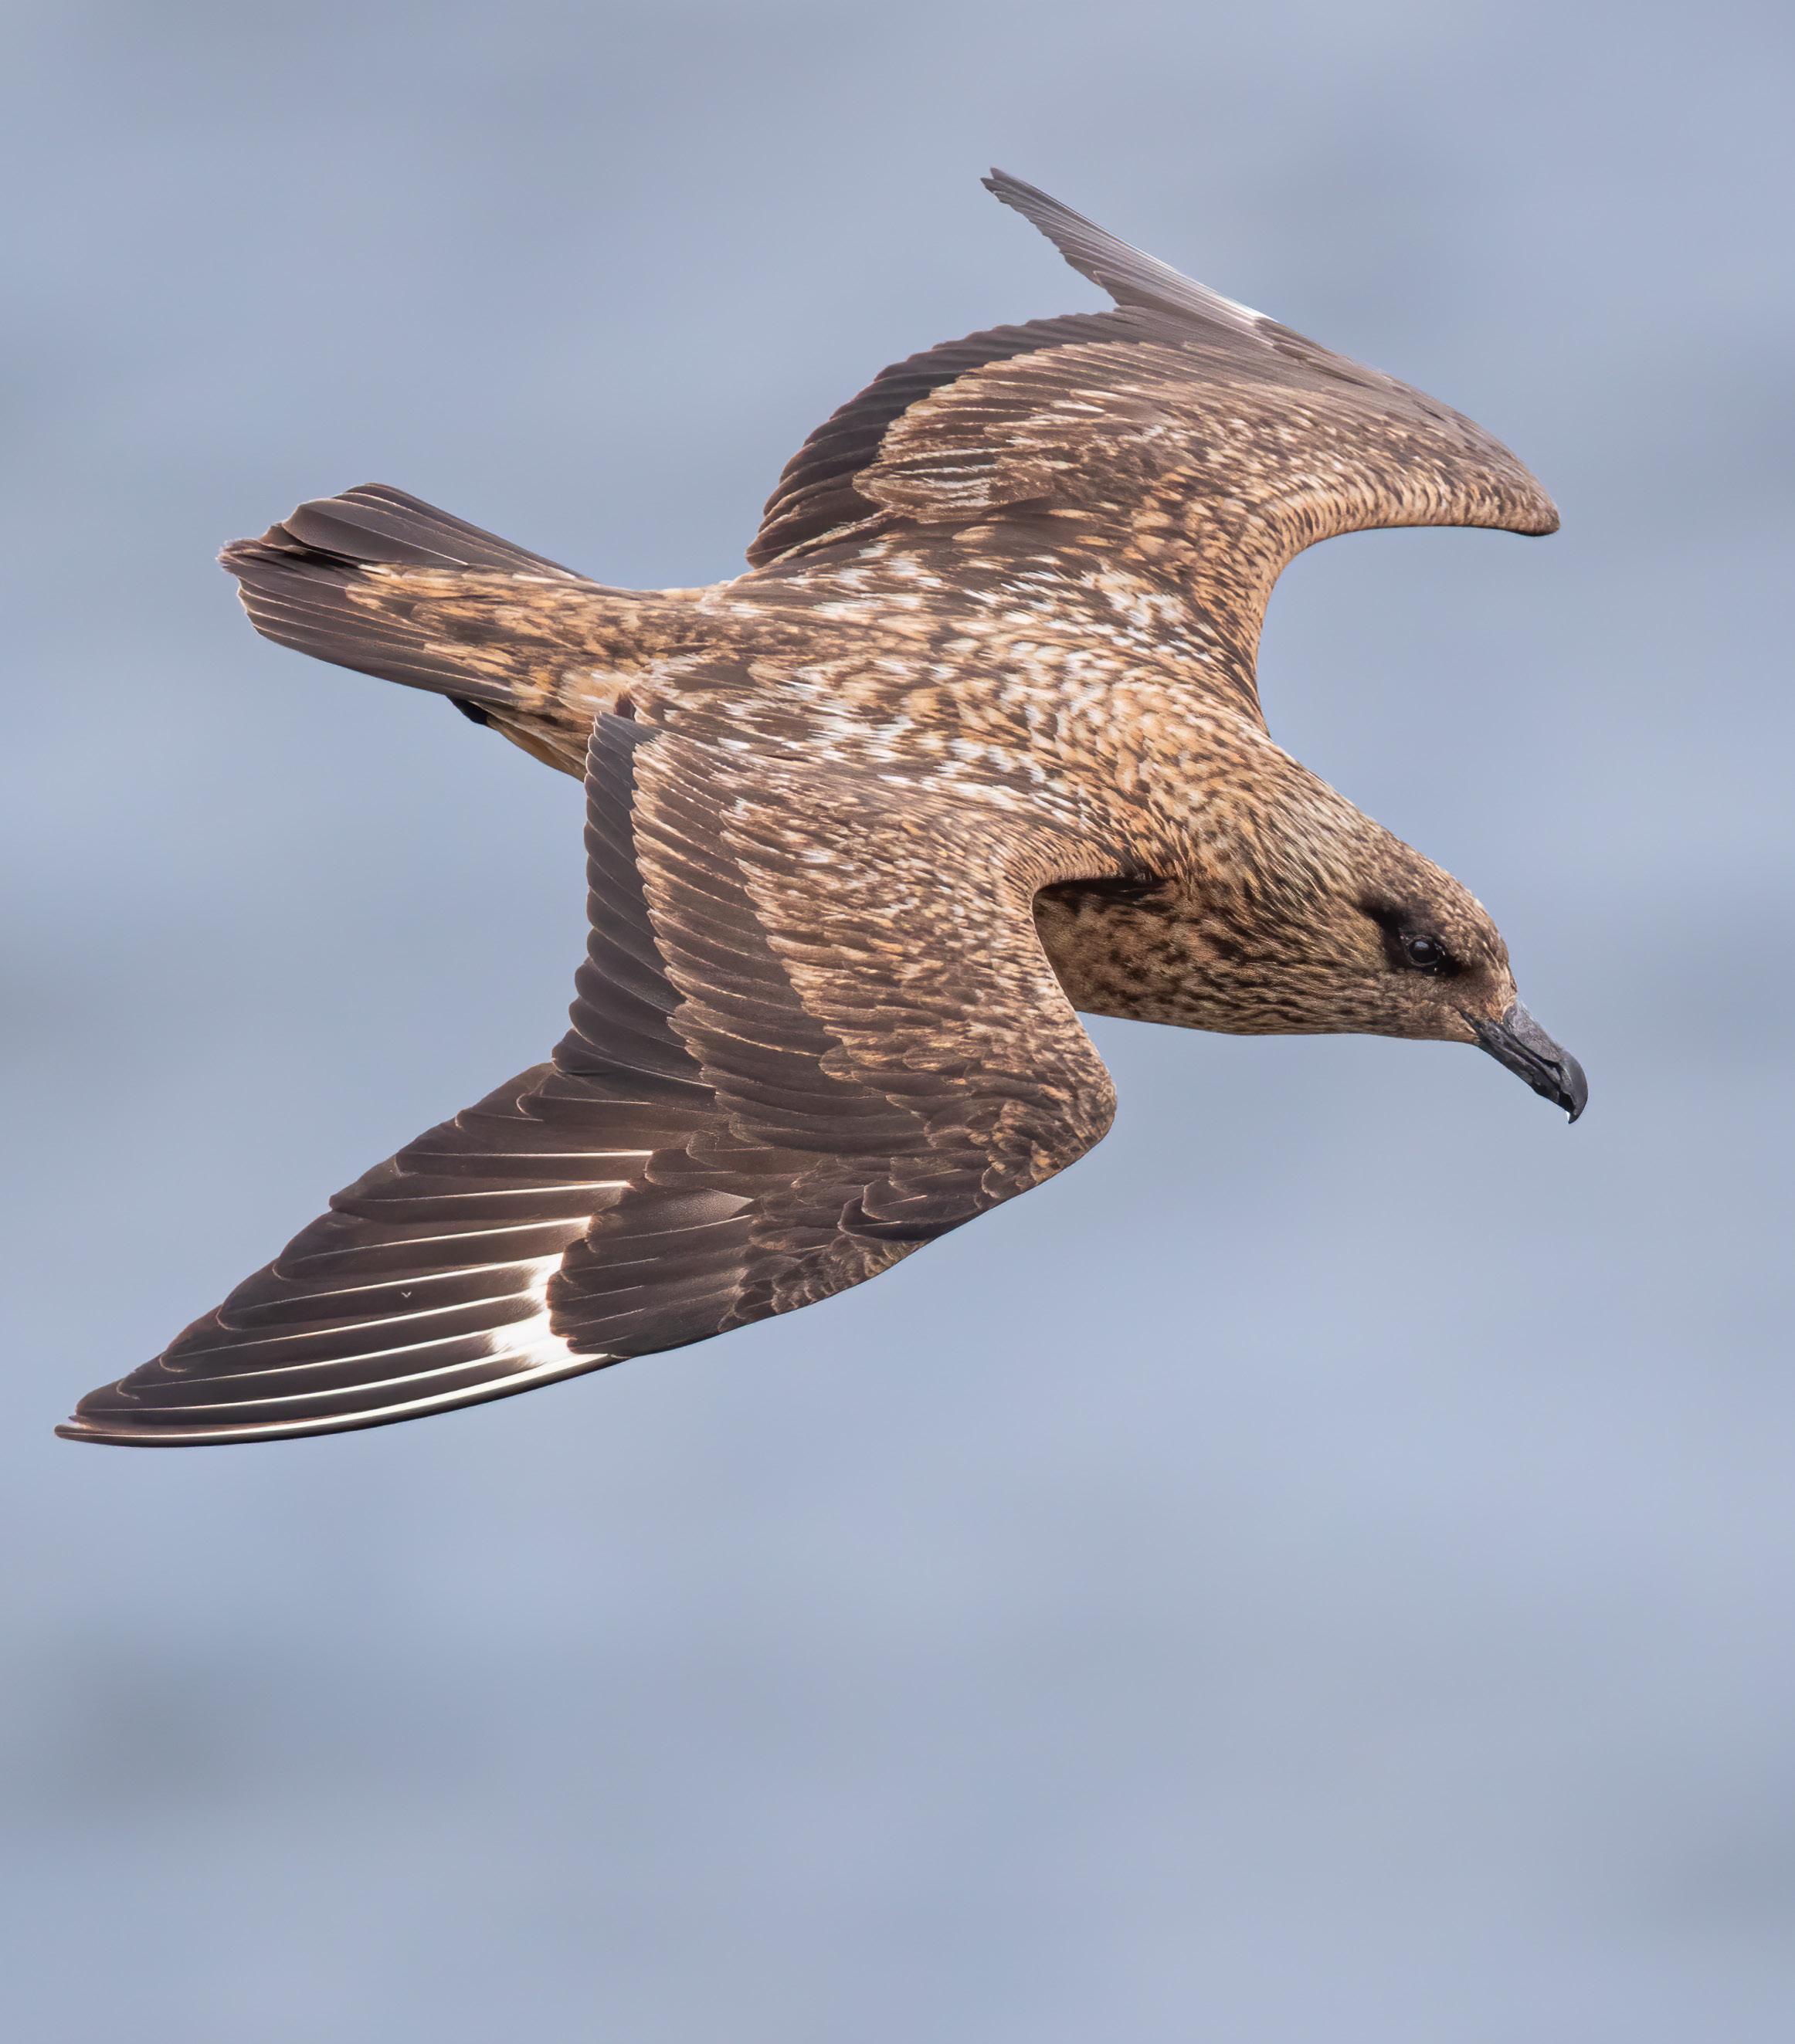
Table 17: Seabirds Count census results
Abundance (AOT) Seabird 2000 (1998—2002)
Abundance (AOT) Seabirds Count (2015—21) Percentage Change
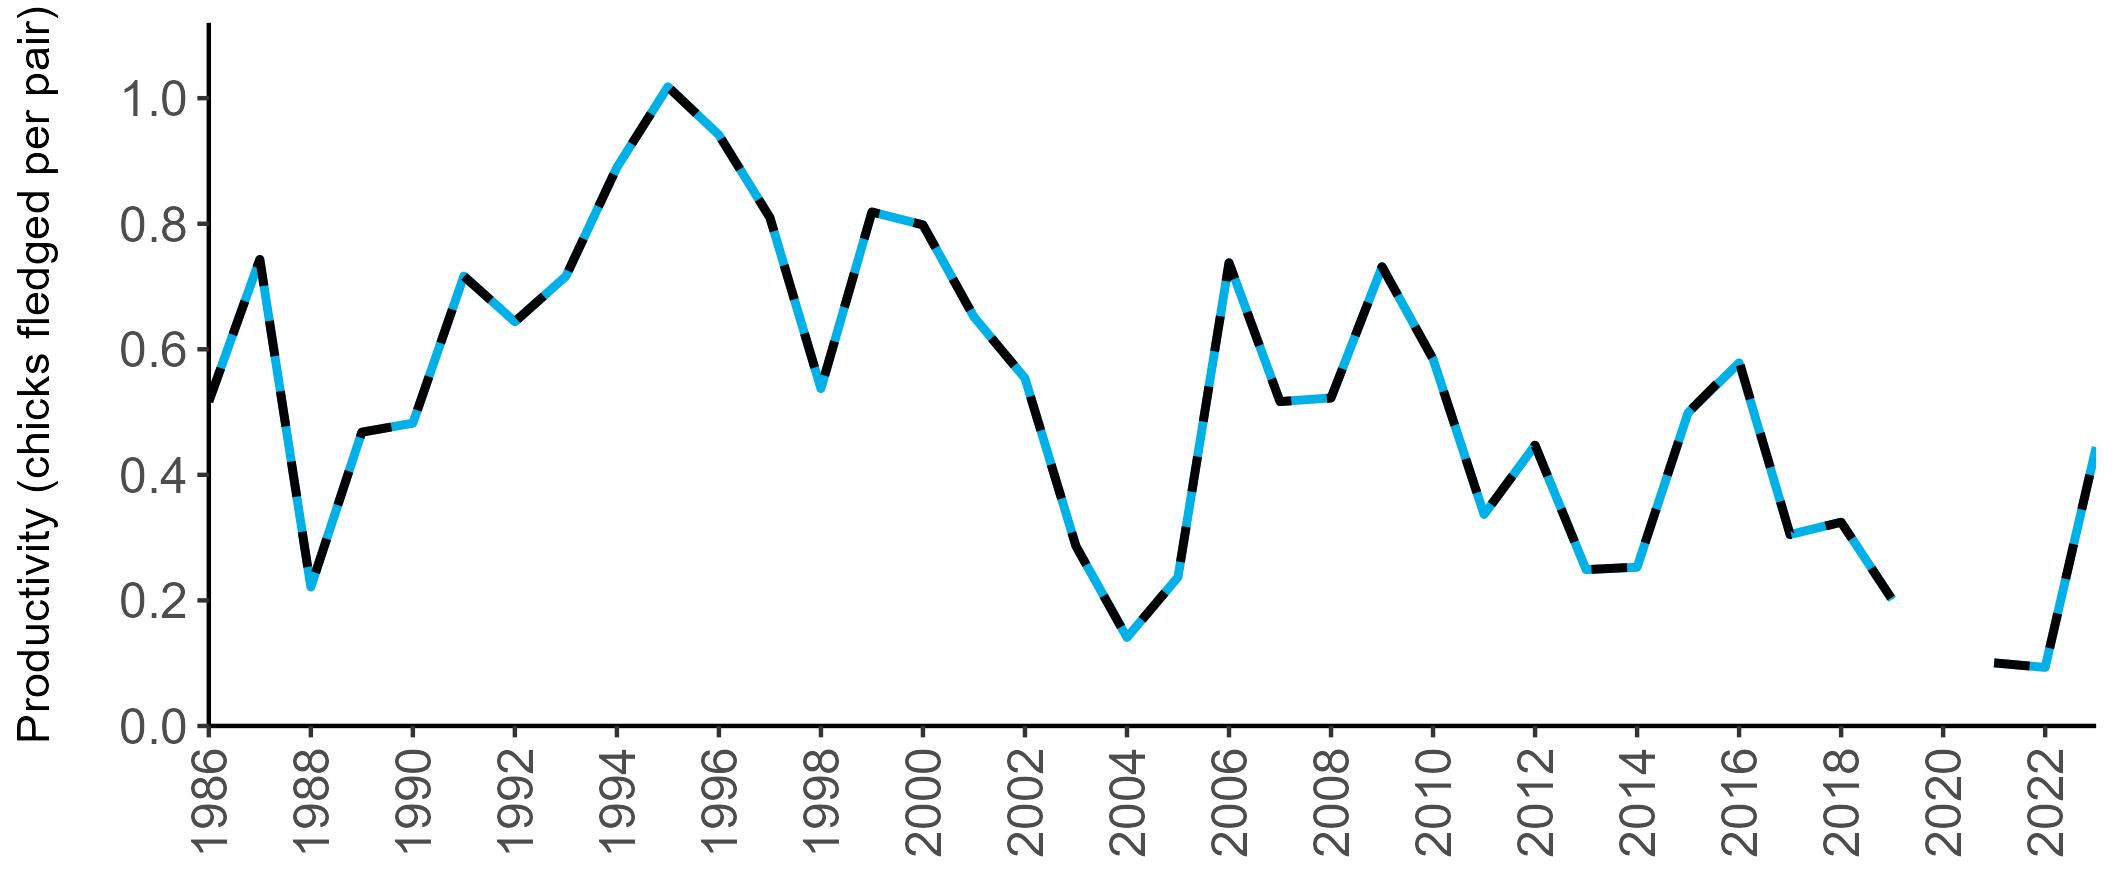
at the local (colony) level was the main driver of population decline recorded in Orkney (Meek et al. 2011). A law to reduce fishery discards, fully enforced since 2019, has the potential to negatively affect those populations of Great Skua that rely most heavily on fishery discards for food (Bicknell et al. 2013; Votier et al. 2008).
et al. 2018). The avian prey component also changed over time, with Kittiwakes being replaced by mainly auks and Fulmars.
PHENOLOGY, DIET AND SURVIVAL RATES
No data have been collected as part of the SMP.
CAUSES OF CHANGE
A significant pressure in recent years is likely to have been a reduction in food availability, although the adaptability of Great Skua to changes in conditions may have protected them to some extent. Competition for food
Despite competition for food and the decline in available discards from fisheries, Great Skua are highly opportunistic feeders and so are likely to be able to switch their diet depending on prey availability. Studies on Great Skuas breeding in northern Scotland showed that their diet changed from being dominated by sandeels in the 1970s to predominantly discarded whitefish from the 1980s onwards, and the proportion of avian prey in the diet increased significantly between the 1980s and 2010s (Church
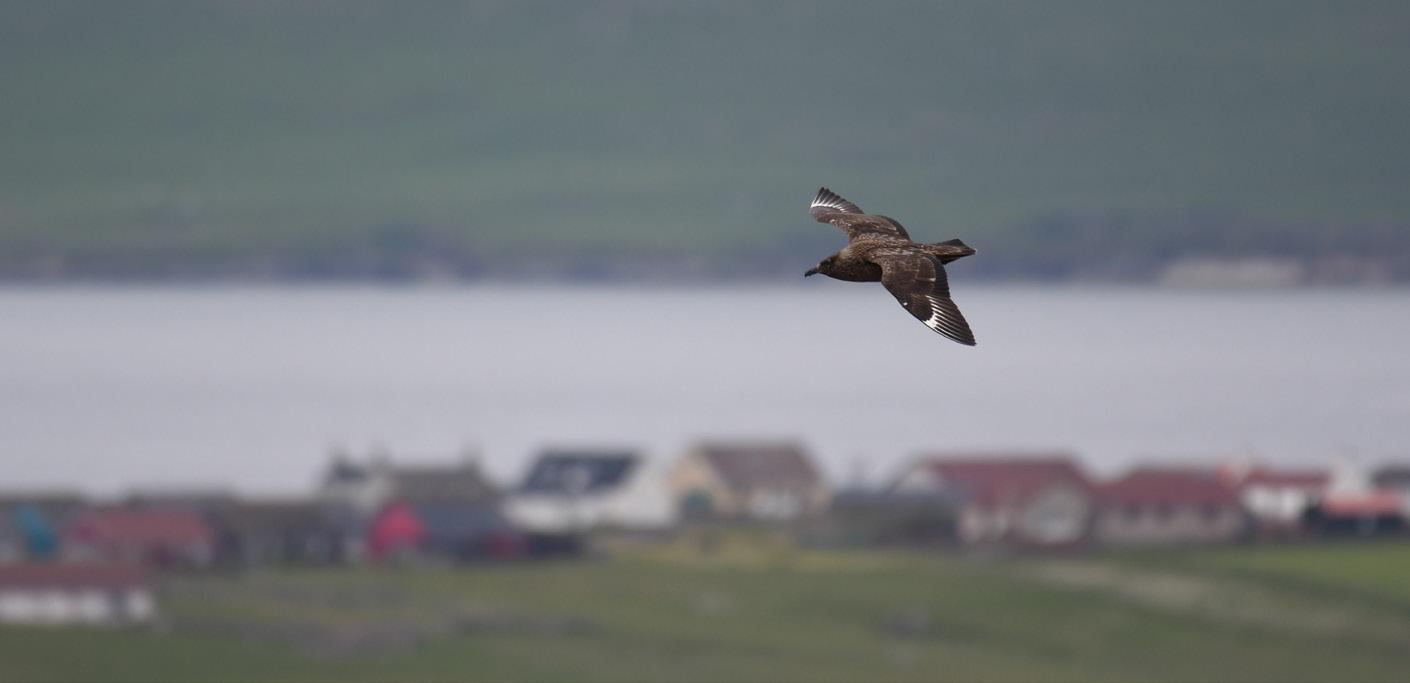
Great Skua pellets have been found to contain plastics in the Faroe Islands. This is likely to be a result of secondary uptake from their prey species, Fulmar (Hammer et al. 2016; van Franeker et al. 2012), which are known to frequently ingest plastic. The effects of this on Great Skuas is unknown.
HPAI caused a substantial loss in the Great Skua population across Scotland in the summer of 2022 (Banyard et al. 2022; Camphuysen et al. 2022), which became a focus for further surveying in 2023 (see pages 8–11).
The Great Skua is a cold-adapted species and can suffer from heat stress (Furness 1987), which is likely to increase under climate change, further reducing suitable breeding habitat.
The impact of HPAI on seabird species in recent years has been pronounced, particularly for Great Skua . A major recommendation from Tremlett et al. (2024) is continued intensive monitoring of Great Skuas, to determine both the immediate impacts and assess the long-term implications of this disease.
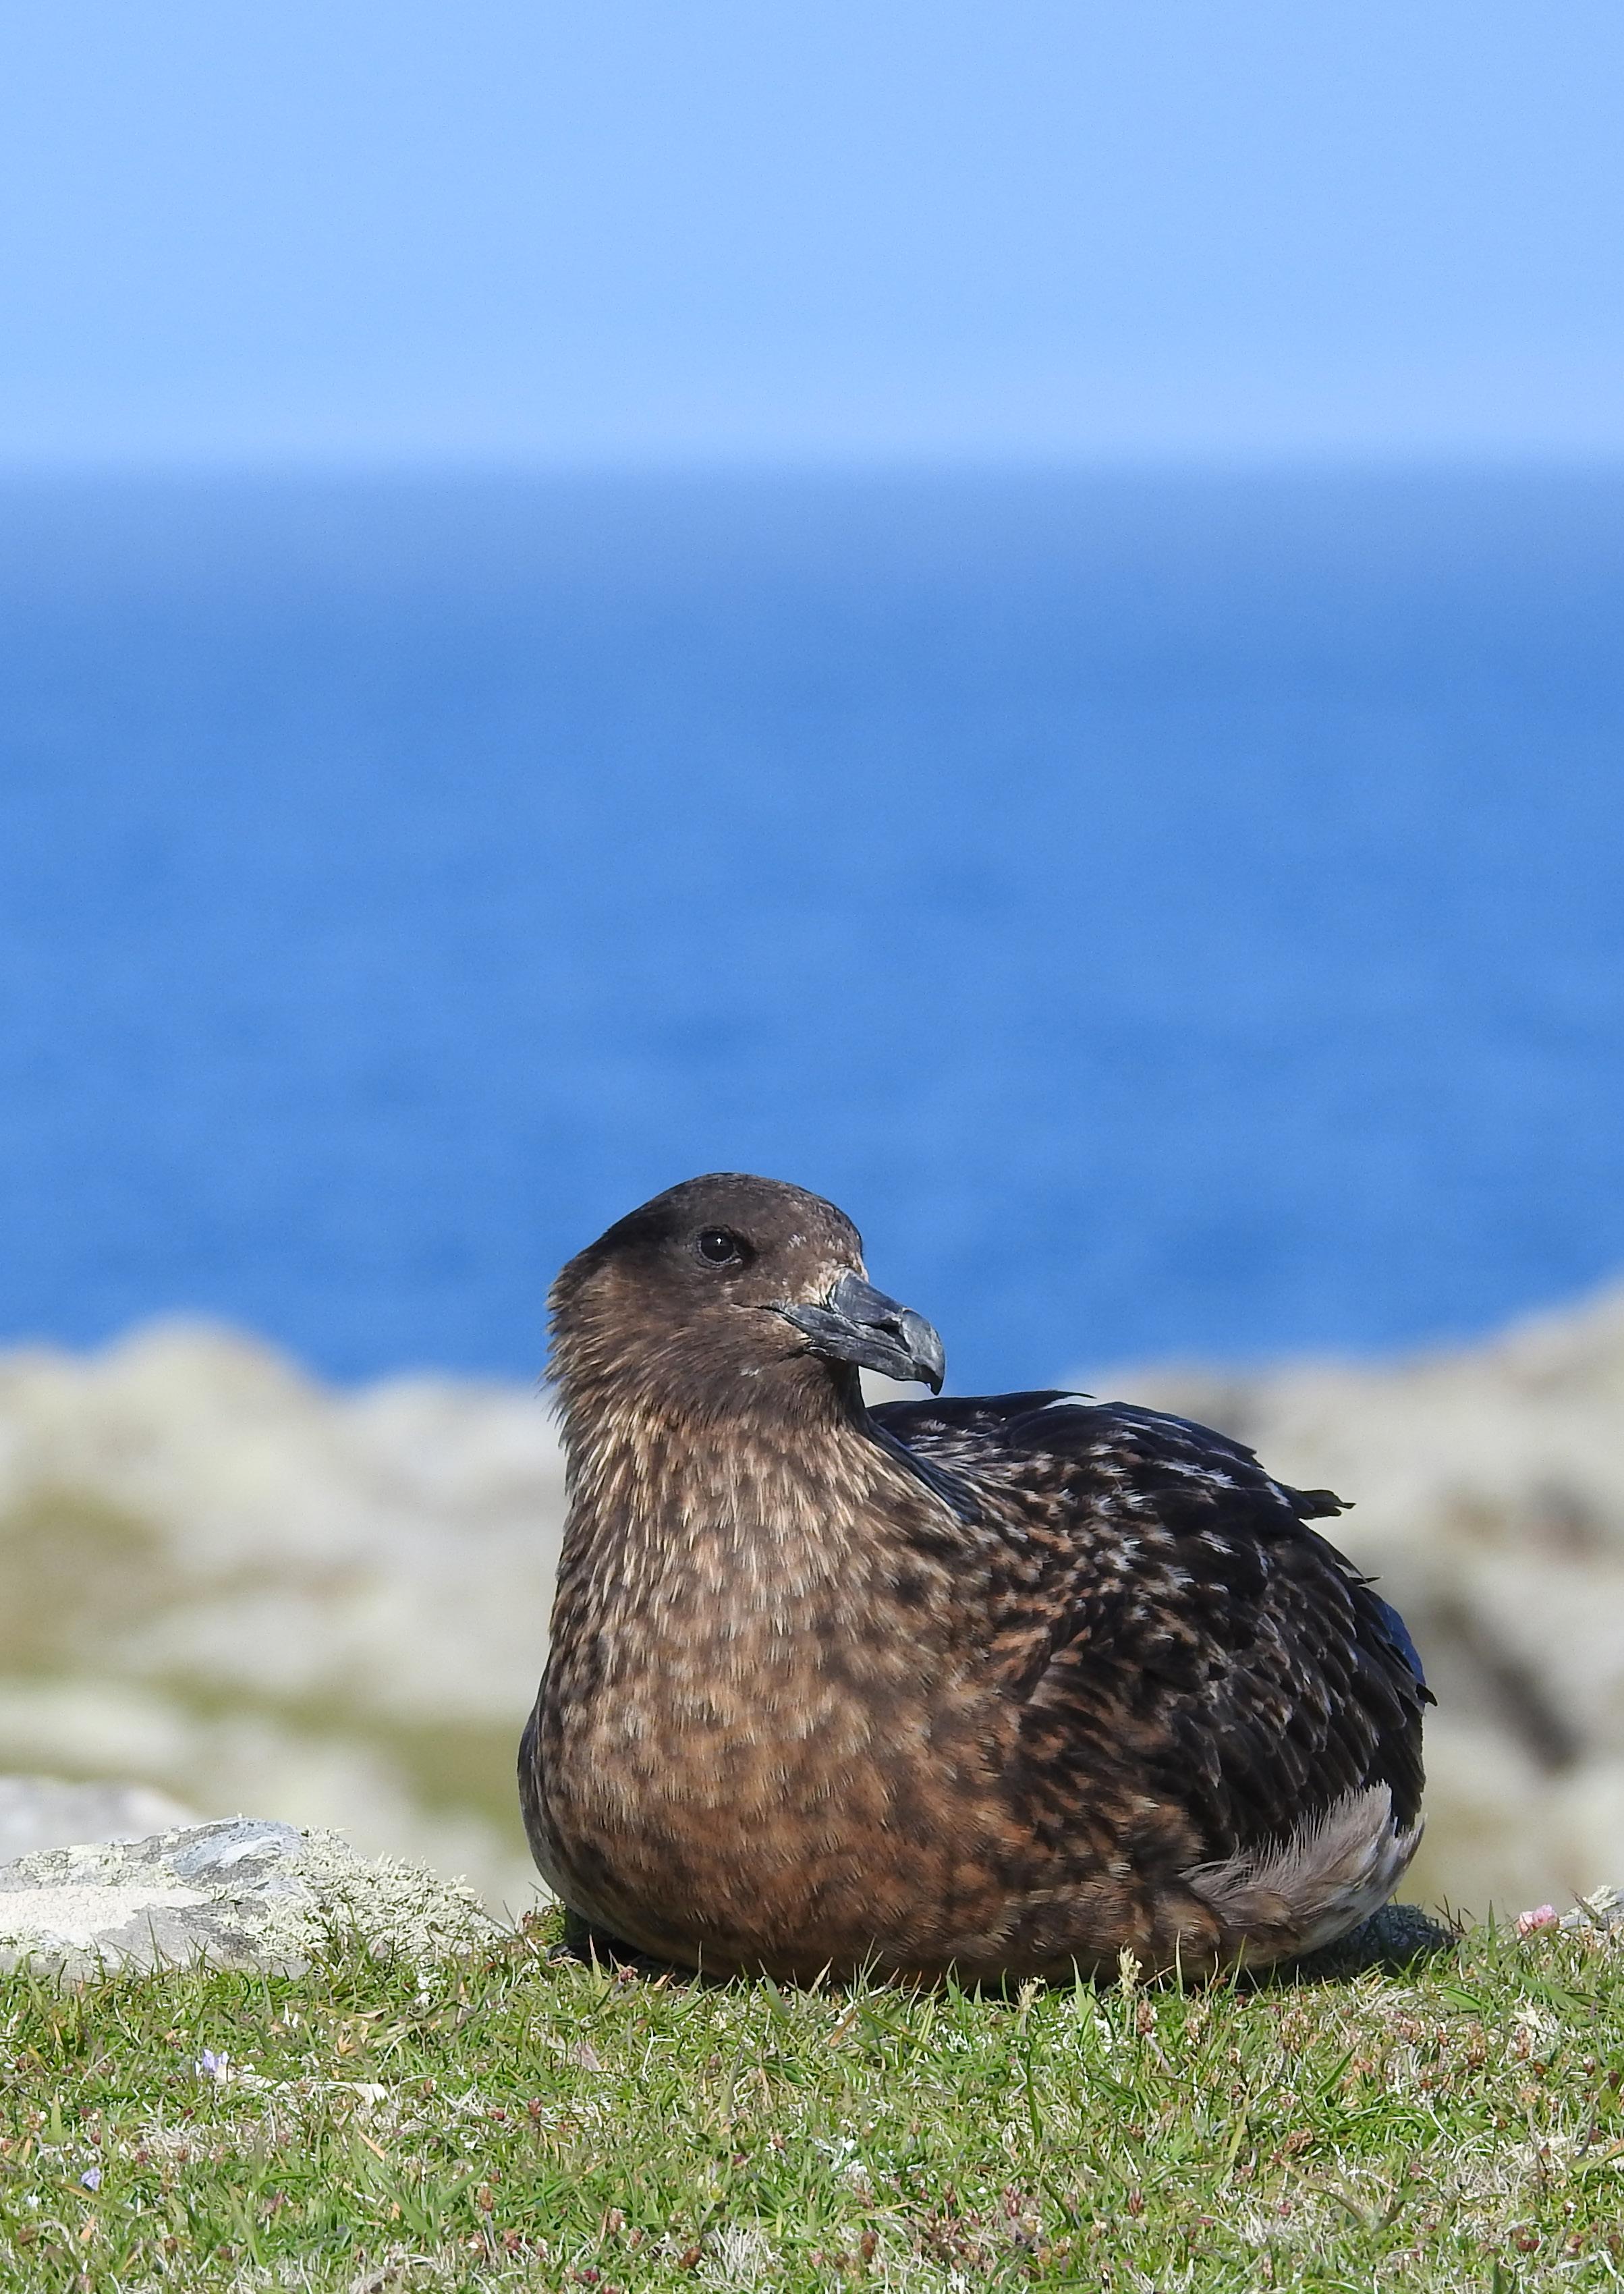
Amber listed
Amber-listed (I)
Least concern
Abundance: n/a
Productivity: n/a
Colony Count sites: 32
Breeding Success sites: 11
Lifespan: 15 years
Breeding age: 2–3 years
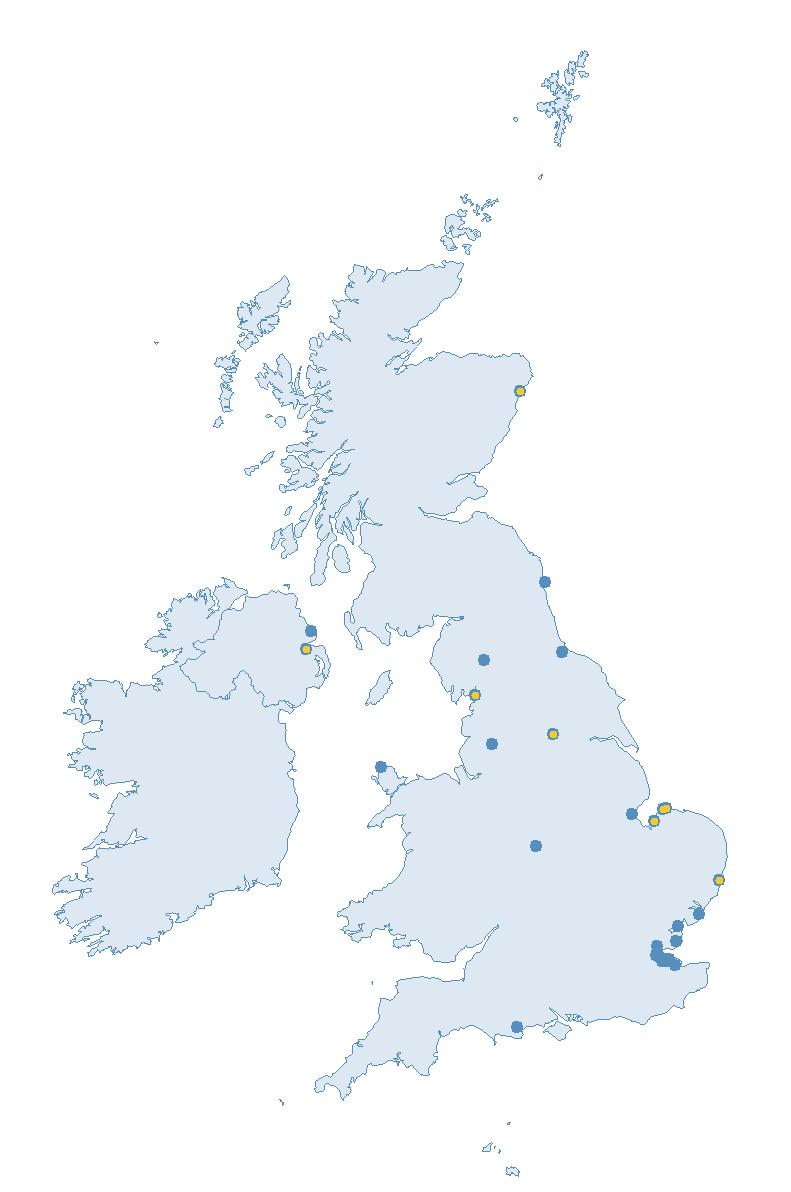
Mediterranean Gulls first bred in Britain in 1968 in Hampshire (England) (Taverner 1970), and in 1995 across the Irish Sea in Antrim (Northern Ireland) (JNCC 2021), but have rapidly expanded in range and population since then, and 1—2% of the the global population now breed in Britain and Ireland (Burnell et al. 2023).
Most Mediterranean Gull breeding colonies in Britain and Ireland are found in the south and east of England. However, since the Seabird 2000 (1998–2002) census, there has been a north-westward range expansion, with new colonies in Wales and Ireland and a significant increase in the number of inland colonies in England (Burnell et al. 2023).
Globally, the main breeding population is found around the Black Sea and surrounding European countries. From the 1950s onwards, they expanded their range to both the east and west, and Mediterranean Gulls currently breed at scattered locations throughout much of Europe (BirdLife International 2024).
Mediterranean Gulls are predominantly migratory, typically wintering in the Mediterranean Sea, the Black Sea, north-west Europe and Africa, favouring coastal habitats with sheltered waters (del Hoyo et al. 1996). Birds that nest in Britain and Ireland can be seen all around the coastline outside of the breeding
season, with some additional records inland, including on refuse tips (BTO 2023a).
During the breeding season Mediterranean Gulls typically eat terrestrial and aquatic insects, gastropods, some fish and rodents (del Hoyo et al. 1996). In the winter, they switch to more marine-related species, such as fish, molluscs and occasional fishery discards, but will also consume insects, earthworms, berries and seeds. They will also forage on refuse tips (Milchev et al. 2004; Urban et al. 1986).
Most Mediterranean Gull colonies in Britain and Ireland are fairly small, and they often breed alongside Blackheaded Gulls (Burnell et al. 2023). They nest in a range of habitats, including coastal lagoons, estuaries, saltmarsh, and inland on wetland areas with sparse vegetation (del Hoyo et al. 1996). Nests are a shallow scrape lined with grass and feathers into which up to three eggs are laid (Snow & Perrins 1998).
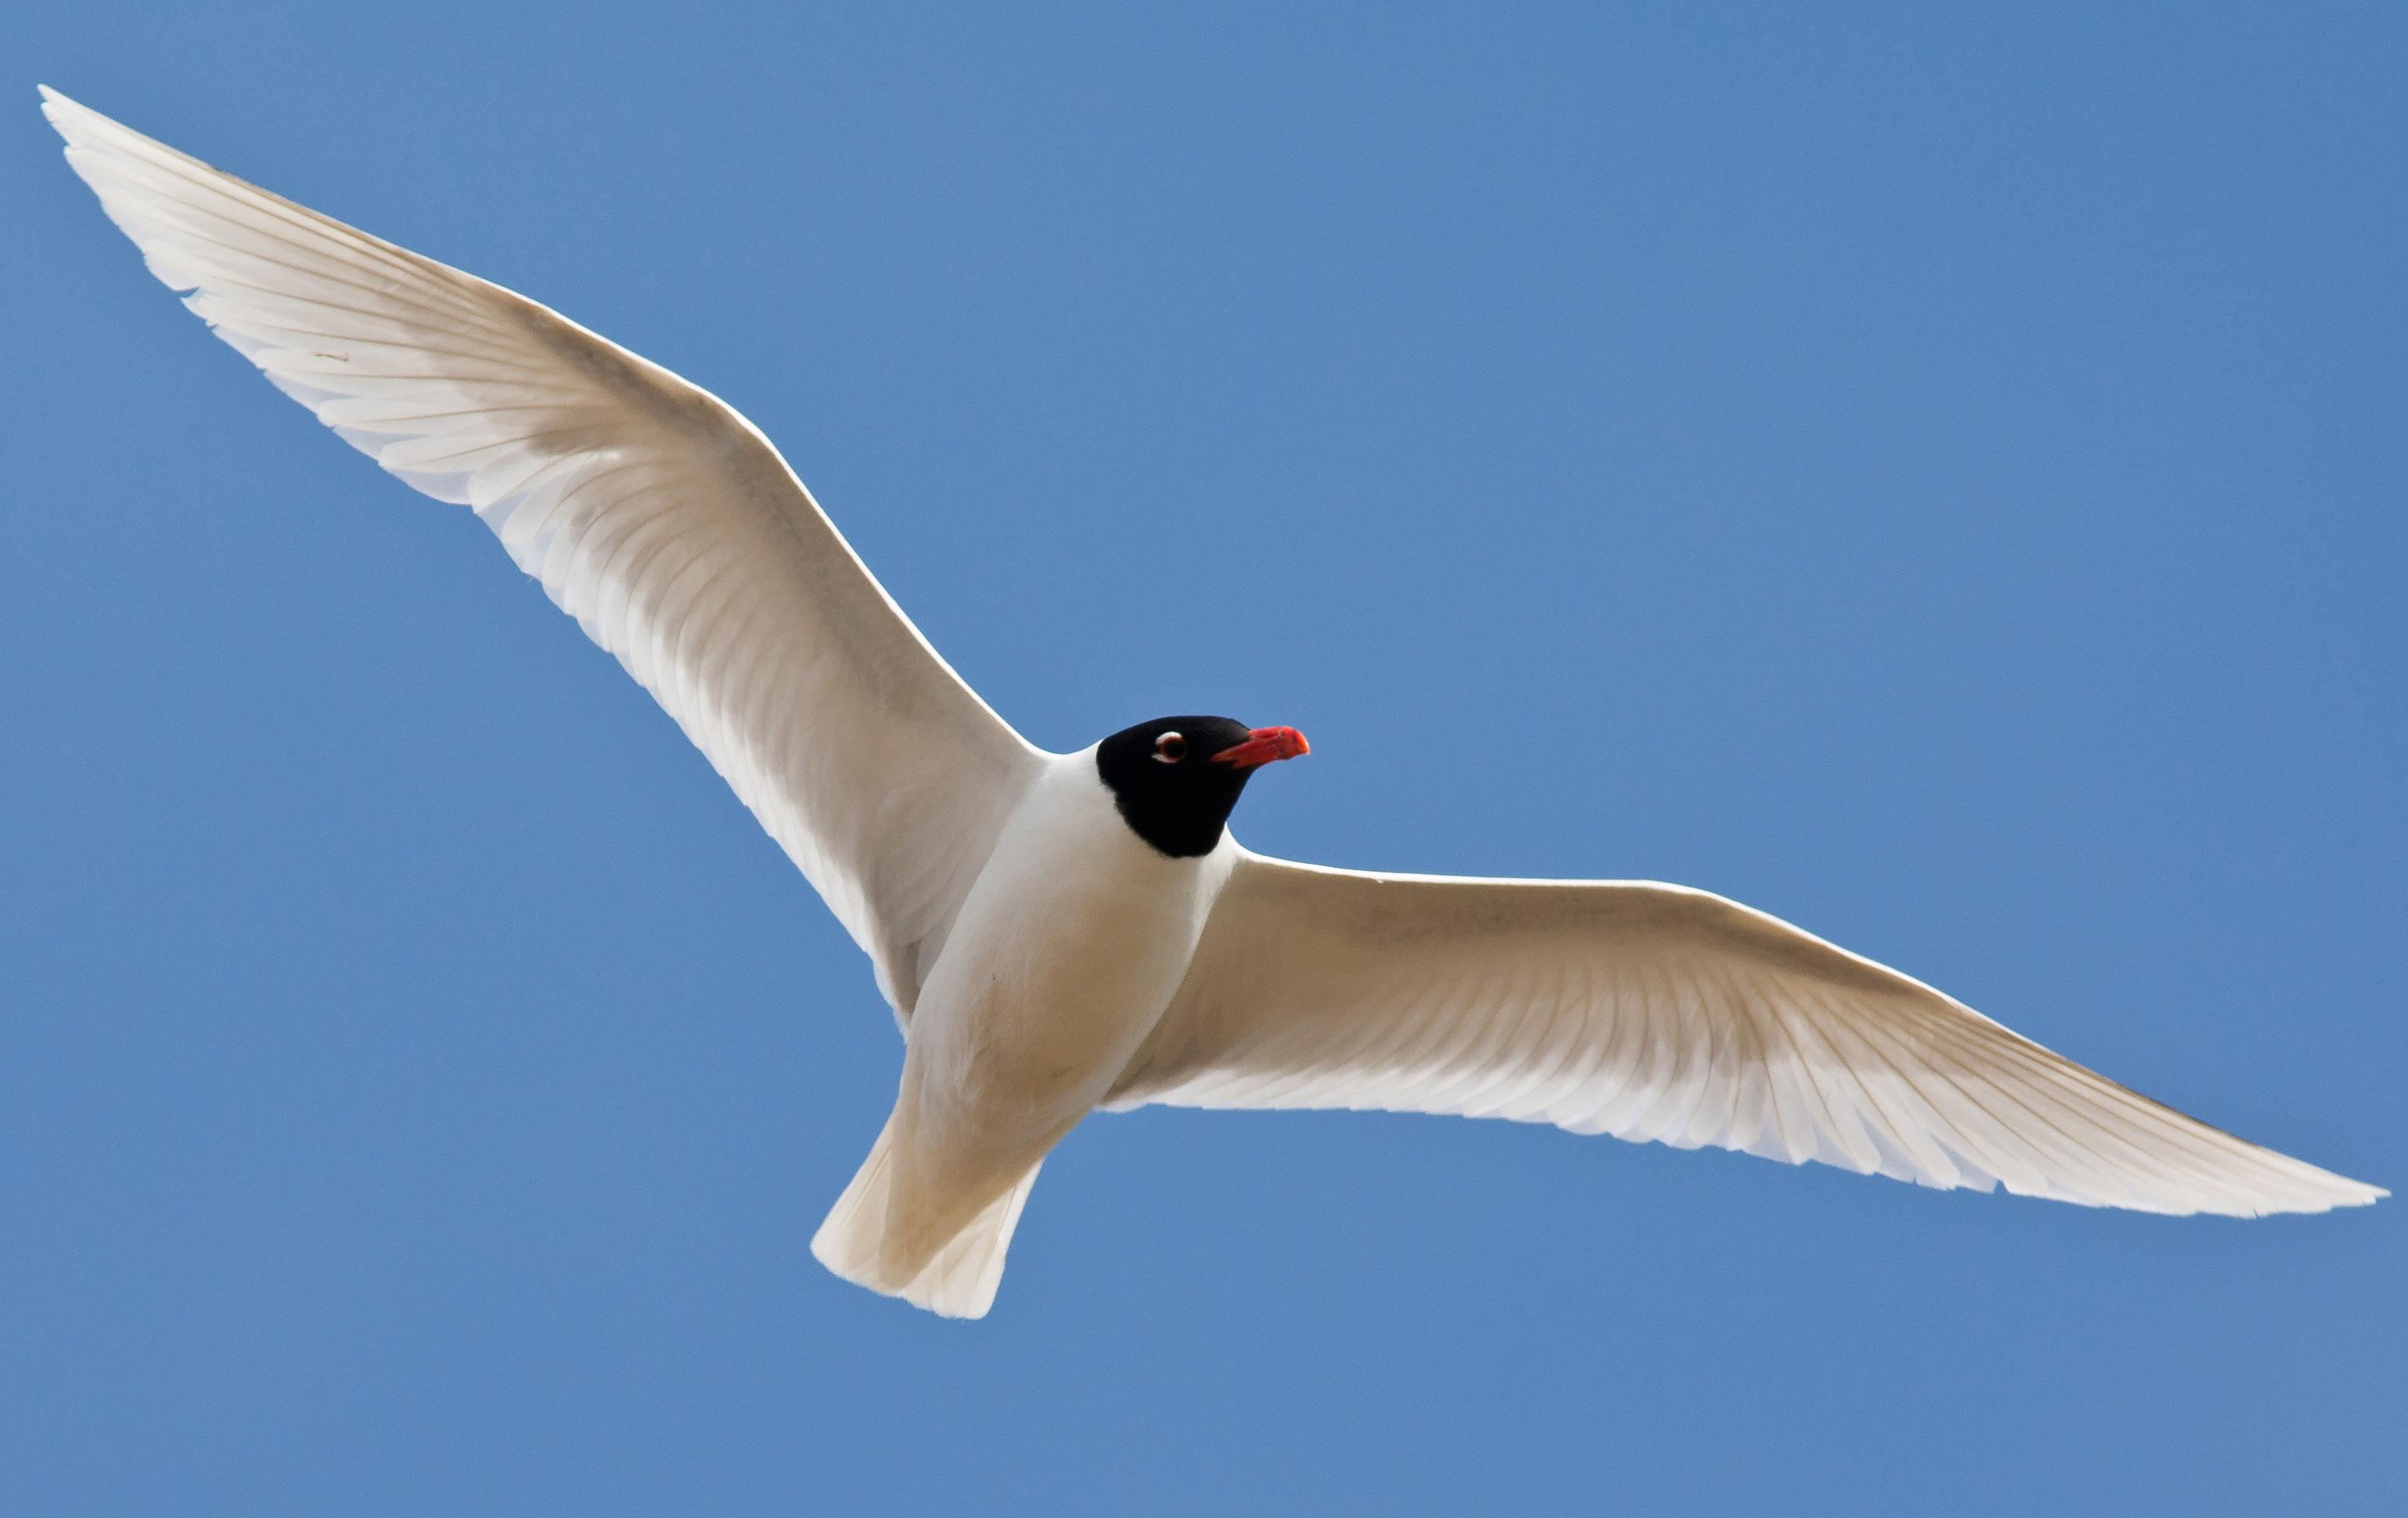
Abundance (AON)
Valid annual SMP abundance trends could not be published for Mediterranean Gull due to the scarcity of regular colony monitoring data, resulting in considerable uncertainty around the estimated trends. Many sites are counted well and data are provided by county bird recorders to the Rare Breeding Birds Panel (Eaton et al. 2023) so an improved flow of data from local counters to the SMP, together with better monitoring would allow a trend to be produced for this species in the future.
The Seabirds Count census demonstrated the rapid recent population growth of this species across Britain and Ireland, with an increase of 1,612% since Seabird 2000 (Table 19), and a rise in colony numbers from 38 to 61 over the same period (Burnell et al. 2023).
At present too few Mediterranean Gull colonies are monitored regularly enough to produce valid productivity trends. More consistent annual
Seabird 2000 (1998—02)
Abundance (AON)
Seabirds Count (2015—21)
Percentage Change
All Britain, Ireland, Isle of Man and Channel Islands 135 2,311 1,612
monitoring of productivity at colonies where data have been submitted previously to the SMP would allow a trend to be produced in the future.
PHENOLOGY, DIET AND SURVIVAL RATES
No data have been collected as part of the SMP.
CAUSES OF CHANGE
Mediterranean Gull populations in Britain and Ireland and across Europe have expanded significantly in recent years, which is likely to be due to a combination of factors, such as climate change, provision and management of suitable habitat, and protection of nesting colonies (Fasola & Canova 1996; Meininger & Flamant 1998; Ausden & Fuller 2009).
However, much of Britain and Ireland's population is sited in just a
few colonies, with a single colony in Hampshire holding 68% of the British and Irish population (Burnell et al. 2023), meaning local impacts have the potential to cause population-level effects (Eaton et al. 2021).
These potential local negative factors include flooding of nests, which can cause desertion of colonies following tidal surges and extreme weather, and this risk is likely to increase due to climate change in the future (JNCC 2021).
Colony disturbance from humans can cause nest desertion and consequent impacts on breeding attempts (James 1984; Burger et al. 2020). Egg loss through predation or illegal collection or harvesting of eggs can also cause local issues, with the latter reported from Poole Harbour (England) in 2016 (Burger et al. 2020; Burnell et al. 2023).
Additional pressures, including outside of the breeding season, facing Mediterranean Gulls include oil pollution, disease and negative impacts resulting from commercial fishing practices and illegal hunting (del Hoyo et al. 1996).
Conservation schemes aimed at reducing human disturbance, protecting against egg collection, and providing and maintaining suitable nesting habitat through vegetation management, erosion control and nesting substrate provision, have proved successful conservation measures for Mediterranean Gulls (Fasola & Canova 1996; Schwartz et al. 2023). Artificial rafts have also occasionally been used by this species (Burgess & Hirons 1992).
Chroicocephalus ridibundus c.
Amber-listed Amber-listed (I)
Abundance: Stable
Productivity: 0.22
Colony Count sites: 114
Breeding Success sites: 28
Least Concern Lifespan: 11 years
Breeding age: 2 years
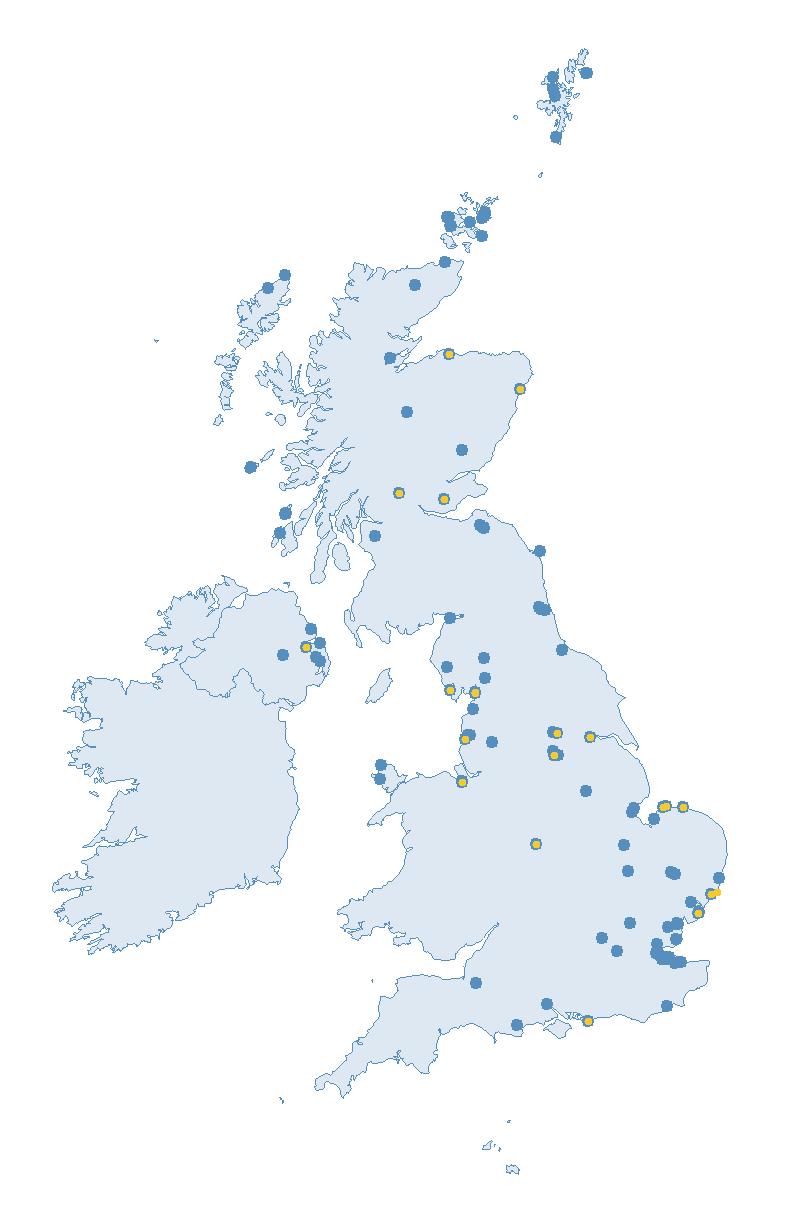
Approximately 2 to 4% of the world’s Black-headed Gull population breeds in Britain and Ireland (Burnell et al. 2023). They are the most widely distributed seabird breeding in Britain and Ireland, with 46% of the population nesting inland and the remainder on the coast (Burnell et al. 2023).
Breeding Black-headed Gulls are widely distributed across Britain and Ireland, with the exception of large areas of the Scottish and Welsh uplands, and the majority of the breeding population are resident throughout the year. (Burnell et al. 2023).
Globally, they breed widely across the middle latitudes of the Palearctic, and there is also a small presence on the east coast of Canada (BirdLife International 2024).
Colonies in the milder areas of their range, such as Britain and Ireland, are resident, with the winter population in Britain boosted by birds from northern and eastern Europe (Wernham et al. 2002). The remaining populations from colder regions winter in the south of the northern hemisphere (del Hoyo et al. 1996).
Black-headed Gulls are opportunistic feeders, adapting their diet to the local environment. Their main prey items are aquatic and terrestrial insects, earthworms and marine invertebrates, but they will also eat
fish, rodents, agricultural grain, berries, fishery discards and human food (del Hoyo et al. 1996; Mitchell et al. 2004; Scott et al. 2015). In the non-breeding season, Black-headed Gulls tend to rely on artificial food sources, including refuse tips (del Hoyo et al. 1996).
Black-headed Gulls usually nest in large colonies near water, e.g. bogs, marshes, gravel pits or the sea, but will also use drier ground, artificial rafts, occasionally low trees and bushes and will utilise rooftops in some places (Hagemeijer & Blair 1997; Mitchell et al. 2004). The nests are made of vegetation, twigs and sticks into which 2–3 eggs are laid (BTO 2023a; Snow & Perrins 1998).
BREEDING ABUNDANCE
SMP abundance trends for Blackheaded Gull are only produced for coastal nesters, as insufficient inland colonies are monitored annually to produce reliable trends.
The UK SMP abundance trend shows a decline of 23% since 2000 (Table 20) compared with the
Too few data are currently submitted to the SMP in other regions to allow for the calculation of meaningful abundance trends.
PRODUCTIVITY
Over the period of the SMP monitoring programme, Black-headed Gull productivity values, which cover both coastal and inland nesters, have fluctuated markedly for both the UK and Scotland, with no clear trend (Figure 24). This is likely to be in response to local changes in predation, food supply and periods of inclement weather during breeding seasons (JNCC 2021). Whilst productivity values were relatively similar between the two regions in 2021 and 2022 (Tables 50 and 52), in 2023, values for Scotland (0.46 chicks fledged per pair) were considerably higher than for the UK as a whole (0.22 chicks fledged per pair; Table 20).
decrease of 33% for coastal nesters reported by Seabirds Count over a similar period (Burnell et al. 2023). The England SMP abundance trend also shows a decline of 23% since 2000 (Table 20), whilst a greater decline of 38% for coastal nesters was shown by the Seabirds Count results (Burnell et al. 2023).
Figures 22 and 23 show the long-term trends for the UK and England over the SMP monitoring period. For both the UK and England, the abundance index declined from the late 1980s until the mid 2000s, followed by an increase over the next decade. However, the trends for both the UK and England appear to have been in overall decline again since 2017. The 2023 figures dropped to 5% below the 1986 baseline for the UK and 9% above for England (Table 20), likely in part to be due to the recent HPAI outbreak which affected the species in 2022 and 2023. While the English trend closely mirrored the UK trend for much of the SMP monitoring period, a gap between the two has become more evident in recent years, with the English figures higher than those for the UK.
Too few data are submitted to the SMP on productivity of Blackheaded Gull in other regions for the calculation of reliable average productivity values.
PHENOLOGY, DIET AND SURVIVAL RATES
No data have been collected as part of the SMP.
The Seabirds Count census revealed regional differences in the pattern
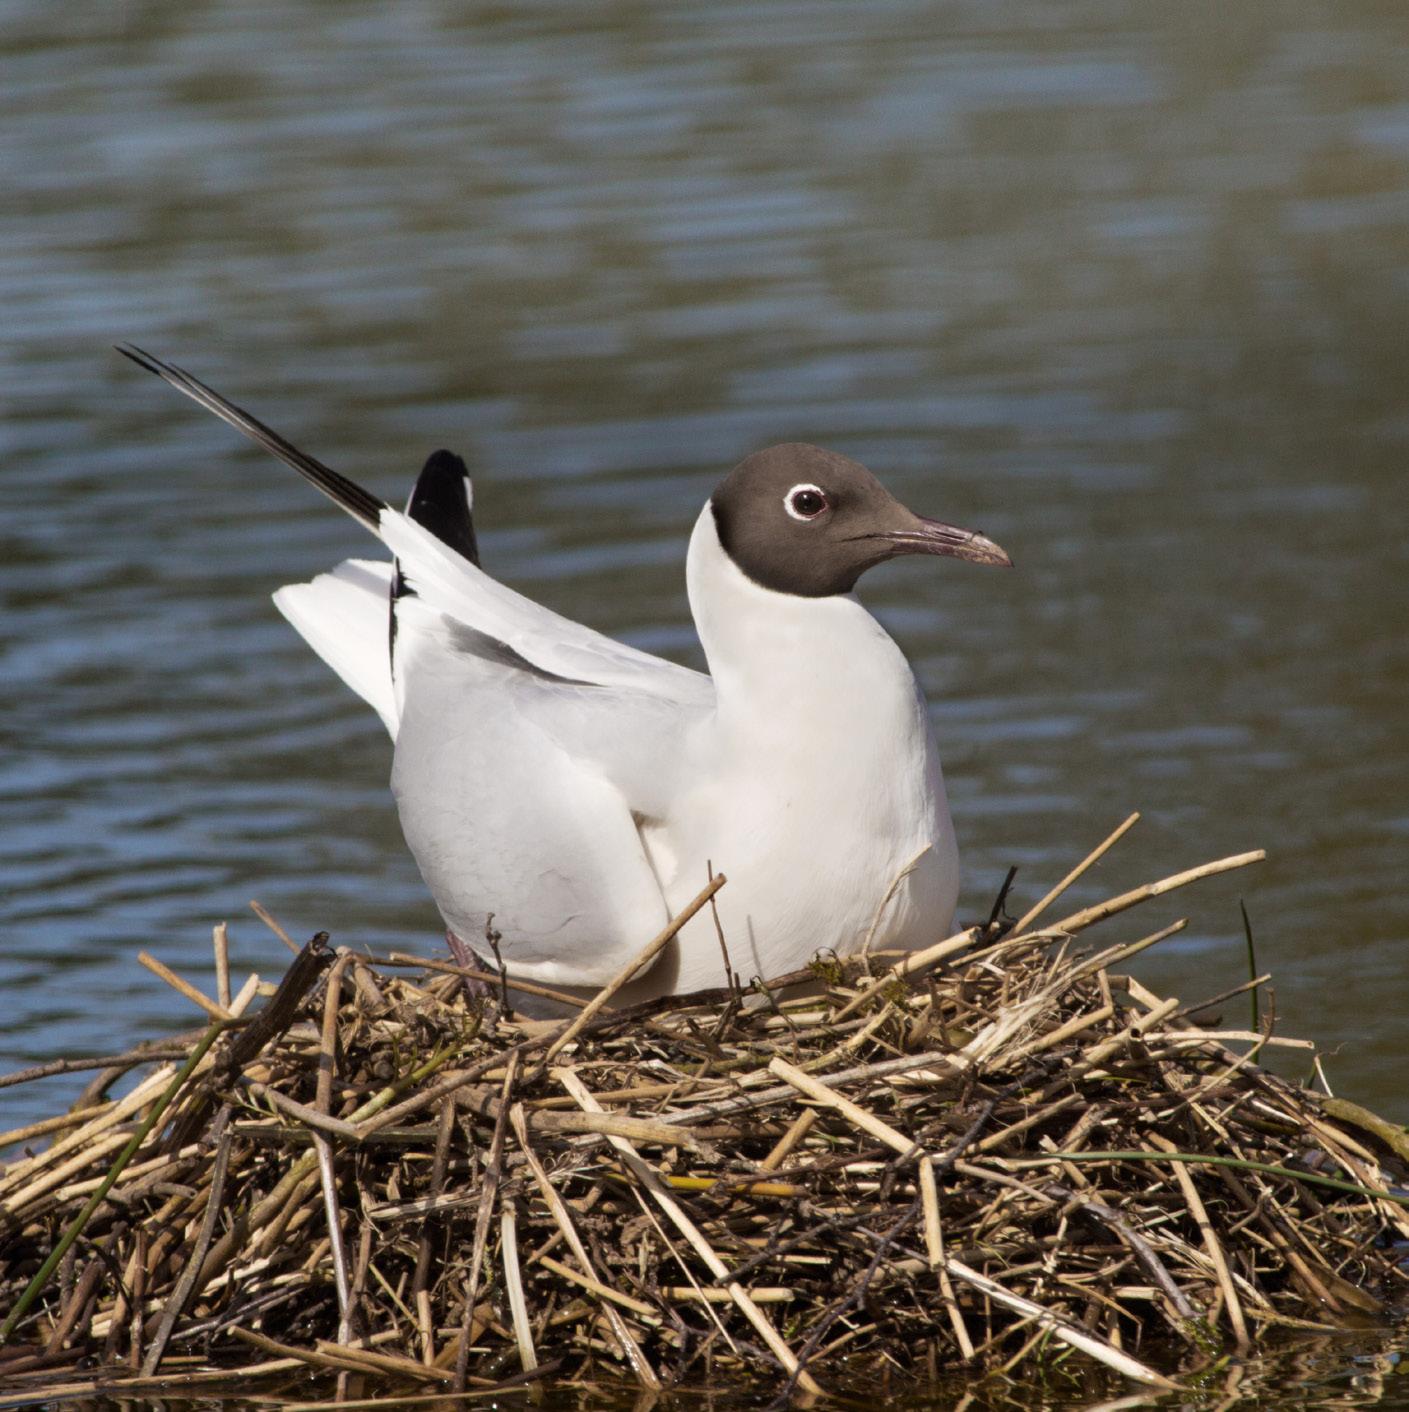
of Black-headed Gull population decline, with losses in England and Wales being concentrated in coastal areas, whereas the declines were more prevalent in inland and often upland sites in Scotland (Burnell et al. 2023). There is no clear evidence of the causative factors for the decline, and it is likely that a combination of pressures are acting together. Much
of the population decline between the Seabird 2000 and Seabirds Count censuses is accounted for by heavy losses at just four large colonies (Burnell et al. 2023).
Predation by a variety of both avian and mammalian predators, including American Mink (Neovison vison) (Craik 1995; 1997; Coulson 2019), rats,
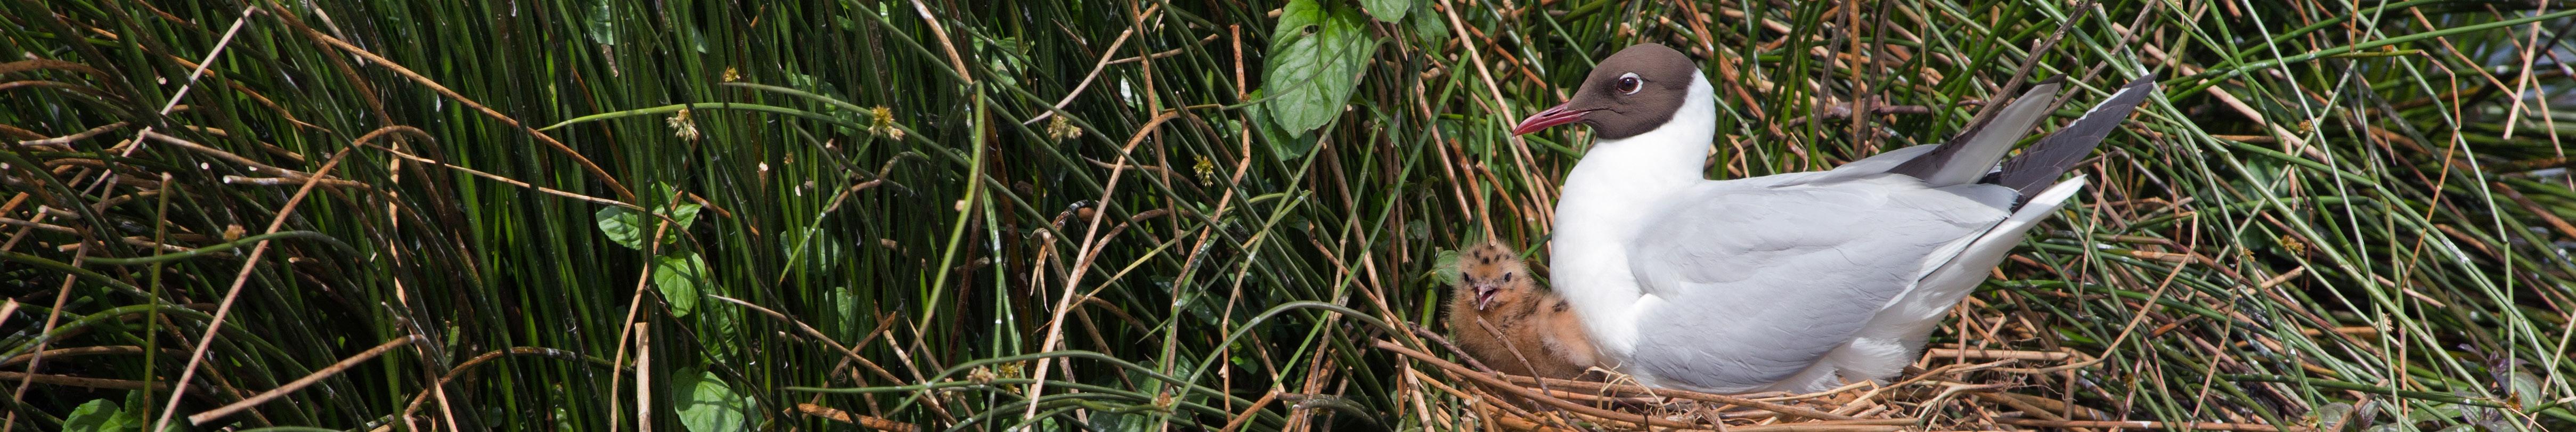
European Otter (Lutra lutra), Red Fox (Vulpes vulpes) and larger gulls, that take eggs and/or chicks, poses a threat to Black-headed Gulls.
Afforestation can remove suitable habitat and introduce opportunities for predatory mammal and bird species, while moorland management and agricultural practices could also be adding pressure at inland locations through habitat changes (Newton 2020; Roos et al. 2018).
In England, licences for harvesting Black-headed Gull eggs for human consumption are still being issued, with around 50 licences issued in 2019 with a combined maximum take of more than 60,000 eggs and adults (Burnell et al. 2023), but it is unknown if the full numbers permissible are actually taken.
Additional potential pressures are changes in food availability, extreme weather events, chemical pollution and oil spills, disturbance and disease outbreaks (Burnell et al. 2023; Gorski et al. 1977; Indykiewicz 2015, van de Pol et al. 2010). The 2022 HPAI outbreak caused an apparent population decline of 11% in the surveyed sites between the Seabirds Count census and 2023 (see pages 8–11). However, the actual impact on the UK Black-headed Gull population is likely to be greater, as this estimate did not include mortality during the 2023 breeding season (Tremlett et al. 2024).
Reduction of the potential impact of predators through both predator fences and direct control, e.g. the removal of
American Mink (Neovison vison) from nesting islands, can lead to increased breeding success and benefit local populations (Hunt & Herrernan 2007; Short 2022).
In England, the creation of new habitat in the form of gravel pits, and appropriate nature reserve management has also proved beneficial for Blackheaded Gulls (Burnell et al. 2023).
Continued monitoring of populations following the impact of HPAI will be crucial in understanding how outbreaks impact birds nesting in Britain and Ireland, and increased research into the regional differences in population change may also be key to the conservation of this species.
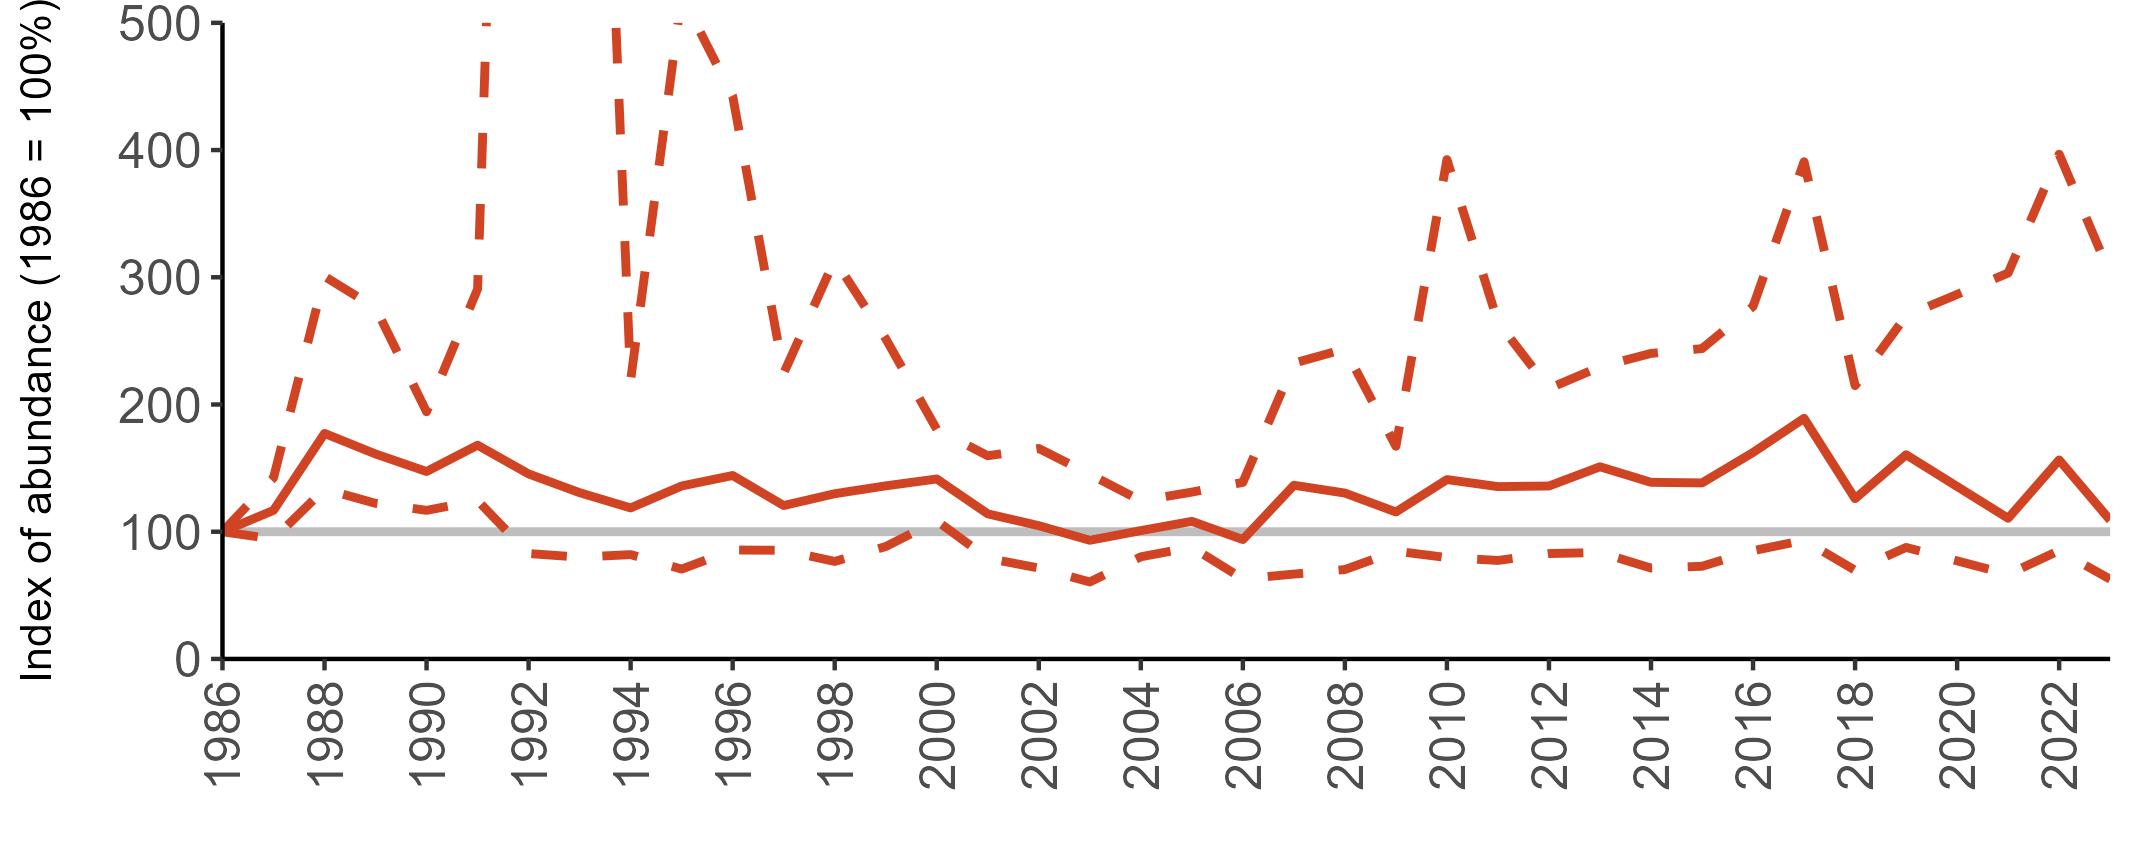
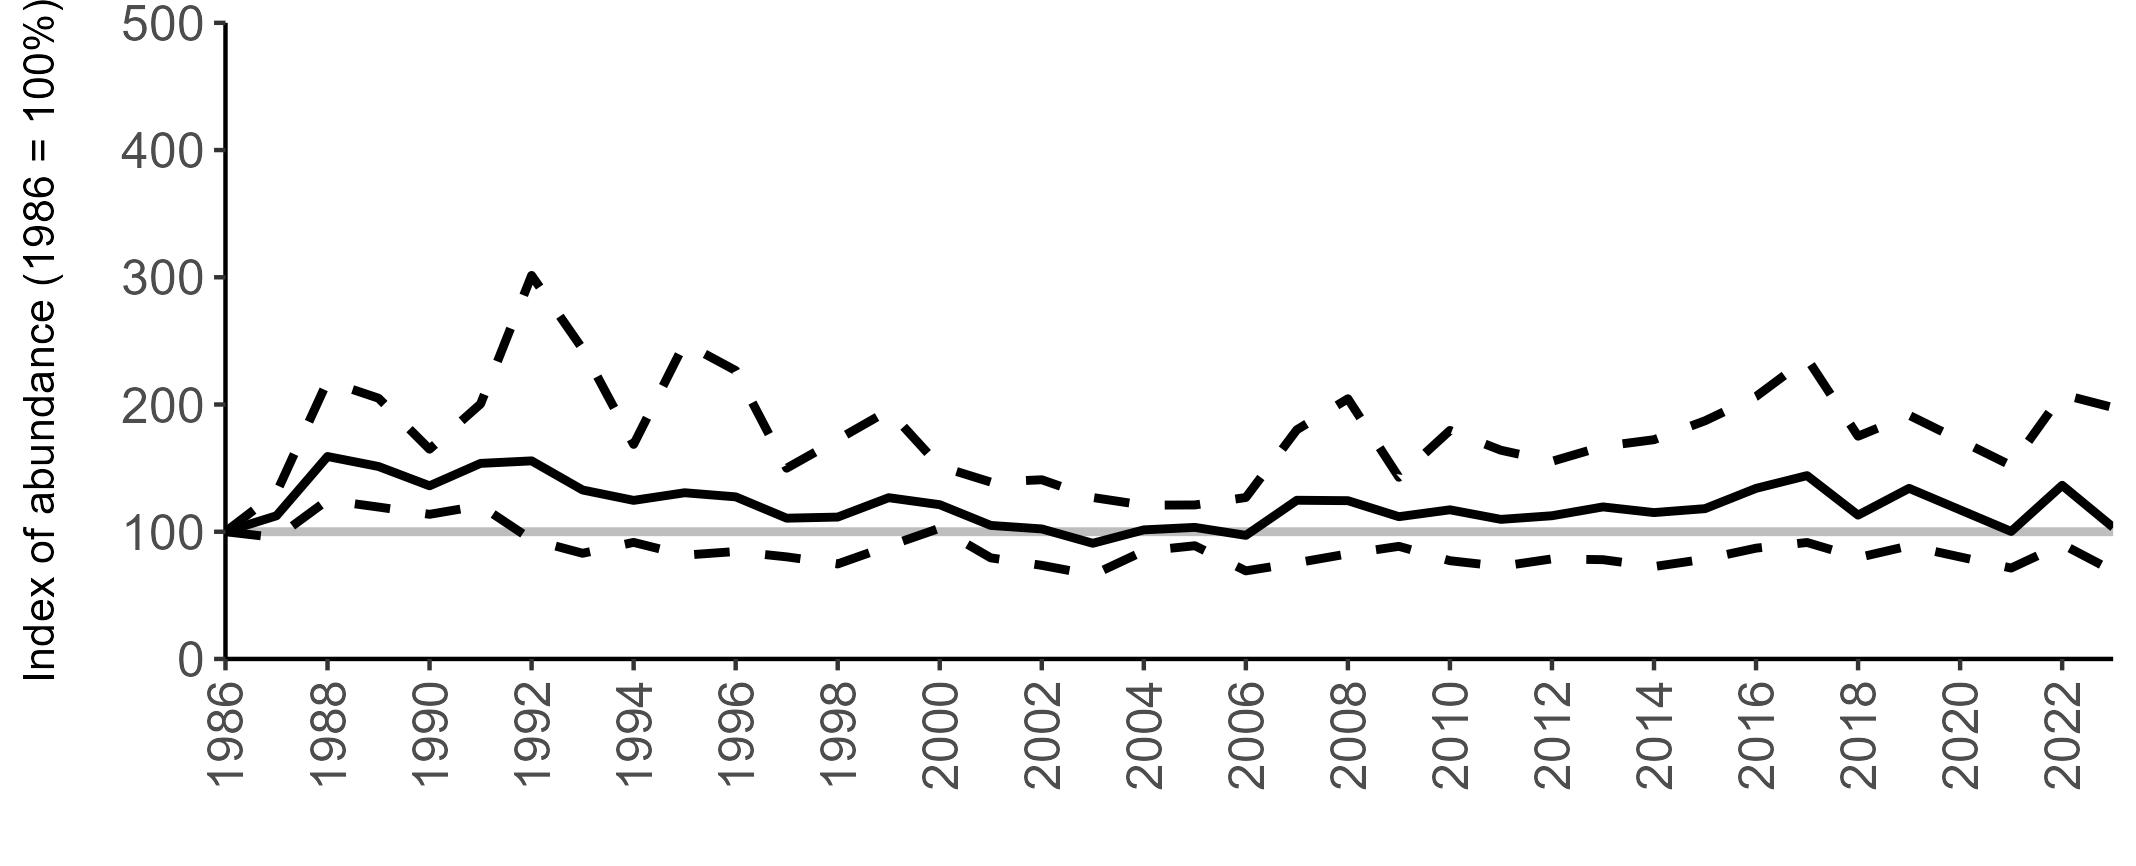
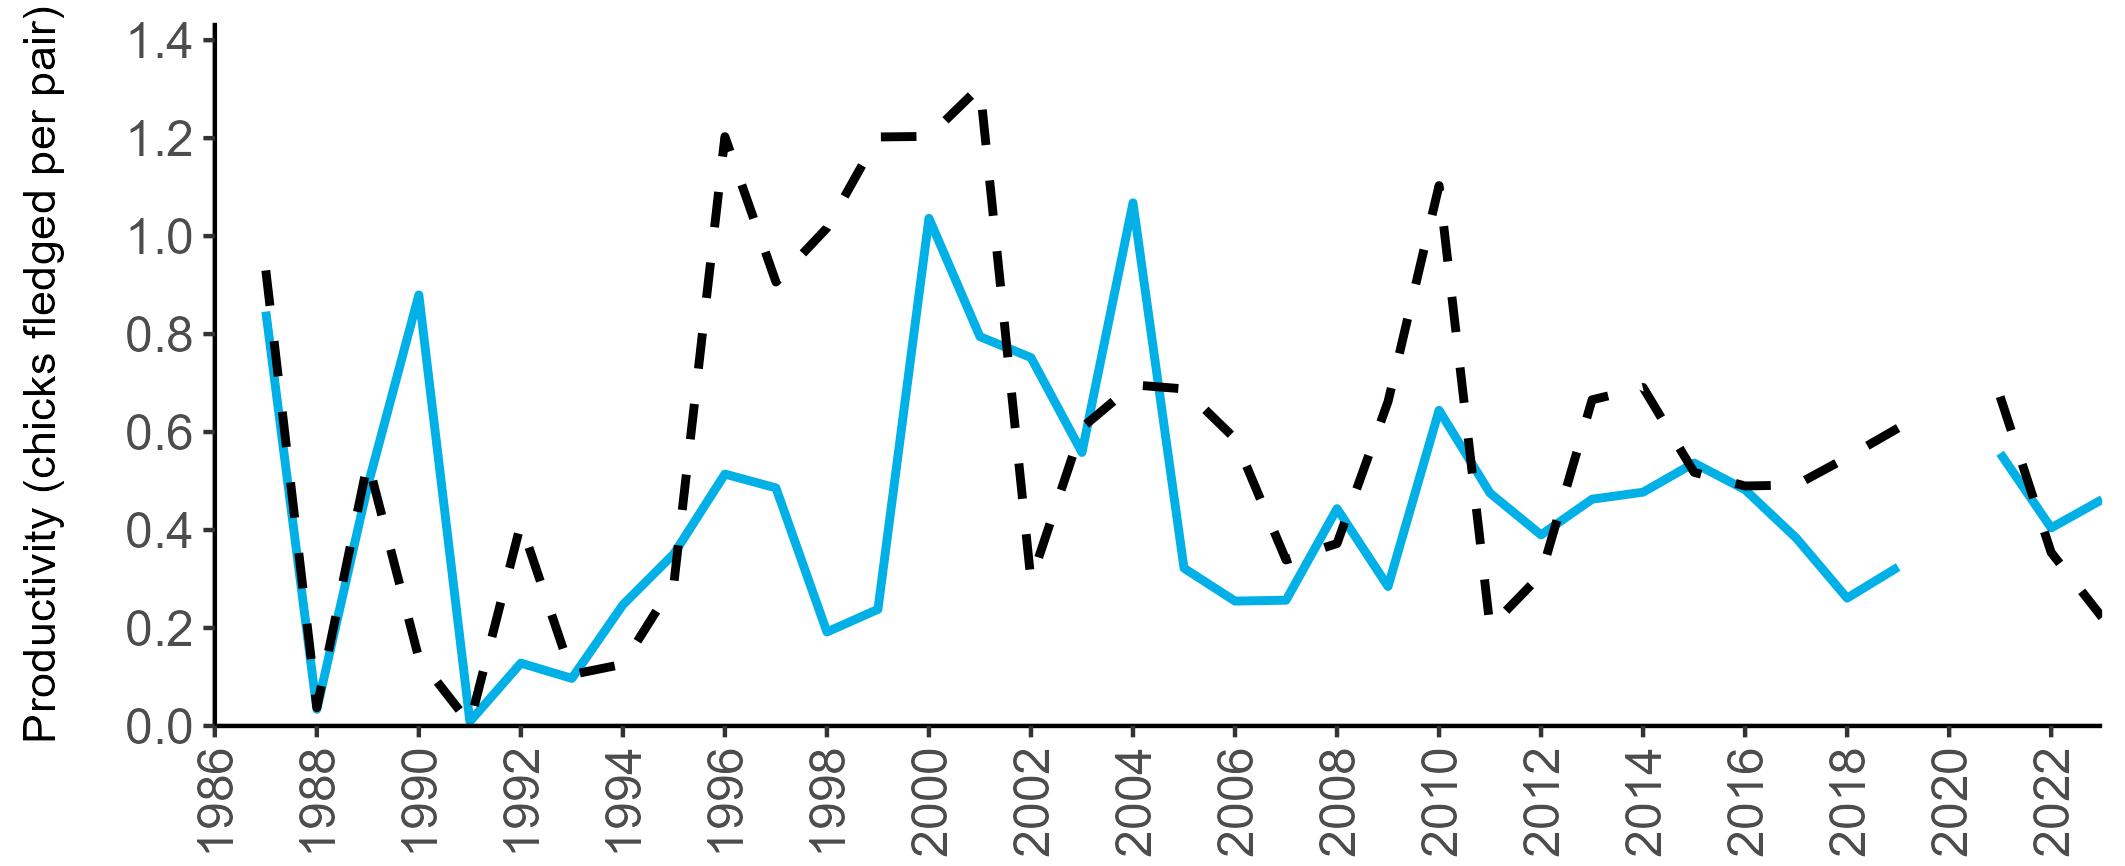
Red-listed
Amber-listed (I)
Least Concern
Abundance: Decline (Scotland)
Productivity: 0.55
Colony Count sites: 77
Breeding Success sites: 11
Lifespan: 10 years
Breeding age: 3 years
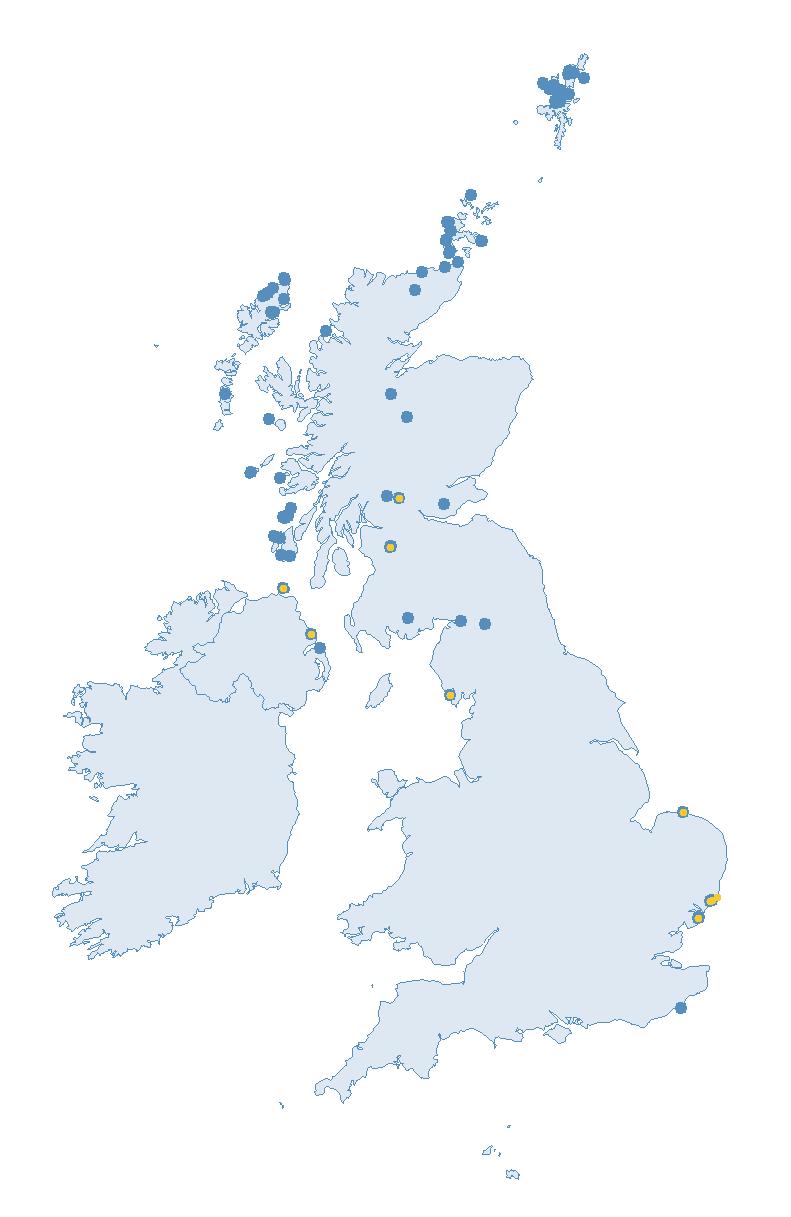
Britain and Ireland host approximately 2% of the global breeding population of Common Gull (Burnell et al. 2023). Key identifying features are their greenish-yellow bill and legs, combined with a grey (canus meaning ‘whitish-grey’) back and upperwings (BTO 2023a).
DISTRIBUTION
The majority of Common Gull breeding colonies are in the north and west of Britain and Ireland, with just a few breeding sites recorded further south (Burnell et al. 2023).
Globally, breeding Common Gulls are found across the northern Palearctic (BirdLife International 2024). Some areas are home to permanent residents, but other populations migrate south in the winter along their respective coasts, to areas including Portugal and the Mediterranean (del Hoyo et al. 1996).
The population in Britain and Ireland is boosted in winter by the arrival of additional migrants from mainland Europe, and they become very widely distributed across lowland and coastal areas (Wernham et al. 2002).
DIET
BREEDING
Coastal Common Gulls breed in a range of associated habitats, from beaches to grassy cliff-ledges, whilst inland breeding sites include moorlands, lake shores and river banks (Burnell et al. 2023; Skórka et al. 2006). They typically nest in small colonies, their nests are shallow cups lined with vegetation and seaweed, and up to three eggs are laid per brood (BTO 2023a; del Hoyo et al. 1996).
BREEDING ABUNDANCE
Due to insufficient data from inland colonies of Common Gull, it has only been possible to provide trends for their coastal-nesting populations. Valid abundance trends could only be produced for Scotland, which holds the majority of the UK population, as too few colonies were monitored elsewhere to produce reliable trends for the UK as a whole.
The diet of the Common Gull varies according to their breeding location and with the season (Mudge & Ferns 1982; Kubetzki & Garthe 2003). Inland, they will eat earthworms, beetles and other insects and in spring have been known to eat grain (del Hoyo et al. 1996), whereas coastal birds will take planktonic crustaceans, molluscs, small fish and fishery discards (Burnell et al. 2023).
For Scotland, the decline in the coastal-nesting Common Gull SMP abundance trend of 38% since 2000
(Table 22) closely matches the decline of 39% reported by the Seabirds Count census for coastal nesters since the Seabird 2000 census (Burnell et al. 2023).
During the SMP monitoring period, there has been a decline in the Common Gull population trend in Scotland since the mid 2000s, with the lowest index value since monitoring began recorded in 2021, when it was 64% below the 1986 baseline (Figure 25). In 2023 there was an increase in the index trend to 19% below the baseline (Table 22).
Too few data are currently submitted to the SMP in other regions to allow for the calculation of meaningful abundance trends.
The Common Gull productivity trends for the UK and Scotland were closely matched up to 2016, with most monitored sites being in Scotland (Figure 26). However, fewer sites have been monitored in Scotland in recent years, and the trends have subsequently diverged, with the Scottish values generally
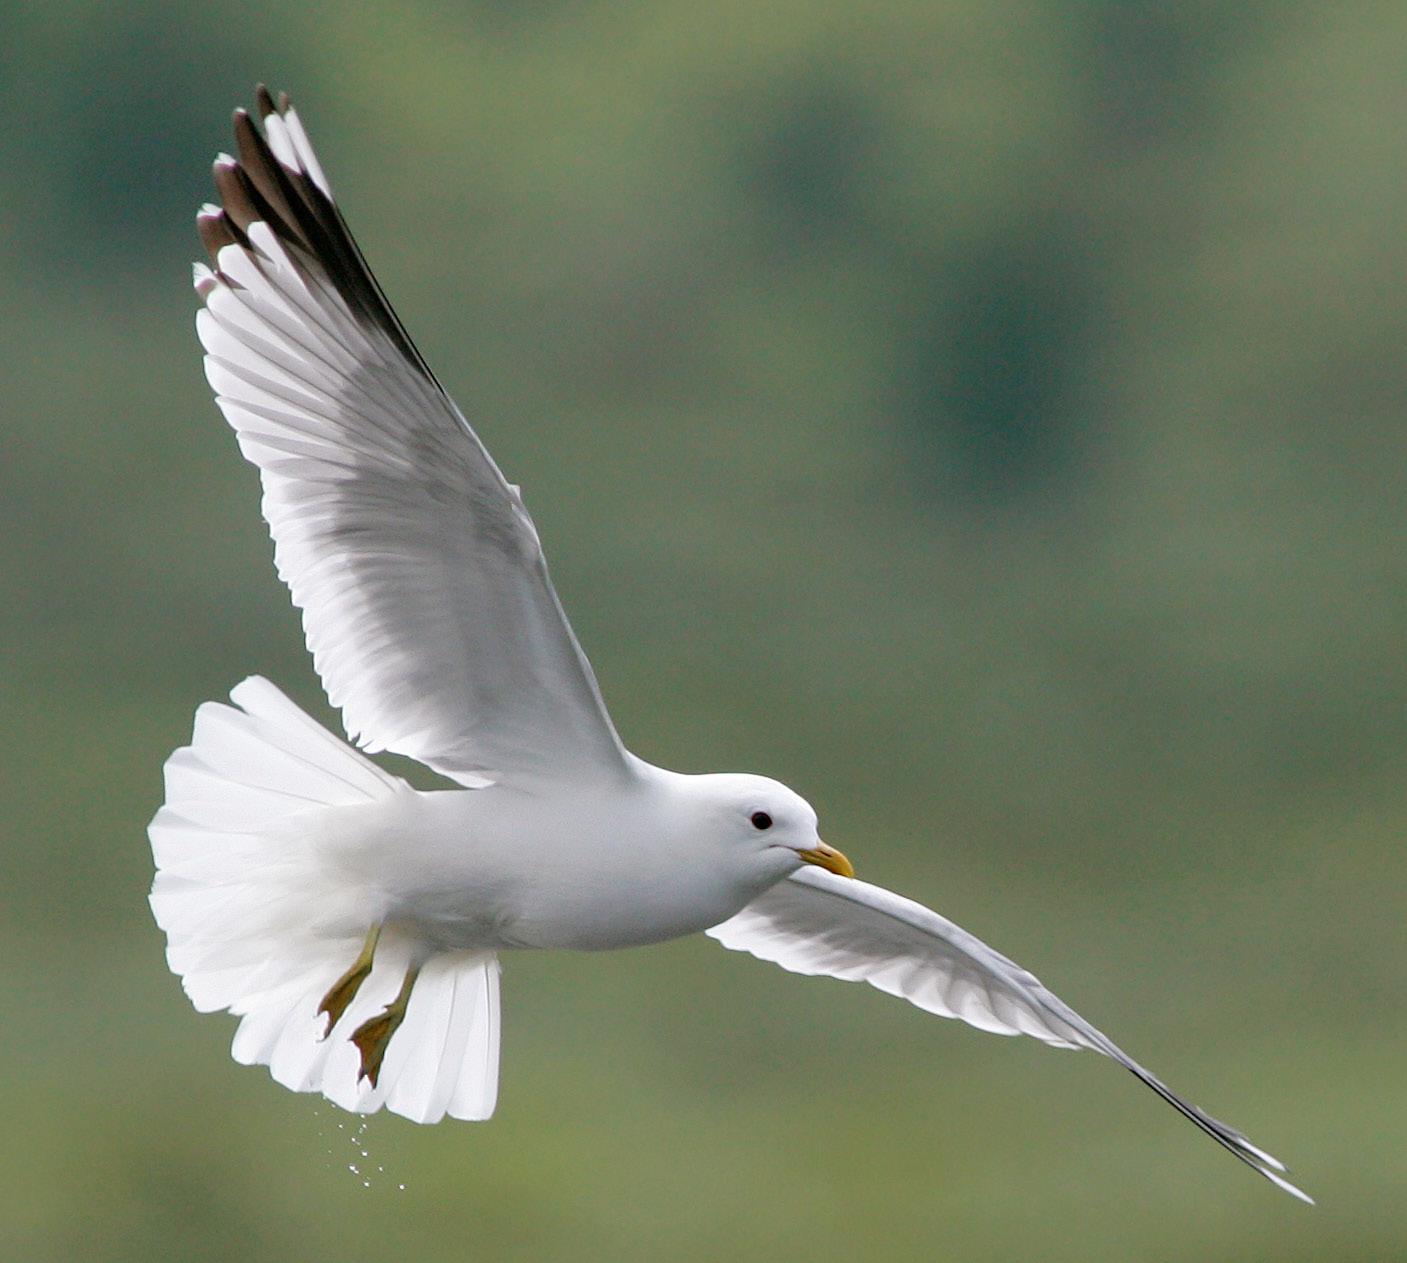
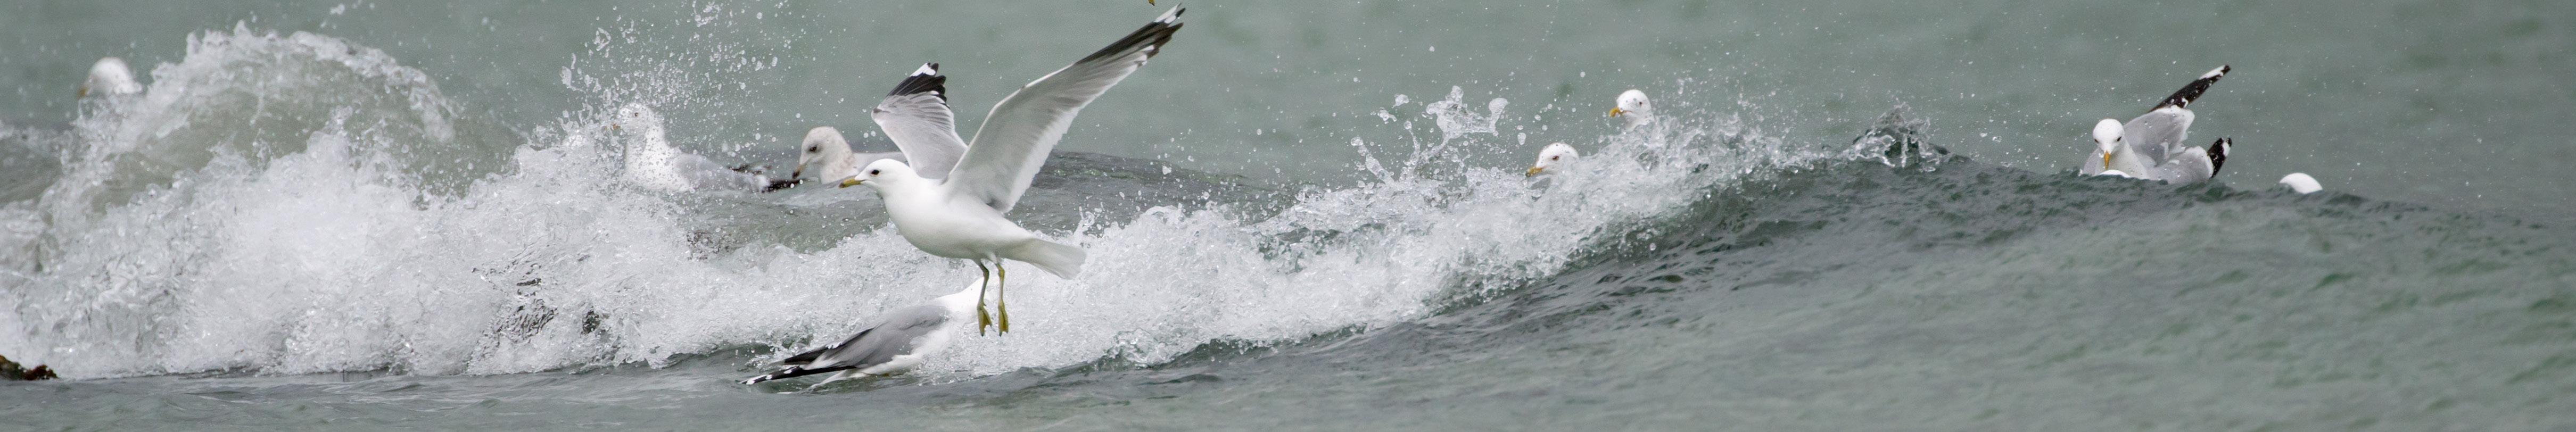
being lower than those for the UK as a whole. The UK and Scotland trends have fluctuated across the years, with a general decline in values between 1998 and 2019, although it should be noted that most of the data between 1996 and 2003 came from a study on the effects of American Mink (Neovison vison) on gulls nesting on the west coast of Scotland (Craik 1995), and may not be representative of the situation in Scotland as a whole (JNCC 2021). The situation appears to have improved in recent years, as a peak in productivity was observed in 2022, with 0.82 and 0.73 chicks fledged per pair for the UK and Scotland, respectively (Tables 50 & 52). Values were lower in 2023, with 0.55 chicks fledged per pair in UK and 0.57 in Scotland (Table 22).
Too few data are submitted to the SMP on productivity of Common Gulls in other regions to calculate any meaningful average productivity values.
PHENOLOGY, DIET AND SURVIVAL RATES
No data have been collected as part of the SMP.
Predation is likely to be a significant threat to Common Gull colonies.
Non-native and invasive American Mink (Neovison vison) are known to take Common Gull adults, chicks and eggs (Craik 1995; 2017; Nordström et al. 2003), and additional predators include European Otter (Lutra lutra), other mammals, birds of prey, crows and large gulls (Burnell et al. 2023). In extreme cases this can cause colony abandonment. However, it is unknown how much of an impact this has on the overall population trend.
Licences are issued each year by NatureScot allowing the destruction of a number of Common Gull eggs and nests (historically, more than 20% of Scottish nests), and this had the potential to impact on the Scottish breeding population if fully implemented (Burnell et al. 2023). In 2024, NatureScot updated guidance to reduce the number of licences issued for gulls, including Common Gulls.
Detrimental changes in their nesting environments, from afforestation to changes in moorland management or the construction of developments such as wind farms, can all cause local declines in populations (Burnell et al. 2023). Changes in food availability through alterations in agricultural management, climate change and the impact of fishery discard bans, are additional potential pressures whose
current impact is unknown (Burnell et al. 2023; Mitchell et al. 2004).
Control of non-native predators, for example removal of American Mink from islands, can lead to higher gull breeding success rates (Hunt & Heffernan 2007), consequently effective predator control is likely to be beneficial for Common Gull populations.
There has been limited research on Common Gulls, and further studies into the impact of pressures such as land management change, alterations in food availability, and licensed nest and egg destruction may be crucial for future conservation of the species, especially in light of the recent declines detected in this species (Burnell et al. 2023).
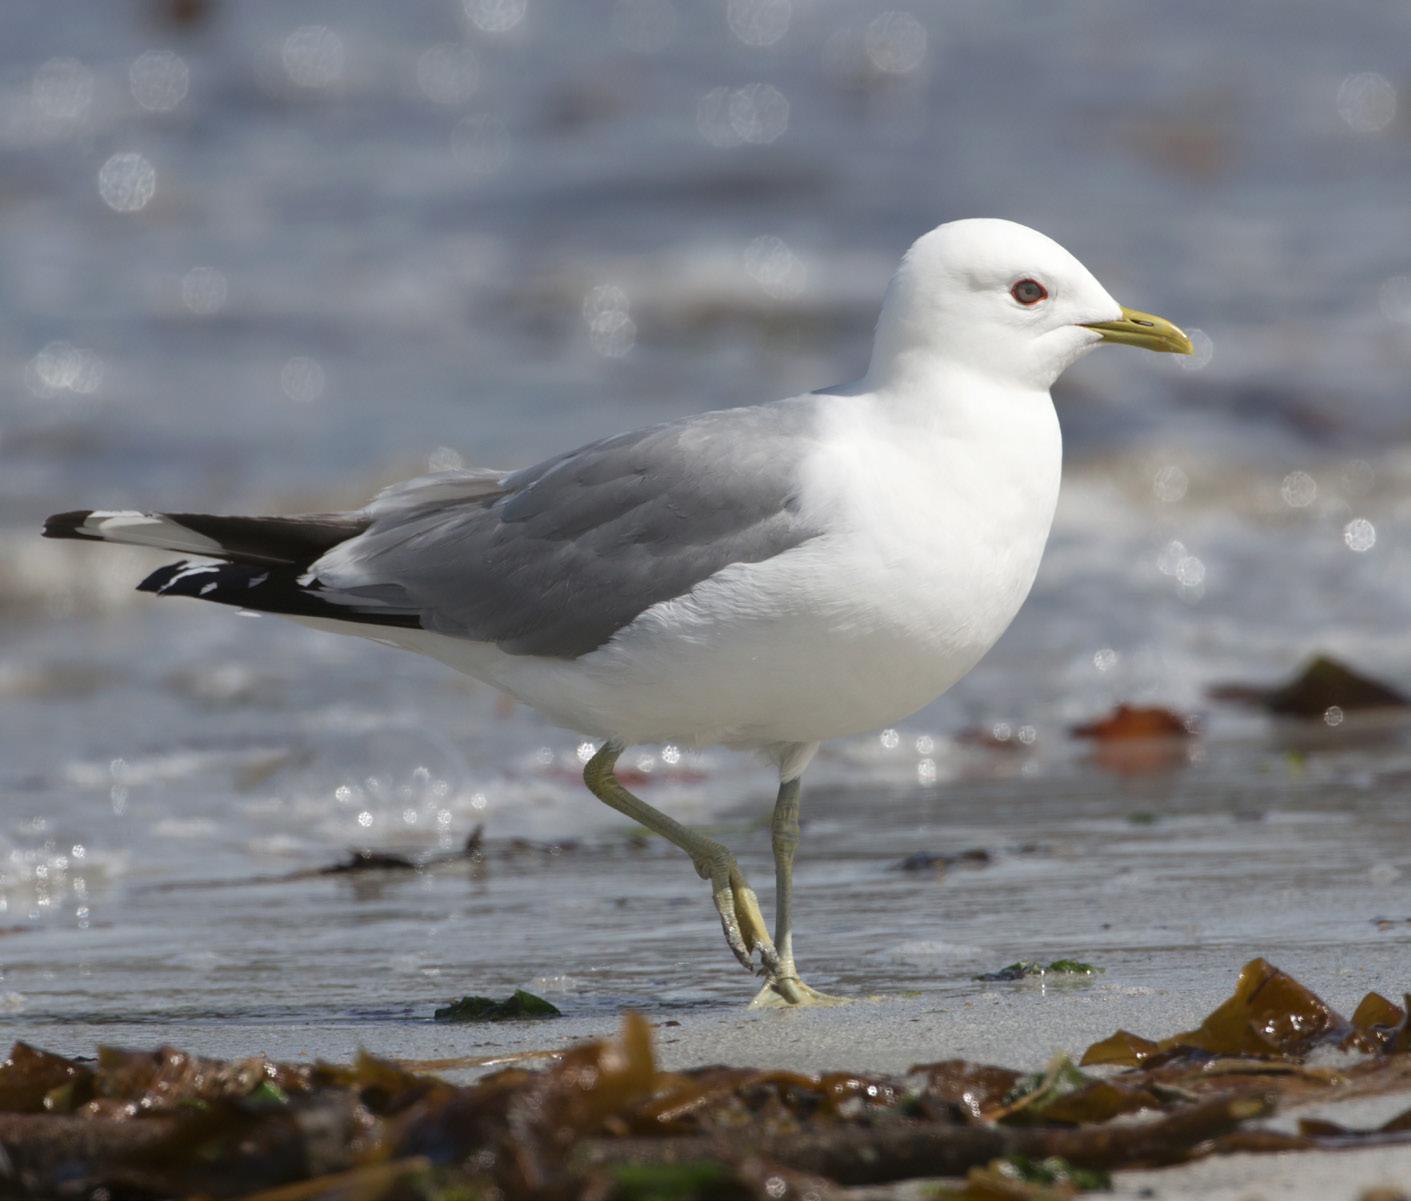
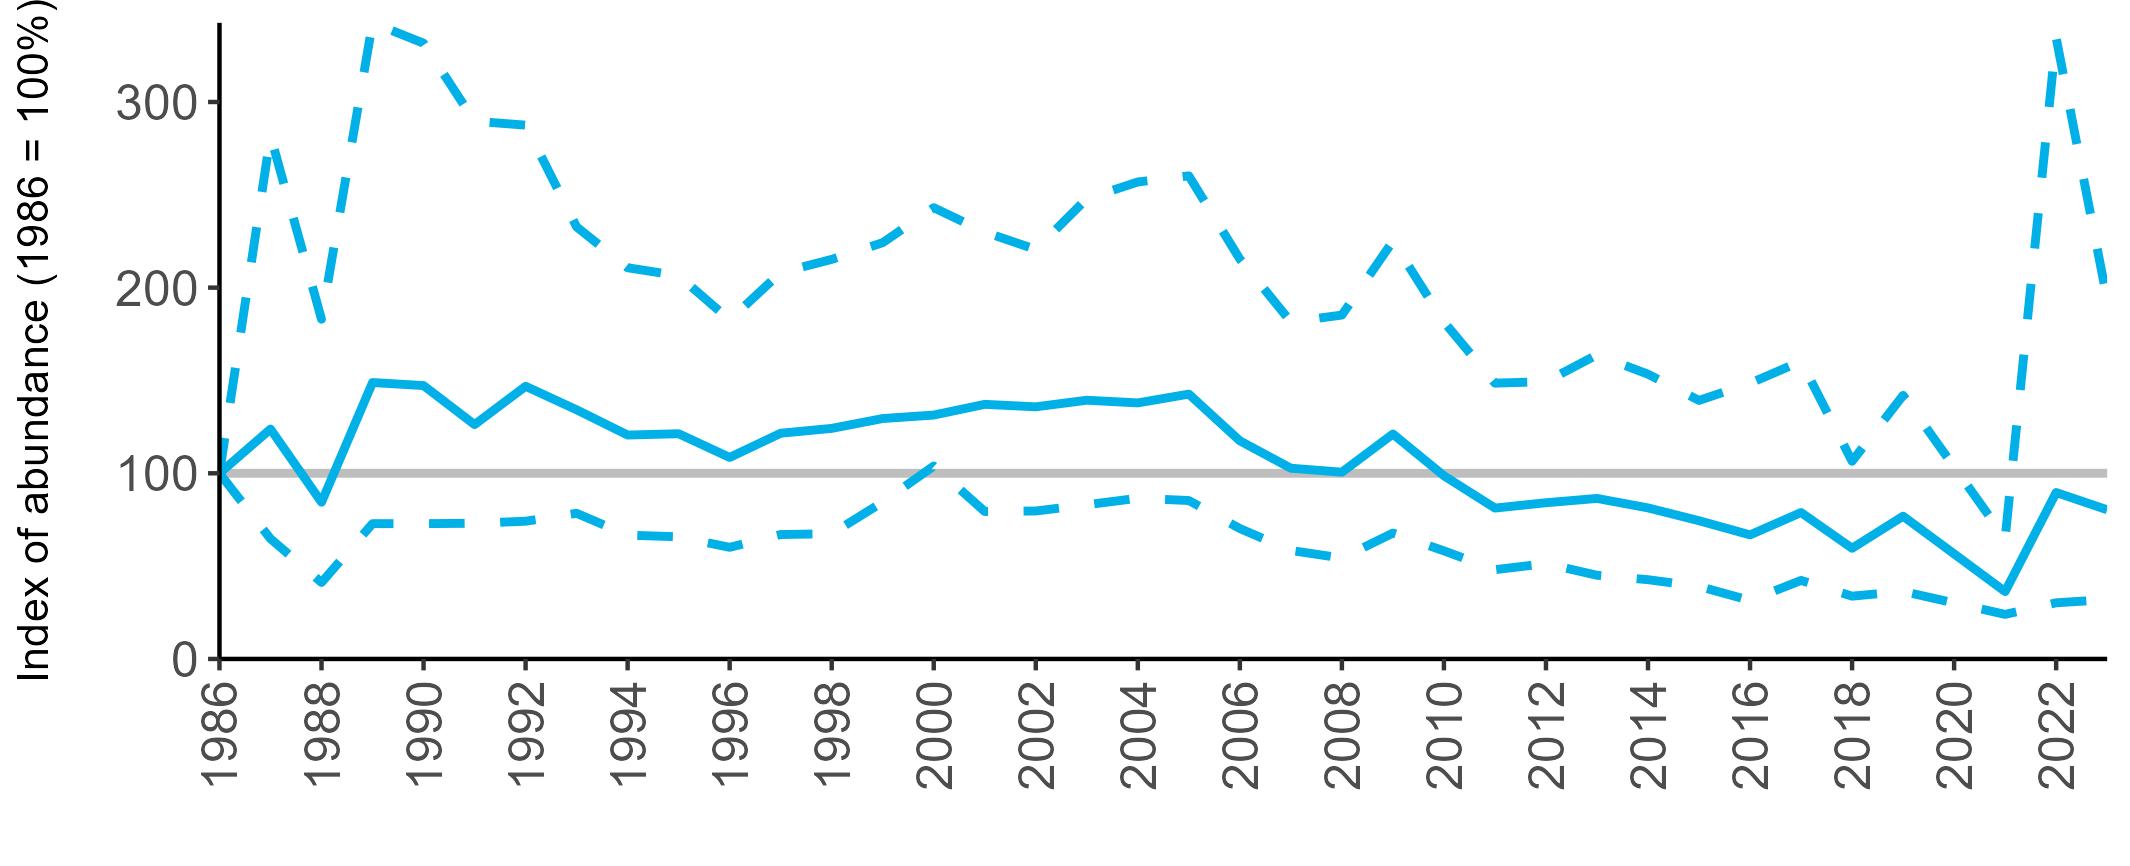
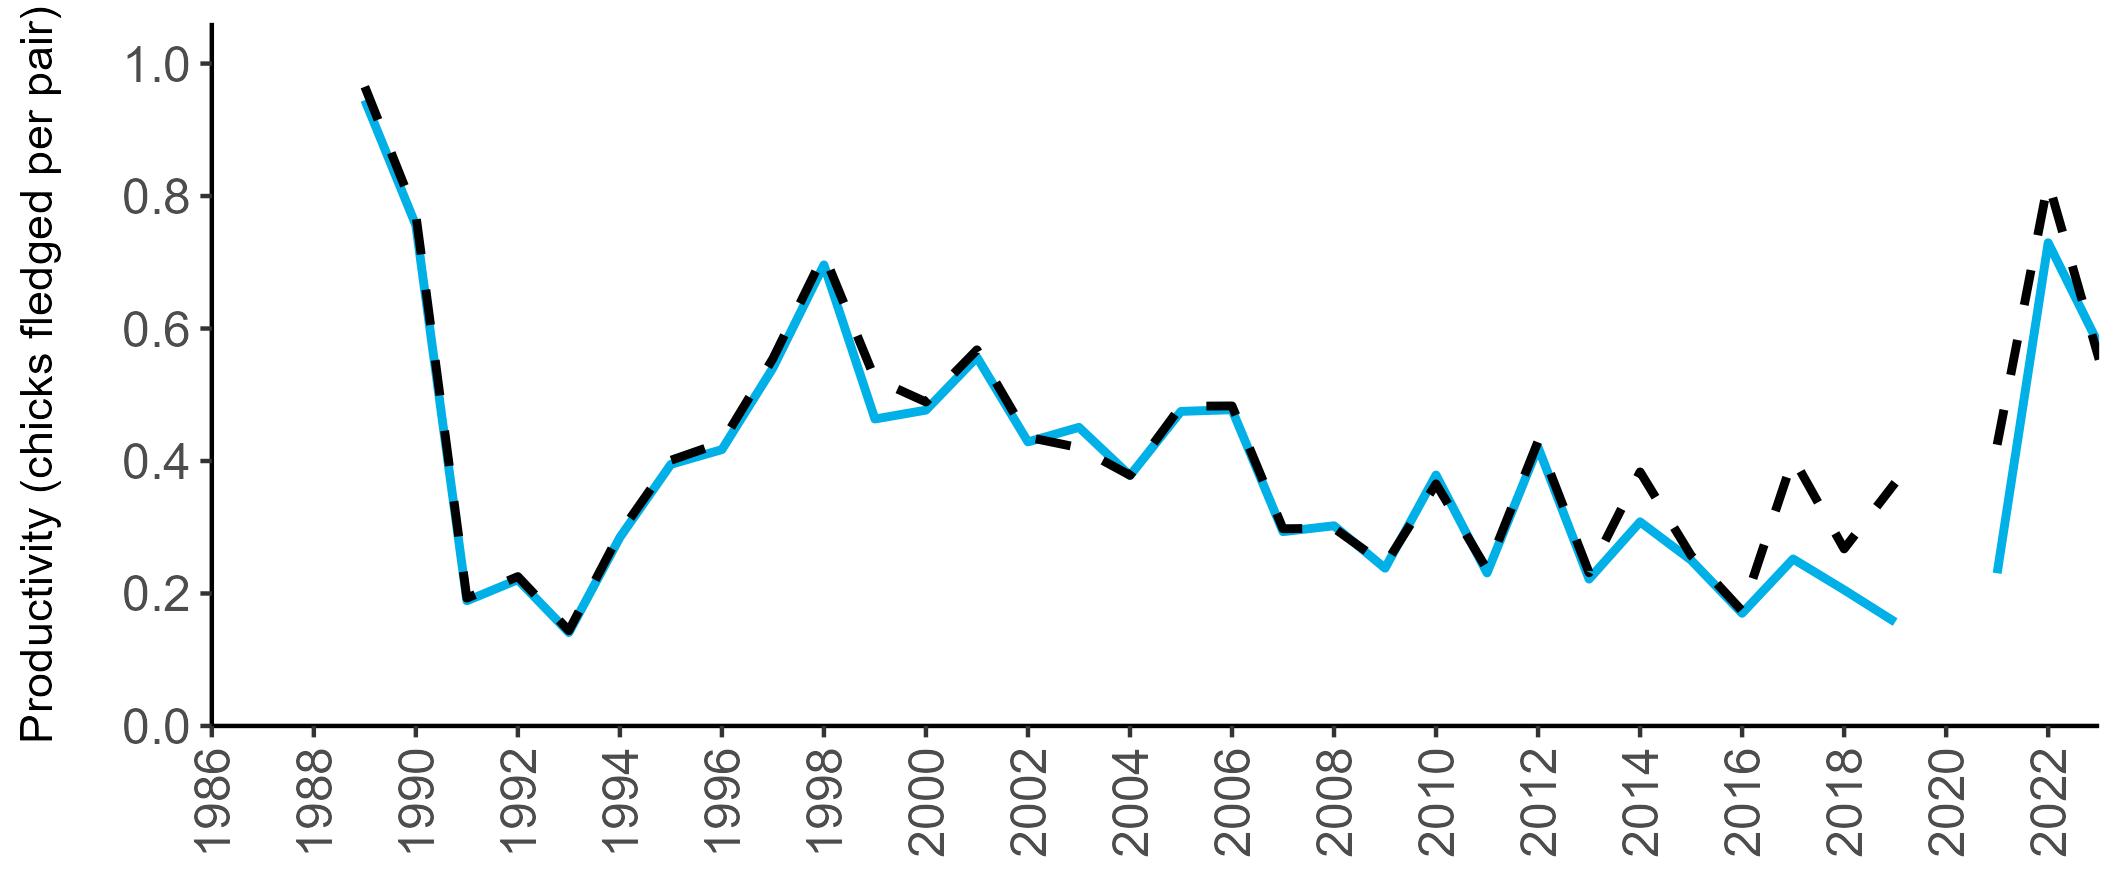
Larus fuscus
c.87%
ssp. graellsii
Amber-listed
Amber-listed (I)

Least concern
Abundance: Decline
Productivity: 0.48
Colony Count sites: 115
Breeding Success sites: 13
Lifespan: 15 years
Breeding age: 4 years
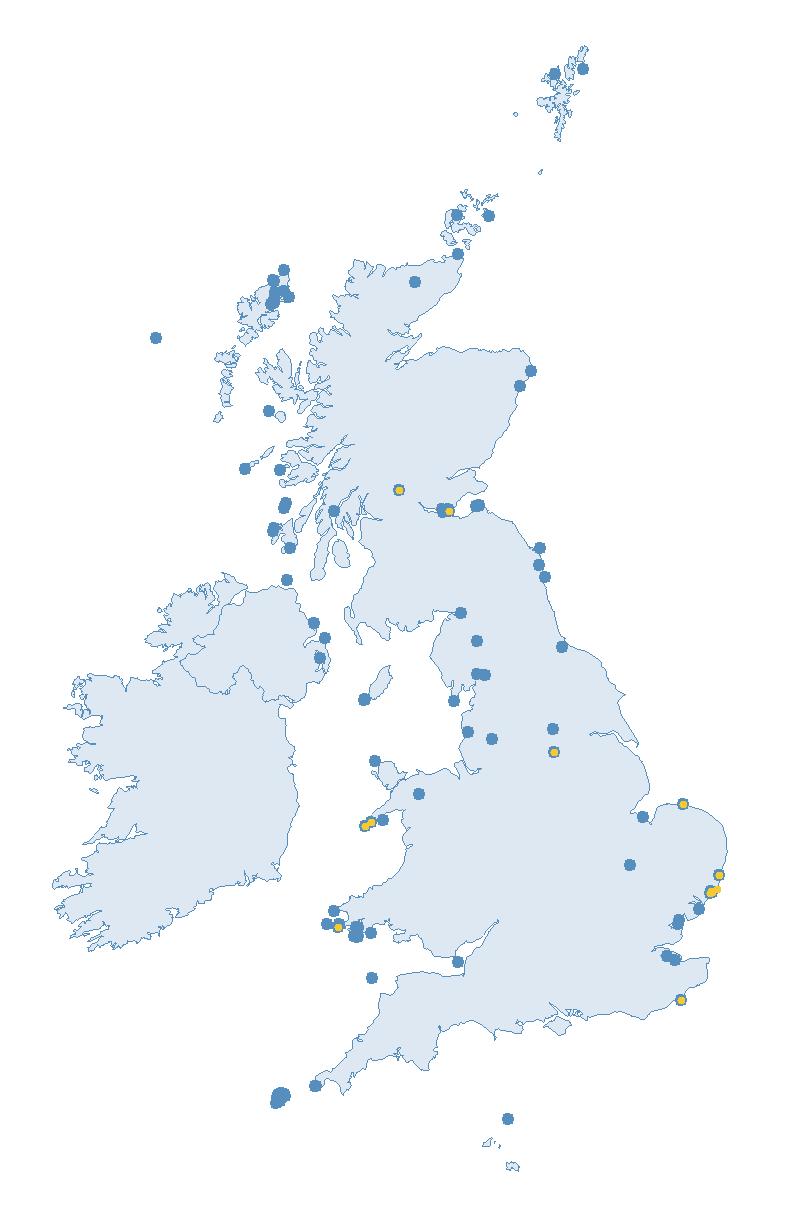
Britain and Ireland host a minimum of 36% (36—65%) of the global breeding population of Lesser Black-backed Gull and approximately 87% of the subspecies graellsii (Burnell et al. 2023). Globally, their population has increased and their tendency to migrate has decreased, making them a more common sight year-round in Britain and Ireland (JNCC 2021).
Breeding Lesser Black-backed Gulls are widespread throughout Britain and Ireland, and have shown a pronounced increase in urban areas in recent years (Burnell et al. 2023).
Globally, Lesser Black-backed Gulls are found in north and west Europe and across much of the northern Palearctic (BirdLife International 2024). During the 20th century, their global populations increased and their tendency to migrate has decreased, so that they can now typically be seen throughout the year in much of their breeding range (BirdLife International 2024).
Part of the breeding population within Britain and Ireland is still migratory, heading towards the coasts of southern Spain, Portugal and northern and western Africa, pausing at many stopovers en route (del Hoyo et al. 1996; Klaassen et al. 2012; Olsen & Larsson 2003; Wernham et al. 2002).
Lesser Black-backed Gulls are omnivorous, opportunistic feeders,
consuming a wide range of natural prey depending on availability within their foraging area, which can include fish, invertebrates, bird eggs and nestlings, carrion, berries and grains. They will also take advantage of refuse tips and fishery discards where available (del Hoyo et al. 1996; Langley et al. 2022; Olsen & Larsson 2003).
Lesser Black-backed Gulls breed across a variety of coastal and inland habitats, such as cliffs, lakes, moorlands, islands and saltmarshes, and will also nest on artificial structures, such as the roofs of buildings (Raven & Coulson 1997).
Locations which are inaccessible to ground predators or where predators are scarce are particularly attractive (JNCC 2021; Rock 2005).
They lay an average of three eggs in a nest which can be a simple lined scrape or constructed from a range of vegetation types (BirdLife International 2015). Lesser Blackbacked Gulls often nest in mixedspecies colonies, frequently with Herring Gulls, although the two
species have different foraging and nesting strategies, with Lesser Blackbacked Gulls tending to forage over larger distances and preferring more vegetated areas to nest (Kim & Monaghan 2006; Calladine 1997; JNCC 2021).
SMP abundance trends for Lesser Black-backed Gulls are currently only produced for natural nesters (defined as breeding on moors, cliffs, marshes, beaches and other areas of natural or semi-natural habitat) due to the difficulties and uncertainties inherent in monitoring urban nesters (SMP defines this as breeding on human-built structures). Therefore, these trends may not reflect the overall trend of the UK population.
The SMP abundance trends for natural-nesting Lesser Black-backed Gulls in all regions where trend values could be produced have decreased markedly since 2000 (Table 24). Seabirds Count census results for natural-nesting birds also showed declines in these regions, but the magnitude of the decline was less
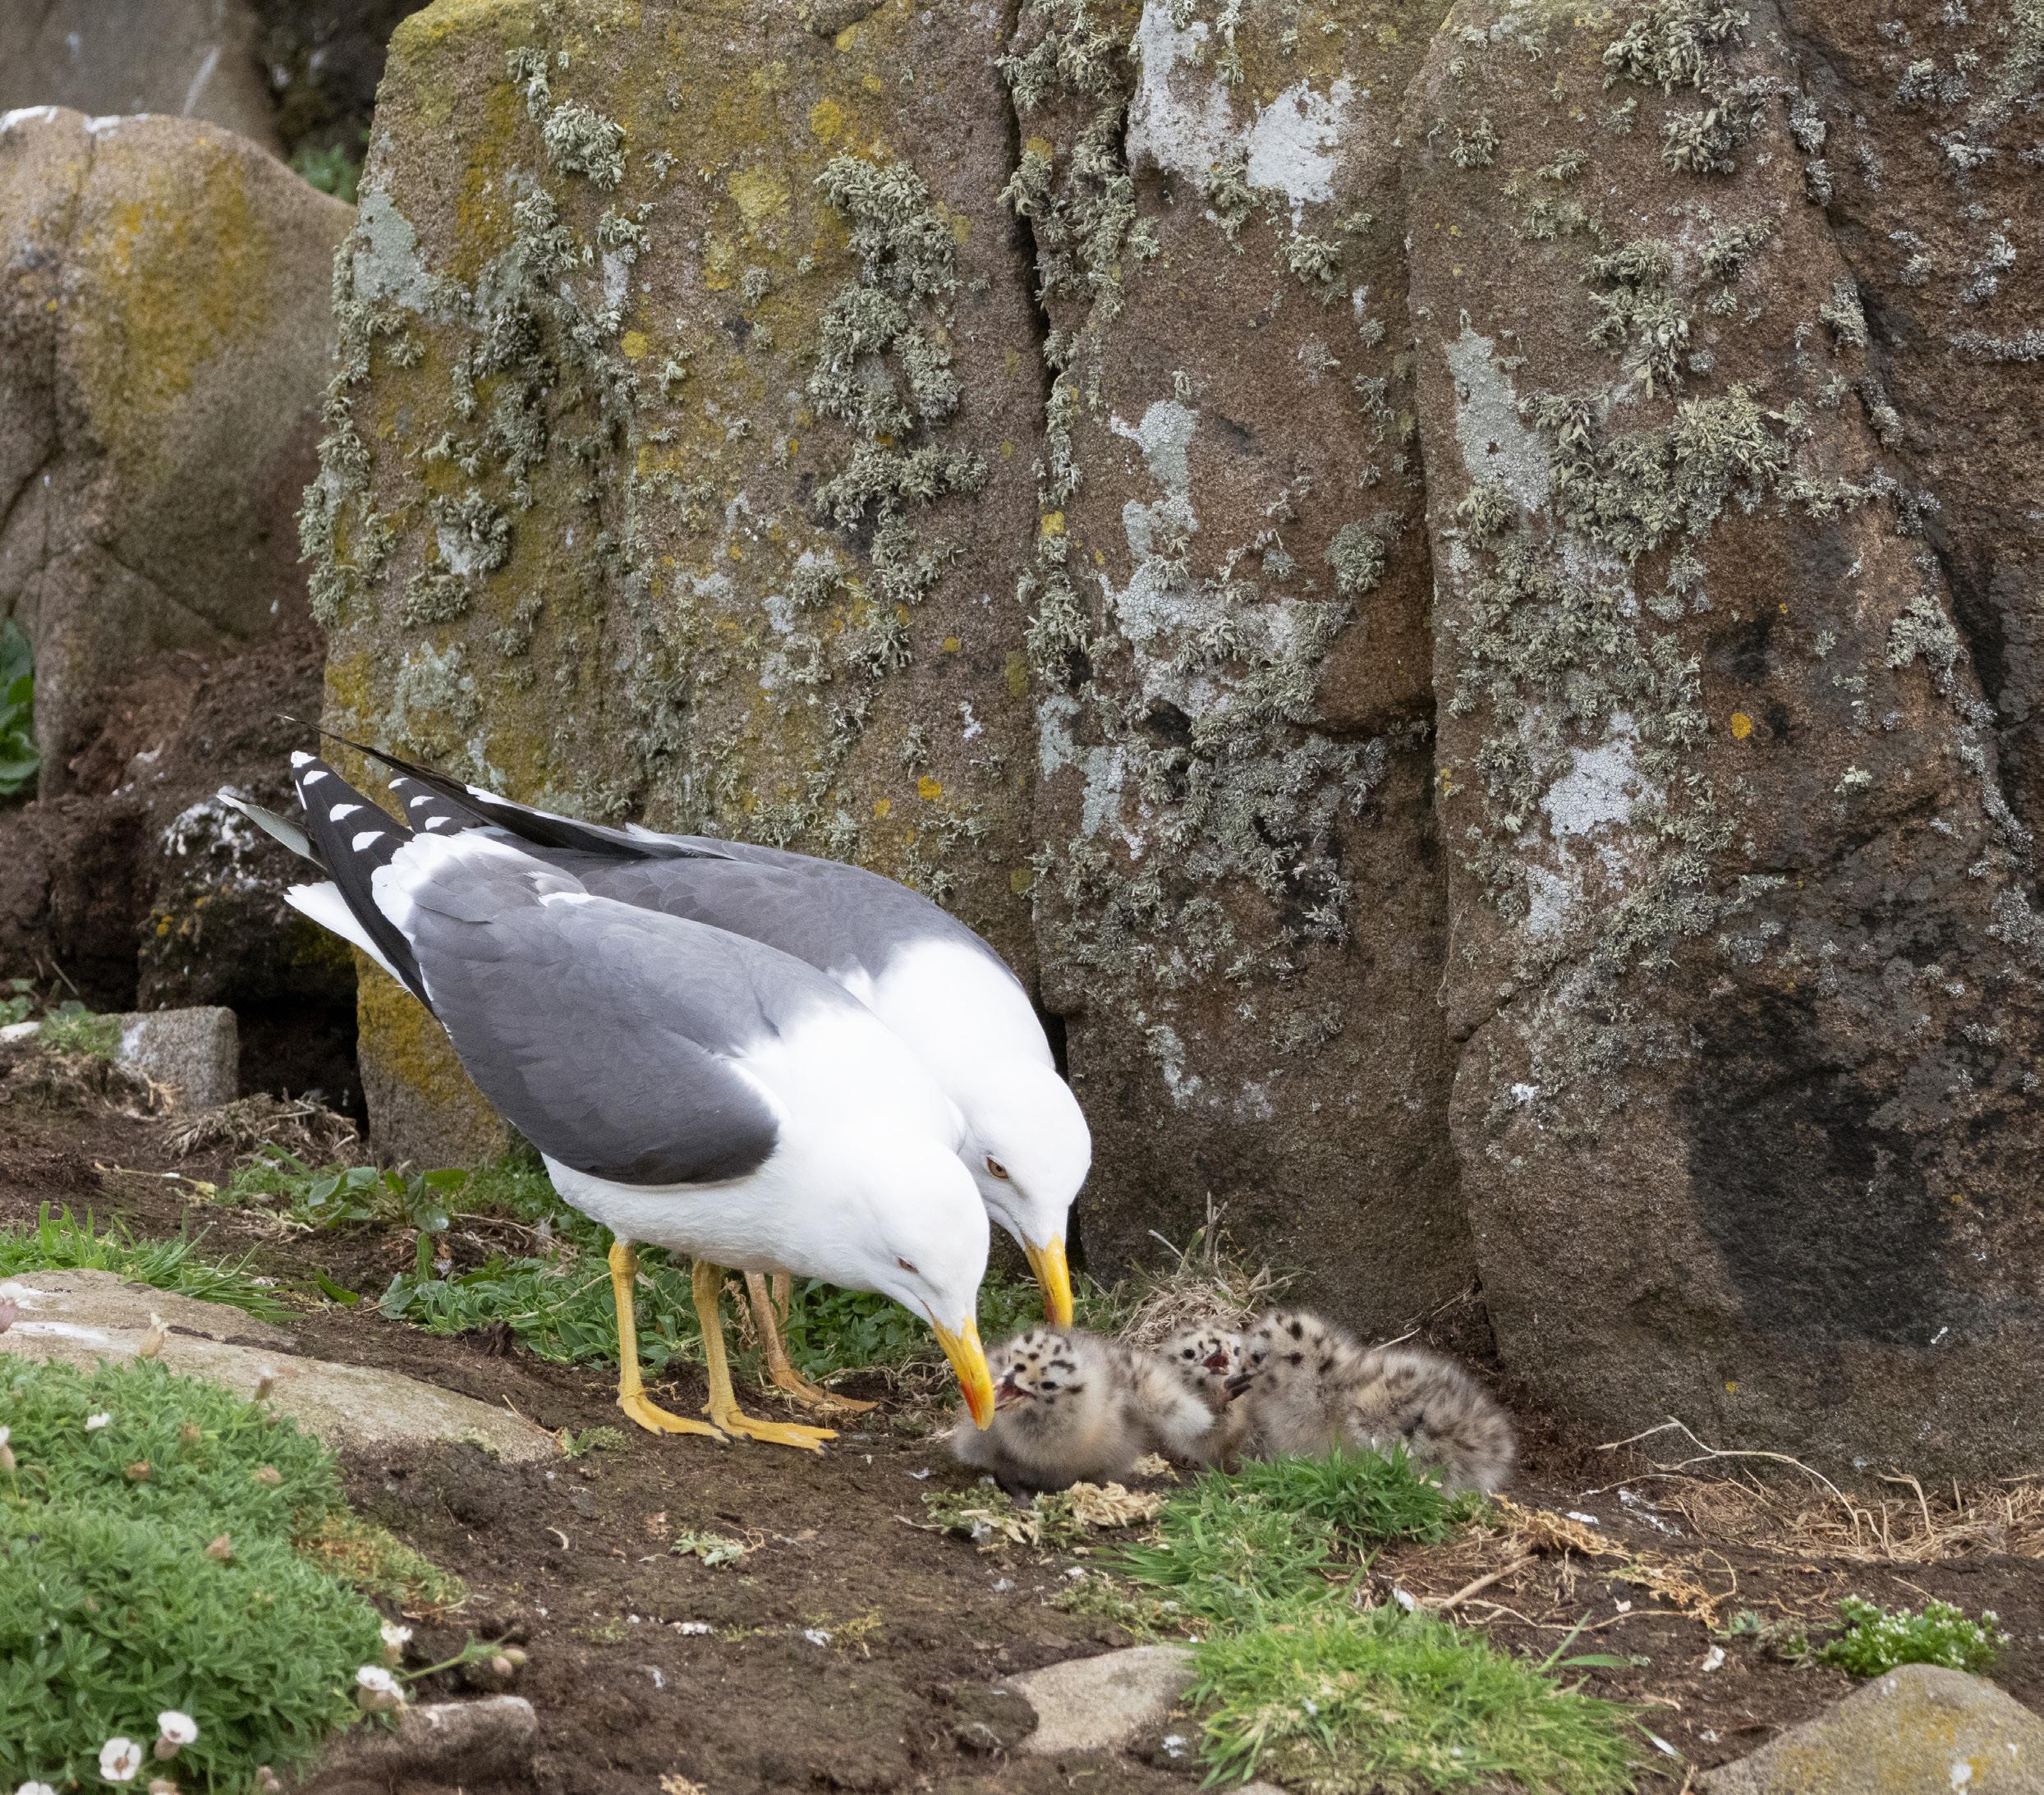
NATURAL NESTERS
Abundance (AON) Seabird 2000 (1998—02) Abundance (AON) Seabirds
(2015—21)
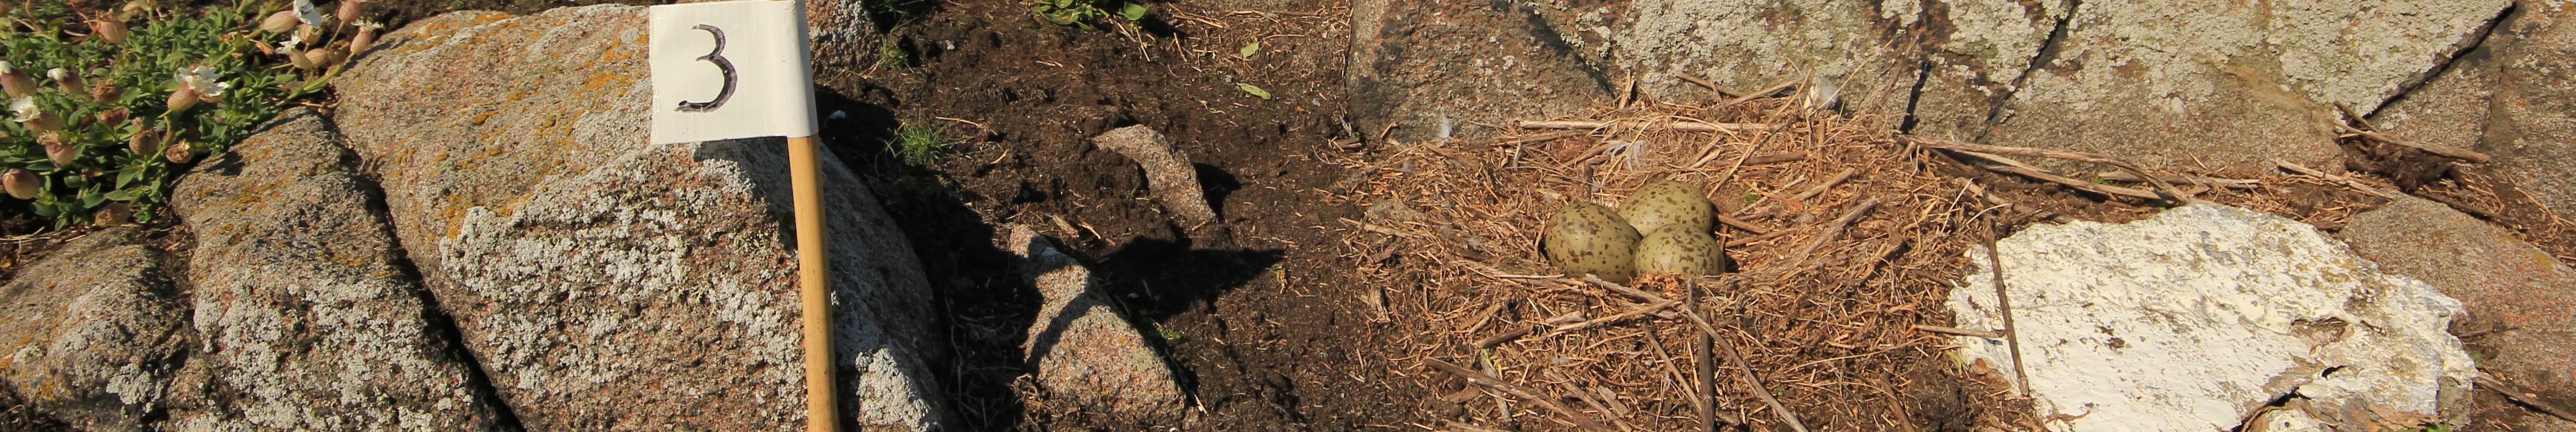
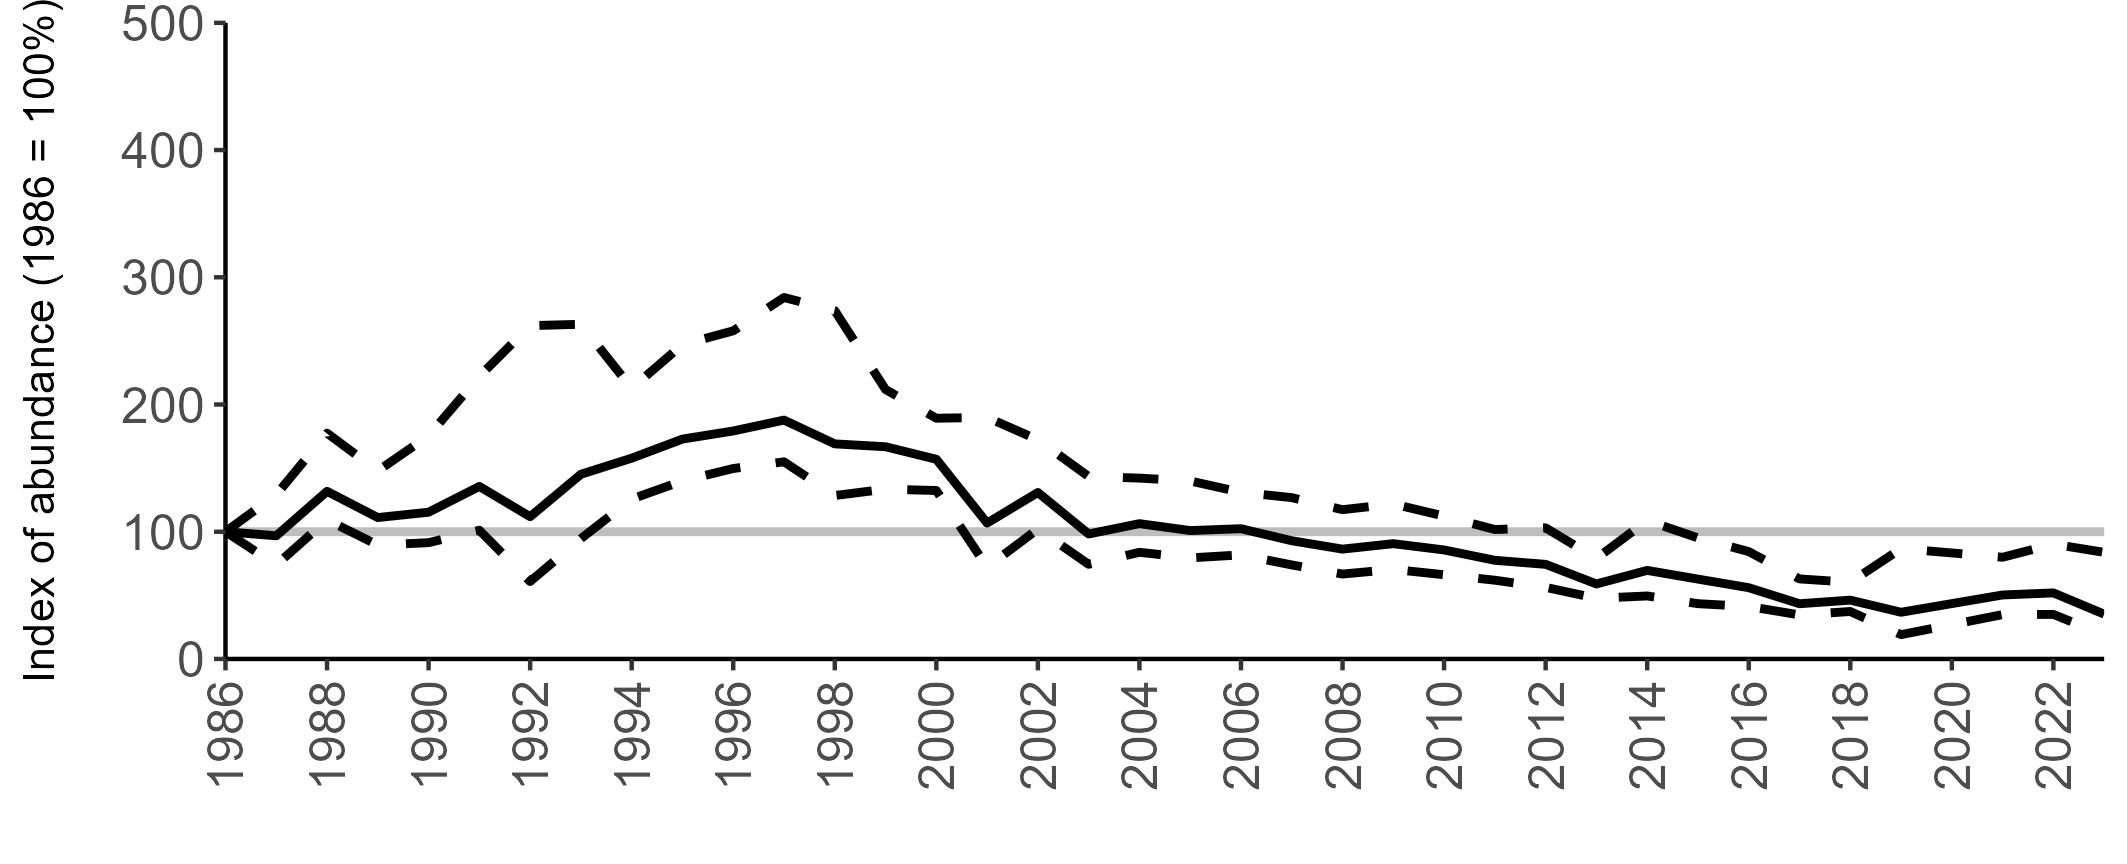
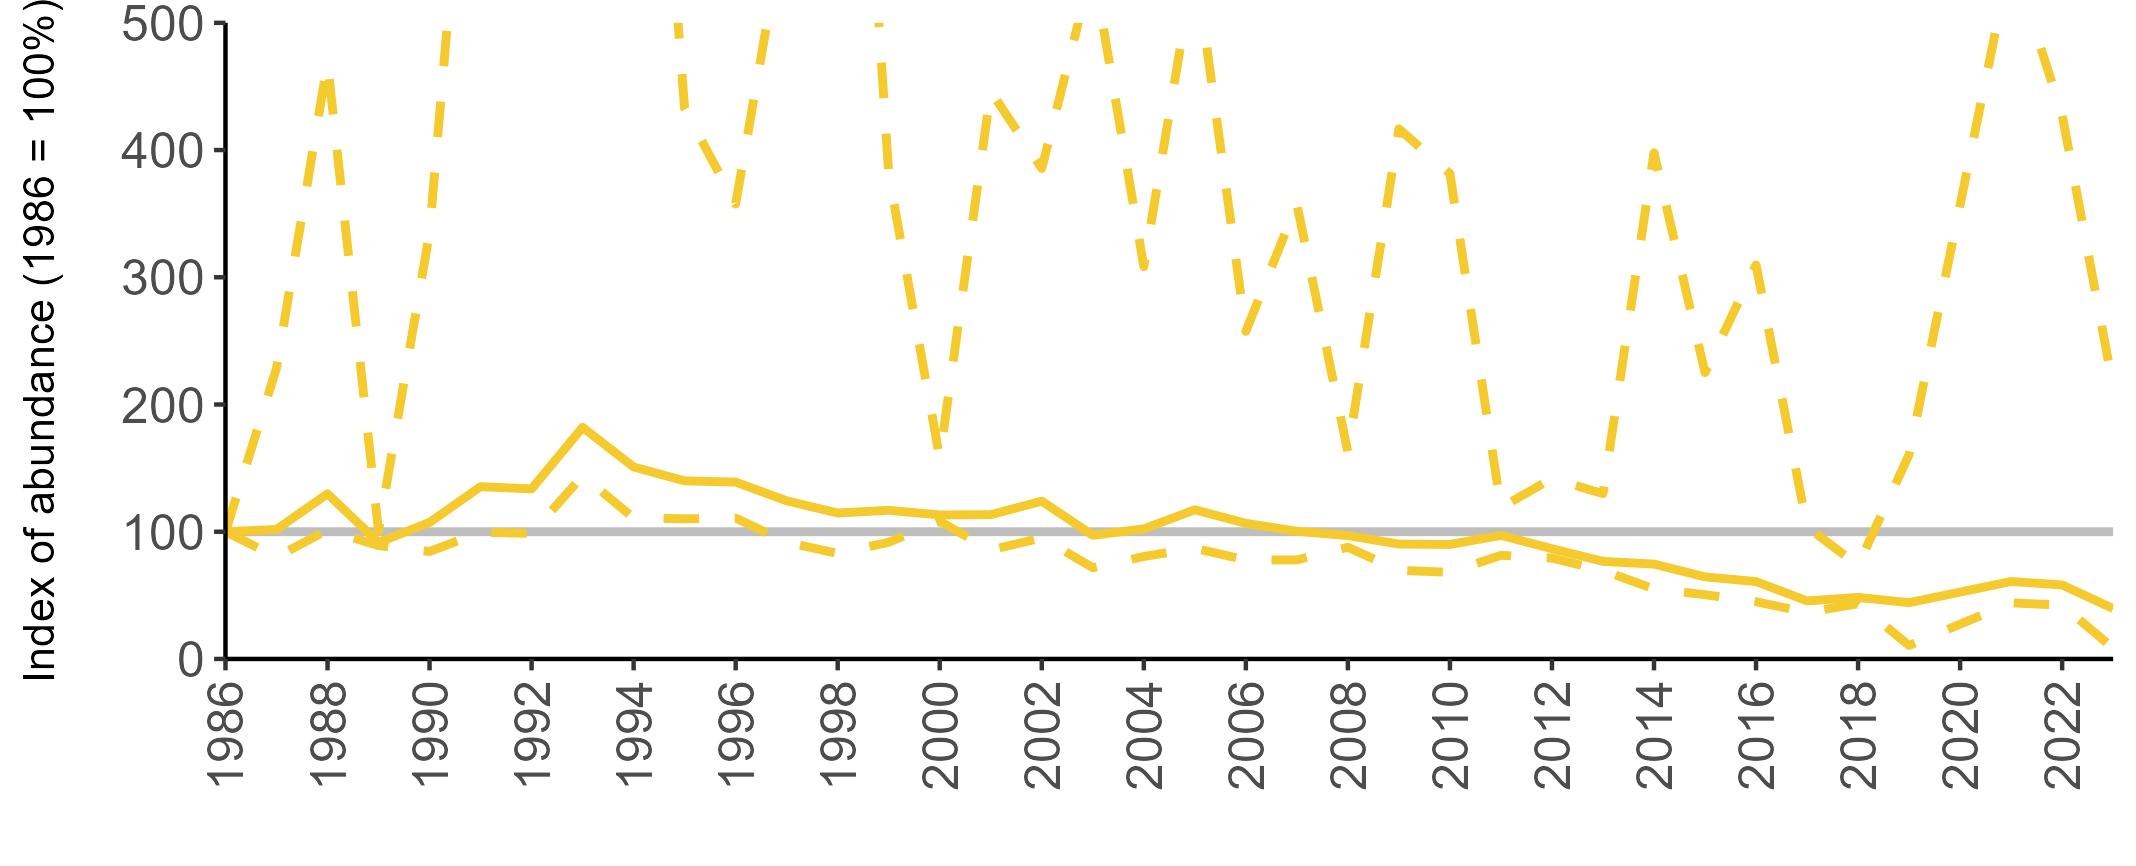
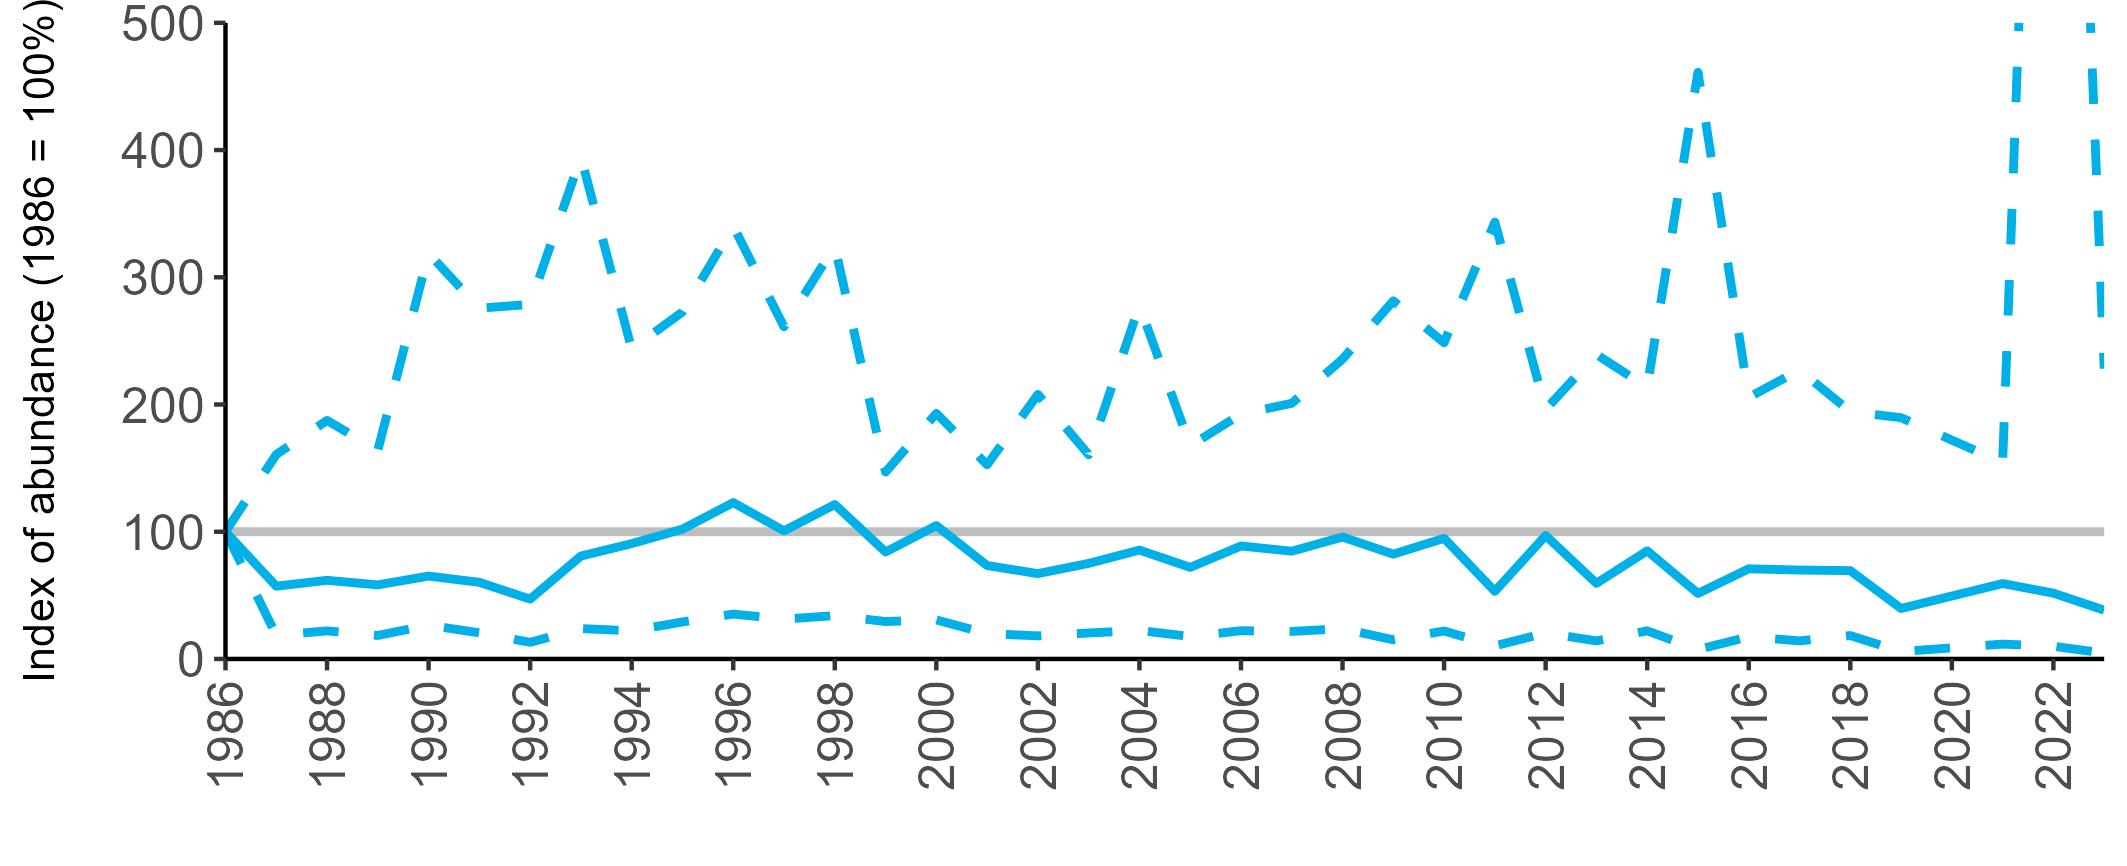
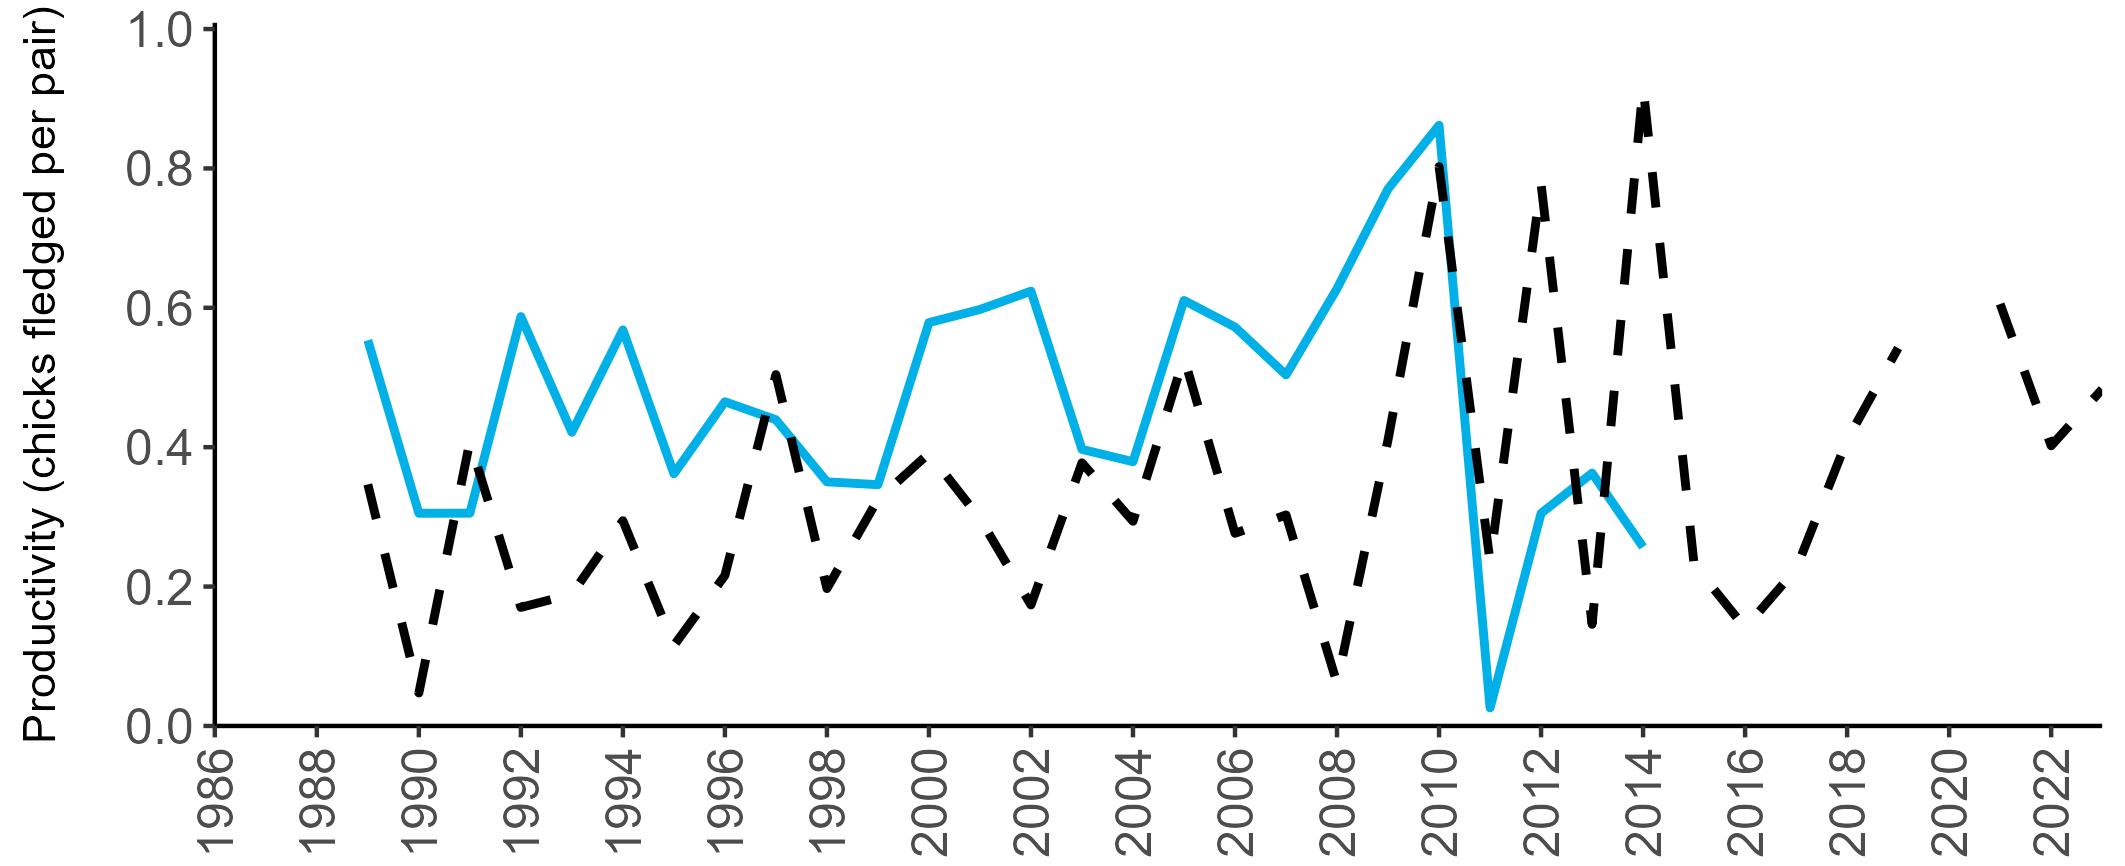
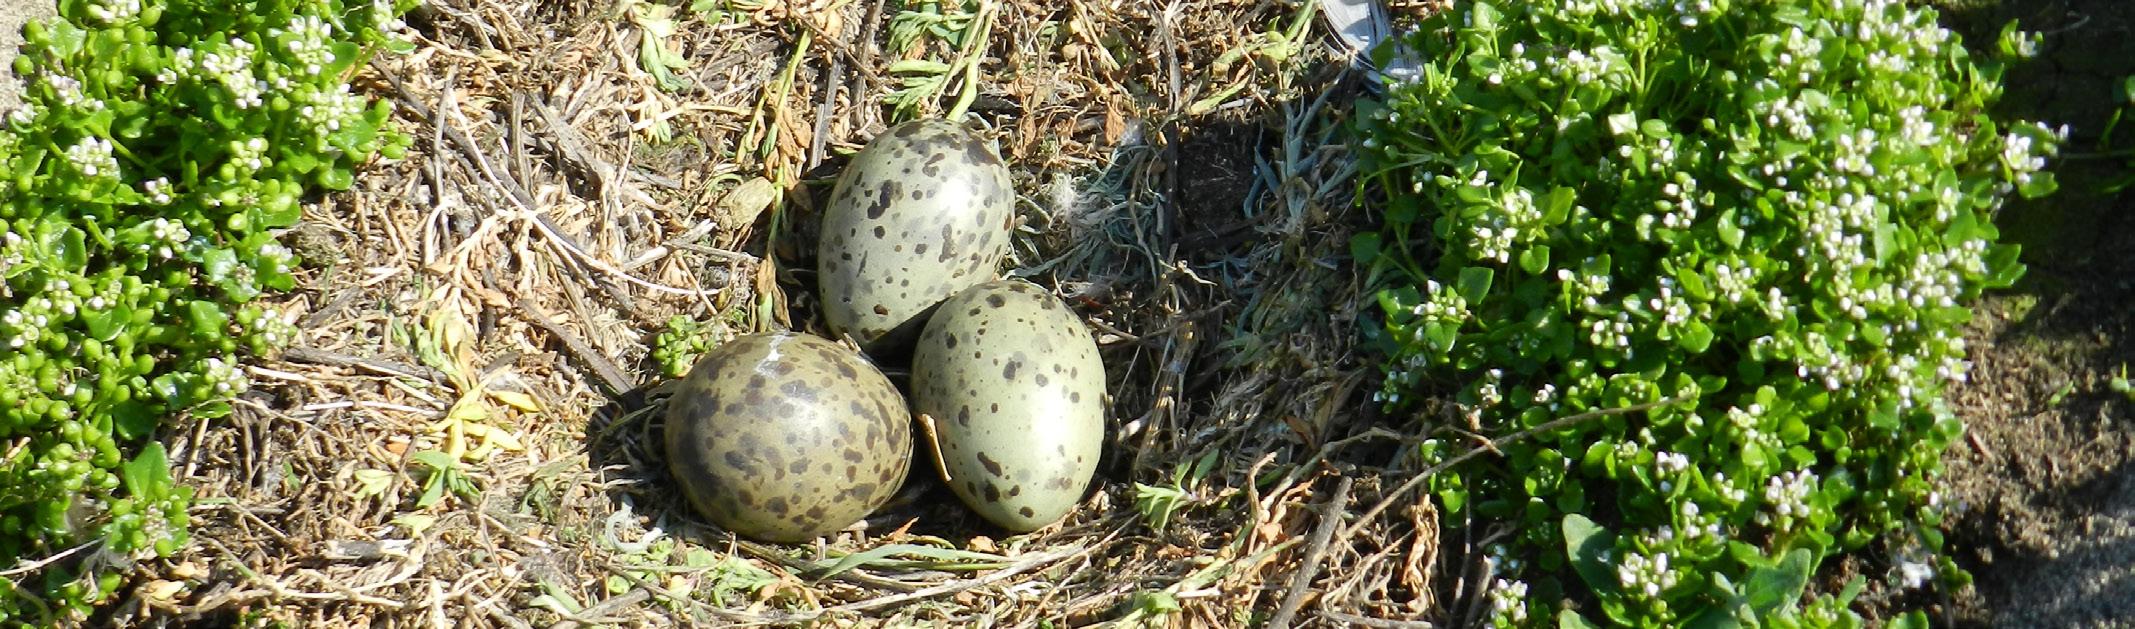
(Burnell et al. 2023). At the UK level, a decline of 78% was recorded by the SMP between 2000 and 2023, whilst the Seabirds Count census showed a decrease of 49% since the Seabird 2000 census (Burnell et al. 2023). For Scotland and Wales, the SMP trends showed similar declines of 63% and 65%, respectively, since 2000 (Table 24), whilst the Seabirds Count census reported less severe declines of 48% and 45% since Seabird 2000 for Scotland and Wales, respectively (Burnell et al. 2023).
Although there is variation between regions in the long-term abundance trends for natural-nesting Lesser Black-backed Gulls over the whole SMP monitoring period, especially during the early years, there has been a fairly consistent decline in the index trend for the UK, Scotland and Wales since the late 1990s (Figures 27–29).
In 2023, the UK index value was 65% below the 1986 baseline, with the values for Scotland and Wales being similar, at 62% and 60% below the baseline, respectively (Table 24). It should be noted for Scotland and Wales that the confidence limits are wide over much of the recording period, therefore these indices should be used with caution.
Too few data are submitted to the SMP on abundance in -all other regions to allow for calculation of meaningful abundance trends.
The productivity trends for naturalnesting Lesser Black-backed Gulls have fluctuated widely over the SMP recording period for both the UK and Scotland, particularly in recent years (Figure 30). Overall, the UK trend has shown a general increase since recording began, and the mean
productivity estimate was 0.48 chicks fledged per pair in 2023 (Table 24). Mean productivity estimates for Scotland are typically higher than those in the UK, and show a slight increasing trend up to 2010. No productivity data have been submitted for Scotland since 2014.
Too few data are submitted to the SMP on productivity of Lesser Black-backed Gulls in other regions to calculate any meaningful average productivity values.
No systematic data on phenology or diet have been collected as part of the SMP. However, adult survival rates of Lesser Black-backed Gull are estimated annually on the Key Site of Skomer Island (Wales) and are published in the Key Site reports for the island.
Natural-nesting Lesser Blackbacked Gulls are facing a wide range of potential pressures, including diseases such as HPAI and botulism (Macdonald & Standring 1978; Tremlett et al. 2024), predation from mammals such as Red Foxes (Vulpes vulpes), American Mink (Neovison vison) and European Badgers (Meles meles) (Davis et al. 2018), loss of nesting habitat through vegetation changes or rising sea levels (Lock et al. 2022; Ross-Smith et al. 2015) and emigration to urban areas (Rock 2005).
The legal changes which have reduced the amount of discards from fisheries are likely to be restricting Lesser Black-backed Gull food supplies (Bicknell et al. 2013; Furness, et al. 1992; Oro 1996; Ross-Smith et al. 2014). If this reduces parental body condition, this has been shown to
negatively influence chick fledging rates (Nager et al. 2000).
Where offshore wind farms are sited within the foraging range of Lesser Black-backed Gulls, there is the potential for collision risk, especially during the breeding season and at some migratory bottlenecks, although studies have shown a degree of avoidance of individual turbines within wind farms (Thaxter et al. 2018; 2019).
Chemical pollution can also be an issue, and it has been demonstrated that organic chemical uptake, including increased levels of polychlorinated biphenyls (PCBs) and dichlorodiphenyldichloroethylene (DDE), can increase chick mortality (Burger et al. 2018; Bustnes 2006; Hario et al. 2000).
Reducing predation levels of Lesser Black-backed Gulls through predator control and the use of predator fences is likely to be beneficial to local populations of this species, alongside appropriate habitat management (Dalrymple 2023). Indeed, the removal of American Mink from islands has been shown to lead to higher gull breeding success rates (Hunt & Heffernan 2007).
In recent years, the removal of Lesser Black-backed Gull from the General Licence scheme throughout the UK and the cessation of mass culling will hopefully have been beneficial for the species. In the future, it should be possible to assess the sustainability of control measures carried out under individual licences to better protect local and regional populations. (Burnell et al. 2023).
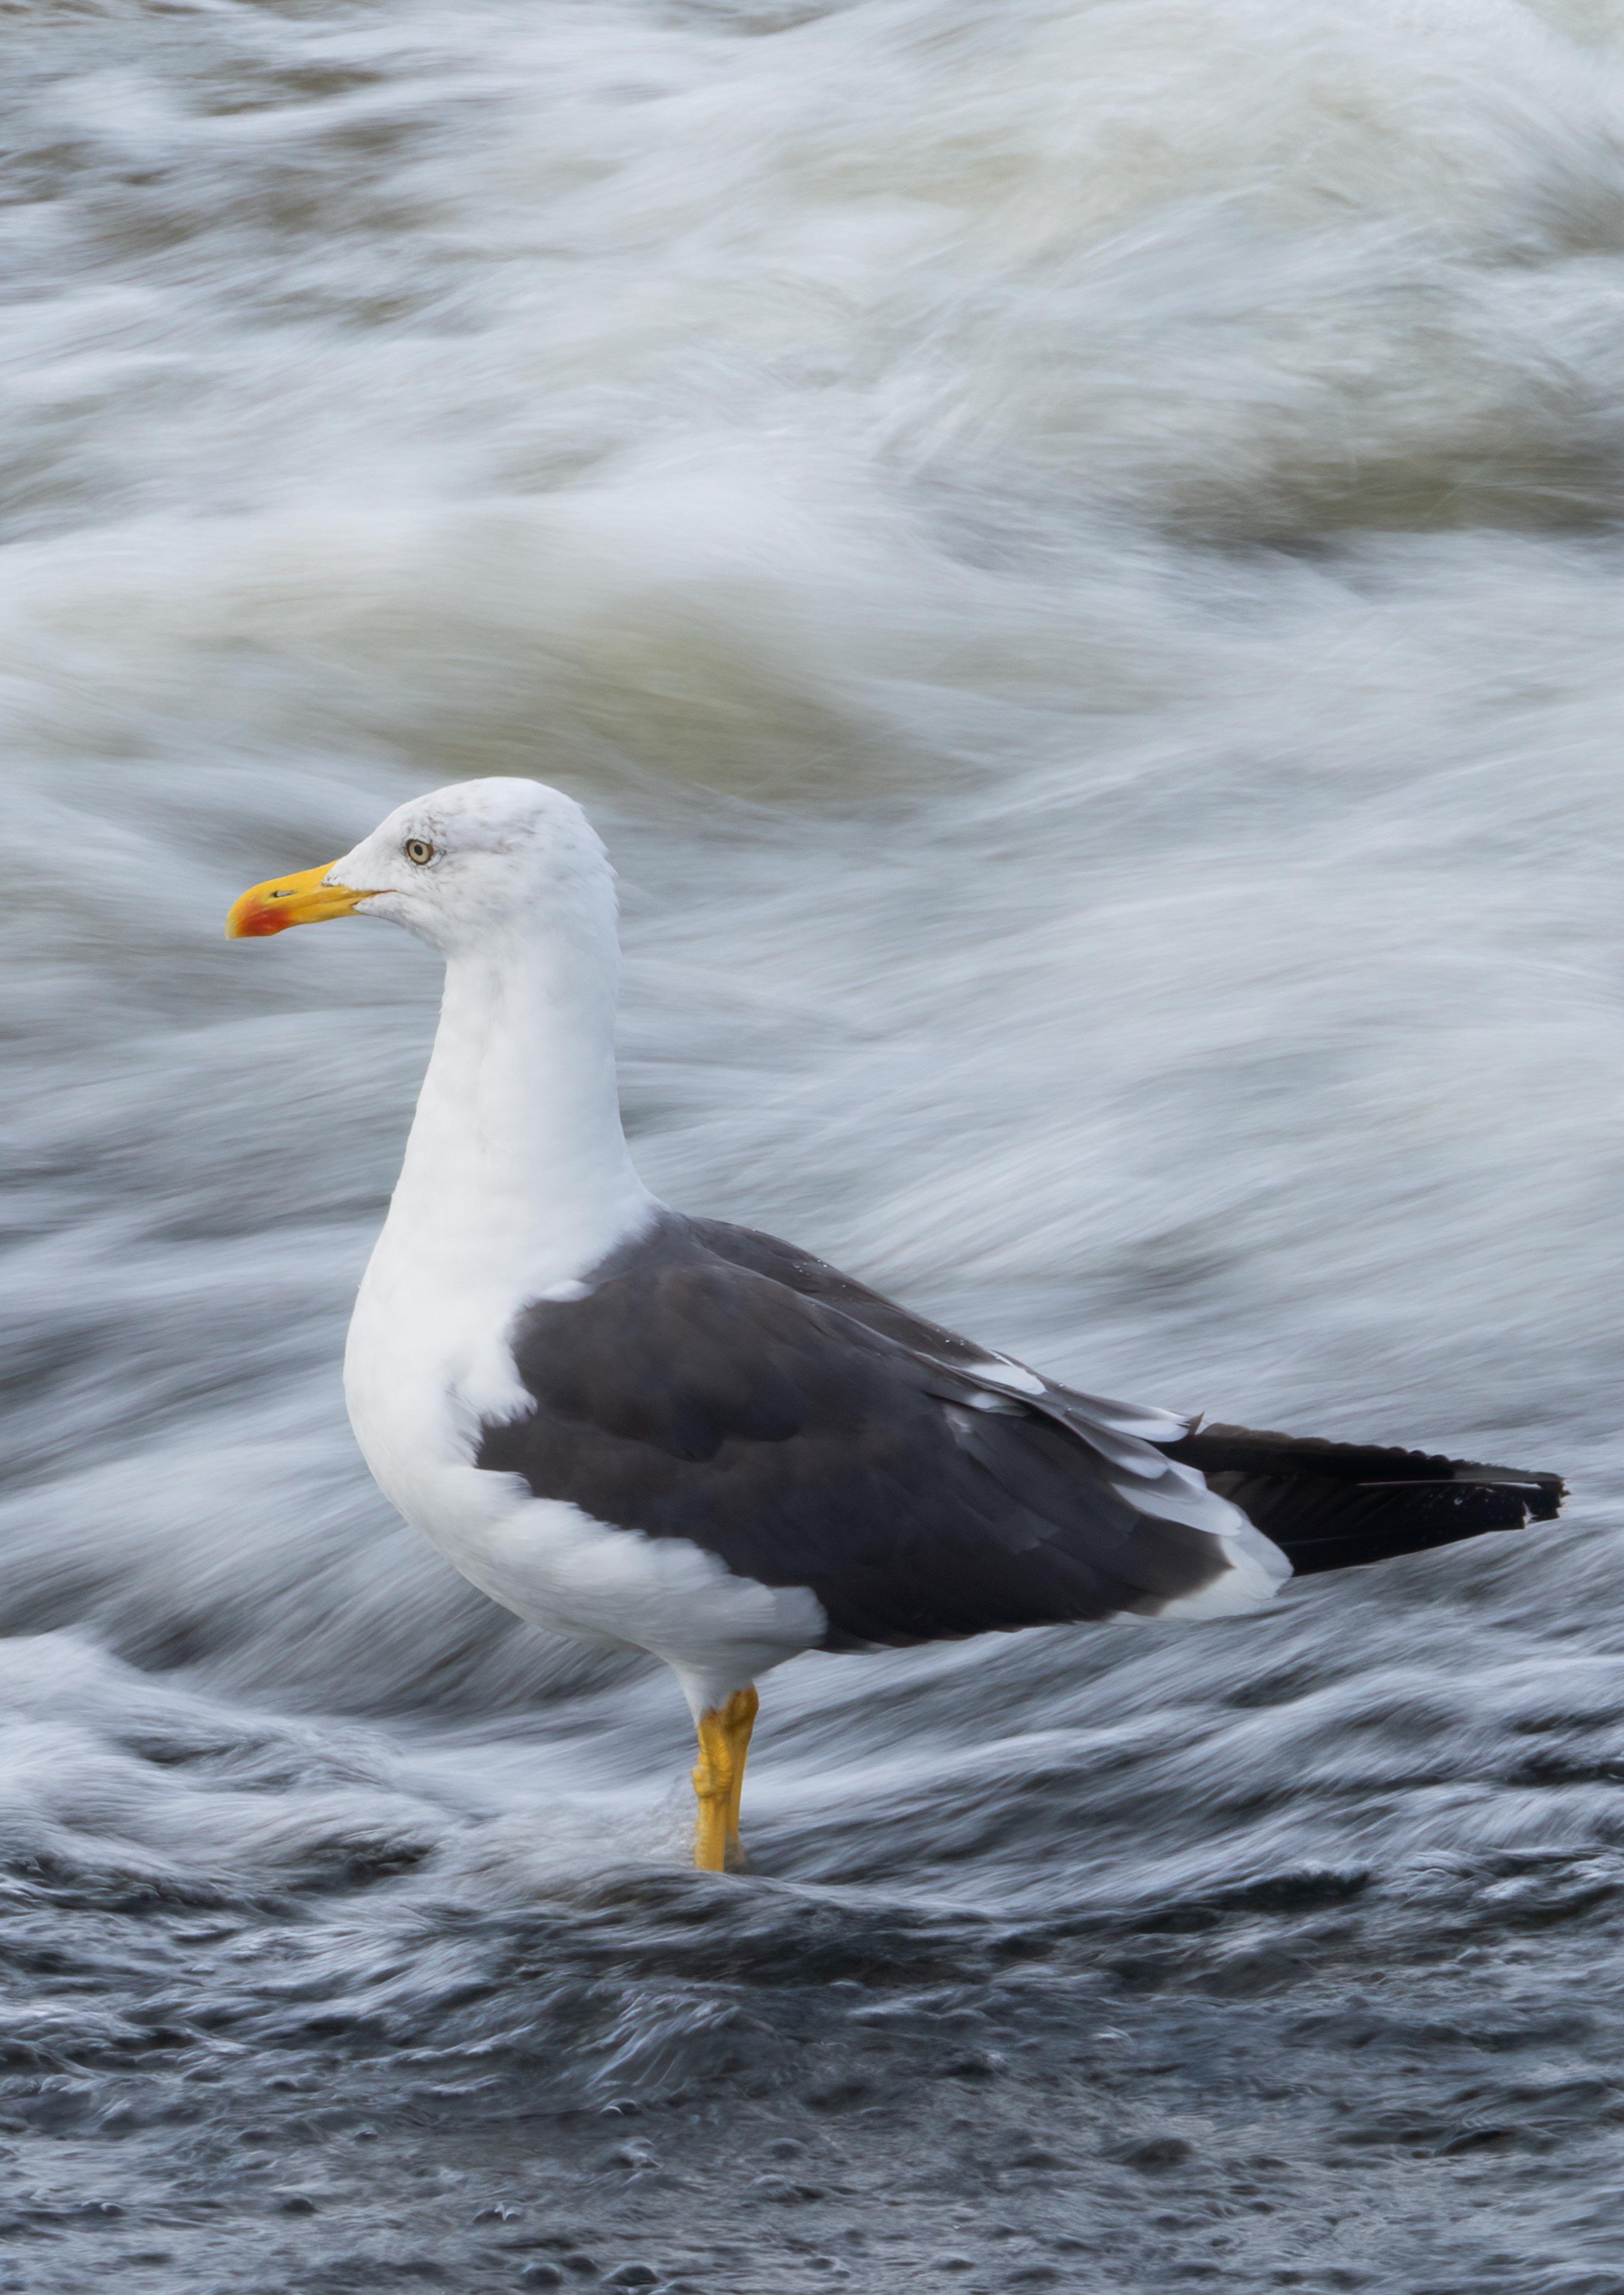
c.70%
ssp. argenteus
Red-listed Amber-listed (I)
Abundance: Decline
Productivity: 0.50
Colony Count sites: 264
Breeding Success sites: 14
Lifespan: 12 years
Breeding age: 4 years
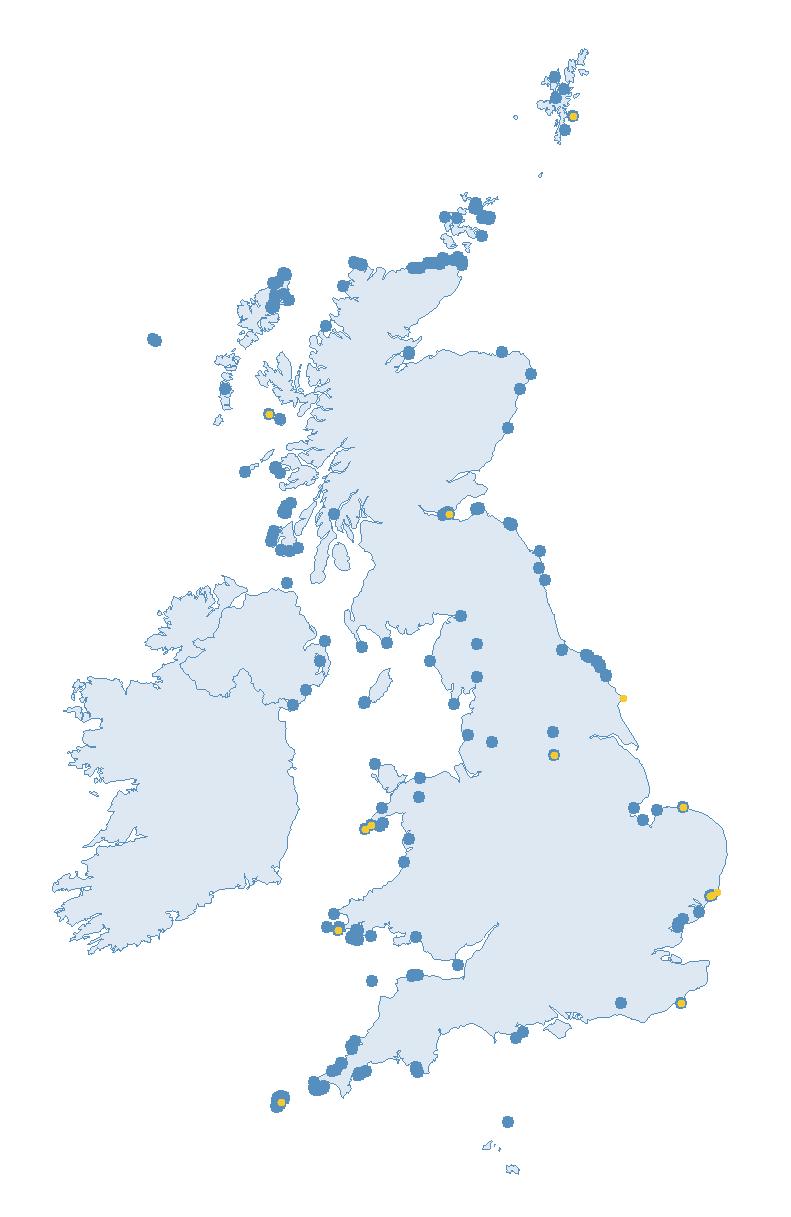
Britain and Ireland host approximately 44% of the world’s breeding Herring Gulls and around 70% of the subspecies argenteus (Burnell et al. 2023). There are two subspecies of Herring Gull, argenteus in the west of their global range and argentatus in the east (Keller et al. 2020).
Breeding Herring Gulls are widespread across Britain and Ireland. They typically nest in coastal areas, but are increasing in both inland and urban sites (JNCC 2021; Rock 2005).
In a global context, Herring Gulls breed around northern and western Europe (BirdLife International 2024) They are migratory in the north of their range, but more southern populations (including those in Britain and Ireland) are nomadic or non-migratory (Flint et al. 1984).
Herring Gulls are opportunistic feeders, with natural food sources including fish, marine invertebrates, crustaceans, birds and eggs, but they will also feed on fishery discards and at refuse tips (Bicknell et al. 2013; del Hoyo et al. 1996; Furness et al. 1992; Hüppop and Wurm 2000).
Although Herring Gulls are opportunistic in terms of diet, individuals that breed in natural-nesting sites on the coast predominantly forage in natural habitats, including mussel beds and the
intertidal zone. However, some urban nesting individuals will still forage at sea and those on the coast or natural sites may still visit urban areas to forage (Booth Jones et al. 2022; Clewley et al. 2021; O'Hanlon and Nager 2018; Rock et al. 2016). Individuals targeting high energy food, e.g. human waste food items or fishery discards, tend to have higher productivity than those targeting more natural resources, although this may vary depending on the local availability of food types (van Donk et al. 2017).
Herring Gulls nest in a wide variety of both natural and artificial habitats, including cliffs, moorland, farmland, freshwater margins and rooftops (Monaghan & Coulson 1977; Madden & Newton 2004; Raven & Coulson 1997; Sellers & Shackleton 2011). A nest is built using vegetation, and one to three eggs are laid per nesting attempt (BTO 2023a).
Herring Gull abundance trends are currently only produced for natural nesters (defined as breeding on moors, cliffs, marshes, beaches and other areas
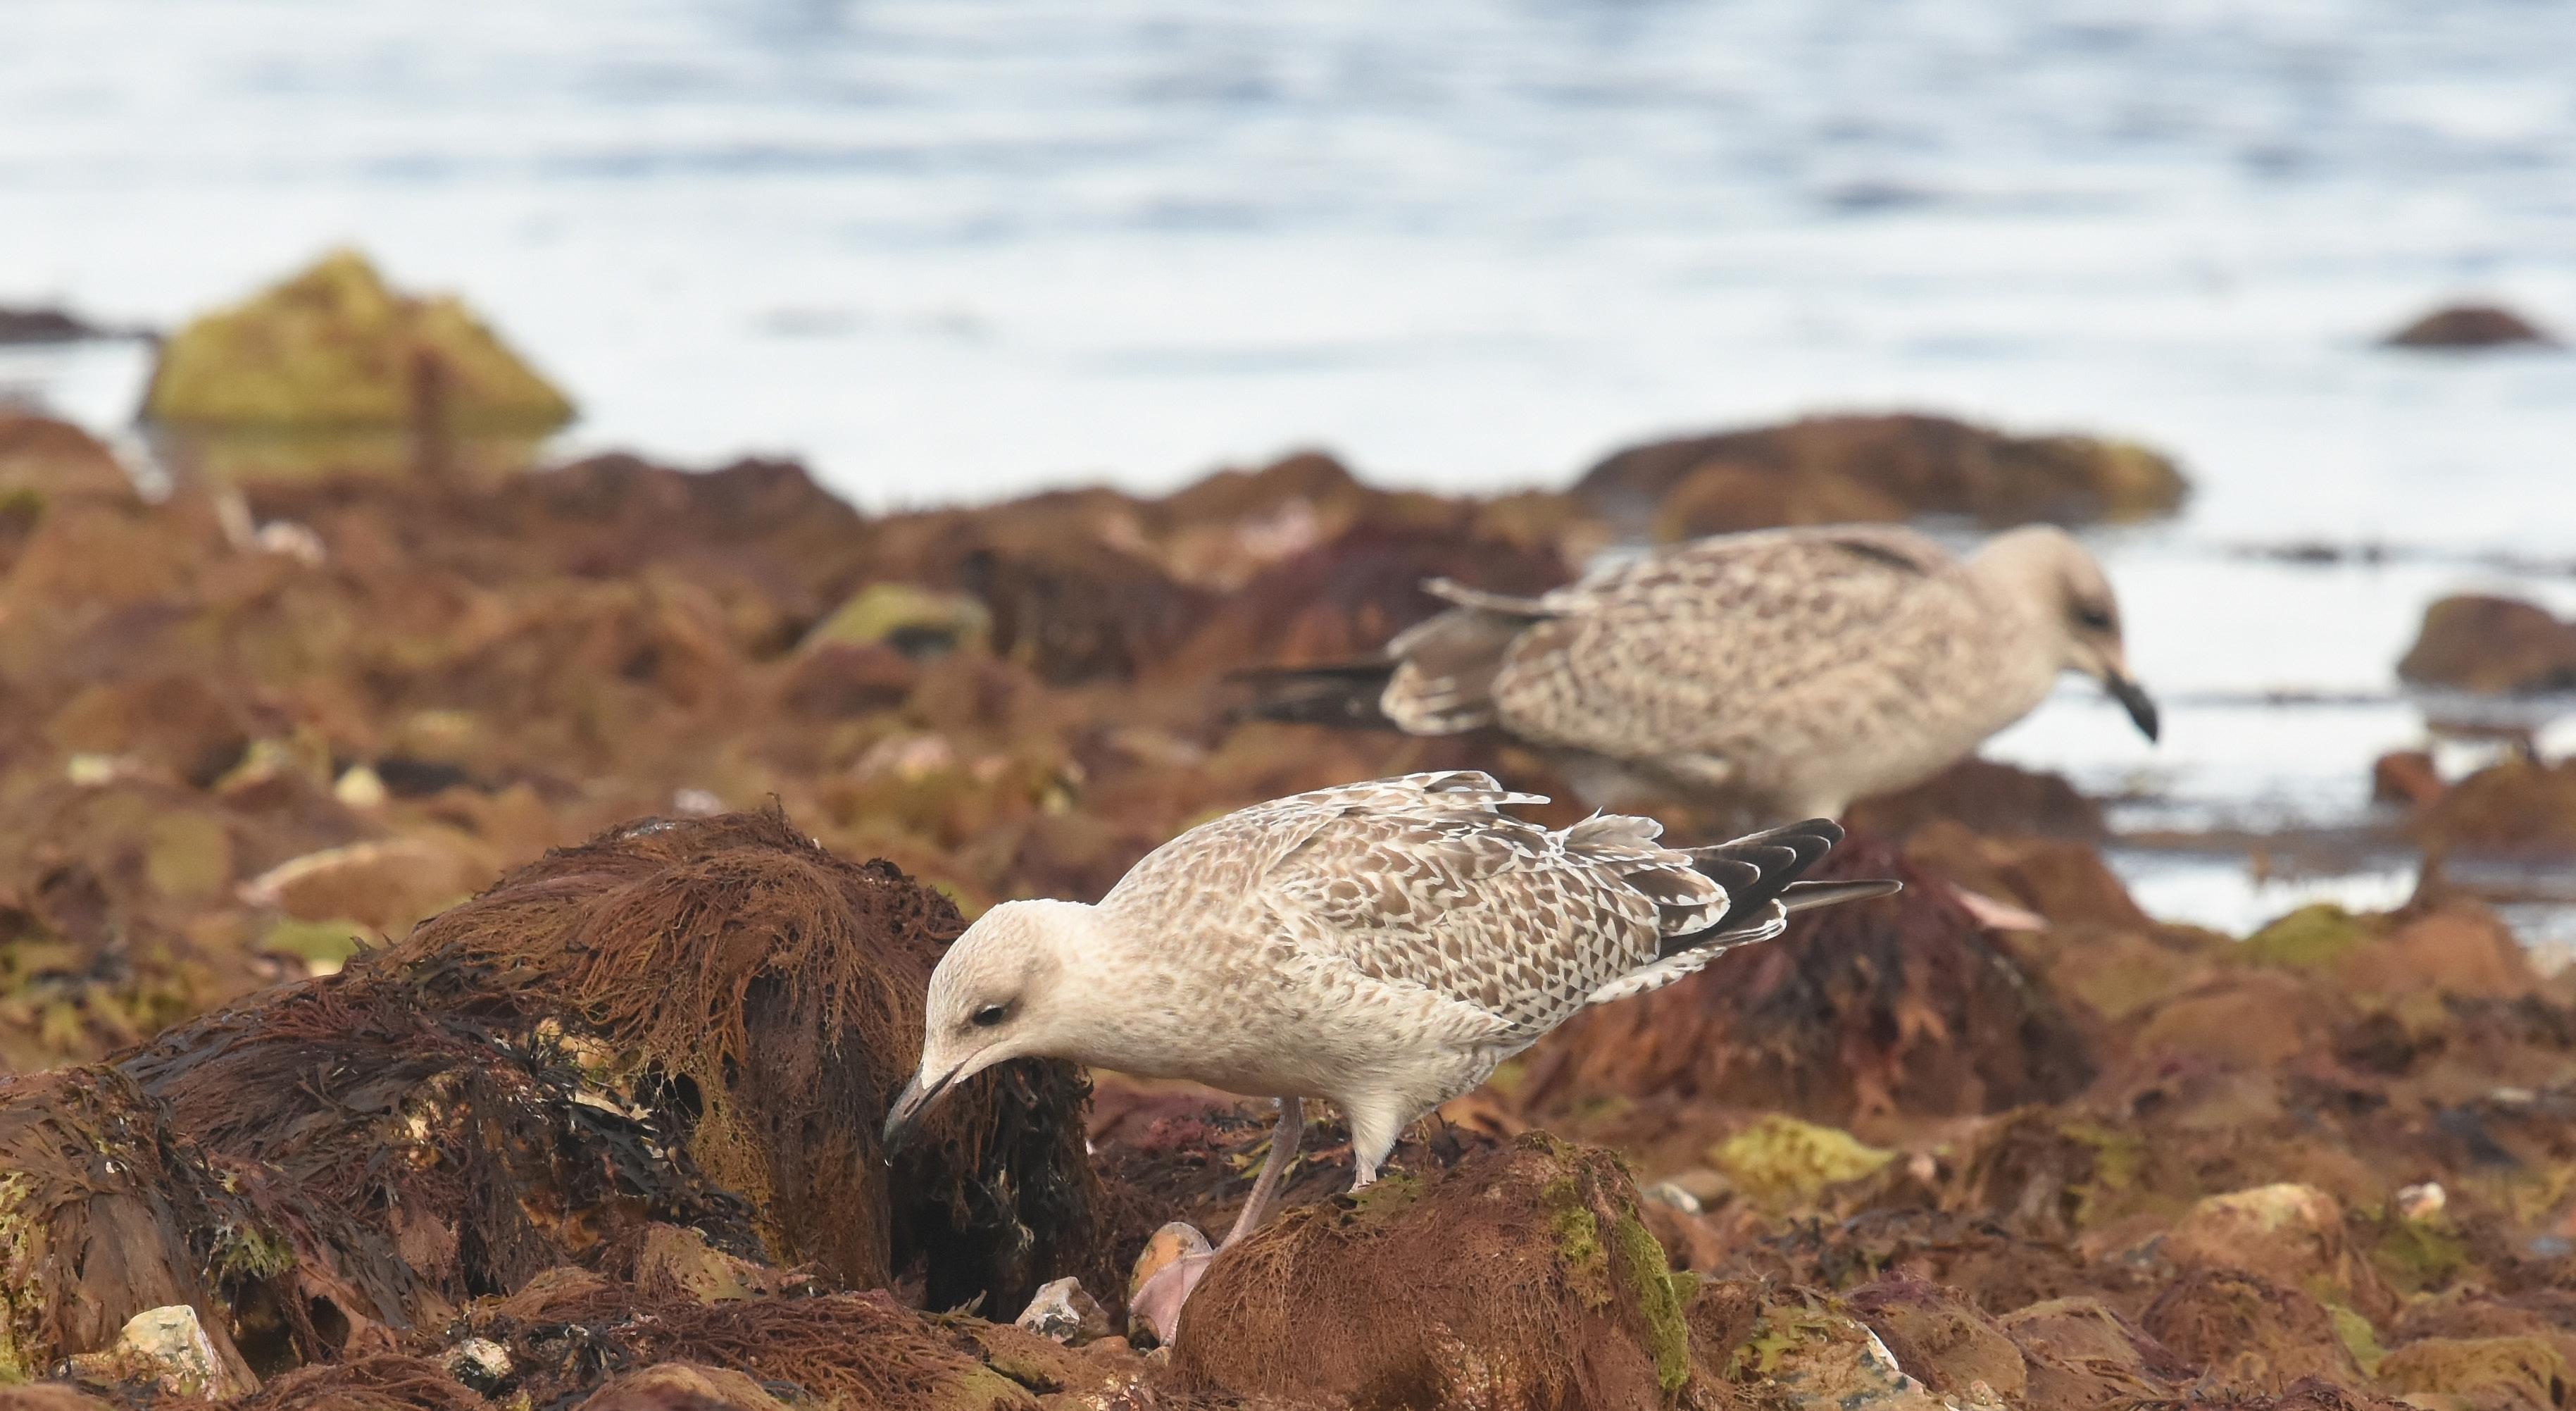
of natural or semi-natural habitat) due to the difficulties and uncertainties inherent in monitoring urban nesters (defined within the SMP as breeding on human-built structures). Therefore, these trends may not reflect the overall trend of the entire UK population.
The declines in SMP abundance trends for natural-nesting Herring Gulls since 2000 (Table 26) are in agreement with those reported by the Seabirds Count census (Burnell et al. 2023). For the UK and Scotland, similar declines of 46% and 43%, respectively, were recorded by the SMP between 2000 and 2023, whilst the Seabirds Count census showed a decrease of 44% for both regions since the Seabird 2000 census. For England the declines were greater, with the SMP 23-year trend showing a decrease of 73% since 2000, whilst the Seabirds Count census reported a decline of 60% over a similar period. The SMP trend for Wales showed a drop of 21% since 2000, similar to the decline of 23% reported by Seabirds Count since Seabird 2000 (Burnell et al. 2023).
The long-term SMP abundance trends for natural-nesting Herring Gulls have
varied between regions since recording started in 1986, with considerable fluctuations before 2000 for both the UK and England (Figures 31 & 32), but more stability in Scotland (Figure 33). Since 2000, all regions have experienced overall declines. In 2023, the index values for the UK and Scotland were at 50 and 53% below the 1986 baseline respectively, and the England index was even lower, at 77% below (Table 26). The abundance index in Wales has generally been higher than the other regions for
many years, and the index value was at 5% below the baseline in 2023 (Table 26).
Too few data are currently submitted to the SMP in other regions to allow for the calculation of meaningful abundance trends.
Over the SMP recording period, the Scotland productivity trend closely matches the UK trend until 2015, whilst the productivity values for
Wales differ markedly from the other regions in some years (Figure 35). Wales has also seen greater fluctuations between years, but with a general decline in values up to the late 2000s. However, the productivity values for Wales peaked in 2021 with 1.41 chicks fledged per pair (Table 53).
In 2023, the mean productivity estimates were similar for the UK and Wales, with 0.50 and 0.52 chicks fledged per pair, respectively (Table 26). Insufficient productivity data have
NATURAL NESTERS
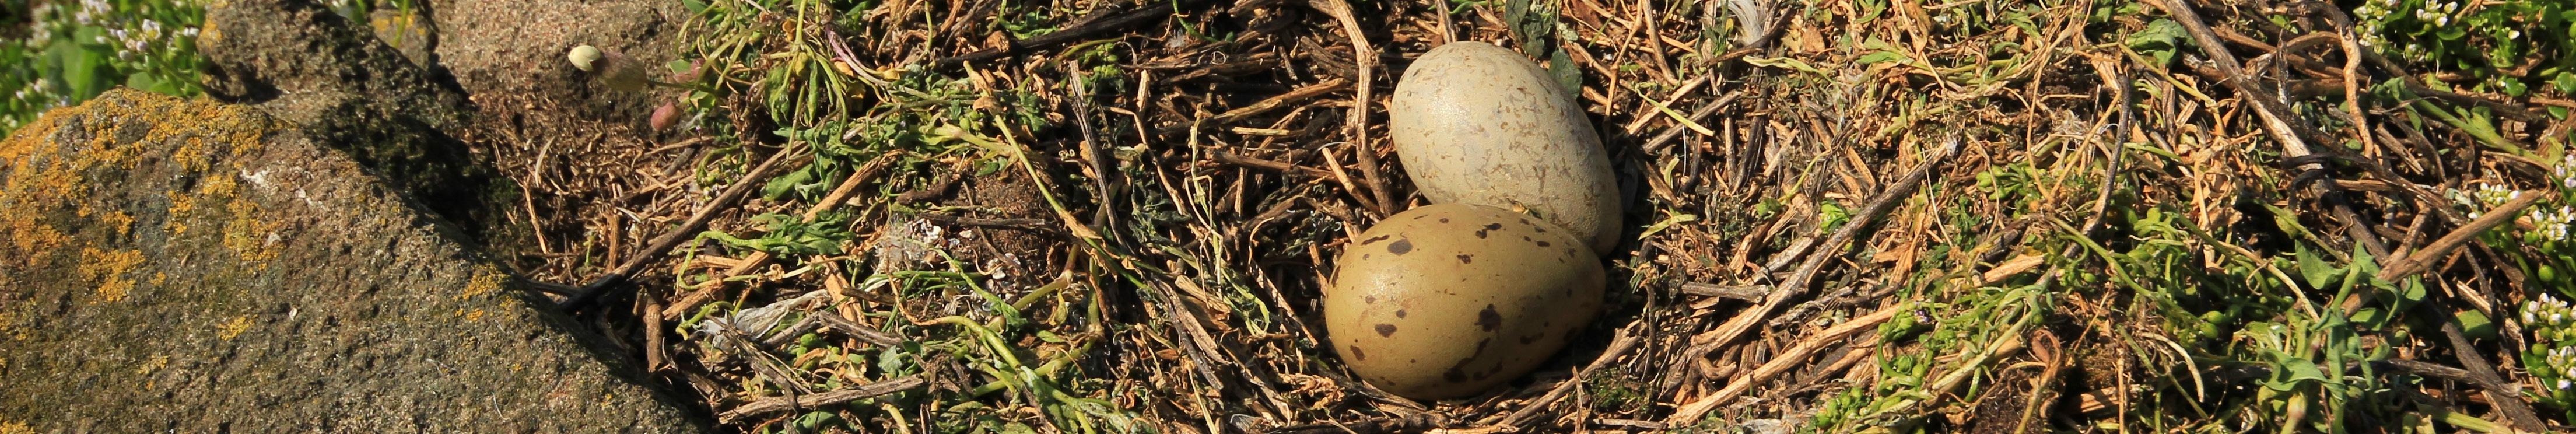
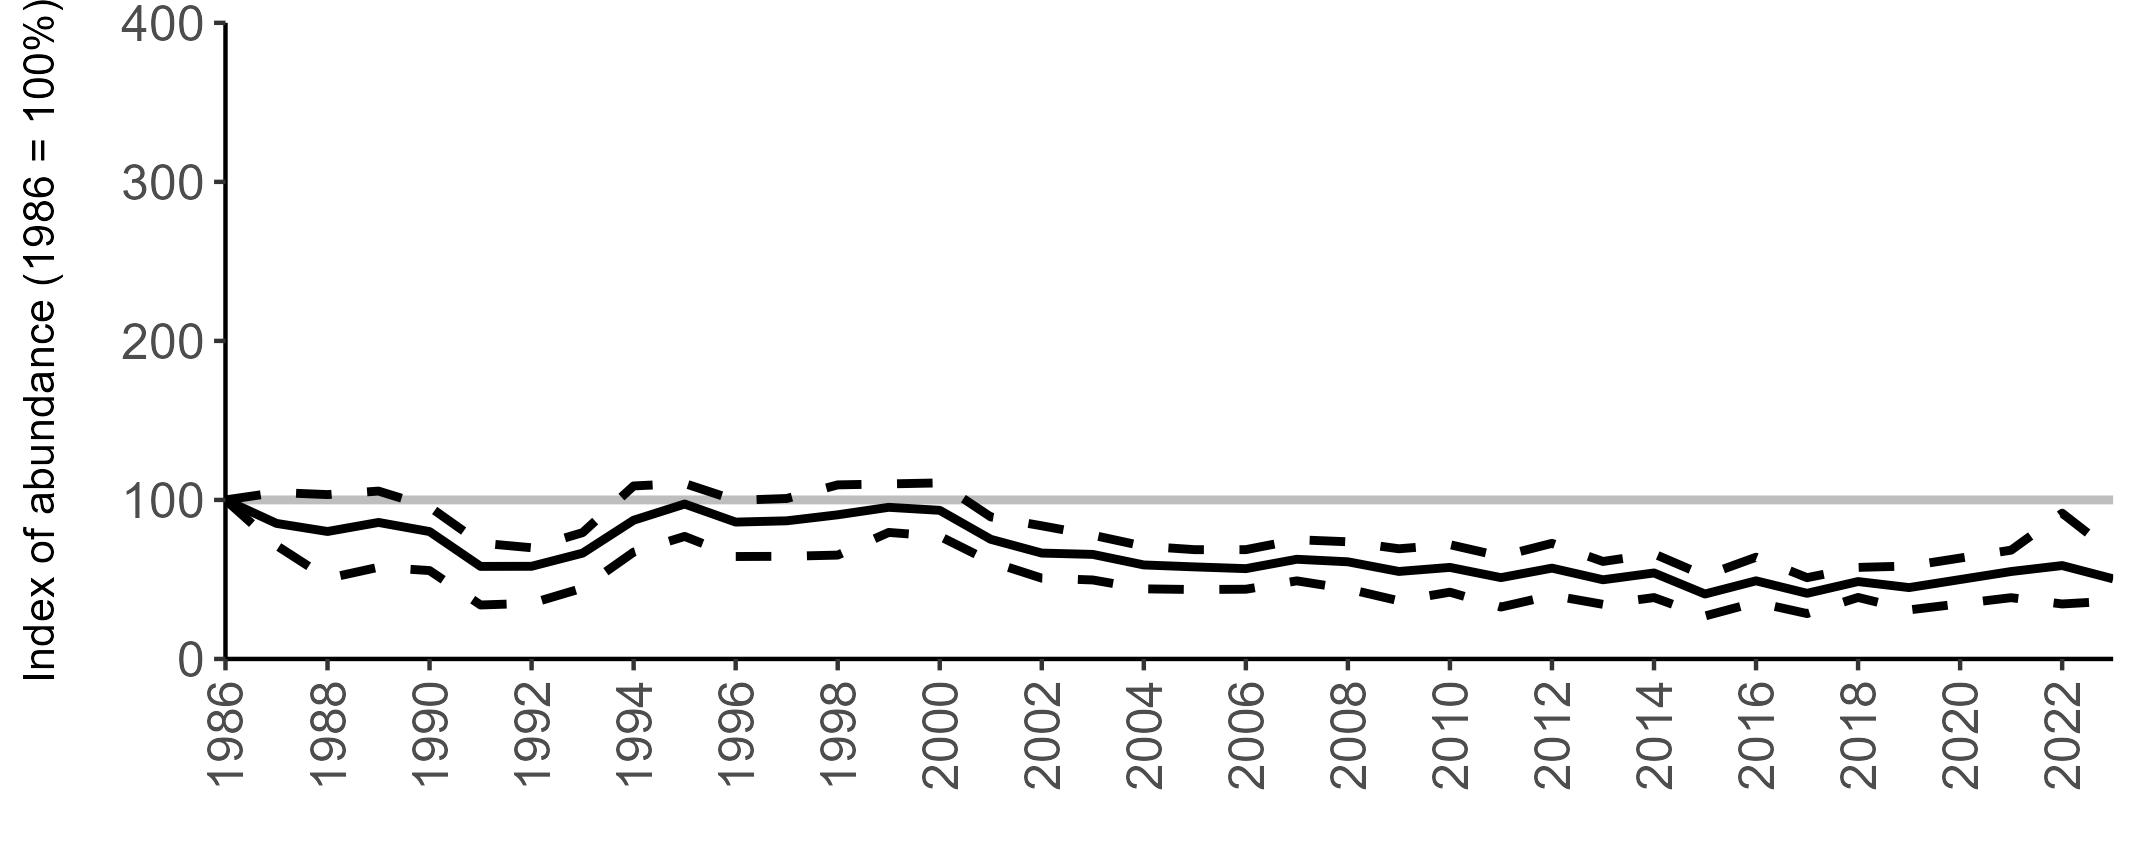
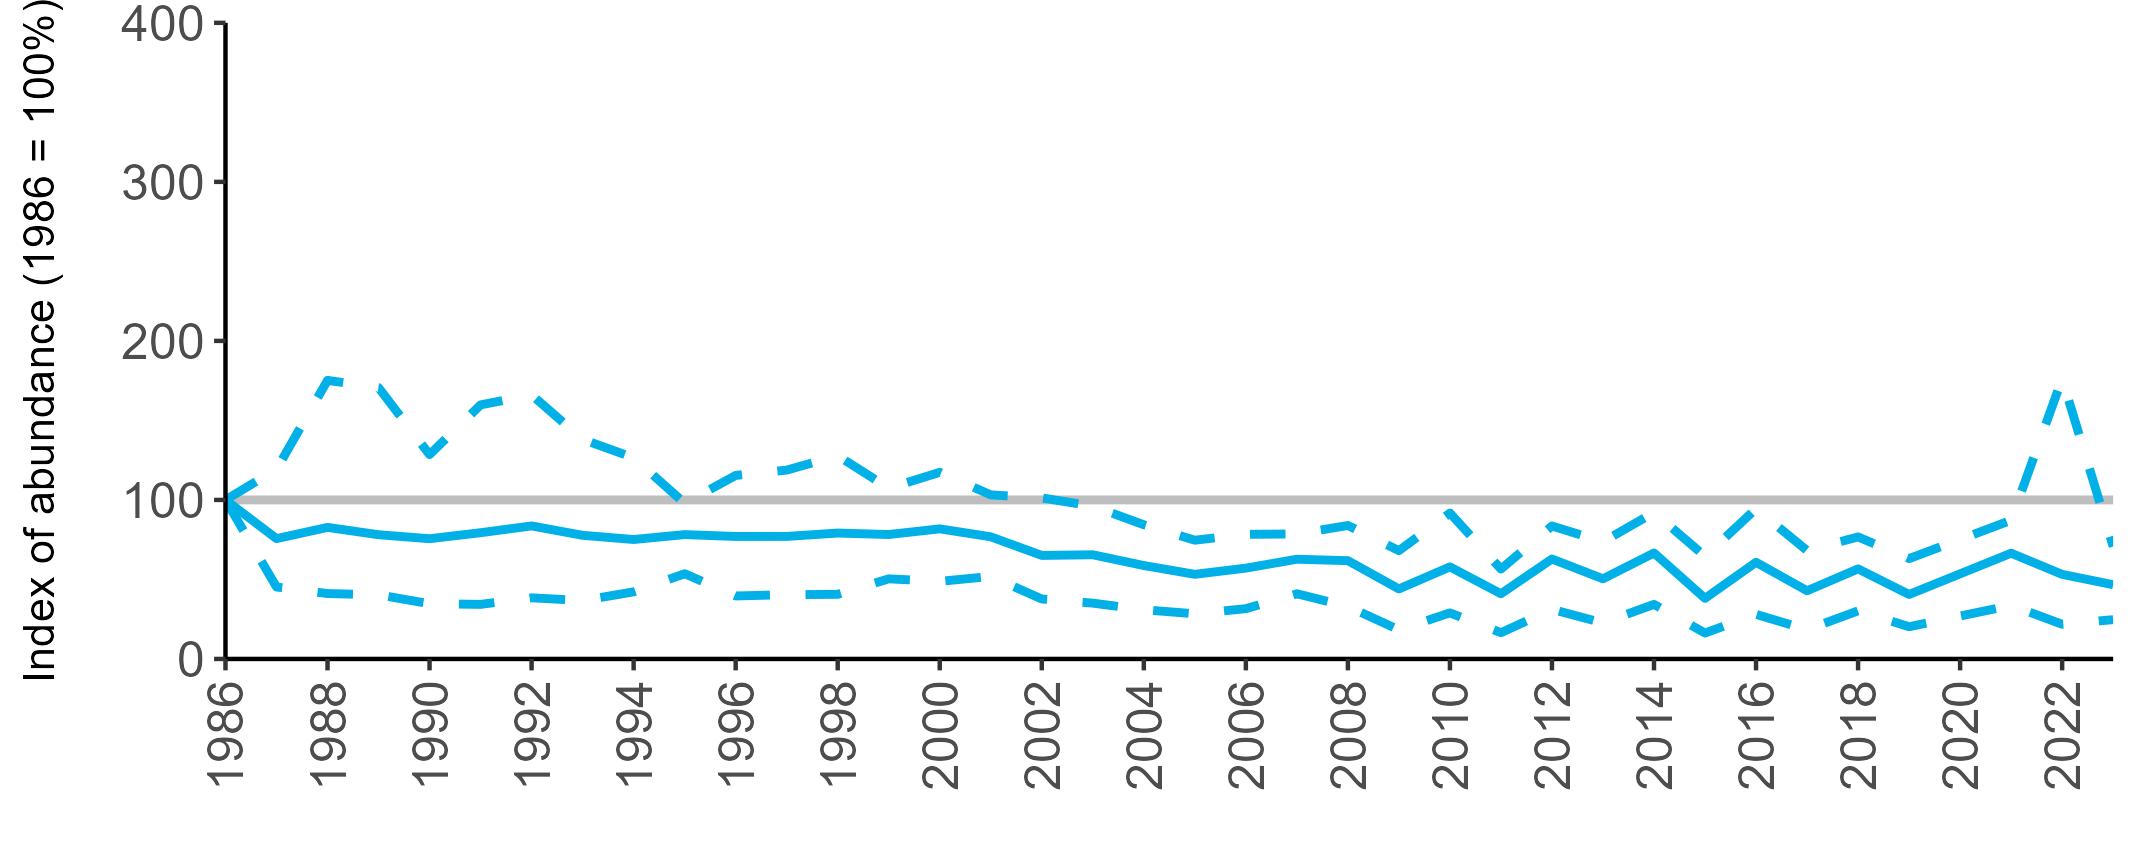
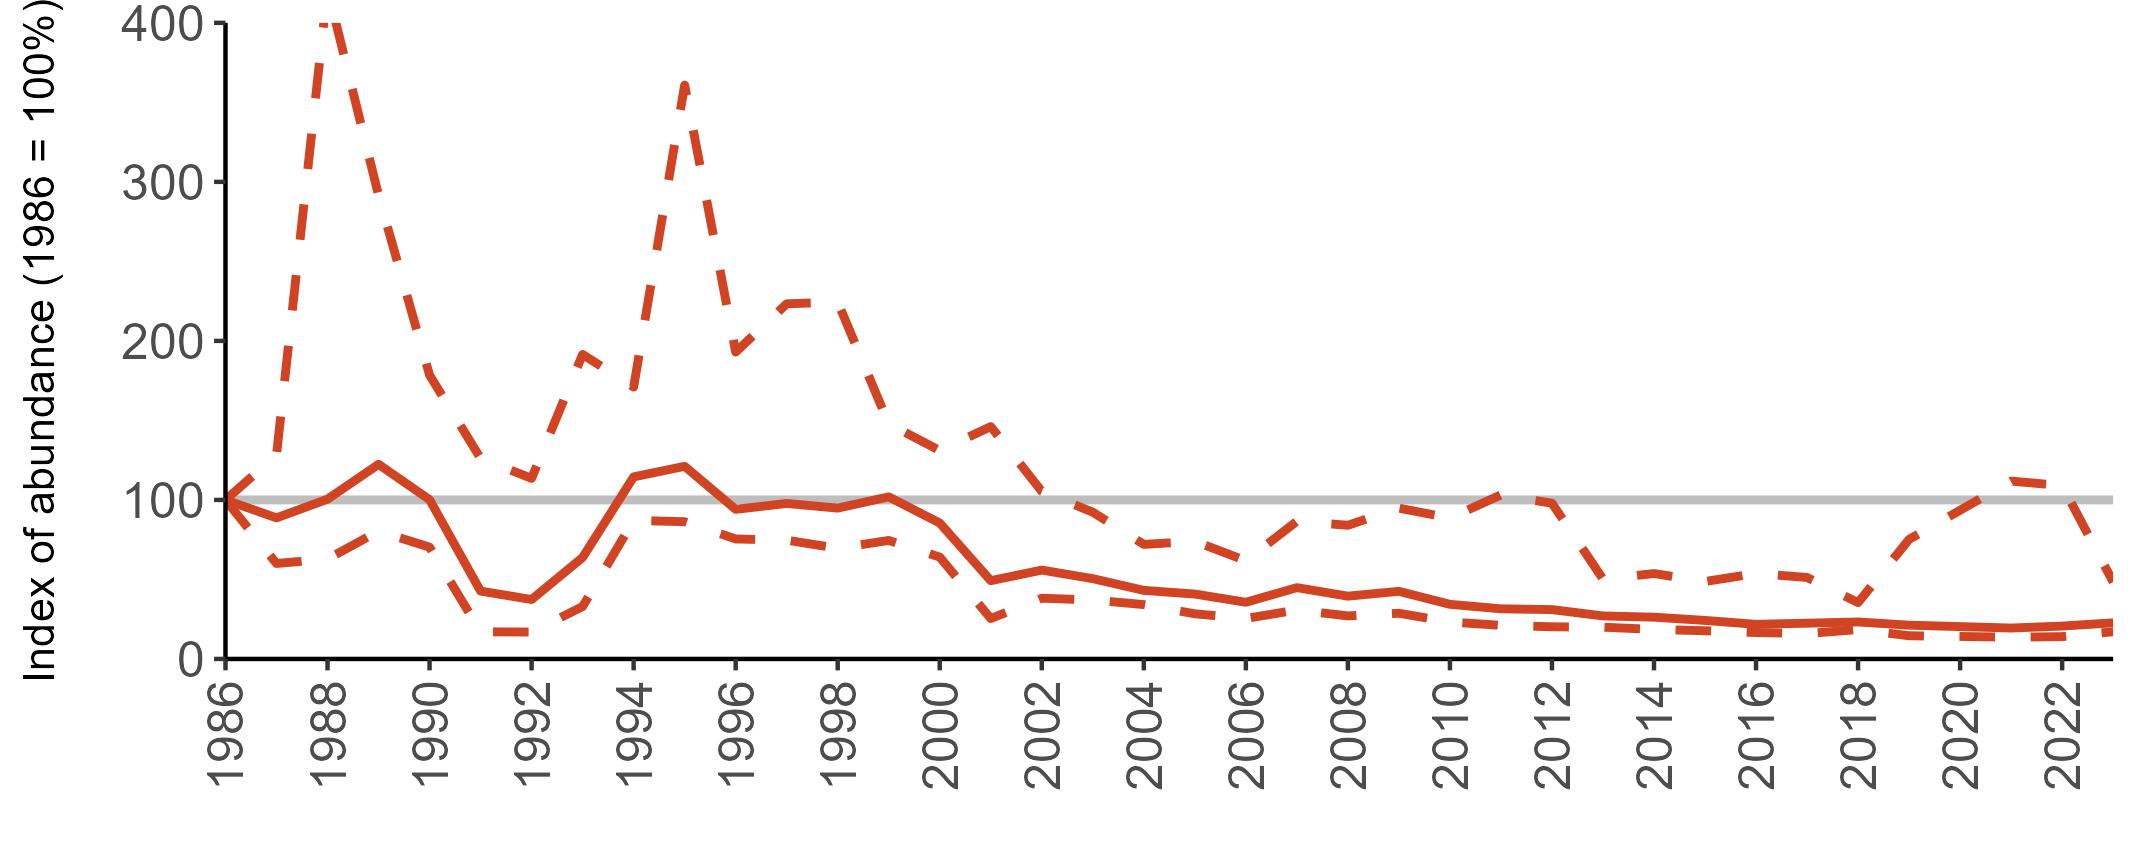
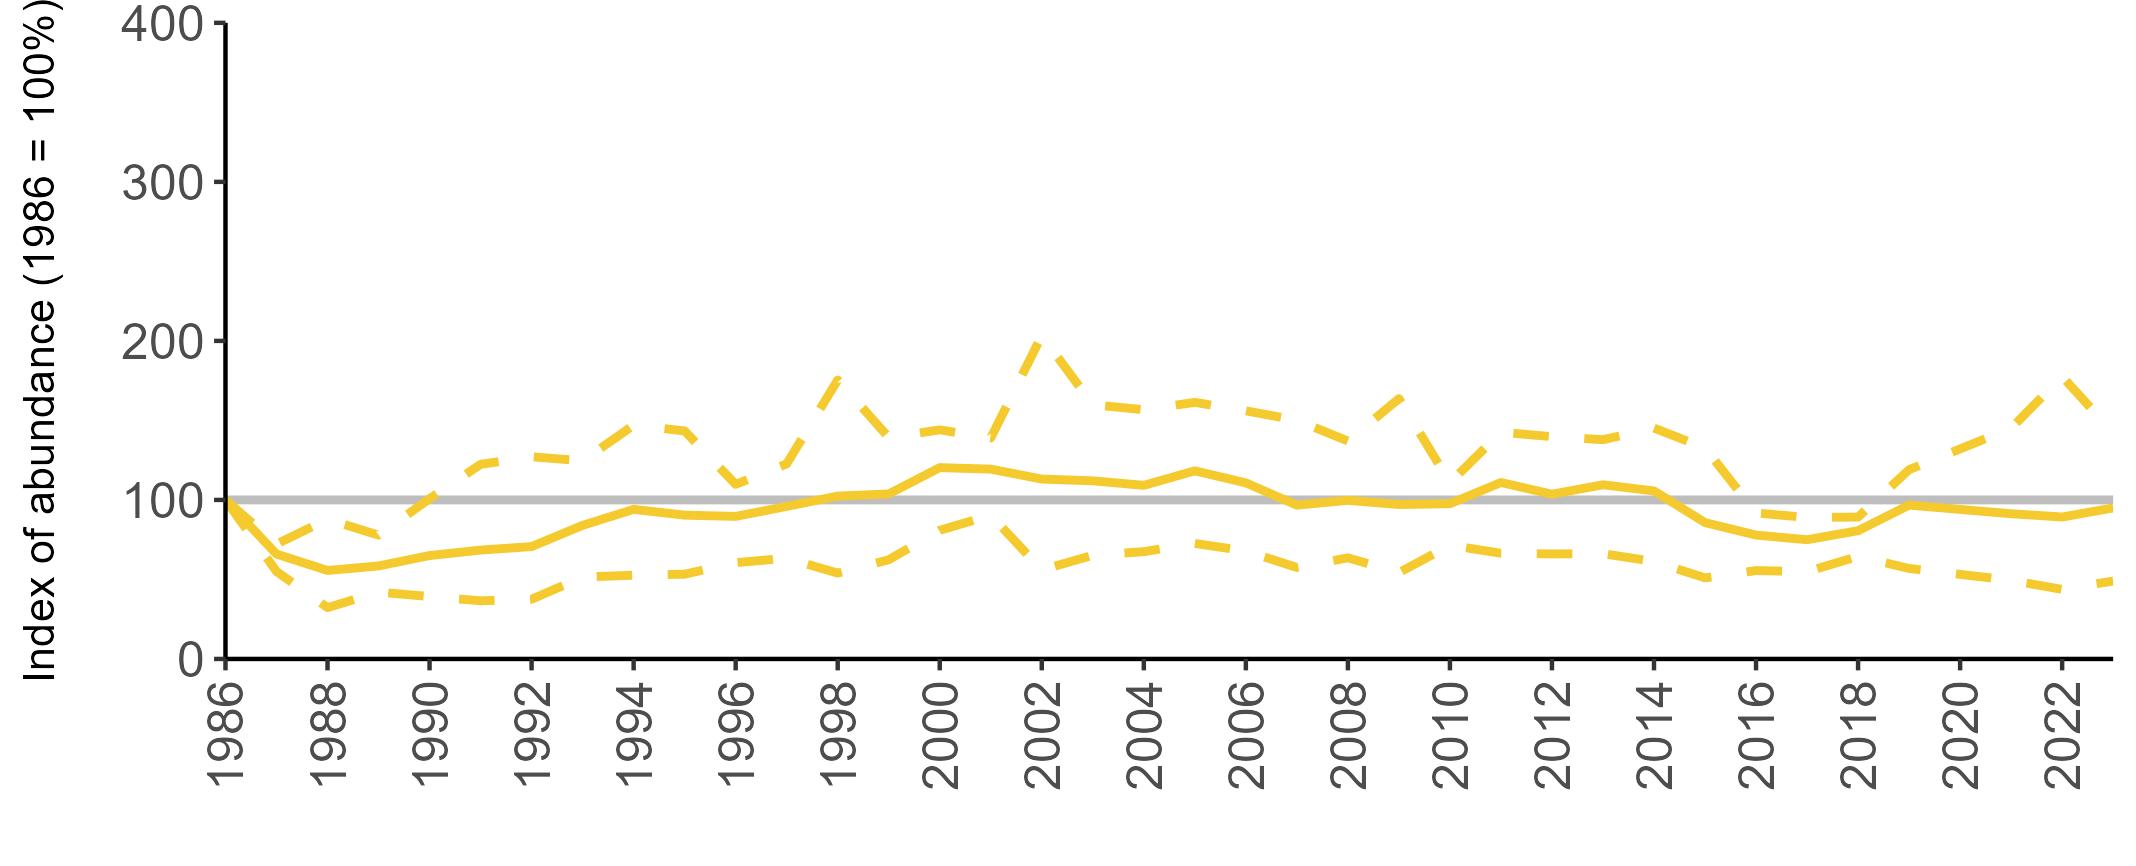
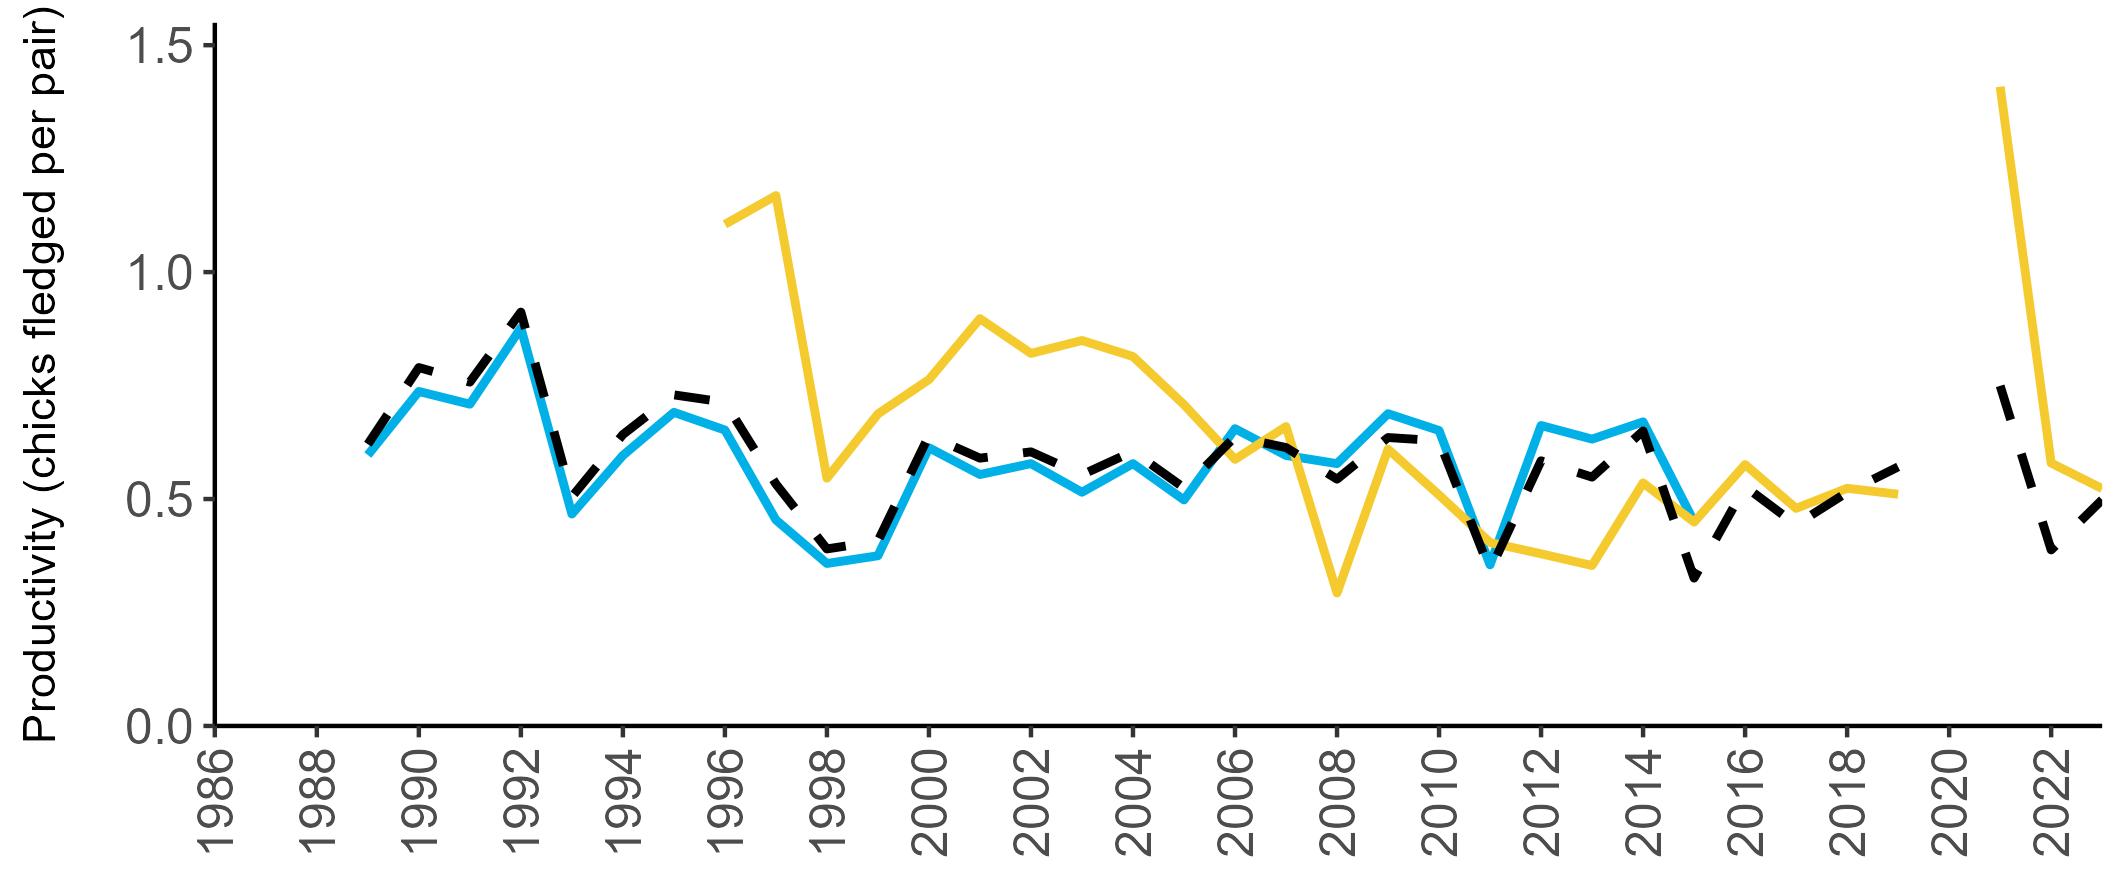
been submitted for Scotland since 2015 to calculate any meaningful average productivity values. This is also true for the other regions where too few data are submitted to the SMP for this calculation.
No systematic data on phenology has been collected as part of the SMP. However, at the Key Site of Canna (Scotland), information on diet is collected and adult survival rates of Herring Gull are estimated on the Key Site of Skomer Island (Wales) and are published in the Key Site reports.
Pressures affecting Herring Gulls include diseases such as botulism (Coulson 2017; Madden & Newton 2004) and HPAI (Melville & Shortridge 2006; Tremlett et al. 2024). At present, however, HPAI appears to have had less effect on Herring Gulls than on many other seabird species (see pages 8–11).
Changes in food availability at both national and local levels may also have impacts on Herring Gull populations. Waste management on refuse tips has improved in recent years, reducing the availability of food for gulls by both covering waste soon after arrival at the tip, and diverting food waste for composting (Coulson 2015; Madden
& Newton 2004). This is of particular concern for overwintering survival for some populations (Olsson & Hentati-Sundberg 2017), Shlepr et al. 2021). Additionally, the ban on fishery discards is likely to be restricting food supplies for Herring Gull, which is known to affect their breeding success (Bicknell et al. 2013; Foster et al. 2017; Furness et al. 1992). Reductions in local fishing activity can also result in changes in diet for Herring Gulls, as was shown on Canna (Scotland), and have a negative impact on their population (Foster et al. 2017).
Herring Gulls are also susceptible to being caught as bycatch by fisheries, including by longlines, trawl nets and gillnets (Anderson et al. 2011; Žydelis, et al. 2013).
Predation from non-native species such as American Mink (Neovison vison) has affected some colonies (Craik 2015). Predation by other gull species and potentially by reintroduced Whitetailed Eagles (Haliaeetus albicilla) may also be increasing the pressures Herring Gulls face (Coulson 2019; Evans et al. 2009).
Wind farms can pose an additional threat, with Herring Gulls shown to be attracted to offshore wind farms, potentially for roosting or foraging opportunities (Vanermen et al. 2015), and they are considered to have a
Scotland
Wales
very high risk of collision mortality (Bradbury et al. 2014; Newton & Little 2009).
Historically, deliberate culling is thought to have contributed to declines in Herring Gull numbers (Coulson 2015) and, as they expand more into urban areas, conflict with humans is likely to increase (Rock 2005).
Conservation measures which could potentially benefit Herring Gulls include predator control, such as the removal of American Mink, which has led to higher breeding success in some colonies (Coulson 2019).
Maintaining legal limits on Herring Gull control through the licensing process will also be beneficial to this species (2009/147/EC). The expansion of the population into urban environments will require sensitive local management to resolve human-gull conflicts, and education programmes and the use of nonlethal deterrents will be important. The future development of improved monitoring techniques for challenging urban environments will also aid in determining whether proposed control methods are sustainable for Herring Gull populations (Burnell et al. 2023; Rock 2005).
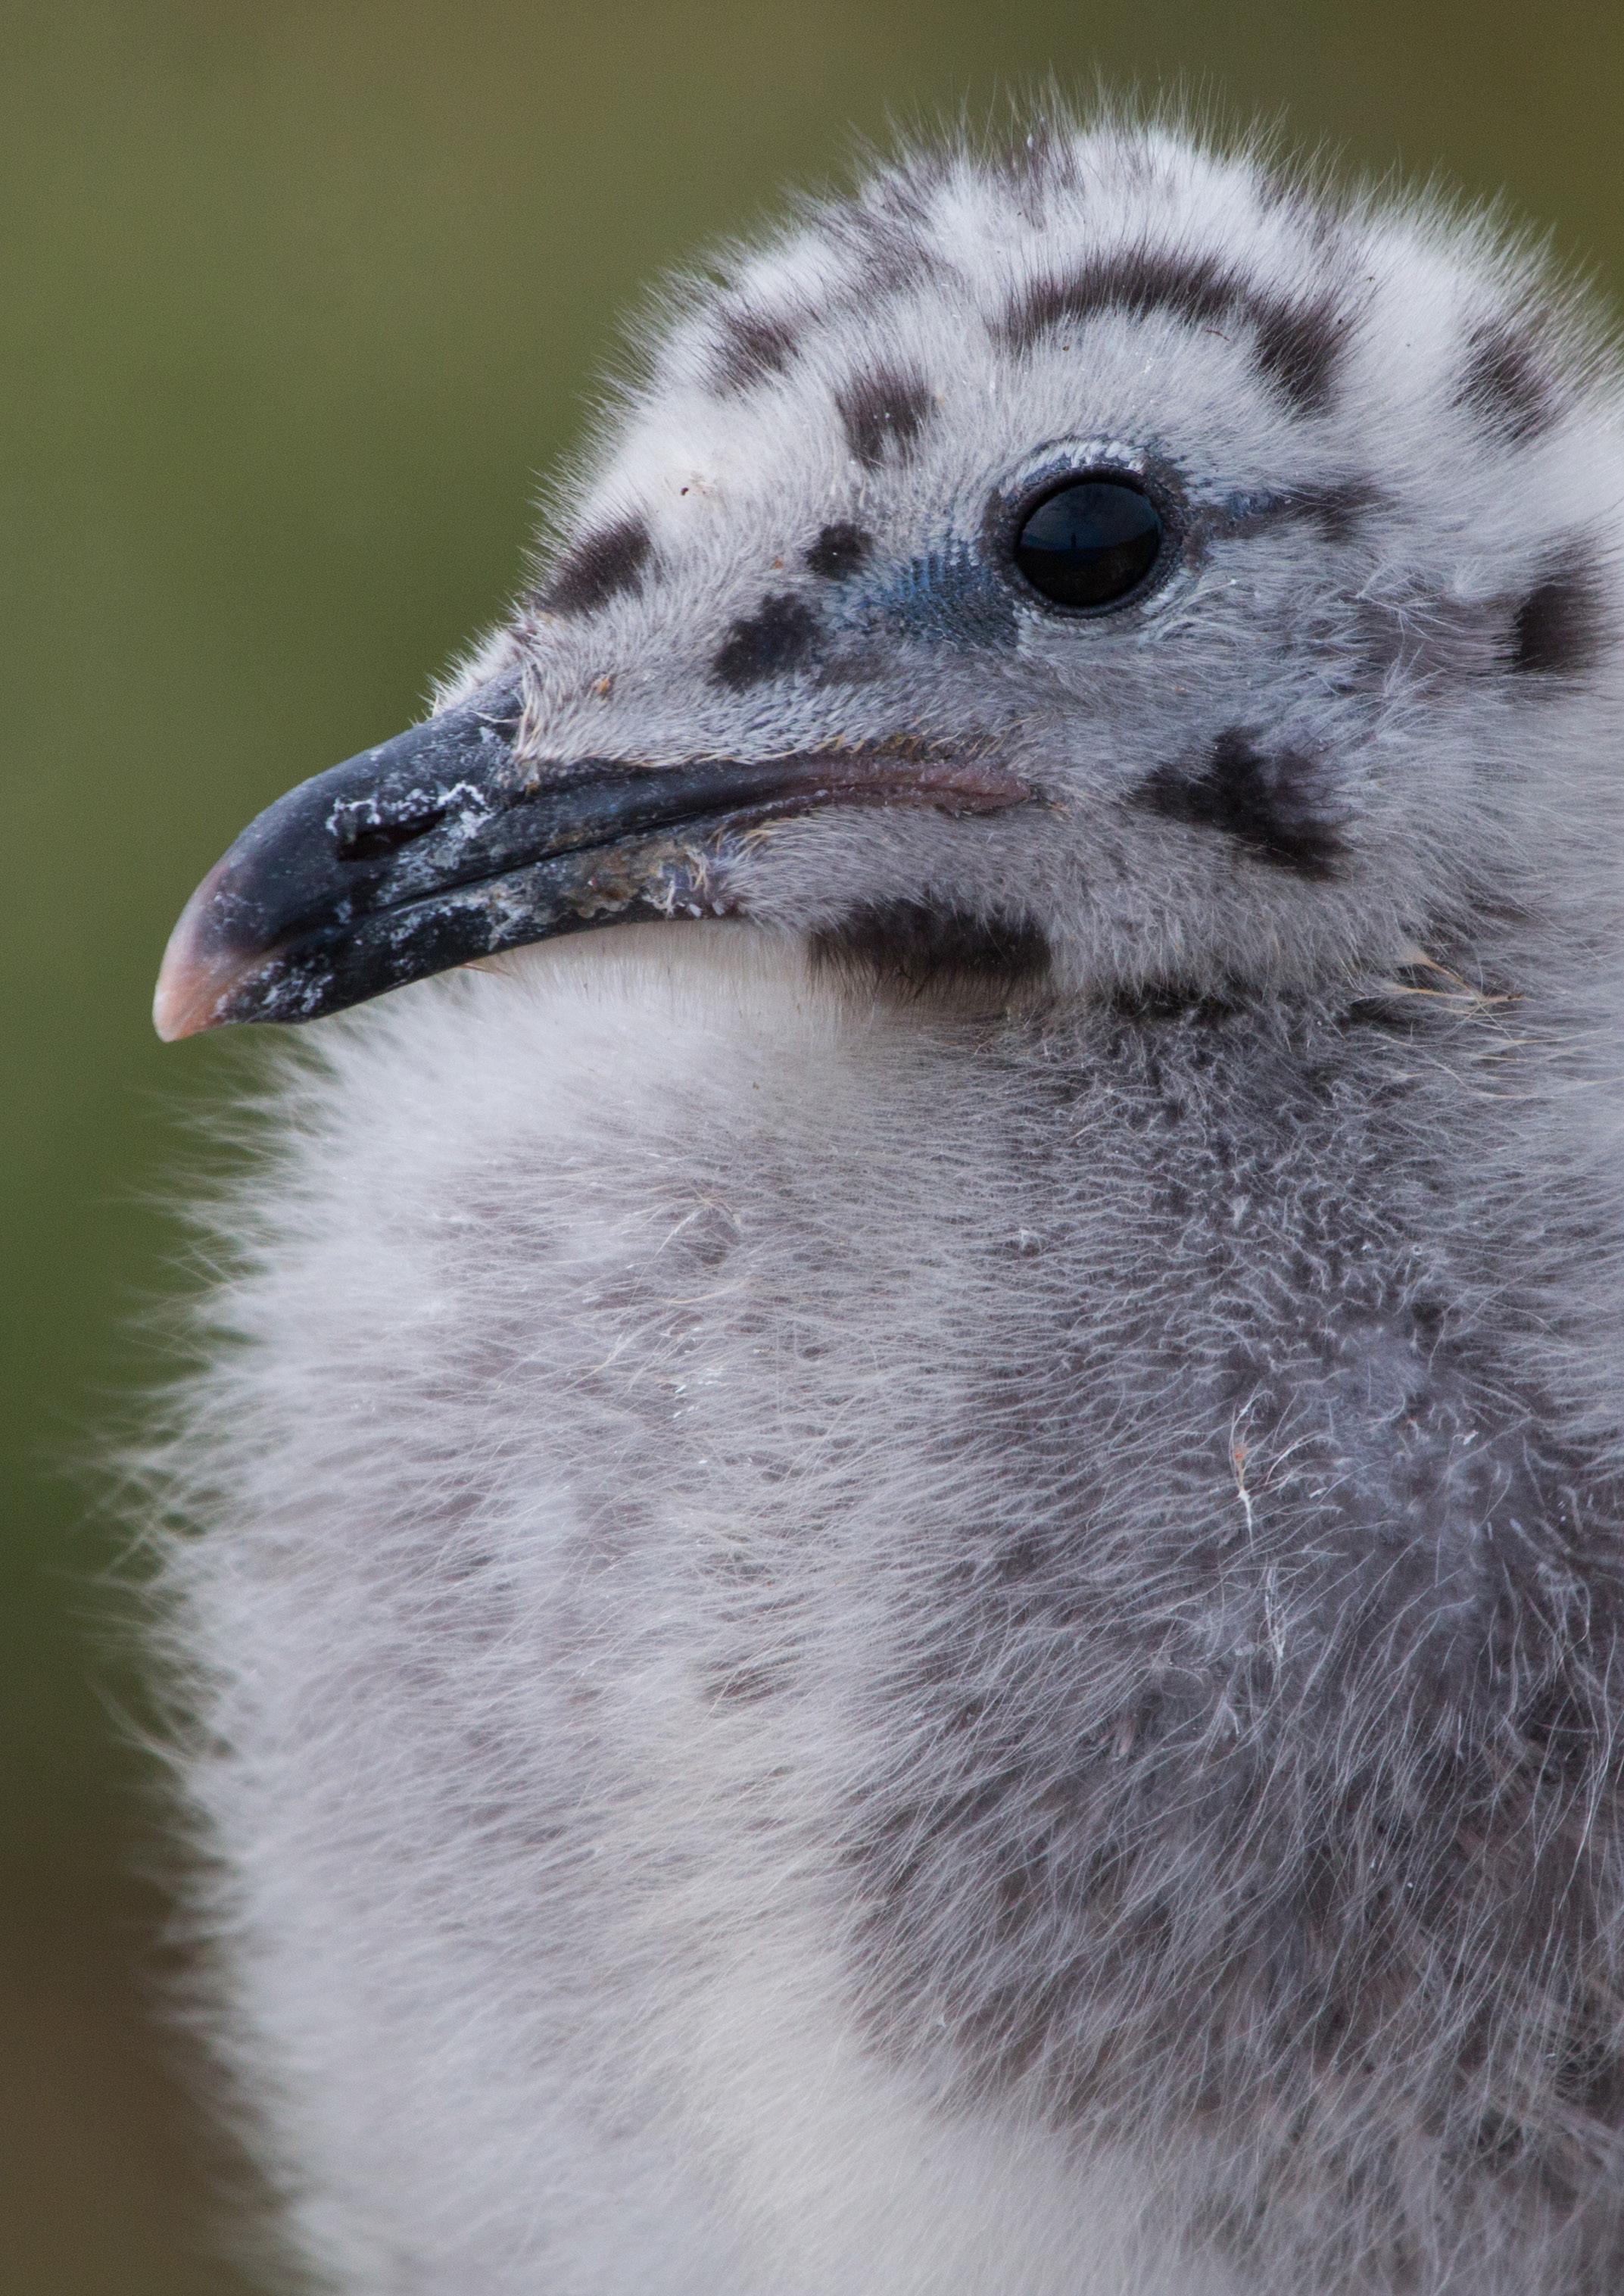
Red-listed
Green-listed (I)
Abundance: Decline
Productivity: 1.13
Colony Count sites: 281
Breeding Success sites: 9
Lifespan: 12 years
Breeding age: 5 years
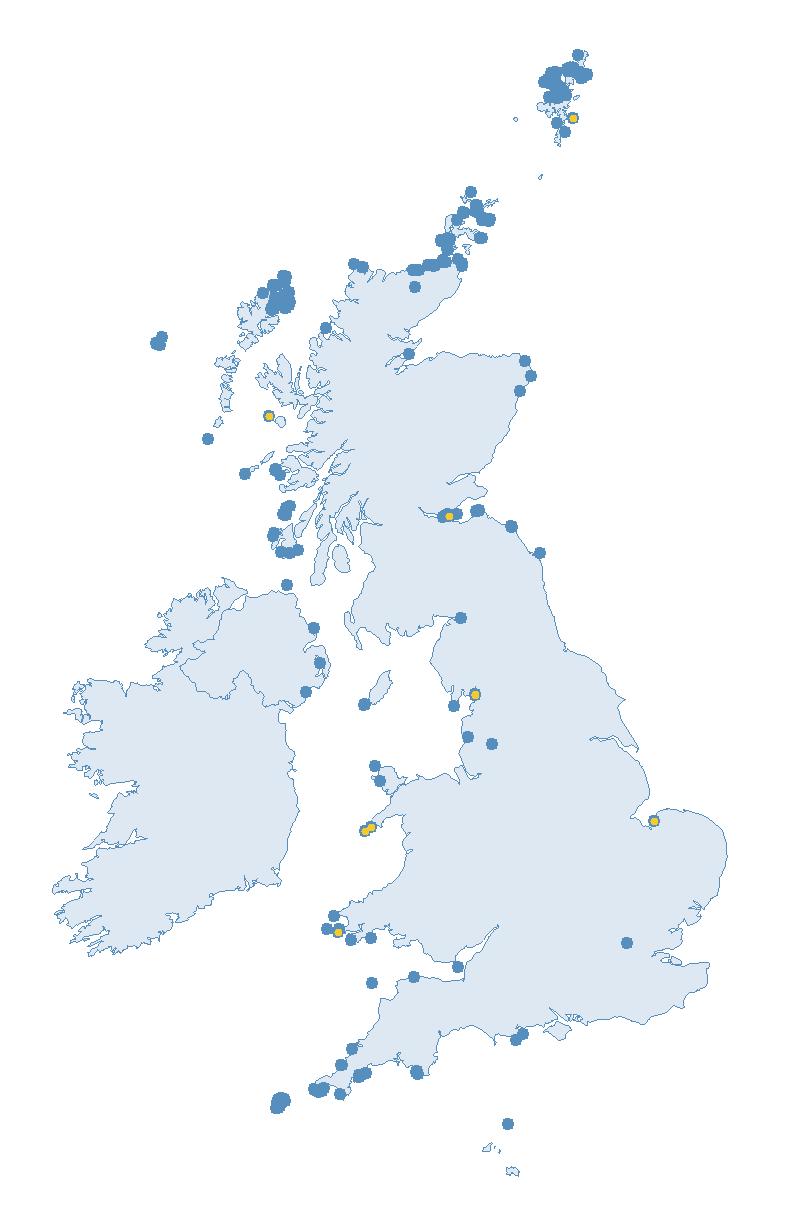
Britain and Ireland host approximately 7% of the global and 9—14% of the European breeding population of Great Black-backed Gull (Burnell et al. 2023). In the recent BoCC5a assessment, they were moved from Amber to the Red List (highest concern) (Stanbury et al. 2024).
Following a dramatic expansion in range in the 20th century, Great Black-backed Gulls currently breed across much of northern and western Britain and Ireland, predominantly around the coastline (JNCC 2021; Langlois Lopez et al. 2022).
Globally, they breed across the coastlines of much of the North Atlantic, and on the Great Lakes of North America, with strongholds in Norway, Canada and Iceland (BirdLife International 2024).
Great Black-backed Gulls that breed in the north of their range typically migrate further south for the winter, and Norwegian and Swedish-ringed Great Black-backed Gulls have been found in the UK during the winter months (BTO 2023b). British and Irish Great Black-backed Gulls can be found overwintering around much of the coastline and also at inland sites. Winter numbers are increased by migrants from further north in their range (Wernham et al. 2002).
Great Black-backed Gulls are generalist foragers and eat both
natural prey, such as fish, birds and their eggs, small mammals and marine invertebrates, and human-discarded waste e.g. fishery discards, offal and scavenged food from refuse tips (Buckley 1990; Taylor et al. 2012).
Great Black-backed Gulls primarily nest on rocky coastlines and coastal grasslands, but small numbers also nest on inland islands in freshwater bodies and on rooftops (del Hoyo et al. 1996; JNCC 2021). They typically nest in solitary pairs or small colonies, often dispersed throughout mixed-species colonies (del Hoyo et al. 1996). Three eggs are usually laid in a scrape lined with vegetation (Burnell et al. 2023)
BREEDING ABUNDANCE
Changes in SMP breeding abundance trends for Great Black-backed Gulls since 2000 (Table 28) are largely in agreement with those reported by the Seabirds Count census (Burnell et al. 2023), with declines in the UK and Scotland, but an increase in Wales.
At the UK level, a decline of 45% was recorded by the SMP between 2000 and 2023, whilst the Seabirds Count census showed a decrease of 52% since
of the recording period for Wales, therefore this index should be used with caution.
Too few data are currently submitted to the SMP in other regions to allow for the calculation of meaningful abundance trends.
PRODUCTIVITY
The UK and Scotland productivity trends for Great Black-backed Gulls are closely matched over the SMP monitoring period (Figure 39), as a large proportion of the monitored nests are located in Scotland. There was an overall decline in productivity for both Scotland and the UK until 2005, after which values increased to a peak in 2021. Following low values in 2022 (Table 50 & 52), which is likely to have been an effect of HPAI, higher mean productivity estimates were reported in 2023, with 1.13 chicks fledged per pair in the UK and 1.02 chicks fledged per pair in Scotland (Table 28).
Too few data are submitted to the SMP on productivity of Great Blackbacked Gulls in other regions to calculate any meaningful average productivity values.
the Seabird 2000 census. For Scotland the SMP trend showed a decline of 70% since 2000, whilst the Seabirds Count census reported a decline of 63% since Seabird 2000. By contrast, the SMP trend for Wales showed an increase of 62% since 2000, whilst the Seabirds Count census reported an increase of 49% over a similar period.
Over much of the SMP reporting period, the UK and Scotland longterm abundance trends for Great Black-backed Gulls have been relatively similar (Figures 36–37), as many of the colonies monitored are located in Scotland. The UK and Scotland trends increased during the 1990s but declined thereafter, particularly for Scotland, and both trends have remained below the 1986 baseline since the early 2000s. Following increases for the UK and Scotland in 2022, the index values declined to -42% for the UK and -72% for Scotland in 2023 (Table 28). By contrast, the Welsh trend increased over the recording period until 2015 (Figure 38). Although the trend has since declined, the index value for Wales was 148% above the baseline in 2023 (Table 28). However, the confidence limits are wide over most
remains around a sample of nests once chicks have fledged, and is published in the Key Site reports for the island.
CAUSES OF CHANGE
The decline in the Great Black-backed Gull population observed across Britain and Ireland is also reflected globally. The global population is estimated to have declined by 43%–48% between 1985 and 2021, with the causes largely unclear in all regions (Langlois Lopez et al. 2022). Increases observed in the south of the global Great Black-backed Gull range could be a result of immigration from the northern population, although these increases are small compared to the overall declines (Langlois Lopez et al. 2022).
In the 19th century, Great Blackbacked Gulls were hunted for the millinery trade and since then fell victim of dichloro-diphenyltrichloroethane (DDT) in the environment (Burnell et al. 2017).
Although Great Black-backed Gulls have a generalist and adaptable diet, any reductions in food availability, such as the recent ban on fishery discards, may potentially impact on their populations (Reeves & Furness 2002; Reid 2004; Wilhelm et al. 2016). Bycatch from fishing activities is an additional potential threat, but current levels are not thought to be significant for this species (Billerman 2020; Christensen-Dalsgaard et al. 2022).
Great Black-backed Gulls are considered to have a very high risk of collision mortality with turbines in offshore wind farms (Bradbury et al. 2014; Furness et al. 2013). This is exacerbated by gulls being attracted to offshore wind farms, potentially for roosting or foraging opportunities (Vanermen et al. 2015).
PHENOLOGY, DIET AND SURVIVAL
No systematic data on phenology or survival have been collected as part of the SMP. However, information on Great Black-backed Gull diet is collected at the Key Site of Skomer Island (Wales), by monitoring prey
Although predation by American Mink (Neovison vison) on Great Blackbacked Gulls appears to be less severe than for other seabirds (Nordström et al. 2003), this non-native predator has been shown to cause declines in some years for this species (Craik 2015). White-tailed Eagles (Haliaeetus albicilla), numbers of which are currently increasing in Scotland, may also reduce gull breeding productivity through increased disturbance (Billerman 2020; Hipfner et al. 2012).
Further research is needed to identify the primary drivers of the decline seen in Great Black-backed Gull populations, so that appropriate actions can be implemented. At present, local measures, such as control of non-native predators, where they are demonstrated to have had negative impacts, may be effective (Hunt & Heffernan 2007).
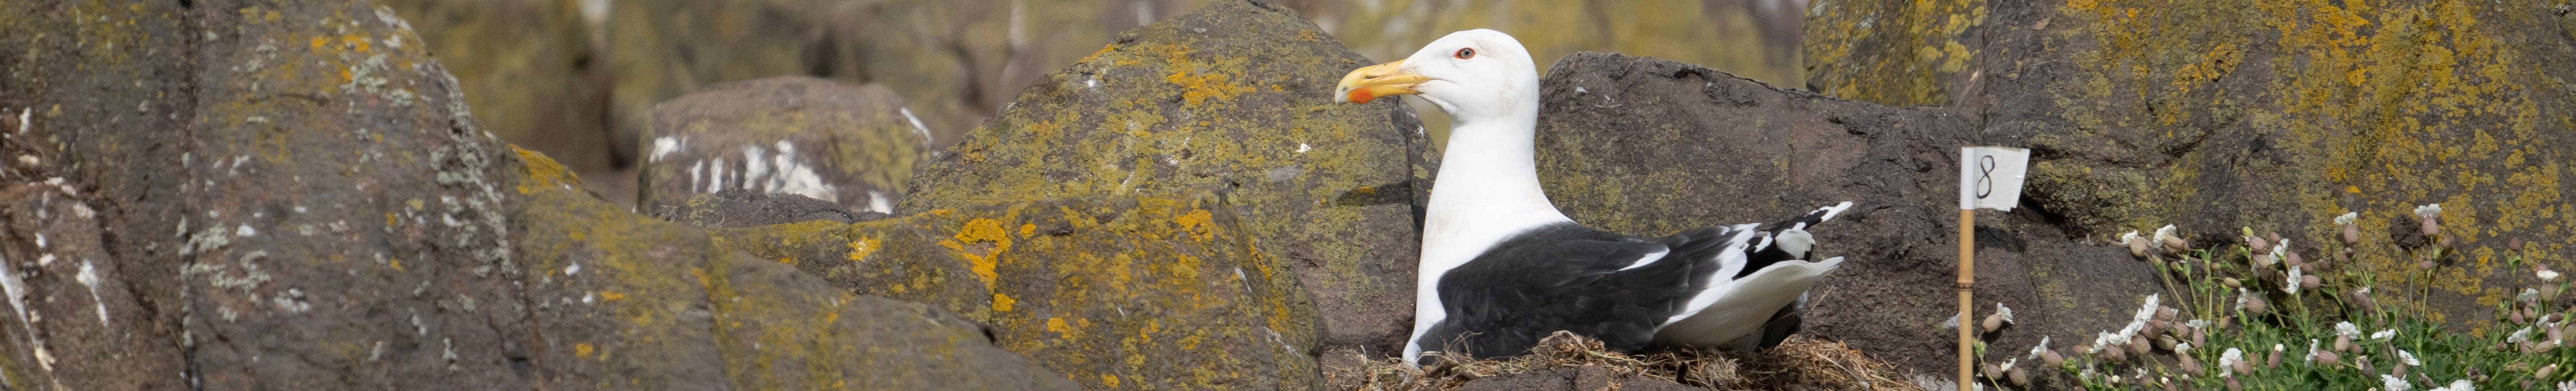
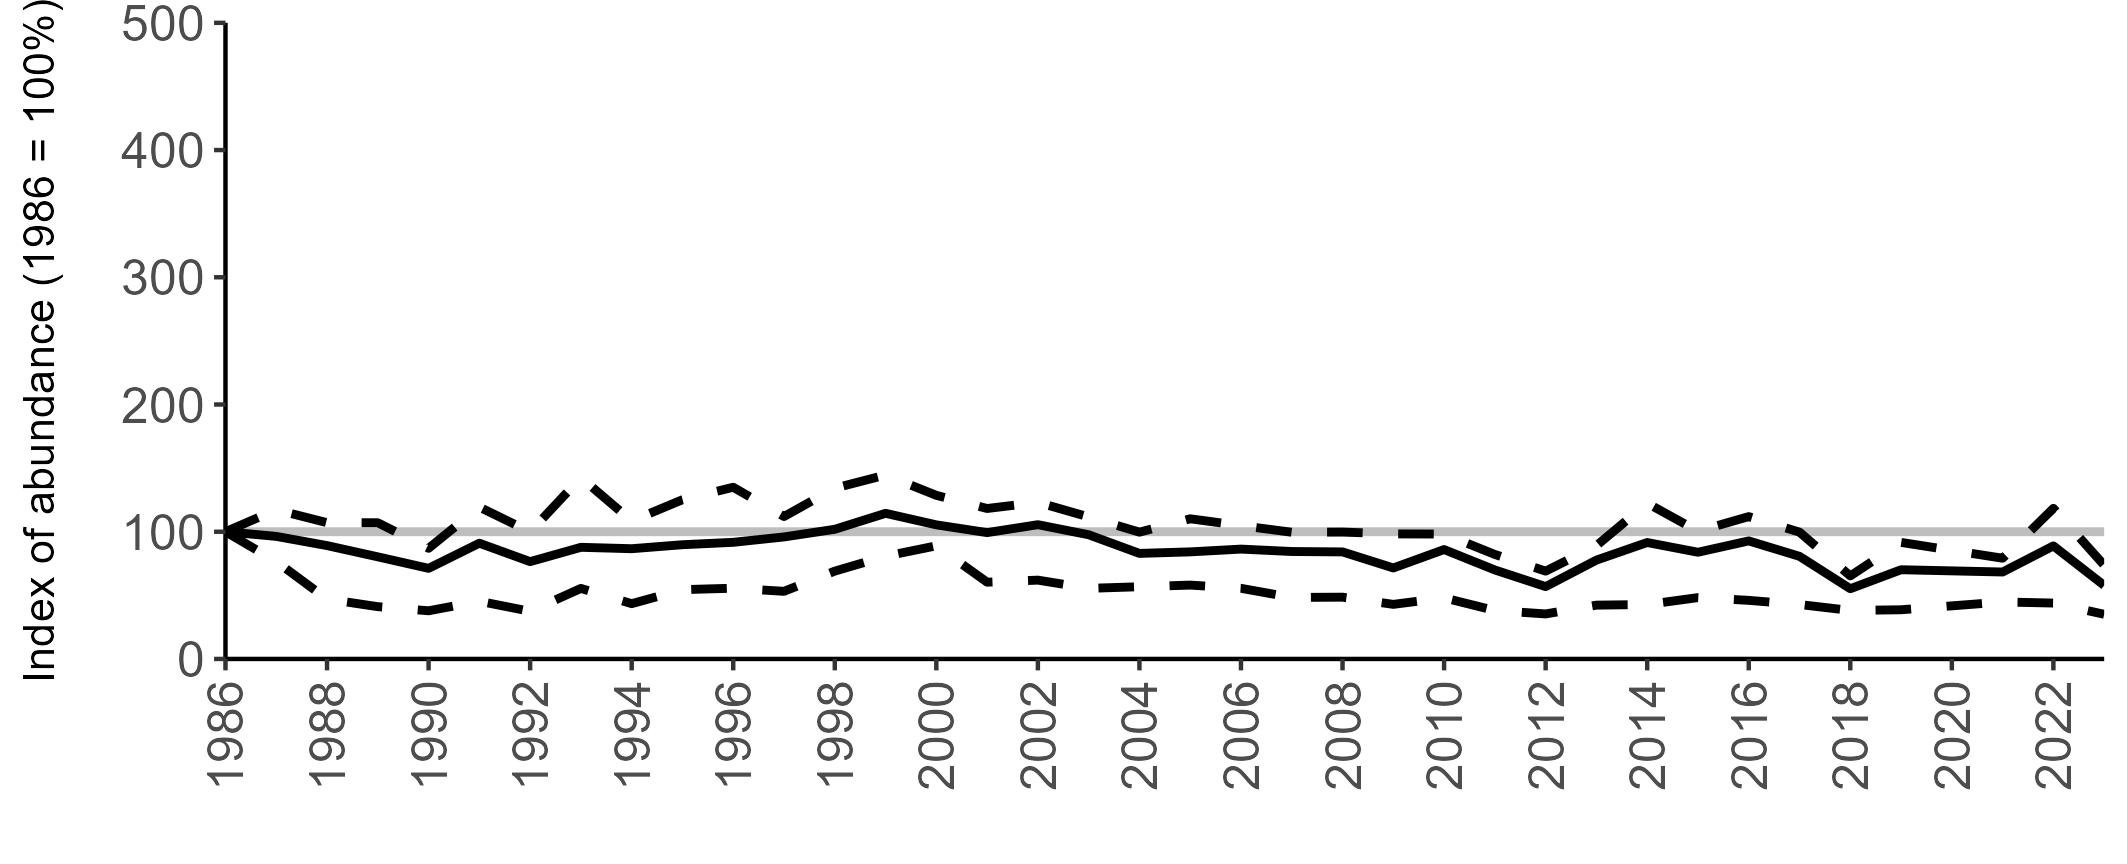
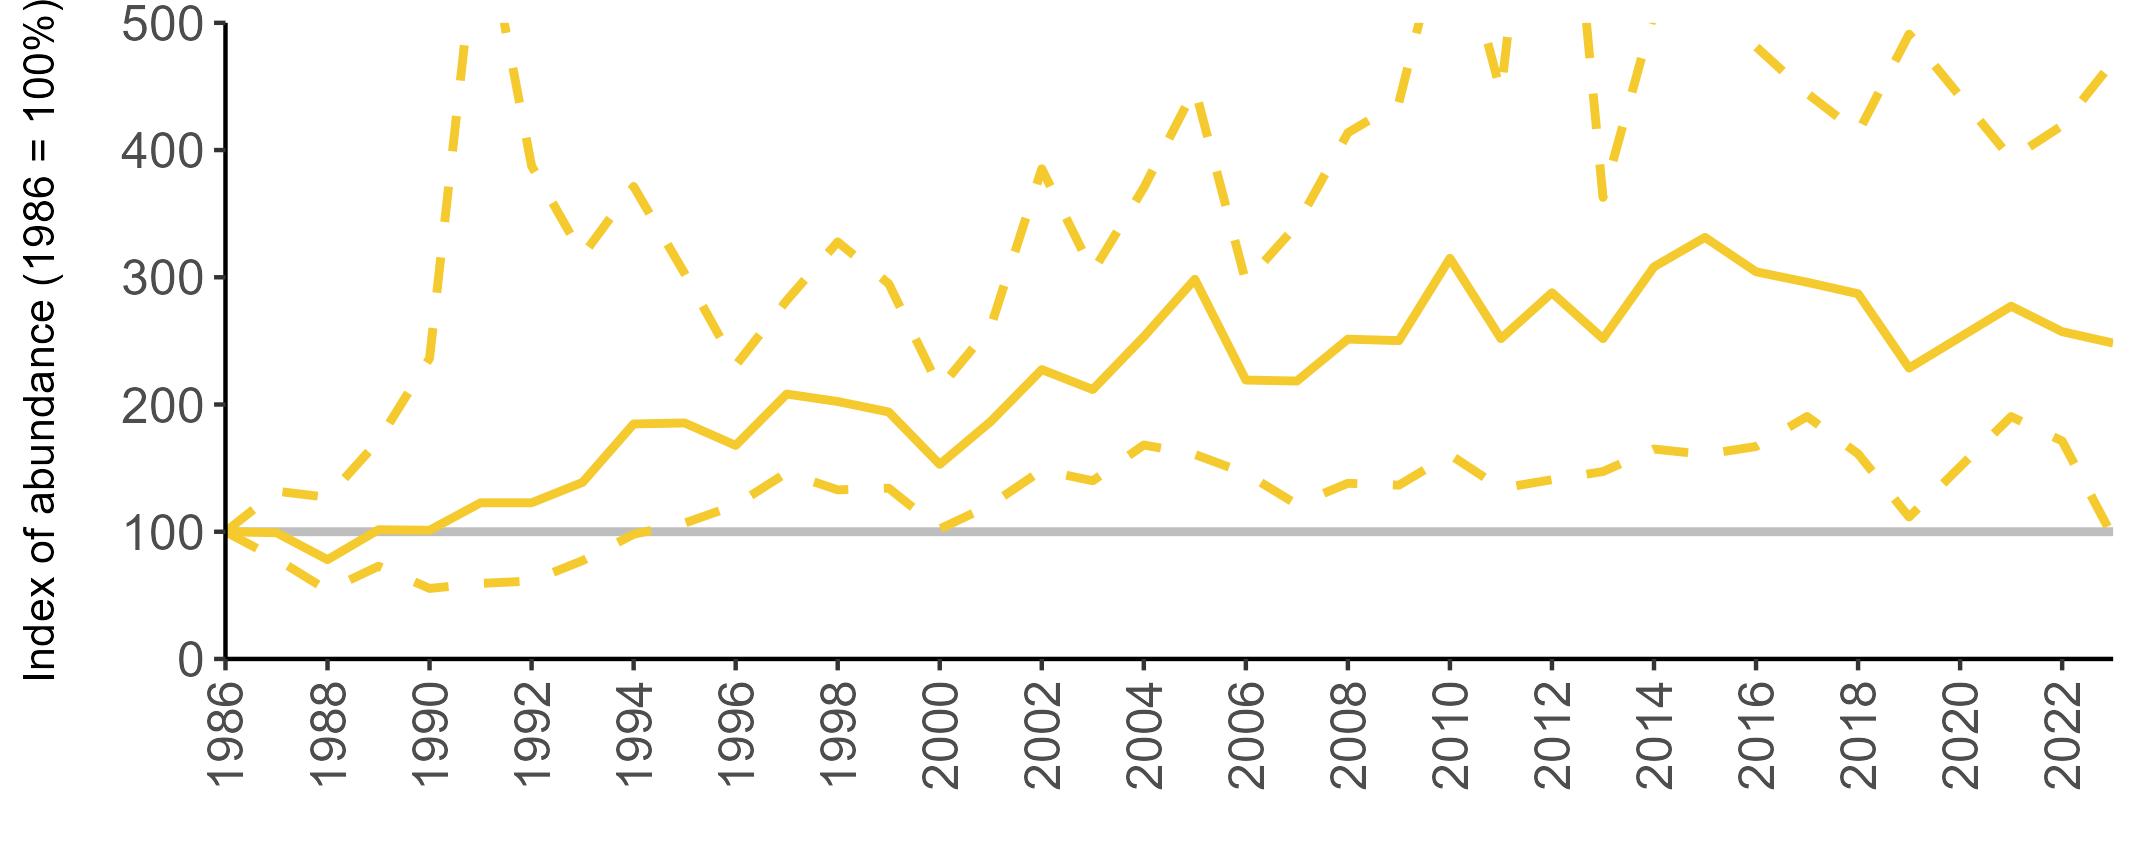
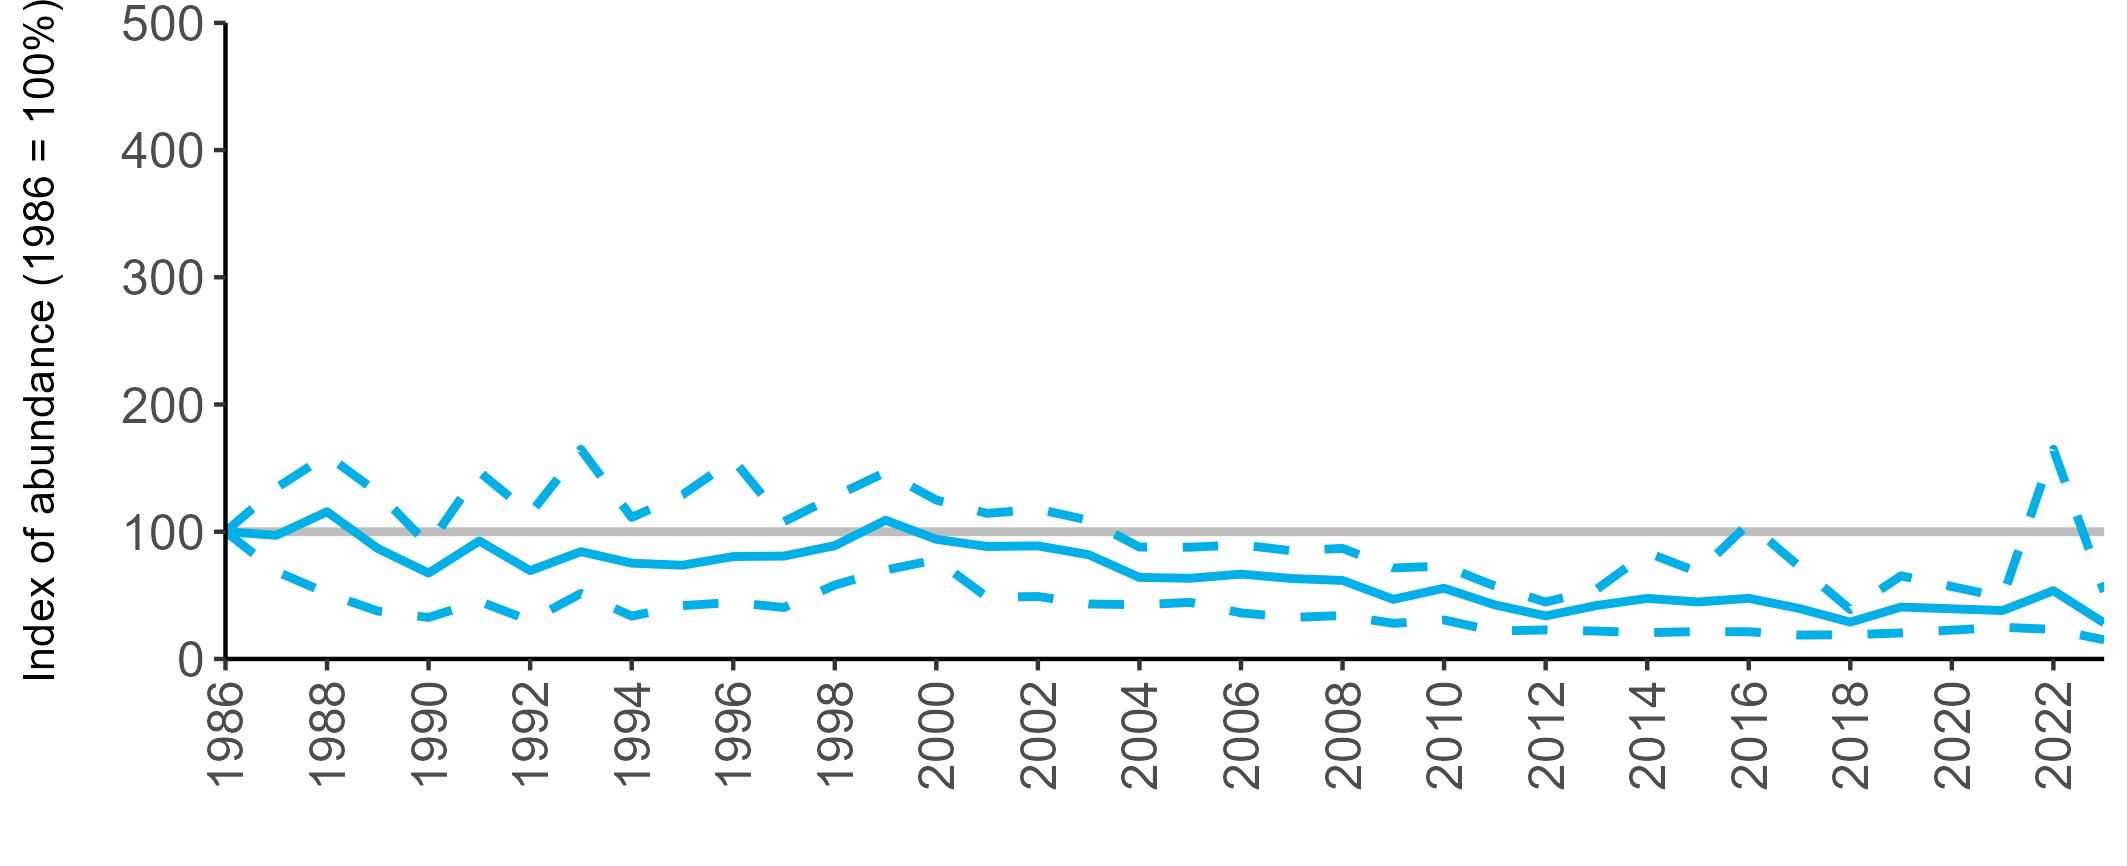
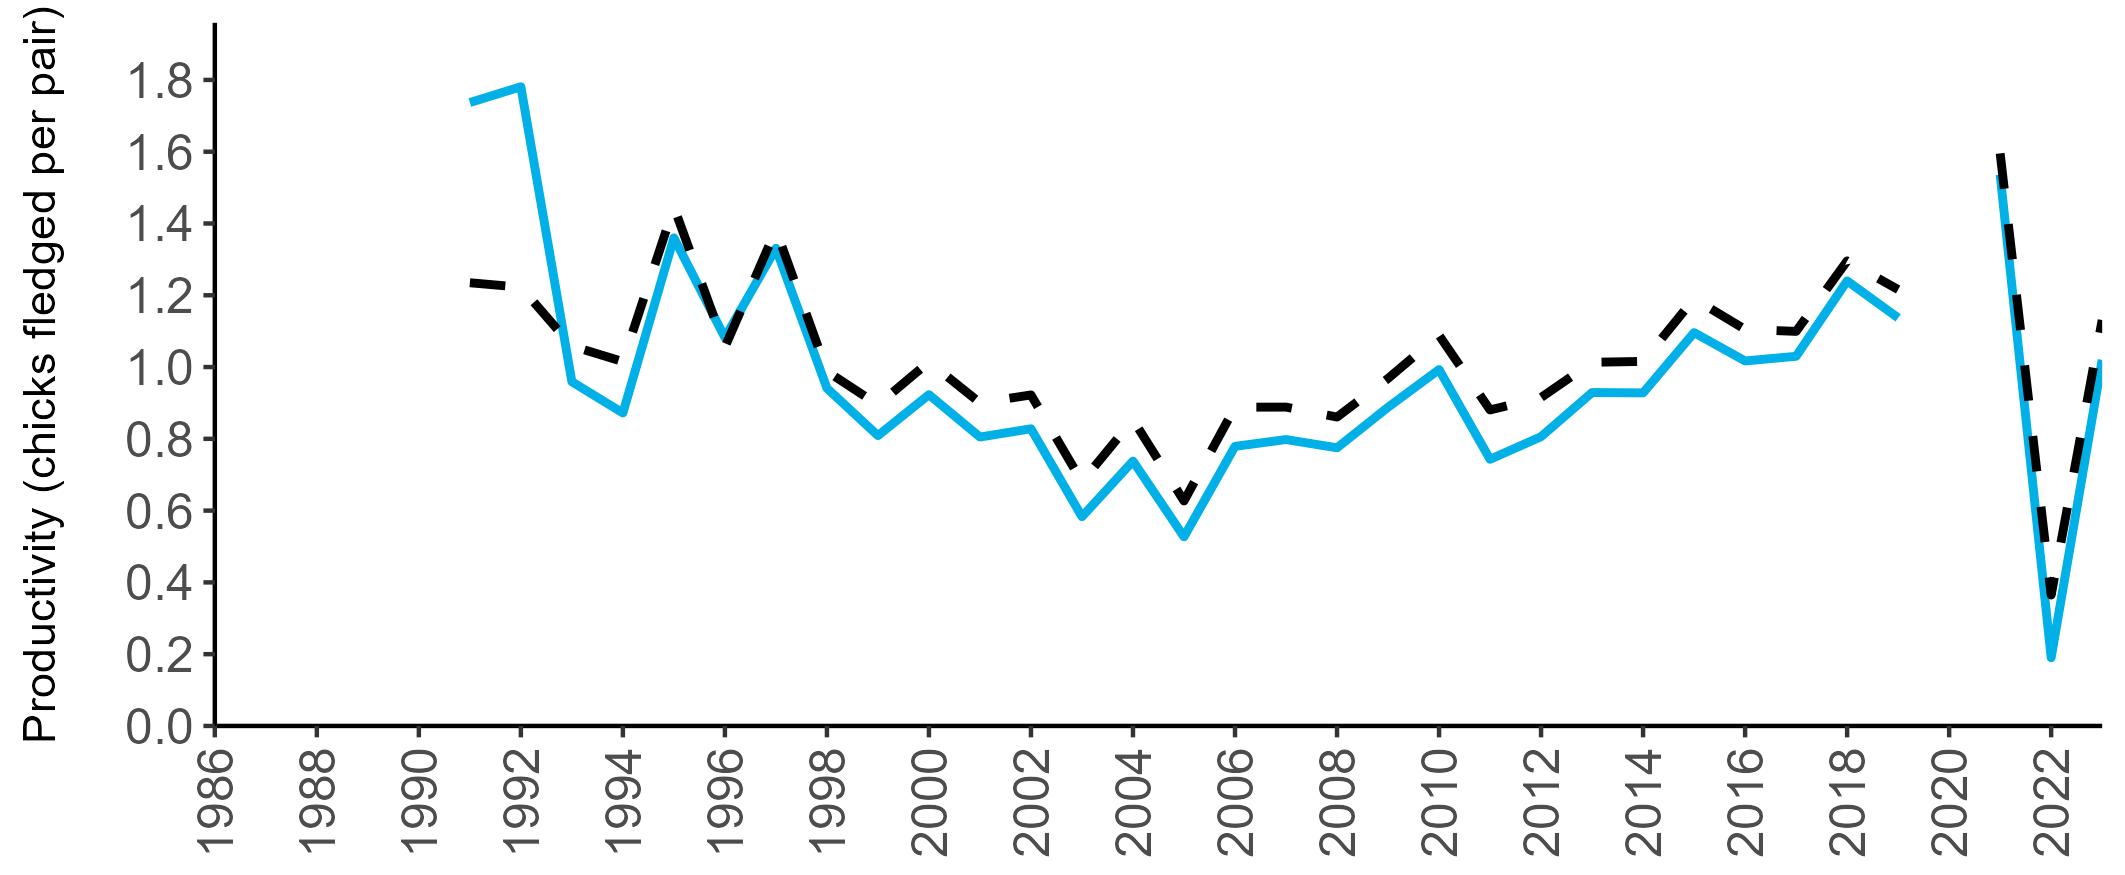
c.12%
ssp. tridactyla
Red-listed
Red-listed (I)
Abundance: Decline
Productivity: 0.75
Colony Count sites: 122
Breeding Success sites: 25
Vulnerable Lifespan: 12 years
Breeding age: 4 years
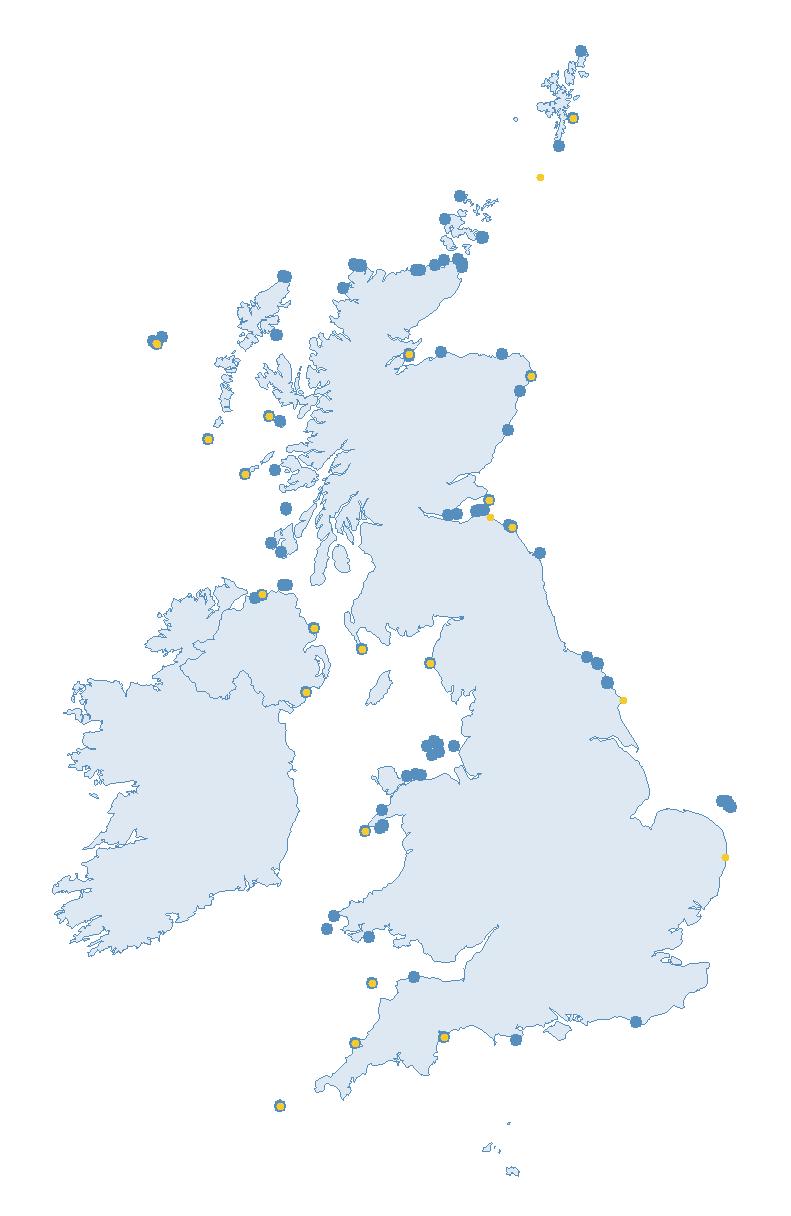
Britain and Ireland host approximately 6% of the global breeding population of Kittiwake, and around 12% of the subspecies tridactyla (Burnell et al. 2023). Kittiwake are thought to be the most numerous gull in the world (JNCC 2021).
Breeding colonies for Kittiwake are widely distributed around the British and Irish coastline, wherever suitable nesting habitats are available (Burnell et al. 2023).
Globally, Kittiwake breed across the coastlines of the North Atlantic, Arctic and North Pacific Oceans (Coulson 2011).
In winter they are generally oceanic, with some individuals shown to travel over 3,000 km from their nesting colonies to feeding hotspots (Bogdanova et al. 2011; Burger et al. 2016). Despite this, during the winter, they can be seen around British and Irish coastlines (del Hoyo et al. 1996) as some birds appear to stay close to their nesting colony during the non-breeding season (Frederiksen et al. 2012).
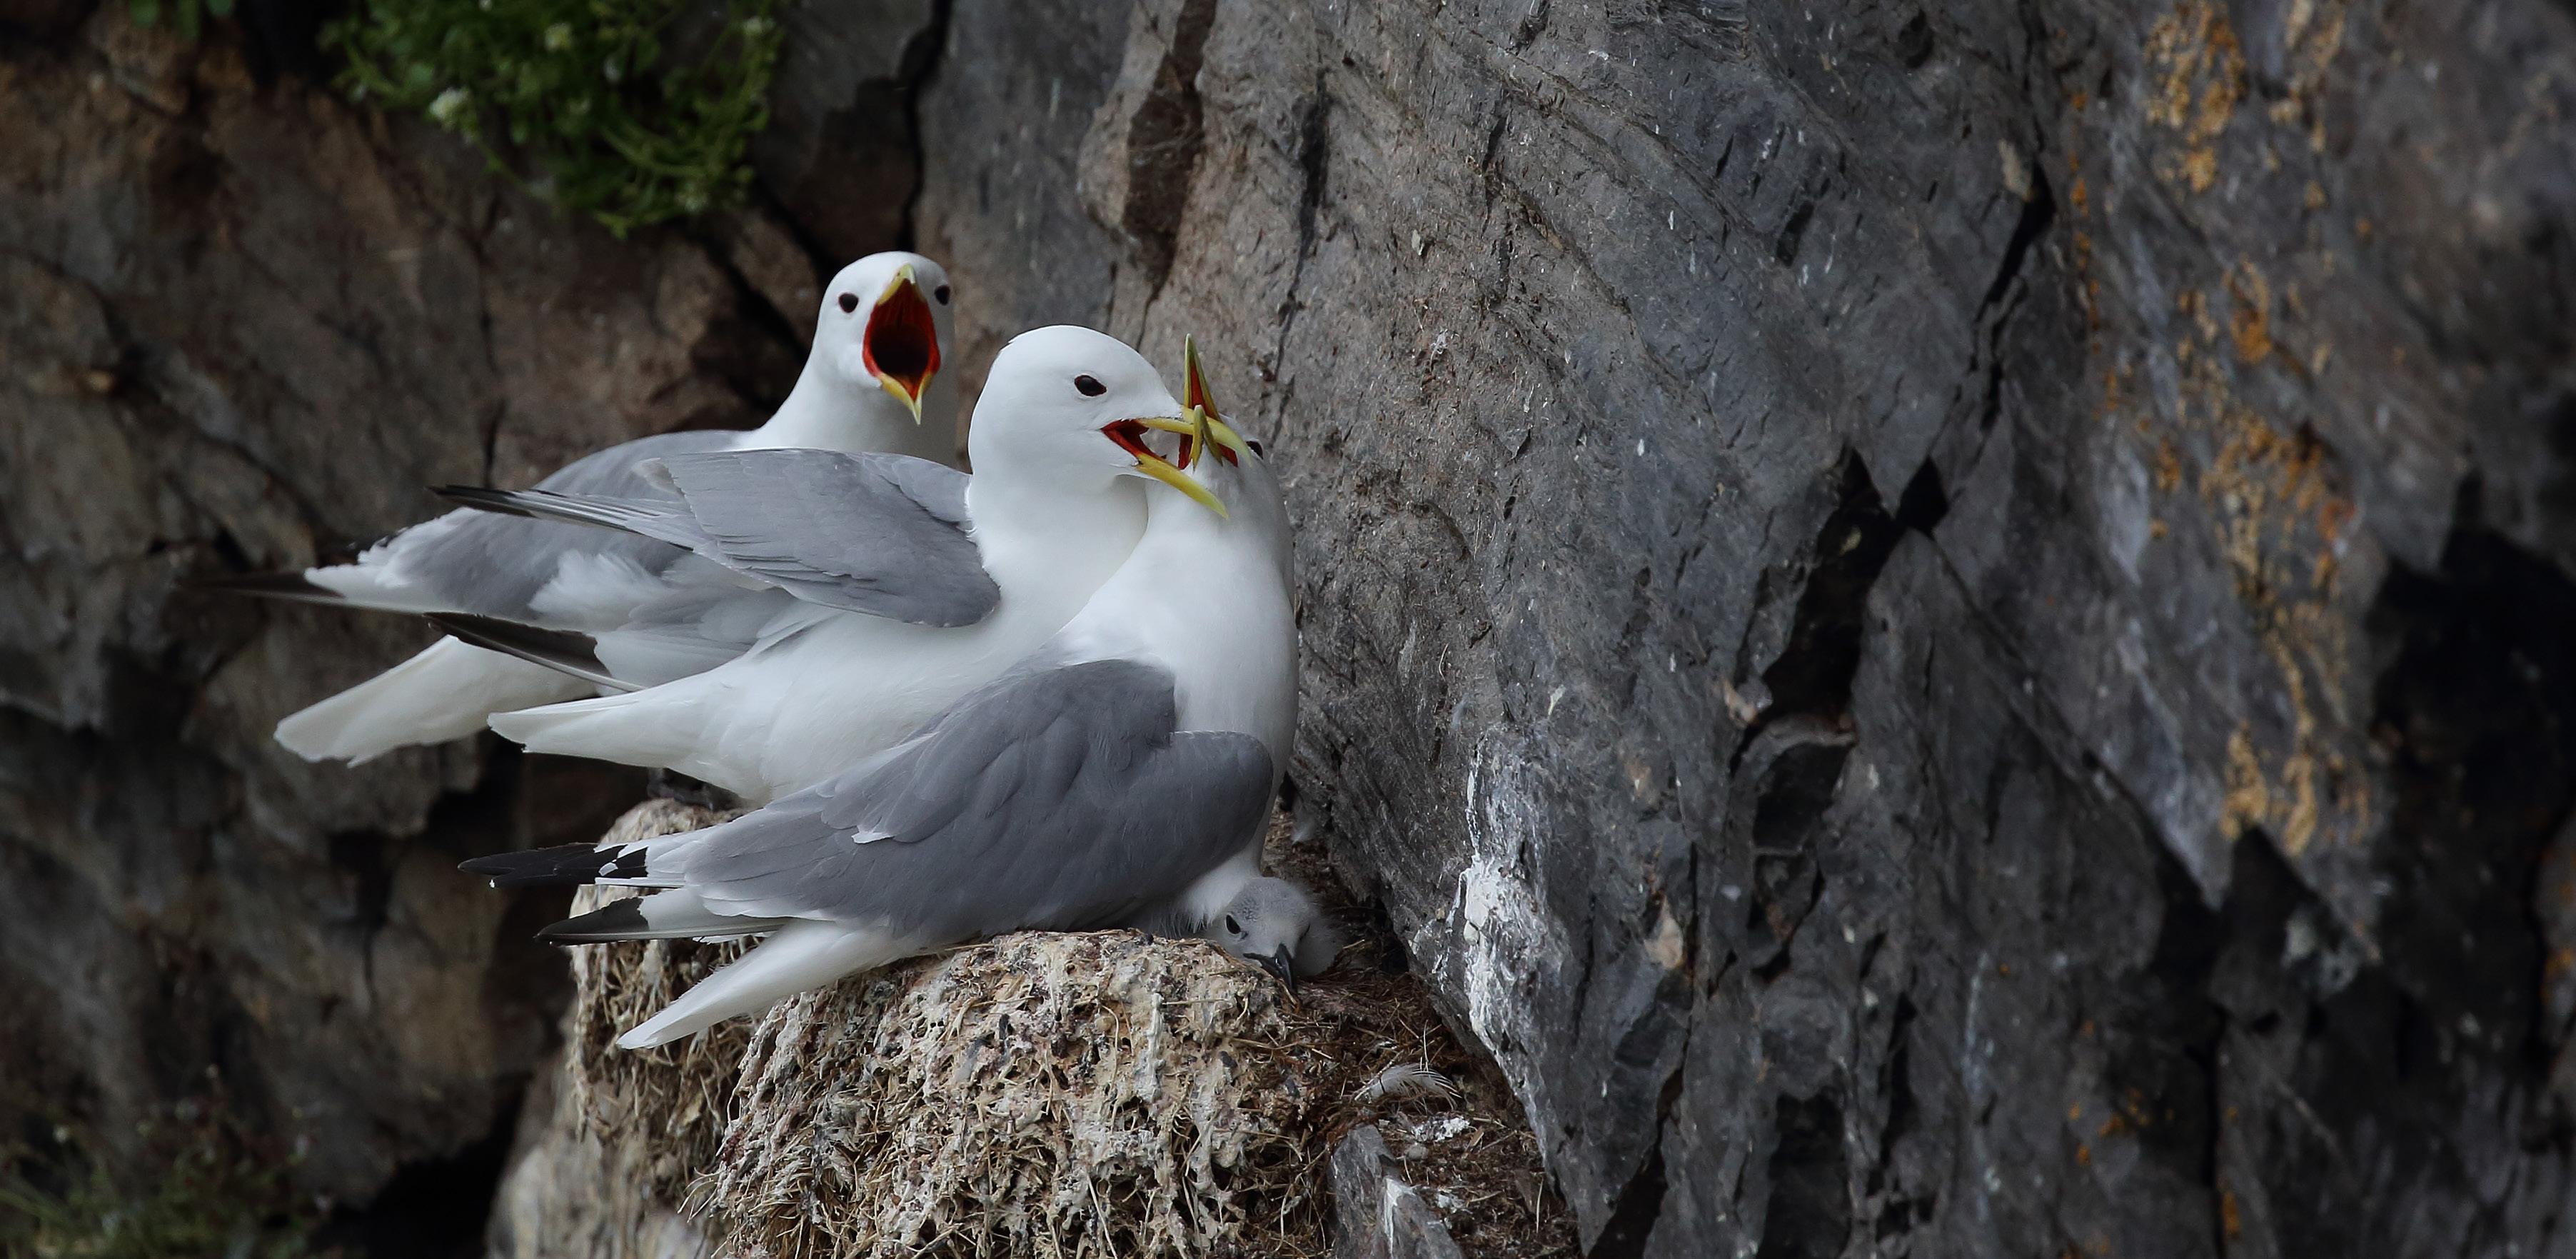
Their foraging range during the breeding season typically covers tens of kilometres (Daunt et al. 2002; Trevail et al. 2019).
Kittiwake nest on narrow ledges on vertical rocky sea-cliffs or, less commonly, on artificial structures, e.g. bridges, buildings and offshore oil installations. The nest is made of mud, lined with grass and seaweed, and holds up to three eggs per brood (Coulson 2011; del Hoyo et al. 1996; JNCC 2021). Colony size can vary from a few pairs to tens of thousands, and the nests are typically evenly spaced, 30–60 cm apart (Snow & Perrins 1998).
BREEDING ABUNDANCE
The declines in SMP abundance trends for Kittiwake since 2000 (Table 30) are broadly similar to those reported by the Seabirds Count census in most regions (Burnell et al. 2023). The decrease of 32% for the UK recorded by the SMP over this period is less severe than the decline of 43%
Kittiwakes are surface feeders and plunge-dive or dip feed to catch their prey. They mainly eat small pelagic shoaling fish such as sandeels, clupeids and gadids, or invertebrates (Bull et al. 2004; Chivers et al. 2012; Swann et al. 2008; Wanless et al. 2018), but will also take offal from fishery discards (Coulson 2011).
shown by the Seabirds Count census.
The SMP 23-year trend in England showed a drop of 23%, in contrast to a minor decrease of 4% recorded between the censuses. For Scotland and Wales, declines of 40% and 48%, respectively, were recorded by the SMP since 2000, whilst the Seabirds Count census showed decreases of 57% and 34%, respectively, over a similar period (Burnell et al. 2023).
The long-term SMP abundance trends for Kittiwake all show declines since the mid 1990s, although the magnitude varies across regions (Figures 40–43). The trends for the UK and Scotland (which are closely matched, as most monitored colonies are in Scotland) declined more severely than those for England and Wales, but all have consistently remained below the 1986 baseline since the late 1990s, despite some annual fluctuations. In 2023, the index values for all regions were similar, ranging between 40% and 53% below the baseline (Table 30).
Too few Kittiwake abundance data are submitted for other regions to produce valid SMP abundance trends.
There has been considerable variation in Kittiwake productivity between both regions and years across the SMP recording period (Figure 44). All regional trends experienced an overall decline until 2008, following which productivity values increased slightly across all regions. In 2023, mean productivity estimates for the UK, Scotland and England were all similar, at between 0.71 and 0.75 chicks fledged per pair (Table 30). Productivity data were submitted for only a few sites in Wales, Northern Ireland and the Republic of Ireland in recent years, therefore the trend only
goes up to 2022 for Wales and 2019 for all-Ireland.
Too few data are submitted to the SMP on productivity of Kittiwake in other regions to calculate any meaningful average productivity values.
No systematic data on phenology have been collected as part of the SMP. However, at the Key Sites, information on diet is collected on Canna and the Isle of May (both in Scotland). Data on adult survival are also collected on Canna and Skomer
Island (Wales), and on adult annual return rates on the Isle of May.
Prior to SMP monitoring, reduced persecution during the early 20th century is thought to have allowed population increases. However, declines have occurred thereafter (Coulson 2011).
Food availability is likely to play a key role in Kittiwake population dynamics, and surface-feeding seabirds, such as Kittiwakes, are thought to be more vulnerable to changes in prey availability than
Britain, Ireland, Isle of Man and Channel Islands
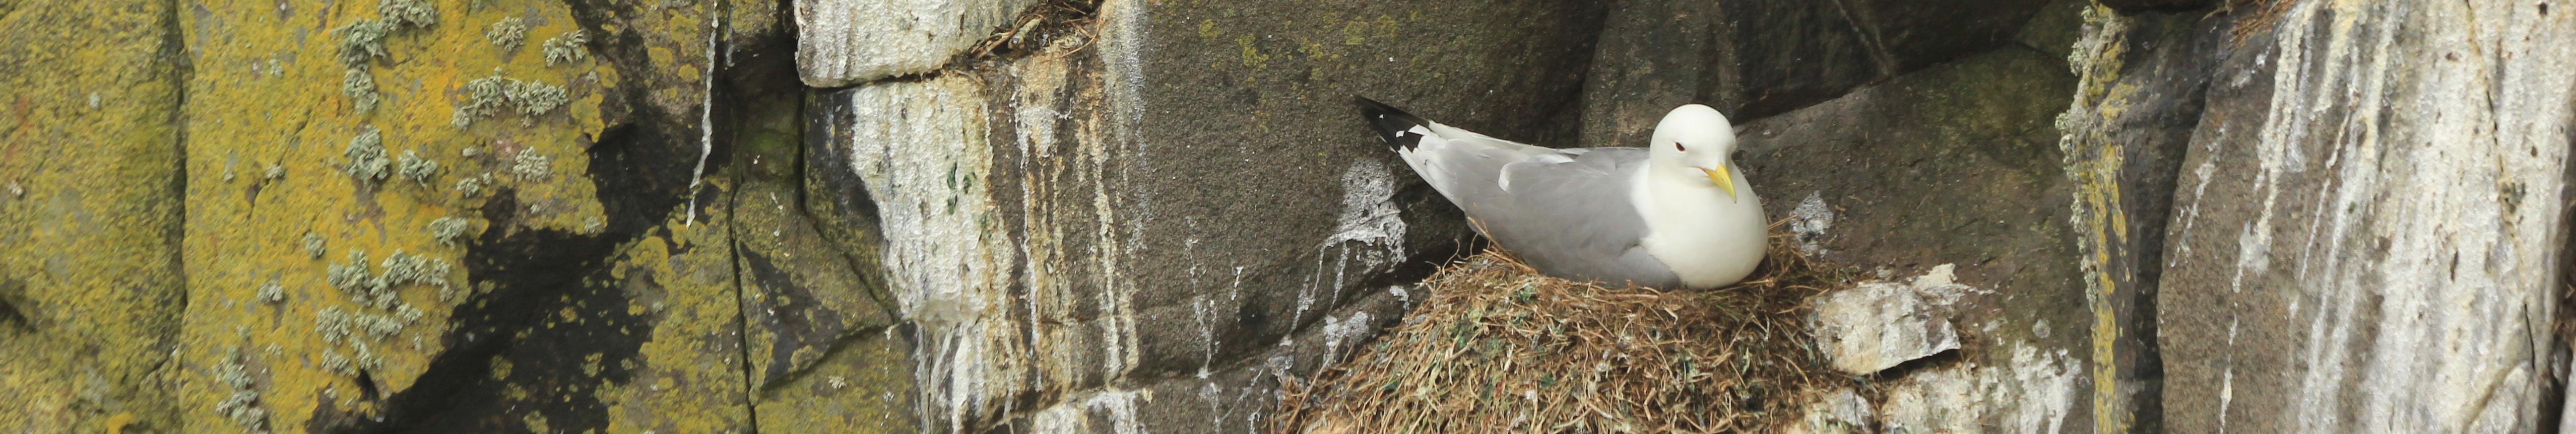
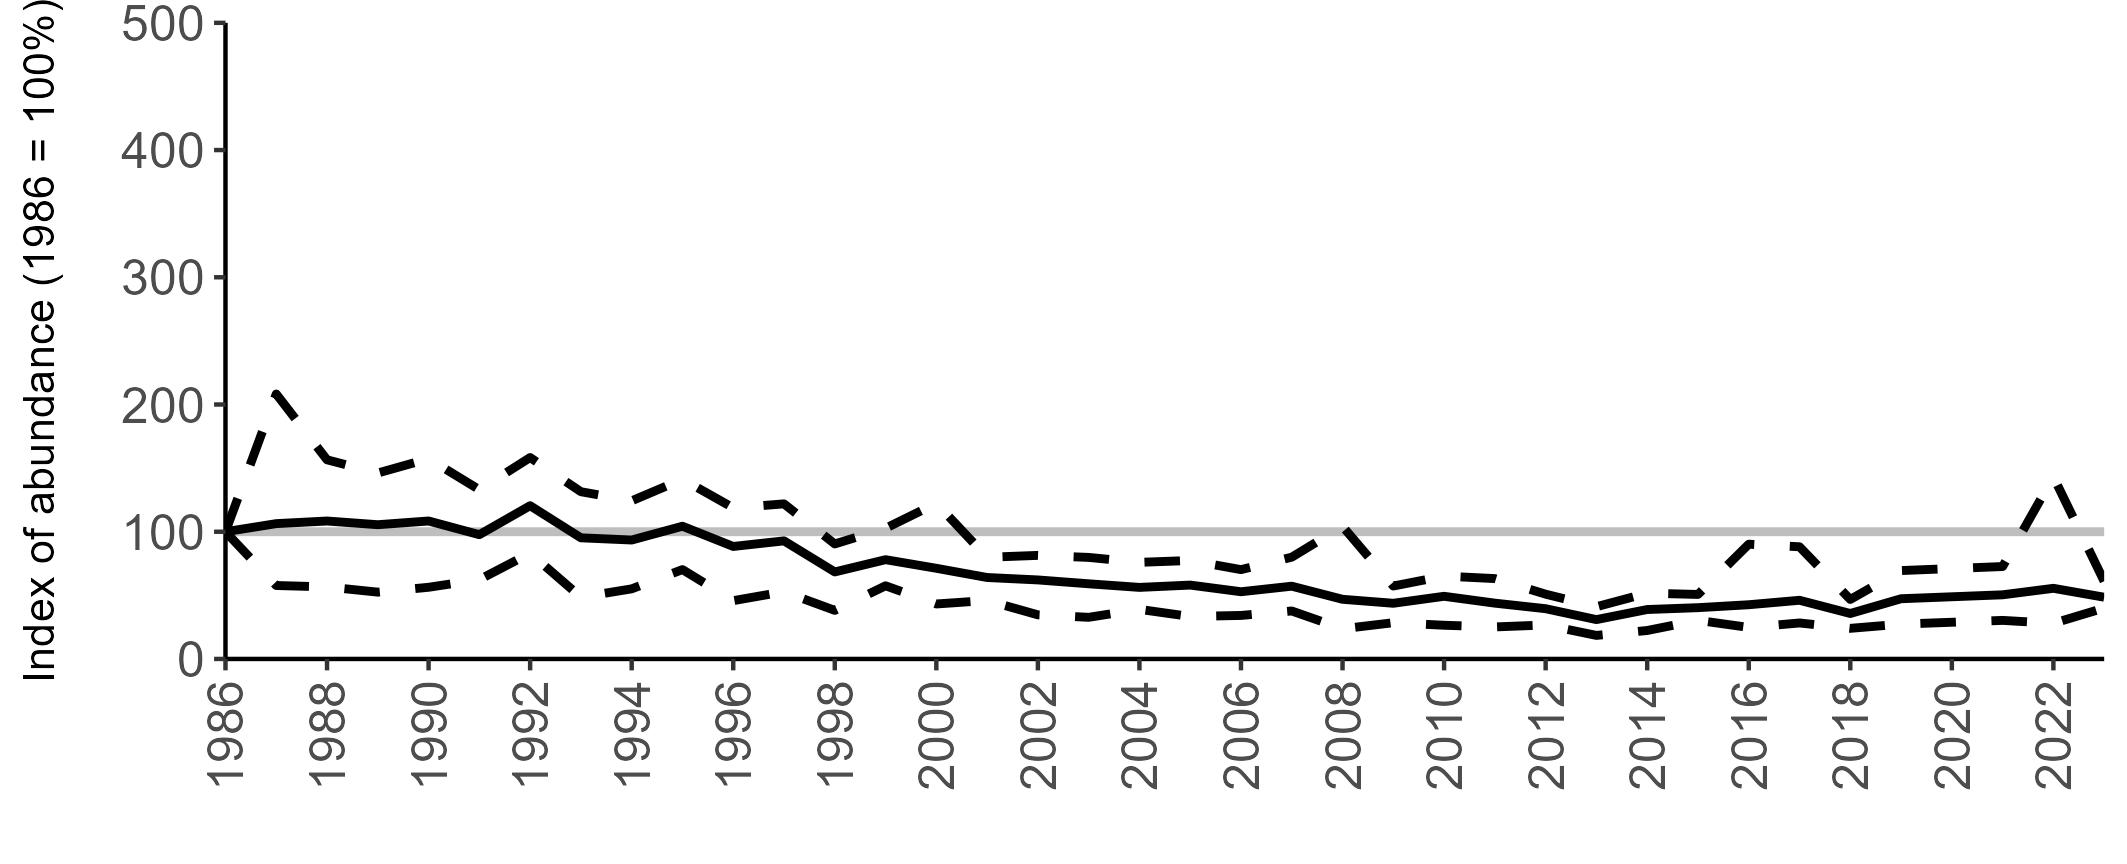
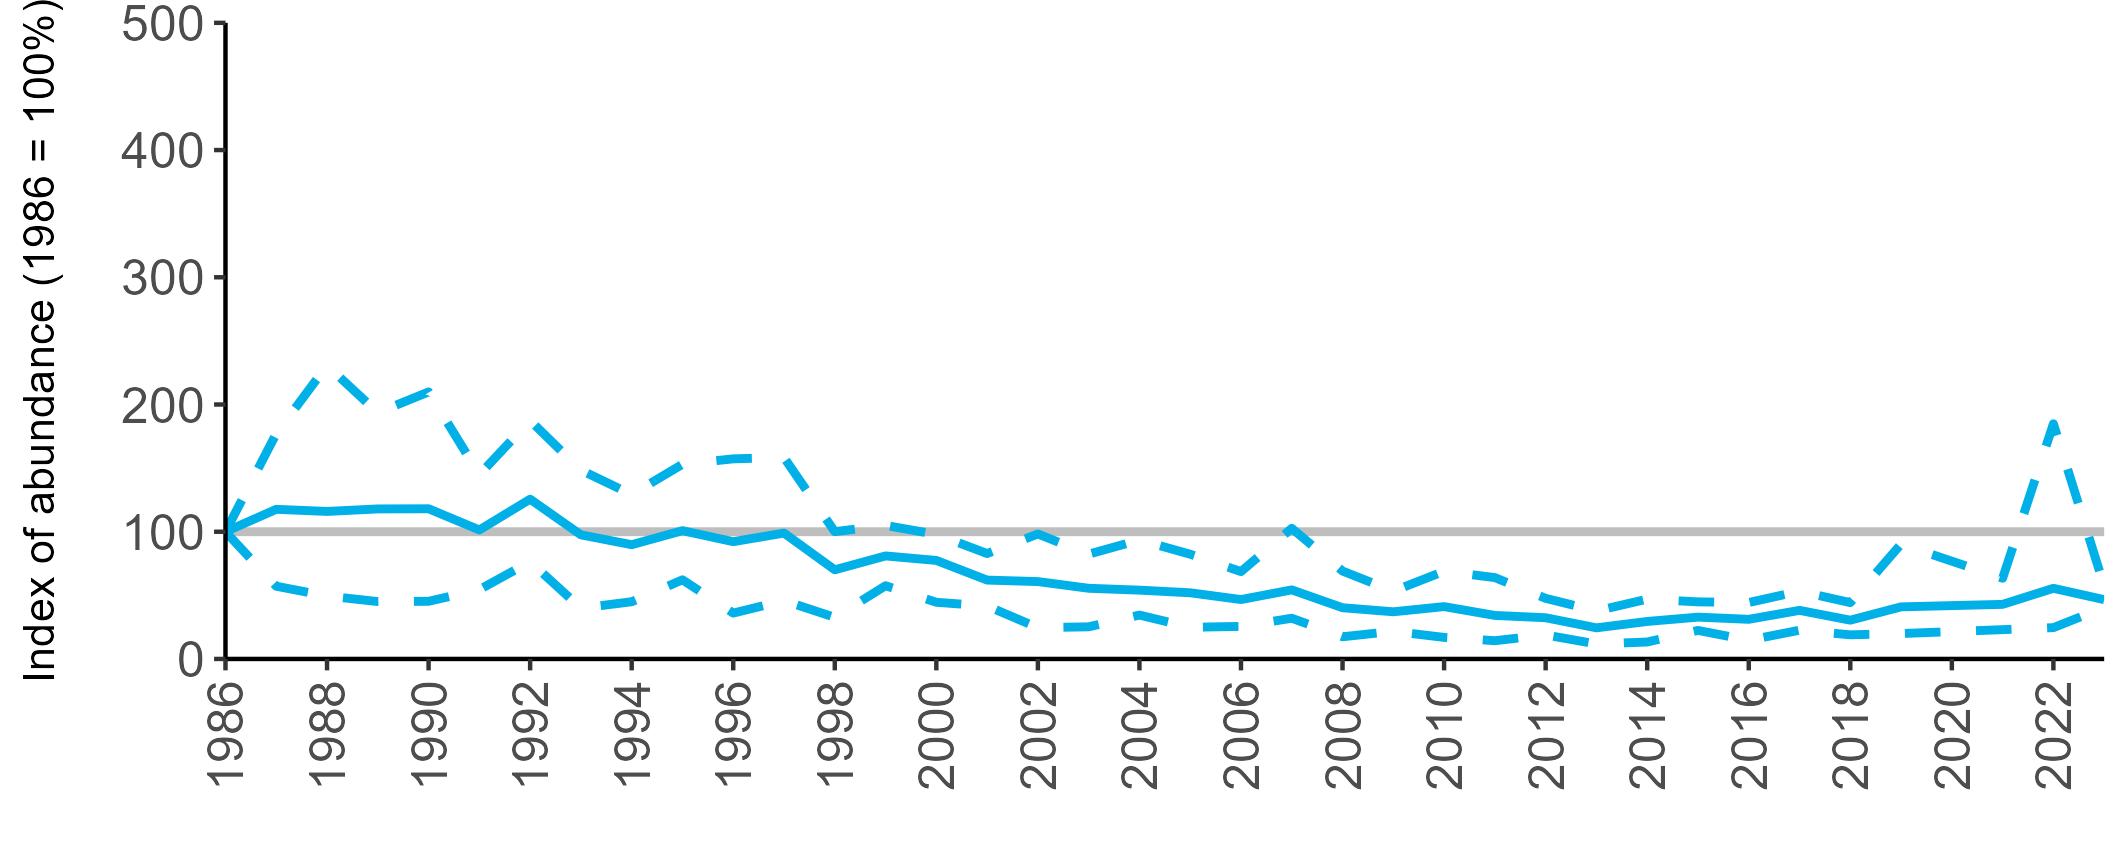
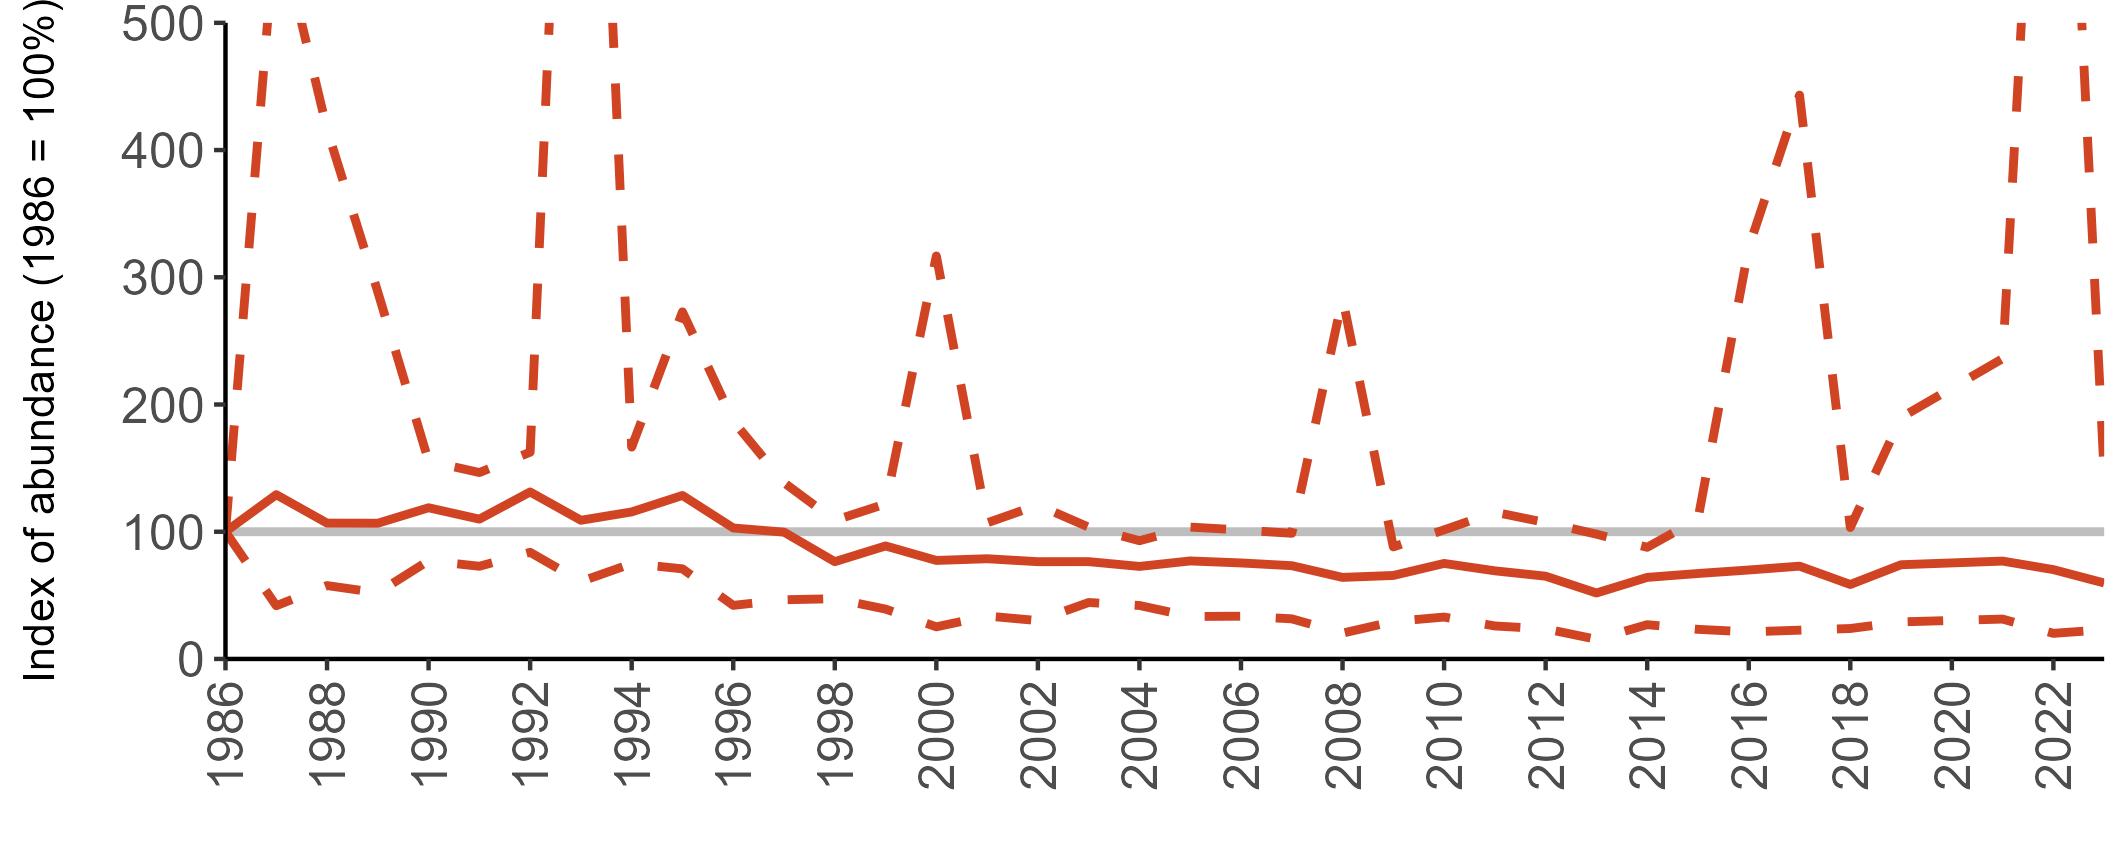
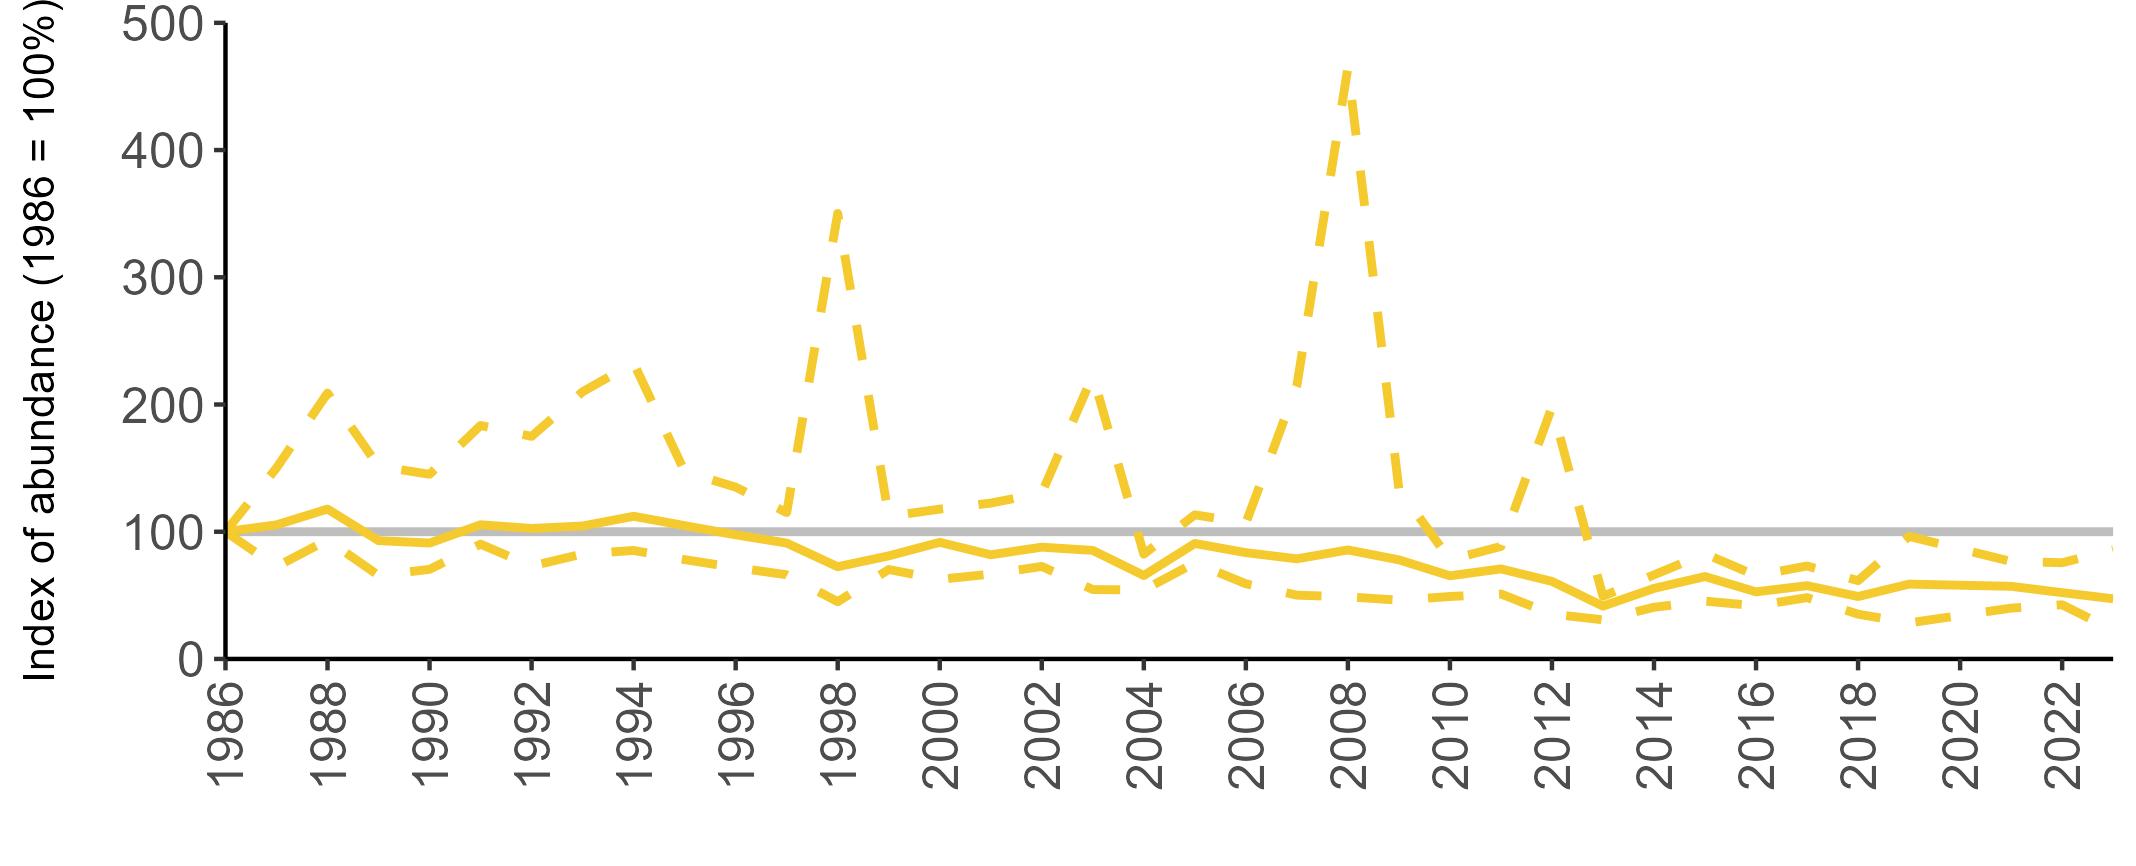
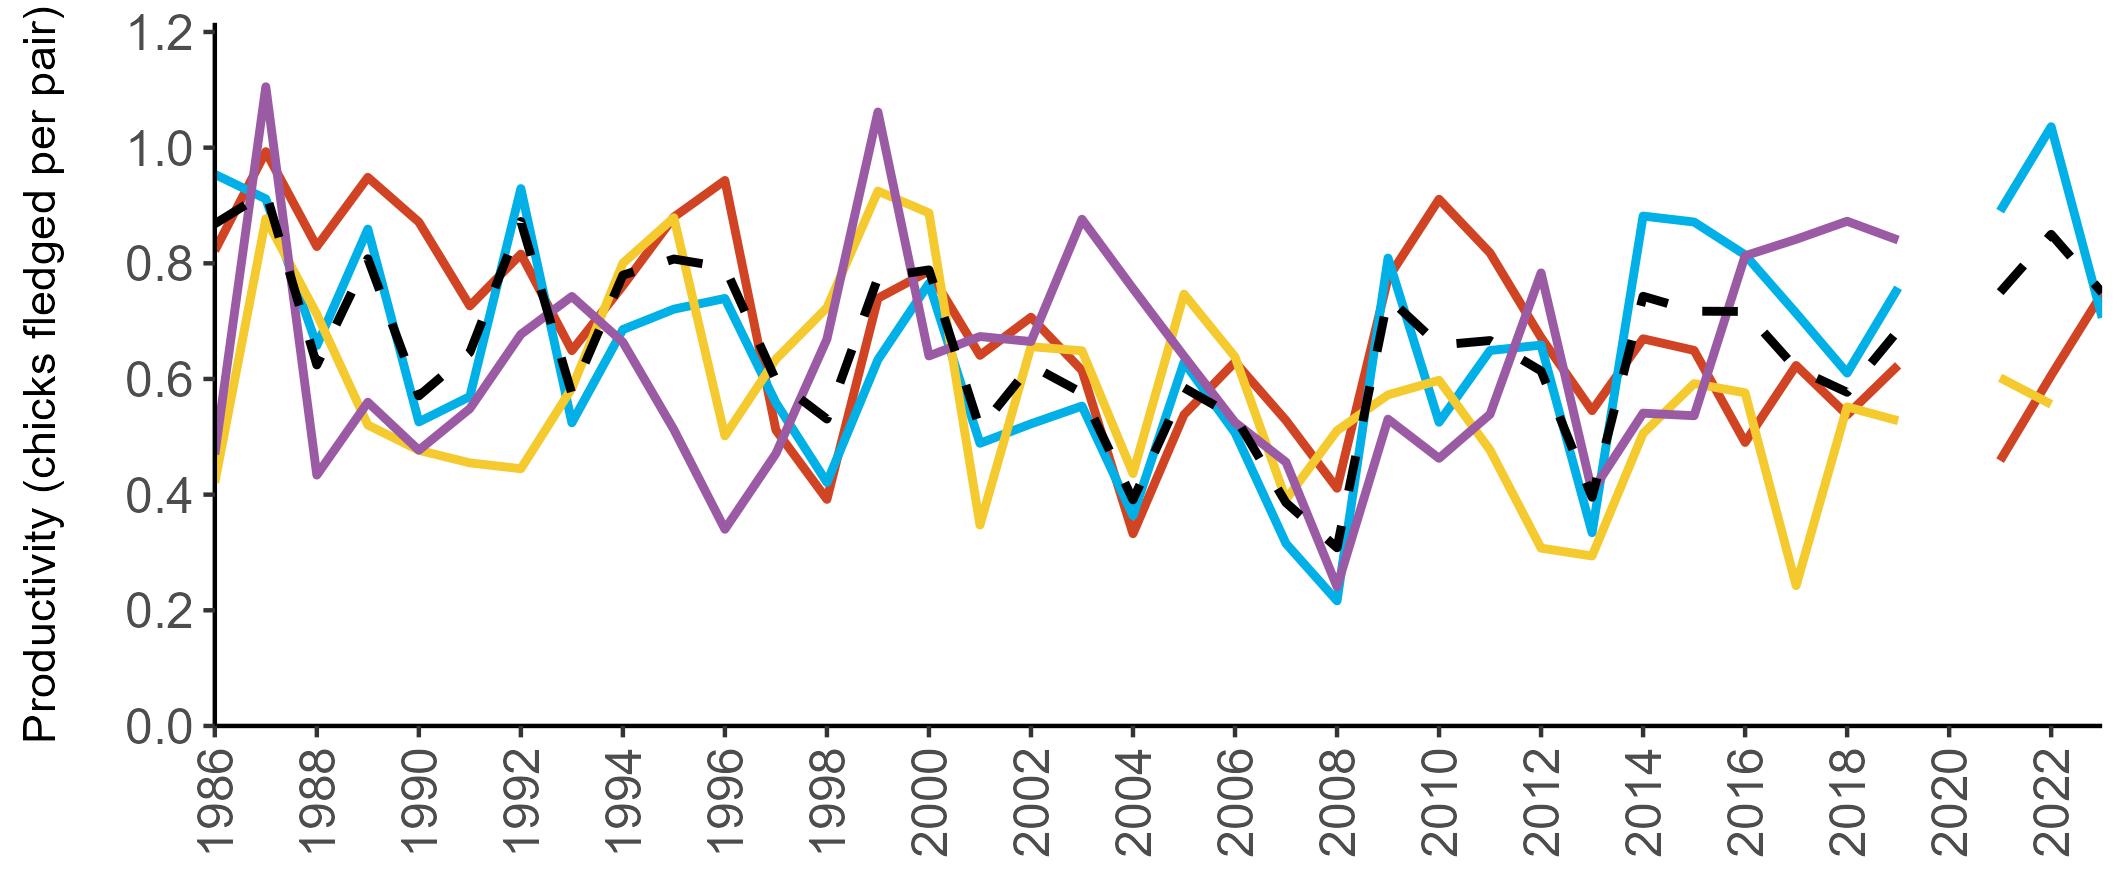
deeper diving species (Furness & Tasker 2000; Wanless et al. 2007).
Increases in sea surface temperatures due to climate change are causing changes in the distribution and timing of development of the Kittiwake’s preferred prey, the Lesser Sandeel ( Ammodytes tobianus) (Wanless et al . 2004), both directly and through indirect effects on the copepod prey of sandeels. The impacts of reduced sandeel abundance have been demonstrated in Kittiwake colonies that have traditionally relied on them. When chicks were fed on alternative prey items, due to sandeel shortages, both adult survival and chick development were reduced (Christensen-Dalsgaard et al. 2018; Paredes et al. 2014; Régnier et al. 2019; Sandvik et al. 2005; Wanless et al. 2018).
Reductions in food availability may also be caused by the presence of fisheries close to Kittiwake breeding colonies, and studies have shown that increased fishing effort in the Irish, Celtic and North Sea areas may be decreasing the amount of suitable prey, and reducing Kittiwake breeding success as a consequence (Frederiksen et al. 2007). Positive effects on breeding success have also been shown following bans on local sandeel fisheries in some areas (Searle et al. 2023).
However, the overall picture is complex and likely to differ between regions (Frederiksen et al. 2007), and both abundance trends and productivity values can vary considerably between different areas within Britain and Ireland (Burnell et al. 2023). Studies have been carried out on the Isle of May (Scotland) which show negative correlations between adult survival and breeding success and increasing sea surface temperatures (Frederiksen et al. 2004), but this link is not clear for some colonies in other areas (Cooke et al. 2014; Carroll et al. 2017; EerkesMedrano et al. 2017).
Climate change can also impact Kittiwake breeding success through an increase in extreme weather events, which can result in nests being washed away during heavy summer rainfall, or hinder foraging ability in winter storms (Clairbaux et al. 2021; Newell et al. 2015; Stubbings et al. 2017).
Further pressures include potential foraging displacement and collision risk following the development of offshore wind farms (Drewitt & Langston 2006; Masden et al. 2010).
Cases of HPAI have been recorded at a number of Kittiwake colonies in recent years (Falchieri et al. 2022; Tremlett et al. 2024), which has the potential
to cause impacts on local population levels in areas which have been severely affected. However, it is also possible that HPAI could have a net positive effect on Kittiwake populations in areas such as Orkney and Shetland, where numbers of Great Skua, which can heavily predate both Kittiwake adults and chicks, have dramatically declined due to HPAI (Burnell et al. 2023; Heubeck et al. 1997; Heubeck 2002; Votier et al. 2004).
Management of fisheries, such as the closure of industrial sandeel fishing in English and Scottish waters, will increase prey availability and is likely to be beneficial to Kittiwake populations e.g. the breeding success rate of Kittiwakes on the Isle of May (Scotland) was shown to increase following the closure of a local sandeel fishery (Daunt et al. 2008; Frederiksen et al. 2004).
Identification of key Kittiwake foraging areas through tracking technologies may also aid in ensuring these regions are appropriately conserved through statutory protection (Christensen-Dalsgaard et al. 2018).
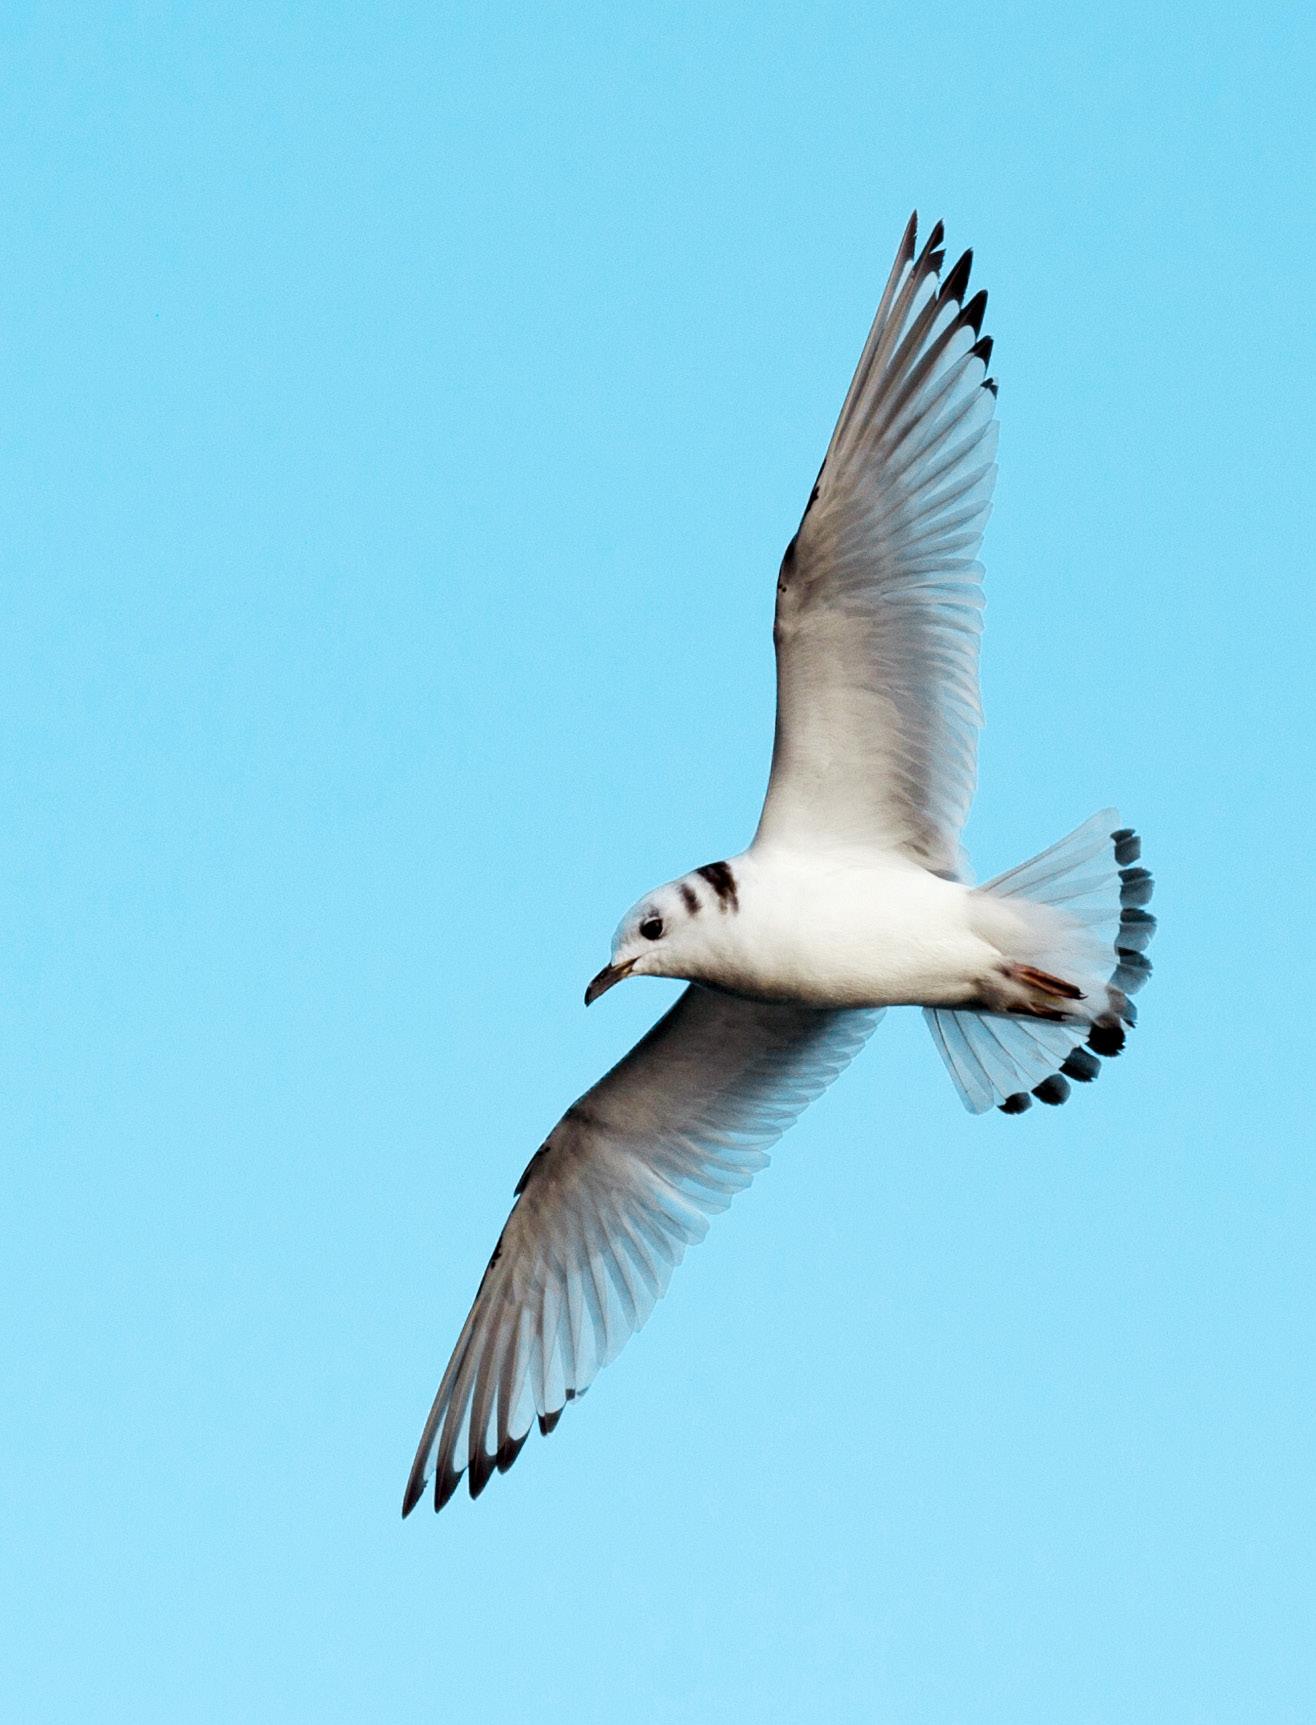
Thalasseus sandvicensis
Amber-listed
Amber-listed (I)
Least concern
Abundance: Decline
Productivity: 0.16
Colony Count sites: 18
Lifespan: 12 years
Breeding age: 3 years
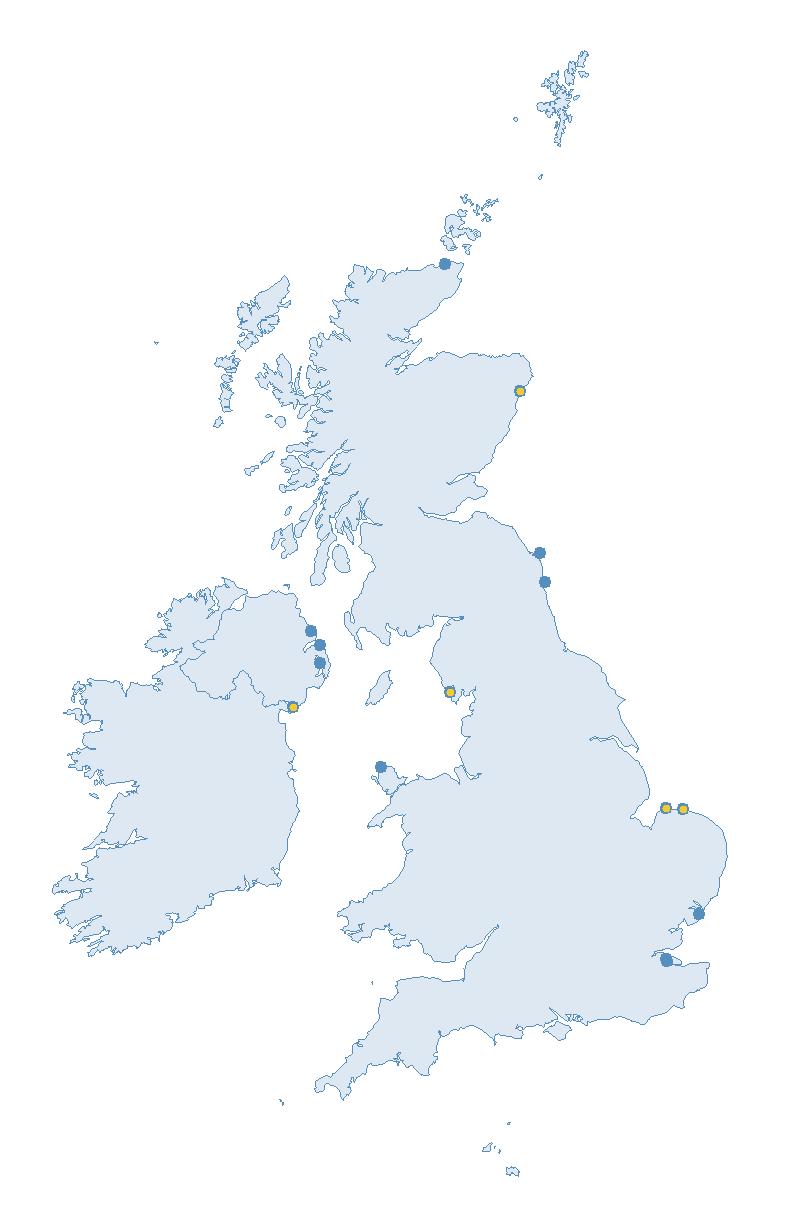
Britain and Ireland host approximately 9% of the world’s breeding Sandwich Terns (Burnell et al. 2023). The oldest known Sandwich Tern reached 30 years, 9 months and 14 days (BTO 2023a).
Sandwich Terns are found in a relatively small number of large breeding colonies around the coastlines of Britain and Ireland, with a stronghold in East Anglia (BTO 2023a; Burnell et al. 2023).
Although overall colony distributions in Britain and Ireland have remained largely the same over time, they are a species known to frequently switch breeding sites (Wernham et al. 2002).
Globally, they breed in western Europe and around the Mediterranean, Black and Caspian Seas (del Hoyo et al. 1996).
Most are migratory, and British and Irish birds are known to overwinter around the West African coast, some travelling over 4,000 km to their wintering grounds (BTO 2023a; Wernham et al. 2002).
Sandwich Terns feed mainly by plunge-diving up to 2 m in depth, preying on small fish, marine worms, shrimp and nestling shorebirds (del Hoyo et al. 1996). During the breeding season, the dominant prey
items are Atlantic Herring (Clupea harengus), European Sprat (Sprattus sprattus) and sandeel (Green 2017).
Sandwich Tern nesting colonies in Britain and Ireland vary in size and location from year to year. However, they favour habitats that are coastal, including low-lying islets and spits, remote dunes, or around bays or brackish lagoons, and they typically nest in high densities (JNCC 2021).
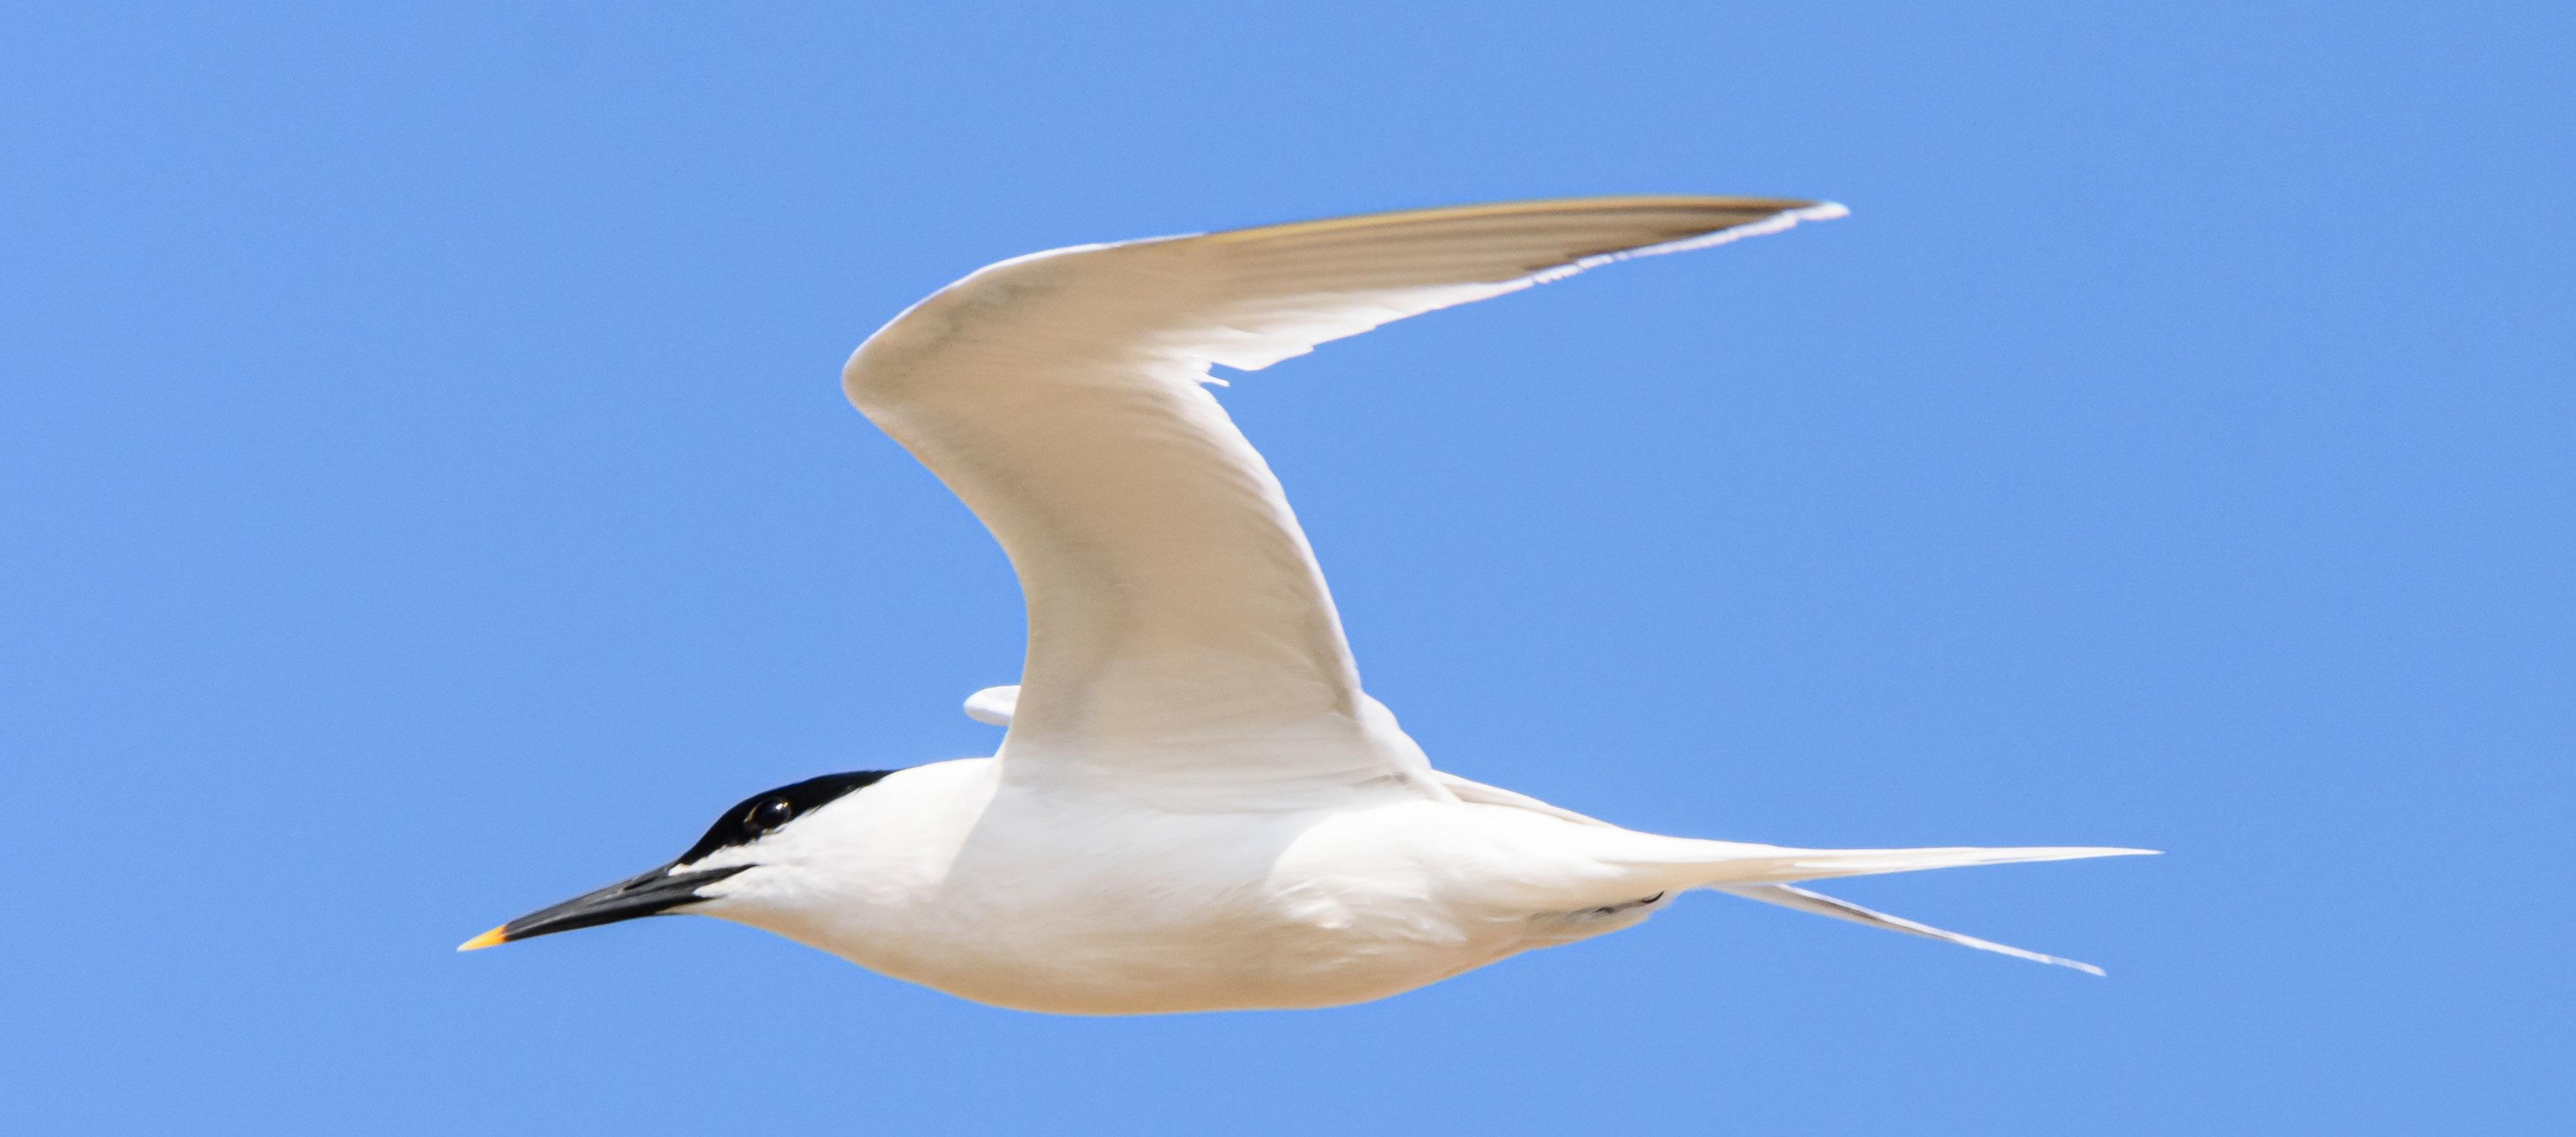
Breeding Success sites: 6 Table 32:
Nests are unlined scrapes in dry ground on shingle or low herbage, and they avoid dense or tall vegetation. The usual clutch size is 1–2 eggs, occasionally three (BTO 2023a).
BREEDING ABUNDANCE
At the UK level, the Sandwich Tern SMP abundance trend of -8% since 2000 (Table 32) is largely in agreement with the relatively stable trend of a 4% increase reported between the Seabirds Count and Seabird 2000 censuses (Burnell et al. 2023). However, for England, the SMP trend shows a decline of 21% since 2000 (Table 32), compared with a 5% increase measured between the censuses (Burnell et al. 2023), c.9%
potentially a consequence of the 2022 HPAI outbreak, which occurred after the census period (see pages 8–11).
Most Sandwich Tern colonies monitored as part of the SMP are in England, therefore the UK and England long-term abundance trends are closely matched (Figures 45 & 46). Following an overall decline in the trends between 1986 and 2008, there was a gradual increase from 2010 to the peak index values in 2021. The spike in the index in 2009 was due to an influx of Sandwich Terns, apparently from continental Europe, nesting at Minsmere (Suffolk) (JNCC 2021). However, the trends have since declined to values of 14% and 26% below the 1986 baseline for the UK and England, respectively, in 2023 (Table 32). This is likely to have been a result of the 2021/22 HPAI outbreak, which severely impacted Sandwich Tern populations (see pages 8–11).
Too few data are currently submitted to the SMP in Scotland, Northern Ireland and the Republic of Ireland to allow for the calculation of meaningful abundance trends for these countries.
SMP productivity trends for the UK and England are relatively similar (Figure 47), as most Sandwich Tern productivity data are collected in England. The productivity trend for Scotland, however, has values generally considerably lower than for the other regions, particularly prior to the mid 2000s. Within all the regions for which trends can be produced, there are considerable fluctuations in values between years. Gaps in the trends for all-Ireland and Scotland, including since 2019, reflect years where insufficient data were submitted to the SMP to produce robust trends.
Following a peak in productivity values across all regions in 2000, there was a general decline in trends up to 2014. This was followed by an increase
for the UK and England until 2017, whilst the trend for Scotland was more stable, albeit with large annual fluctuations (Figure 47).
In 2023, mean productivity estimates were similarly low for the UK and England, with 0.16 and 0.18 chicks fledged per breeding pair, respectively (Table 32). HPAI is likely to have been a factor in the decline in productivity since 2021.
Too few data are submitted to the SMP on productivity of Sandwich Terns in other regions to allow for calculation of productivity values.
No data have been collected as part of the SMP.
The Sandwich Tern population has been relatively stable over the course of the SMP monitoring period, but local fluctuations can be experienced due to colony movements in response to human disturbance, reductions in food availability, predation pressure or habitat changes (Burnell et al. 2023; Garthe & Flore 2007; Gochfield et al. 2018; Wernham et al. 2002). Additional human impacts on Sandwich Terns include the trapping of birds in their wintering grounds (Stienen et al. 1998), and hunting of adults which has caused severe declines in some areas of their global range (Gochfield et al. 2018).
Red Foxes (Vulpes vulpes), European Badgers (Meles meles) and European Otters (Lutra lutra) are known to
Abundance (AON) Seabird
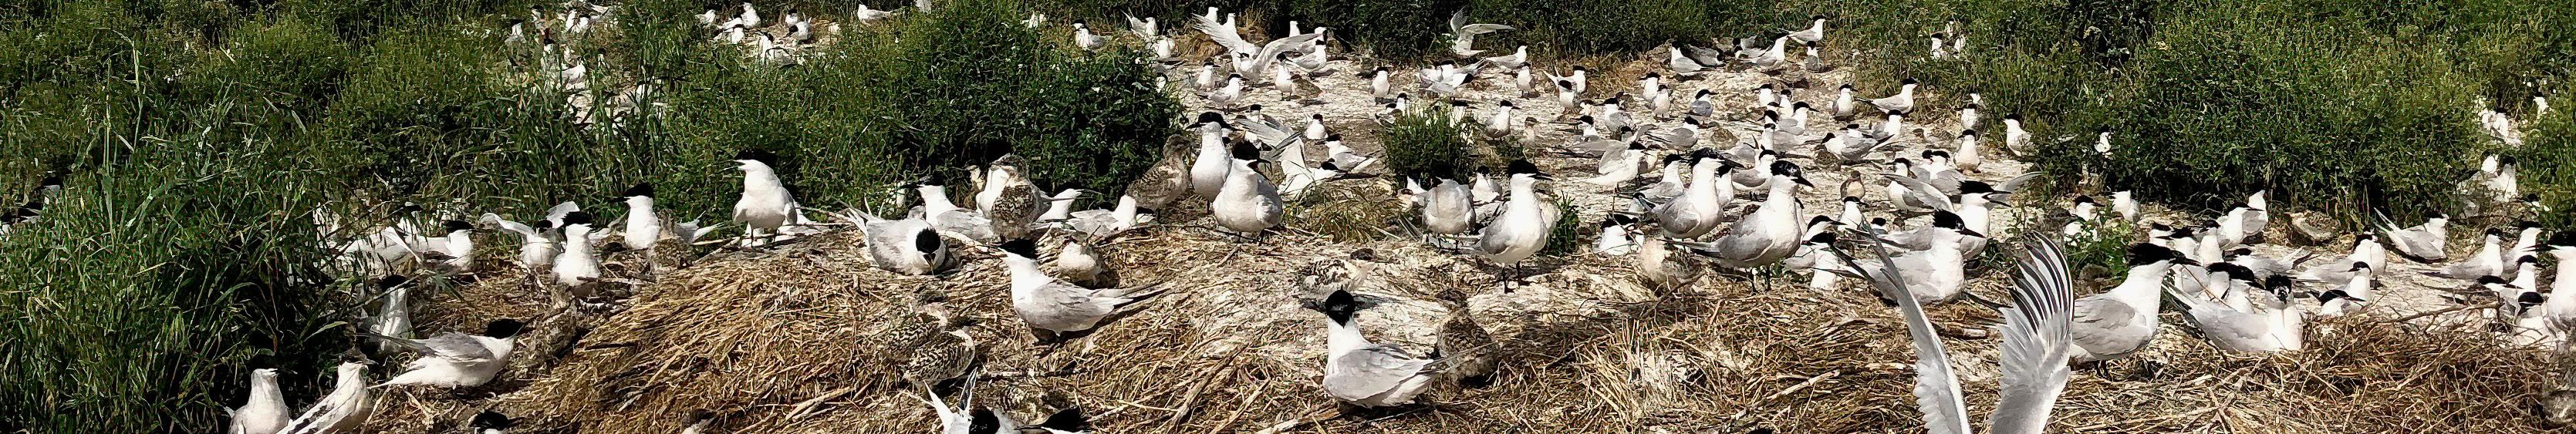
take Sandwich Tern eggs and chicks (Ratcliffe et al. 2000; Short 2014).
Although large gull species will predate tern eggs and young and take food from returning adult birds provisioning chicks (kleptoparasitism), the benefits of nesting near these larger species, which keep other predators at bay, is thought to outweigh the costs (Stienen 2006).
Climate change has the potential to impact Sandwich Tern populations in Britain and Ireland in the future through the loss of suitable habitat and changes in prey availability. The predicted increases in extreme weather events, alongside erosion, sea level rise and extreme high tides are all potential threats (Johnston et al. 2021). The strong winds associated with increased storminess may also
reduce their foraging efficiency, impacting on their ability to maintain body condition and feed chicks (Burnell et al. 2023; Taylor 1983).
In an attempt to combat climate change, the number of offshore wind farms is increasing, and this has the potential to cause mortalities in Sandwich Terns through collisions with turbines (Furness et al. 2013).
HPAI caused severe population declines during 2021–22, with high mortality rates being recorded at colonies across northern Europe (Knief et al. 2024), a 35% decline in the population at surveyed sites in the UK between 2015–21 and 2023 (Tremlett et al. 2024) and mass mortality at colonies in the Netherlands (Rijks et al. 2022)
Introduction of legislation to reduce the level of egg collecting and hunting of adults in the early 1900s successfully led to an increasing population trend between the 1920s and mid 1980s (JNCC 2021), prior to SMP monitoring.
The most effective conservation measures for Sandwich Terns are likely to be the continuation of current local management measures, such as predator fencing, site patrols to restrict recreational disturbance (Short 2020), and habitat management to maintain or create suitable nesting habitats (Burgess & Hirons 1992; Fasola & Canova 1996). Decoys can also be used to attract individuals to new, suitable, nesting habitats (del Hoyo et al. 1996).
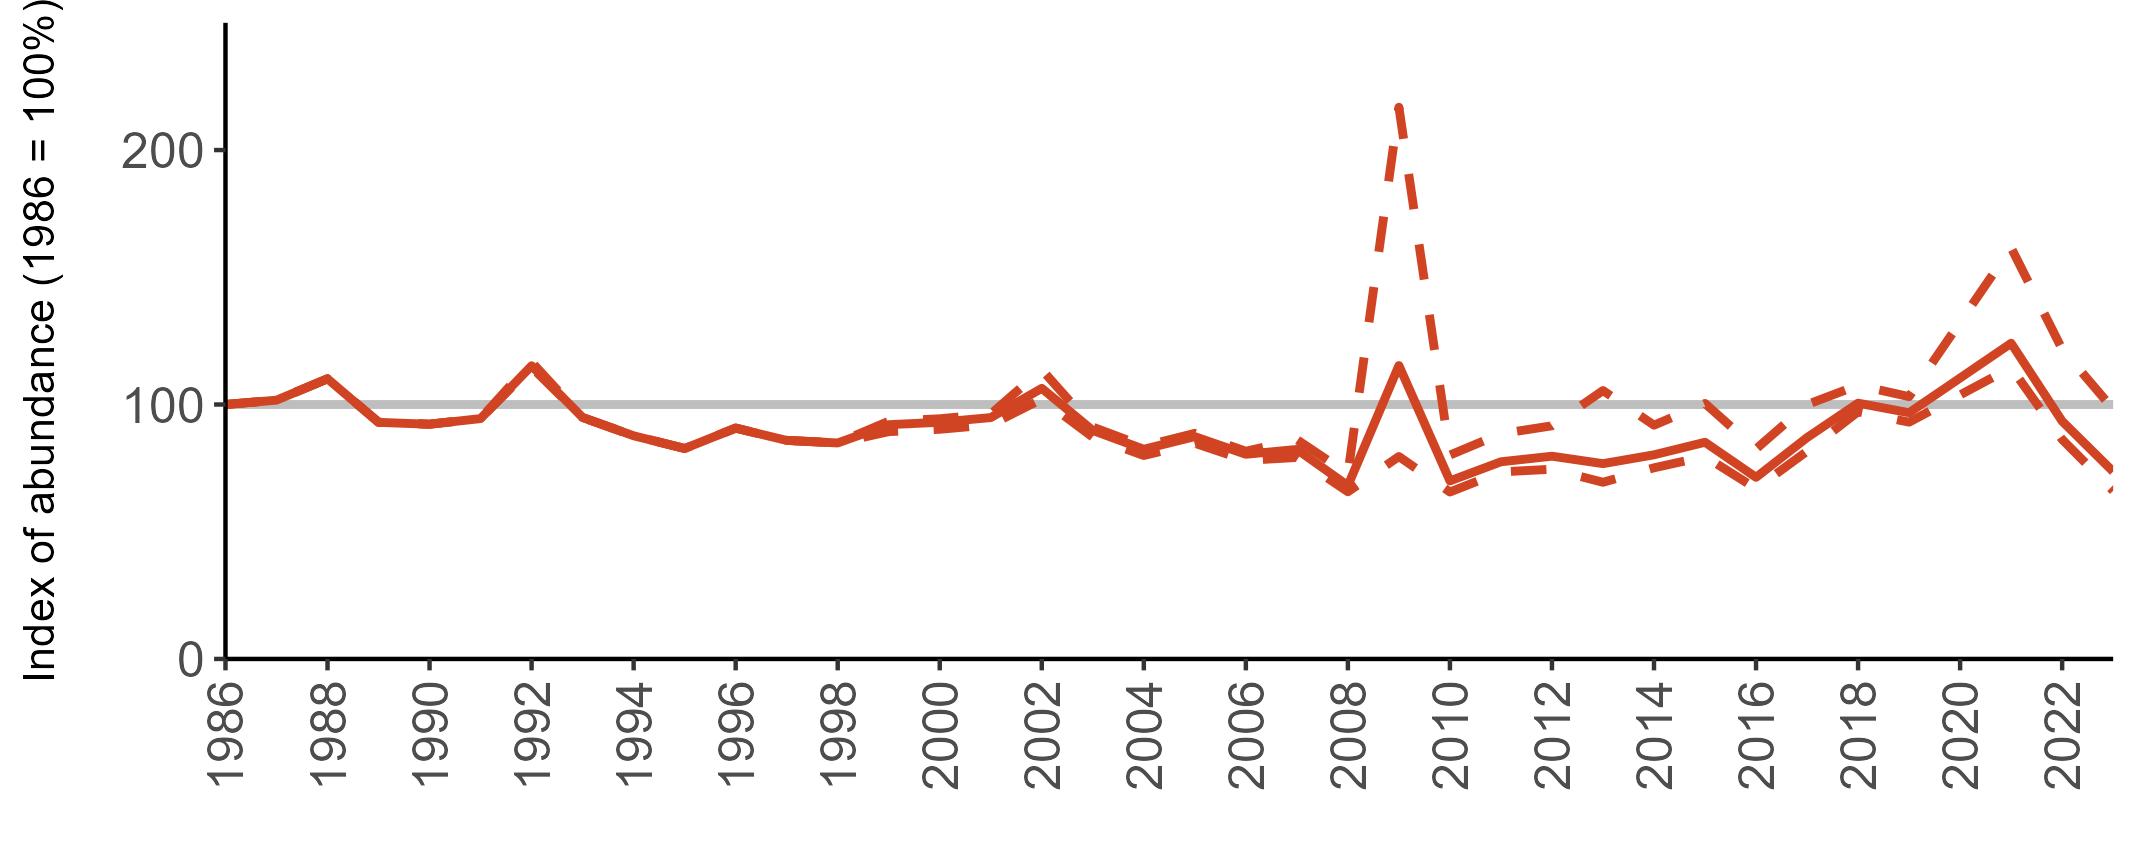
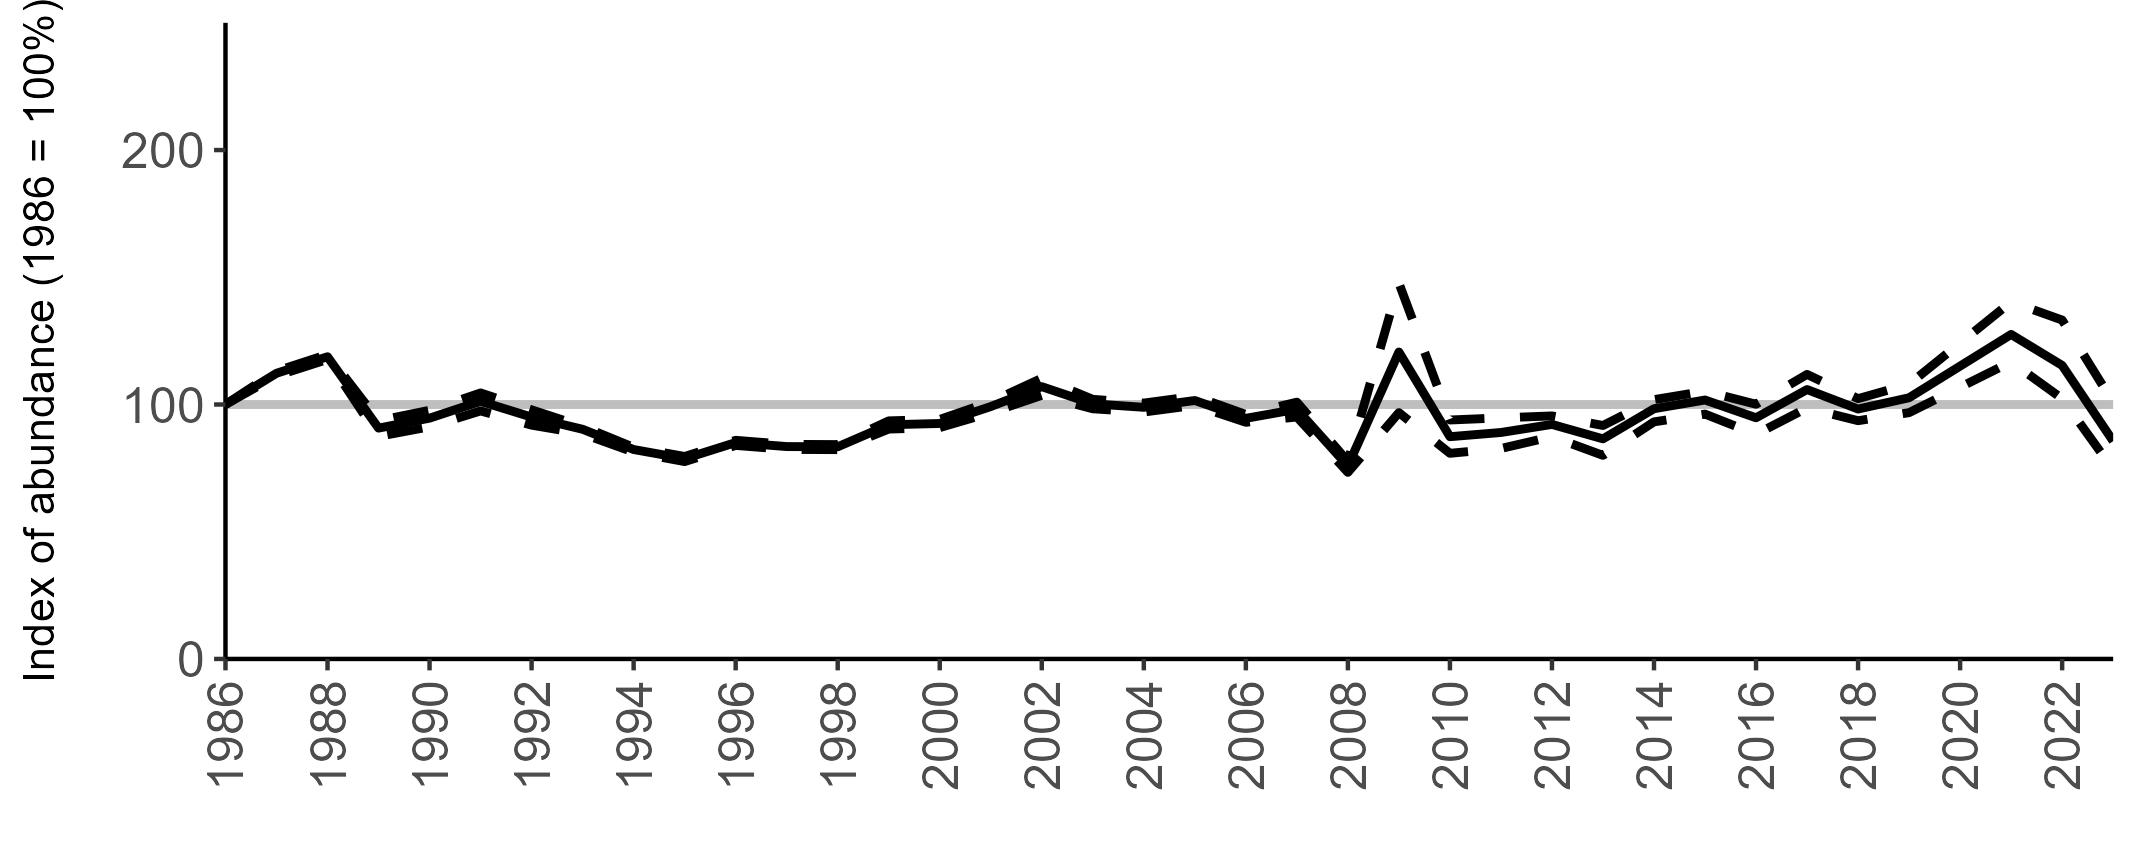
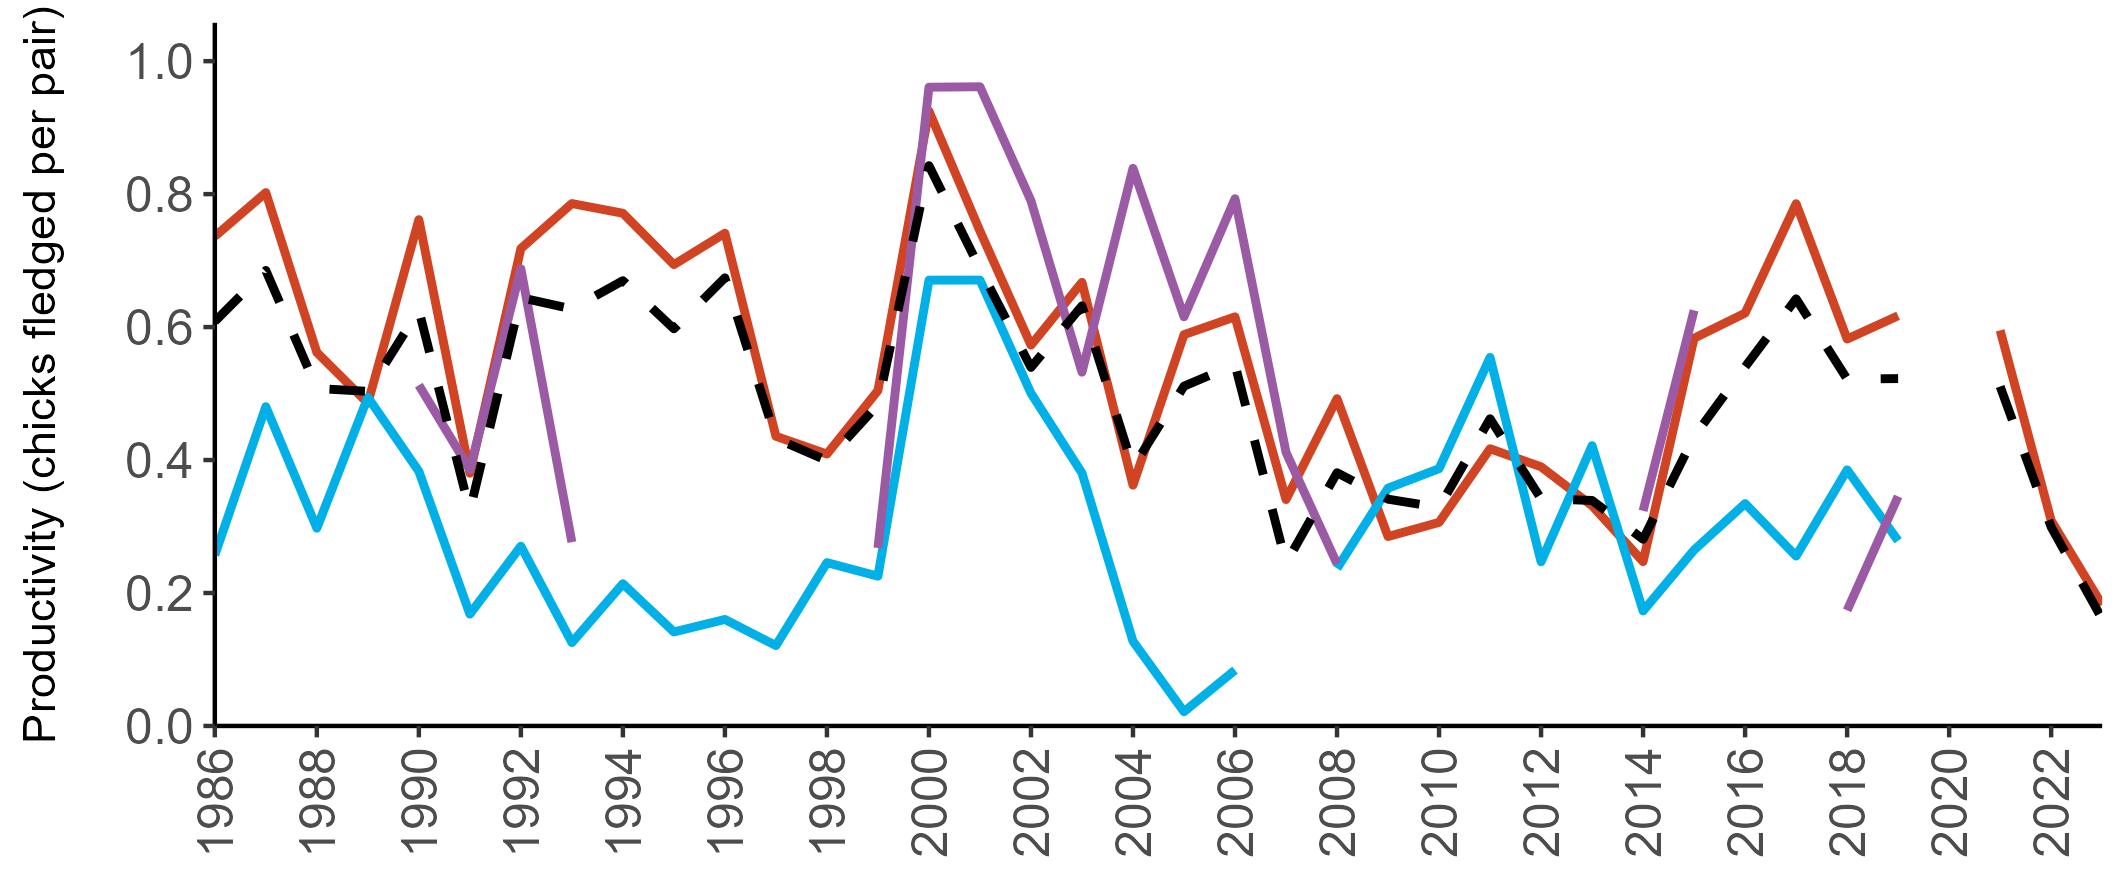
c.2%
Red-listed
Amber-listed (I)
Abundance: Decrease
Productivity: 0.30 (2022)
Colony Count sites: 4
Breeding Success sites: 1
Least Concern Lifespan: 8 years
Breeding age: 2 years
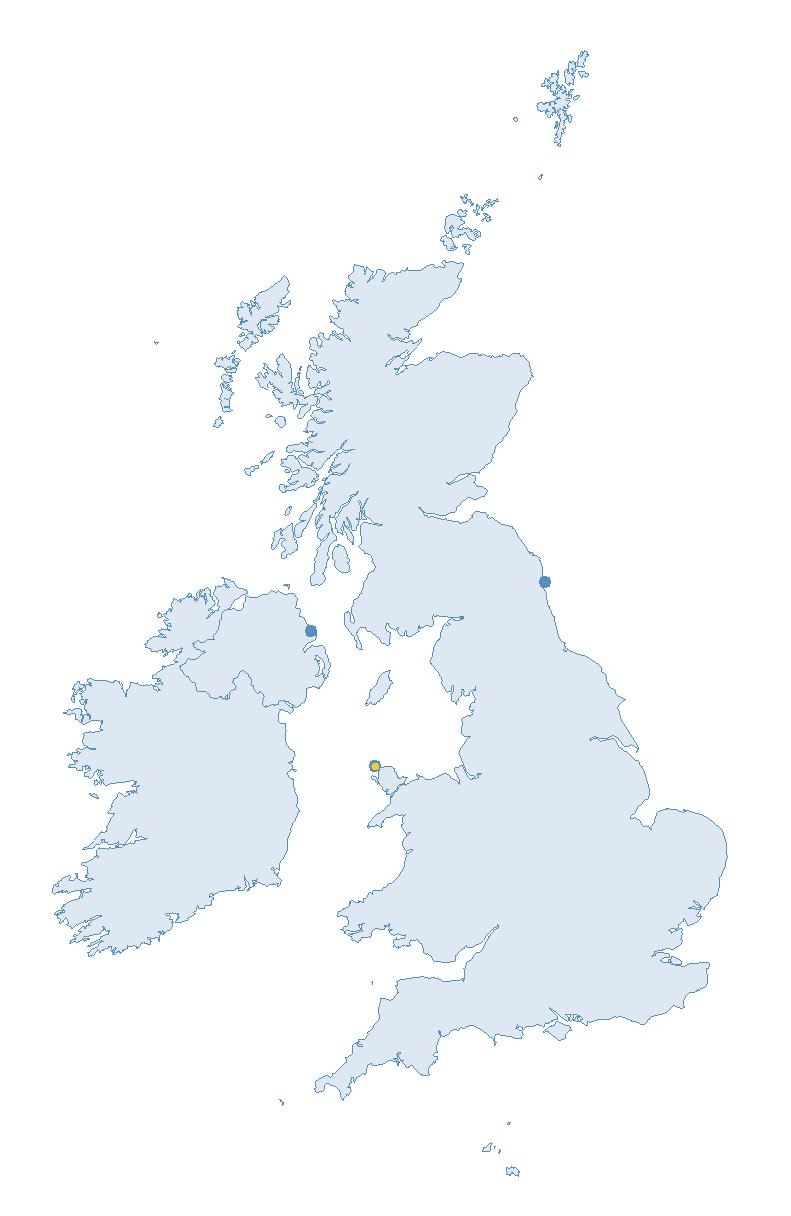
Britain and Ireland host less than 2% of the world’s breeding Roseate Terns (Burnell et al. 2023). Of those breeding in Britain and Ireland, 94% breed in the Republic of Ireland (Burnell et al. 2023).
In Britain and Ireland, breeding Roseate Terns are restricted to just a few colonies. They are very widely distributed across the globe, and are found in both the northern and southern hemispheres (BirdLife International 2024).
Roseate Terns that breed in Britain and Ireland migrate south to warmer waters in the non-breeding season (Snow & Perrins 1998).
Roseate Terns feed by plunge-diving on a variety of species of small fish depending on the location, with sandeels being of particular importance in the North Atlantic (Newton & Crowe 2000), although they may also take insects and marine invertebrates (del Hoyo et al. 1996).
BREEDING
Roseate Terns have specialised foraging and nesting behaviours, which restrict their UK breeding colonies to a few, suitable areas (JNCC 2021). They typically nest on coastal lowland habitat, including beaches, shingle, saltmarsh and
islands, especially when near to suitable fishing grounds (del Hoyo et al. 1996; Snow & Perrins 1998).
They create shallow scrapes as nests and tend to favour densely vegetated sites in temperate regions (del Hoyo et al. 1996). Nest boxes are utilised at the main colonies in Britain and Ireland, and breeding success in these has been shown to be greater than in open nest sites (Burke et al. 2022).
BREEDING ABUNDANCE
As Roseate Terns are restricted to breeding in a small number of wellmonitored colonies, SMP trend figures cover the entire UK population rather than using a sample of colonies to produce estimated trends. The increase in the UK Roseate Tern population of 116% since 2000 calculated from SMP data (Table 34) is very closely in agreement with the increase of 114% reported by the Seabirds Count census since Seabird 2000 (Burnell et al. 2023).
Over the course of the SMP monitoring period, the UK Roseate Tern population underwent a striking decline between 1986 and 1991 (Figure 48), thought to be due to low
Island Lake. Rockabill is the largest Roseate Tern colony in Europe and has been steadily increasing over the recording period, with 1,704 AON in 2021 (Figure 49), aided by habitat management and the provision of nest boxes. No data were submitted to the SMP from Rockabill for the 2022 or 2023 breeding seasons, and the colony was impacted by HPAI in 2023.
PRODUCTIVITY
The UK productivity trend for Roseate Tern has fluctuated across the SMP monitoring period (Figure 50), but with a gradual overall increase until recent years, partly due to effective conservation management. However, 2022 saw a decline in productivity to a value of 0.30 chicks fledged per pair (Table 34) due to HPAI on Coquet Island, which caused high mortality of chicks and adults. HPAI was also present in the colony in 2023, therefore no productivity data were submitted to the SMP.
driven mainly by increases in the Irish population through the use of effective local conservation measures. However, recovery in other regions is slow or absent.
Potential impacts on Roseate Terns include human disturbance and egg collecting, but this has been largely prevented by full-time wardening at the main colonies in Britain and Ireland. Predation from species such as Brown Rat (Rattus norvegicus), European Otter (Lutra lutra), Pine Marten (Martes martes) and European Badger (Meles meles), large gulls and even Turnstones ( Arenaria interpres) remains a threat (Acampora et al. 2018; Avery et al. 1995), although this has been reduced by the use of predator fences, biosecurity measures and predator control where necessary (Burnell et al. 2023).
(Falchieri et al. 2022), with a 21% decrease in the Roseate Tern population at surveyed sites in the UK between 2015–21 and 2023 (see pages 8–11) (Tremlett et al. 2024).
Following the introduction of legislation to reduce the threat from the millinery trade in 19th century, the population increased through the early 20th century, before SMP monitoring began (JNCC 2021).
immature survival rates as a result of trapping and poor food availability on the species’ wintering grounds off West Africa (Ntiamoa-Baidu et al. 1992).
After a subsequent period of stability, the population has slowly started to recover due to a range of conservation measures, including provision of nest boxes for shelter and protection from avian predators, and appropriate habitat management on Coquet Island (England), where the UK population is currently largely found (JNCC 2021, Burnell et al. 2023).
By 2022, the UK population had risen to 158 AON. The majority of these (154 AON) were breeding on Coquet Island, and an outbreak of HPAI at this colony after the count was carried out caused high levels of mortality (Tremlett et al. 2024). Consequently, in 2023, the number of Roseate Tern breeding on Coquet Island declined to 118 AON, and the UK population to 121 AON, 63% less than the 1986 population figure (Table 34).
Within Britain and Ireland, the Republic of Ireland holds the majority of breeding Roseate Terns at two colonies, Rockabill and Lady’s
Too few data are submitted to the SMP on productivity of Roseate Terns in other regions to allow for calculation of productivity values.
PHENOLOGY, DIET AND SURVIVAL RATES
No data have been collected as part of the SMP.
CAUSES OF CHANGE
In recent decades the Roseate Tern population in Britain and Ireland has been growing. This has been
The removal of eggs or hunting of adults has caused severe declines in some areas of their range (Gochfield et al. 2018), including deliberate trapping in the non-breeding grounds of Ghana (Ntiamoa-Baidu et al. 1992; Ratcliffe & Merne 2002), but any form of disturbance can cause pressure.
Climate change has the potential to impact colonies in the future through extreme weather events, sea level rise, erosion, and impacts on prey populations (Burnell et al. 2023).
HPAI caused severe population mortalities in 2022 and 2023
Successful Roseate Tern conservation measures include education at overwintering sites to reduce trapping of adults (Ratcliffe & Merne 2002), deployment of nest boxes to reduce predation and/or active predator management (Acampora et al. 2018), appropriate habitat and vegetation management, and wardening to reduce disturbance (Casey et al. 1995; Newton & Crowe 2000; Seward et al. 2019).
Examples of successful ongoing conservation management can be found in Ireland on Lady’s Island Lake (Daly et al. 2020) and on Rockabill (Gill et al. 2019), as well as internationally, including restoration of a small islet in the Azores, Portugal (Praia Islet). Work on Praia included European Rabbit (Oryctolagus cuniculus) eradication, native plant reintroduction and nest box deployment (Bried et al. 2009).
Abundance (AON) Seabird 2000 (1998—02)
(AON) Seabirds Count (2015—21)
Britain, Ireland, Isle of Man and Channel Islands
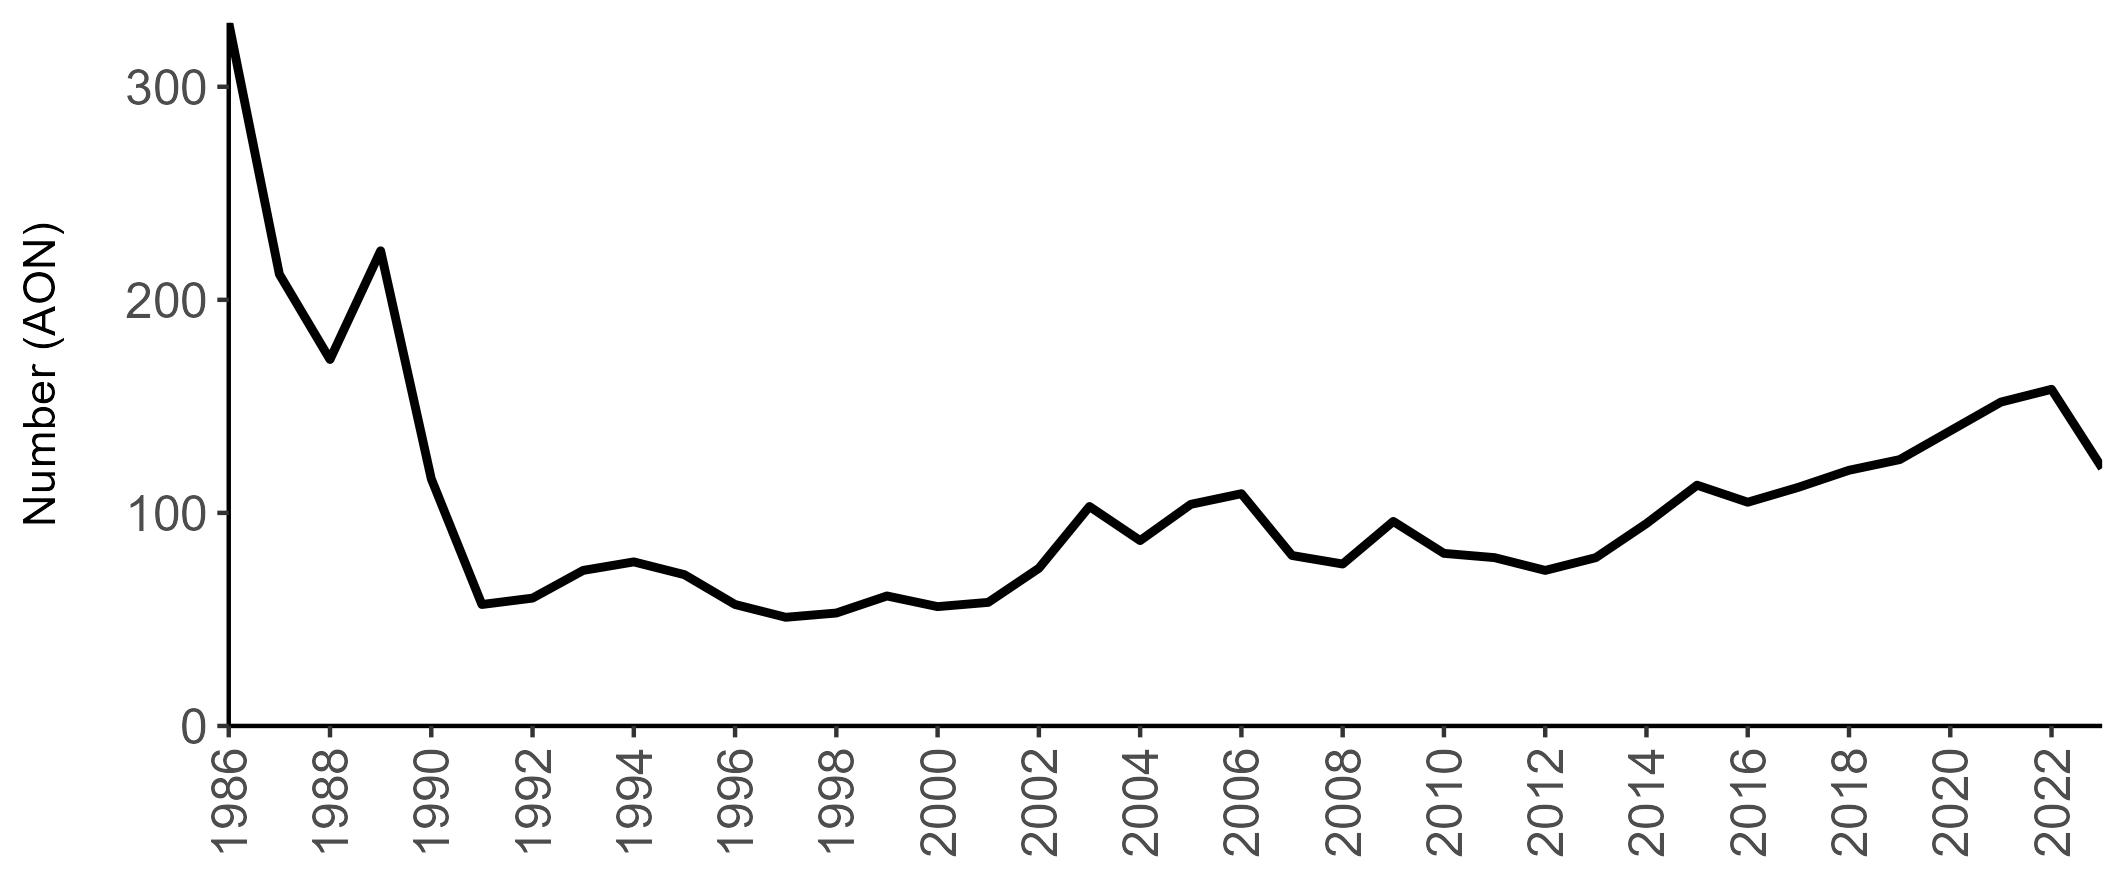
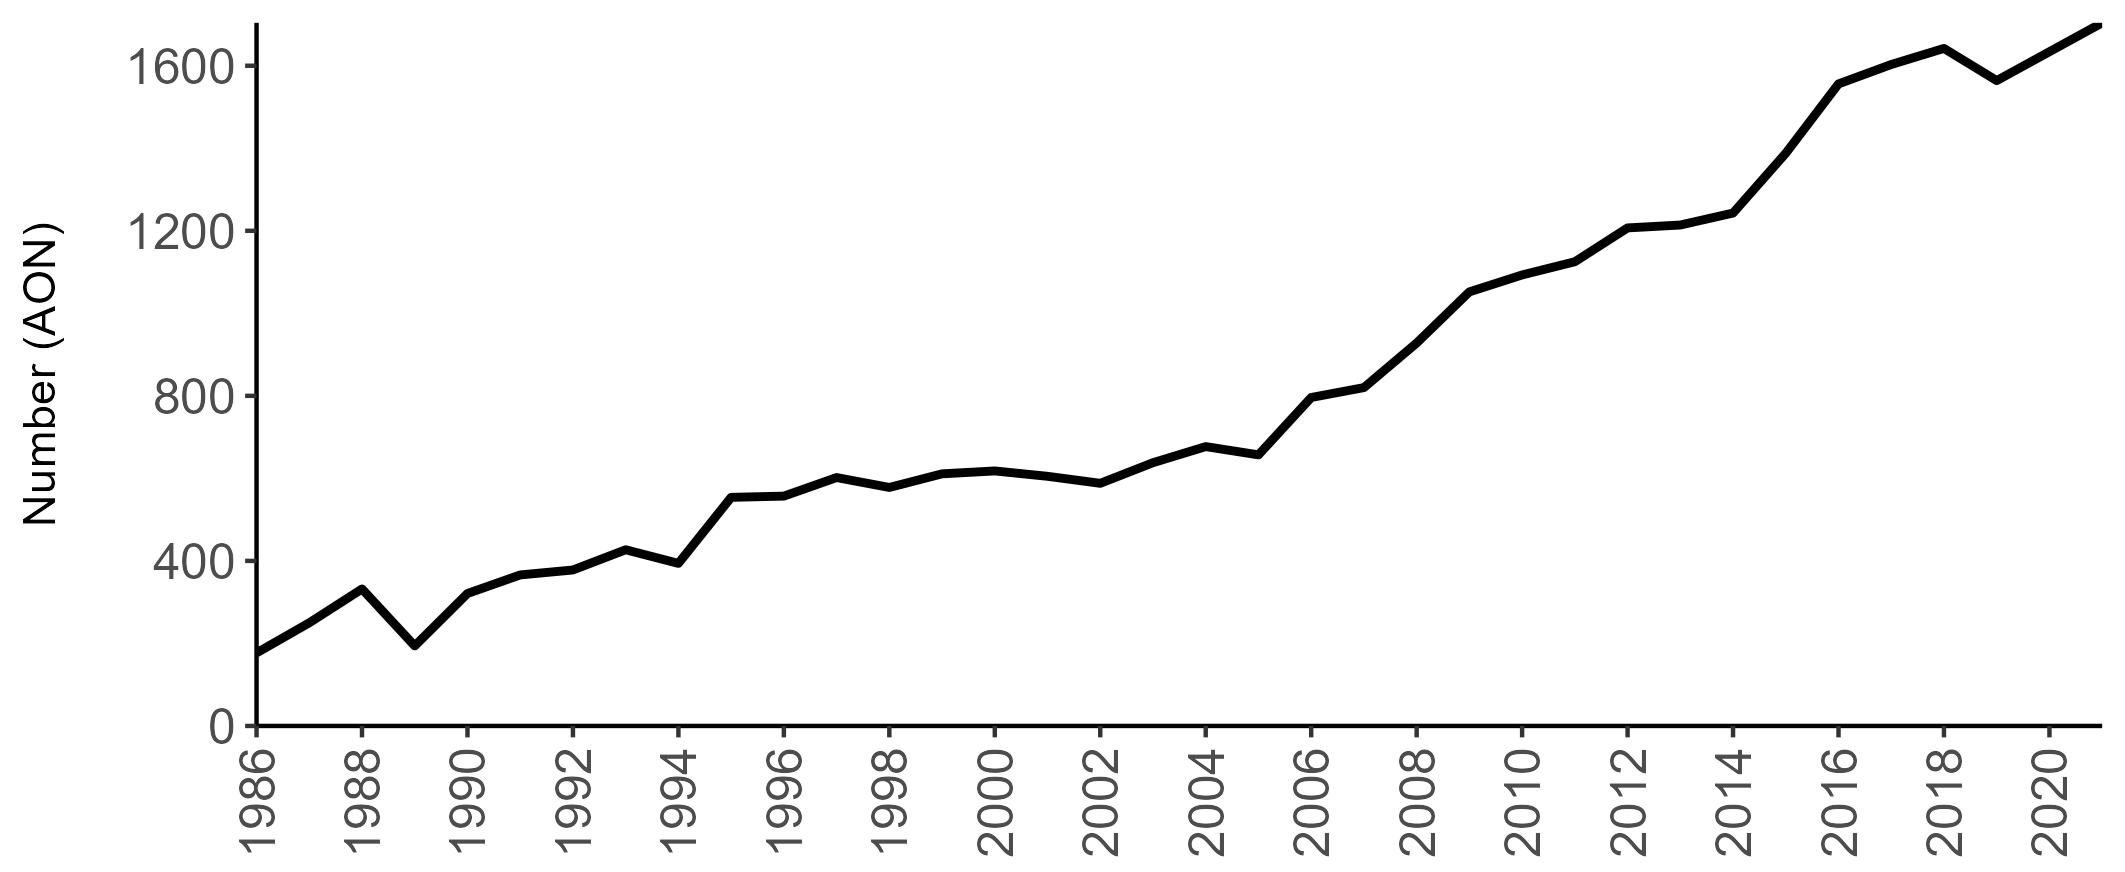
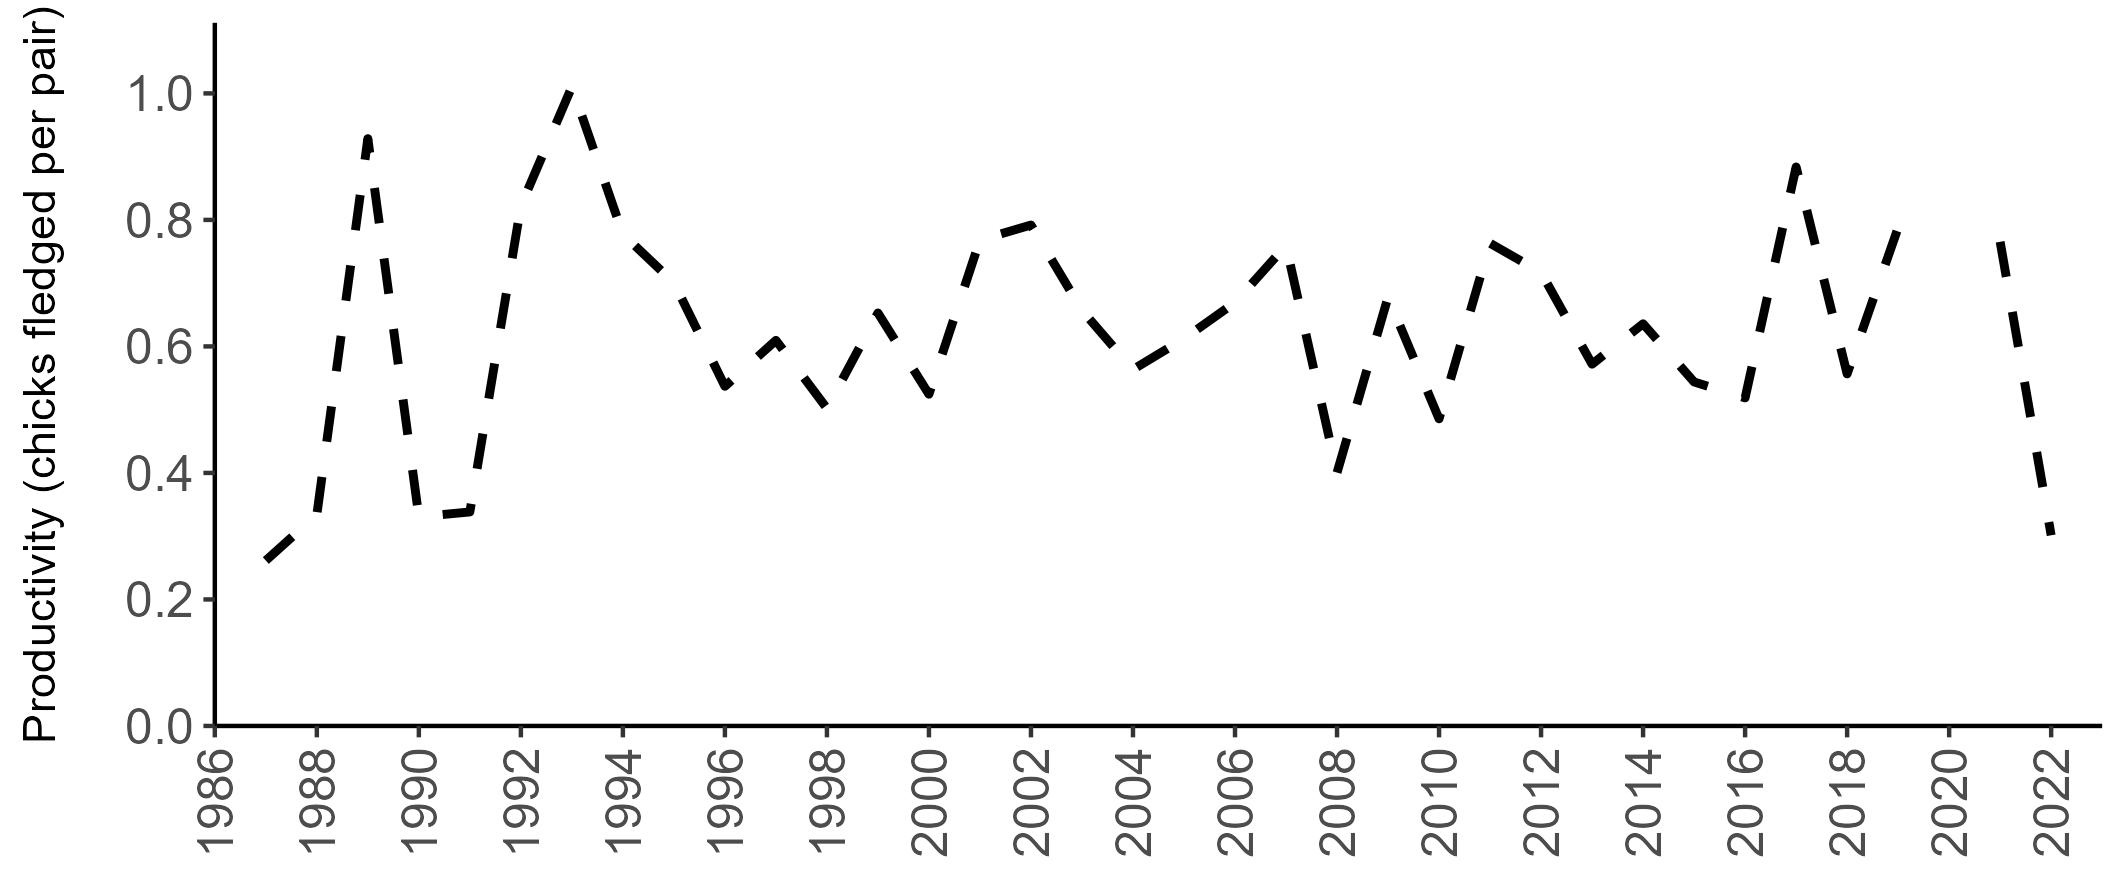
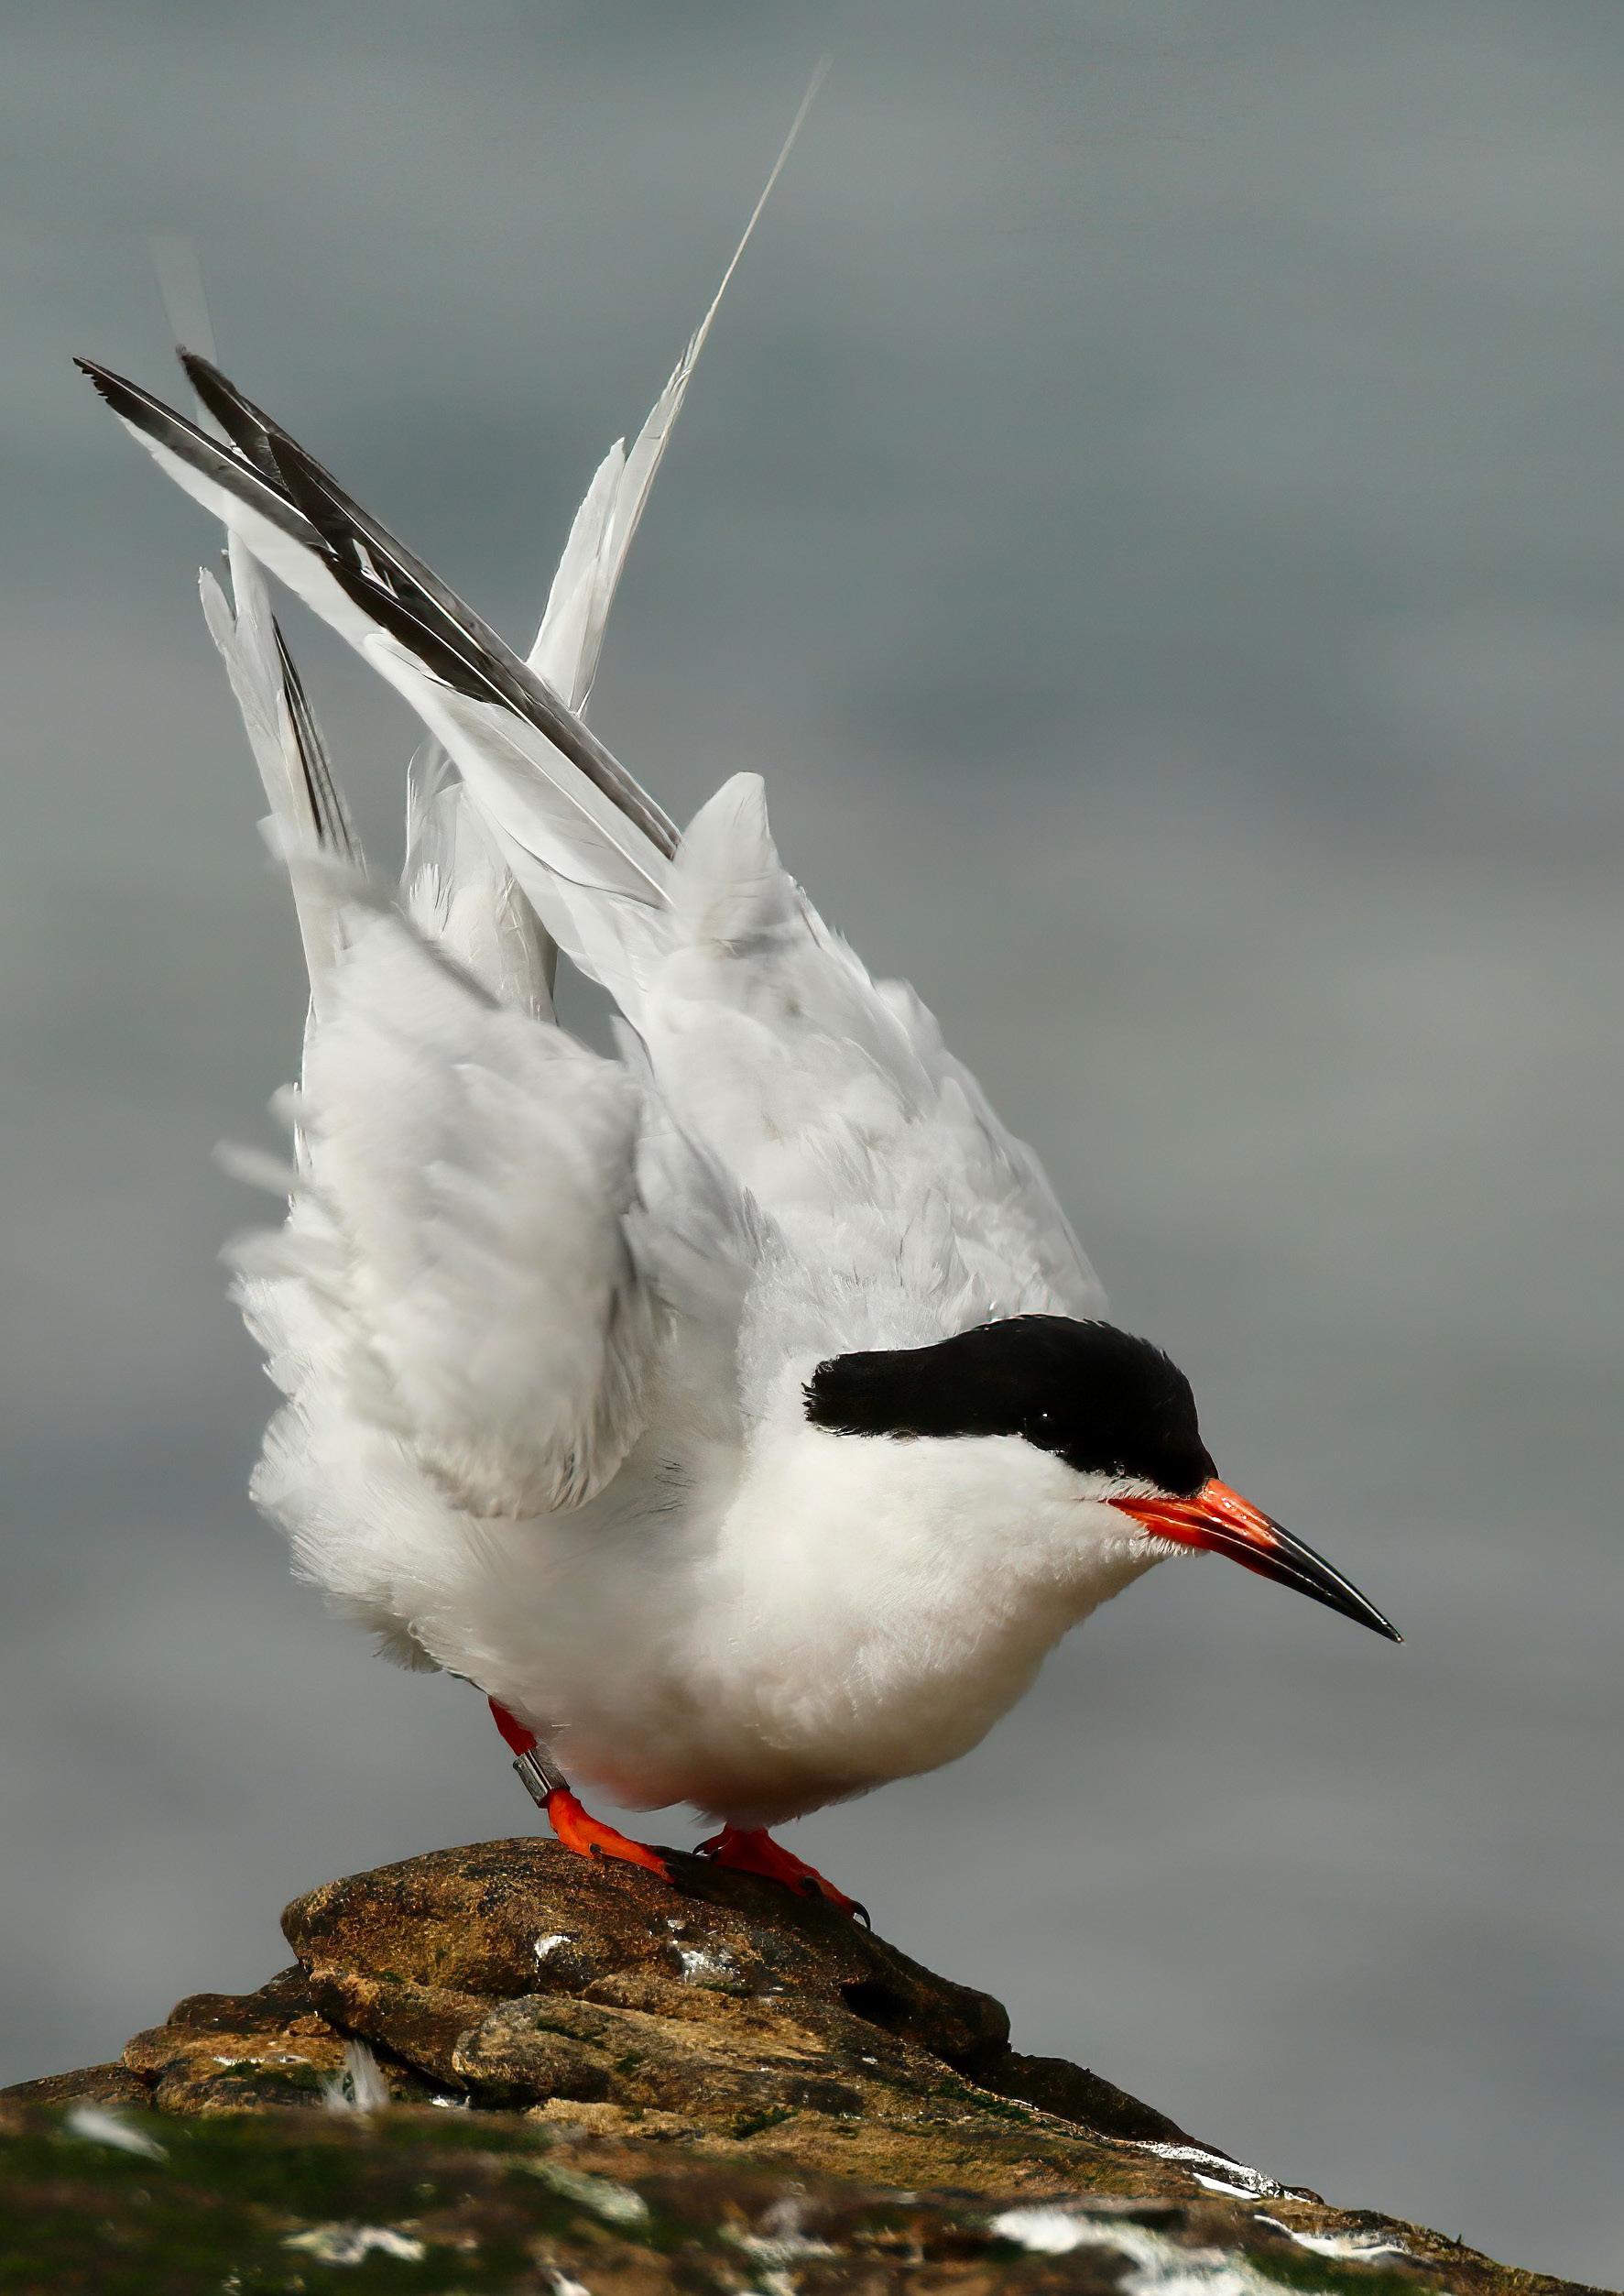
Abundance: Decline
Productivity: 0.46
Colony Count sites: 93
Breeding Success sites: 29
Least Concern Lifespan: 12 years
Breeding age: 3 years
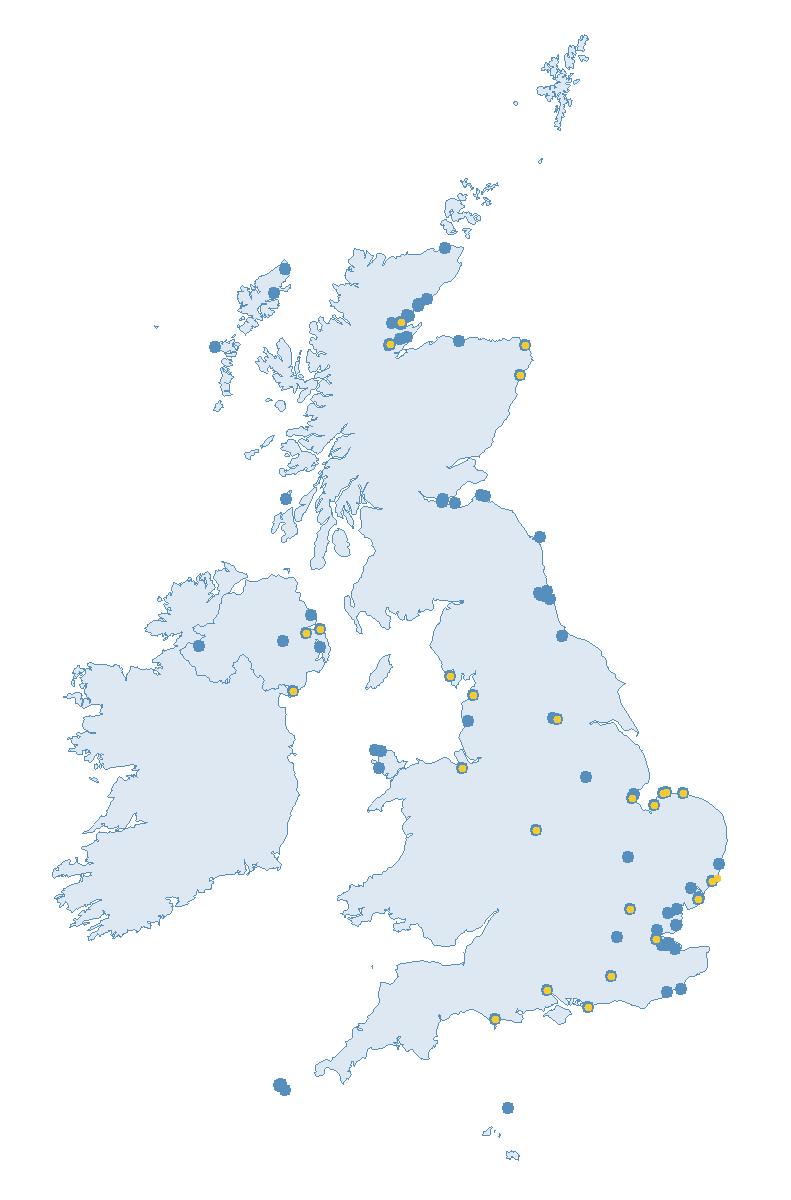
Britain and Ireland host approximately 1—2% of the world’s breeding Common Terns (Burnell et al. 2023). Although not the most numerous tern in Britain and Ireland, they are probably the most familiar due their widespread distribution, both inland and at the coast.
Common Terns breed around much of the British and Irish coast, although rarely in the south-west of Britain, and are also found at many inland sites (Burnell et al. 2023).
Their world distribution stretches around the globe, breeding in most of Europe, Asia and North America (BirdLife International 2024).
British and Irish birds migrate south after breeding to wintering grounds between the coast of Spain and the west African coast (Wernham et al. 2002).
Common Terns are opportunistic foragers, with a broader diet than many other tern species. They forage by plunge-diving over both marine and freshwater bodies, mainly preying on small fish and occasional insects and planktonic crustaceans (del Hoyo et al. 1996; Lemmetyinen 1973). They generally forage within 10 km of the breeding colony (Perrow et al. 2011; Wilson et al. 2014).
They nest in shallow depressions on open ground with some vegetation cover, and lay 2–3 eggs (del Hoyo et al. 1996 ).
BREEDING ABUNDANCE
The declines in Common Tern SMP abundance trends since 2000 (Table 36) were greater than those reported by the Seabirds Count census (Burnell et al. 2023). The SMP trends showed declines of 40% for the UK and 47% for England, whilst Seabirds Count reported smaller declines for the UK (-9%) and England (-3%) since Seabird 2000, potentially a consequence of the recent HPAI outbreak, which occurred after the census period (see pages 8–11). Over the same period, the difference between the trends was not so marked in Scotland, where a decline
Common Terns nest on flat rocks, shingle, sandy beaches, dunes, spits and small islands around the coastline, and inland at gravel pits, lakes, river valleys and marshes (del Hoyo et al. 1996; Richards 1990; Snow & Perrins 1998). They are an adaptable species, and artificial structures are also used, such as rafts, docks, barges and rooftops (Burnell et al. 2023).
of 28% was indicated by the SMP trend and 24% by census data.
The long-term UK and England trends are closely matched (Figure 51 & 52), as most colonies monitored are within England, although the UK values are typically lower. The UK and England trend indices gradually increased between 2012 and 2022. However, index values dropped in 2023 to 45% and 44% below the 1986 baseline for the UK and England, respectively (Table 36). This is likely to have been a result of the 2021/22 HPAI outbreak, which particularly impacted several Common Tern colonies in England (see pages 8–11).
In contrast to the UK and England, there has been a general decline in the Scottish abundance trend over recent years (Figure 53), with the trend value in 2023 dropping to 41% below the 1986 baseline (Table 36). Although Common Tern colonies in Scotland were also affected by HPAI, the impact on the population appears to have been less severe.
Too few data are currently submitted to the SMP in other regions to allow
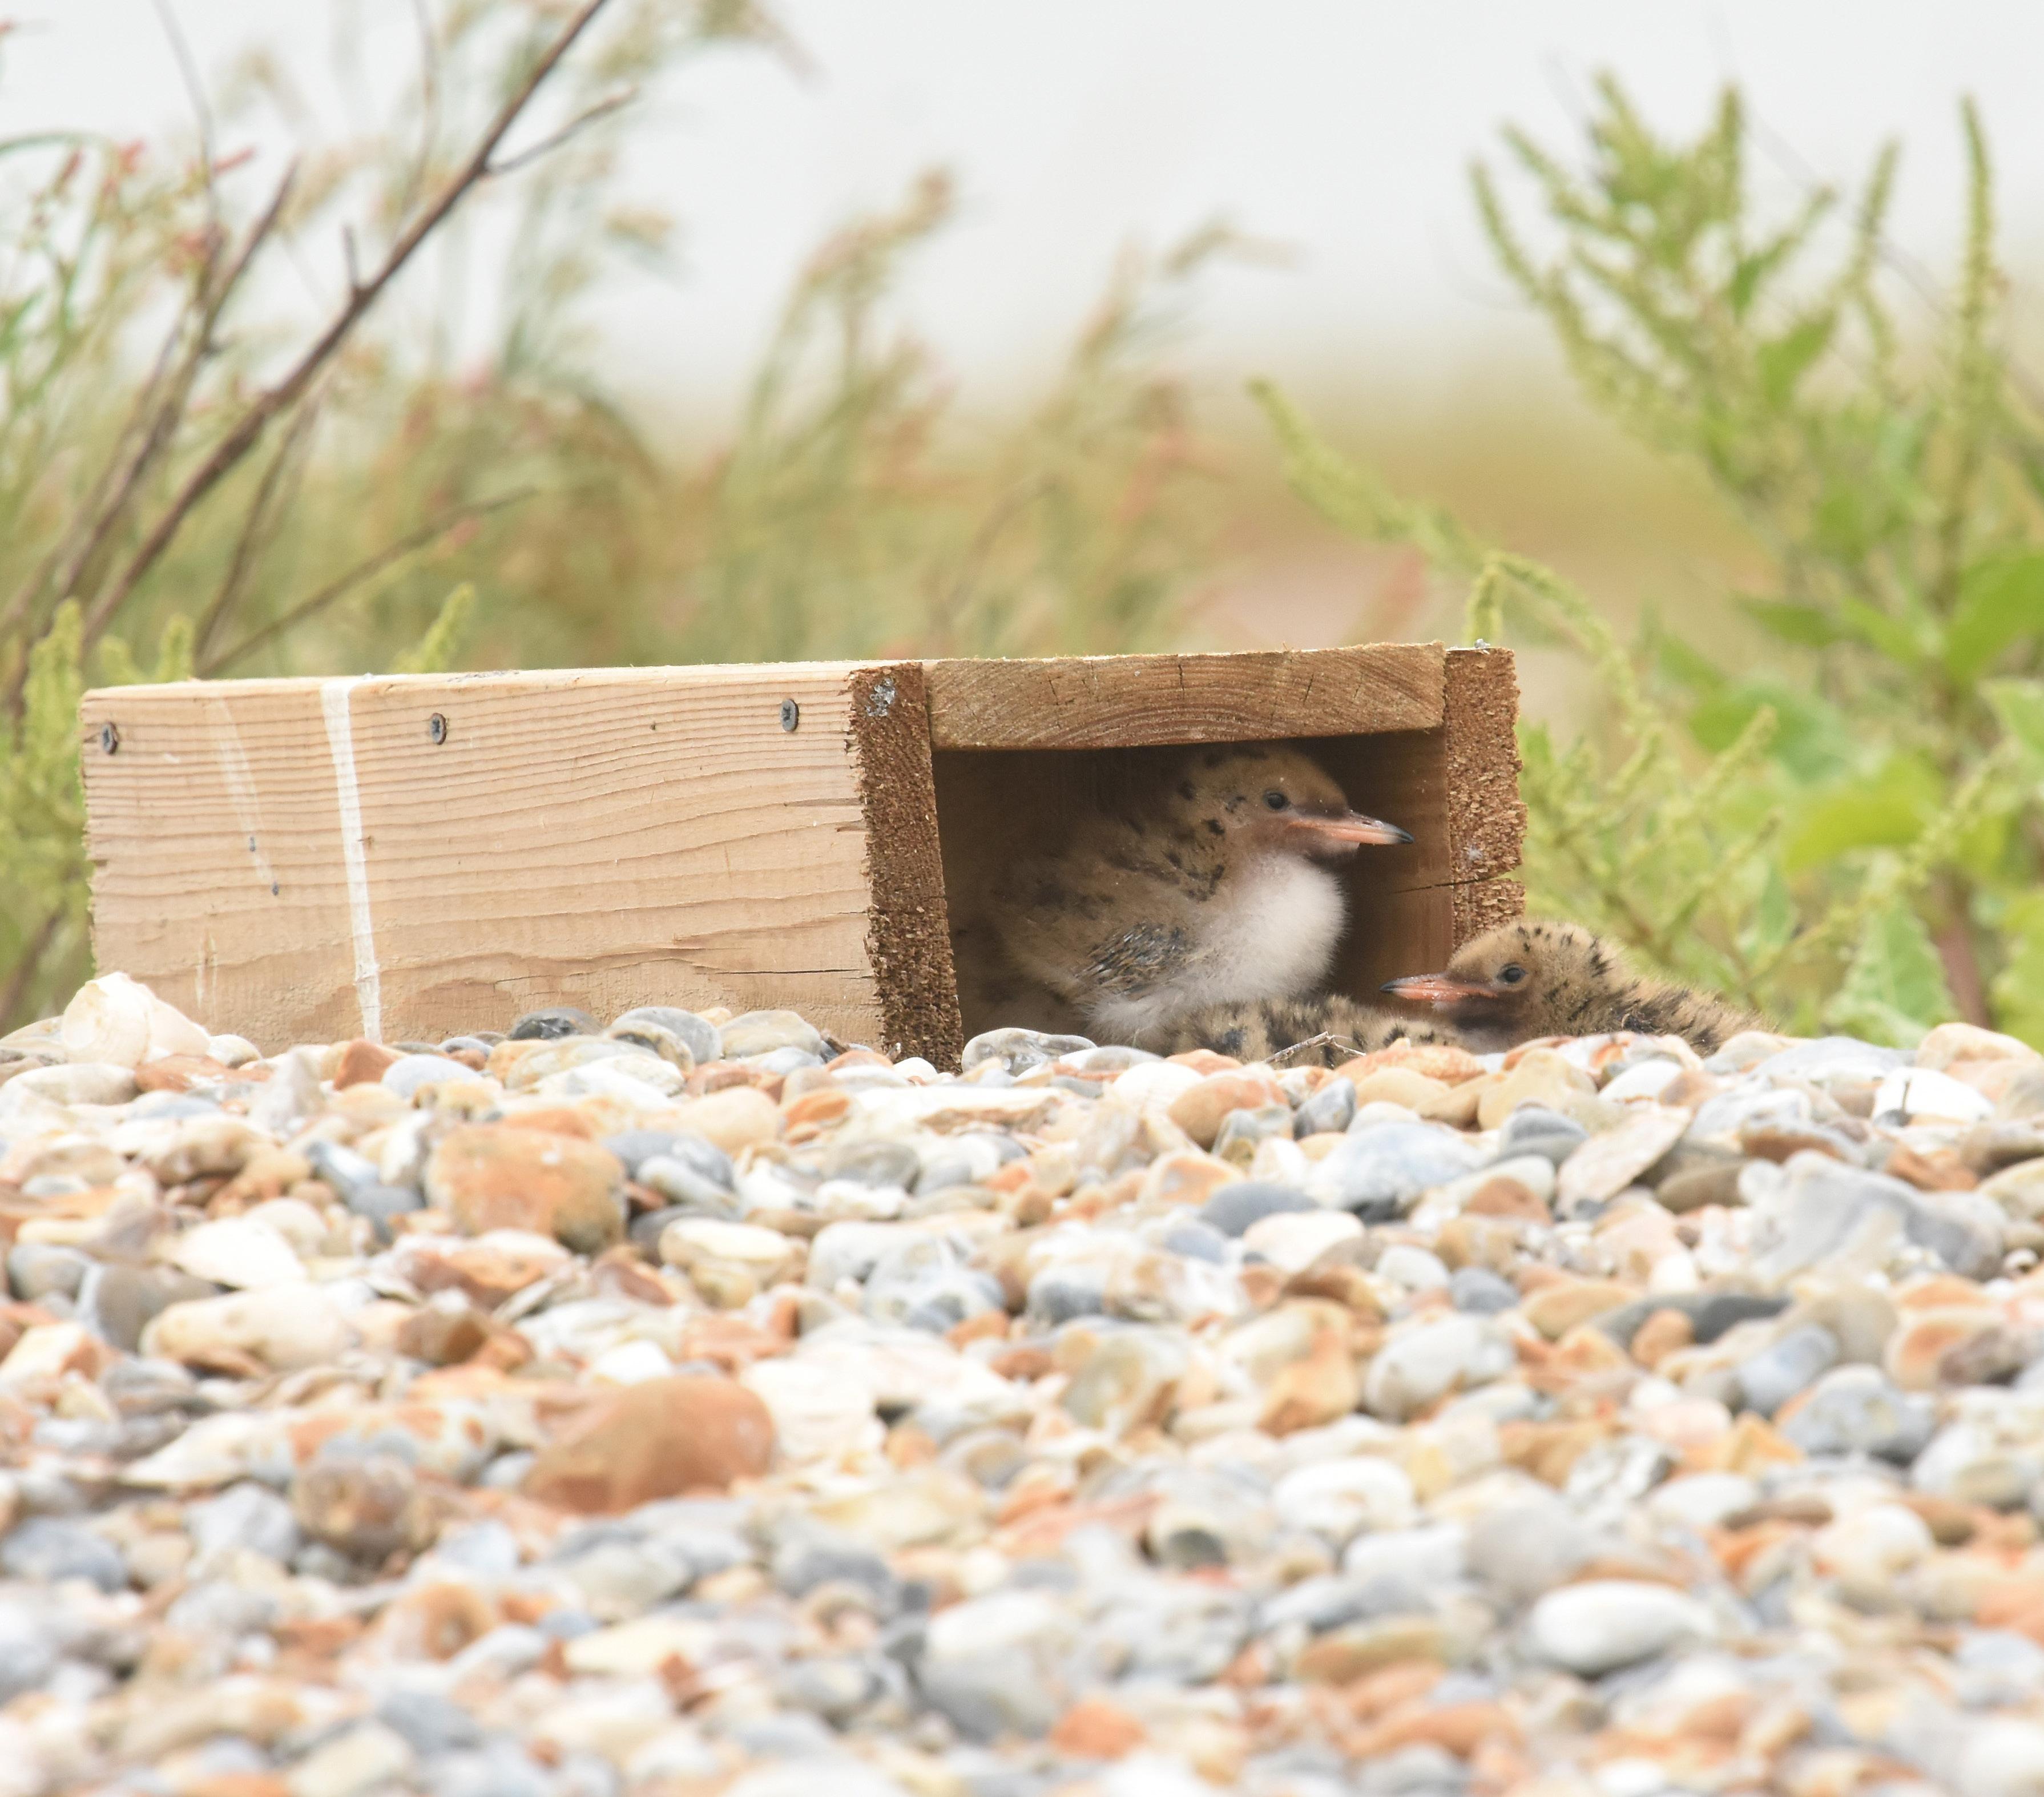
Abundance (AON) Seabird 2000 (1998—02)
Abundance (AON) Seabirds Count (2015—21) Percentage


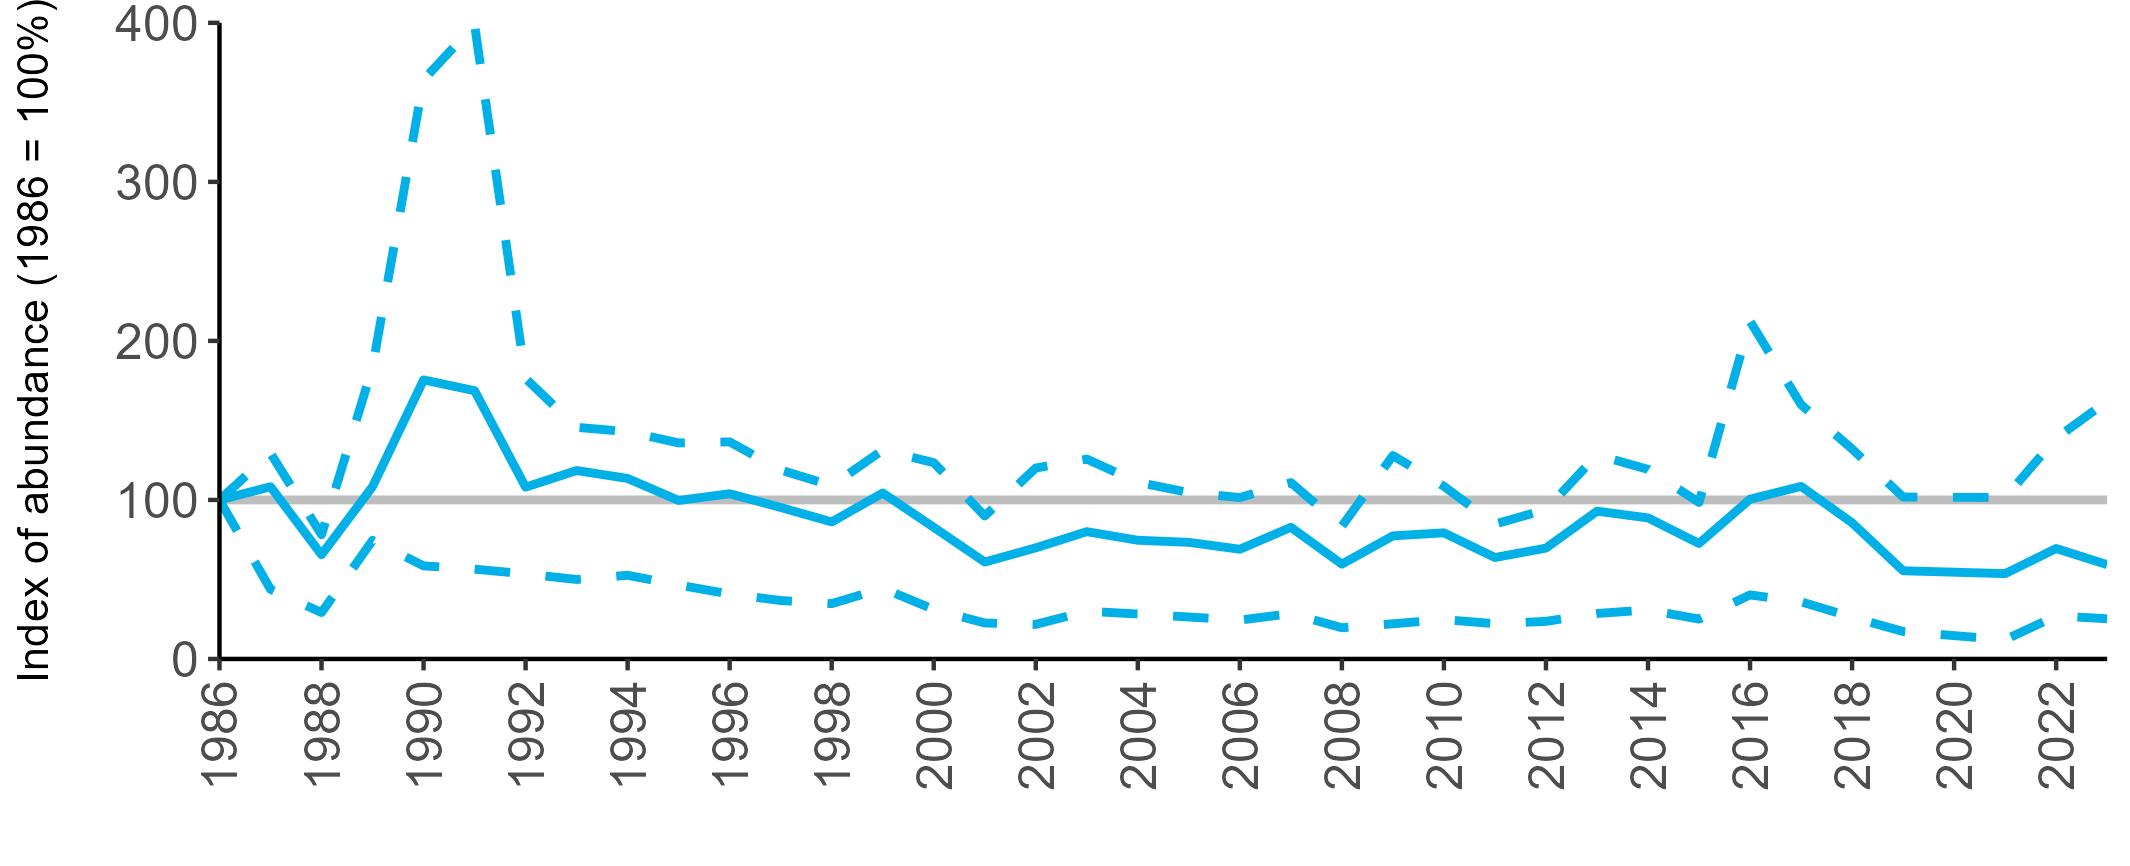
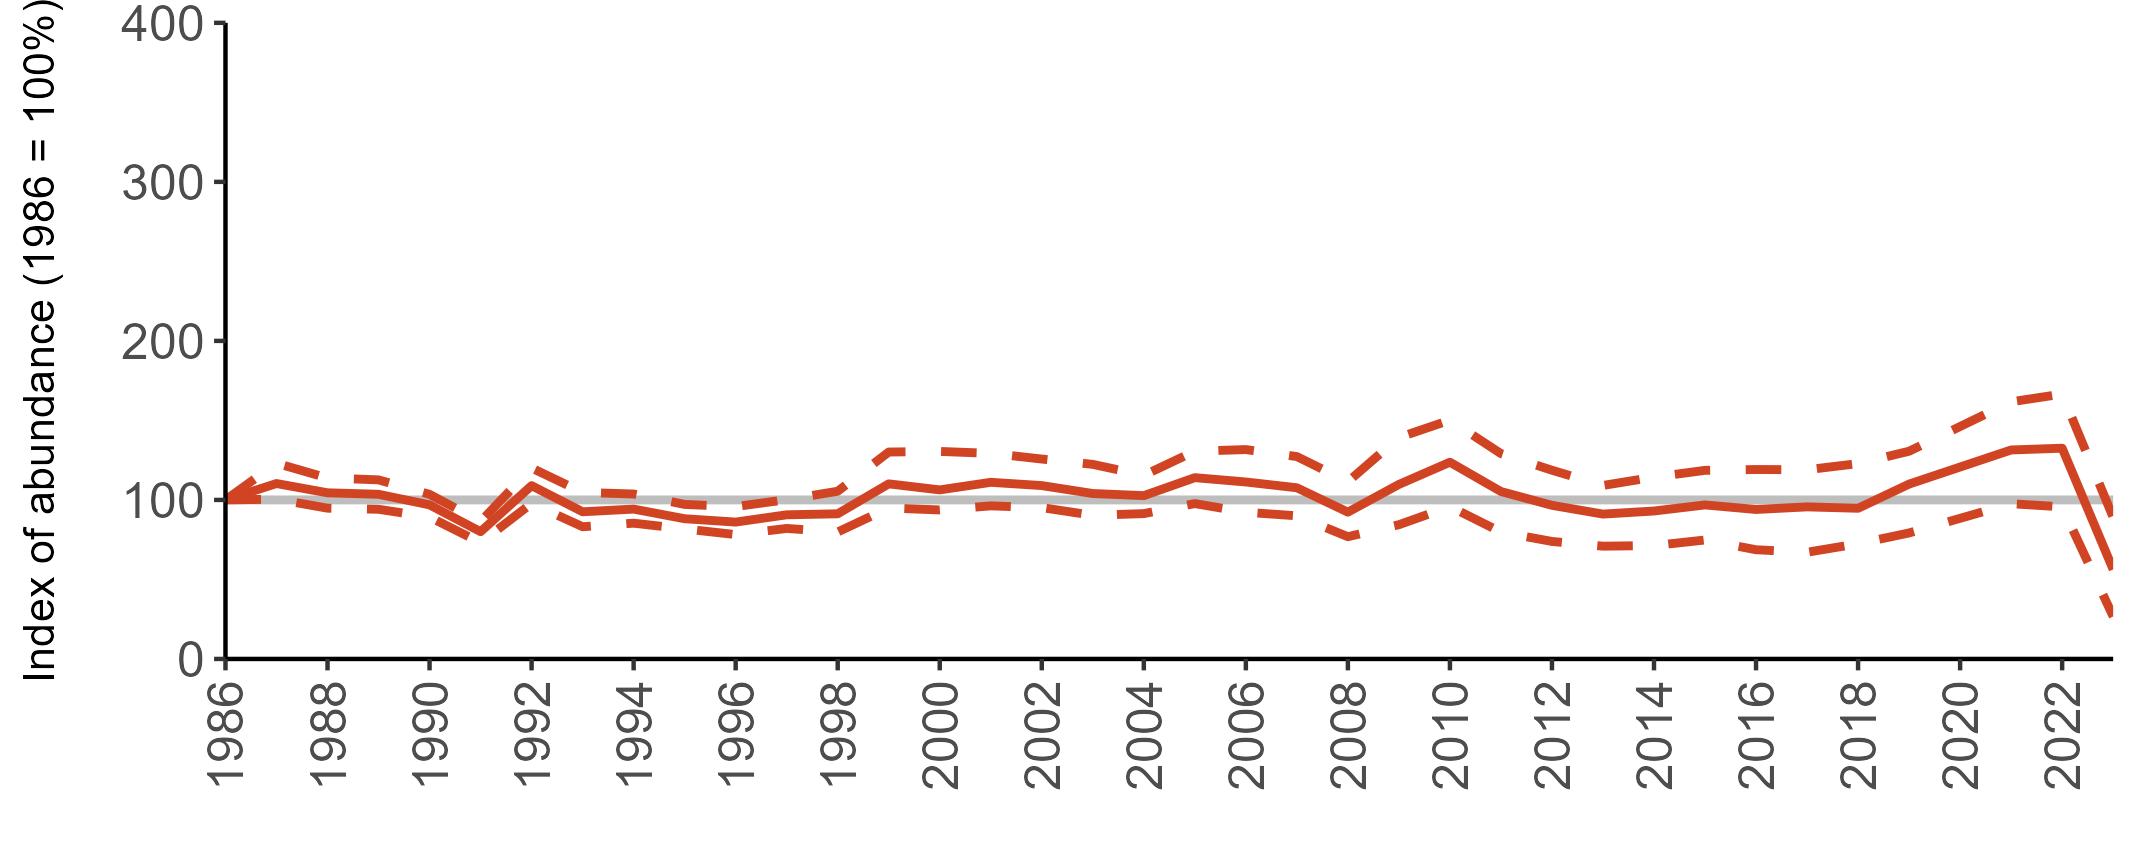
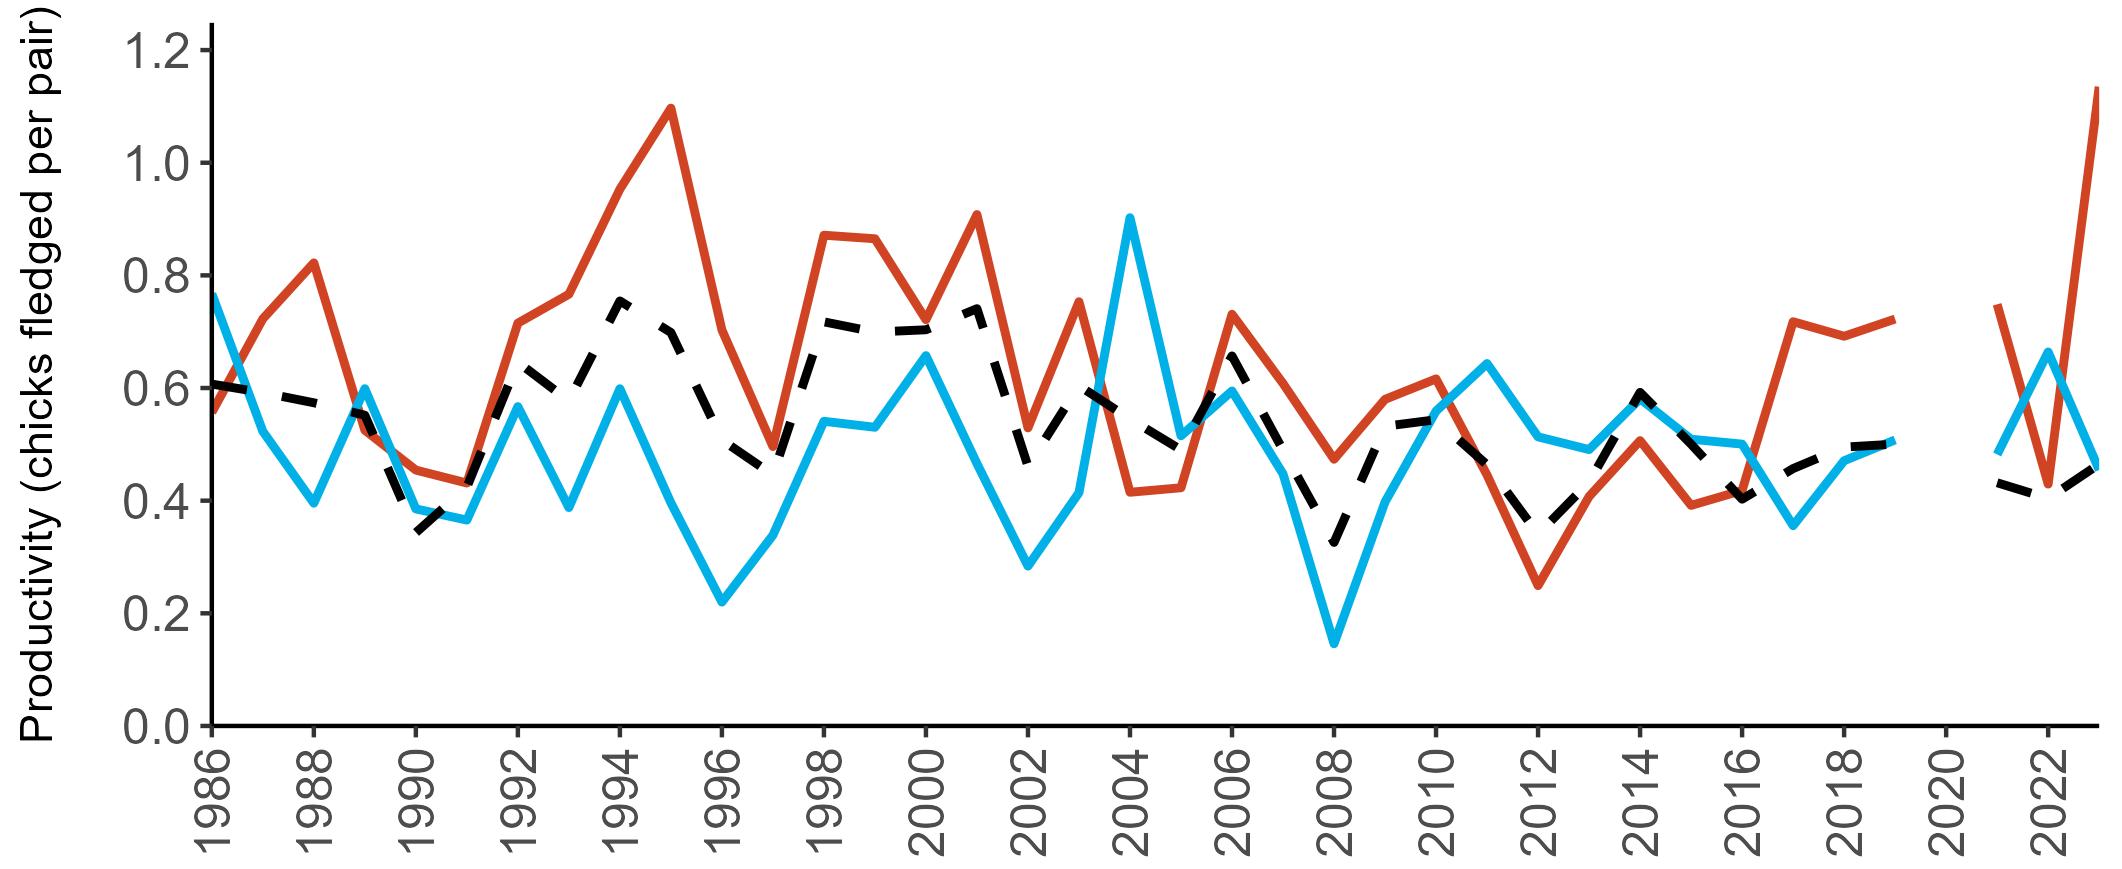
for the calculation of meaningful abundance trends.
Across the SMP recording period, the productivity trends for Common Terns have experienced fluctuations in values between years within all regions (Figure 54). The trend patterns for the UK and England are similar, as a large proportion of monitored sites are in England, with both, until recently, showing a gradual overall decline over time.
Mean productivity estimates have been higher in England than in the UK and Scotland over much of the SMP reporting period. In 2023, mean productivity estimates were similar for the UK and Scotland, with 0.46 and 0.45 chicks fledged per breeding pair, respectively, whilst productivity was higher in England, with 1.13 chicks fledged per pair (Table 36).
Too few data are submitted to the SMP on productivity of Common Terns in other regions to calculate any meaningful average productivity values.
No data have been collected as part of the SMP.
The Seabirds Count census showed that the British and Irish Common Tern population trend is largely stable (Burnell et al. 2023). A large proportion of Britain and Ireland’s breeding population occupies just 14 colonies (Burnell et al. 2023), and these sites often require intensive management, such as predator control, biosecurity measures, vegetation management, provision of artificial nesting structures or habitats and prevention of human disturbance.
At unwardened sites, human disturbance from recreational activities, such as watercrafts (Burger 1998) and the use of Uncrewed Aerial Vehicles (UAVs), can negatively impact colonies or prevent birds from using otherwise suitable habitat for breeding. An extreme form of human disturbance is the removal of eggs or
hunting of adults which led to the Britain and Ireland tern populations almost becoming extirpated at the end of the 1800s (del Hoyo et al. 2018).
Predation by American Mink (Neovison vison) (Craik 1995; 1997), Red Fox (Vulpes vulpes) and Brown Rat (Rattus norvegicus) can have significant impacts on local populations, and has caused colony abandonments in the past (Burnell et al. 2023). Large gull species and Peregrine Falcons (Falco peregrinus), in addition to directly predating Common Terns, may also cause displacement of colonies to less favourable sites through competition or disturbance (Booth & Morrison 2010; Burnell et al. 2023; Cuthbert et al. 2003).
Climate change is likely to impact Common Tern populations in a variety of ways. Increasing sea surface temperatures will affect prey availability, an increased frequency of storms may reduce foraging ability, and sea level rise, extreme weather events and a longer vegetation growing season may all cause a loss of suitable nesting habitat (Burnell et al. 2023; Monaghan and White 1989; Uttley et al. 1989).
HPAI has also had an effect on Common Tern populations over the last few years. Monitoring of 40% of the UK population following the recent outbreak showed a 42% decrease in numbers between 2015–21 and 2023 (see pages 8–11) (Tremlett et al. 2024).
As a migratory species, threats along migration routes and on the wintering grounds may also impact Common Tern breeding populations from Britain and Ireland. Historically, hunting on wintering grounds posed a threat but how extensive this is currently is unknown. Commercial fishery exploitation of the waters of West Africa could also affect food availability in the non-breeding season (EJF 2020; Grémillet et al. 2015).
Historically, the population of Common Terns in Britain and Ireland increased through the 20th
century following the introduction of protective legislation to prevent egg collecting and hunting of adult birds (JNCC 2021).
Common Terns are highly adaptable and respond well to a range of conservation management techniques. These include the provision of nest boxes (Bried et al. 2009; Burgess & Morris 1992), artificial rafts (Dunlop et al. 1991) and islands, habitat management to provide suitable vegetation cover (Cook-Haley & Millenbah 2002), and reduction of disturbance through restrictions on human access (Fasola & Canova 1996).
Predator control also plays an important role in tern conservation. Trapping of American Mink has been shown to significantly improve Common Tern productivity (Ratcliffe et al. 2008a), and control of Brown Rat (Amaral et al. 2010) and gulls (Blokpoel et al. 1997; Donehower et al. 2007; Guillemette & Brousseau 2001) have also been shown to be beneficial. Erection of predator fences and effective biosecurity measures are additional measures that are locally effective in protecting Common Tern colonies.
As also described for Roseate Tern, examples of successful conservation management for Common Terns in Ireland include ongoing conservation management in Ireland are on Lady’s Island Lake and Rockabill (Gill et al. 2019). Internationally, they include an effective conservation scheme in Po Delta, Italy, to protect gull and tern breeding colonies (Fasola & Canova 1996) and restoration of a small islet in the Azores, Portugal (Praia Islet), which included European Rabbit (Oryctolagus cuniculus) eradication, native plant reintroduction and box deployment (Bried et al. 2009).
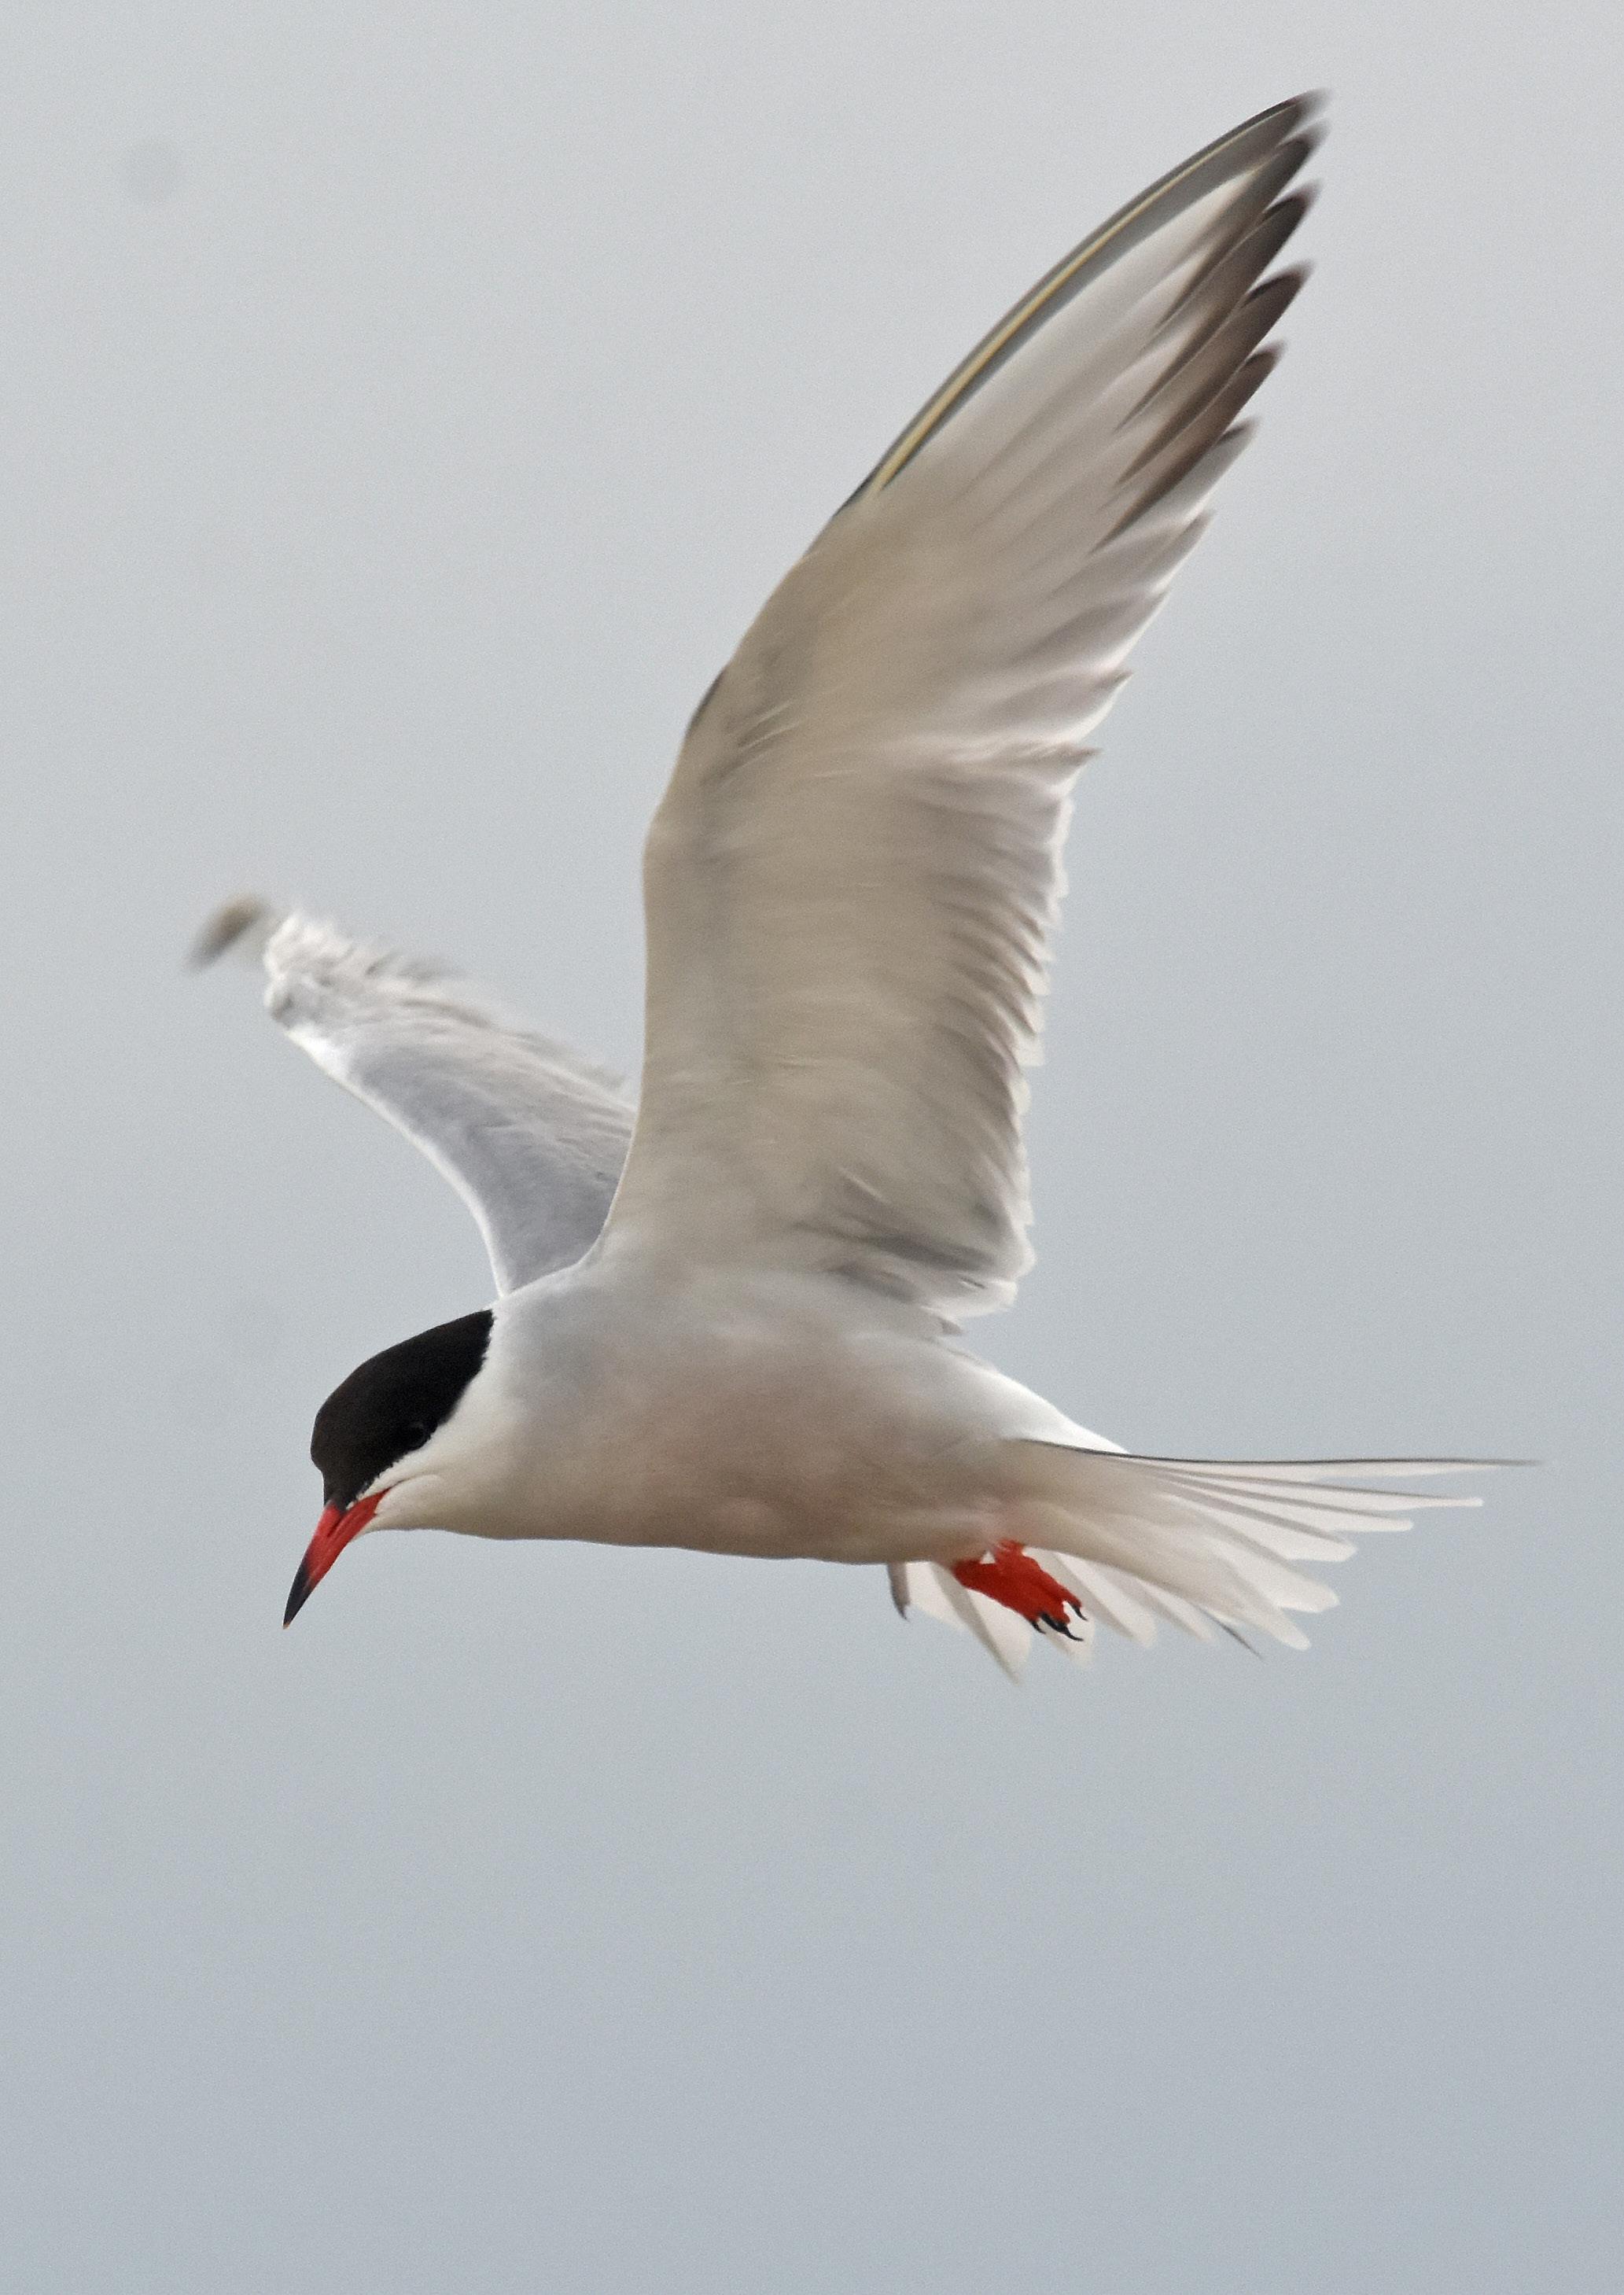
Red-listed
Amber-listed (I)
Abundance: Decline
Productivity: 0.11
Colony Count sites: 101
Breeding Success sites: 16
Least Concern Lifespan: 13 years
Breeding age: 4 years
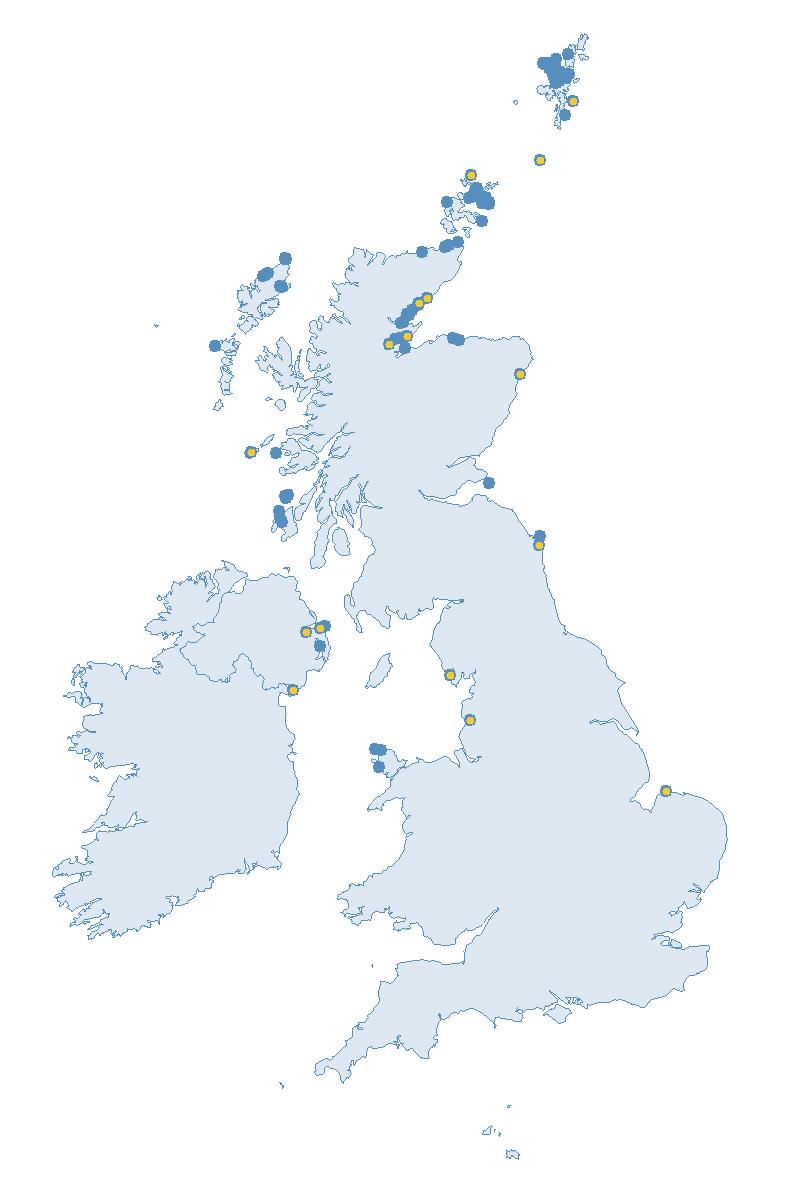
Arctic Terns are the most common breeding tern in Britain and Ireland, and approximately 3% of the global breeding population is hosted here in summer (Burnell et al. 2023). They have the longest known annual return migration on earth, of up to 50,000 km (Alerstam et al. 2019).
In Britain and Ireland, breeding Arctic Terns are found predominantly around the northern and western coastlines, with a few colonies further south (Burnell et al. 2023).
In a global context, they breed widely across the Arctic and subarctic regions of Europe, Asia and North America (BirdLife International 2024).
Arctic Terns migrate south for the non-breeding season, taking advantage of the long summer daylight hours in the southern hemisphere (del Hoyo et al. 1996; Melville & Shortridge 2006; Wernham et al. 2002). At this time they can be found throughout the Southern Ocean, from the southern waters off South America and Africa to the edge of the Antarctic ice sheet (BTO 2023a).
Arctic Terns are surface feeders, plunge-diving to depths of 50 cm (Cramp 1985). They preferentially feed on sandeels or other small energyrich fish species, which are particularly important for chicks (Ewins 1985; Furness 1982; Furness & Tasker
2000; Monaghan et al. 1989; Suddaby & Ratcliffe 1997). Additional prey include planktonic species of crustaceans, molluscs, insects and occasionally berries on initial arrival at their breeding grounds. During non-breeding season, Arctic Terns are known to forage over the open ocean, often near Antarctic Minke Whales (Higgins & Davies 1996).
BREEDING
Around Britain and Ireland, Arctic Tern colonies are predominantly coastal, nesting on shingle, beaches, spits or islands with short or sparse vegetation. The nest is a simple scrape in the substrate, in which they lay 1–2 eggs (Mitchell et al. 2004).
Elsewhere in the world, Arctic Terns also breed on islets along rivers, inland near water, on grassland, tundra and forest-tundra (del Hoyo, Elliott and Sargatal 1996; IUCN 2024). In these habitats, they nest as solitary pairs or in small colonies (del Hoyo et al. 1996).
BREEDING ABUNDANCE
At the UK level, the decline in the Arctic Tern SMP abundance trend of
17% since 2000 (Table 38) was less than the decrease of 37% recorded by the Seabirds Count census since Seabird 2000 (Burnell et al. 2023).
For Scotland, the SMP trend showed a decline of 49% since 2000 (Table 38), similar to the decline of 54% reported by Seabirds Count. However, for England, the SMP trend indicated a decline of 8% since 2000 (Table 38), whilst the Seabirds Count census showed a large increase of 69% over a similar period. This large discrepancy suggests that trends within the colonies sampled in England for the SMP may be unrepresentative of trends within the country as a whole.
The long-term SMP abundance trends for Arctic Tern differ considerably between regions (Figures 55–57). Between 1990 and 2012, the UK trend generally fluctuated around the 1986 baseline. After a peak in the index in 2014, the UK trend has since declined overall to 12% below the baseline in 2023 (Table 38).
Following a peak in 1988, the abundance trend for Scotland declined overall over the first half of the SMP recording period, and
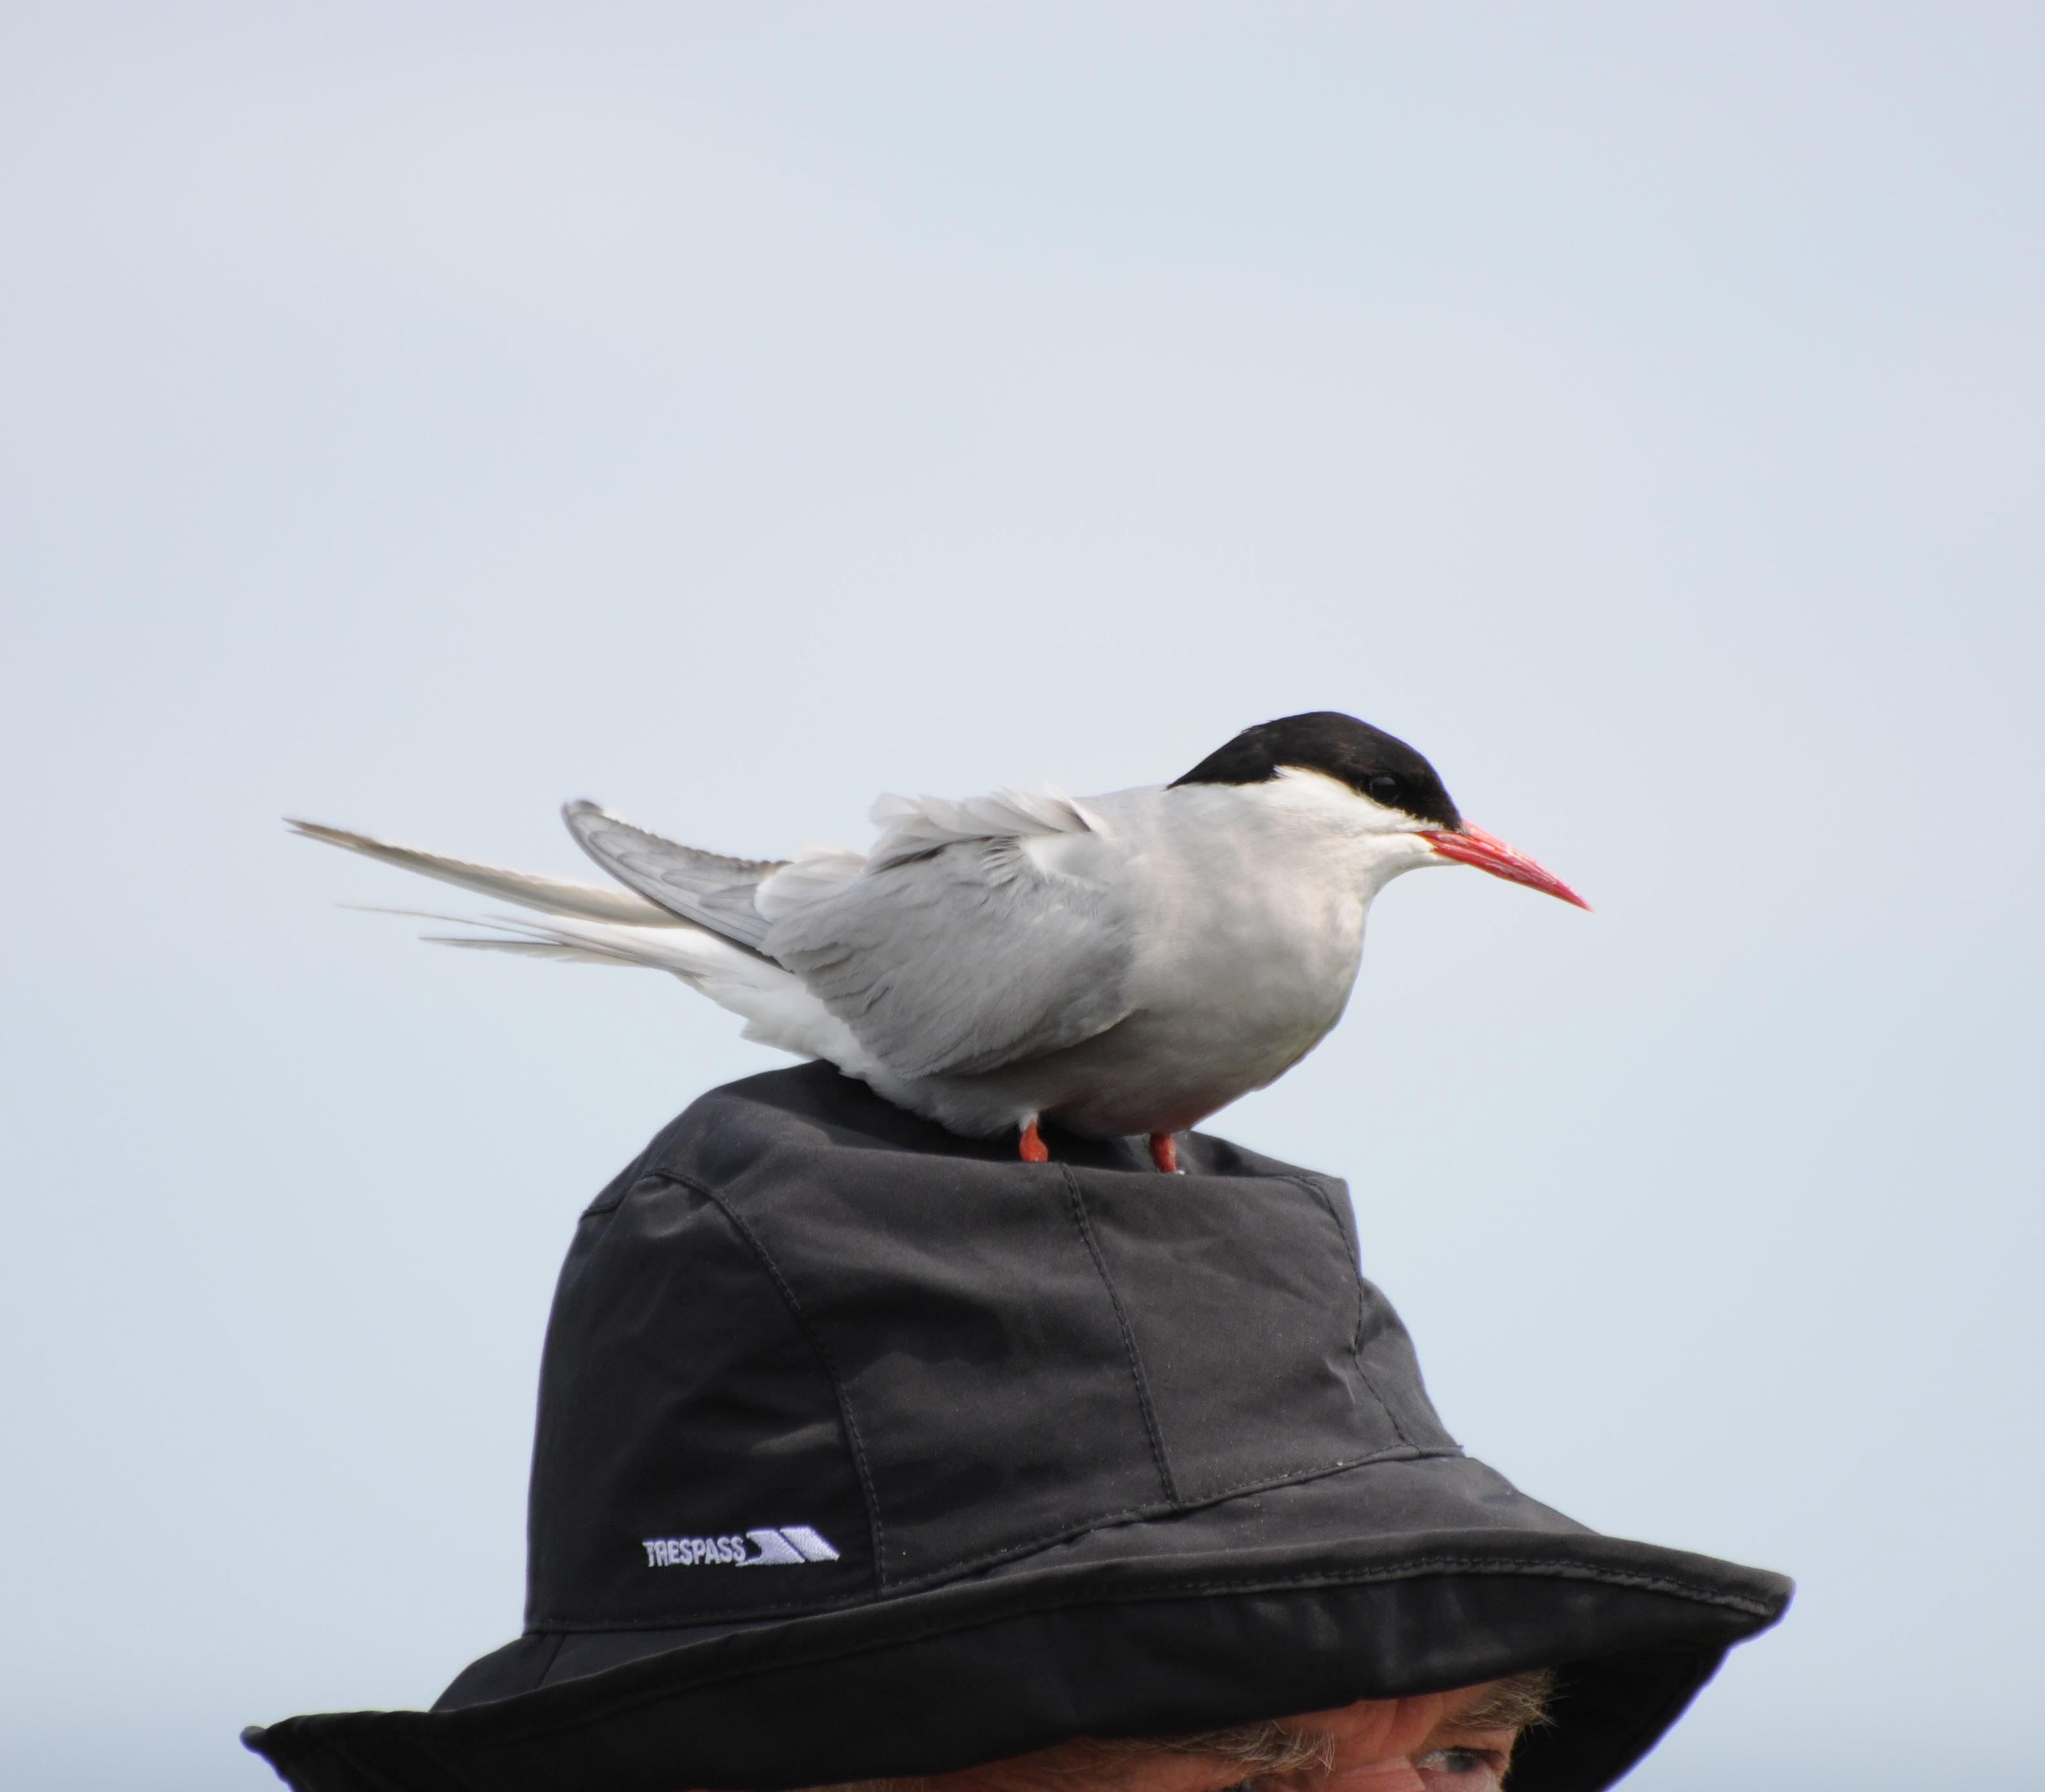
Abundance (AON) Seabird 2000 (1998—02) Abundance (AON) Seabirds Count (2015—21) Percentage Change
All Britain, Ireland, Isle of Man and Channel Islands
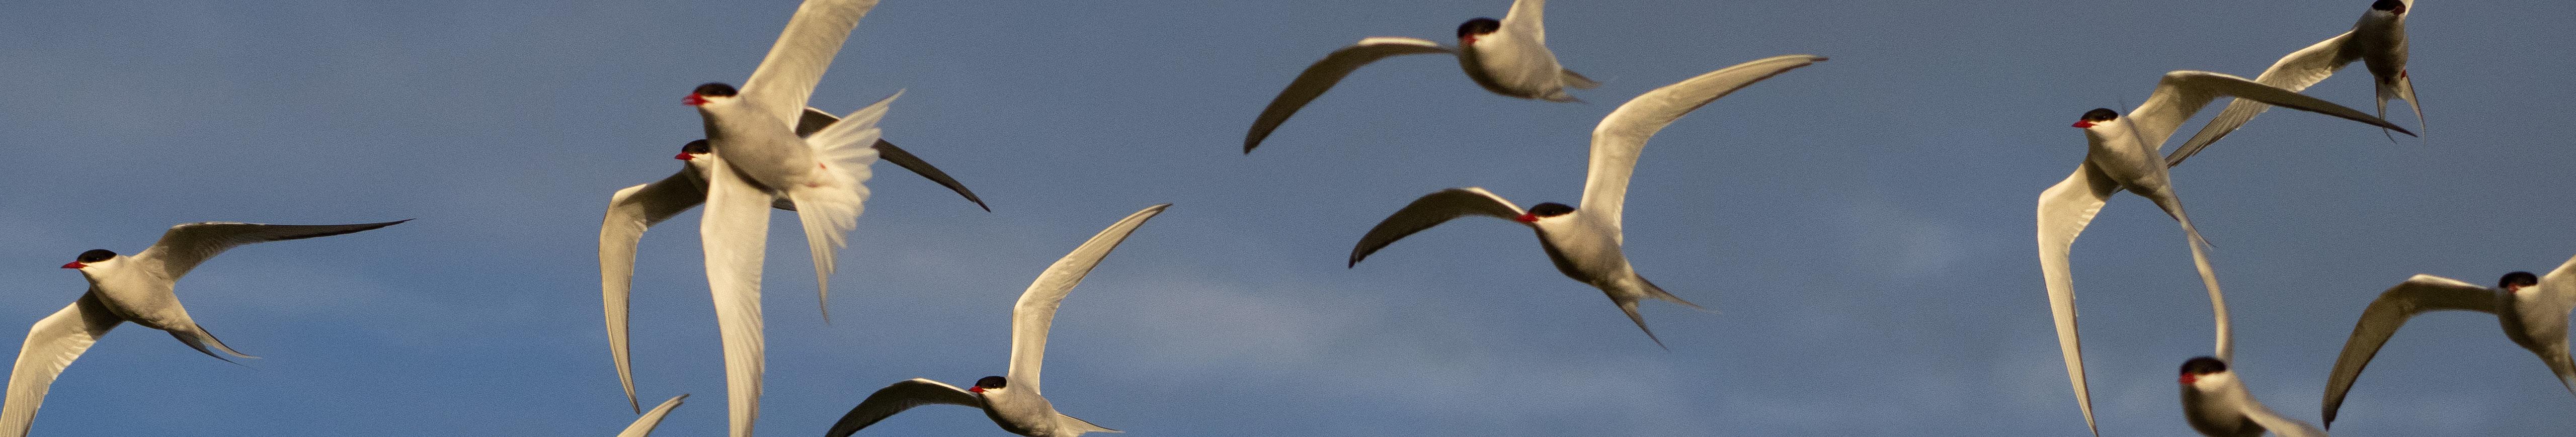
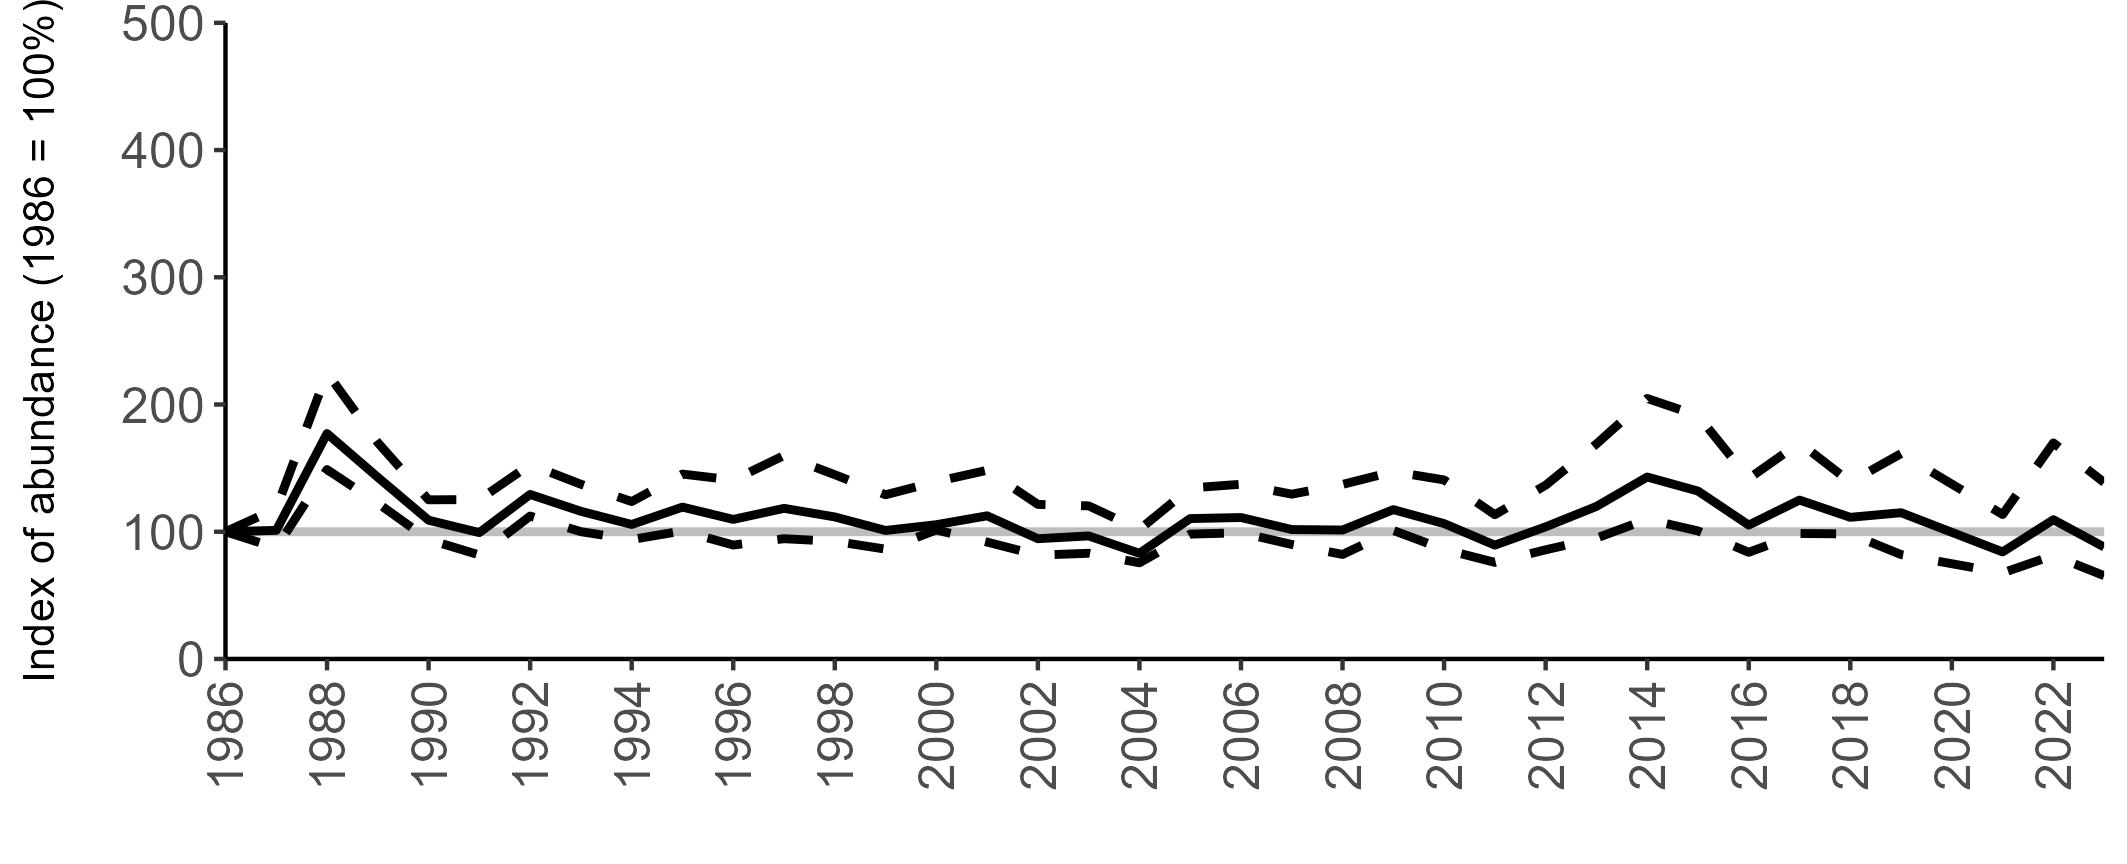
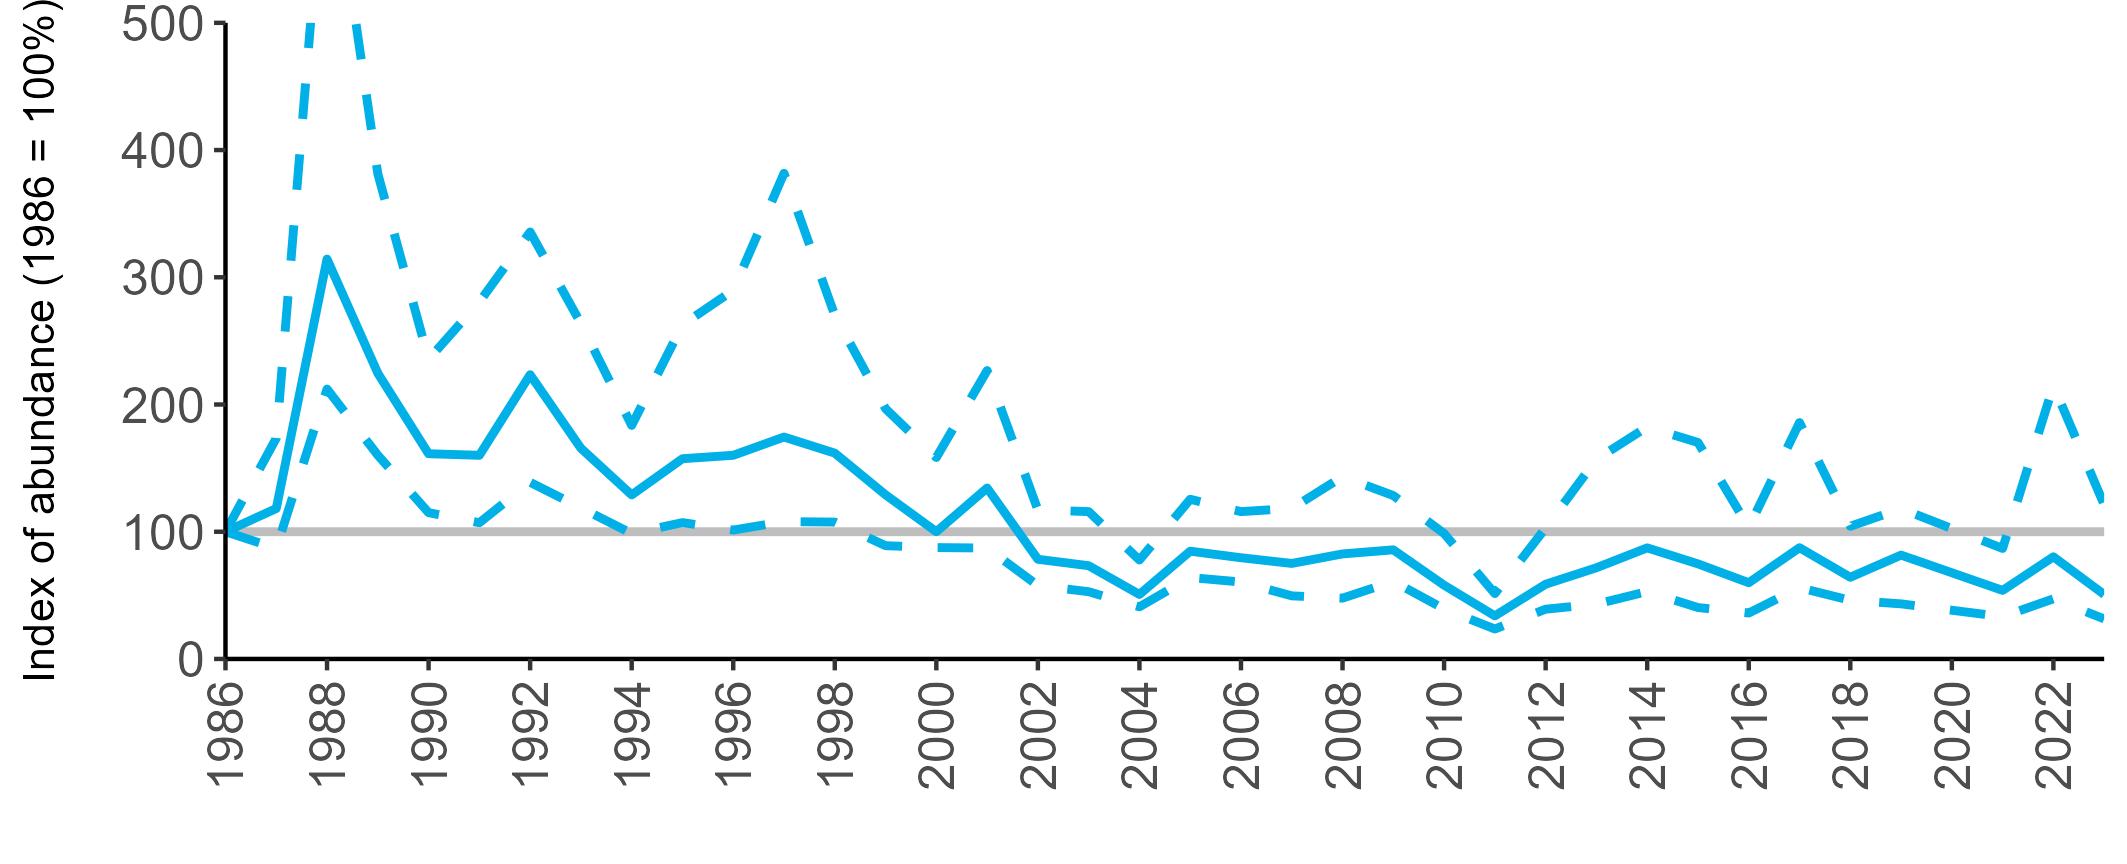
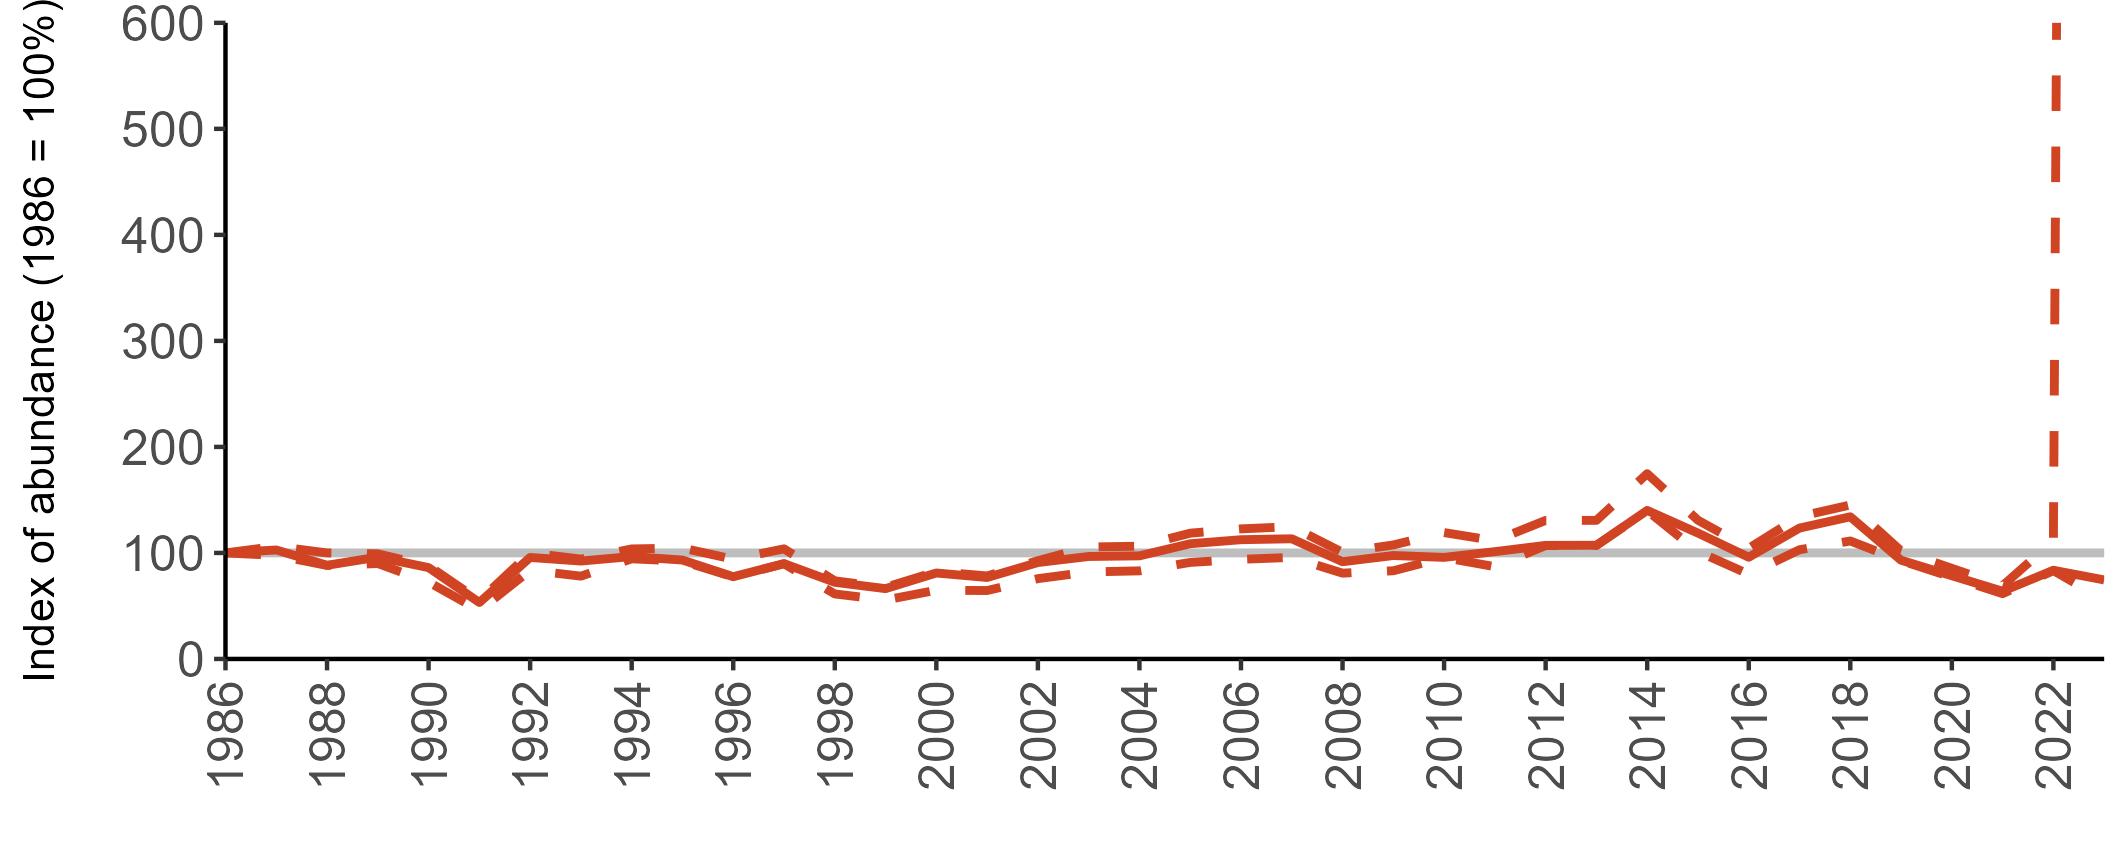
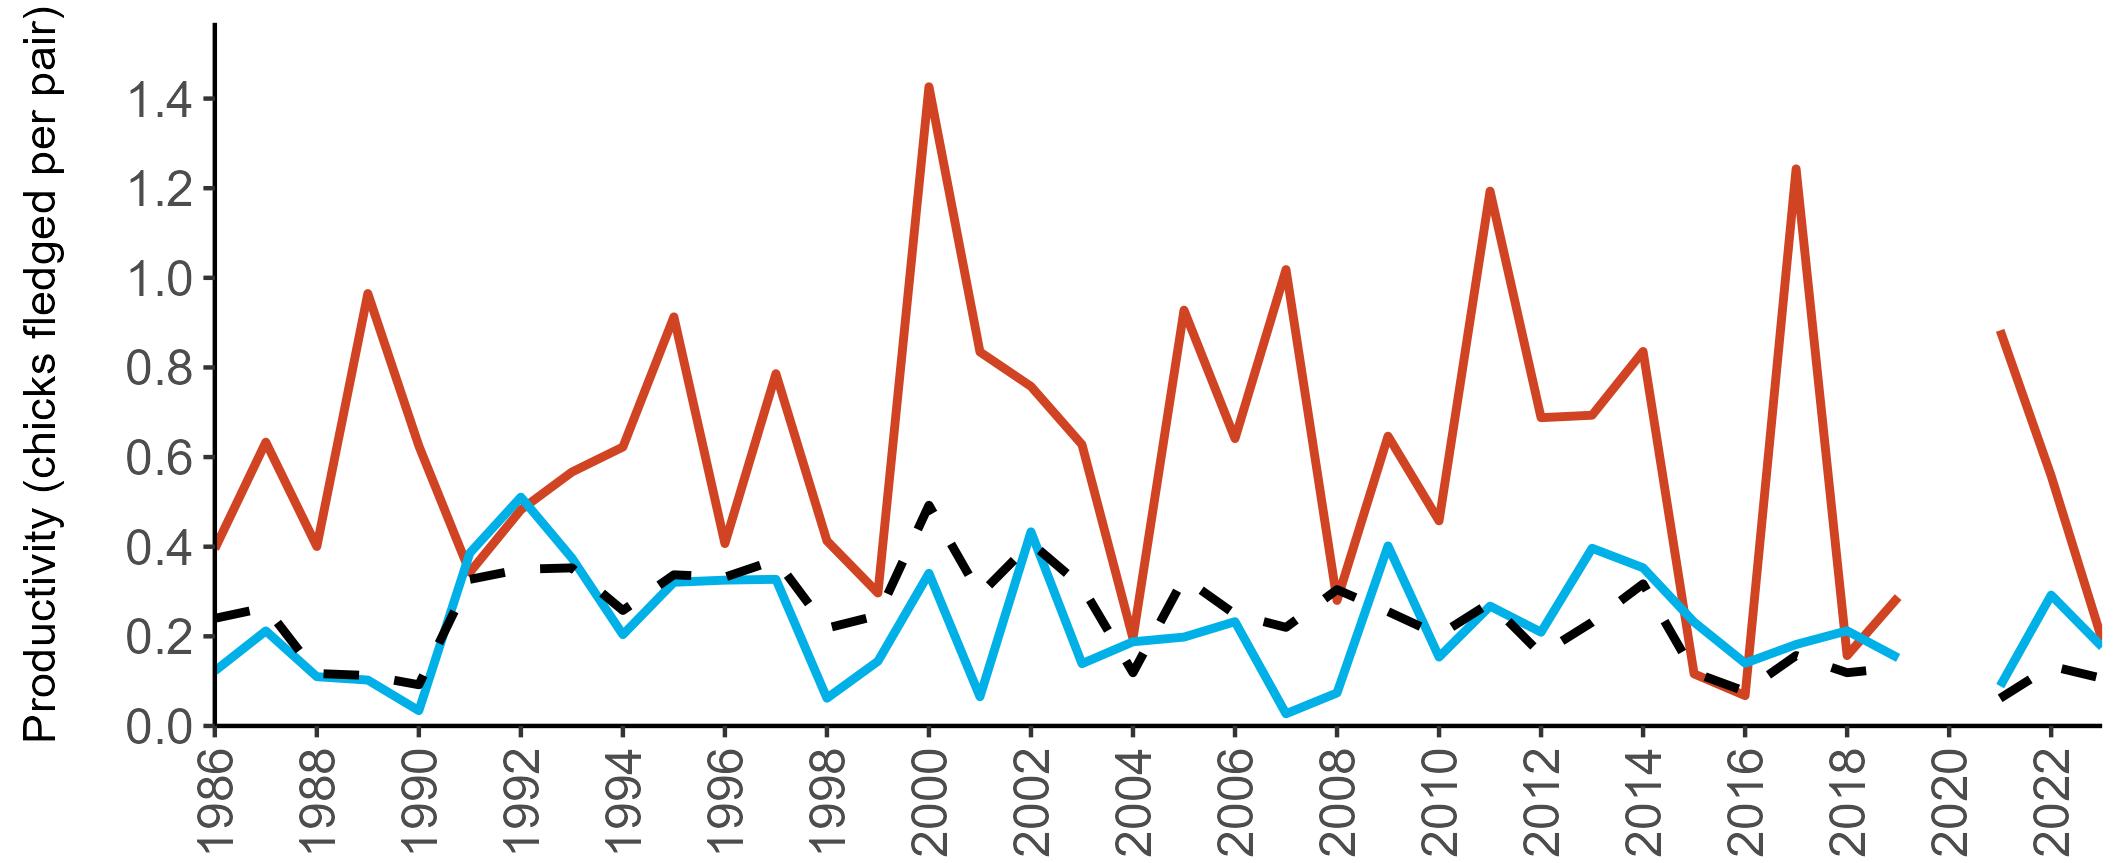
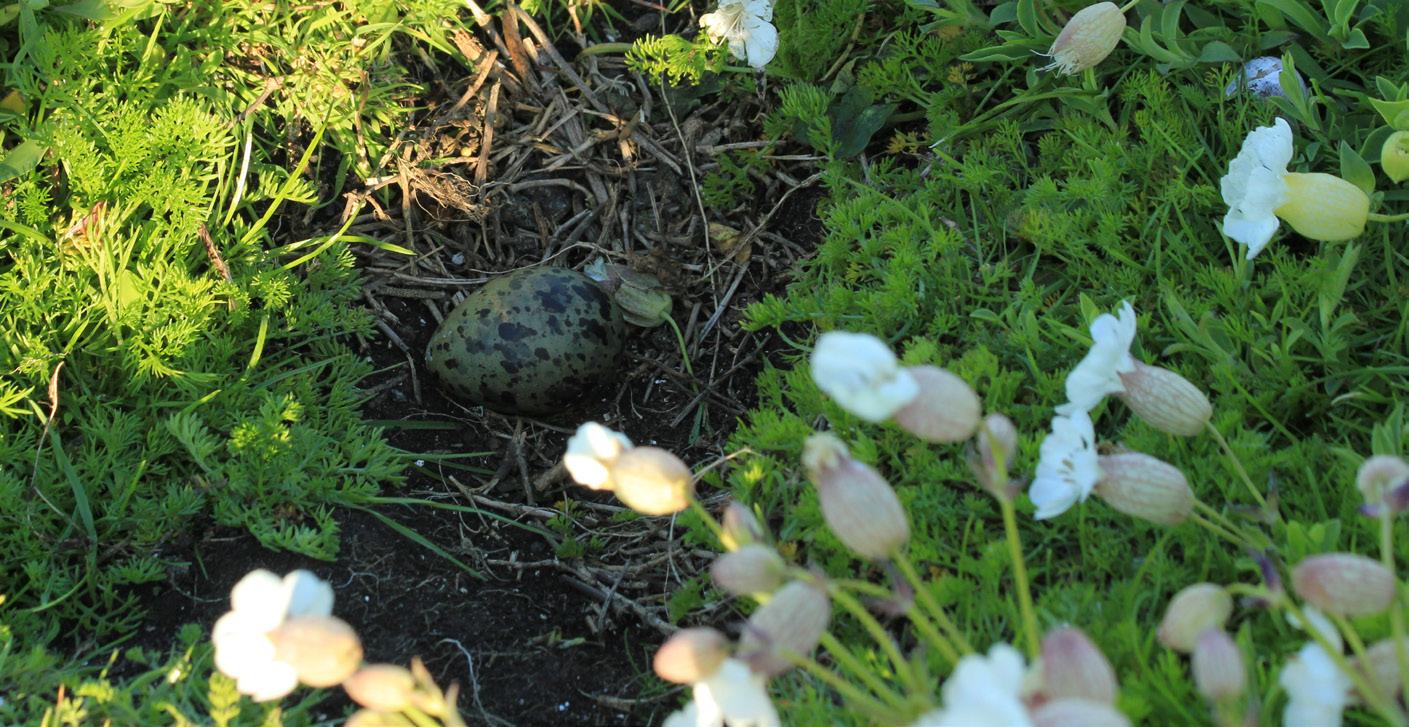
has remained relatively stable, but below the baseline, since the early 2000s, with an index value of 49% below the 1986 baseline in 2023 (Table 38). In comparison, there was a gradual, overall increase in the England trend in the early 2000s up to 2014, with a general decline since. The index value for England in 2023 was 25% below the 1986 baseline (Table 38:). However, the upper confidence interval in 2023 is very large, indicating a high degree of uncertainty, as data was missing from key colonies, and the value should therefore be treated with caution.
Too few data are currently submitted to the SMP in other regions to allow for the calculation of meaningful abundance trends.
The productivity trends for Arctic Tern have been relatively similar for the UK and Scotland over the SMP monitoring period (Figure 58). By contrast, the productivity values for England have generally been higher and show a considerable fluctuation in values between years. In 2023, the mean productivity estimates were similarly low across all three regions, with 0.11 chicks fledged per pair in the UK, and 0.18 and 0.19 chicks fledged per breeding pair for Scotland and England, respectively (Table 38).
Too few data are submitted to the SMP on productivity of Arctic Terns in other regions to calculate any meaningful average productivity values.
No data have been collected as part of the SMP.
recreational activities, and predation. Loss of Arctic Tern eggs, chicks and adults through predation by American Mink (Neovison vison), are thought to have contributed to local population declines, e.g. in western Scotland (Craik 1997). Additional predators include rats, gulls, corvids and European Hedgehogs (Erinaceus europaeus) (Burnell et al. 2023; Booth Jones 2020).
Arctic Terns may be more dependent on sandeels as prey items than the other tern species breeding in Britain and Ireland, and show less flexibility in diet – when their preferred food source declines, they do not readily switch to alternative prey (del Hoyo et al. 1996). In the main Arctic Tern breeding areas in Britain, there are also few alternative energy-rich fish available, so any change in sandeel abundance, such as those currently caused by climate change, can have serious effects. Indeed, declines in sandeel availability have been shown to lead to Arctic Tern breeding failures (Monaghan 1992; Schreiber & Kissling 2005; Vigfusdottir et al. 2013). After an increase of the sandeel stock around Shetland during the 1970s and early 1980s, a collapse between 1984 and 1990 resulted in declines in the local Arctic Tern population (Bailey 1991; JNCC 2021).
Climate change is also likely to impact Arctic Tern populations through increased storminess, which may hinder foraging ability, and extreme weather events, which can cause nests to flood (Wright & Wilde 2015; Rendell-Read 2016; Short & Watts 2016). The British and Irish population of Arctic Tern is at the southern edge of its range, and predictions of range constrictions for the UK seabird population in response to climate change suggest that in future its population may become restricted to only the most northerly coasts and islands of Scotland (Daunt & Mitchell 2013).
Additional pressures on Arctic Terns include human disturbance through
Legislation to protect Arctic Terns from hunting and egg collecting in the early part of the 20th century led to historic increases in the UK population (JNCC 2021).
Successful Arctic Tern colony site management techniques have included the eradication or control of American Mink (Craik 1997; 2015; Nordström et al. 2004; Mavor et al. 2006), water level control, prevention of public access, and control and/or exclusion using electric fencing of predatory mammals (Daly et al. 2016).
In common with many seabird species, active management of breeding sites alone will be insufficient to deal with all the pressures faced by Arctic Terns. Pressures resulting from the effects of climate change will be particularly challenging to address, given the wide-ranging nature of the likely impacts. These have the potential to affect both their breeding success in summer and their foraging ability in winter months, through a reduction in the pack ice habitat in Antarctica on which they depend for feeding opportunities (Burnell et al. 2023).
Monitoring and research on Arctic Tern populations will prove vital to assessing the impact of these changes and inform conservation actions.
HPAI caused Arctic Tern mortalities during 2021 and 2022 but these were relatively minor, with a 2% decline in sites surveyed between 2015–21 and 2023 (Buckingham et al. 2022; EFSA et al. 2022; Falchieri et al . 2022; Tremlett et al. 2024). However, continued tracking of the impacts of HPAI across all UK seabird species is advisable.
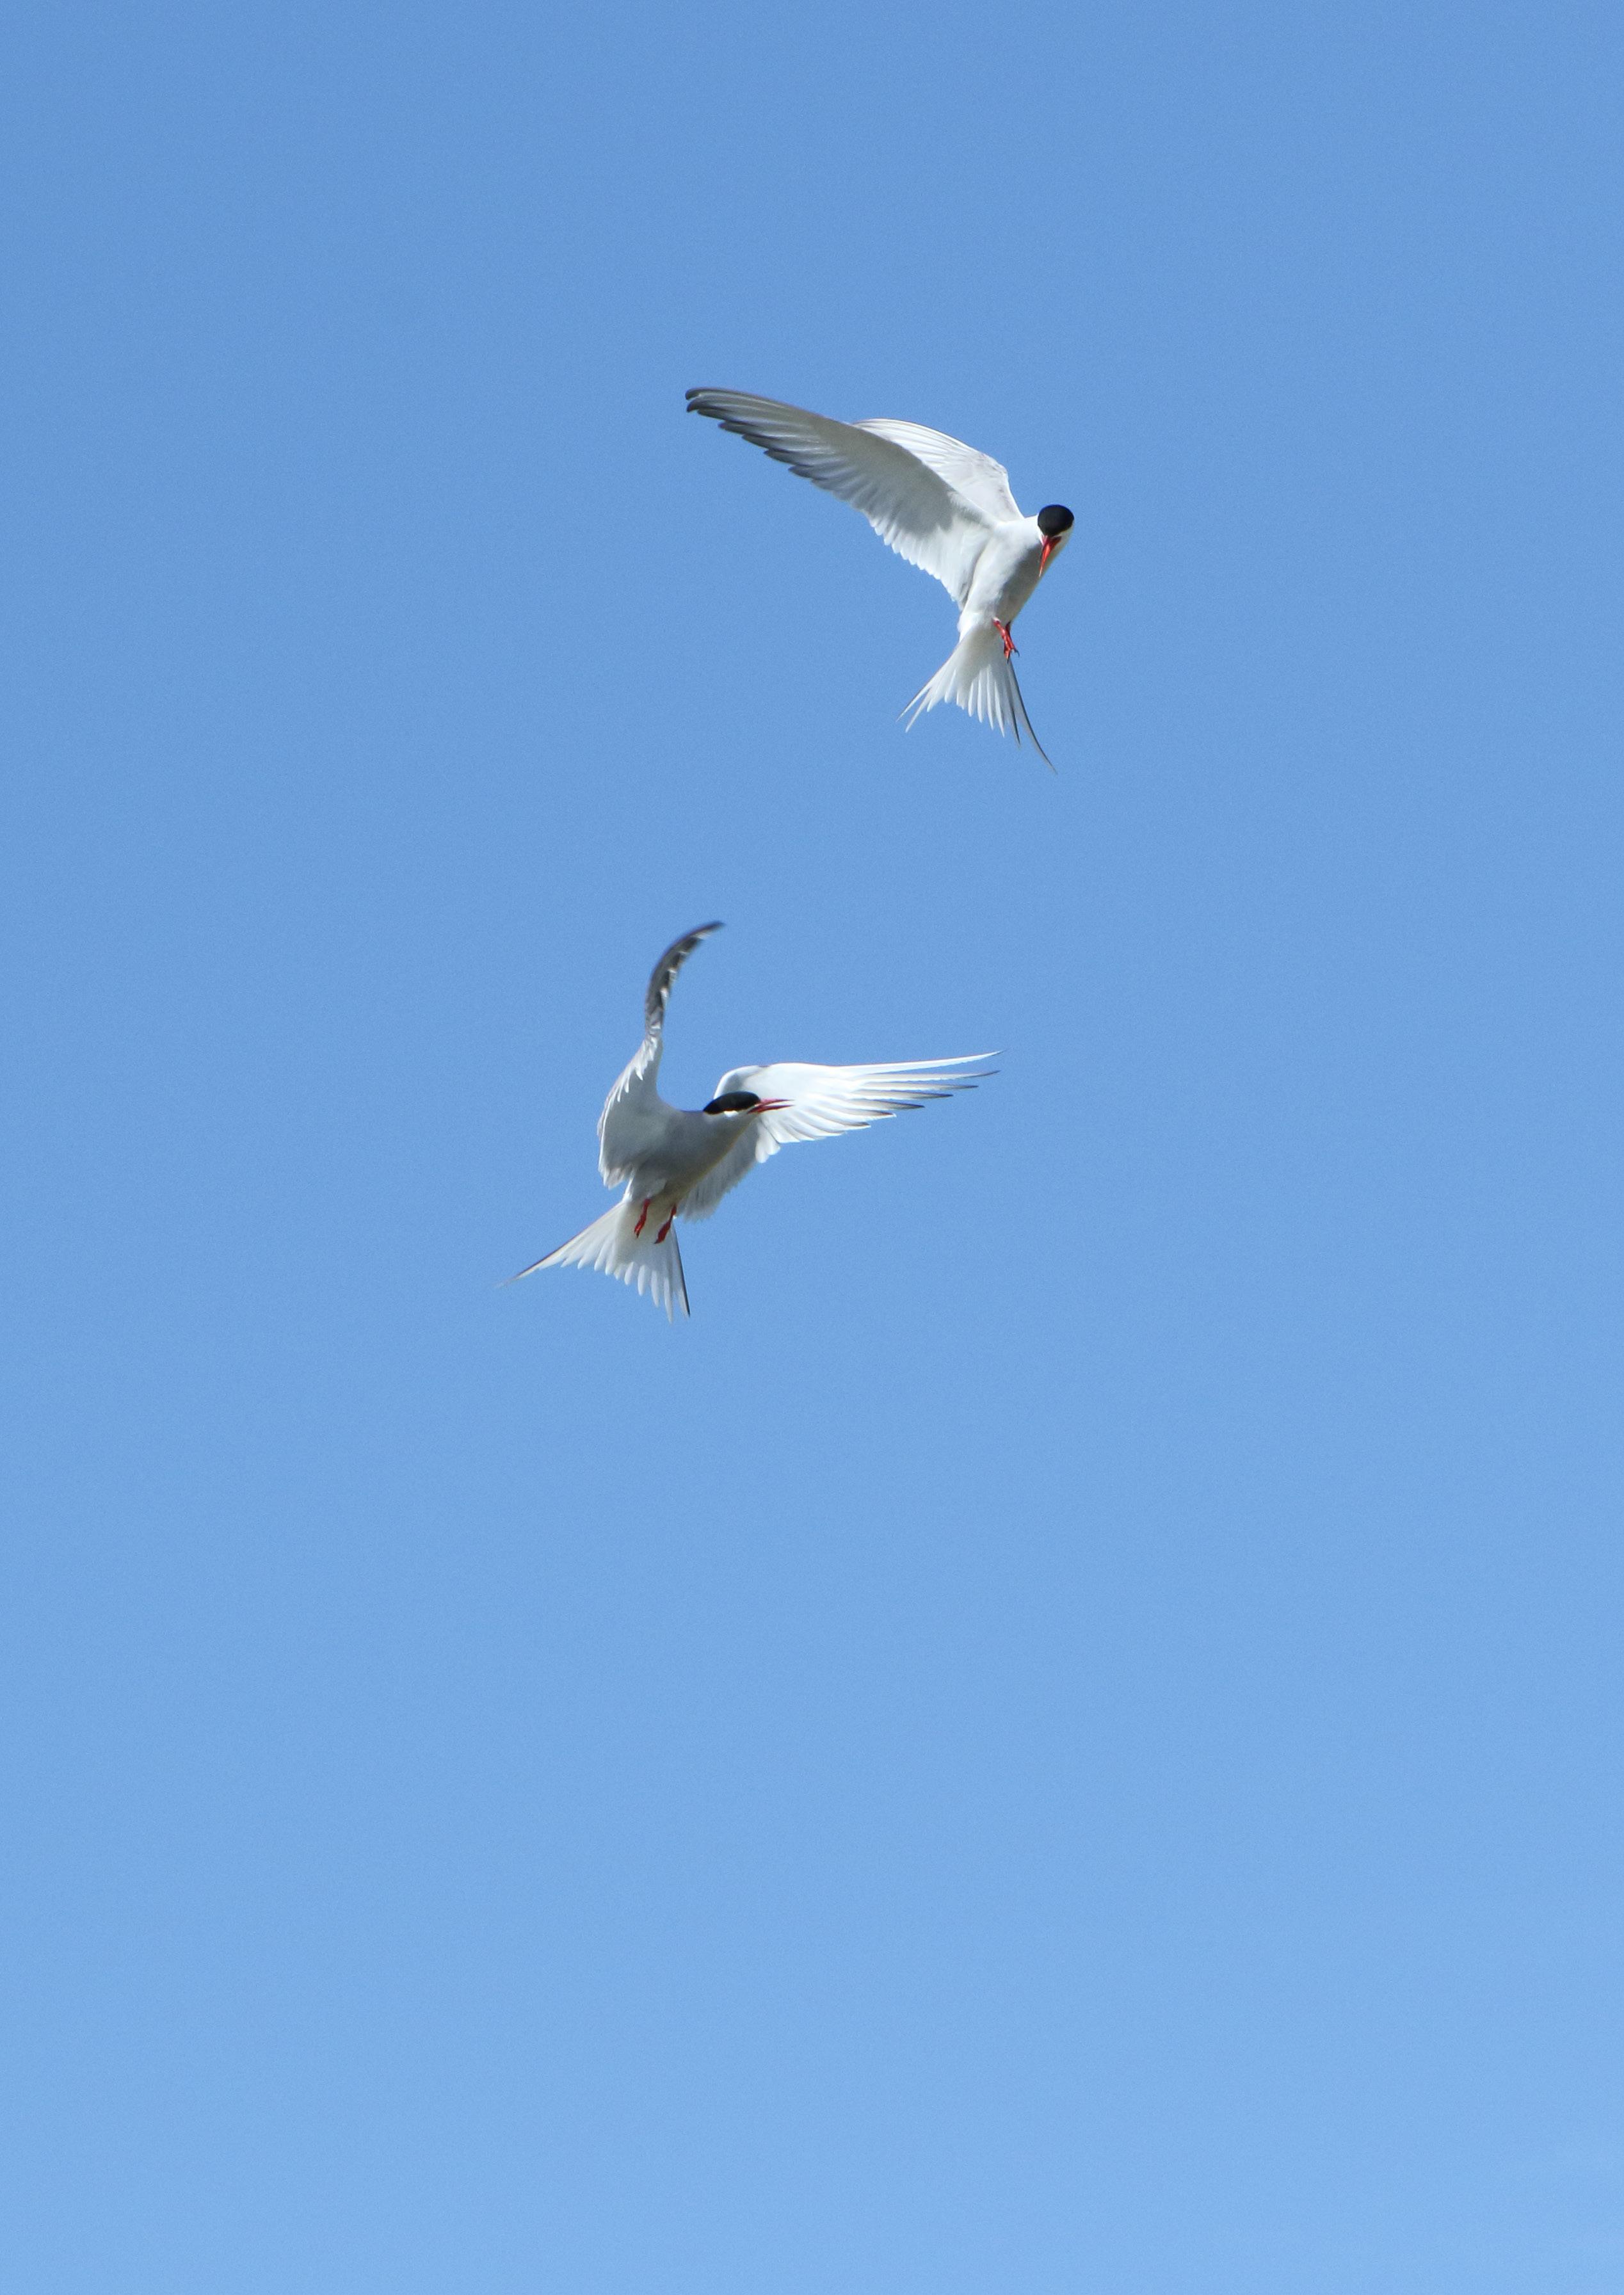
c.2—3%
ssp. albifrons
Amber-listed
Amber-listed (I)
Abundance: Decline
Productivity: 0.64
Colony Count sites: 59
Breeding Success sites: 46
Least Concern Lifespan: 12 years
Breeding age: 3 years
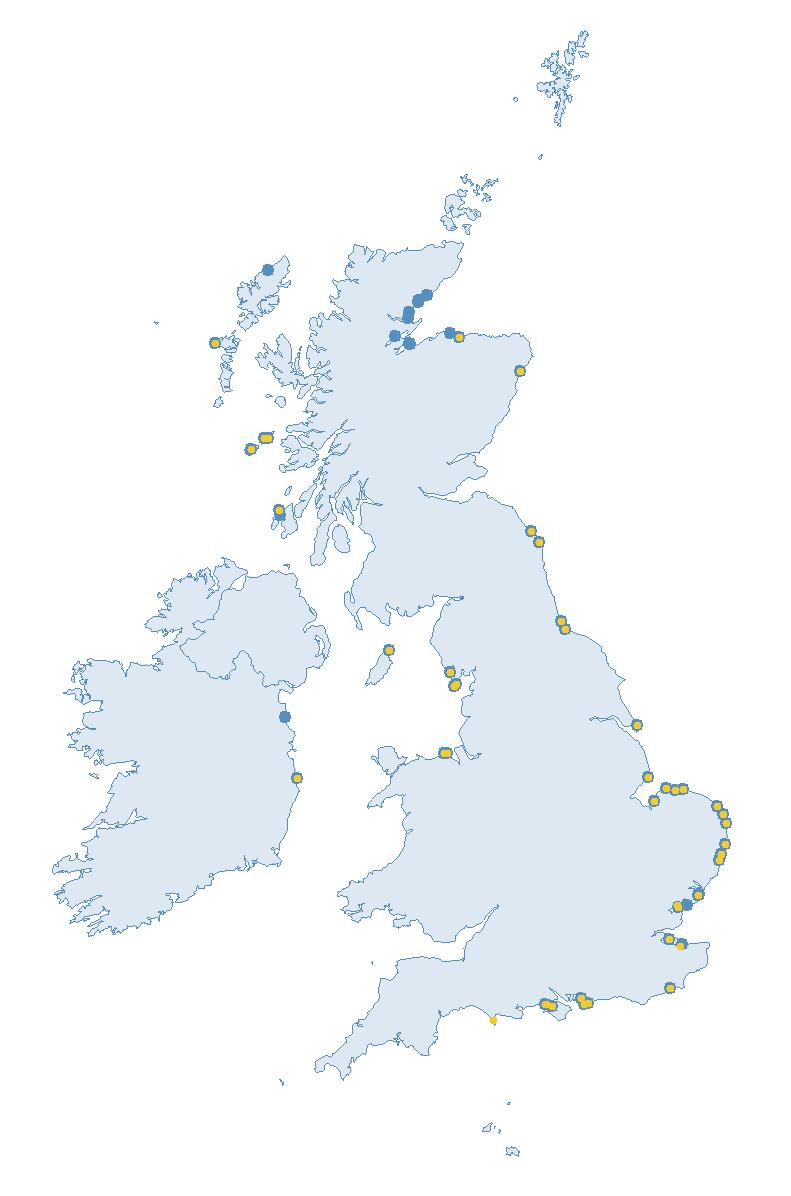
Britain and Ireland host around 1—2% of the world’s breeding Little Terns, but approximately 2—3% of the subspecies albifrons (Burnell et al. 2023). Every summer in Britain and Ireland, wardens are employed to help manage and protect key Little Tern breeding areas from predators and human disturbance (BTO 2023a).
Little Terns breed in scattered locations across much of Britain and Ireland, with the largest colonies located in East Anglia, North Wales and south-east Ireland (Burnell et al. 2023).
Globally, they are found across much of Europe and Africa, western, central and the east coast of Asia, and in parts of Australasia (BirdLife International 2024). They are migratory, with northern birds moving further south in the winter (Tavecchia et al. 2006).
Little Terns feed by plunge-diving or dipping. Their prey varies according to locality, but is primarily small fish, crustaceans and invertebrates (del Hoyo et al. 1996; Paiva et al. 2008).
In the UK, Little Terns exclusively breed along the coast, on beaches, spits or inshore islets. They have a small foraging range in the breeding season. Active breeders usually feed less than 6 km from the colony, which limits colony location to being within a short distance from suitable feeding
grounds, whereas failed breeders have been shown to occupy home ranges of 52 km 2 in Norfolk, England (Perrow et al. 1996).
Their nests are shallow, wellcamouflaged scrapes on the ground, where a clutch of 2–3 eggs are laid (Burnell et al. 2023; JNCC 2021).
In other parts of their global breeding range they also nest inland, around more marshland habitat, where their nests consist of broken up shells and vegetation (del Hoyo et al. 1996).
BREEDING ABUNDANCE
The 23-year SMP abundance trends for the UK and England (Table 40) are similar to those reported by the Seabirds Count census (Burnell et al. 2023). For the UK, the SMP trend showed a decline of 14%, whereas there was a slightly larger decline of 25% between the Seabird 2000 and Seabirds Count censuses. The values were more aligned for England, where there was a decline of 27% in the SMP trend and a decrease of 32% between censuses. The trend values differed markedly in Scotland however, with a
72% decline in the SMP trend and a 29% decline in Seabirds Count totals compared with Seabird 2000. It should be noted that the proportion of adult Little Terns choosing to nest each year can fluctuate, and as a consequence it is thought that annual counts, such as those conducted through the SMP, may provide more accurate trends than widely spaced censuses (JNCC 2021).
There has been a continuous overall decline in the long-term abundance trends for Little Tern over most of the SMP monitoring period for the UK, England and Scotland, and figures have largely remained below the 1986 baseline (Figures 59–61). However, the trends improved for the UK and England (where a large proportion of the Little Tern colonies are monitored) between 2019 and 2021, before dropping again in 2022. In 2023, the index values for the UK and England were 26% and 38% below the 1986 baseline, respectively, whilst the index value for Scotland was much lower at 83% below the baseline (Table 40).
Too few data are currently submitted to the SMP in other regions to allow
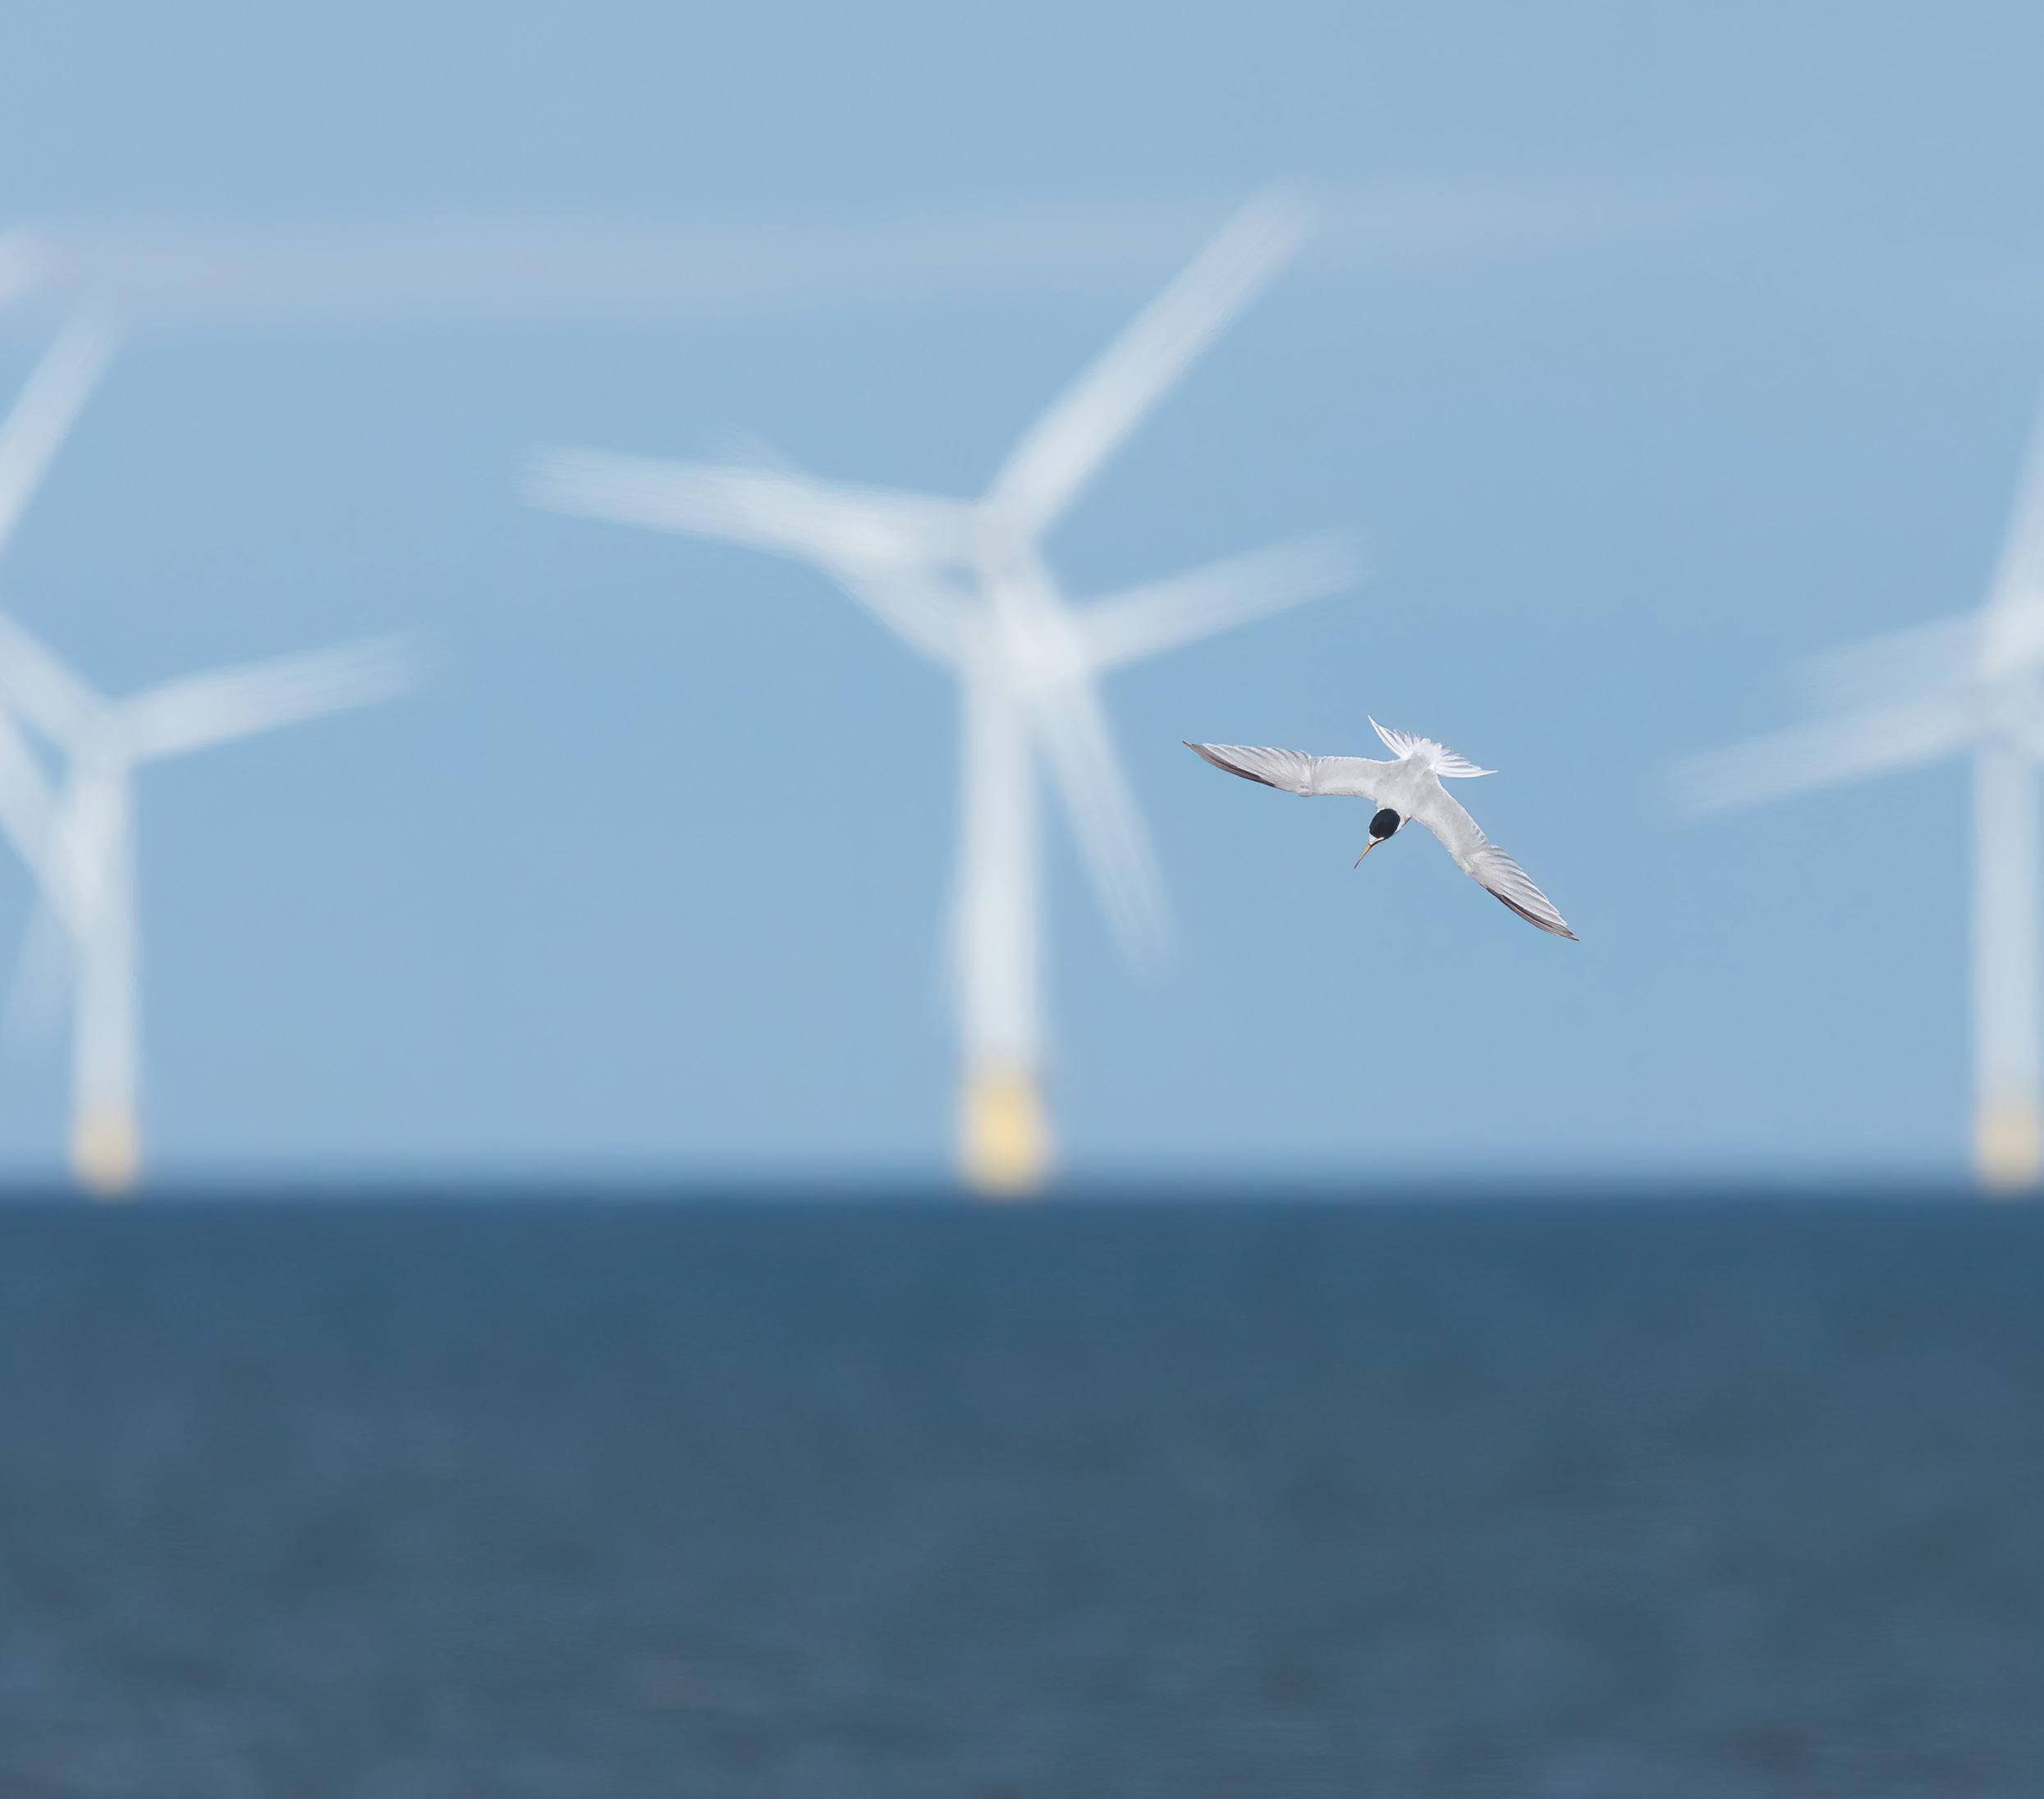
Abundance (AON) Seabird 2000 (1998—02)
Abundance (AON) Seabirds Count (2015—21)
All Britain, Ireland, Isle of Man and Channel Islands

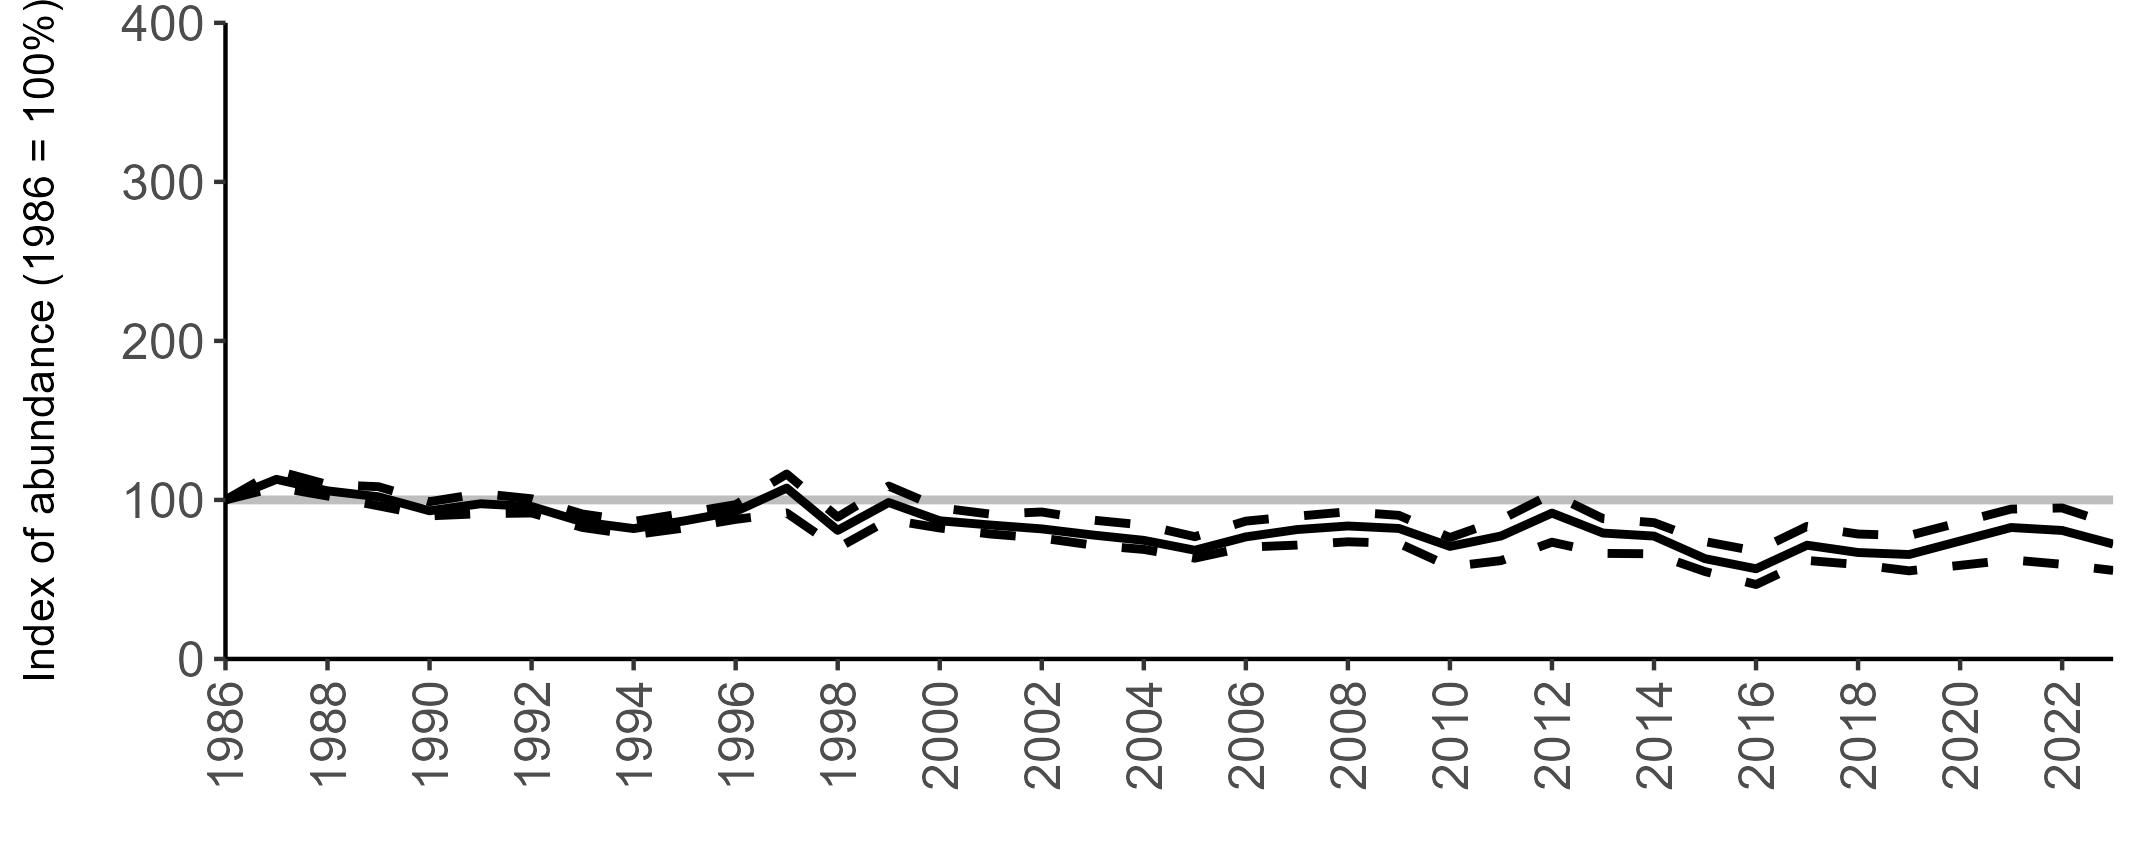
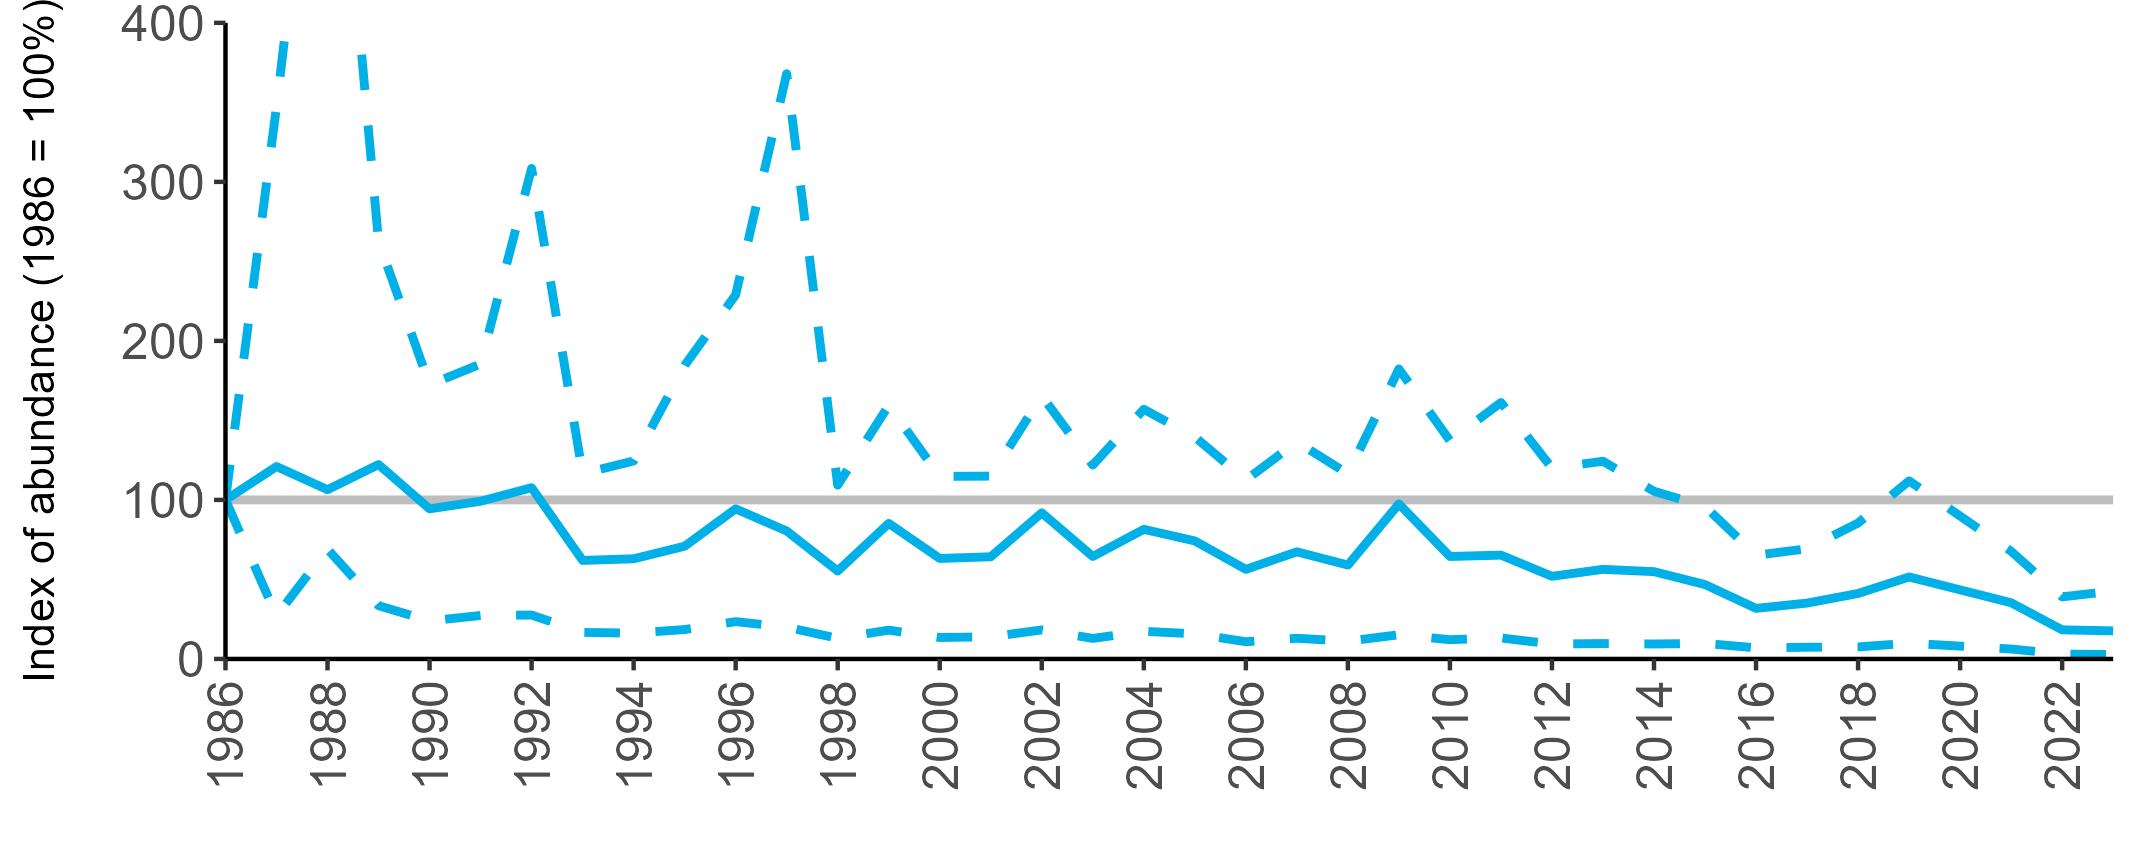
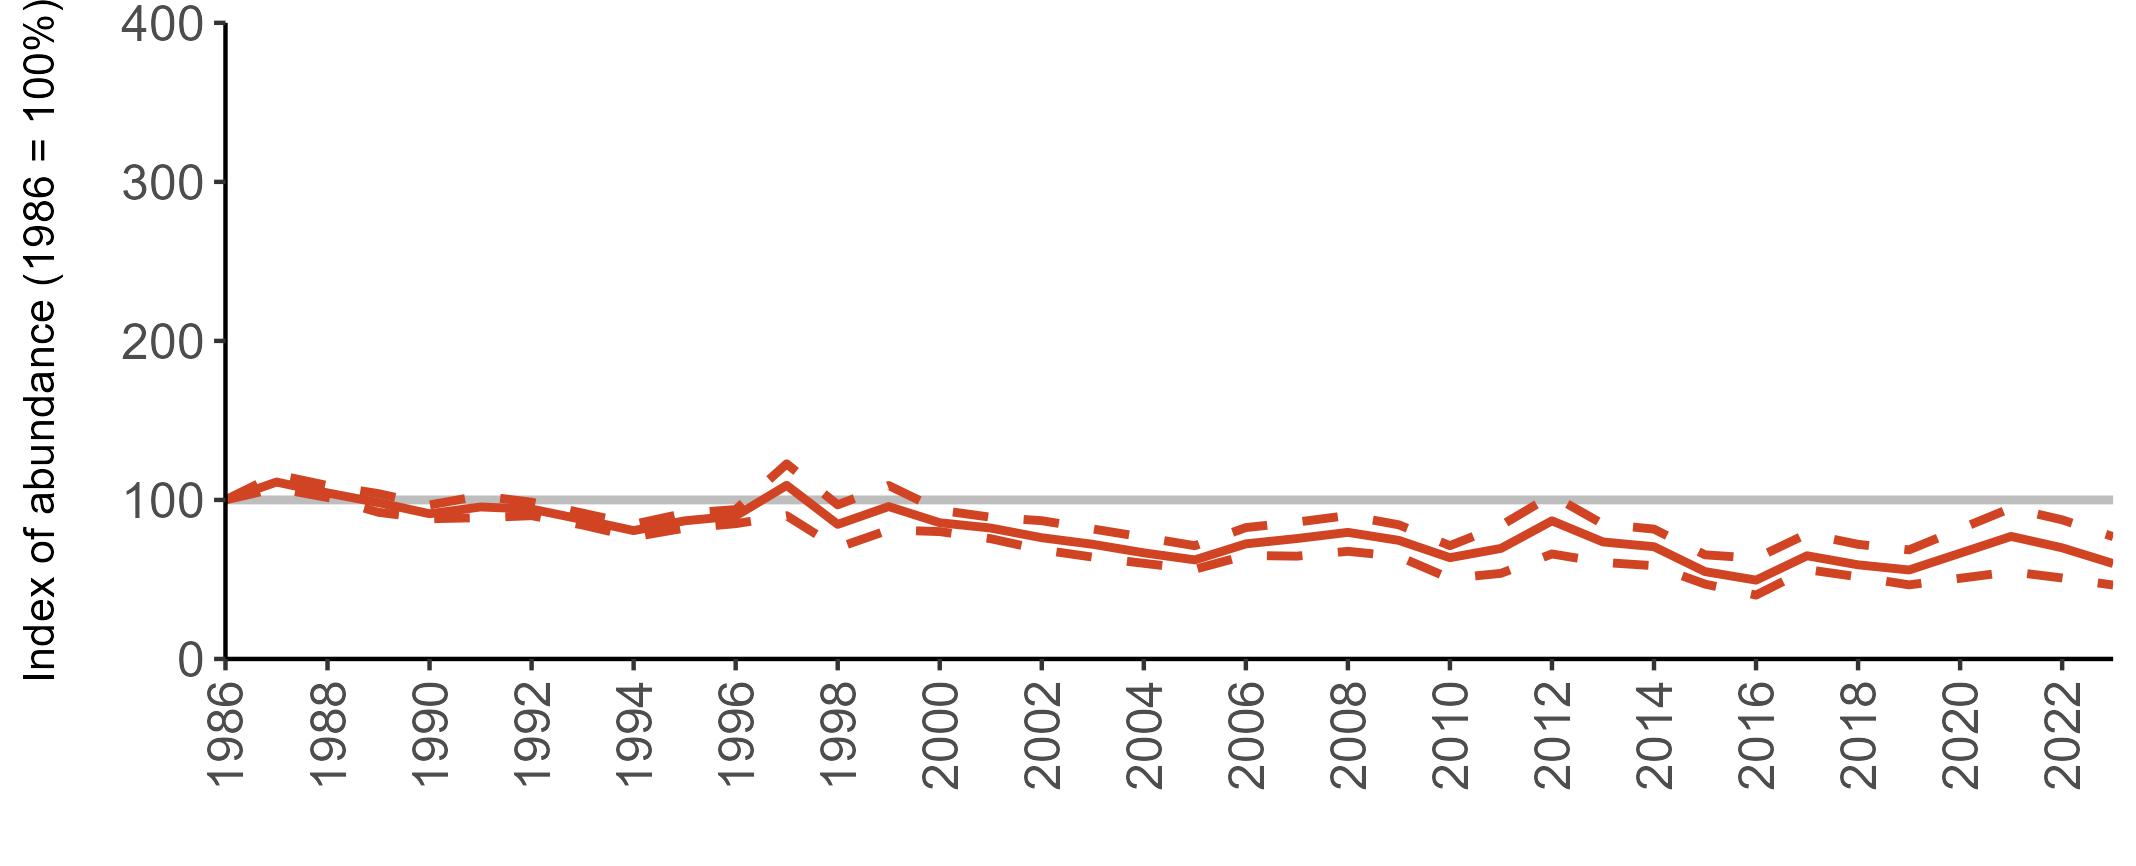
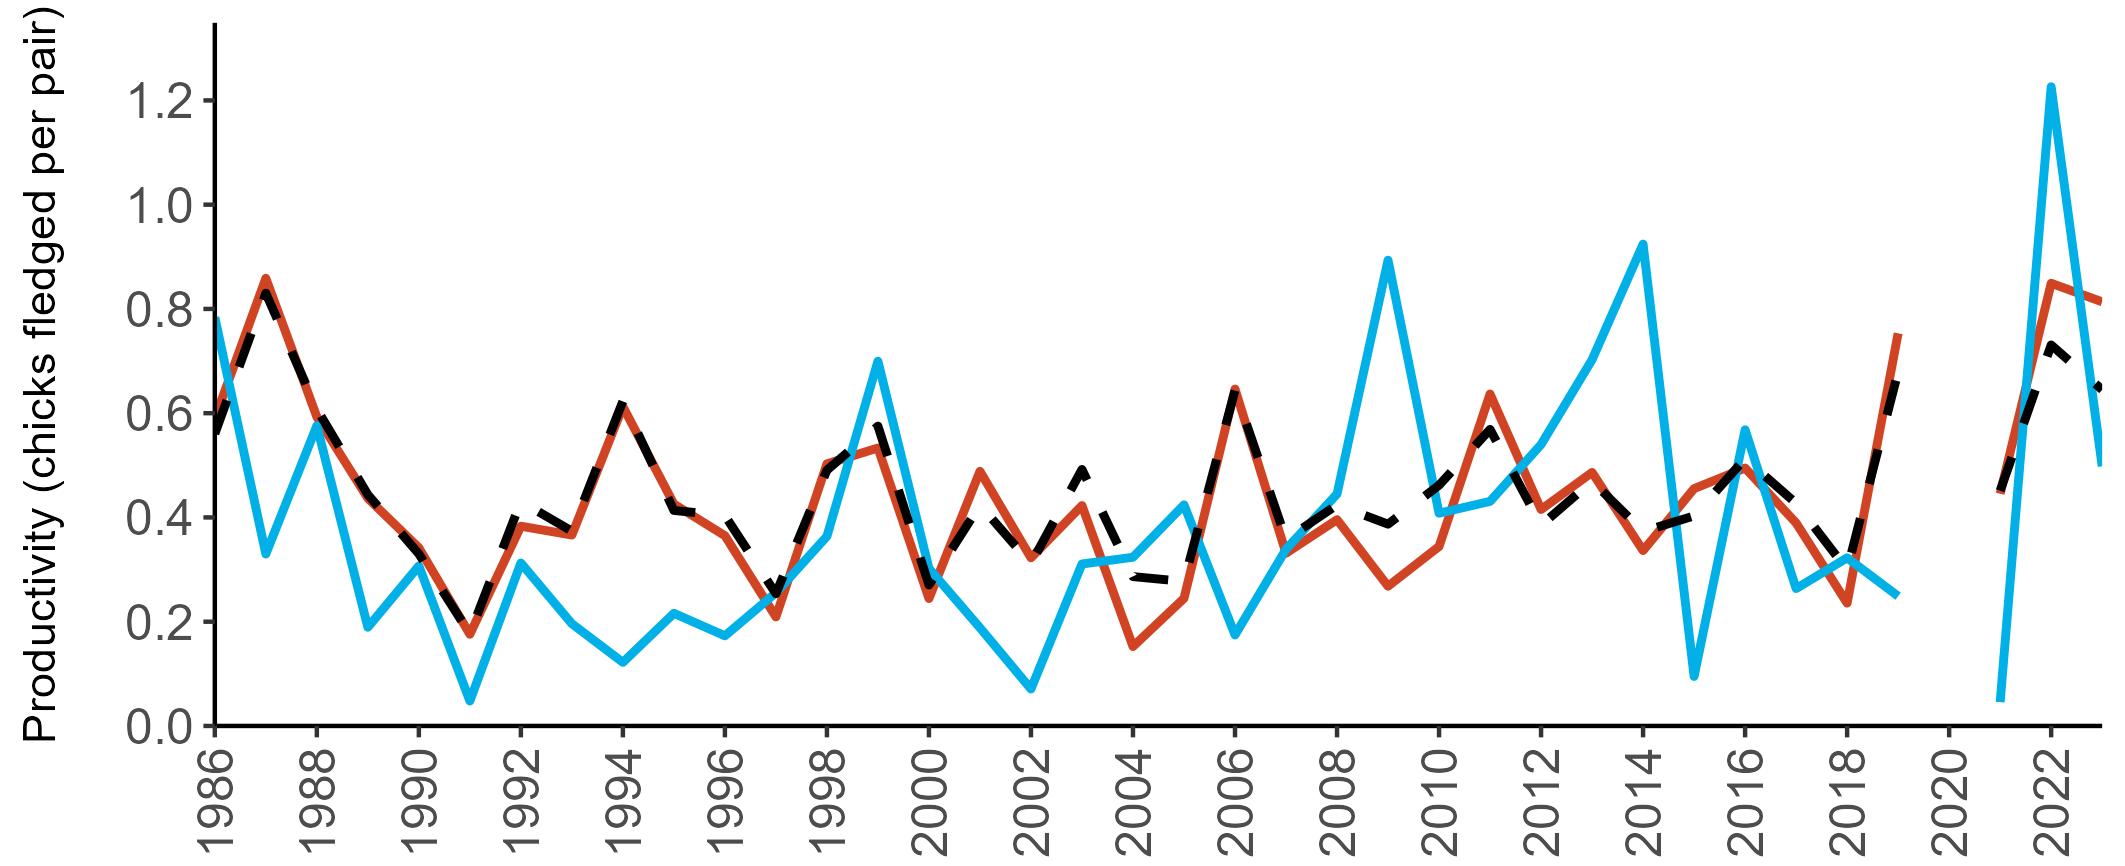
for the calculation of meaningful abundance trends.
The UK and England productivity trends for Little Tern are closely matched, as a large proportion of UK monitored sites are in England, whilst the Scottish values are often quite different, but all have fluctuated widely and there are no apparent trends over the years (Figure 62). Productivity for all regions has been below the figure of 0.70 chicks fledged/pair thought to be needed to maintain population stability (Cook & Robinson 2010) for much of the SMP monitoring period. There was a crash in Little Tern productivity in Scotland in 2021, and this country also had the lowest mean productivity value in 2023, at 0.50 chicks fledged per pair (Table 40). Values for the UK and England were higher, at 0.64 and 0.81 chicks per pair, respectively.
Too few data are submitted to the SMP on productivity of Little Tern in other regions to allow for calculation of productivity values.
No data have been collected as part of the SMP.
One of the biggest pressures on Little Terns is human disturbance, as their preferred nesting beaches are often busy with recreational users (JNCC 2021; Ratcliffe et al. 2008b). However, many Little Tern nesting colonies are wardened to reduce disturbance levels.
Loss of nesting habitat due to increases in extreme weather events alongside erosion, sea level rise and extreme high tides is also becoming an increasing pressure on nesting birds (Rendell-Read 2018; MacleodNolan 2020), and further habitat loss through encroachment of vegetation is a problem at some colonies, e.g. Beacon Ponds, East Yorkshire (England) (Hunton 2024).
Little Terns are also subject to predation from a wide range of both mammalian and avian predators, such as Red Foxes (Vulpes vulpes), European
Badgers (Meles meles), European Hedgehogs (Erinaceus europaeus), Stoats (Mustela erminea), Kestrels (Falco tinnunculus) and corvids (Rendell-Read 2018; Macleod-Nolan 2020; JNCC 2021).
Successful management techniques for Little Tern colonies include wardening, signage and barriers to reduce disturbance, predator fences, diversionary feeding of predators, and habitat management to reduce erosion and vegetation encroachment (BTO 2023a; Burnell et al. 2023; Fasola & Canova 1996; JNCC 2021; Mederios et al. 2007; Ratcliffe et al. 2000; Smart & Amar 2018; Wilson et al. 2020). Habitat creation, through managed realignment of coastal defences and the creation of artificial islands, is also likely to have beneficial impacts on the UK Little Tern population.
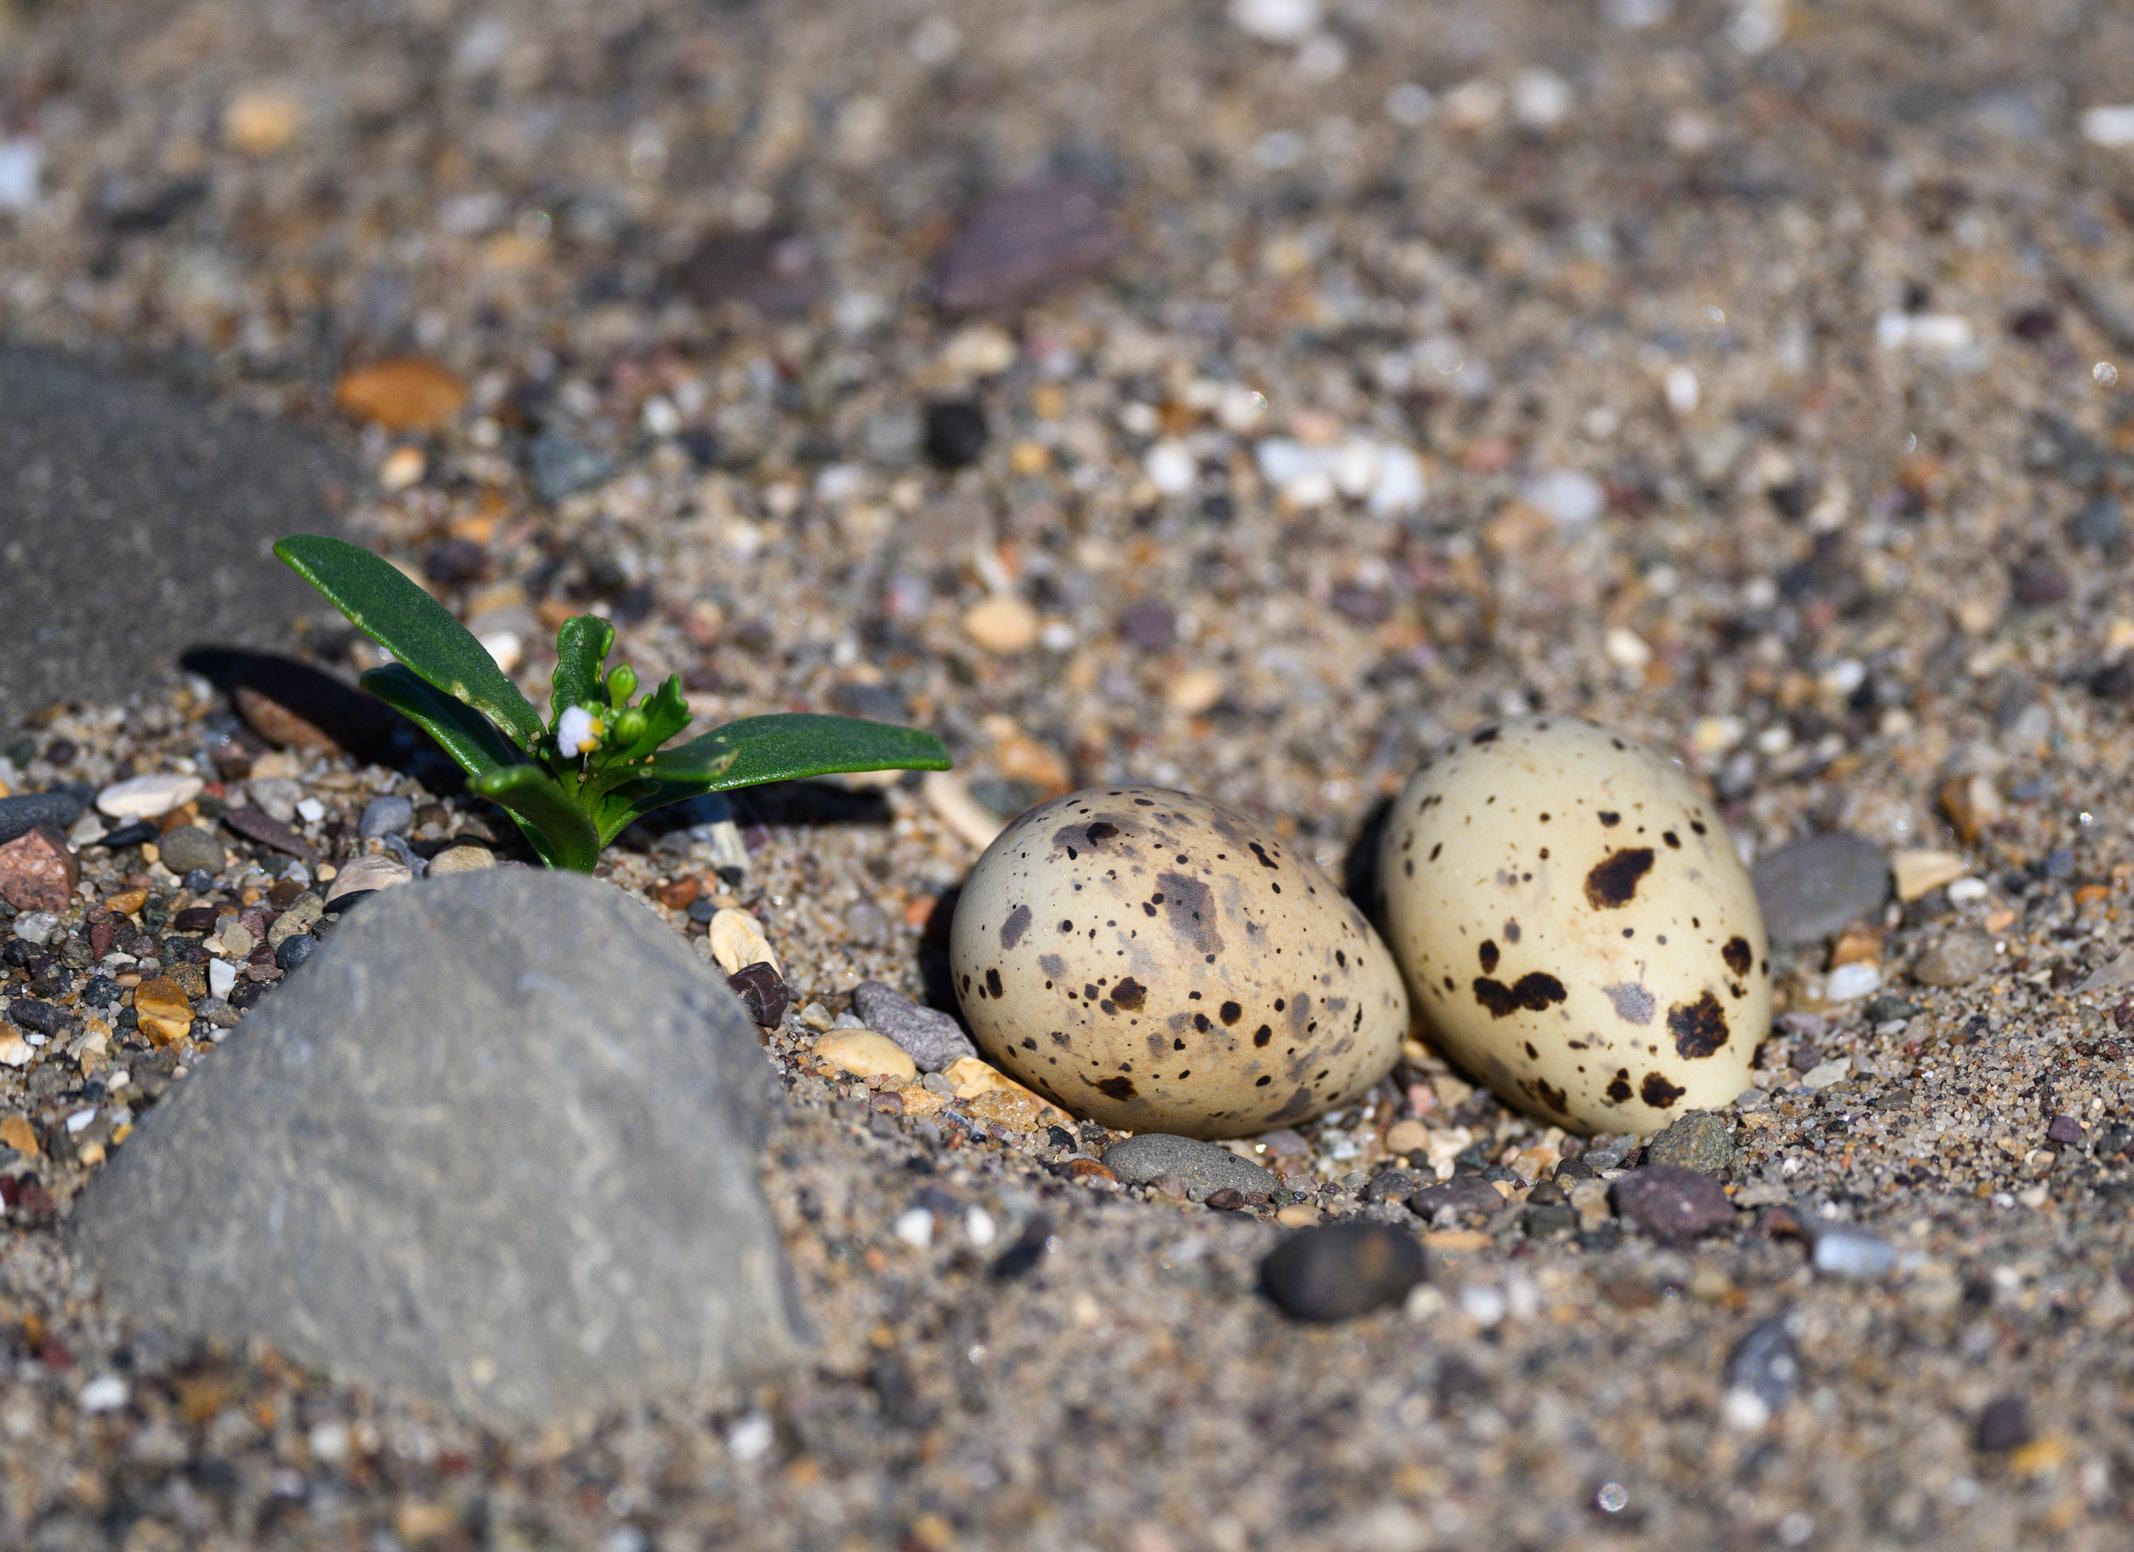
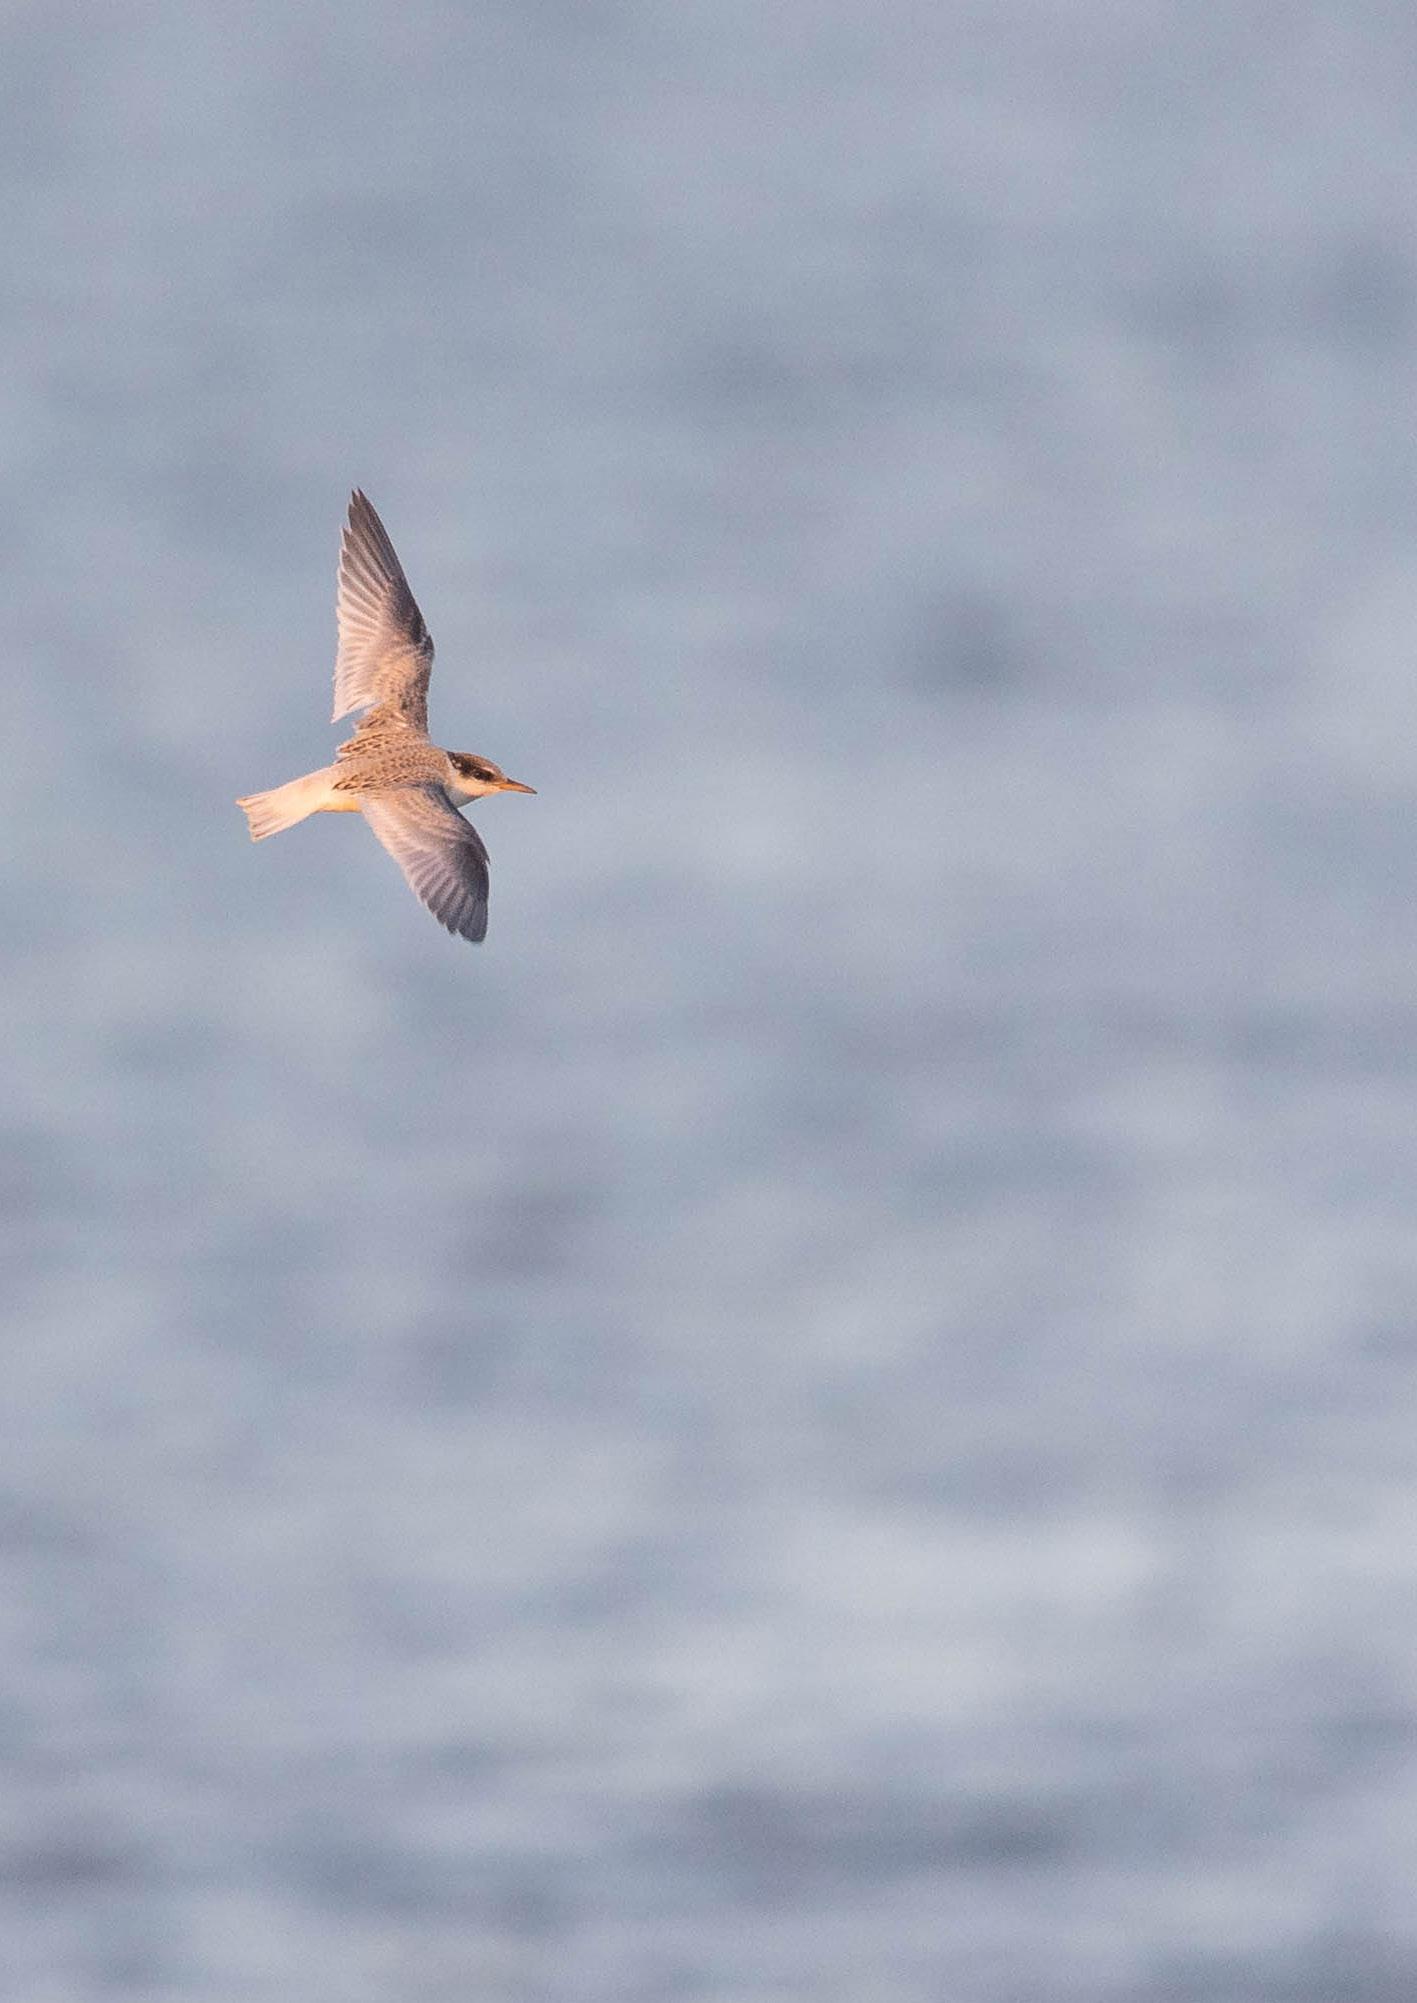
Amber-listed
Amber-listed (I)
Abundance: Increase
Productivity: 0.37
Colony Count sites: 121
Breeding Success sites: 10
Least Concern Lifespan: 23 years
Breeding age: 5 years

in 2023
Britain and Ireland host approximately 8% of the global breeding population of Guillemots (Burnell et al. 2023). Two of the five subspecies breed in Britain and Ireland: Uria aalge aalge, which is a darker and larger and is found across much of Europe as far south as northern England, and Uria aalge albionis, which has a browner mantle, is smaller, and is found in the rest of England, Wales and Ireland, as well as Helgoland, parts of France and Iberia. There is also a ‘bridled’ morph, with a white eye ring and spectacle, which increases in frequency in northern latitudes of the Atlantic Ocean (JNCC 2021).
Guillemot breeding colonies can be found around the British and Irish coastlines wherever there are suitable cliffs (Burnell et al. 2023).
Globally they have a circumpolar distribution across the northern Atlantic and Pacific Oceans, and low-arctic areas of the Arctic Ocean (BirdLife International 2024).
In winter, British and Irish birds can be seen across all coastal waters, with larger numbers in the north and west (BTO 2023a).
Guillemots predominantly feed on small fish such as sandeels, clupeids and gadids, although crustaceans and molluscs may also be taken (Anderson et al. 2014; Lorentsen & AnkerNilssen 1999; Sonntag & Hüppop 2005). In winter, they venture further offshore to deeper waters, diving up to 180 m in search of prey (Piatt & Nettleship 1985).
Guillemots nest preferentially on ledges on steep sea cliffs, but can also be found in boulder scree. They lay a single egg directly onto the bare rock. They are generally found in large colonies, and breeding success is highest when breeding in higher densities or at sites well protected from predators (JNCC 2021). Breeding densities can reach approximately 20 pairs per m 2 (JNCC 2021).
Juvenile Guillemots leave the nest before their wings have fully grown. When ready to leave the breeding ledge, they jump off the cliff to the beach or waves below and swim out to sea, guided by their male parent (Hjernquist et al. 2012).
BREEDING ABUNDANCE
The Guillemot SMP abundance trends since 2000 (Table 42) are similar to those reported by the Seabirds Count census (Burnell et al. 2023). For the UK, the SMP showed a stable trend, with a small increase of 2% since
the index (JNCC 2021). Therefore, these values should be treated with caution. In 2023, a greater number of colonies, including large colonies, were counted than in 2019 and 2022, due to enhanced monitoring for HPAI impacts (see pages 8–11), and the values are therefore likely to be more reliable. The 2023 long-term index values were 23% above the 1986 baseline for the UK and 9% below the baseline for Scotland (Table 42).
The Seabirds Count census also showed increases in the Guillemot populations for England, Wales, Northern Ireland, the Republic of Ireland and the Isle of Man, with a decline in the Channel Islands (Burnell et al. 2023). Unfortunately, current data submitted to the SMP for these regions are too sparse to produce valid SMP abundance trends for comparison.
higher than the UK (0.37) and Scottish (0.38) values (Table 42).
Too few data are currently submitted to the SMP in other regions to allow for the calculation of meaningful productivity trends.
Data on Guillemot breeding phenology are collected at the Key Site of Skomer Island (Wales), and also at Sumburgh Head in Shetland (Scotland) by the Shetland Oil Terminal Environmental Advisory Group (SOTEAG). Diet information is collected at the Key Sites of Canna, Fair Isle and the Isle of May (all in Scotland), and survival information is collected on Canna and the Isle of May.
Increases in the sea surface temperature are causing changes in the abundance and distribution of Guillemot prey, such as sandeels (Erikstad et al. 2013; Heath et al. 2009; Régnier et al. 2017; Riordan & Birkhead 2018; Wanless et al. 2005), potentially resulting in a switch to less energy-rich alternative prey items (Heubeck 2009). This is something Guillemot appear to be able to do more readily than some other seabird species, for example, the nutritionally-poor Snake Pipefish (Entelurus aequoreus) in the mid 2000s (Anderson et al. 2014). However, this can result in a lower breeding success
2000 (Table 42), whilst the Seabirds Count census reported a decline of 11% since the Seabird 2000 census (Burnell et al. 2023). For Scotland, the SMP trend indicated a decrease of 25% since 2000 (Table 42), whilst the Seabirds Count census showed a decline of 31% over a similar period (Burnell et al. 2023).
The long-term SMP abundance trends differ for the UK and Scotland over the SMP recording period (Figures 63 & 64). The trends were similar until 2001, following which the UK trend continued to gradually increase, whilst the Scotland trend declined. However the Scotland trend has also shown a gradual increase in more recent years. In 2019 and 2022, a large number of small colonies and few large colonies (>10,000 individuals) were counted and included in the abundance index analysis, causing uncertainty in these trend estimates, as the large number of smaller colonies included in the sample are likely to have had a disproportionate influence on
The productivity trends for the UK and Scotland are closely matched (Figure 65), as many of the monitored colonies are in Scotland. In both regions, productivity was relatively stable between 1986 and 2002, before a steep decline until 2007, following which values maintained a higher level. Productivity values in England have shown a less consistent pattern, and there are some gaps in years where no data were submitted. In recent years, productivity values for all three regions have been similar, although in 2023 the English value (0.60 chicks fledged per breeding pair) was substantially
Guillemots face a wide range of current and potential threats in Britain and Ireland. They are particularly susceptible to severe winter storms, which reduce foraging opportunities and can in extreme cases lead to starvation. Climate change is increasing the frequency of these extreme weather events (Field et al. 2012), which can lead to many dead birds being washed up on beaches in an event known as a seabird wreck. In the winter of 2013/14, large wrecks occurred along British coasts, and post-mortems suggested starvation and some oil contamination as likely causes (Jessop 2014; Sellers 2014).
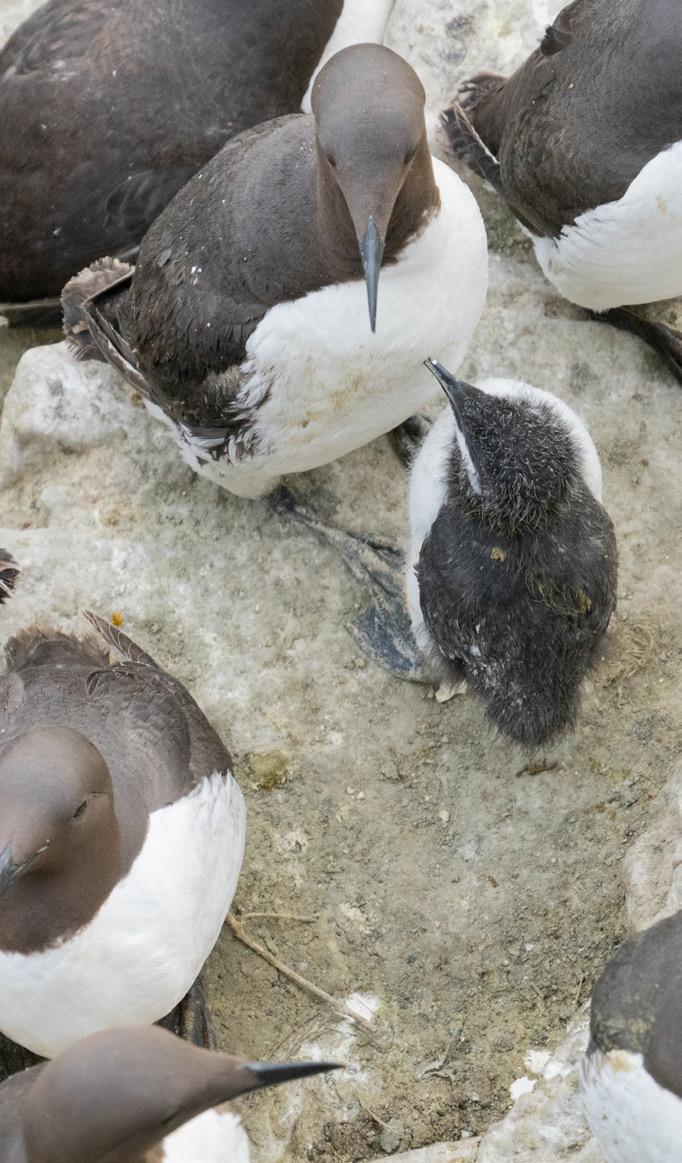
Abundance (IND) Seabird 2000 (1998—02)
Abundance (IND) Seabirds Count (2015—21) Percentage Change All Britain, Ireland, Isle of Man and Channel Islands
in areas where Guillemots are heavily dependent on sandeels in the breeding season.
Guillemot adults, eggs and chicks are vulnerable to predation during the breeding season by a range of species, including Hooded Crows (Corvus cornix), Carrion Crows (Corvus corone) and Herring Gulls (Booth Jones 2020). This threat increases in smaller auk colonies, which offer less protection for individual birds (Gilchrist 1999).
The commercial fishing industry can also negatively impact Guillemot populations through both bycatch, particularly in gillnets (Northridge et al. 2023), and overfishing of important prey species, which is likely to increase foraging pressure and decrease breeding productivity (Nettleship et al. 2018a).
Offshore wind farms are an additional pressure on Guillemots, through potential displacement of birds from foraging grounds (Peschko et al. 2020).
In common with other auks, Guillemots are especially vulnerable to oil spills, as a large proportion of their time is spent on the sea surface (Williams et al. 1995).
As for many species of seabirds, mitigating against climate change is likely to be the most effective conservation action that can be taken to improve Guillemot population numbers. Additional measures that are likely to prove beneficial would be continued research on the impacts of offshore renewable developments, which could then be used to better
inform Environmental Impact Assessments, trials of mitigation methods designed to reduce bycatch in fishing activities, and implementation of measures to reduce the frequency or impact of oil pollution incidents.
Although HPAI appears not to have had a major impact on Guillemot populations so far (see page 9) (Tremlett et al. 2024), continued monitoring will be beneficial to determine whether this remains the case.
Changes to adult survival has the potential to alter productivity, which for Guillemot is known to increase with age. Increased monitoring studies of adult survival is likely to be important in understanding both abundance change and productivity (Crespin et al. 2006). Year
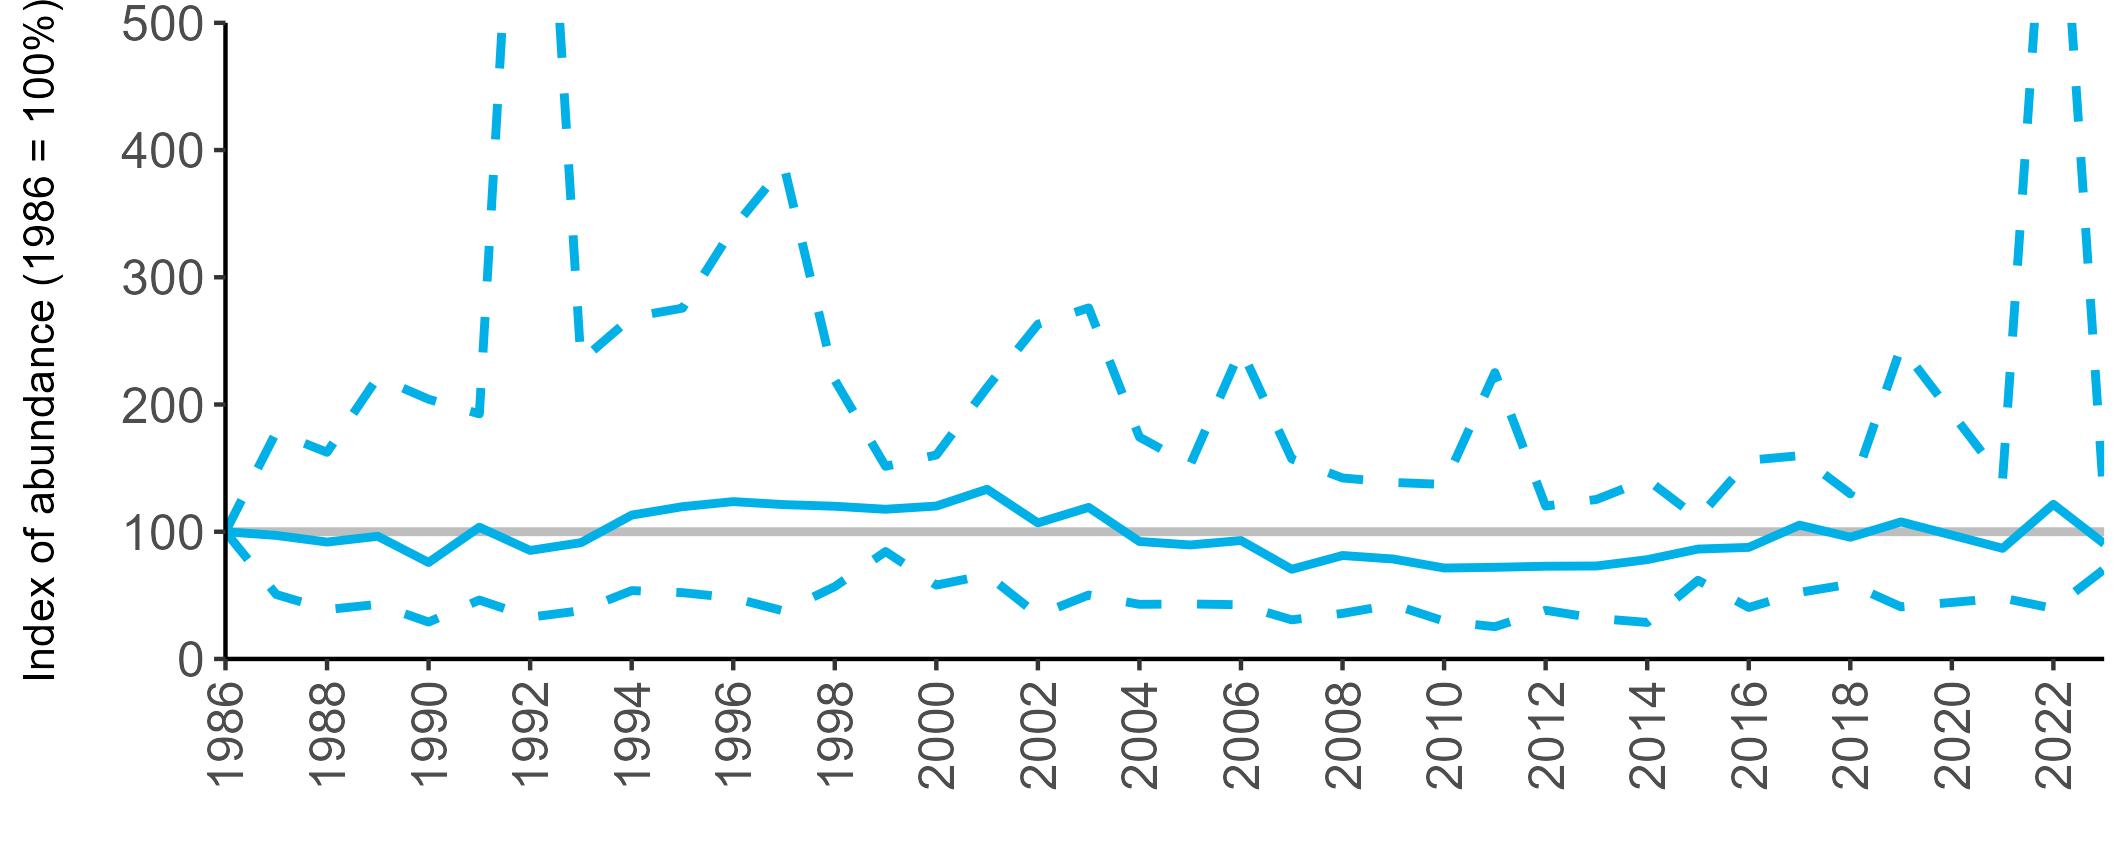
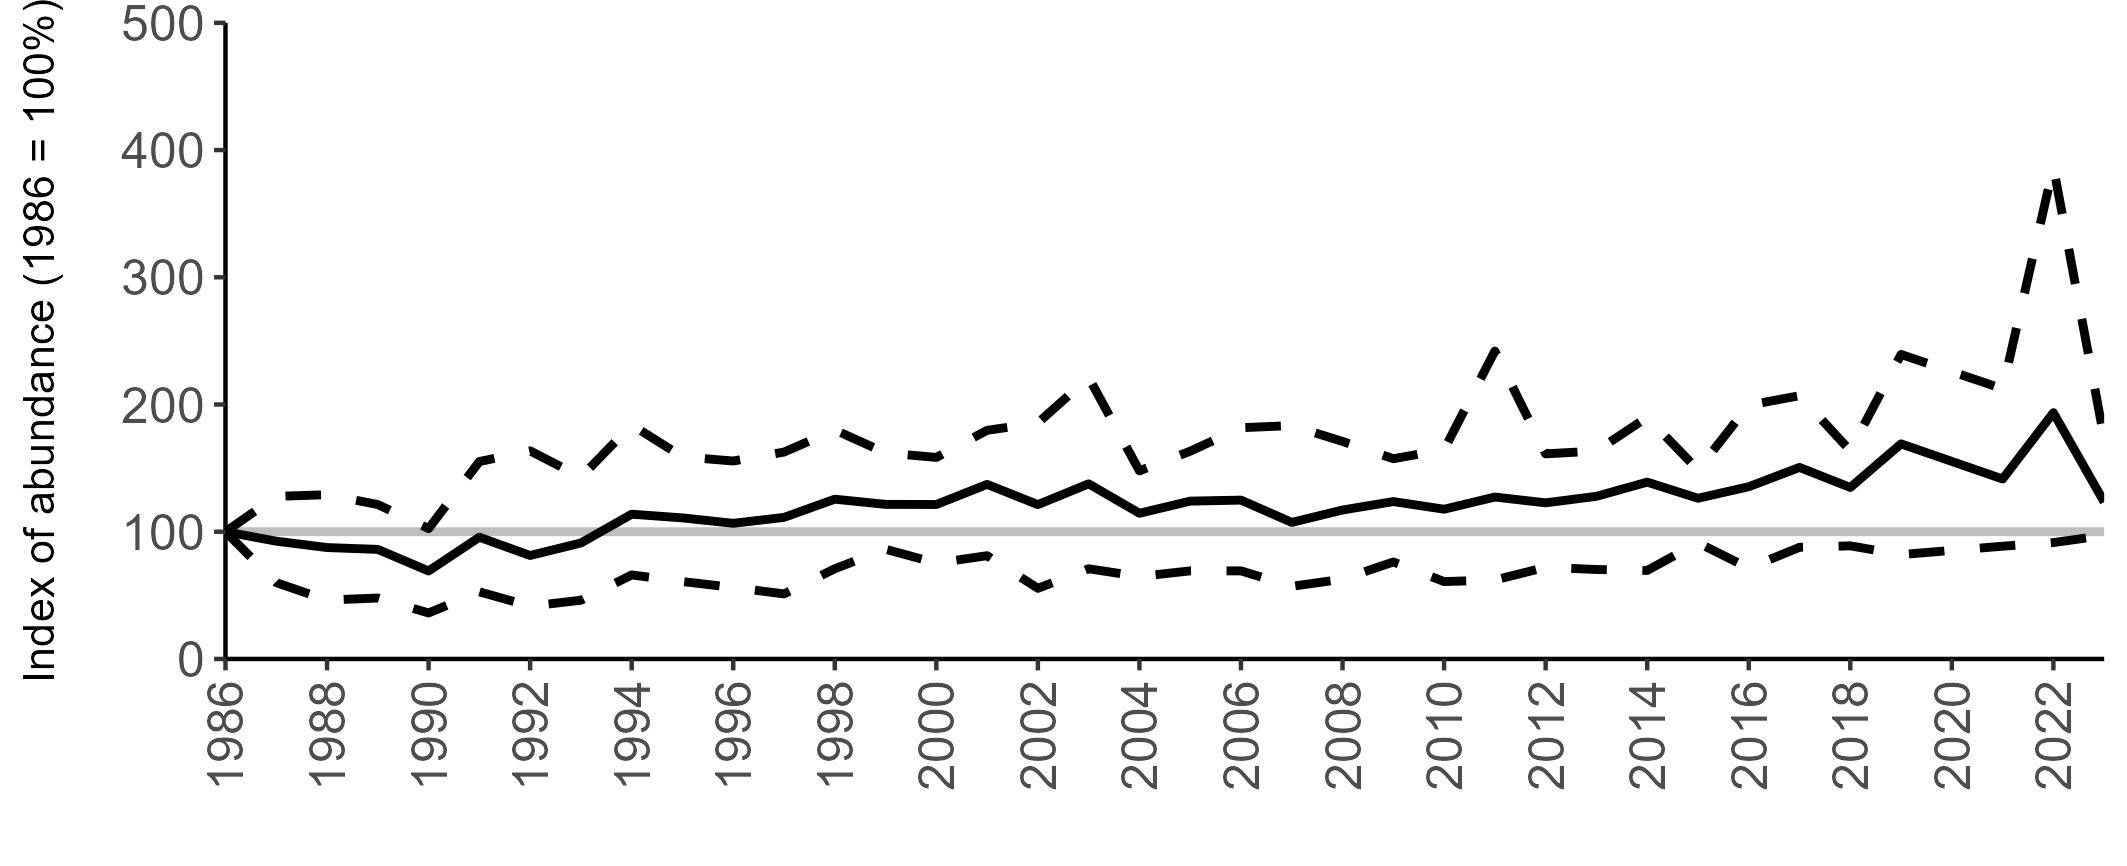
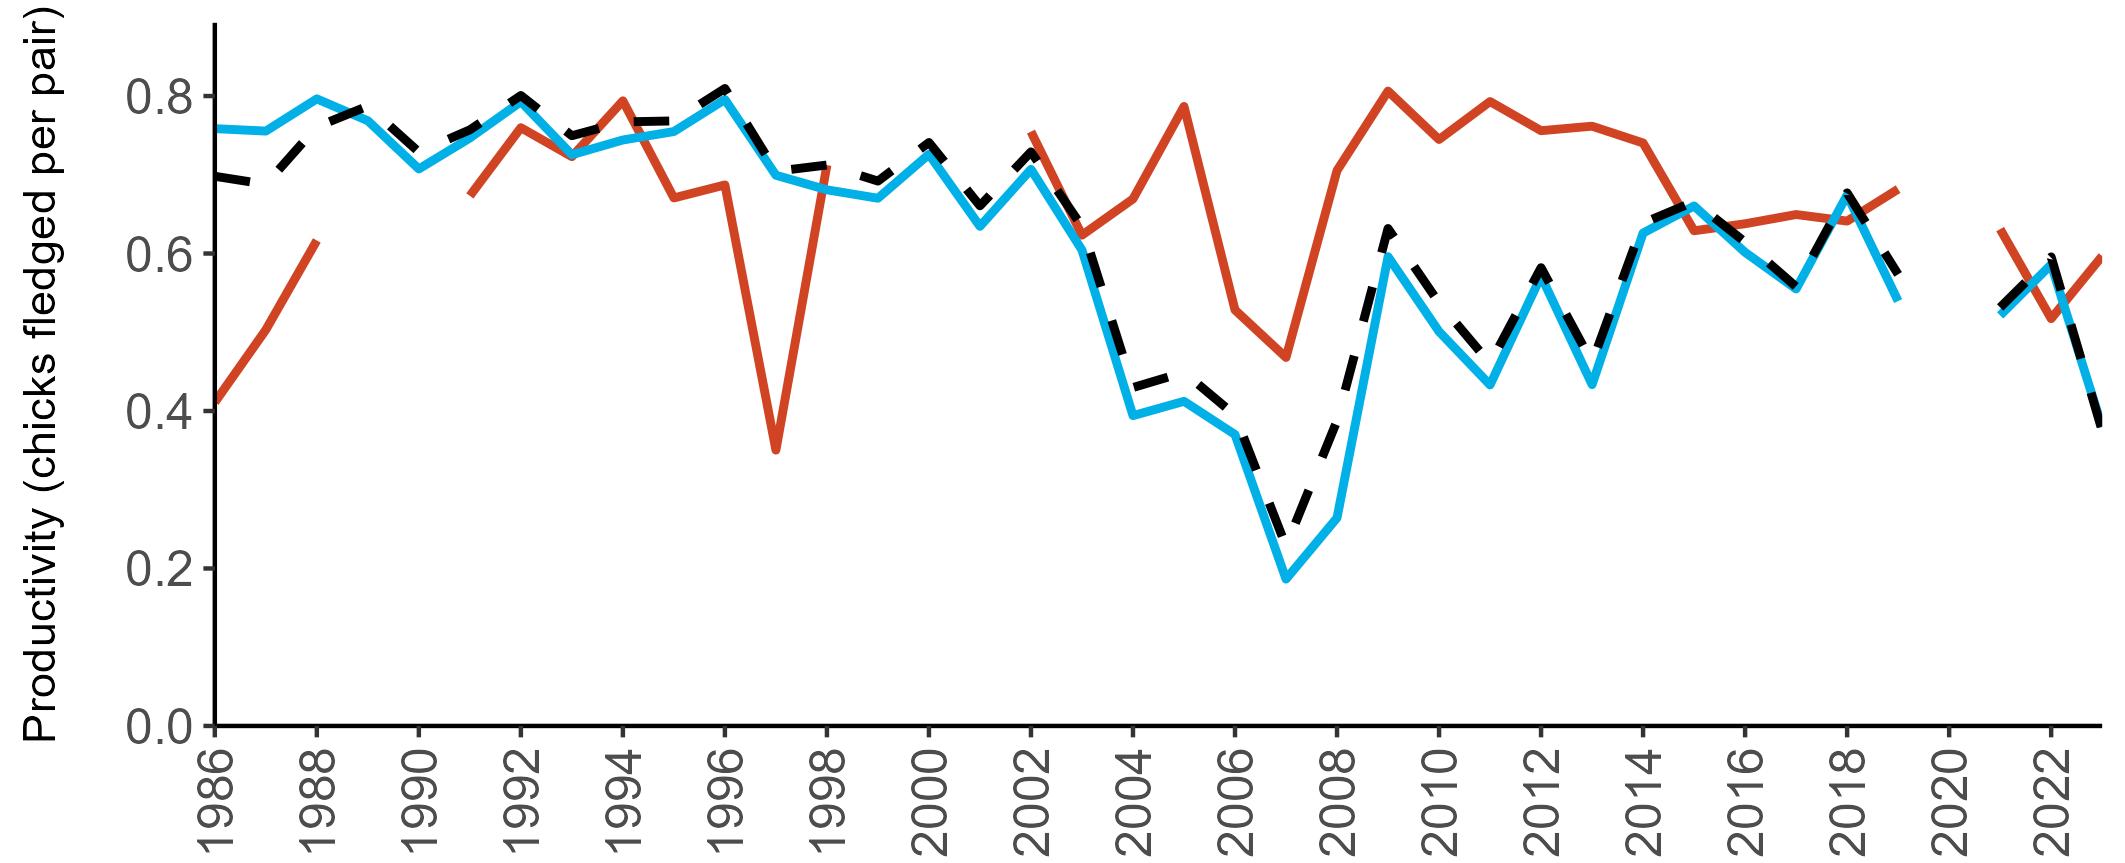
c.29% ssp. islandica
Amber-listed Red-listed (I)
Abundance: Increase
Productivity: 0.51
Colony Count sites: 149
Breeding Success sites: 10
Least Concern Lifespan: 13 years
Breeding age: 4 years
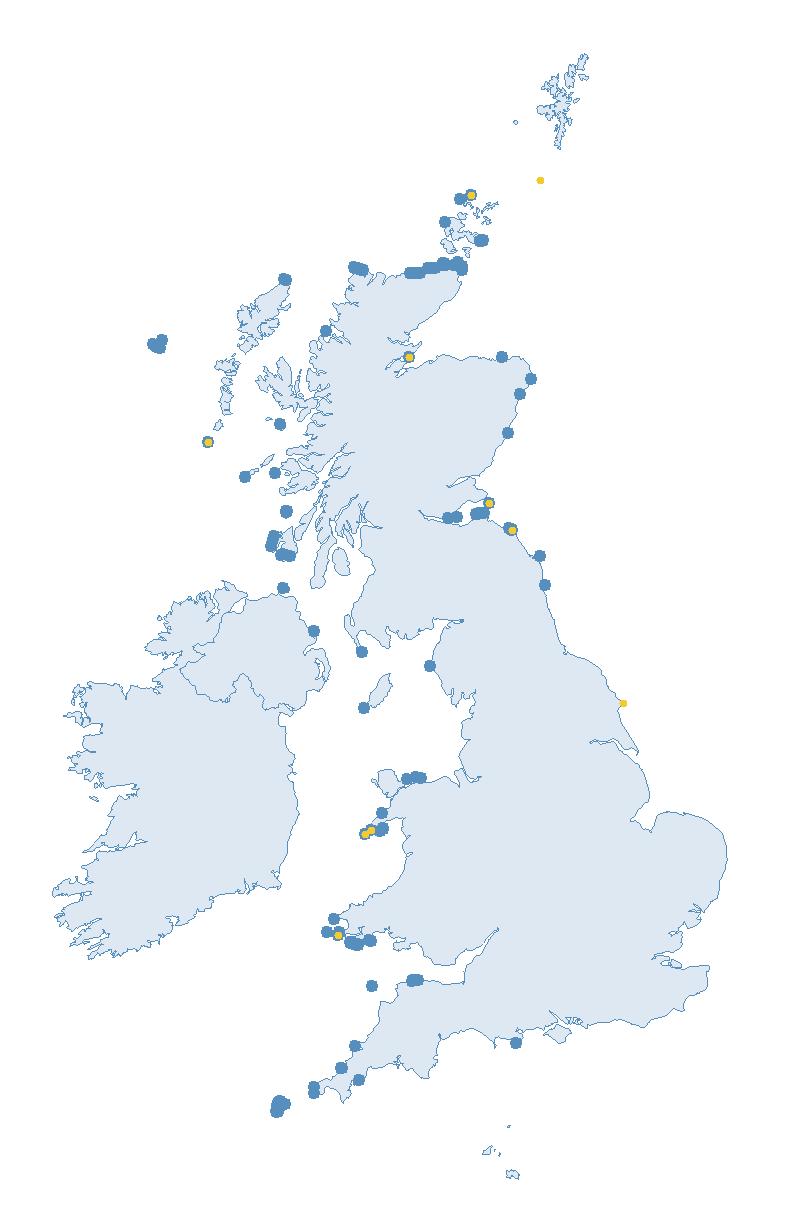
Britain and Ireland host 16—31% of the world’s breeding Razorbills and approximately 29% of the subspecies islandica (Burnell et al. 2023). The oldest known Razorbill, from ringing records, was recorded in 2004 at 41 years, 11 months and 23 days (BTO 2023a).
Razorbills are widespread around the coastlines of Britain and Ireland in the breeding season, with the exception of the south-east of England (Burnell et al. 2023).
Globally, they breed on north Atlantic coastlines from eastern North America to north-west Russia (BirdLife International 2024).
Razorbills overwinter coastally along both sides of the Atlantic (Lavers et al. 2020). British and Irish birds continue to be seen around our coastlines during winter, although many move south to the Atlantic coasts of Europe and North Africa, and some birds move into the western Mediterranean (Wernham et al. 2002). Immature birds generally travel greater distances from their colonies than adults in winter, often moving further south or occasionally west to Greenland and the Azores (JNCC 2021).
Razorbills feed on a variety of prey including krill, sprat and sandeels (Nettleship 1996; Barrett 2015), catching them by pursuit-
diving. Spines within their mouths allow them to hold multiple fish simultaneously, increasing the efficiency of foraging trips and chick provisioning (Burnell et al. 2023). Foraging ranges during the breeding season vary between colonies (Isaksson et al. 2019).
BREEDING
Razorbill nest on small ledges or in rocky crevices on cliffs, in boulder beaches and in scree (JNCC 2021). They lay a single egg and, once the chick fledges, the male parent will feed it for up to two months out at sea (Gaston & Jones 1998).
BREEDING ABUNDANCE
The SMP abundance trends for Razorbill since 2000 (Table 44) differed from those reported by the Seabirds Count census (Burnell et al. 2023). For the UK, the SMP trend showed an increase of 57% since 2000, whilst the Seabirds Count census reported a rise of 18% since Seabird 2000. For Scotland, the SMP trend indicated an increase of 16% since 2000, in contrast to a small decline of 2% between the censuses. The SMP trend for Wales shows a
large increase of 108%, whilst the Seabirds Count census showed an increase of 82% over a similar period.
The long-term SMP abundance trends for Razorbill in the UK, Scotland and Wales have all remained largely above the 1986 baseline since the early 1990s (Figures 66–68). Following a period of sustained increase until the early to mid 2000s, all three regional trends underwent a period of decline, which was most pronounced in Scotland. This was followed by a further period of increasing trends overall for these regions. The highest index values since 1986 were recorded for all three regions in 2022. However, there is a high degree of uncertainty in these values as fewer sites were monitored in 2022, resulting in wide confidence intervals. It should be noted that the confidence intervals are wide for a number of years for Scotland and Wales across the recording period, therefore these indices should also be used with caution.
In all three regions, the abundance values decreased in 2023, when a greater number of colonies, and particularly large colonies, were

Abundance (IND) Seabird 2000 (1998—02) Abundance (IND) Seabirds Count (2015—21) Percentage Change
Britain, Ireland, Isle of Man and Channel Islands
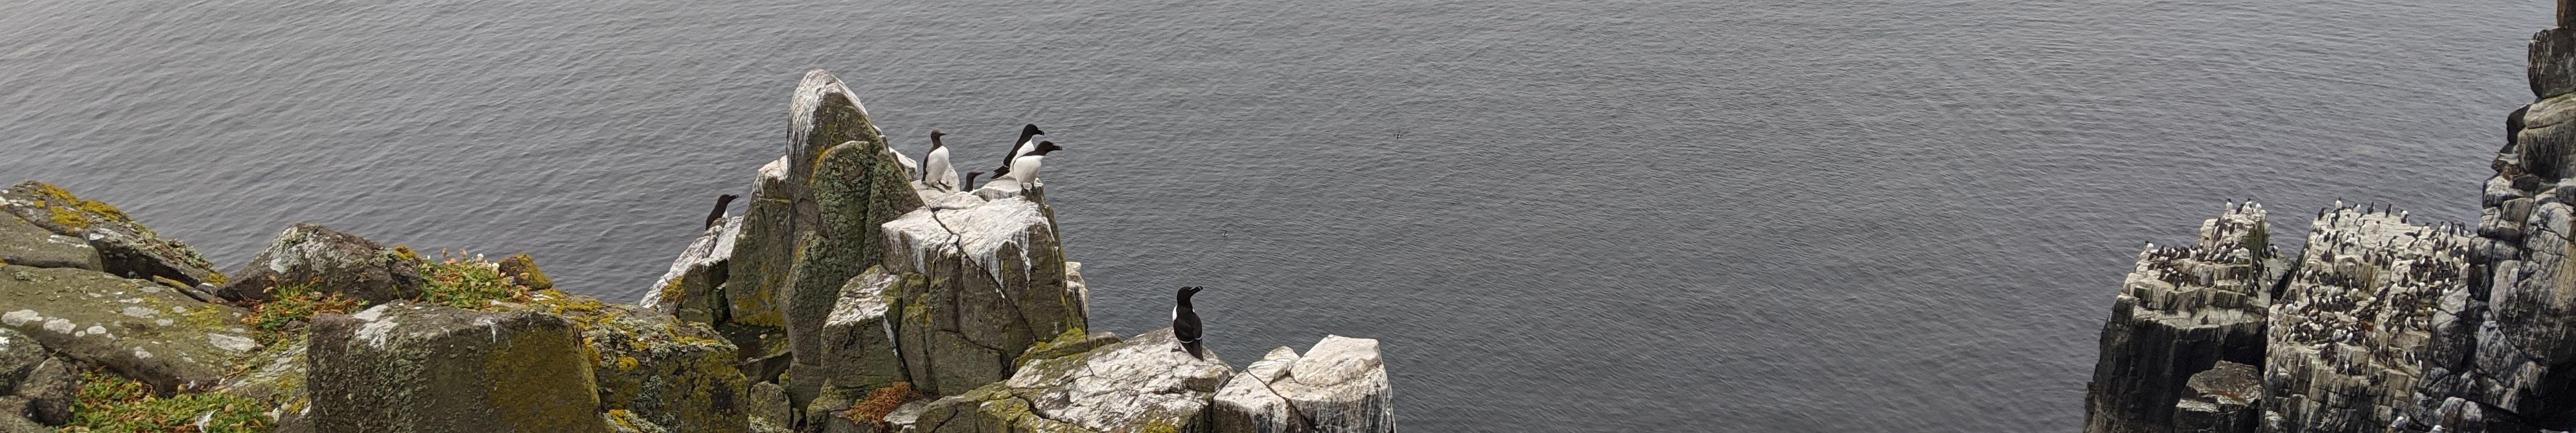
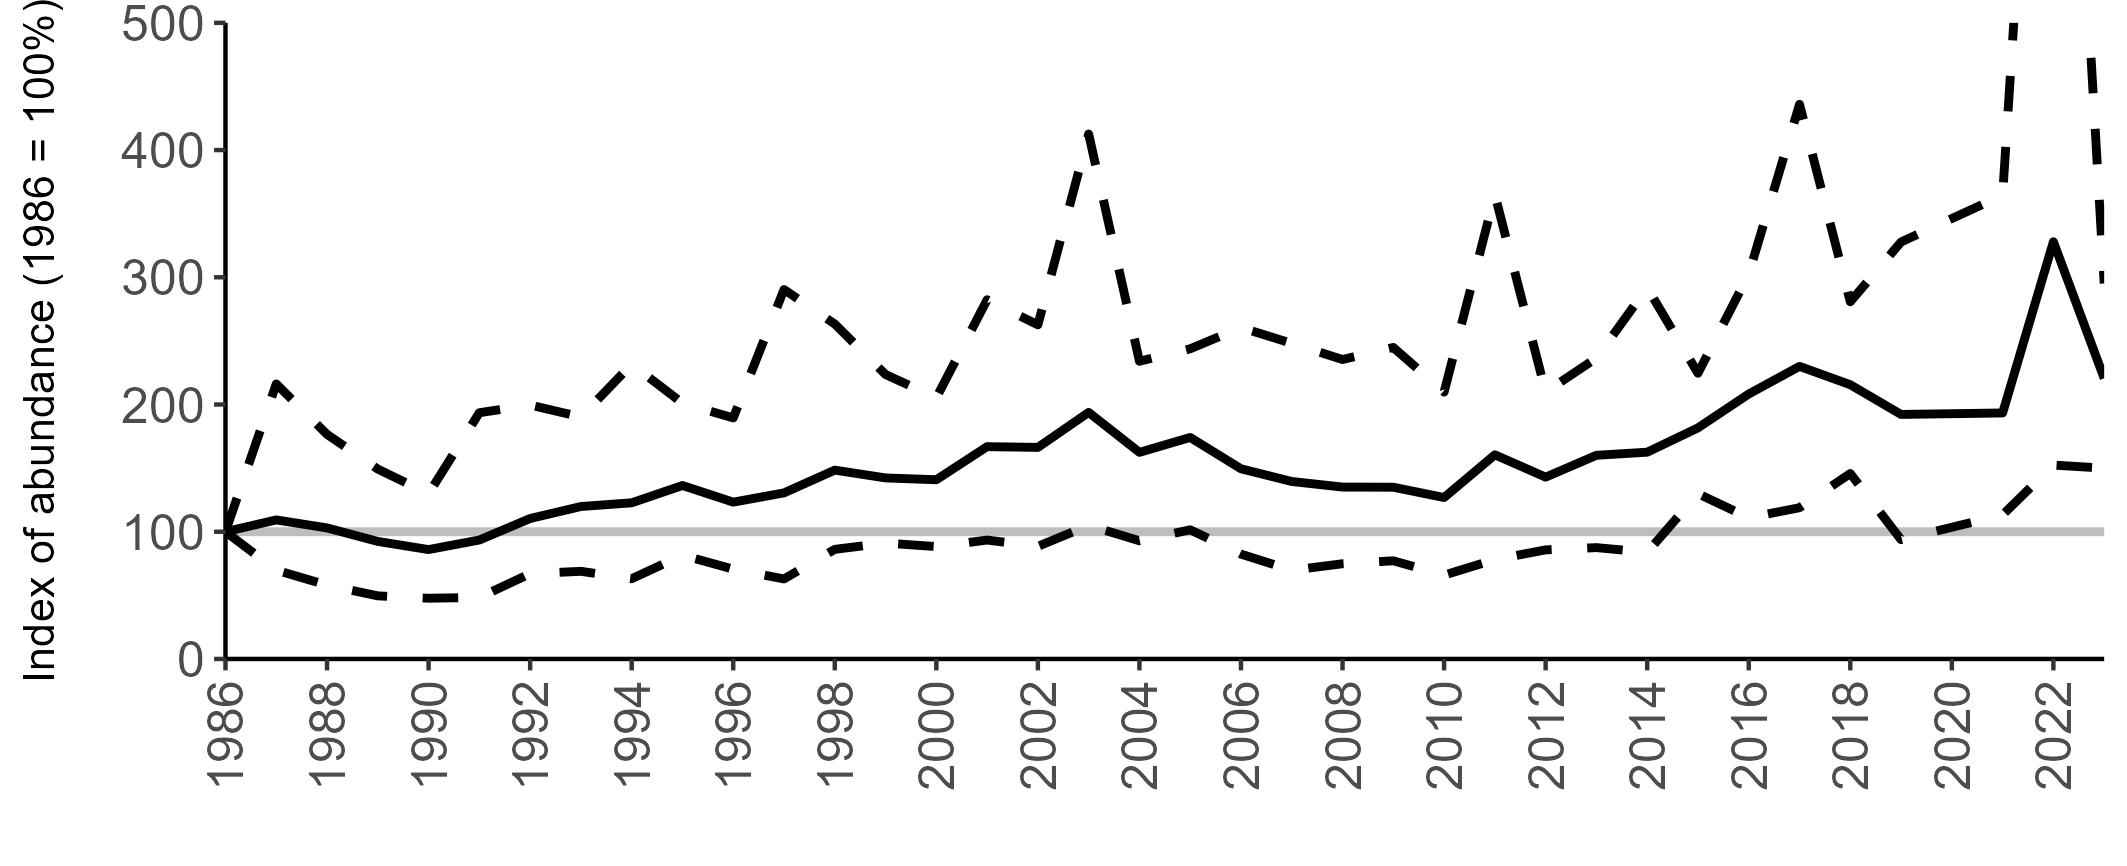
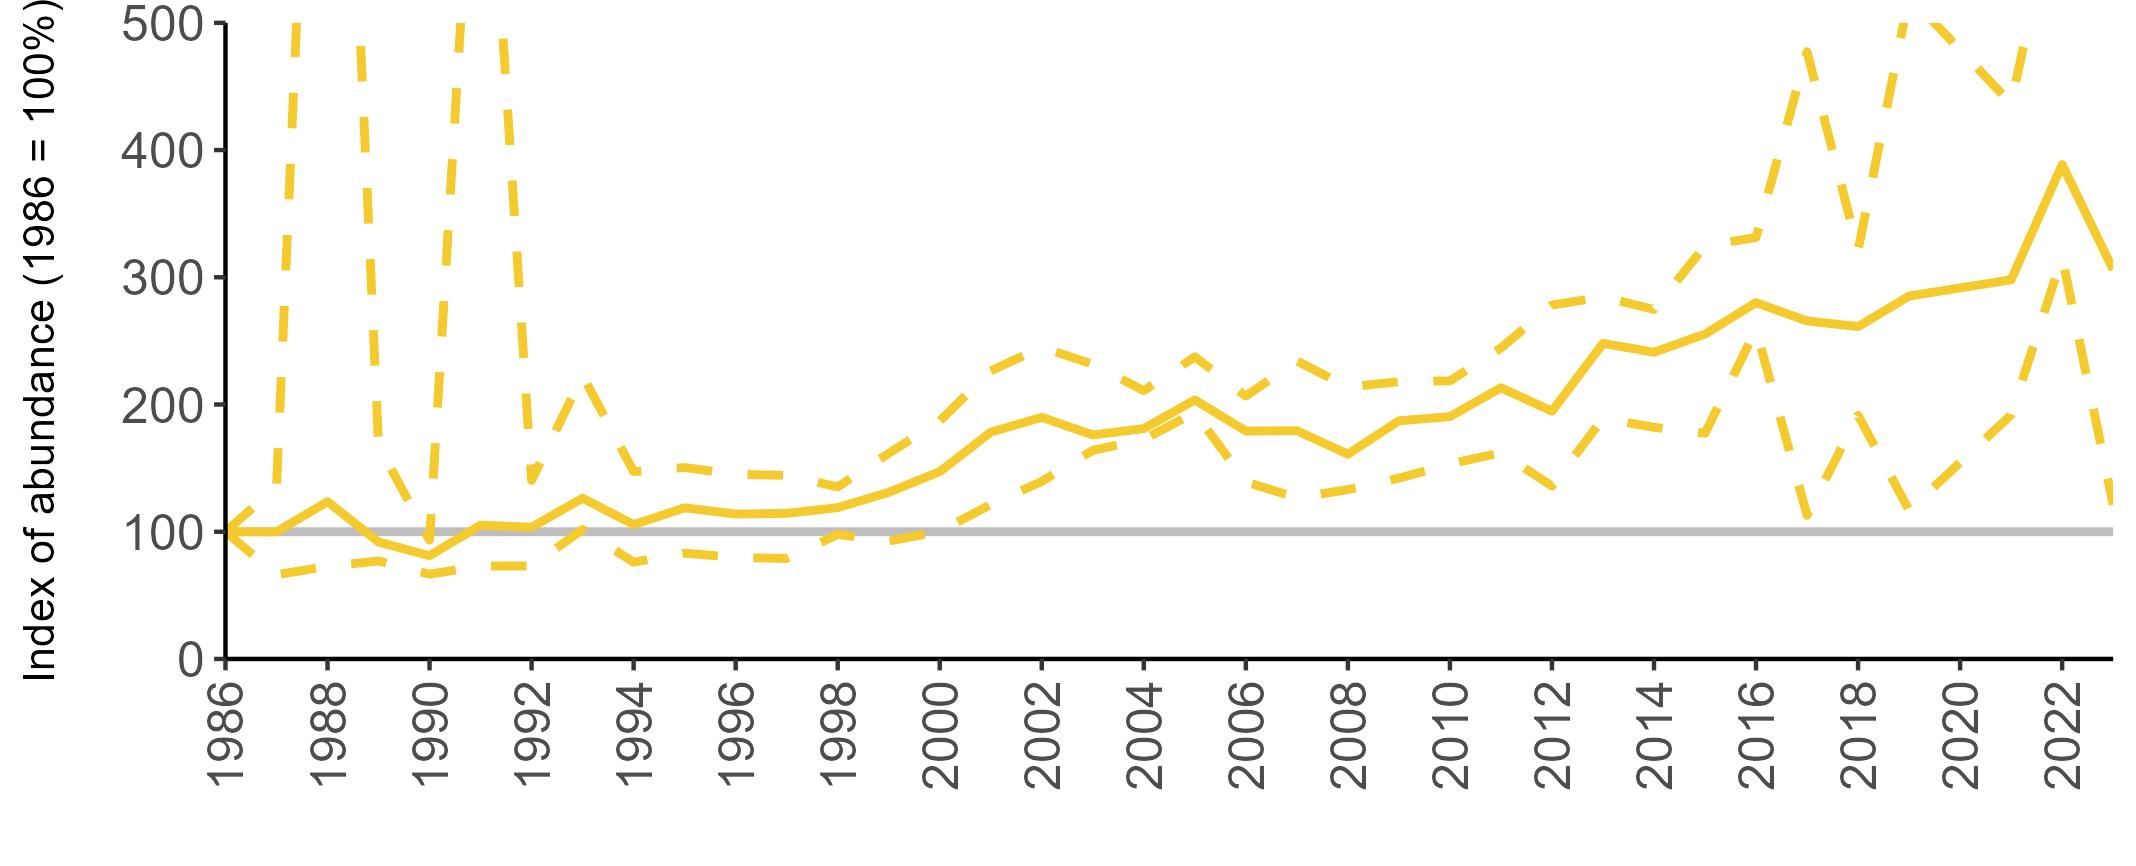
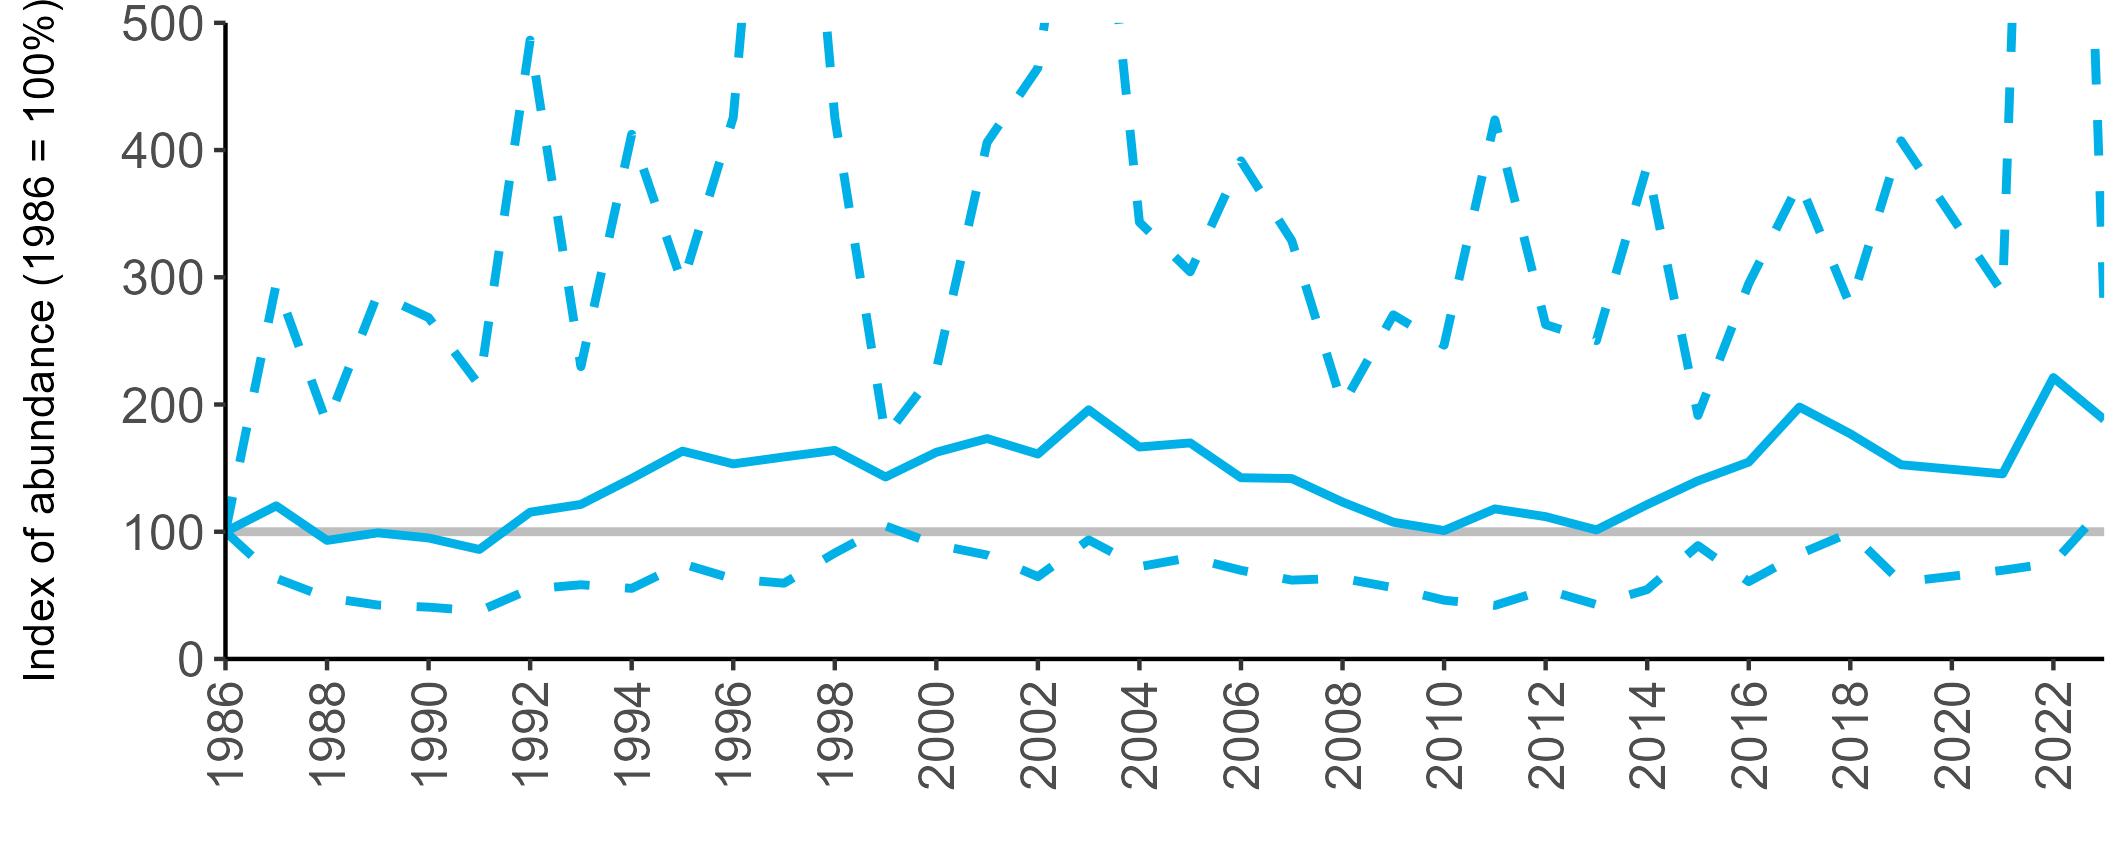
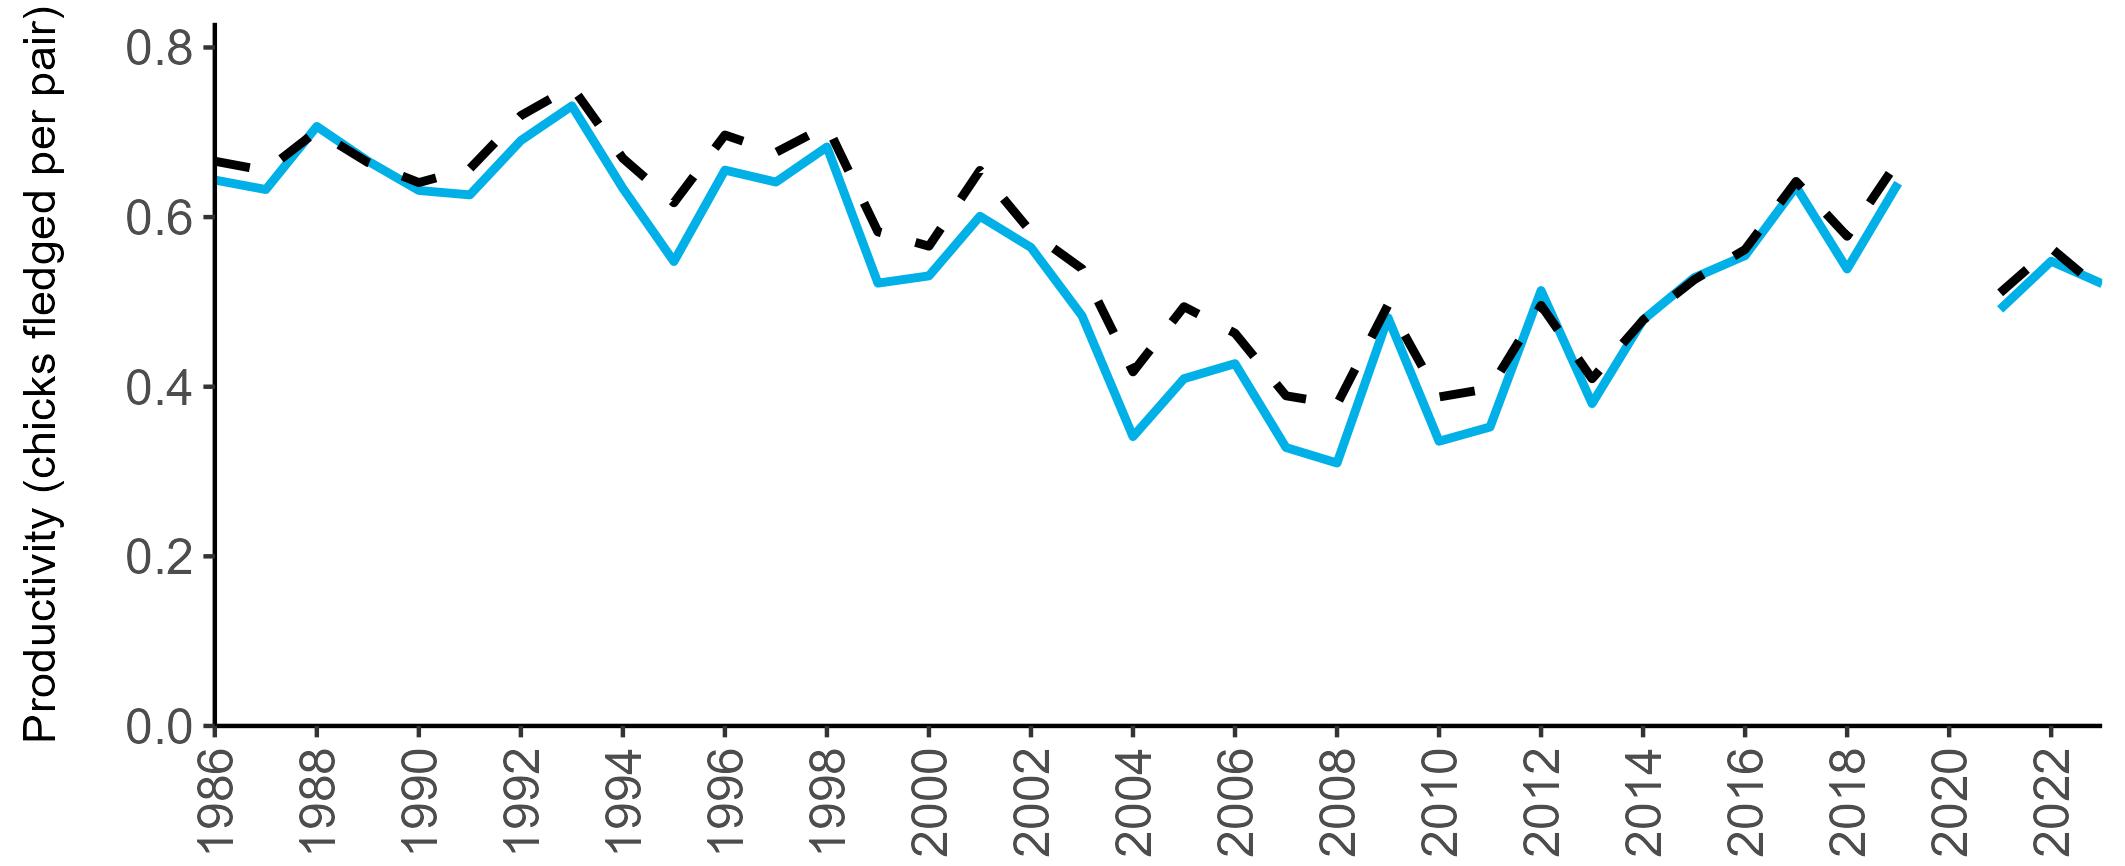
counted across the UK due to enhanced monitoring for HPAI impacts (see pages 8–11). These more robust 2023 values show a UK index of 121% above the 1986 baseline, whilst the index values for Scotland and Wales were 88% and 206% above the baseline, respectively (Table 44).
Too few data are currently submitted to the SMP in other regions to allow for the calculation of meaningful abundance trends.
The productivity trends for Razorbill in the UK and Scotland across the SMP monitoring period have been similar (Figure 69), as most monitored colonies are in Scotland, although UK values have tended to be slightly higher. After an initial period of stability, there was an overall decline in the productivity trends for both regions from the late 1990s to a low point in 2008, after which they started to recover. Mean productivity estimates have dropped since 2019, with 0.51 and 0.52 chicks fledged per breeding pair in the UK and Scotland, respectively, in 2023 (Table 44).
Too few data are submitted to the SMP on productivity of Razorbills in other regions to calculate any meaningful average productivity values.
A range of additional data on Razorbills are collected at the SMP Key Sites. Data on breeding phenology are recorded on Skomer Island (Wales), whilst diet data are collected at the Isle of May (Scotland). Information on adult survival is
gathered on Canna (Scotland) and Skomer Island, and on adult annual return rates on the Isle of May.
Razorbill numbers in Britain and Ireland have continued their steady increase since national seabird censuses began (Burnell et al. 2023). However, a few areas showed declines in the Seabirds Count census, particularly in the north, and Razorbills, in common with many other seabirds, face a number of pressures.
Extreme climatic events such as intense winter storms can take their toll on Razorbills, through a reduction in their ability to forage and a consequent loss of body condition. This can lead to widespread mortality and their appearance in seabird wrecks (Underwood & Stowe 1984). In 2007, many dead Scottish Razorbills were washed up in the North Sea, Skagerrak and Kattegat (Heubeck et al. 2011). A large wreck also occurred in the winter of 2013/14, along the English and Irish Atlantic coasts and down as far as Spain, with post-mortems suggesting starvation as one of the main causes of death (Jessop 2014; Sellers 2014).
Alterations in the distribution and availability of prey species through climate change-induced sea surface temperature changes (Heath et al. 2009; Régnier et al. 2017; Sandvik et al. 2005; Wanless et al. 2005) have the potential to impact Razorbill populations in the future, as favoured prey potentially become scarcer. However, studies on the diet of Razorbills have shown a degree of plasticity in food consumption, suggesting that they can switch to
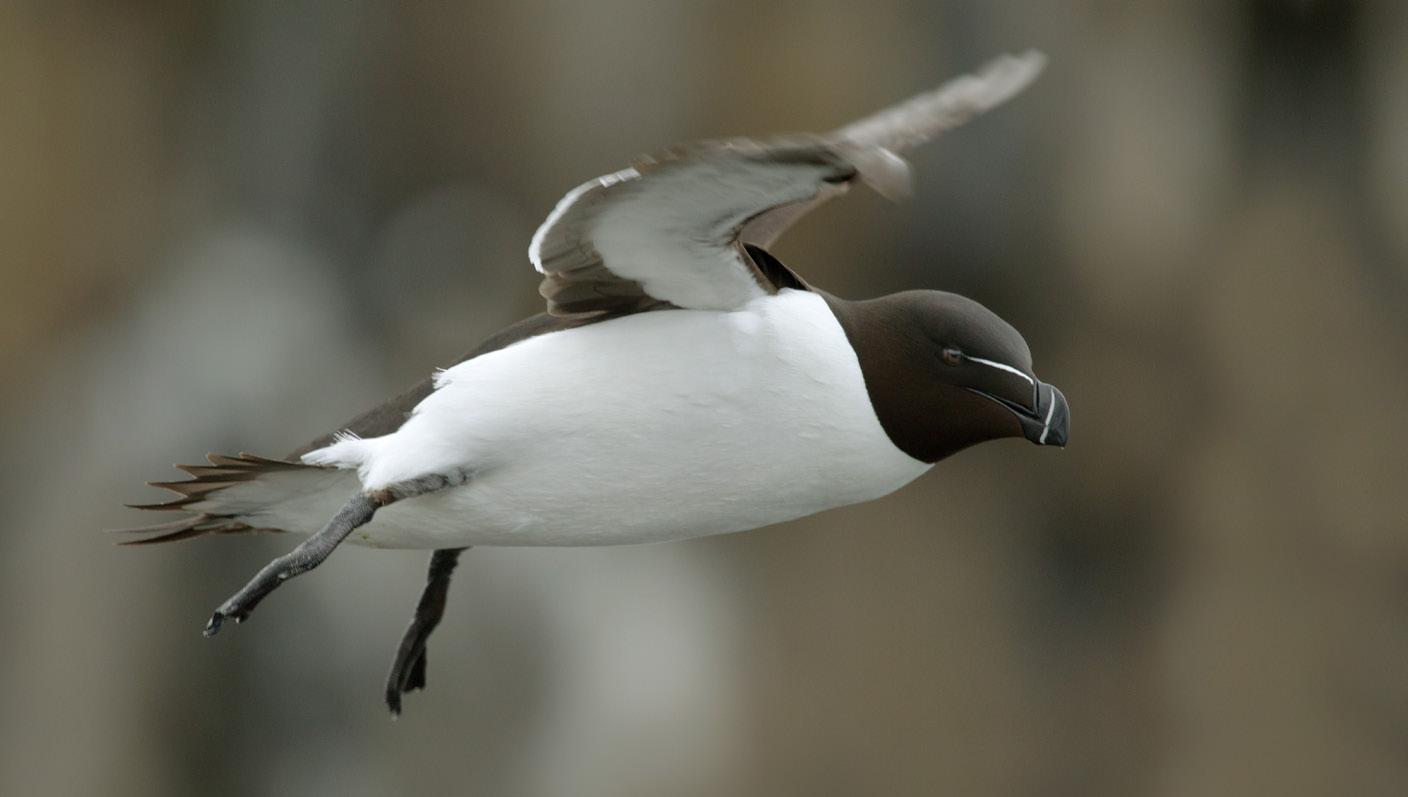
alternative prey if the preferred target is less abundant (Gaston & Woo 2008; Barrett 2015).
Razorbills are a pursuit diver, and as a result are often caught in fishing nets as bycatch during commercial fishing (Costa et al. 2018; Žydelis et al. 2013). Commercial fishing also targets some of the same prey species as Razorbill, so may be reducing the available food supply (Brochet et al. 2017; Nettleship et al. 2018b).
Although it is thought that Razorbills have a low risk of collision with wind turbines, offshore developments can cause a moderate risk of displacement, impacting on the availability of foraging areas (Bradbury et al. 2014). Razorbills are also considered to be vulnerable to the adverse effects of tidal turbines, due to their pursuit diving foraging behaviour (Furness et al. 2012).
Razorbills are vulnerable to predation from a variety of animals, including rats, Great Skuas and American Mink (Neovison vison) (Bonesi & Palazon 2007; Swann et al. 2016). Brown Rats (Rattus norvegicus) are known to have caused colony declines in a number of locations, including Canna (Scotland) (Swann 2002), and American Mink (Neovison vison) have impacted populations in south-west Finland (Nordström et al. 2003).
As is the case for all auks, Razorbill are particularly susceptible to the ill effects of oil spills, with oil contamination reducing their ability to fly and forage (Biliavskiy & Golod 2012), often leading to death.
Measures likely to have widespread benefits for the Razorbill population include limiting the degree of climate change, assessment and consideration of the full impacts of offshore renewable developments, design and implementation of innovative fishery bycatch mitigation methods, and a reduction in the frequency of oil pollution incidents.
At a local level, rat eradication projects on seabird islands such as Lundy (England) and Canna (Scotland) have been followed by increases in Razorbill numbers (Swann et al . 2021).
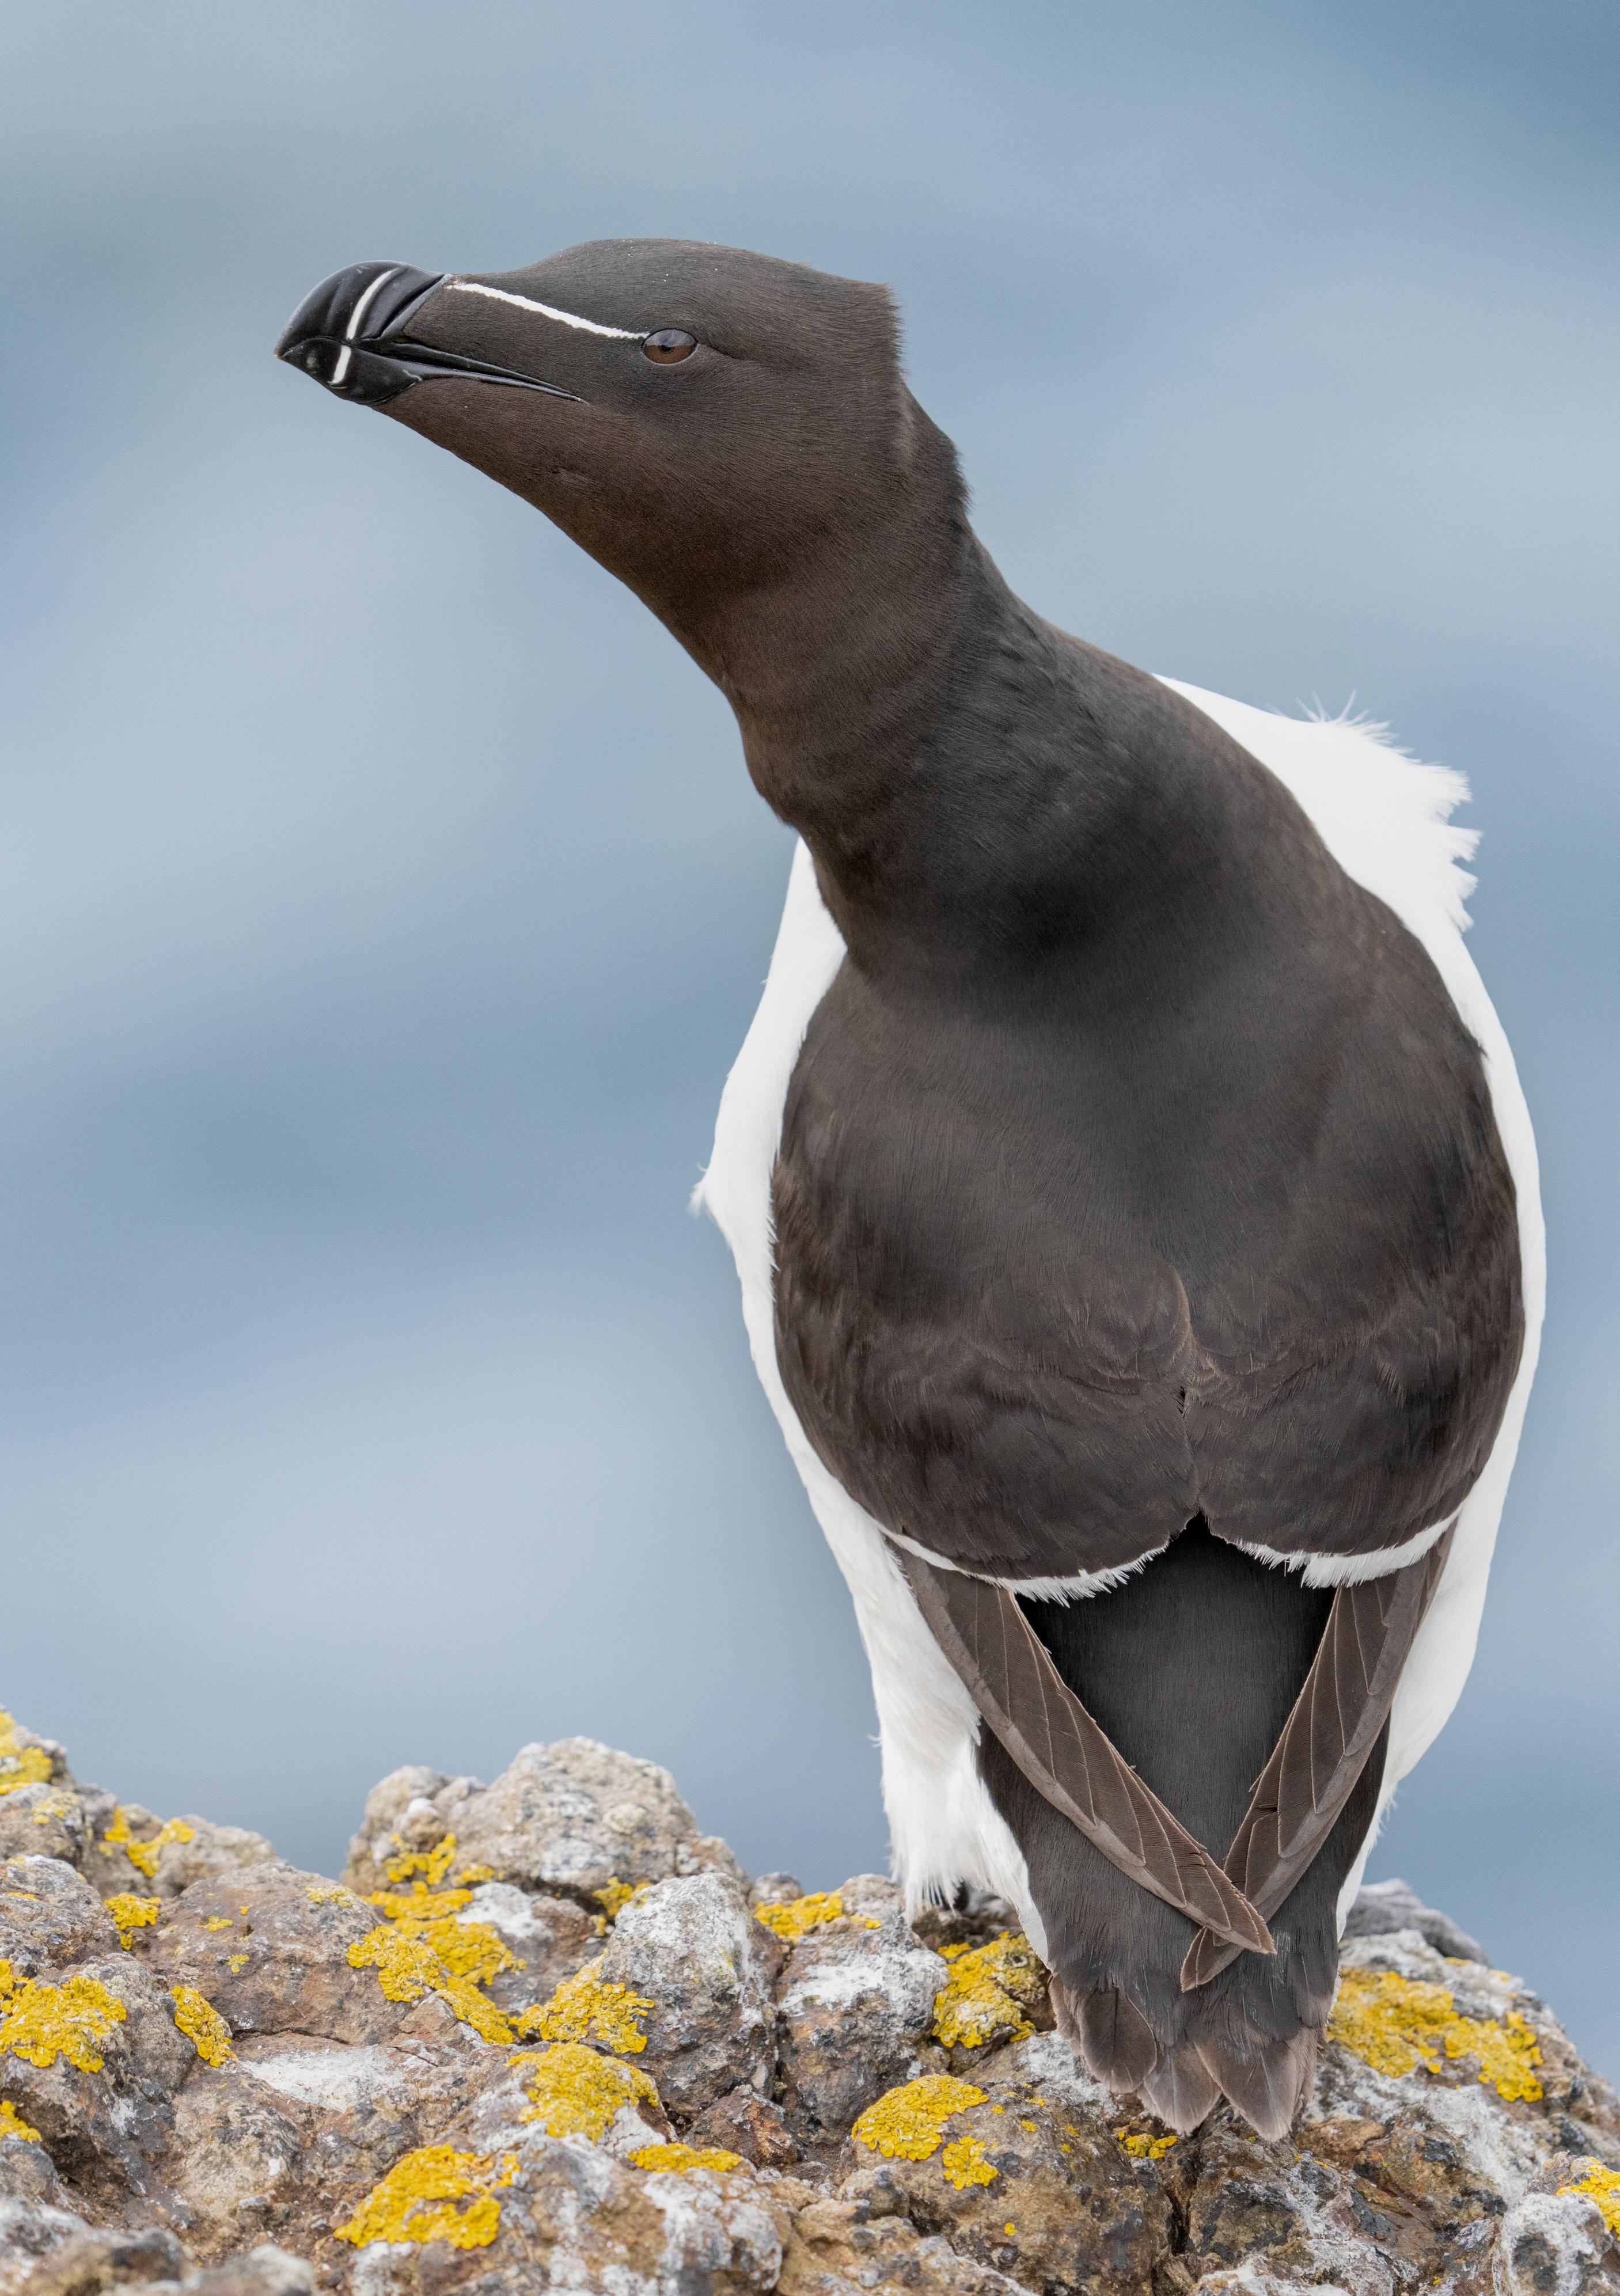
Green-listed
Amber-listed (I)
Abundance: Decrease
Productivity: n/a
Colony Count sites: 50
Breeding Success sites: 0
Least Concern Lifespan: 11 years
Breeding age: 4 years

Britain and Ireland host approximately 3—10% of the known global breeding population of Black Guillemot (Burnell et al. 2023). Also known as ‘Tystie’, they use their wings to propel themselves when hunting for prey under the water (Cairns 1987).
In Britain and Ireland, Black Guillemots nest around the coasts of Ireland, Anglesey (Wales), the Isle of Man, and northern and western Scotland, with a small population located in the north-east of Scotland (Burnell et al. 2023).
At a global scale, Black Guillemots have a circumpolar distribution in the northern hemisphere, with the British and Irish birds being towards the southern edge of their range (BirdLife International 2024).
In Britain and Ireland, they are a resident species that only move short distances offshore during winter (BTO 2023a).
Black Guillemots usually forage within 5 km of their colonies and in sea depths of 10–130 m (Cairns 1987; Dehnhard et al. 2023; Durinck et al. 1994), although birds in Canada’s Northwest Territories can travel up to 55 km from their colonies to feed (BirdLife International 2000).
They are predominantly benthic foragers and birds from some colonies
favour feeding in areas with kelp Laminaria spp. (Dehnhard et al. 2023). Around British and Irish coasts, their summer diet includes butterfish, sandeels and blennies (Harris & Riddiford 1989; Ewins 1990). Although often foraging in similar areas in winter, their diet may alter to include a higher proportion of invertebrate prey, suggesting these are a more important winter food source (Baak et al. 2021; Ewins 1990).
Black Guillemots usually nest in coastal rock crevices or under boulders, although they will also use cavities in artificial structures and purpose-built nest boxes and cairns (BTO 2023a; Burnell et al. 2023; Leonard & Wolsey 2014). They lay a clutch of two eggs.
BREEDING ABUNDANCE
Black Guillemot SMP abundance trends since 2000 (Table 46) differ from those reported by the Seabirds Count census (Burnell et al. 2023). The 23-year UK SMP trend shows an increase of 13% and the Scotland trend decreased by 5%, whereas the Seabirds Count census reported a decline of 11%
between the last two censuses for both the UK and Scotland.
The long-term SMP abundance trends for the UK and Scotland are closely matched (Figures 70 & 71), as in most years (although not in 2023) the majority of monitored sites are in Scotland. Since the start of the SMP recording period, the trends have remained below the baseline for both regions, following a decline between 1986 and 1988. Trends from some of the early years of the SMP recording period should, however, be treated with caution as only a small number of sites submitted data, leading to large confidence intervals. The trend lines for both regions were relatively stable between the mid 1990s and the end of the 2000s, before increasing slightly in the early 2010s. In 2023, the abundance index values were 21% and 38% below the 1986 baseline, respectively, for the UK and Scotland (Table 46).
Insufficient data are submitted to the SMP on Black Guillemot abundance in other regions and countries to allow for the calculation of meaningful abundance trends.
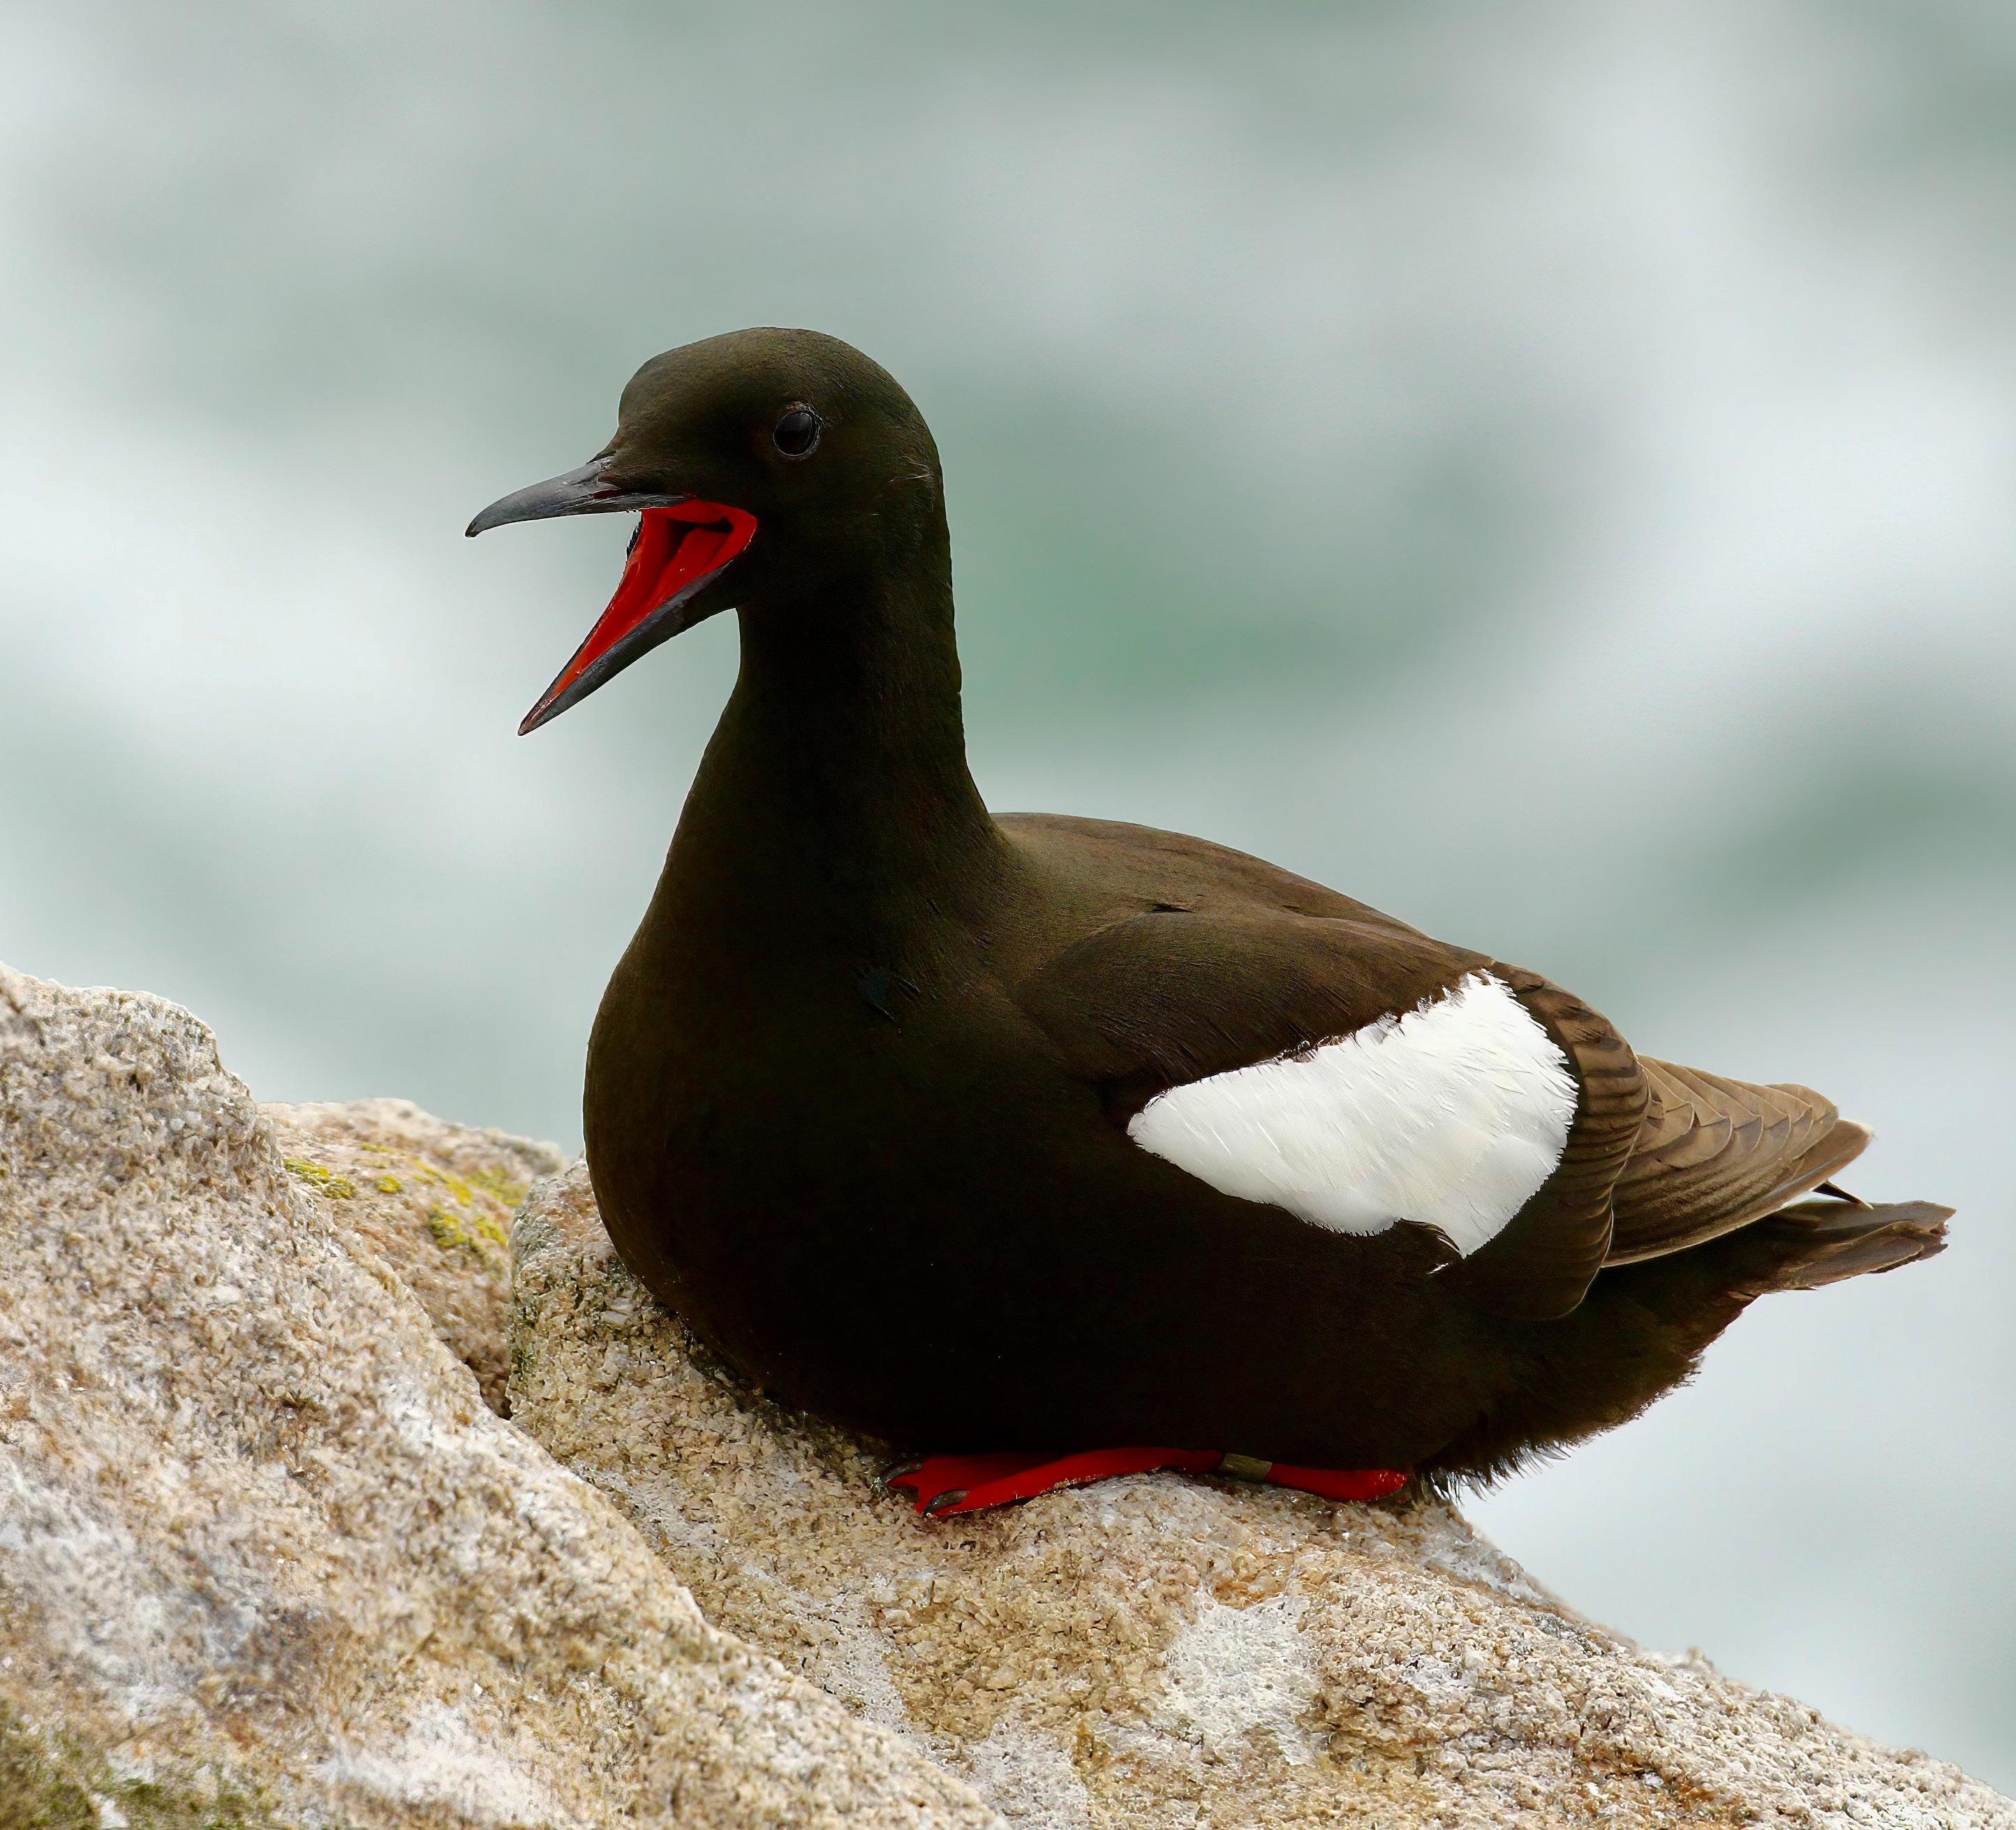
PRODUCTIVITY
An insufficient number of Black Guillemot colonies are monitored frequently enough to allow for calculation of productivity values for any region.
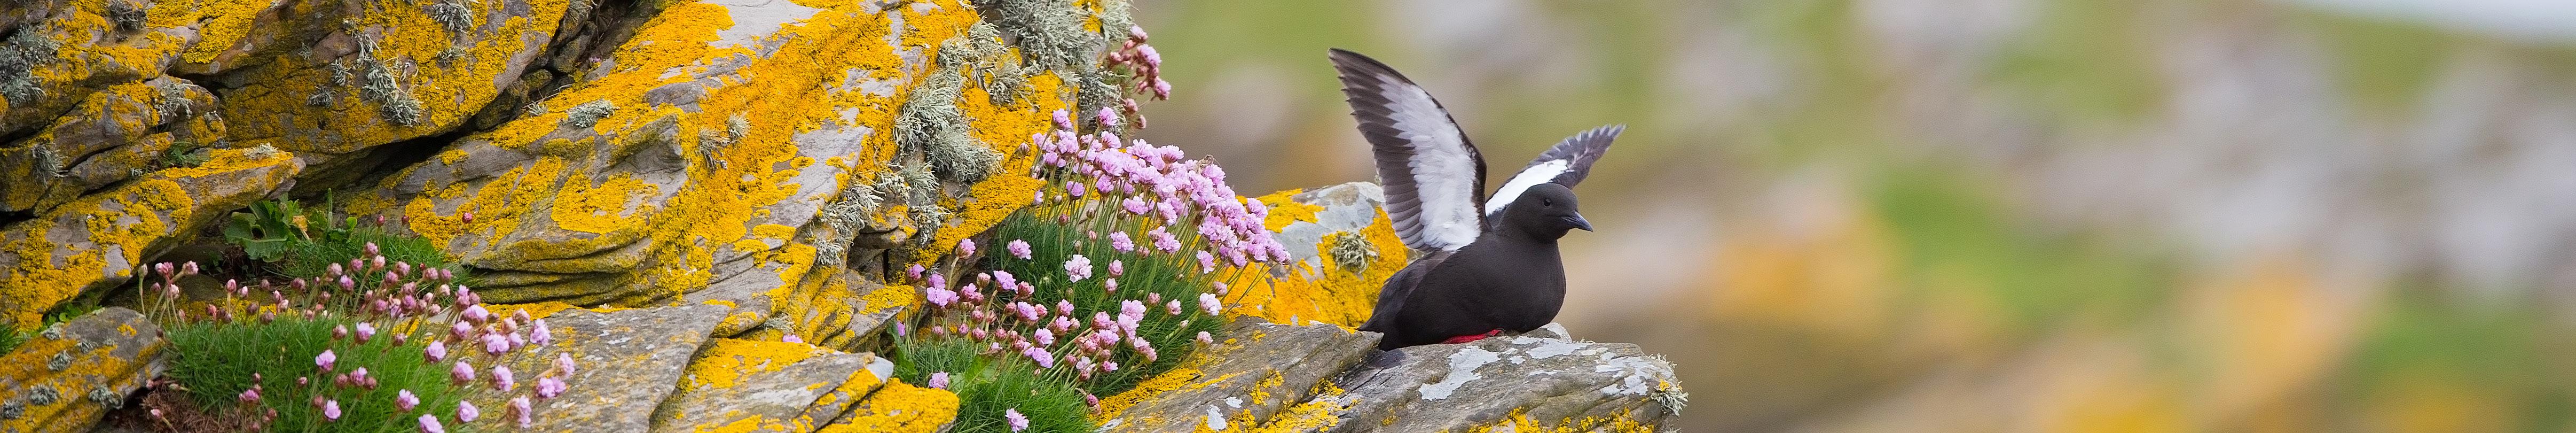
No data have been collected as part of the SMP.
Black Guillemot adults, eggs and chicks are vulnerable to predation during the breeding season due to their ground-nesting, often accessible nesting locations. Predation by various species has been recorded, including mammals such as Brown Rat (Rattus norvegicus), European Otter (Lutra lutra) and Domestic Cat (Felis catus), and birds such as Herring Gull and Hooded Crow (Corvus cornix) (Greenwood 2014, Johnston et al. 2020, JNCC 2021).
Climate change is affecting the abundance, distribution and life cycle timing of a range of seabird prey species through changes in sea surface temperatures (Greenwood 2007; Régnier et al. 2017; Wanless et al. 2004). In Britain and Ireland, butterfish are the dominant prey species of Black Guillemot (Ewins 1990; Leonard & Wolsey 2014; Shoji et al. 2015), and any negative climate change-related impacts on the availability of this species at critical times during the breeding season have the potential to affect Black Guillemot breeding populations.
Climate change may also affect Black Guillemot populations through an increased frequency of extreme weather events and rising sea levels, which may result in challenging foraging conditions and consequent loss of body condition (Hario 2001). Black Guillemots are at the southern edge of their global breeding range in Britain and Ireland and this may also
make them be more susceptible to climate change (Burnell et al. 2023).
Fisheries bycatch poses an additional threat to Black Guillemots, as their diving foraging behaviour renders them vulnerable to being caught in gillnets (Žydelis et al. 2013).
Black Guillemots are thought to have a low risk of collision with wind turbines, although offshore wind farms may cause displacement from foraging habitat (Bradbury et al. 2014). However, they are thought to be highly vulnerable to the negative impacts of marine tidal renewable energy turbines (Furness et al. 2012).
Local measures for increasing breeding habitat availability for Black Guillemots have been shown to be effective. These include the provision of nest boxes (Leonard & Wolsey
2014) and the construction of artificial nesting cairns, such as on Grass Holm in Orkney (Burnell et al. 2023). There has been an increase in the use of artificial structures for nesting sites in Northern Ireland, benefiting the birds by providing greater protection to the incubating adults, eggs and chicks (Mitchell et al. 2004). Redesign of nest boxes to reduce the size of the entrance hole has also been shown to reduce predation by gulls and other predators (Greenwood 2014).
The eradication of ground predators such as rats, ferrets and stoats from islands on which Black Guillemots breed are also likely to have beneficial effects.
As is the case for all auks, the design of measures which would reduce the threats posed by tidal turbines and commercial fisheries would also benefit Black Guillemots.
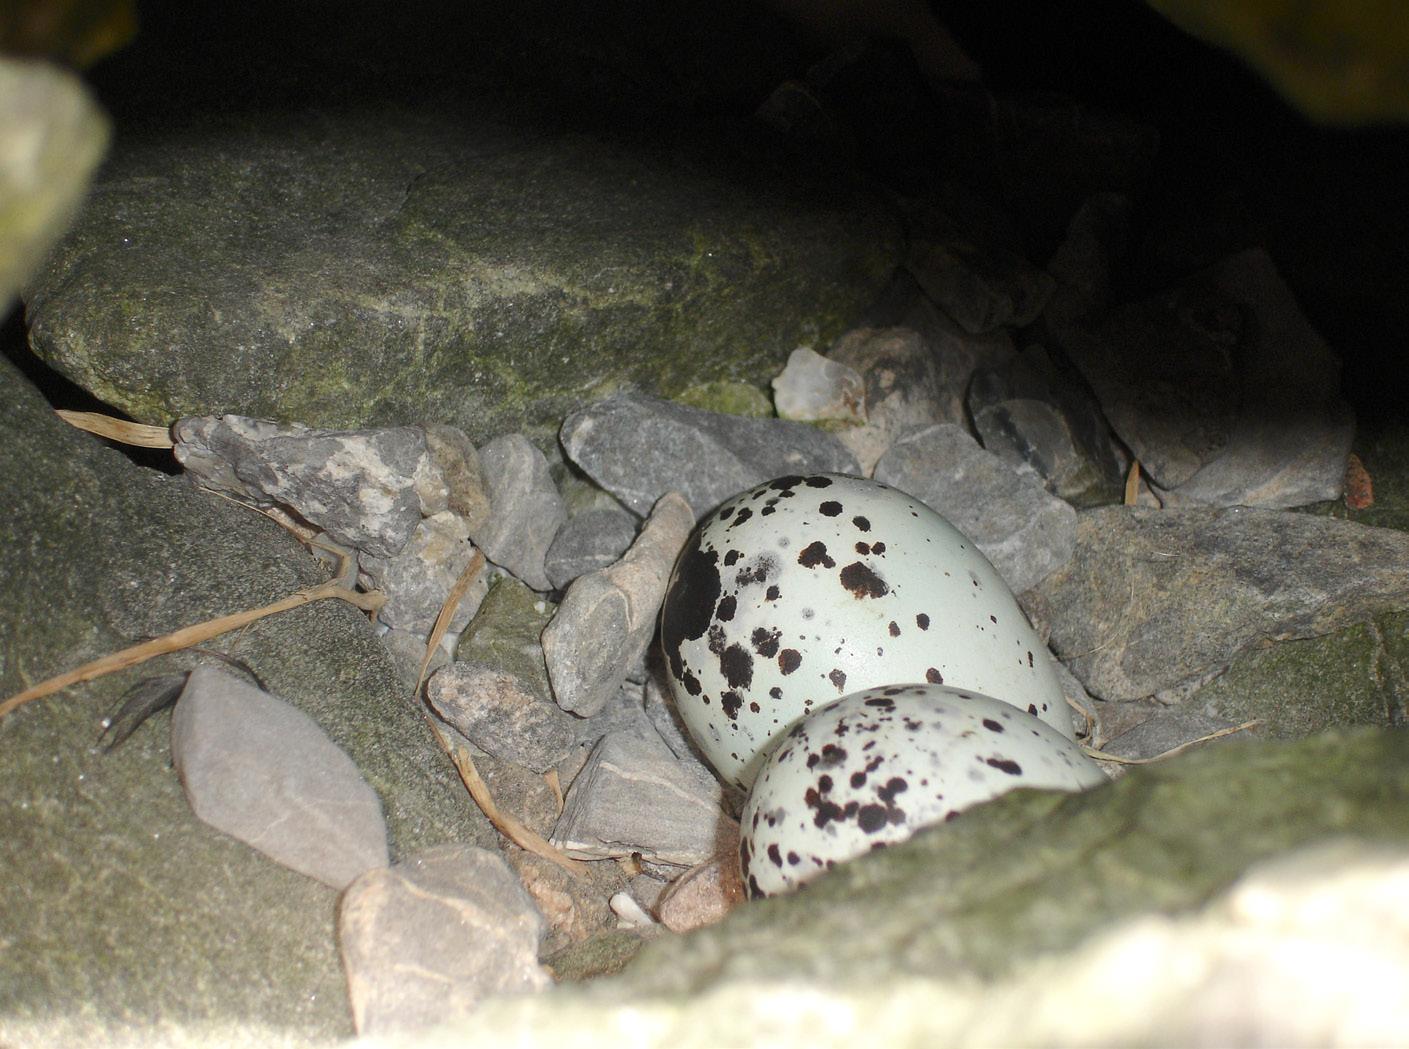
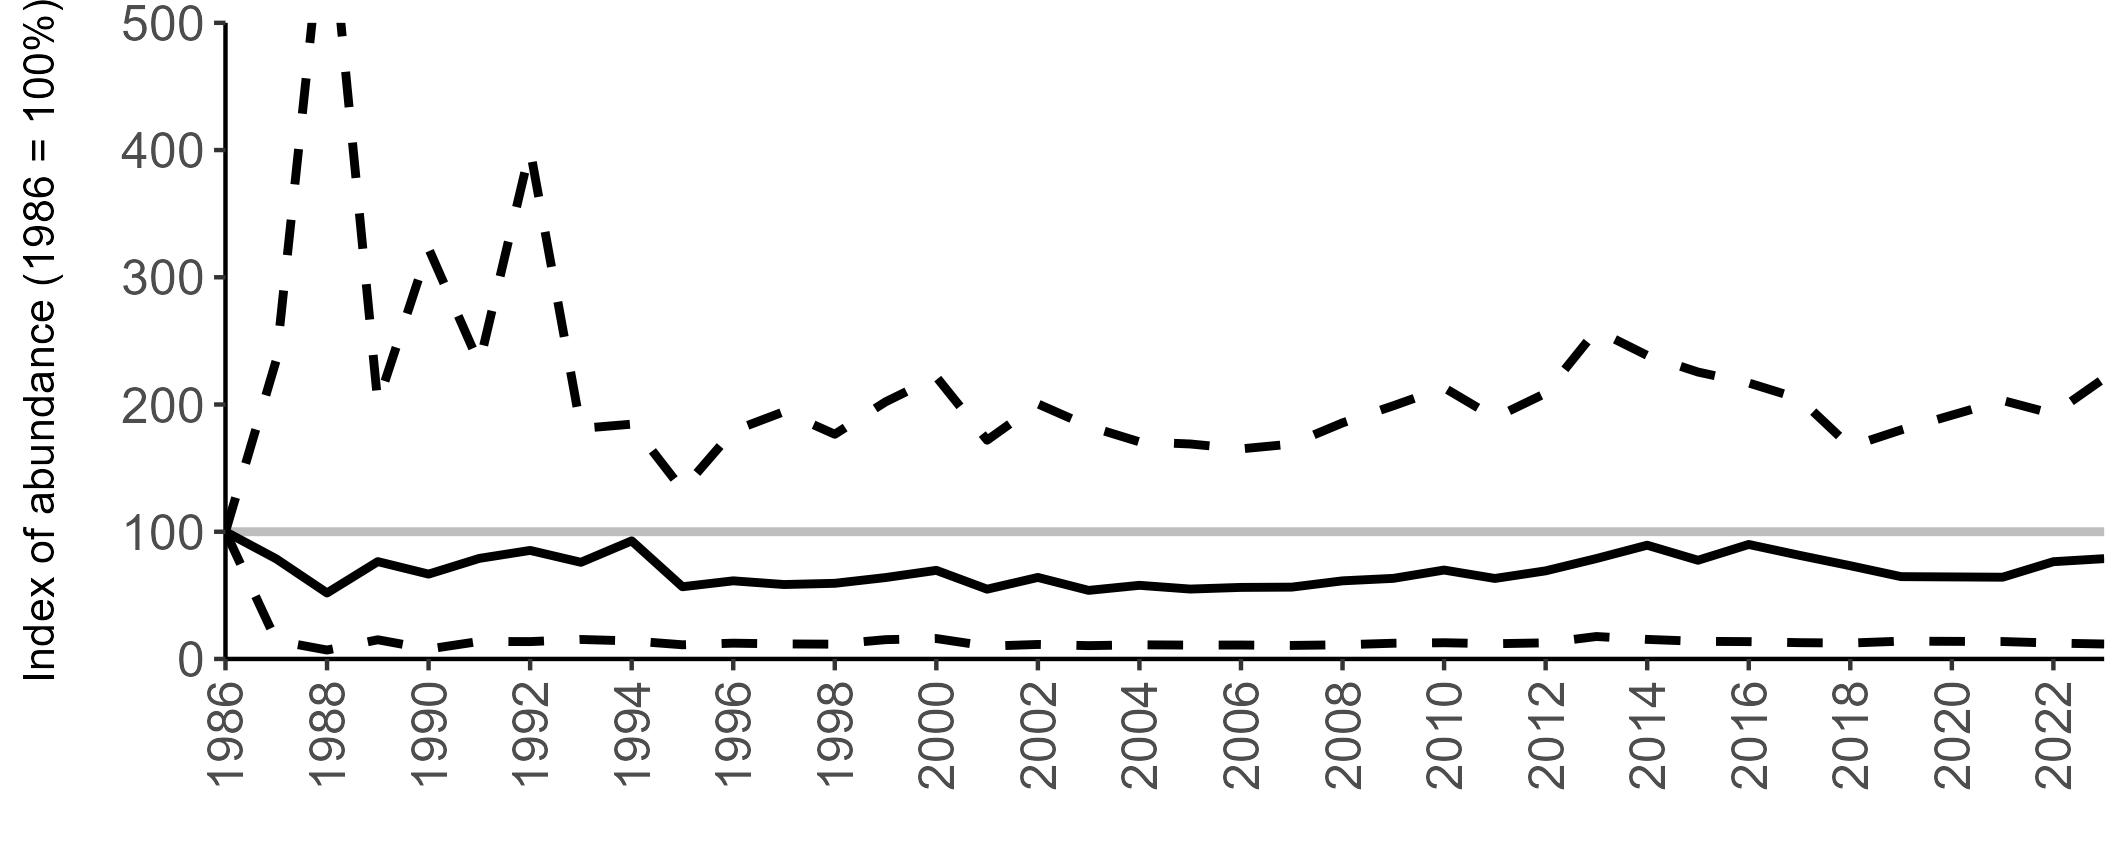
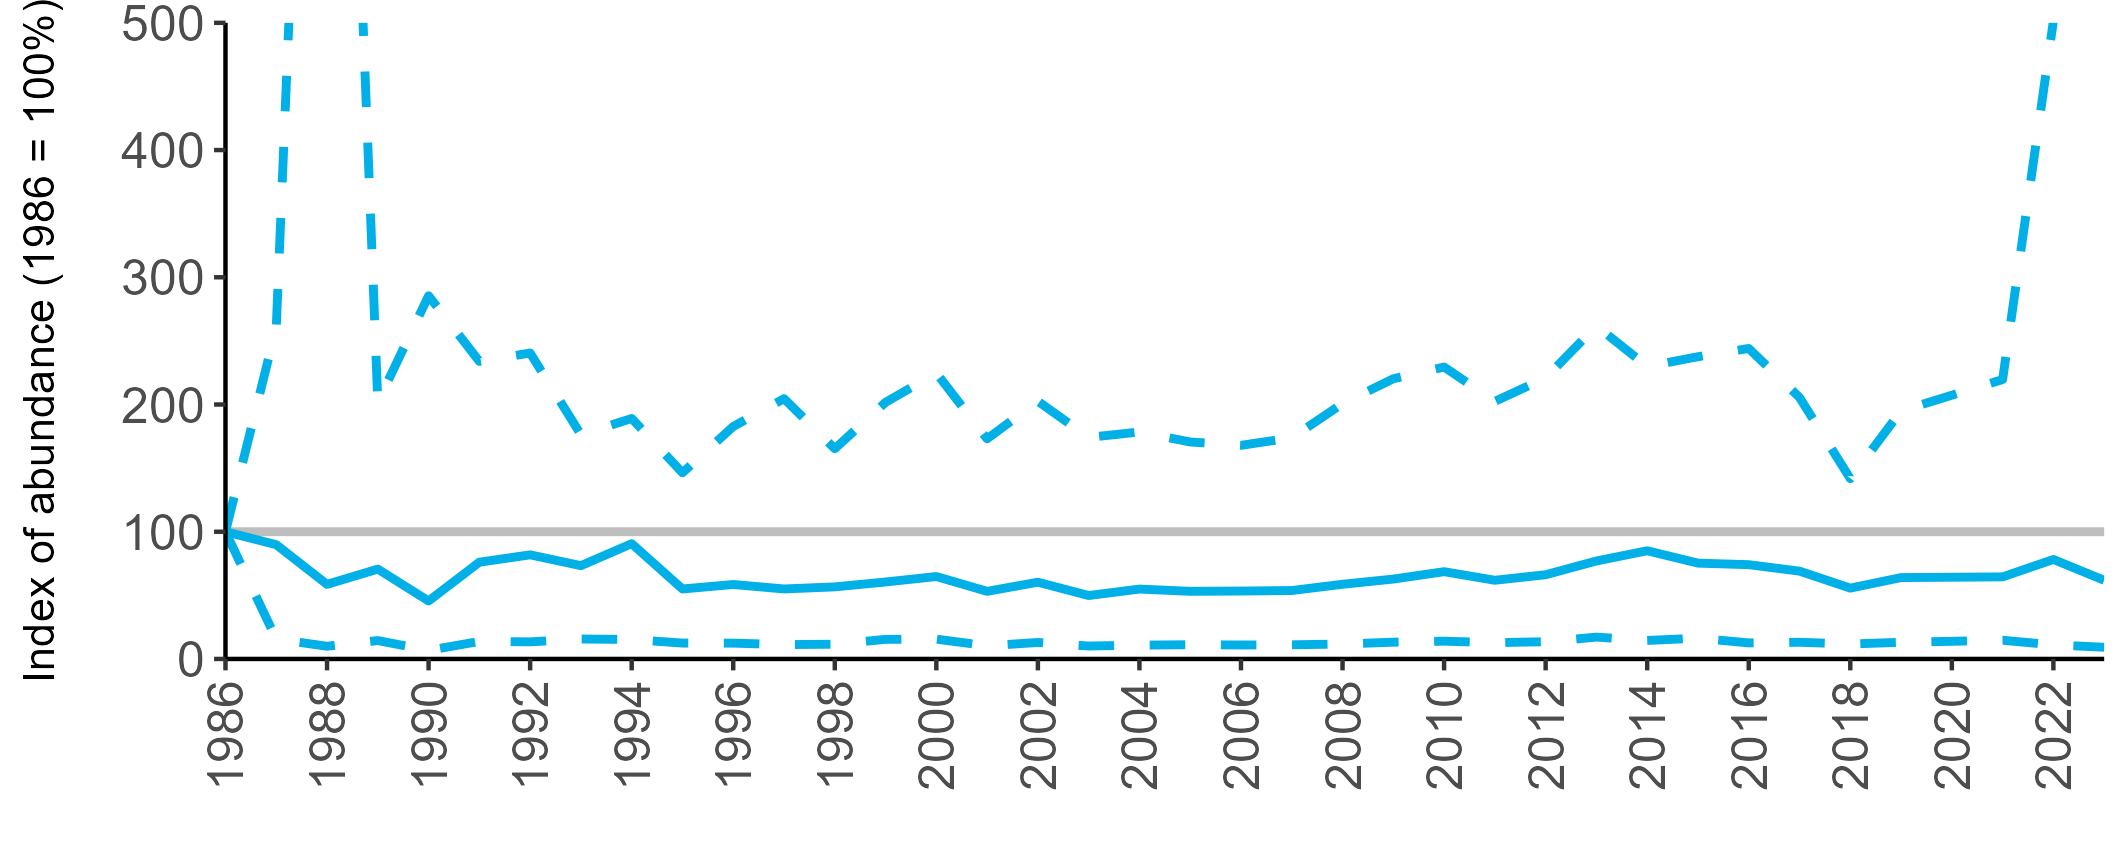
Red-listed Red-listed (I)
Abundance: n/a
Productivity: 0.48
Colony Count sites: 55
Breeding Success sites: 6
Vulnerable Lifespan: 18 years
Breeding age: 5 years
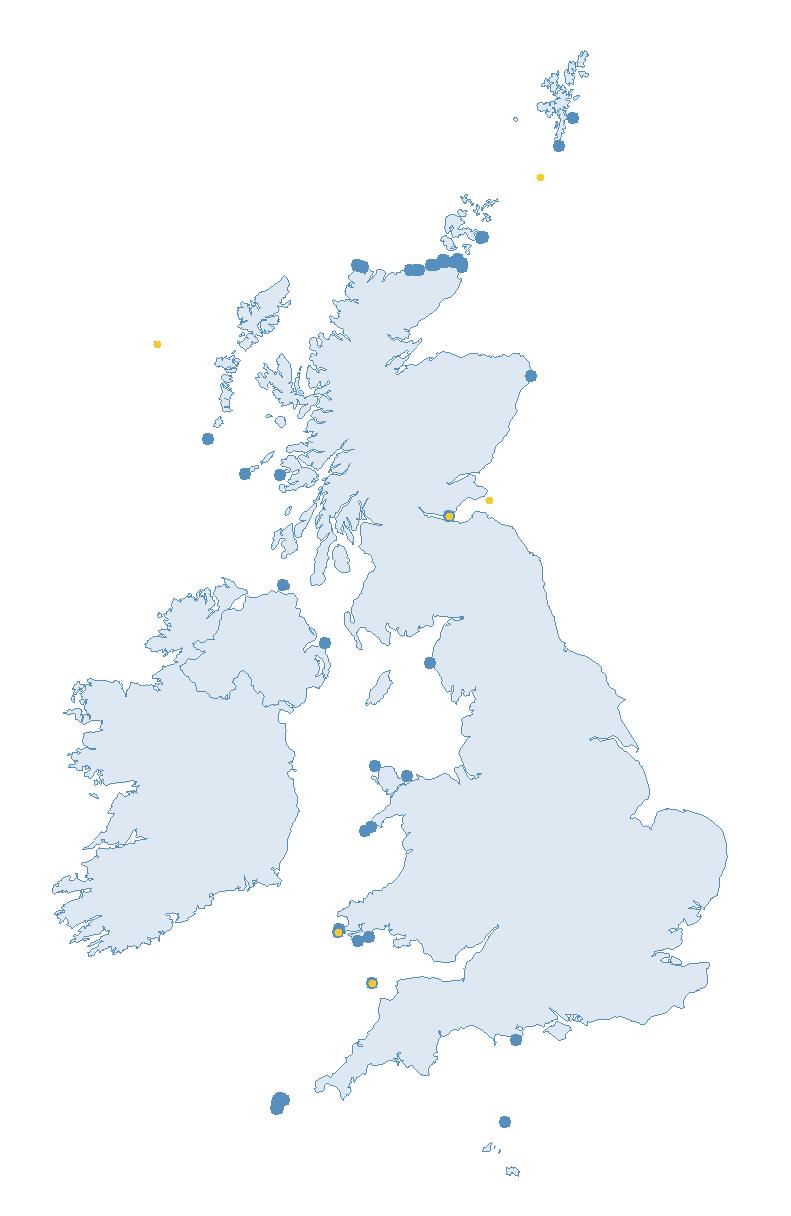
Britain and Ireland host approximately 8% of the global and 9% of the European breeding populations of Puffin (Burnell et al. 2023). Puffins are largest in the northern latitudes of their range, and smallest in their southern range. Body size is smallest in the UK, France and southern Norway, and largest in the High Arctic, e.g. Canada, Greenland, Svalbard and Russia (Burnell et al. 2023; Kersten et al. 2021; Leigh et al. 2022).
Puffin colonies are found around the coastline of much of Britain and Ireland, with the exception of southeast England, and Scotland holds the majority of the population (Burnell et al. 2023).
Globally, Puffins breed around the coasts of the North Atlantic and Arctic Oceans, with the highest numbers found in Iceland, Norway, Canada and the Faroe Islands. (BirdLife International 2024).
In the non-breeding season, they range extensively across their respective surrounding oceans. British and Irish breeders can be found throughout the North Atlantic Ocean and North Sea, with a few even venturing into the Mediterranean Sea (BTO 2023a; JNCC 2021; Fayet et al. 2017).
Puffins forage by pursuit dives and are agile underwater, reaching depths of 60 m (Burger & Simpson 1986 ). Their predominant prey is Lesser Sandeel ( Ammodytes tobianus), but
they will also take sprat, herring and juvenile gadoid fish (Harris & Wanless 2011).
Puffins are burrow nesters and, whilst they will excavate their own burrows, they will also use those dug by other species such as Manx Shearwater and European Rabbit (Oryctolagus cuniculus) (BTO 2023a). Extensive burrowing has been known to lead to such extreme soil erosion that the colony can collapse and be forced to move elsewhere, as happened on the island of Grassholm (Wales), which declined from estimates of 250,000 birds in 1890 to just two breeding pairs in 1973 and, thereafter, no breeding was confirmed (Boag & Alexander 1995; Morgan 2012; Pritchard et al. 2021).
Puffins are highly colonial and typically nest in soil burrows on the slopes and cliffs of isolated headlands and islands, or less commonly amongst boulder screes or in sheer cliff cracks. They lay a single egg, which is incubated for 36–45 days (Harris & Wanless 2011).
Like other burrow-nesting seabirds, they are easy prey for mammalian predators, so colonies are often in locations where these are absent (JNCC 2021).
Too few Puffin colonies are monitored in Britain and Ireland to enable the production of valid annual breeding abundance trends for any region, due to the logistical and financial challenges involved in monitoring this burrow-nesting species.
Methodological changes and inconsistencies between national censuses can make it difficult to accurately assess population changes for this species. The Seabirds Count census indicated that the Puffin population in Britain and Ireland had declined by 24% since Seabird 2000 (Burnell et al. 2023) when only sites/records surveyed using the same method, units and sufficiently similar timings between Seabirds Count and Seabird 2000 were included in the analysis.
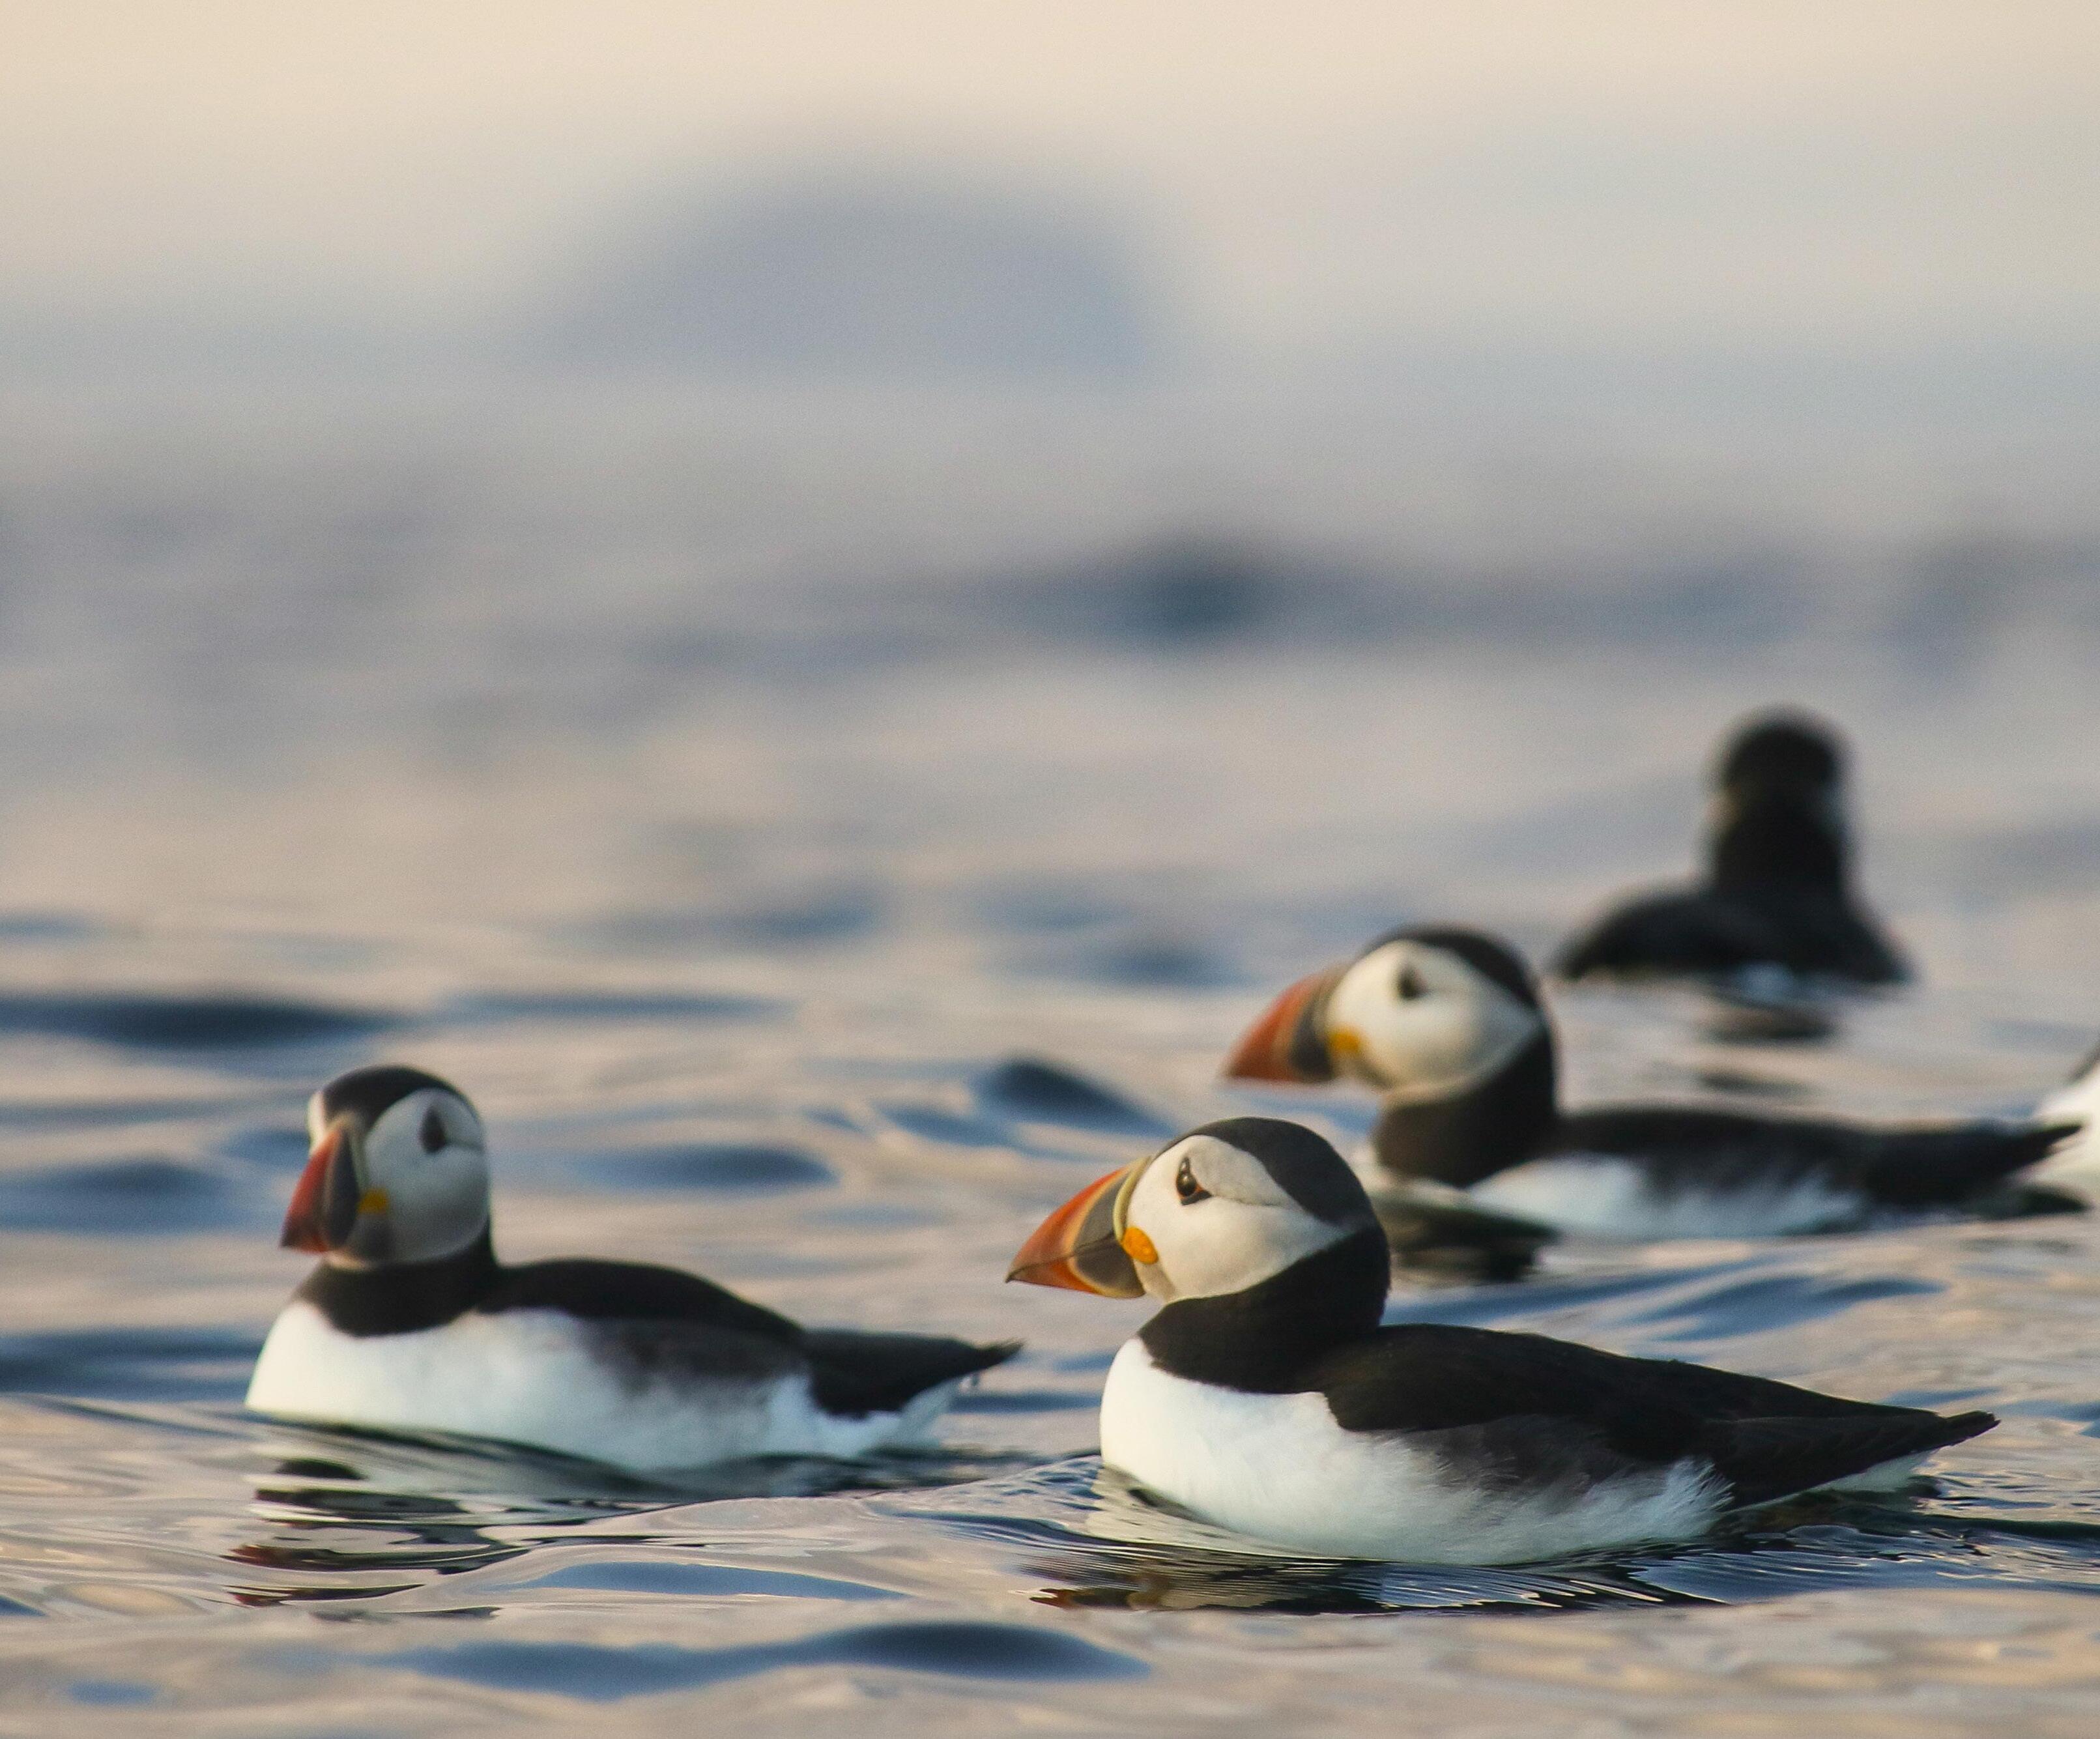
Puffin productivity trends for the UK and Scotland are closely matched (Figure 72) as a large proportion of monitored sites are in Scotland. Productivity values for the UK and Scotland have fluctuated between years over the SMP recording period. The trends declined from the mid 1990s to a low in 2007, following which they increased overall until 2021. In 2023, mean productivity estimates declined to 0.48 and 0.45
chicks fledged per pair in the UK and Scotland, respectively (Table 49).
Too few data are submitted to the SMP on productivity of Puffins in other regions to calculate any meaningful average productivity values.
PHENOLOGY, DIET AND SURVIVAL RATES
No systematic data on phenology have been collected as part of the SMP. However, diet information is collected
COMPARABLE FIGURES – NOT COMPLETE COUNTS
See main text under ‘Breeding Abundance’
Abundance (AOB) Seabird 2000 (1998—02)
on the Key Sites of Fair Isle and the Isle of May (both in Scotland), whilst information on adult survival is gathered on the Isle of May (Scotland).
CAUSES OF CHANGE
Rising sea surface temperatures are impacting the sandeel populations on which Puffins rely for food (Régnier et al. 2017; Wanless et al. 2004, 2018). Consequently, adult Puffins need to travel further to forage, which is more energetically costly (Fayet et al. 2021).
Abundance (AOB) Seabirds Count (2015—21) Percentage Change
-24
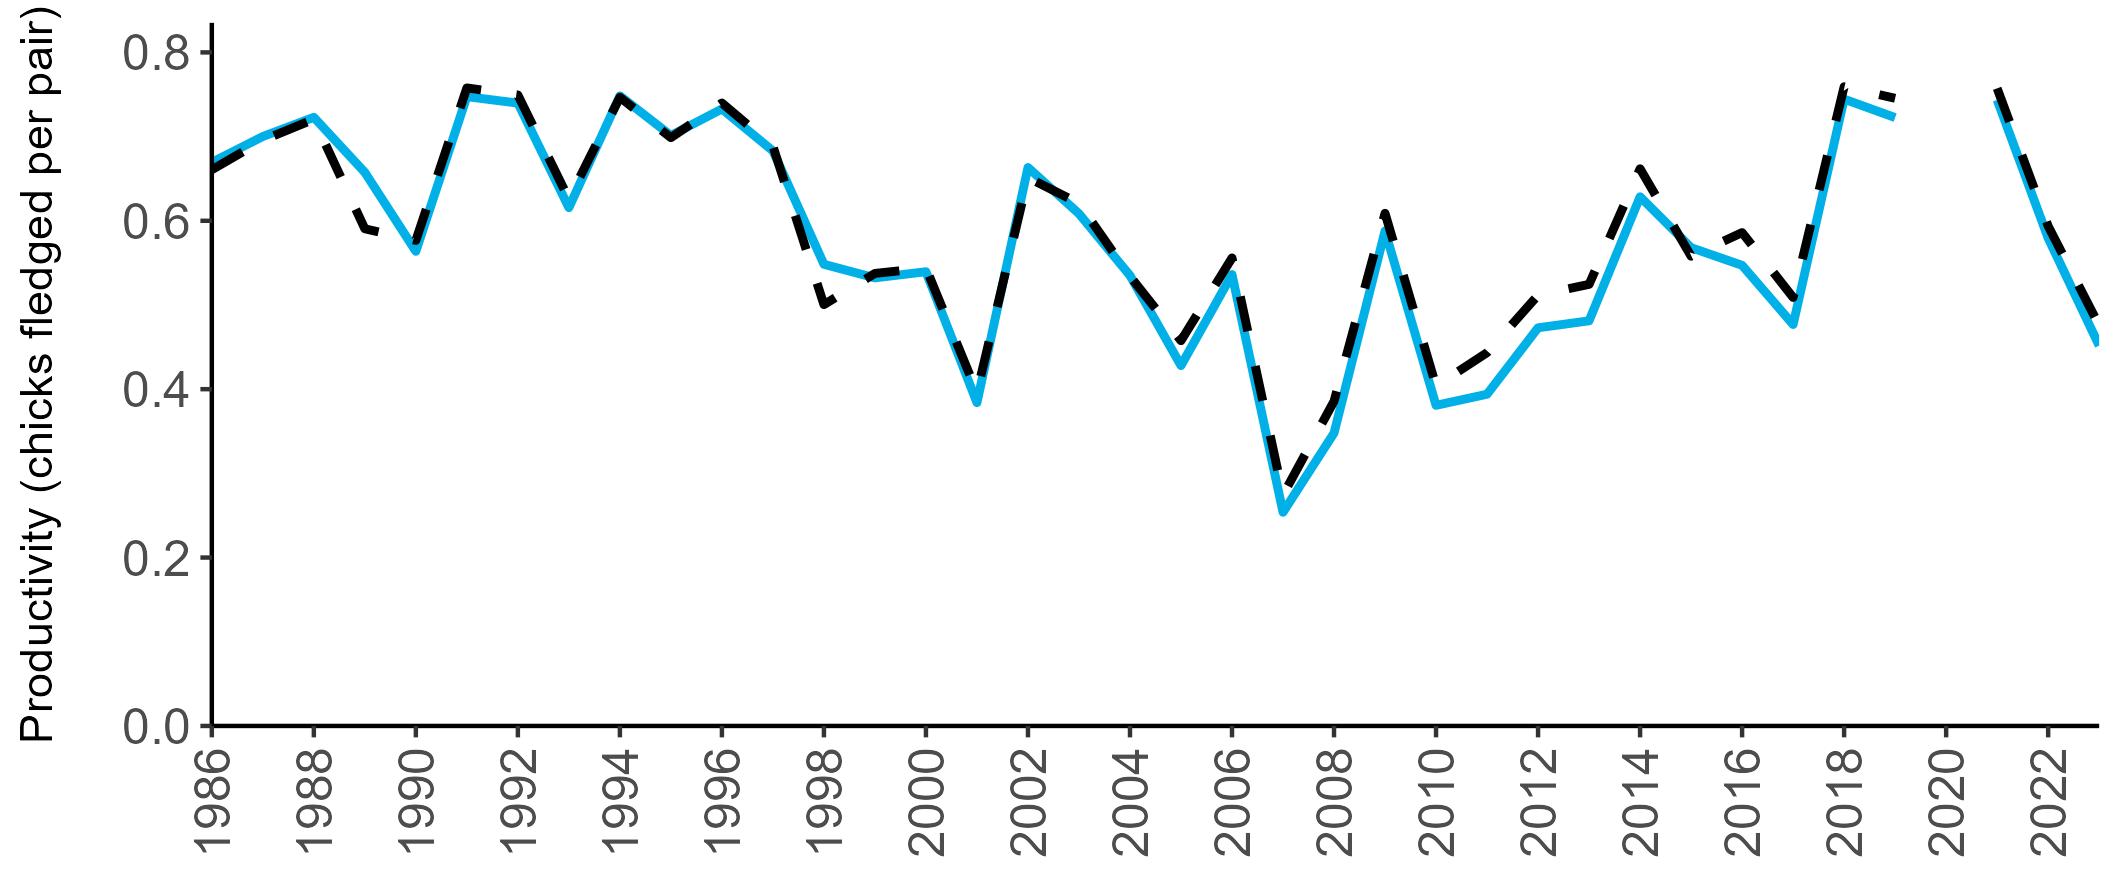
and can lead to a deterioration of body condition, and in extreme cases starvation, resulting in seabird wrecks (Jessop 2014; JNCC 2021).
Ireland) using tape lures and decoys, resulting in confirmed nesting in 2015 (Booth Jones & Wolsey 2017).
A reduction in food availability during breeding seasons, causing low productivity, is thought to have contributed to population declines at a number of colonies (Owen et al. 2018), whilst increases have been noted where favourable foraging conditions occur near colonies (Fayet et al. 2021).
As a burrow nesting species, Puffins are vulnerable to mammalian predators such as Domestic Cats (Felis catus) and rats (Brown at al. 2011). Avian predators include Great Skua (Miles et al. 2015) and large gull species (Finney et al. 2001). They can also be the target of kleptoparasites such as Arctic Skua and Great Blackbacked Gu ll (Burnell et al. 2023; Finney et al. 2001), which can reduce the provisioning of prey to chicks.
Increased winter storm frequency due to climate change may also be impacting Puffin populations. These can make foraging more challenging
Offshore wind farms, installed to help tackle climate change, have been identified as a potential threat to the species. These are often located on sandbanks, which are nursery grounds for breeding sandeels (Kenyon & Cooper 2005) and, as such, are favorable Puffin foraging areas. The presence of wind farms can make these areas unsuitable for Puffins due to displacement or barrier effects (Searle et al. 2014).
Eradication of predatory mammals from islands with breeding Puffins can prove beneficial. For example, the successful removal of Black (Rattus rattus) and Brown (Rattus norvegicus) Rats from the island of Lundy (England) in 2004 was followed by a rapid increase in Puffin numbers (Brown et al. 2011; Lock 2006). Biosecurity measures are also vital, to prevent the colonisation or reinvasion of Puffin breeding islands by invasive predators.
An expansion in the breeding range of Puffins could also be achieved by attracting prospecting adults to predator-free islands before the breeding season. This was successfully achieved at Copeland (Northern
Additional conservation measures likely to benefit Puffins include the careful placement of offshore wind farms in areas away from Puffin colonies and important foraging areas, and reductions in commercial fishing of key prey species, such as sandeels (Burnell et al. 2023).
The impact of HPAI on Puffin populations is currently unknown. In the breeding season of 2022, HPAI was confirmed in six out of 25 Puffin carcasses sent for testing, including in a bird from St Kilda, the largest Puffin colony in Britain and Ireland (APHA 2024, Burnell et al. 2023). Continued monitoring will be crucial in understanding any impacts from the virus.
Accurate monitoring of the abundance and productivity of Puffins, both through the SMP and national censuses, is currently logistically, methodologically and financially challenging. The development of new monitoring technologies, such as the use of Uncrewed Aerial Vehicles (UAVs), time-lapse photography and burrow sensors, will be critical to better evaluating and understanding Puffin population trends in the future (Burnell et al. 2023).
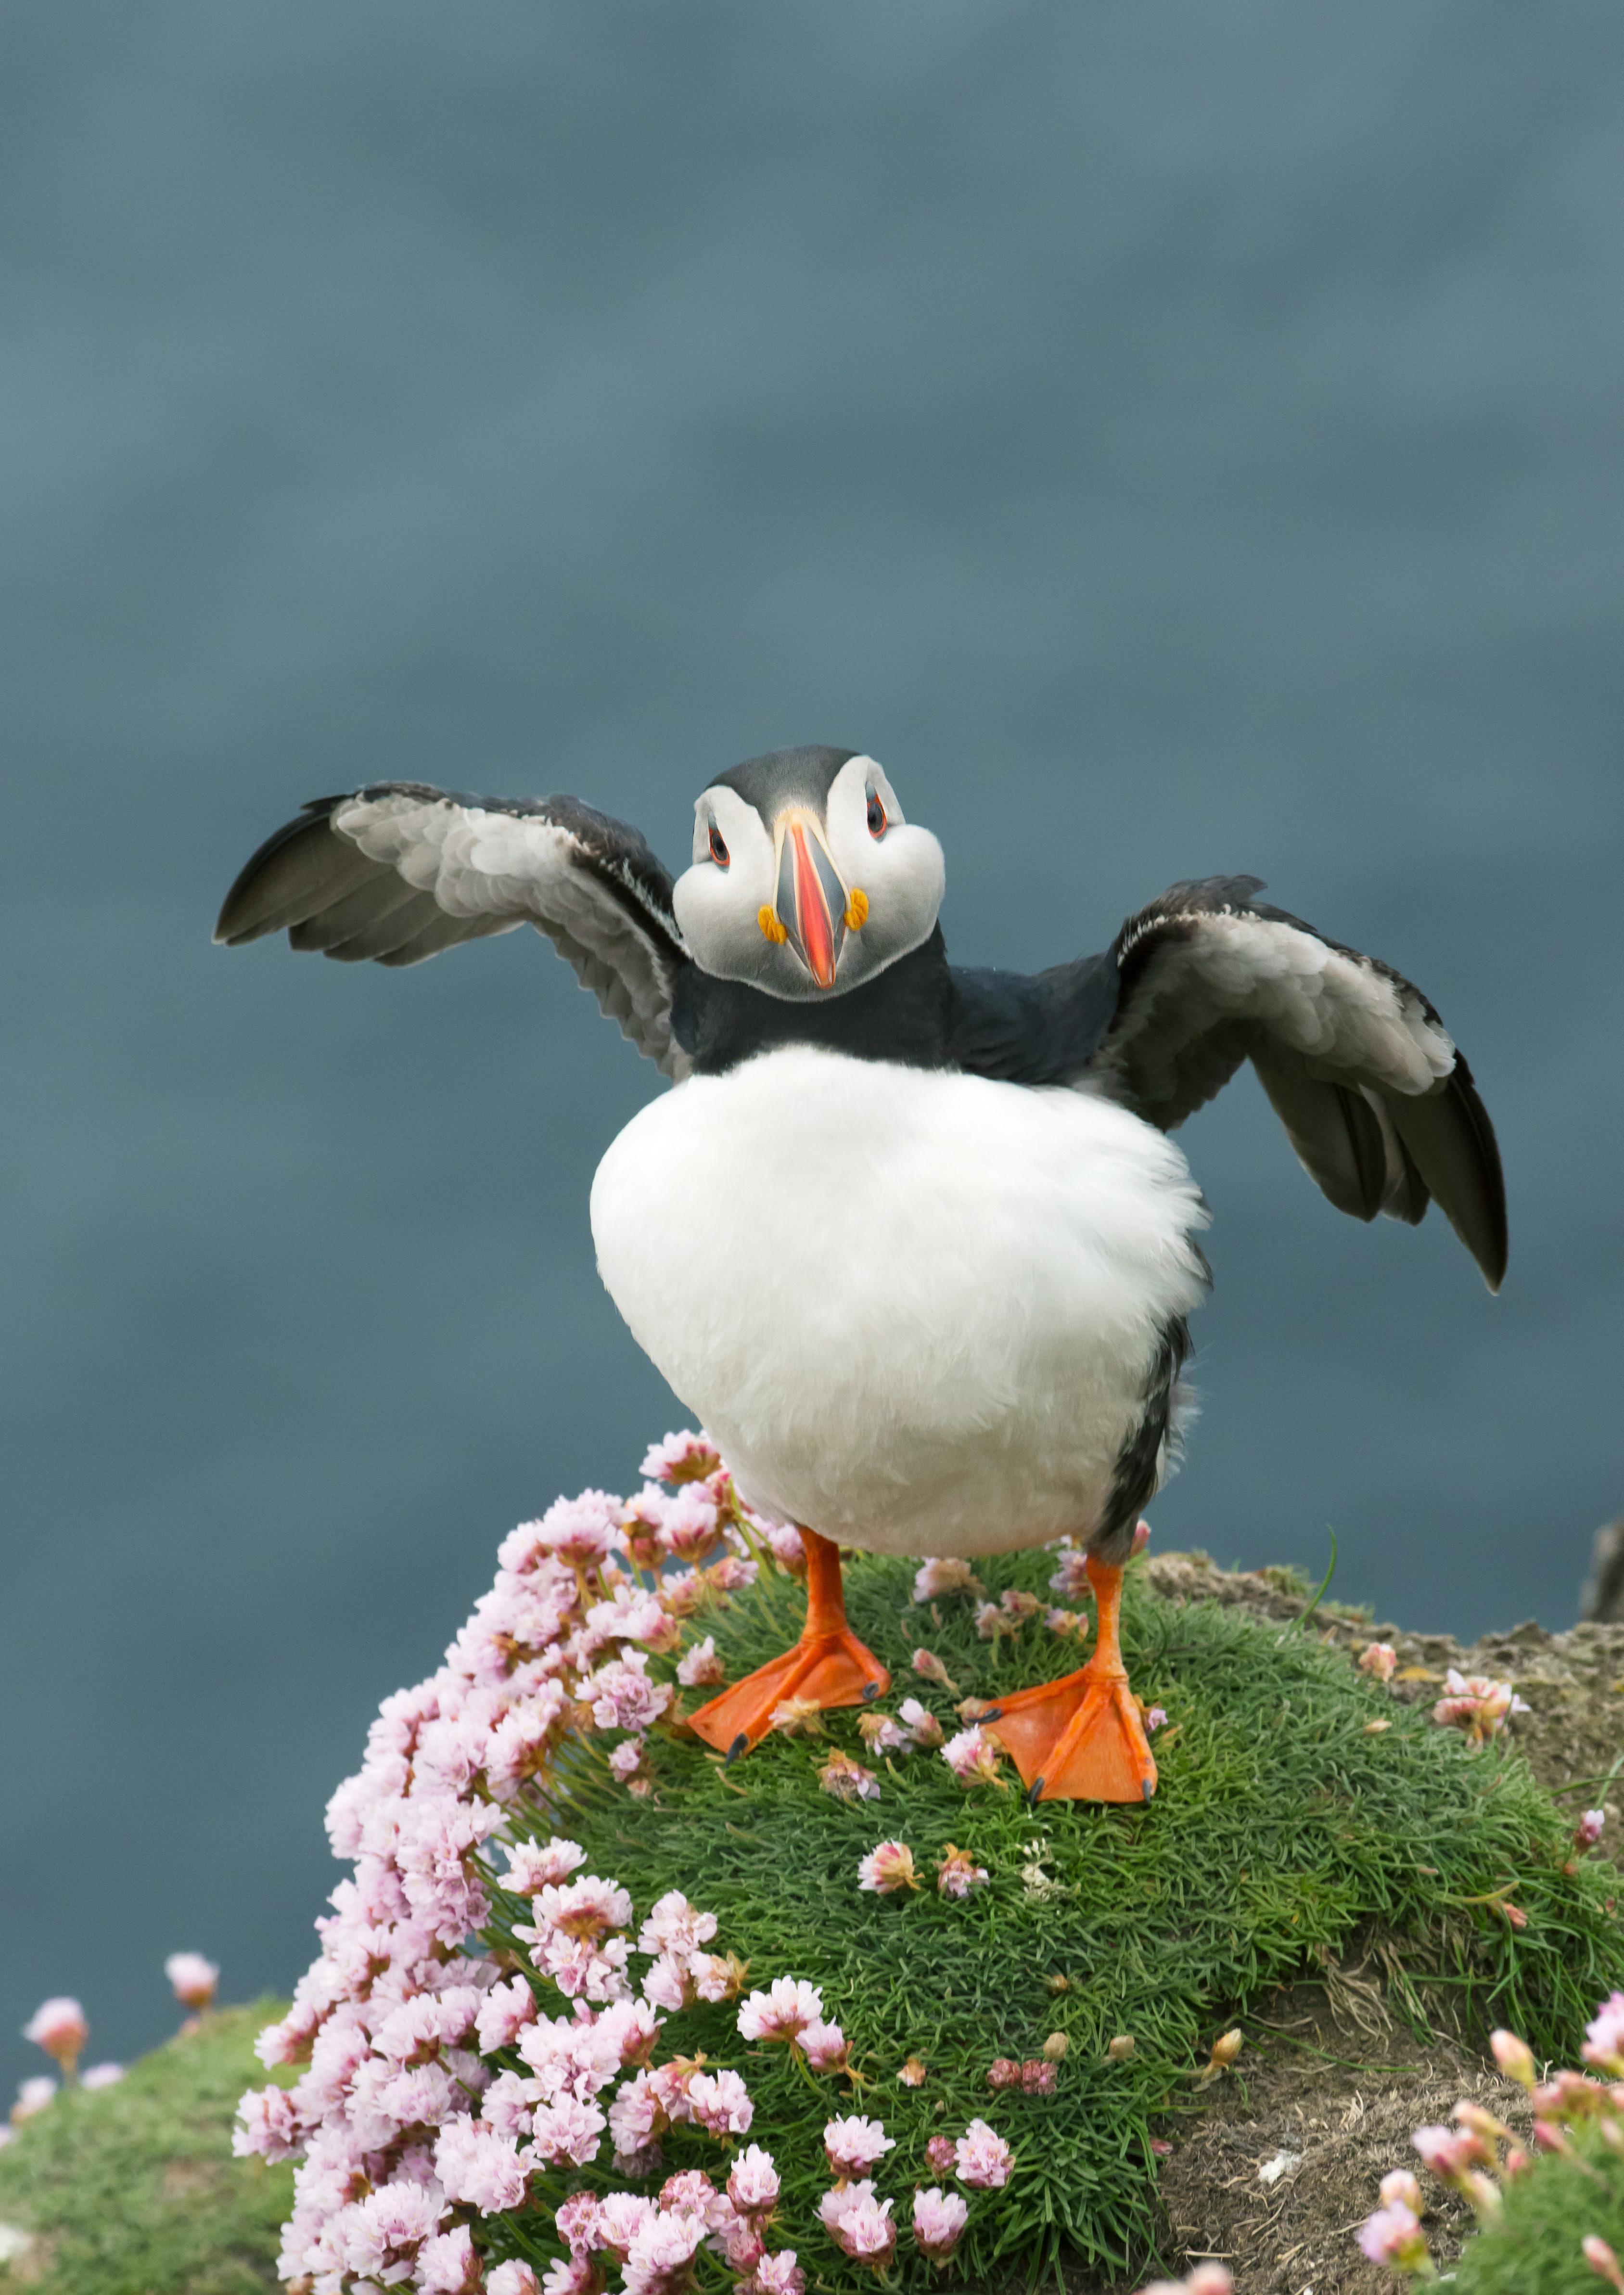
Table 50: An overview
Table 51: An overview of the breeding abundance trends and productivity values for England. For information on interpreting the data presented in this table, see pages 18—21. Information and context regarding the results presented here are available in full within the species accounts (see pages 22—133).
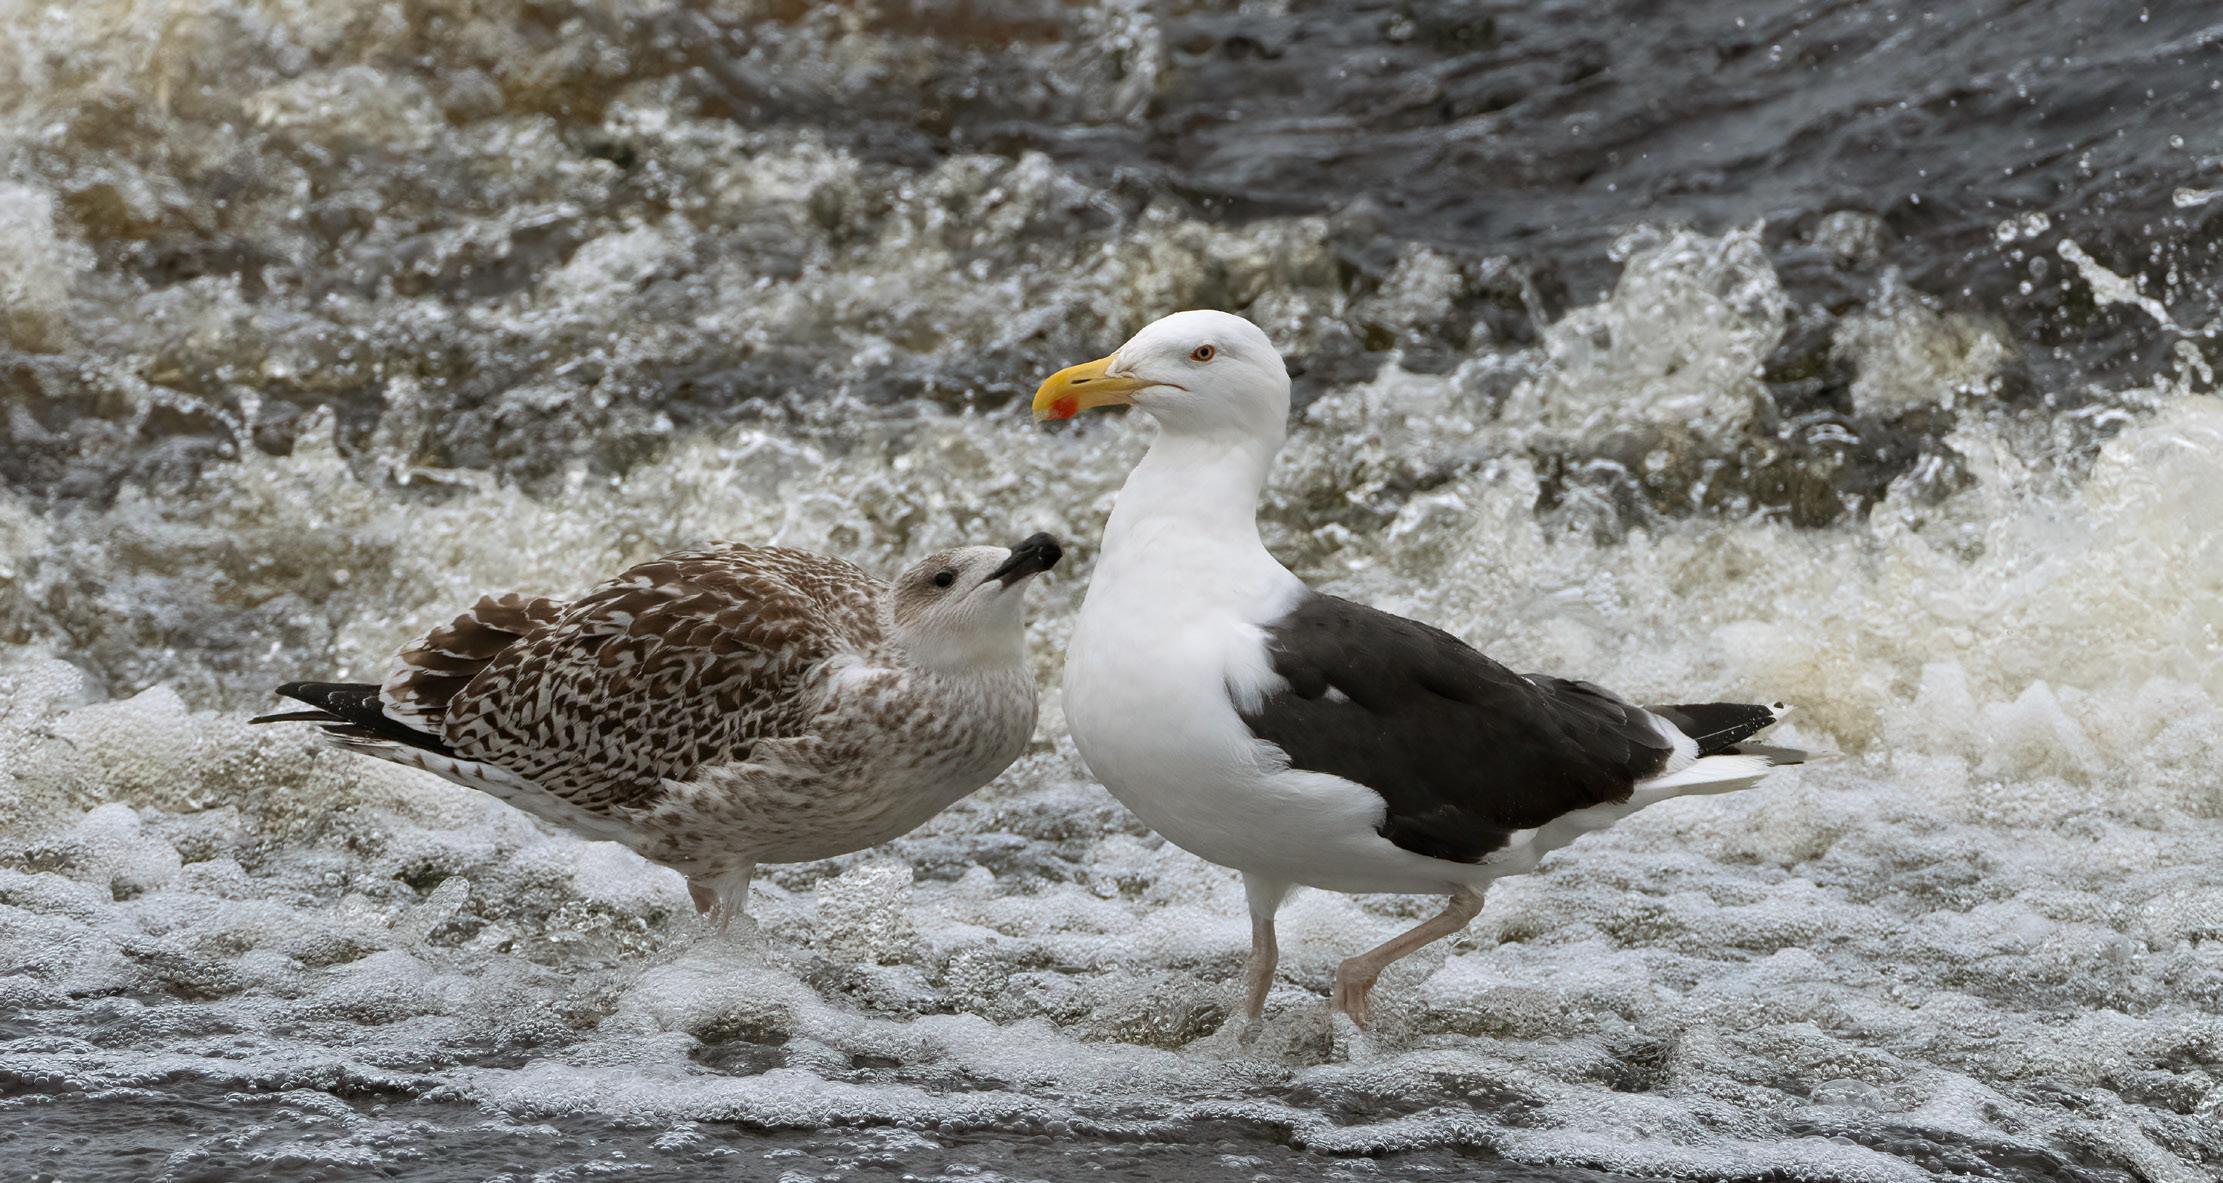
Table 52: An overview of the breeding abundance trends and productivity values for Scotland. For information on interpreting the data presented in this table, see pages 18—21. Information and context regarding the results presented here are available in full within the species accounts (see pages 22—133).
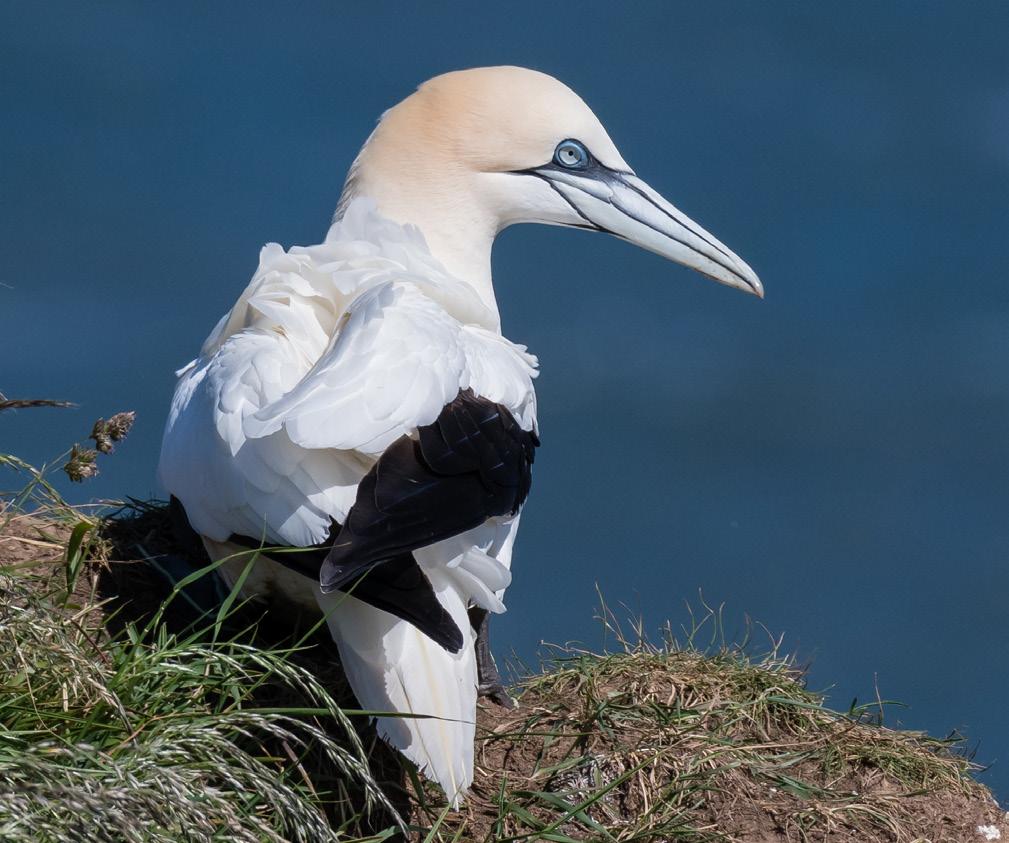
Table 53: An overview of the breeding abundance trends and productivity values for Wales. For information on interpreting the data presented in this table, see pages 18—21. Information and context regarding the results presented here are available in full within the species accounts (see pages 22—133).
statistically significant trends
In previous reports covering the annual results of the SMP abundance and productivity values have been presented for particularly important colonies for some species in regions or countries, especially the Channel Islands, Isle of Man, Northern Ireland, the Republic of Ireland and all-Ireland, where insufficient data were available to produce robust trends. Although data may be insufficient to produce these region- or country-specific trends at present, all UK-scale trends include data from England, Northern Ireland, Scotland and Wales.
In the species accounts, some of the productivity graphs show historic data for certain areas where data from more recent years are currently unavailable. Work behind the scenes by both organisational staff and volunteers aims to increase future coverage, collate any missing historic data
and improve data flow into the SMP database via SMP Online. As such, future reports are highly likely to feature results from these countries and areas.
Additionally, SMP data analysis methods are currently undergoing development and, together, these advances will increase the ability for greater reporting across Britain and Ireland.
We are particularly grateful to those collecting or collating information from seabird colonies in the Channel Islands, Isle of Man, Northern Ireland, and the Republic of Ireland for their continued support, efforts to align databases and, of course, to everyone for the data submitted to date.
The SMP has provided breeding seabird data for decades, collected and submitted by professional surveyors and enthusiastic volunteers across Britain and Ireland, including the Channel Islands and Isle of Man.
Periodic seabird censuses, such as the recently published Seabirds Count, provide an invaluable report on the condition of breeding seabird populations. However, censuses can only be delivered on decadal timescales due to the time consuming and costly process of completing coordinated counts. As observed with the recent collapse of Gannet and gull breeding colonies due to HPAI, things can change very quickly. Annual seabird surveys like SMP may be more sensitive to capturing stochastic changes in breeding populations which may not be picked up by periodic censuses run every 15–20 years. Annual monitoring is, therefore, essential for informing effective and timely conservation methods, and by increasing the coverage of seabird sites across Britain and Ireland we will
1. February—March
Sign up for SMP and register for your site/s.
4. July—September
Productivity recording ends as the last chicks fledge.
have more accurate data and a better understanding of how populations are faring.
Additionally, seabird productivity varies considerably from year to year and is highly dependent on the environmental conditions during the chick provisioning period, and is sensitive to extreme weather conditions. Breeding Success surveys are something that, when conducted annually, can deliver a valuable productivity time-series that may offer an early warning system to e.g. the collapse of fisheries and other oceanographic processes that are difficult to monitor.
With exciting advancements in seabird monitoring methodologies and the advancements underway for the SMP – from data entry to data analysis methods and survey sampling – now is the perfect time to get involved in monitoring seabird colonies!
There are two different surveys you can take part in to contribute to the SMP: Colony Counts and Breeding Success. Colony Counts, depending on the site, generally require one visit to count the nest sites or individual breeding adults within the whole colony. However, when surveying plots, additional visits are required. These visits can last from 20 minutes to several hours depending on the number of birds and the size of the plot. Breeding
2. Late March
Beginning of monitoring season for early breeders.

5. October Deadline for data submission through the SMP online portal.
A mix of participants, from experienced professional surveyors monitoring seabirds as part of their working life, to volunteers who discovered seabird monitoring recently, and everything in between, describe what drives them to take part in the SMP.
Success surveys, where the number of chicks that have fledged from active nests are recorded, also require multiple visits to the colony.
Depending on the species you wish to monitor at your site, the survey season starts in late March (for early breeders like Black Guillemot) and ends in September (for late fledging Gannets).
If you have never taken part in a BTO survey before, you will need to create a BTO account in order to sign up to take part in the SMP. Visit www.bto.org to create your BTO account and then sign up to the SMP ‘project’ specifically.
Next, visit SMP Online (app.bto.org/seabirds) and search for SMP sites in your area. There are seabird monitoring sites across Britain and Ireland at both coastal and inland locations, and the map shows you where these sites are.
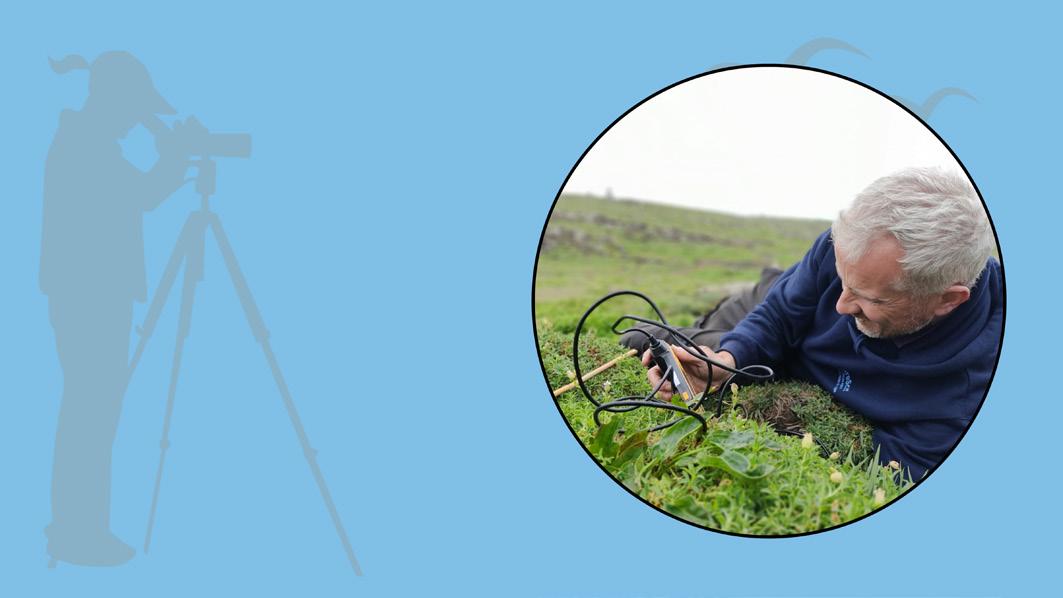
“I've been living and working on seabird islands for 23 years and the SMP plays such a pivotal role in allowing us to assess the health of our internationally important seabird colonies in these changing times”
David Steel
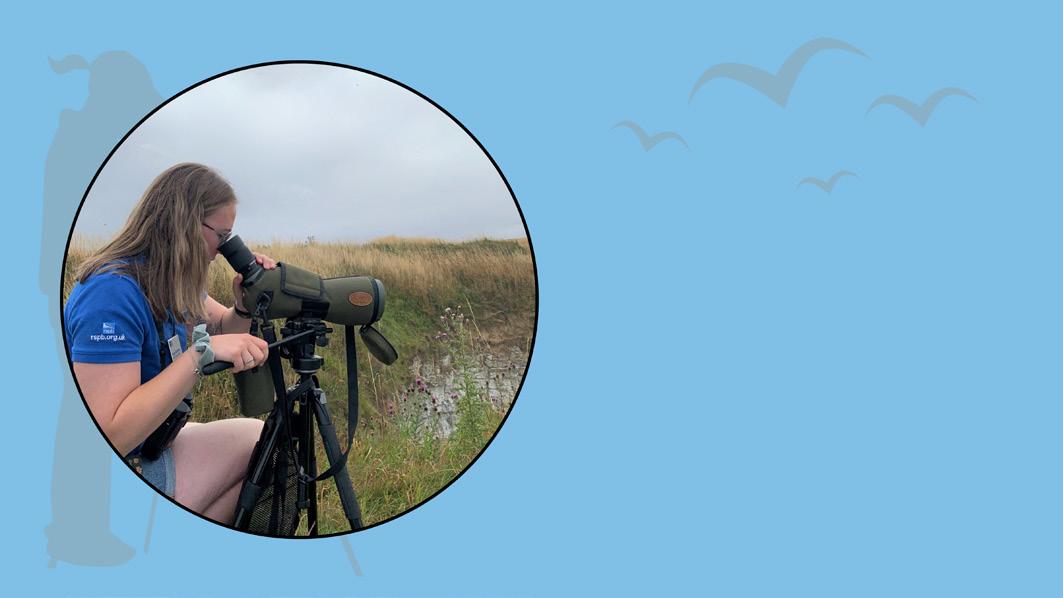
“Not only do I spend more time out on the coast watching birds that I love, but I have the ability to understand the colony more and collect data which are vital for seabird conservation efforts.”
3. May—July
Key months for monitoring most seabird species.
6. Await results
Data feeds into trend analysis, research and publications.

Sites marked as already having active counters may not have all seabird species covered, so if there is a covered site that you wish to count, please get in touch with the SMP Organiser to find out more at: smp@bto.org. Finally, sites with breeding seabirds not yet on the map can also be added to the programme.
To take part, you will need to be able to identify the seabirds present at your site. You will also need to be able to follow the prescribed methodology in the Seabird Monitoring Handbook. The handbook specifies times, dates and methods for each species which will need to be used to ensure that data are standardised and comparable with previous counts.
After you have completed your survey you will need to input your data through the SMP Online data entry portal, with guidance available online, by the end of October each year.
And most importantly, get out into the field and have fun. Monitoring seabirds is a fantastic way to observe this fascinating group of animals first hand. Head to the windswept coastline and see Gannets diving at breakneck speeds to capture prey, or travel to inland colonies where gulls can be seen flying atmospherically over moorland.
“It was a great privilege to be asked to help monitor the exceedingly vulnerable Roseate Tern colony on Coquet Island, making a valuable contribution to SMP. My goosebumps continue to this day!”
Tom Cadwallender
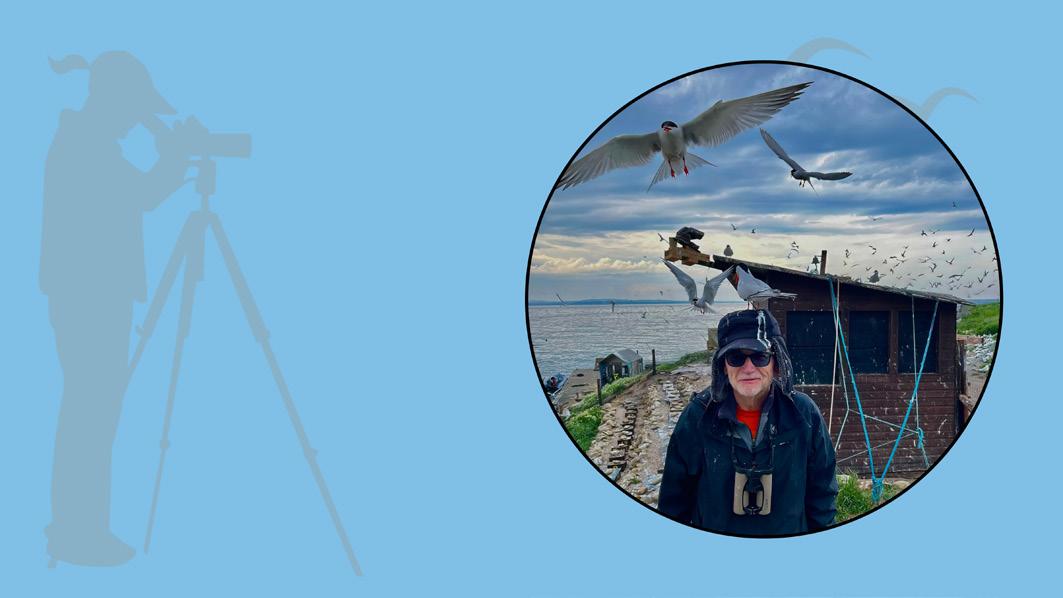
“There’s nothing like witnessing a successful season with adults bringing in fish and (hopefully!) lots of fledged young!” Murray Orchard


“The Seabird Monitoring Programme has captured my heart in 2024 and I look forward to discovering more about the intricate lives of Britain’s seabirds!”
Jess Callaghan
The SMP collects annual data on the breeding abundance and productivity of seabirds. This includes colonies and breeding populations at both inland and coastal locations.
There are two main counts that take place annually: Colony Counts (count of birds and nests within a defined count area — the whole colony or via multiple-visit sample plots) used in the breeding abundance analysis, and Breeding Success recording (how many young were successfully raised in a breeding season) which feeds into the annual productivity assessment.
The dates and times for undertaking Colony Counts of seabirds in Britain and Ireland (for more detailed time and date requirements for specific methods please check the Seabird Monitoring Handbook*):
Fulmar
Late May—early July (ideally June)
Gannet June—July
Manx Shearwater Late May—early June
Storm Petrel Mid July
Leach’s Petrel Late June
Cormorant Normally early May—late June (peak nesting period, repeat counts if possible)
Shag Normally late May—late June (peak nesting period, repeat counts if possible)
Arctic and Great Skua Normally late May—late June (peak nesting period, repeat counts if possible)
Gulls (Larus spp.) Late May—early June
Kittiwake Late May—mid June (repeat counts if possible)
Terns Mid May—late June (if repeated counts are possible, otherwise early—mid June)
Guillemot and Razorbill 1—21 June
Black Guillemot Late March—early May
Puffin Late April—mid May optimal (early August is acceptable for AOB)
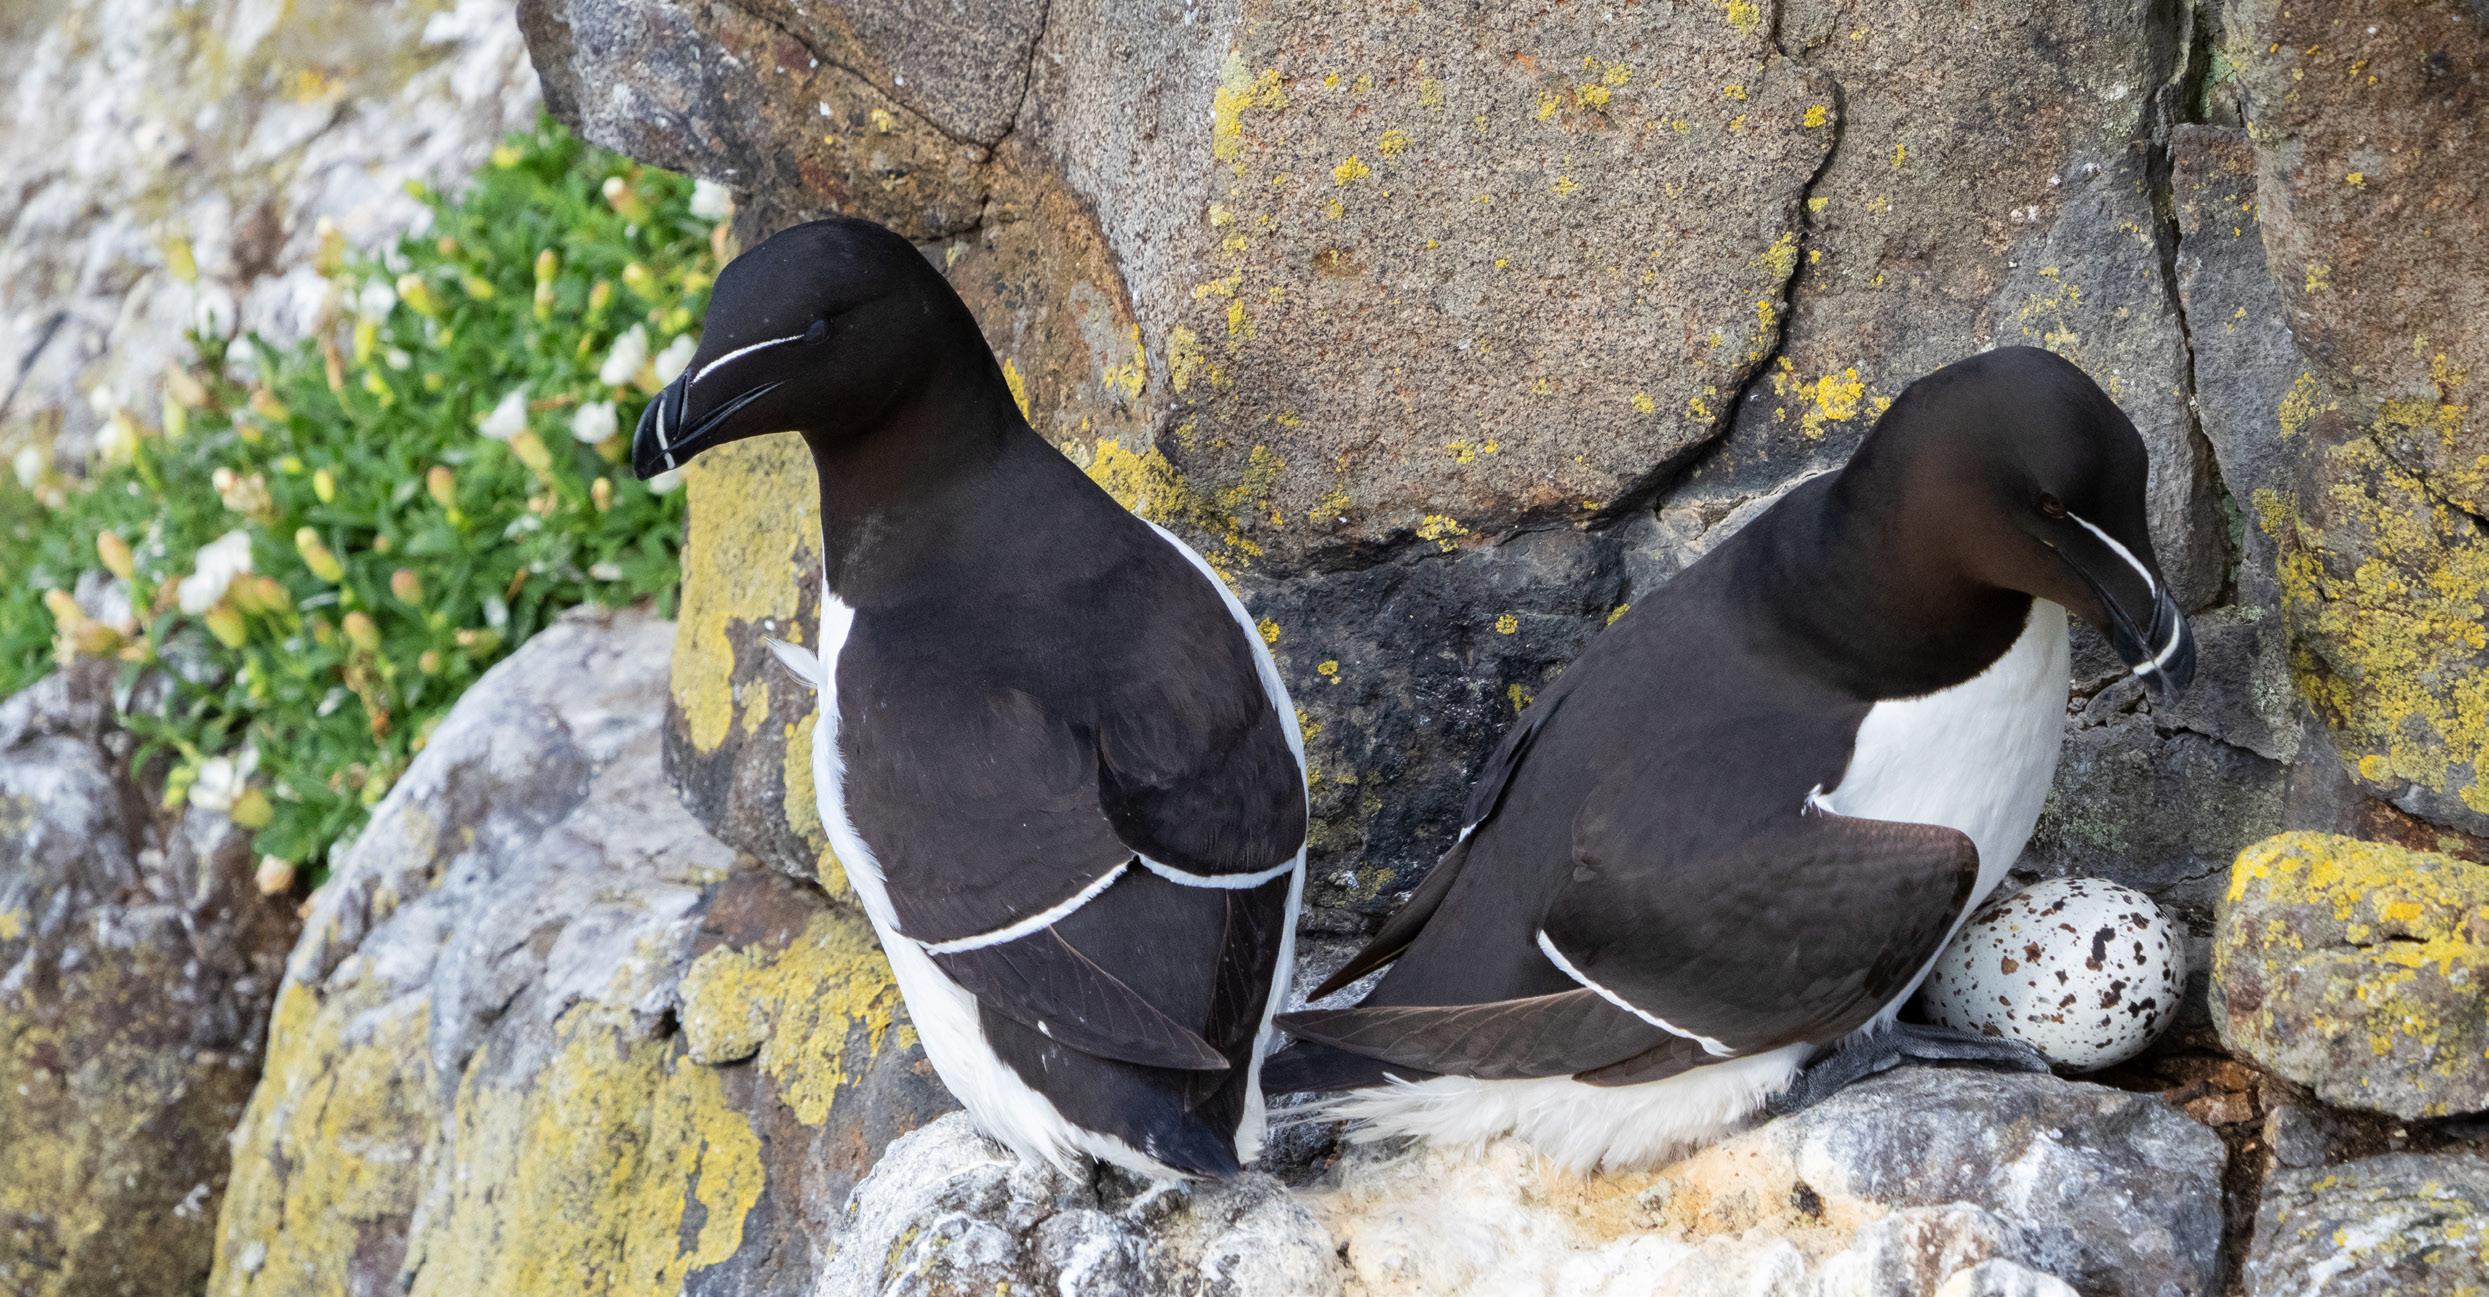
0900—1730
0900—1600
Daylight
Daylight
Daylight
Daylight
Daylight
Daylight
Daylight or 0900—1600 for vantage point counts and flush counts
Daylight
0800—1600 or preferably 1000—1200 if flush counts are used
0800—1600
First light—0900
Daylight
The dates and times for undertaking Breeding Success monitoring of seabirds in Britain and Ireland (for more detailed time and date requirements for specific methods please check the Seabird Monitoring Handbook*):
Fulmar Late May—mid August
Gannet Late April—late August
Manx Shearwater Early May—late August
Storm Petrel June—September
Daylight
Daylight
Daylight
Daylight
Leach's Petrel June—September Daylight
Cormorant and Shag Mid April—early August Daylight
Arctic Skua Late May—early August Daylight
Great Skua Mid May—mid August Daylight
Gulls (Larus spp.) Mid May—early August
Kittiwake Late May—July
Daylight
Daylight
Terns Mid May—July Daylight
Guillemot June—July Daylight
Razorbill Mid May—mid July
Daylight
Black Guillemot May—July Daylight
Puffin May—July Daylight
THIS INFORMATION IS BASED ON THE FOLLOWING:
*Walsh, P.M., Halley, D.J., Harris, M.P., del Nevo, A., Sim, I.M.W., & Tasker, M.L. 1995. Seabird monitoring handbook for Britain and Ireland. Peterborough, JNCC/RSPB/ITE/Seabird Group.
The methods and count unit options per species and key for undertaking Colony Counts of seabirds in Britain and Ireland:
Species (BTO code)
Fulmar (F.)
Manx Shearwater (MX)
Storm Petrel (TM)
Leach’s Petrel (TL)
Gannet (GX)
Cormorant (CA)
Shag (SA)
Arctic Skua (AC)
Great Skua (NX)
Mediterranean Gull (MU)
Black-headed Gull (BH)
Lesser Black-backed Gull (LB)
Herring Gull (HG)
Great Black-backed Gull (GB)
Common Gull (CM)
Kittiwake (KI)
Arctic Tern (AE)
Common Tern (CN)
Little Tern (AF)
Sandwich Tern (TE)
Roseate Tern (RS)
Guillemot (GU)
Razorbill (RA)
Black Guillemot (TY)
Puffin (PU)
2.1: whole colony counts of AOB
2.2: sample quadrats/ transect counts of AOB
2.3: counts of individuals attending the colony
2.4: other (please provide details on methods used)
3.1: counts of AOT/AON from a vantage point
3.2: foot-based counts of AOT/AON from within colony
3.3: sample quadrats/ transect counts of AOT/AON
3.4: flush counts of individuals
3.5: aerial counts
4.1:
4.4: foot-based counts of AON from within colony
5.1: ascertained presence/absence of AOS
5.2: count of AOS using tape-playback
Survey method options:
1.1, 1.2 AOS
5.1, 5.2, 5.3 AOS
5.1, 5.2, 5.3 AOS
5.1, 5.2, 5.3 AOS
4.1, 4.2, 4.3, 4.4 AON, AOS
1.1, 1.2 AON
1.1, 1.2 AON
3.1, 3.2, 3.3, 3.4, 3.5 AOT
3.1, 3.2, 3.3, 3.4, 3.5 AOT
3.1, 3.2, 3.3, 3.4, 3.5 AON, AOT, IND
3.1, 3.2, 3.3, 3.4, 3.5 AON, AOT, IND
1.1, 1.2, 3.1, 3.2, 3.3, 3.4, 3.5 AON, AOT, IND
1.1, 1.2, 3.1, 3.2, 3.3, 3.4, 3.5 AON, AOT, IND
1.1, 1.2, 3.1, 3.2, 3.3, 3.4, 3.5 AON, AOT, IND
1.1, 1.2, 3.1, 3.2, 3.3, 3.4, 3.5 AON, AOT, IND
1.1, 1.2 AON, IND
3.1, 3.2, 3.3, 3.4, 3.5 AON, IND
3.1, 3.2, 3.3, 3.4, 3.5 AON, IND
3.1, 3.2, 3.3, 3.4, 3.5 AON, IND
3.1, 3.2, 3.3, 3.4, 3.5 AON, IND
3.1, 3.2, 3.3, 3.4, 3.5 AON, IND
1.1, 1.2 IND
1.1, 1.2 IND
1.1, 1.2 IND, SEA
1.1, 1.2, 2.1, 2.2, 2.3, 2.4 AOB, IND, SEA, AIR
The methods and count unit options per species and key for undertaking Breeding Success monitoring of seabirds in Britain and Ireland:
Survey method options:
Species (BTO code)
Fulmar (F.) 1.1, 1.2 AOS
Manx Shearwater (MX) 2.1, 2.2, 2.3, 2.4 AOS, AOB
Storm Petrel (TM) 2.2, 2.3, 2.4 AOS, AOB
Leach’s Petrel (TL) 2.2, 2.3, 2.4 AOS, AOB
Gannet (GX) 1.1, 3.1 AON, AOS
Cormorant (CA) 1.1, 3.1 AON
Shag (SA) 1.1, 3.1 AON
Arctic Skua (AC) 4.1, 4.2 AOT
Great Skua (NX) 4.1, 4.2 AOT
Mediterranean Gull (MU) 5.1, 5.2, 5.3, 5.4, 5.5 AOT, AON
Black-headed Gull (BH) 5.1, 5.2, 5.3, 5.4, 5.5 AOT, AON
Lesser Black-backed Gull (LB) 5.1, 5.2, 5.3, 5.4, 5.5 AOT, AON
Herring Gull (HG) 5.1, 5.2, 5.3, 5.4, 5.5 AOT, AON
Great Black-backed Gull (GB)
Common Gull (CM)
5.1, 5.2, 5.3, 5.4, 5.5 AOT, AON
5.1, 5.2, 5.3, 5.4, 5.5 AOT, AON
Kittiwake (KI) 1.1, 3.1 AON
Arctic Tern (AE) 5.1, 6.1, 6.2, 6.3, 6.4 AON
Common Tern (CN) 5.1, 6.1, 6.2, 6.3, 6.4 AON
Little Tern (AF)
5.1, 6.1, 6.2, 6.3, 6.4 AON
Sandwich Tern (TE) 5.1, 6.1, 6.2, 6.3, 6.4 AON
Roseate Tern (RS) 5.1, 6.1, 6.2, 6.3, 6.4 AON
Guillemot (GU) 1.1 AOS
Razorbill (RA) 7.1, 7.2, 7.3 AOS
Black Guillemot (TY) 8.1, 8.2 AOS
Puffin (PU) 9.1, 9.2, 9.3 AOB
Key
Apparently Occupied Burrow
Individual on land at colony
Individual on sea adjacent to colony
or more: Fresh breeze or stronger
Method
1.1: nest-sites mapped AON: Apparently Occupied Nest
1.2: repeated counts of AOS AOS: Apparently Occupied Site
2.1: burrow checking with stick/bamboo AOT: Apparently Occupied Territory
2.2: repeated visit to nest box AOB: Apparently Occupied Burrow
2.3: repeated visits – nest viewed with endoscope
2.4: repeated visits – nest viewed with naked eye Count/Fledged Accuracy
3.1: comparison of nest and chick counts ACC: Accurate Count
4.1: comparison of territory and chick counts EST: Estimate Count
4.2: territories mapped
5.1: assessing ratio of ringed to unringed fledglings
5.2: capture/recapture of large chicks
5.3: chick ringing totals
5.4: observations of mapped nests
5.5: use of enclosures or other confined plots
6.1: counts of apparently incubating adults, with multiple visits to mark/recapture chicks
6.2: flush-counts of adults, with single or multiple counts of large chicks
6.3: multiple visits at egg and chick stage, with mark/recapture counts of chicks
6.4: nest/incubating adult count, with single count of large chicks
7.1: open nest-sites viewable from a distance
7.2: enclosed but accessible nest-sites
7.3: enclosed but inaccessible nest-sites
8.1: accessible nest-sites
8.2: inaccessible nest-sites
9.1: mapped burrows plus observations from hide
9.2: staked burrows
9.3: staked burrows plus observations from hide
Other: other method
In text ref. Reference
Acampora et al. 2018
Alerstam et al. 2019
Acampora, H., Ní Dhonnabháin, L., Miley, D. & Newton, S. 2018. Rockabill Tern Report 2018. BirdWatch Ireland Seabird Conservation Report.
Alerstam, T., Bäckman, J., Grönroos, J., Olofsson, P. & Strandberg, R. 2019. Hypotheses and tracking results about the longest migration: The case of the arctic tern. Ecology and Evolution 9 : 9511—9531.
Alley et al. 2022 Alley, C.L., Arkless, S., Ames, E., Abrahams, M., Gentle, L.K. & Wood, M.J. 2022. Plastic ingestion in adult and fledgling Manx Shearwaters Puffinus puffinus on Skomer Island, Wales. Seabird Journal 34 : 33—44. Almeida et al. 2023 Almeida, A., Alonso, H., Oliveira, N., Silva, E. & Andrade, J. 2023. Using a visual deterrent to reduce seabird interactions with gillnets. Biological Conservation 285 : 110236—110236.
Álvarez et al. 2018 Álvarez, G., Barros, Á. & Velando, A. 2018. The use of European Shag pellets as indicators of microplastic fibers in the marine environment. Marine Pollution Bulletin 137 : 444—448. Amaral et al. 2010 Amaral, J.J., Almeida, S., Sequeira, M. & Neves, V.C. 2010. Black rat Rattus rattus eradication by trapping allows recovery of breeding roseate tern Sterna dougallii and common tern S.hirundo populations on Feno Islet, the Azores, Portugal. Conservation Evidence 7 : 16—20.
Anderson 1982 Anderson, A. 1982. The establishment and growth of a new Fulmar colony on sand dunes. Bird Study 23 189—194.
Anderson et al. 2014 Anderson, H.B., Evans, P.G.H., Potts, J.M., Harris, M.P. & Wanless, S. 2014. The diet of Common Guillemot Uria aalge chicks provides evidence of changing prey communities in the North Sea. Ibis 156 23—34.
Anderson et al. 2011 Anderson, O.R.J., Small, C.J., Croxall, J.P., Dunn, E.K., Sullivan, B.J., Yates, O. & Black, A. 2011. Global seabird bycatch in longline fisheries. Endangered Species Research 14 91—106.
APHA 2024 APHA (Animal and Plant Health Agency). 2024. Bird flu (avian influenza): cases in wild birds. Available at: https://www. gov.uk/government/publications/avian-influenza-in-wild-birds [Accessed 25/10/2024].
Araújo et al. 2022 Araújo, H., Correia-Rodrigues, P., Debru, P., Ferreira, M., Vingada, J. & Eira, C. 2022. Balearic shearwater and northern gannet bycatch risk assessment in Portuguese continental waters. Biological Conservation 267 109463. Ausden & Fuller 2009 Ausden, M. & Fuller, R.J. 2009. Birds and habitat change in Britain part 2: Past and future conservation responses. British Birds 102 : 52—71.
Avery et al. 1995 Avery, M.I., Coulthard, N.D., Del Nevo, A.J., LeRoux, A., Medeiros, F., Merne, O., Monteiro, L., Moralee, A., NtiamoaBaidu, Y., O'Briain, M. & Wallace, E. 1995. A recovery plan for Roseate Terns in the East Atlantic: an international programme. Bird Conservation International 5 : 441—453. Baak et al. 2021 Baak, J.E., Leonard, M.L., Gjerdrum, C., Dodds, M.D. and Ronconi, R.A. 2021. Non-breeding movements and foraging ecology of the Black Guillemot Cepphus grylle in Atlantic Canada. Marine Ornithology 49 : 57—70. Bailey 1991 Bailey, R.S. 1991. Recent changes in the population of the sandeel (Ammodytes marinus Raitt) at Shetland in relation to estimates of seabird predation. ICES Marine Science Symposium 193 : 209—216. Balmer et al. 2013 Balmer, D.E., Gillings, S., Caffrey, B., Swann, B., Downie, I. & Fuller, R. 2013. Bird Atlas 2007 11: The Breeding and Wintering Birds of Britain and Ireland. British Trust for Ornithology, Thetford. Banyard et al. 2022 Banyard, A.C., Lean, F.Z., Robinson, C., Howie, F., Tyler, G., Nisbet, C., Seekings, J., Meyer, S., Whittard, E., Ashpitel, H.F. & Bas, M. 2022. Detection of Highly Pathogenic Avian Influenza Virus H5N1 Clade 2.3.4.4b in Great Skuas: A Species of Conservation Concern in Great Britain. Viruses 14 : 212. Barcelona et al. 2010 Barcelona, S.G., Ortiz de Urbina, J.M., de la Serna, J.M., Alot, E. & Macías, D. 2010. Seabird bycatch in Spanish Mediterranean large pelagic longline fisheries, 2000—2008. Aquatic Living Resources 23 363—371. Barrett 2015 Barrett, R.T. 2015. The diet, growth and survival of Razorbill Alca torda chicks in the southern Barents Sea. Ornis Norvegica 38 25—31. Bicknell et al. 2013 Bicknell, A.W.J., Oro, D., Camphuysen, J.C. & Votier, S.C. 2013. Potential consequences of discard reform for seabird communities. Journal of Applied Ecology 50 : 649—658.
Biliavskiy & Golod 2012 Biliavskiy, G. & Golod, A. 2012. Oil pollution of the Black Sea. Proceedings of the National Aviation University 51 92—95. Billerman et al. 2020 S.M. Billerman., B.K. Keeney., P.G. Rodewald, & T.S. Schulenberg (eds). 2022. Birds of the World. Cornell Laboratory of Ornithology, Ithaca, NY, USA. Available at: https://birdsoftheworld.org/bow/home [Accessed: 25/10/2024]
BirdLife International 2015 BirdLife International. 2015. European Red List of Birds 2015. Office for Official Publications of the European Communities, Luxembourg. Available at: https://www.iucnredlist.org/resources/birdlife2015#:~:text=2015,16%20 Endangered%20and%2055%20Vulnerable [Accessed: 25/10/2024].
BirdLife International 2024 BirdLife International. 2024. IUCN Red List for birds. Available at: https://datazone.birdlife.org/species/search [Accessed: 25/10/2024].
BirdLife International 2000 BirdLife International. 2000. The Development of Boundary Selection Criteria for the Extension of Breeding Seabird Special Protection Areas into the Marine Environment. OSPAR Convention for the Protection of the Marine Environment of the North-East Atlantic. Meeting of the Biodiversity Committee (BDC) Vlissingen (Flushing), 20—24 November, 2000, Agenda Item 8.
Blokpoel et al. 1997 Blokpoel, H., Tessier, G.D. & Andress R.A. (Bud). 1997. Successful Restoration of the Ice Island Common Tern Colony Requires On-going Control of Ring-billed Gulls. Colonial Waterbirds 20 : 98—101. Boag & Alexander 1995 Boag, D and Alexander, M. 1995. The Puffin. Blandford Press. London. Bogdanova et al. 2011 Bogdanova, M.I., Francis, F., Newell, M., Phillips, R.A., Harris, M.P. & Wanless S. 2011. Seasonal interactions in the blacklegged kittiwake, Rissa tridactyla: links between breeding performance and winter distribution. Proceedings of the Royal Society B 278 : 2412—2418.
In text ref. Reference
Bolton 2021 Bolton, M. 2021. GPS tracking reveals highly consistent use of restricted foraging areas by European Storm-petrels Hydrobates pelagicus breeding at the largest UK colony: implications for conservation management. Bird Conservation International 31 35—52.
Bolton et al 2010 Bolton, M., Brown, J.G., Moncrieff, H., Ratcliffe, N. & Okill, J.D. 2010. Playback re-survey and demographic modelling indicate a substantial increase in breeding European Storm-petrels Hydrobates pelagicus at the largest UK colony, Mousa, Shetland. Seabird Journal 23 14—24.
Bond et al. 2023 Bond, A.L., Wilhelm, S.I., Pirie-Hay, D.W., Robertson, G.J., Pollet, I.L. & Arany, J.L. 2023. Quantifying gull predation in a declining Leach’s Storm-petrel (Hydrobates leucorhous) colony. Avian Conservation and Ecology 18 Bonesi & Palazon 2007 Bonesi, L. & Palazon, S. 2007. The American Mink in Europe: status, impacts, and control. Biological Conservation 134 470—483.
Brooke 1990 Brooke, M. 1990. The Manx Sherwater. T. and A.D. Poyser, London.
Booth Jones 2020 Booth Jones, K. 2020. The Northern Ireland Seabird Report 2019. British Trust for Ornithology, Thetford. Booth Jones & Wolsey 2017 Booth Jones, K & Wolsey, S. 2017. Northern Ireland Seabird Report 2016. British Trust for Ornithology. Thetford. Booth Jones et al. 2022 Booth Jones, K., Thaxter, C., Clewley, G., Wolsey, S., Calbrade, N., Atkinson, P., Calladine, J. & Burton, N. 2022. Belfast’s urban gulls: an assessment of breeding populations, breeding season movements and winter population BTO Research Report 734. British Trust for Ornithology, Thetford.
Booth & Morrison 2010 Booth V. & Morrison P. 2010. Effectiveness of disturbance methods and egg removal to deter large gulls Larus spp. from competing with nesting terns Sterna spp. on Coquet Island RSPB reserve, Northumberland, England. Conservation Evidence 7 39—43.
Bradbury et al. 2014 Bradbury, G., Trinder, M., Furness, B., Banks, A.N., Caldow, R.W.G. & Hume, D. 2014. Mapping Seabird Sensitivity to Offshore wind farms. PLoS ONE 9 : e106366.
Bregnballe et al. 2014 Bregnballe, T., Lynch, J., Parz-Gollner, R., Marion, L., Volponi, S., Paquet, J.-Y., David N. Carss & van Eerden, M.R. (eds.) 2014. Breeding numbers of Great Cormorants Phalacrocorax carbo in the Western Palearctic, 2012—2013. IUCNWetlands International Cormorant Research Group Report, Danish Centre for Environment and Energy No. 99 224 Available at: http://dce2.au.dk/pub/SR99.pdf [Accessed 25/10/2024].
Bregnballe & Frederiksen 2006 Bregnballe, T. & Frederiksen, M. 2006, Net-entrapment of great cormorants Phalacrocorax carbo sinensis in relation to individual age and population size. Wildlife Biology 12 : 143—150.
Bried et al. 2009 Bried, J., Magalhães, M.C., Bolton, M., Neves, V.C., Bell, E., Pereira, J.C., Aguiar, L., Monteiro, L.R. & Santos, R.S. 2009. Seabird habitat restoration on Praia Islet, Azores Archipelago. Ecological Restoration 27 : 27—36.
Brochet et al. 2017 Brochet, A.-L., Van den Bossche, W., Jones, V. R., Arnardottir, H., Damoc, D., Demko, M., Driessens, G., Flensted, K., Gerber, M., Ghasabyan, M., Gradinarov, D., Hansen, J., Horvath, M., Karlonas, M., Krogulec, J., Kuzmenko, T., Lachman, L., Lehtiniemi, T., Lorgé, P., Lotberg, U., Lusby, J., Ottens, G., Paquet, J.-Y., Rukhaia, A., Schmidt, M., Shimmings, P., Stipnieks, A., Sultanov, E., Vermouzek, Z., Vintchevski, A., Volke, V., Willi, G. & Butchart, S.H.M. 2019. Illegal killing and taking of birds in Europe outside the Mediterranean: assessing the scope and scale of a complex issue. Bird Conservation International, 29 10—40.
Brown et al. 2011 Brown, A., Price, D., Slader, P., Booker, H., Lock, L. & Deveney, D. 2011. Seabirds on Lundy: their current status, recent history and prospects for the restoration of a once important bird area. British Birds 104 : 139—158.
BTO 2023a BTO 2023 BirdFacts Available at: www.bto.org/understanding-birds/birdfacts [Accessed: 25/10/2023].
BTO 2023b BTO 2023. Online Ringing and Nest Recording Report. BTO, Thetford. Available at: www.bto.org/our-science/projects/birdringing-scheme/ringing-publications/online-ringing-and-nest-recording [Accessed: 01/09/2024].
Buckley 1990 Buckley, N.J. 1990. Diet and feeding ecology of great black-backed gulls (Laws marinus) at a southern Irish breeding colony. Journal of Zoology 222 363—373.
Buckingham et al. 2022 Buckingham, L., Heward, C., Carter, A., Dixon, T., Micklewright, S., Stace, H. & Ward, R. 2022. Treshnish Isles Auk Ringing Report 2022. Cambridgeshire.
Bull et al. 2004 Bull, J., Wanless, S., Elston, D., Daunt, F., Lewis, S. & Harris, M. 2004. Local-scale variability in the diet of Black-legged Kittiwakes Rissa tridactyla Ardea 92 43—52.
Burg et al. 2003 Burg, T. M., Lomax. J., Almond, R., Brooke, M.D.L. & Amos, W. 2003. Unravelling dispersal patterns in an expanding population of a highly mobile seabird, the northern fulmar (Fulmarus glacialis). Proceedings of the Royal Society of London Series B: Biological Sciences 270 979—984.
Burger et al. 2020 Burger, J., Gochfeld, M. & Garcia. E.F.J. 2020. Mediterranean Gull (Ichthyaetus melanocephalus), version 1.0. In: del Hoyo, J., Elliott, A., Sargatal, J., Christie, D.A. & de Juana, E. (eds). 2020. Cornell Lab of Ornithology, Ithaca, NY, USA. Available at: https://doi.org/10.2173/bow.medgul1.01 [Accessed: 25/10/2024].
Burger et al. 2018 Burger, J., Gochfeld, M., Kirwan, G.M., Christie, D.A. & de Juana, E. 2018. Lesser Black-backed Gull (Larus fuscus). In: del Hoyo, J., Elliott, A., Sargatal, J., Christie, D.A. & de Juana, E. (eds). 2018. Handbook of the Birds of the World Alive, Lynx Edicions, Barcelona.
Burger et al. 2016 Burger, J., Gochfeld, M., Kirwan, G.M., Christie, D.A. & Garcia, E.F.J. 2016. Black-legged Kittiwake (Rissa tridactyla). In: del Hoyo, J., Elliott, A., Sargatal, J., Christie, D.A. & de Juana, E. (eds). 2016. Handbook of the Birds of the World Alive Lynx Edicions, Barcelona.
Burgess & Hirons 1992 Burgess, N.D., & Hirons, J.M. 1992. Creation and management of articficial nesting sites for wetland birds. Journal of Environmental Management 34 : 285—295.
Burgess & Morris 1992 Burgess, G.P. & Morris, R.D. 1992. Shelters decrease gull predation on chicks at a Common Tern colony. Journal of Field Ornithology 63 186—189.
Burger & Simpson 1986 Burger, A.E. & Simpson, M. 1986. Diving depths of Atlantic puffins and common murres. Auk 103 828—830.
Burke et al. 2022 Burke, B., O'Connell, D. P., Kinchin-Smith, D., Sealy, S., & Newton, S. F. 2022. Nest boxes augment seabird breeding performance in a high-density colony: Insight from 15 years of monitoring data. Ecological Solutions and Evidence 3 e12171
Burnell et al. 2023 Burnell, D., Perkins, A.J., Newton, S.F., Bolton, M., Tierney, T.D., Dunn, T.E. (eds) 2023. Seabirds Count: a census of breeding seabirds in Britain and Ireland (2015 2021) Lynx Nature Book, Barcelona.
In text ref. Reference
Burthe et al. 2014 Burthe, S., Wanless, S., Newell, M., Butler, A. & Daunt, F. 2014. Assessing the vulnerability of the marine bird community in the western North Sea to climate change and other anthropogenic impacts. Marine Ecology Progress Series 507 : 277—295.
Bustnes 2006 Bustnes, J.O. 2006. Environmental pollutants in endangered vs. increasing subspecies of the lesser black-backed gull on the Norwegian Coast. Environmental Pollution 144 893—901.
Byrne et al. 2023 Byrne, A.M., James, J., Mollett, B.C., Meyer, S.M., Lewis, T., Czepiel, M., Seekings, A.H., Mahmood, S., Thomas, S.S., Ross, C.S. & Byrne, D.J. 2023. Investigating the Genetic Diversity of H5 Avian Influenza Viruses in the United Kingdom from 2020—2022. Microbiology Spectrum e04776—22.
Cadiou et al. 2010 Cadiou, B., Bioret, F., & Chenesseau, D. 2010. Response of breeding European Storm Petrels to habitat change. Journal of Ornithology 151 : 317—327.
Cairns 1987 Cairns, D.K. 1987. The Ecology and Energetics of Chick Provisioning by Black Guillemots. The Condor 89 : 627—635. Calladine 1997 Calladine, J. 1997. A comparison of Herring Gull Larus argentatus and Lesser Black-backed Gull Larus fuscus nest sites: their characteristics and relationships with breeding success. Bird Study 44 318—326. Camphuysen et al. 2022 Camphuysen, C.J., Gear, S.C. & Furness, R.W. 2022. Avian influenza leads to mass mortality of adult Great Skuas in Foula in summer 2022. Scottish Birds 42 312—323.
Carboneras et al. 2014 Carboneras, C., Jutglar, F. & Kirwan, G.M. 2014. Manx Shearwater (Puffinus puffinus). In: del Hoyo, J., Elliott, A., Sargatal, J., Christie, D.A. & de Juana, E. (eds). 2014. Handbook of the Birds of the World Alive, Lynx Edicions, Barcelona. Casey et al. 1995 Casey, S., Moore, N., Ryan, L., Merne, O.J., Coveney, J.A & del Nevo, A. 1995. The Roseate Tern conservation project on Rockabill, Co. Dublin: a six year review 1989—1994. Irish Birds 5 251—264.
Chapdelaine et al. 1987 Chapdelaine. G., Laporte, P. & Nettleship, D. N. 1987. Population, productivity and DDT contamination trends of Northern Gannets (Sula bassanus) at Bonaventure Island, Quebec, 1967—1984. Canadian Journal of Zoology 65 : 2922—2926.
Chivers et al. 2012 Chivers, L. S., Lundy, M.G., Colhoun, K., Newton, S. F., & Reid, N. 2012. Diet of Black-legged Kittiwakes (Rissa tridactyla) feeding chicks at two Irish colonies highlights the importance of clupeids. Bird Study 59 363—367.
Christensen-Dalsgaard et al. 2018 Christensen-Dalsgaard, S., May, R.F., Barrett, R.T., Langset, M., Sandercock, B.K. & Lorentsen, S.H. 2018. Prevailing weather conditions and diet composition affect chick growth and survival in the black-legged kittiwake. Marine Ecology Progress Series 604 237—249.
Christensen-Dalsgaard et al. 2022 Christensen-Dalsgaard, S., Ytrehus, B., Langset, M., Wiig, J.R. & Bærum, K.M. 2022. Seabird beachcast events associated with bycatch in the Norwegian purse seine fishery. Marine Environmental Research 177 105625. Church et al. 2018 Church, C.E., Furness, R.W., Tyler, G., Gilbert, L. & Votier, S.C. 2018. Change in the North Sea ecosystem from the 1970s to the 2010s: great skua diets reflect changing forage fish, seabirds, and fisheries. ICES Journal of Marine Science 76 : 925—937
Clairbaux et al. 2021 Clairbaux, M., Mathewson, P., Porter, W., Fort, J., Strøm, H., Moe, B., Fauchald, P., Descamps, S., Helgason, H., Bråthen, V., Merkel, B., Anker-Nilssen, T., Bringsvor, I., Chastel, O., Christensen-Dalsgaard, S., Danielsen, J., Daunt, F., Dehnhard, N., Erikstad, K. & Grémillet, D. 2021. North Atlantic winter cyclones starve seabirds. Current Biology 31 3964—3971.
Clewley et al. 2021 Clewley, G.D., Barber, L.J., Conway, G.J., Clark, N.A., Donato, B.J., Thaxter, C.B. & Burton, N.H.K. 2021. Foraging habitat selection by breeding Herring Gulls (Larus argentatus) from a declining coastal colony in the United Kingdom. Estuarine, Coastal and Shelf Science 261 : 107564. Collard et al. 2022 Collard, F., Bangjord, G., Herzke, D. & Gabrielsen, G.W. 2022. Plastic burdens in northern fulmars from Svalbard: Looking back 25 years. Marine Pollution Bulletin 185 114333. Collins et al. 2022 Collins, S.M., Hedd, A., Fifield, D.A., Wilson, D.R. & Montevecchi, W.A. 2022. Foraging paths of breeding Leach’s StormPetrels in relation to offshore oil platforms, breeding stage, and year. Frontiers in Marine Science 9 816659. Cook-Haley & Millenbah 2002 Cook-Haley, B.S. & Millenbah, B.F. 2002. Impacts of vegetative manipulations on common tern nest success at Lime Island, Michagan. Journal of Field Ornithology 73 : 174—179. Cook & Robinson 2010 Cook, A.S.C.P & Robinson, R.A. 2010. How representative is the current monitoring of breeding seabirds in the UK? BTO Research Report No. 573, British Trust for Ornithology, Thetford. Cordes et al. 2015 Cordes, L.S., Hedworth, H.E., Cabot, D., Cassidy, M. & Thompson, P.M. 2015. Parallel declines in survival of adult Northern Fulmars Fulmarus glacialis at colonies in Scotland and Ireland. Ibis 157 : 631—636. Costa et al. 2018 Costa, R.A., Pereira, A.T., Costa, E., Henriques, A.C., Miodonski, J., Ferreira, M., Vingada, J.V. & Eira, C. 2019. Razorbill Alca torda mortality in the Portuguese west coast. European Journal of Wildlife Research 65 : 1—7. Coulson 2019 Coulson, J.C. 2019. Gulls. Harper Collins Publisher, London. Coulson 2015 Coulson, J.C. 2015. Re-Evaluation of the Role of Landfills and Culling in the Historic Changes in the Herring Gull (Larus argentatus) Population in Great Britain. Waterbirds 38 339—354. Coulson 2011 Coulson, J.C. 2011. The Kittiwake. T. and A.D. Poyser, London. CMS FAO 2023 CMS FAO Co-convened Scientific Task Force on Avian Influenza and Wild Birds. 2023. Scientific Task Force on Avian Influenza and Wild Birds statement on H5N1 high pathogenicity avian influenza in wild birds - Unprecedented conservation impacts and urgent needs. Available at: https://www.cms.int/en/workinggroup/scientific-task-force-avian-influenza-andwild-birds [Accessed: 25/10/2024].
Craik 1995 Craik, J.C.A. 1995. Effects of North American Mink Mustela vison on the breeding success of terns and smaller gulls in west Scotland. Seabird Journal 17 : 3—11.
In text ref. Reference
Craik 1997 Craik, J.C.A. 1997. Long-term effects of North American Mink Mustela vison on seabirds in western Scotland. Bird Study 44 303—309.
Craik 2015 Craik, J.C.A. 2015. Results of the mink-seabird project in 2014. Unpublished. Scottish Association for Marine Science Report, Oban.
Cramp 1985
Cramp, S. (ed.) 1985. Handbook of the birds of Europe, the Middle East and North Africa: the Bird of the Western Palearctic. Volumne 3: Waders to Gulls. Oxford University Press, Oxford.
Crespin et al. 2006 Crespin, L., Harris, M., Lebreton, J-D. & Wanless, S. 2006. Increased adult mortality and reduced breeding success with age in a population of Common Guillemot Uria aalge using marked birds of unknown age. Journal of Avian Biology 37 273—282.
Croxall & Rothery 1991
Cuthbert et al. 2003
Croxall, J.P. & Rothery, P. 1991. Population regulation of seabirds: implication of their demography for conservation. In: Perrins, C.M., Lebreton, J-.D. & Hirons, G.J.M. (eds). 1991. Bird Population Studies: Relevance To Conservation And Management. Oxford University Press.
Cuthbert, F., Wires, L & Timmerman, K. 2003. Status assessment and conservation recommendations for the Common Tern sterna hirundo in the Great Lakes region. U.S. Department of the Interior, Fish and Wildlife Service, Ft. Snelling, Minnesota, USA.
d’Entremont et al. 2022 d'Entremont, K.J., Guzzwell, L.M., Wilhelm, S.I., Friesen, V.L., Davoren, G.K., Walsh, C.J. & Montevecchi, W.A. 2022. Northern Gannets (Morus bassanus) breeding at their southern limit struggle with prey shortages as a result of warming waters. ICES Journal of Marine Science 79 50—60.
Dalrymple 2023 Dalrymple, S.A. 2023. Predator exclusion fencing improves productivity at a mixed colony of Herring Gulls Larus argentatus Lesser Black-backed Gulls L. fuscus and Great Black-backed Gulls L. marinus Seabird Journal 35 18—29.
Daly et al. 2020 Daly, D., Daly, L. & Murray, M. 2020. Lady’s Island Lake Tern Report 2019. Department of Culture, Heritage and the Gaeltacht, Dublin.
Daly et al. 2016 Daly, D., Murphy, B. & Murray, T. 2016. Lady’s Island Lake Tern Report 2016 Department of Arts, Heritage, Regional, Rural and Gaeltacht Affairs. Available at: https://www.npws.ie/sites/default/files/publications/pdf/Lady%27s%20Island%20 Tern%20Report%202016_0.pdf [Accessed 25/10/2024].
Darby et al. 2021 Darby, J.H., De Grissac, S., Arneill, G.E., Pirotta, E., Waggitt, J.J., Börger, L., Shepard, E., Cabot, D., Owen, E., Bolton, M. & Edwards, E.W.J. 2021. Foraging distribution of breeding northern fulmars is predicted by commercial fisheries. Marine Ecology Progress Series 679 : 181—194
Daunt & Mitchell 2013 Daunt, F. & Mitchell, I. 2013. Impacts of climate change on seabirds Marine Climate Change Impacts Partnership: Science Review 125—133.
Daunt et al. 2002 Daunt, F., Benvenuti, S., Harris, M., Dall'Antonia, L., Elston, D.A. & Wanless, S. 2002. Foraging strategies of the Black-legged Kittiwake Rissa tridactyla at a North Sea colony: evidence for a maximum foraging range. Marine Ecology Progress Series 245 : 239—247.
Daunt et al. 2008 Daunt, F., Wanless, S., Greenstreet, S.P.R., Jensen, H., Hamer, K.C. & Harris, M.P. 2008. The impact of the sandeel fishery closure in the north-western North Sea on seabird food consumption, distribution and productivity. Canadian Journal of Fish Aquatic Science 65 362—381.
Davies et al. 2021 Davies, J.G., Humphreys, E.M. & Pearce-Higgins, J.W. 2021. Project future vulnerability of seabirds within the INTERREG VA area to climate change. British Trust for Ornithology Report to Agri-Food and Biosciences Institute and Marine Scotland Science. British Trust for Ornithology, Thetford.
Davis et al. 2018 Davis, S., Brown, A., Lock, L., Sharps, E., Bolton, M. & Wilson, L. 2018. Productivity of Herring Gulls Larus argentatus and Lesser Black-backed Gulls L. fuscus in relation to fox predation risk at colonies across northern England and Wales in 2012. RSPB Centre for Conservation Science, Bedfordshire.
Dawson et al. 2011 Dawson, N.M., Macleod, C.D., Smith, M. & Ratcliffe, N. 2011. Interactions with Great Skuas Stercorarius skua as a factor in the long-term decline of an Arctic Skua Stercorarius parasiticus population. Ibis 153 143—153. de León et al. 2006 de León, A., Mínguez, E., Harvey, P., Meek, E., Crane, J.E. & Furness, R.W. 2006. Factors affecting breeding distribution of Storm-petrels Hydrobates pelagicus in Orkney and Shetland. Bird Study 53 64—72.
Deakin et al. 2018 Deakin, Z., Gilbert, L., Prior, G. & Bolton, M. 2019. Assessment of Great Skua Stercorarius skua pellet composition to inform estimates of storm petrel consumption from bioenergetics models. Seabird Journal 31 36—48.
Deakin et al. 2021 Deakin, Z., Hansen, E., Luxmoore, R., Thomas, R., Wood, M., Padget, O,. Medeiros, R., Aitchison, R., Ausden, M., Barnard, R., Booth, V., Hansen, B., Hansen, E., Hey, J., Hilmarsson, J., Hoyer, P., Kirby, W., Luxmoore, A., Mcdevitt, A. & Bolton, M. 2022. Decline of Leach's Storm Petrels Hydrobates leucorhous at the largest colonies in the northeast Atlantic. Seabird Journal 33 : 74—106.
Deakin et al. 2022
Deakin, Z., Cook, A., Daunt, F., McCluskie, A., Morley, N., Witcutt, E., Wright, L. & Bolton, M. 2022. A review to inform the assessment of the risk of collision and displacement in petrels and shearwaters from offshore wind developments in Scotland. Scottish Government Report.
Defra 2023 Defra (Department for Environment Food and Rural Affairs). 2023. Wild bird populations in the UK, 1970 to 2022. Department for Environment Food and Rural Affairs. Available at: https://www.gov.uk/government/statistics/wild-birdpopulations-in-the-uk/wild-bird-populations-in-the-uk-1970-to-2021#introduction [Accessed: 13/06/2024]
Dehnhard et al. 2023 Dehnhard, N., Anker-Nilssen, T., Johnston, D., Masden, E.A., Lorentsen, S.H. & Christensen-Dalsgaard, S. 2023. Foraging behaviour of black guillemots at three Norwegian sites during the breeding season. Marine Biology 170 1—18.
del Hoyo et al. 1992 del Hoyo, J., Elliot, A. & Sargatal, J. 1992. Handbook of the Birds of the World, Vol. 1: Ostrich to Ducks. Lynx Edicions, Barcelona, Spain.
del Hoyo et al. 1996 del Hoyo, J., Elliott, A. & Sargatal, J. 1996. Handbook of the Birds of the World, vol. 3: Hoatzin to Auks. Lynx Edicions, Barcelona, Spain.
del Hoyo et al. 2018 del Hoyo, J., Elliott, A., Sargatal, J., Christie, D.A. & de Juana, E. 2018. Handbook of the Birds of the World Alive. Lynx Editions. Barcelona. Available at: https://www.hbw.com/node/54016. [Accessed: 25/10/2024].
d’Entremont et al. 2020 d’Entremont, K.J.N., Zitske, L.M., Gladwell, A.J., Elliott, N.K., Mauck, R.A. & Ronconi, R.A. 2020. Breeding population decline and associations with nest site use of Leach’s Storm-Petrels on Kent Island, New Brunswick from 2001 to 2018. Avian Conservation and Ecology 15 11.
In text ref. Reference
Dias et al. 2019
Dias, M.P., Martin, R., Pearmain, E.J., Burfield, I.J., Small, C., Phillips, R.A., Yates, O., Lascelles, B., Borboroglu, P.G. & Croxall, J.P. 2019. Threats to seabirds: a global assessment. Biological Conservation 237 525—537. Dierschke et al. 2016 Dierschke, V., Furness, R.W. & Garthe, S. 2016. Seabirds and offshore wind farms in European waters: Avoidance and attraction. Biological Conservation 202 59—68.
Donehower et al. 2007 Donehower, C.E., Bird, D.M., Hall, C.S. & Kress, S.W. 2007. Effects of gull predation and predator control on tern nesting success at Eastern Egg Rock, Maine. Waterbirds 30 29—39.
Drewitt & Langston 2006 Drewitt, A.L. & Langston, R.H.W. 2006. Assessing the impacts of wind farms on birds. Ibis 148 29—42. Drury 1973 Drury, W.H. 1973. Population changes in New England seabirds. Bird Banding 44 267—313. Dunlop et al. 1991 Dunlop, C.L., Blokpoel, H. & Jarvie, S. 1991. Nesting rafts as a management tool for a declining Common Tern (Sterna hirundo) colony. Colonial Waterbirds 14 : 116—120.
Durinck et al. 1994 Durinck, J., Skov, H., Jensen, F.P. & Pihl, S. 1994. Important Marine Areas for Wintering Birds in the Baltic Sea. Colonial Waterbirds 19 157.
Eaton et al. 2023 Eaton, M. & the Rare Breeding Birds Panel. 2023. Rare breeding birds in the UK in 2021. British Birds 116 : 609—684. Eaton et al. 2021 Eaton, M. & the Rare Breeding Birds Panel. 2021. Rare breeding birds in the UK in 2019. British Birds 114 : 646—704. EFSA et al. 2022 EFSA (European Food Safety Authority), ECDC (European Centre for Disease Prevention and Control), EURL (European Reference Laboratory for Avian Influenza). Adlhoch, C., Fusaro, A., Gonzales, J.L., Kuiken, T., Marangon, S., Niqueux, É., Staubach, C., Terregino, C., Guajardo, I.M., Chuzhakina K. & Baldinelli F. 2022. Avian influenza overview June—September 2022. EFSA Journal, 20 e07597.
EFSA et al. 2023 EFSA (European Food Safety Authority), ECDC (European Centre for Disease Prevention and Control), EURL (European Reference Laboratory for Avian Influenza). Adlhoch, C., Fusaro, A., Gonzales, J.L., Kuiken, T., Mirinaviciute, G., Niqueux, É., Stahl, K., Staubach, C., Terregino, C., Broglia, A., Kohnle, L. & Baldinelli, F. 2023. Scientific report: Avian influenza overview March—April 2023. EFSA Journal 21 e08039.
EJF 2020 EJF (Environmental Justice Foundation). 2020. The people’s fishery on the brink of collapse. Small pelagics in landings of Ghana's industrial trawl fleet. Environmental Justice Foundation, London. Available at: https://ejfoundation.org/ resources/downloads/EJF-report-small-pelagics-2020-final.pdf [Accessed: 25/10/2024].
Erikstad et al. 2013 Erikstad, K.E., Reiertsen, T.K., Barrett, R.T., Vikebø, F. & Sandvik, H. 2013. Seabird fish interactions: the fall and rise of a common guillemot Uria aalge population. Marine Ecology Progress Series 475 267—276.
Esmonde et al. 2022 Esmonde, N.P., Hanna, R.E., Patel, J.G., Smyth, V.J., Caplat, P., Smyth, W., Jaggers, P., Padget, O., Guilford, T., Perrins, C. & Reid, N. 2022. Case Report of Puffinosis in a Manx Shearwater (Puffinus puffinus) Suggesting Environmental Aetiology. Animals 12 3457.
2009/147/EC European Union, Directive 2009/147/EC 2009. Directive of the European Parliament and the Council on the conservation of wild birds Official Journal of the European Communities L20: 7—25. Evans et al. 2009 Evans, R., Wilson, J.D., Amar, A., Douse, A., MacLennan, A., Ratcliffe, N. & Whitfield, D.P. 2009. Growth and demography of a re-introduced population of White-tailed Eagles Haliaeetus albicilla Ibis 151 : 244—254.
Ewins 1985 Ewins, P.J. 1985. Growth, diet and mortality of Arctic tern Sterna paradisaea chicks in Shetland. Seabird Journal 8 : 59—68.
Ewins 1990 Ewins, P.J. 1990. The diet of Black Guillemots Cepphus grylle in Shetland. Holarctic Ecology 13 90—97. Falchieri et al. 2022 Falchieri, M., Reid, S.M., Ross, C.S., James, J., Byrne, A.M., Zamfir, M., Brown, I.H., Banyard, A.C., Tyler, G., Philip, E. & Miles, W. 2022. Shift in HPAI infection dynamics causes significant losses in seabird populations across Great Britain. Veterinary Record 191 294—296.
Fasola & Canova 1996 Fasola, M., Canova, L. 1996. Conservation of gull and tern colony sites in north-eastern Italy, an internationally important bird area. Colonial Waterbirds, 19 59-67. Fayet et al. 2021 Fayet, A.L., Clucas, G.V., Anker-Nilssen, T., Syposz, M. & Hansen, E.S. 2021. Local prey shortages drive foraging costs and breeding success in a declining seabird, the Atlantic puffin. Journal of Animal Ecology 90 : 1152—1164. Fayet et al. 2020 Fayet, A.L., Shannon, P., Lyons, D.E. & Kress, S.W. 2020. Manx shearwaters Puffinus puffinus breeding in the western Atlantic follow a different migration route from their eastern Atlantic conspecifics. Marine Ornithology 48 : 179—183 Fayet et al. 2017 Fayet, A.L., Freeman, R., Anker-Nilssen, T., Diamond, A., Erikstad, K.E., Fifield, D., Fitzsimmons, M.G., Hansen, E.S., Harris, M.P., Jessopp, M., Kouwenberg, A.L., Kress, S., Mowat, S., Perrins, C.M., Petersen, A., Petersen, I.K., Reiertsen, T.K., Robertson, G.J., Shannon, P., Sigurðsson, I.A., Shoji, A., Wanless, S. & Guilford, T. 2017. Ocean-wide drivers of migration strategies and their influence on population breeding performance in a declining seabird. Currrent Biology 27 3871—3878.
Field et al. 2012 Field, C.B., Barros, V., Stocker, T.F. & Dahe, Q. (eds.) 2012. Managing the Risks of Extreme Events and Disasters to Advance Climate Change Adaptation: Special Report of the Intergovernmental Panel on Climate Change. Cambridge University Press, Cambridge. Fisher 1952 Fisher, J. 1952. The Northern Fulmar. Collins, London. Finney et al. 2001 Finney, S., Wanless, S., Harris, M. & Monaghan, P. 2001. The impact of gulls on puffin reproductive performance: An experimental test of two management strategies. Biological Conservation 98 : 159—165. Flint et al. 1984 Flint, V.E., Boehme, R.L., Kostin, Y.V., Kuznetsov, A.A. 1984. A field guide to birds of the USSR. Princeton University Press, Princeton, New Jersey.
Foster et al. 2017 Foster, S., Swann, R.L. & Furness, R.W. 2017. Can changes in fishery landings explain long-term population trends in gulls? Bird Study 64 : 90–97.
In text ref. Reference Frederiksen et al. 2012 Frederiksen, M., Moe, B., Daunt, F., Phillips, R.A., Barrett, R.T., Bogdanova, M.I., Boulinier, T., Chardine, J.W., Chastel, O., Chivers, L.S., Christensen-Dalsgaard, S., Clément-Chastel, C., Colhoun, K., Freeman, R., Gaston, A.J., GonzálezSolís, J., Goutte, A., Grémillet, D., Guilford, T., Jensen, G.H., Krasnov, Y., Lorentsen, S.-H., Mallory, M.L., Newell, M., Olsen, B., Shaw, D., Steen, H., Strøm, H., Systad, G.H., Thórarinsson, T.L. & Anker-Nilssen, T. 2012. Multi-colony tracking reveals the winter distribution of a pelagic seabird on an ocean basin scale. Diversity and Distributions 18 530—542.
Frederiksen et al. 2007 Frederiksen, M., Edwards, M., Mavor, R.A. & Wanless, S. 2007. Regional and annual variation in black-legged kittiwake breeding productivity is related to sea surface temperature. Marine Ecology Progress Series 350 : 137—143.
Frederiksen et al. 2005 Frederiksen, M., Wright, P.J., Harris, M.P., Mavor, R.A., Heubeck, M. & Wanless, S. 2005. Regional Patterns of Kittiwake Rissa Tridactyla Breeding Success Are Related to Variability in Sandeel Recruitment. Marine Ecology Progress Series 300 : 201—11.
Frederiksen et al. 2004 Frederiksen, M., Wanless, S., Harris, M. P., Rothery, P. & Wilson, L.J. 2004. The role of industrial fisheries and oceanographic change in the decline of North Sea black-legged kittiwakes. Journal of Applied Ecology 41 : 1129—1139.
Furness 1982 Furness, R.W. 1982. Population, breeding biology and diets of seabirds on Foula in 1980. Seabird Report 1977—1981. The Seabird Group.
Furness 1987 Furness, R.W. 1987. The Skuas. T. and A.D. Poyser, Calton.
Furness et al. 1992 Furness, R.W., Ensor, K. & Hudson, A.V. 1992. The use of fishery waste by gull populations around the British Isles. Ardea 80 : 105—113.
Furness & Tasker 2000 Furness, R.W. & Tasker, M.L. 2000. Seabird-fishery interactions: quantifying the sensitivity of seabirds to reductions in sandeel abundance, and identification of key areas for sensitive seabirds in the North Sea. Marine Ecology Progress Series 202 : 253—264.
Furness et al. 2013 Furness, R.W., Wade, H.M. & Masden, E.A. 2013. Assessing vulnerability of marine bird populations to offshore wind farms. Journal of environmental management 119 : 56—66.
Furness et al. 2012 Furness, R.W., Wade, H.M., Robbins, A.M.C. & Masden, E.A. 2012. Assessing the sensitivity of seabird populations to adverse effects from tidal stream turbines and wave energy devices. ICES Journal of Marine Science 69 1466—1479.
Gaston & Jones 1998 Gaston, A.J. & Jones, I.L. 1998. The Auks: Alcidae. Oxford University Press, Oxford.
Garthe et al. 2000 Garthe, S., Benvenuti, S. & Montevecchi, W.A. 2000. Pursuit plunging by northern gannets (Sula bassana) feeding on capelin (Mallotus villosus). Proceedings of the Royal Society of London Series B: Biological Sciences 267 : 1717—1722.
Garthe & Flore 2007 Garthe, S. & Flore, B.-O. 2007. Population trend over 100 years and conservation needs of breeding Sandwich Terns (Sterna sandvicensis) on the German North Sea coast. Journal of Ornithology 148 215—227.
Garthe & Furness 2001 Garthe, S. & Furness, R.W. 2001. Frequent shallow diving by a Northern Fulmar feeding at Shetland. Waterbirds 24 287—289.
Gaston & Woo 2008 Gaston, A.J. & Woo, K. 2008. Razorbills (Alca torda) follow subarctic Prey into the Canadian Arctic: Colonization Results from Climate Change? The Auk 125 : 939—942.
Giagnoni et al. 2015 Giagnoni, R., Conti, C.A., Canepa, P. & Nardelli, R. 2015. First breeding records of Northern Gannet Morus bassanus in Italy. Avocetta 39 : 93—95.
Gilbert et al. 2021 Gilbert, G., Stanbury, A & Lewis, L. 2021. Birds of Conservation Concern in Ireland 2020—2026. Irish Birds 9 523—544. Gilchrist 1999 Gilchrist, H.G. 1999. Declining Thick-billed Murre Uria lomvia colonies experience higher gull predation rates: an intercolony comparison. Biological Conservation 87 21—29.
Gill et al. 2019 Gill, L., McManus, A., Tiernan, E. & Newton, S. 2019. Rockabill Tern Report 2019. BirdWatch Ireland Seabird Conservation Report, Kilcoole.
Gill et al. 2023 Gill, F., Donsker, D. & Rasmussen, P. (eds) 2023. IOC World Bird List v13.1. Available at: https://www.worldbirdnames.org/ new/ioc-lists/master-list-2/ [Accessed: 25/10/2024]
Gochfield et al. 2018 Gochfeld, M., Burger, J. & Garcia, E.F.J. 2018. Sandwich Tern (Thalasseus sandvicensis). In: del Hoyo, J., Elliott, A., Sargatal, J., Christie, D.A. & de Juana, E. (eds). 2018. Handbook of the Birds of the World Alive pp. Lynx Edicions. Barcelona. https://www.hbw.com/node/54016.
Gorski et al. 1977 Gorski, W., Jakuczun, B., Nitecki, C. & Petryna, A. 1977. Investigation of oil pollution on the Polish Baltic coast in 1974—1975. Przeglad Zoologiczny 21 20—23.
Green 2017 Green, E. 2017. Tern diet in the UK and Ireland: a review of key prey species and potential impacts of climate change. RSPB, Royal Society for the Protection of Birds, Sandy.
Greenwood 2007 Greenwood, J. 2007. Earlier laying by black guillemots Cepphus grylle in response to increasing sea-surface temperature. Bird Study 54 378—379.
Greenwood 2014 Greenwood, J. 2014. A review of black guillemots breeding at Bangor, Co. Down, 1985—2013. In: Leonard, K. & Wolsey, S. (eds). 2014. Northern Ireland Seabird Report 2013. British Trust for Ornithology, Thetford.
Grémillet et al. 2003 Grémillet, D., Liu, H., Le Maho, Y. & Carss, D.N. 2003. Great cormorants and freshwater fish stocks: a pragmatic approach to an ecological issue. Cormoran 13 : 131—136.
Grémillet et al. 2015 Grémillet, D., Péron, C., Provost, P. & Lescroel, A. 2015. Adult and juvenile European seabirds at risk from marine plundering off West Africa. Biological Conservation 182 : 143—147.
Guildford et al. 2009 Guilford, T., Meade, J., Willis, J., Phillips, R.A., Boyle, D., Roberts, S., Collett, M., Freeman, R. & Perrins, C.M. 2009. Migration and stopover in a small pelagic seabird, the Manx shearwater Puffinus puffinus insights from machine learning. Proceedings of the Royal Society B: Biological Sciences 276 : 1215—1223.
Guildford et al. 2018 Guilford, T., Padget, O., Bond, S. & Syposz, M. 2018. Light pollution causes object collisions during local nocturnal manoeuvring flight by adult Manx Shearwaters Puffinus puffinus Seabird Journal 31 : 48—55.
Guillemette & Brousseau 2001 Guillemette, M. & Brousseau, P. 2001. Does culling of predatory gulls enhance the productivity of breeding common terns? Journal of Applied Ecology 38 1—8.
Hagemeijer & Blair 1997 Hagemeijer, E.J.M. & M.J. Blair (eds). 1997. The EBCC Atlas of European Breeding Birds: their distribution and abundance T & A.D. Poyser, London.
Hamer et al. 2001 Hamer, K.C., Phillips, R.A., Hill, J.K., Wanless, S. & Wood, A.G. 2001. Contrasting foraging strategies of Gannets Morus bassanus at two North Atlantic colonies. Marine Ecology Progress Series 224 283—290
In text ref. Reference
Hammer et al. 2016 Hammer, S., Nager, R.G., Johnson, P.C.D., Furness, R.W. & Provencher, J.F. 2016. Plastic debris in great skua (Stercorarius skua) pellets corresponds to seabird prey species. Marine Pollution Bulletin 103 206—210. Hario 2001 Hario, M. 2001. Chick growth and nest departure in Baltic Black Guillemots Cepphus grylle Ornis Fennica 78 : 97—108. Available at: https://lintulehti.birdlife.fi:8443/pdf/artikkelit/342/tiedosto/of_78_97-108_artikkelit_342.pdf. [Accessed: 24.10.2024]
Hario et al. 2000 Hario, M., Himberg, K., Hollmén, T. & Rudbäck, E. 2000. Polychlorinated biphenyls in diseased lesser black-backed gull (Larus fuscus fuscus) chicks from the Gulf of Finland. Environmental Pollution 107 : 53—60. Harris & Riddiford 1989 Harris, M.P. & Riddiford, N.J. 1989. The food of some young seabirds on Fair Isle in 1986—88. Scottish Birds 15 119—125. Harris & Wanless 1991 Harris, M.P. & Wanless, S. 1991. The importance of the lesser sandeel Ammodytes marinus in the diet of the shag Phalacrocorax aristotelis. Ornis Scandinavica 22 375—382.
Harris & Wanless 1996 Harris, M.P. & Wanless, S. 1996. Differential responses of Guillemot Uria aalge and Shag Phalacrocorax aristotelis to a late winter wreck. Bird Study 43 : 220—230.
Harris & Wanless 2011 Harris, M.P. & Wanless, S. 2011. The Puffin. T. and A.D. Poyser, London.
Harris et al. 2022 Harris, S.J., Massimino, D., Balmer, D.E., Eaton, M.A., Noble, D.G., Pearce-Higgins, J.W., Woodcock, P. and Gillings, S. 2021. The Breeding Bird Survey 2020. BTO Research Report 736. British Trust for Ornithology, Thetford. Harris et al. 2021 Harris, S.J., Massimino, D., Balmer, D.E., Kelly, L., Noble, D.G., Pearce-Higgins, J.W., Woodcock, P., Wotton, S. & Gillings, S. 2022. The Breeding Bird Survey 2021. BTO Research Report 745. British Trust for Ornithology, Thetford. Harris et al. 2007 Harris, M.P., Newell, M., Daunt, F., Speakman, J. & Wanless, S. 2007. Snake pipefish Entelurus aequoreus are poor food for seabirds. Ibis 150 : 413—415.
Heaney et al. 2002 Heaney, V., Ratcliffe, N., Brown, A., Robinson, P.J. & Lock, L. 2002. The status and distribution of European Stormpetrels Hydrobates pelagicus and Manx Shearwaters Puffinus puffinus on the Isles of Scilly. Atlantic Seabirds 4 1—16. Heath et al. 2009 Heath, M., Edwards, M., Furness, R., Pinnegar, J. & Wanless, S. 2009. A view from above: changing seas, seabirds and food sources. In: Baxter, J.M., Buckley, P.J. & Frost, M.T. (eds). 2009. Ecosystem Linkages Report Card. Hedd et al. 2018 Hedd, A., Pollet, I.L., Mauck, R.A., Burke, C.M., Mallory, M.L., McFarlane Tranquilla, L.A., Montevecchi, W.A., Robertson, G.J., Ronconi, R.A., Shutler, D., Wilhelm, S.I. & Buegess, N.M. 2018. Foraging areas, offshore habitat use, and colony overlap by incubating Leach’s storm-petrels Oceanodroma leucorhoa in the North-west Atlantic. PLoS ONE 13 : e0194389.
Hedd & Montevecchi 2006 Hedd, A. & Montevecchi, W.A. 2006. Diet and trophic position of Leach’s storm-petrel Oceanodroma leucorhoa during breeding and moult, inferred from stable isotope analysis of feathers. Marine Ecology Progress Series 322 291—301. Heubeck 2009 Heubeck, M. 2009. Common guillemot Uria aalge chick diet and breeding performance at Sumburgh Head, Shetland in 2007—09, compared to 1990—91. Seabird Journal 22 : 9—18. Heubeck et al. 2011 Heubeck, M., Aarvak, T., Isaksen, K., Johnsen, A., Petersen, I.K. & Anker-Nilssen, T. 2011. Mass mortality of adult Razorbills Alca torda in the Skagerrak and North Sea area, autumn 2007. Seabird Journal 24 11—32. Hey et al. 2020 Hey, J., Hansen, E.S. & Bolton, M. 2020. Gull Predation on Leach’s Hydrobates leucorhous and European Storm-petrels H. pelagicus on Elliðaey Island, Iceland. Seabird Journal 32 59—71. Higgins & Davies 1996 Higgins, P.J. & Davies, S.J.J.F. 1996. Handbook of Australian, New Zealand and Antarctic birds vol 3: snipe to pigeons Oxford University Press, Oxford.
Hipfner et al. 2012 Hipfner, J.M., Blight, L.K., Lowe, R.W., Wilhelm, S.I., Robertson, G.J., Barrett, R.T., Anker-Nilssen, T. & Good, T.P. 2012. Unintended consequences: how the recovery of sea eagle Haliaeetus spp. populations in the northern hemisphere is affecting seabirds. Marine Ornithology 40 39—2. Hjernquist et al. 2012 Hjernquist, M.B., Hjernquist, M. & Hjernquist, B. 2012. Behaviour and survival of Common Guillemot Uria aalge chicks at departure from a nest site in the Baltic Sea. Ornis Svecica 22 : 3—8. Horswill et al. 2022 Horswill, C., Miller, J.A. & Wood, M.J. 2022. Impact assessments of wind farms on seabird populations that overlook existing drivers of demographic change should be treated with caution. Conservation Science and Practice 4 e12644. Horswill & Robinson 2015 Horswill, C & Robinson, R. 2015. Review of seabird demographic rates and density dependence. Available at: https:// data.jncc.gov.uk/data/897c2037-56d0-42c8-b828-02c0c9c12d13/JNCC-Report-552-REVISED-WEB.pdf [Accessed 31/07/2024] Howells et al. 2018 Howells, R.J., Burthe, S.J., Green, J.A., Harris, M.P., Newell, M.A., Butler, A., Wanless, S. & Daunt, F. 2018. Pronounced long-term trends in year-round diet composition of the European shag Phalacrocorax aristotelis. Marine Biology 165 1—15. Hunt & Heffernan 2007 Hunt, J. & Heffernan, M.L. 2007. Mink trapping at Lough Mask 2007 to protect breeding gulls. Unpublished report to the Heritage Council and the National Parks and Wildlife Service. Hunton 2024 Hunton, R. 2024. Beacon Ponds. SMPnews 2 8—13. BTO. Available at: www.bto.org/smp-news [Accessed: 01/07/2024] Indykiewicz 2015 Indykiewicz, P. 2015. Egg losses caused by cold snap in the Black-headed Gull, Chroicocephalus ridibundus. Polish Journal of Ecology 63 460—466.
Isaksson et al. 2019 Isaksson, N., Evans, T. J., Olsson, O., & Åkesson, S. 2019. Foraging behaviour of Razorbills Alca torda during chickrearing at the largest colony in the Baltic Sea. Bird Study 66 11—21. IUCN 2024 IUCN. 2024. The IUCN Red List of Threatened Species. Version 2023—1 Available at: www.iucnredlist.org. [Accessed: 12/06/2024].
James 1984 James, P. C. 1984. The status and conservation of seabirds in the Mediterranean Sea. In: Croxall, J.P., Evans, P.G.H. & Schreiber, R.W. (eds). 1984. Status and conservation of the world's seabirds. International Council for Bird Preservation, Cambridge, UK.
Jessop 2014 Jessop, H. Seabird tragedy in the north-east Atlantic winter 2013/14. Unpublished RSPB Report. Royal Society for the Protection of Birds, Sandy.
In text ref. Reference
JNCC 2021 JNCC. 2021. Seabird Population Trends and Causes of Change: 1986—2023 Report JNCC. Available at: www.jncc.gov.uk// out-work/ [Accessed 01/08/2023]
JNCC 2014
JNCC. 2014. Methods of analysis for production of indices of abundance and estimation of productivity. Available at: https://hub.jncc.gov.uk/assets/701c338f-ed54-43da-a61c-254cb79698b8 [Accessed 31/07/2024]
Johnston et al. 2021 Johnston, D.T., Humphreys, E.M., Davies, J.G. & Pearce-Higgins, J.W. 2021. Review of climate change mechanisms affecting seabirds within the INTERREG VA area. MarPAMM project commissioned report.
Johnston et al. 2020 Johnston, D.T., Furness, R.W., Robbins, A., Tyler, G.A. & Masden, E.A. 2020. Camera traps reveal predators of breeding Black Guillemots Cepphus grylle. Seabird Journal 32 : 72—83.
Keller et al. 2020 Keller, V., Herrando, S., Voríšek, P., Franch, M., Kipson, M., Milanesi, P., Martí, D., Anton, M., Klvanova, A., Kalyakin, M.V., Bauer, H.G. & Foppen, R.P.B. 2020. European Breeding Bird Atlas 2: Distribution, Abundance and Change. Lynx Edicions, Barcelona, Spain.
Kenyon & Cooper 2005 Kenyon, N. & Cooper, B. 2005. Sand banks, sand transport and offshore wind farms. DTI SEA 6 Technical Report. Department of Trade and Industry, London.
Kersten et al. 2021 Kersten, O., Star, B., Leigh, D.M., Anker-Nilssen, T., Strøm, H., Danielsen, J., Descamps, S., Erikstad, K.E., Fitzsimmons, M.G., Fort, J., Hansen, E.S., Harris, M.P., Irestedt, M., Kleven, O., Mallory, M.L., Jakobsen, K.S. & Boessenkool, S. 2020. Complex population structure of the Atlantic puffin revealed by whole genome analyses. Communications Biology 4 : 922.
Kim & Monaghan 2006 Kim, S.Y. & Monaghan, P. 2006. Interspecific differences in foraging preferences, breeding performance and demography in herring (Larus argentatus) and lesser black-backed gulls (Larus fuscus) at a mixed colony. Journal of Zoology 270 664—671.
Klaassen & Wille 2023 Klaassen, M. & Wille, M. 2023. The plight and role of wild birds in the current bird flu panzootic. Nature Ecology & Evolution 7 1541—1542.
Klaassen et al. 2012 Klaassen, R.H., Ens, B.J., Shamoun-Baranes, J., Exo, K.M. & Bairlein, F. 2012. Migration strategy of a flight generalist, the Lesser Black-backed Gull Larus fuscus Behavioral Ecology 23 : 58—68.
Knief et al. 2024 Knief, U., Bregnballe, T., Alfarwi, I., Ballmann, M., Brenninkmeijer, A., Bzoma, S., Chabrolle, A., Dimmlich, J., Engel, E., Fijn, R., Fischer, K., Hälterlein, B., Haupt, M., Herrmann, C., Veld, R., Kirchhoff, E., Kristersson, M., Kühn, S., Larsson, K. & Courtens, W. 2024. Highly pathogenic avian influenza causes mass mortality in Sandwich Tern Thalasseus sandvicensis breeding colonies across north-western Europe. Bird Conservation International 34 : e6.
Kubetzki & Garthe 2003 Kubetzki, U. & Garthe, S. 2003. Distribution, diet and habitat selection by four sympatrically breeding gull species in the south-eastern North Sea. Marine Biology 143 199—207.
Kubetzki et al. 2009 Kubetzki, U., Garthe, S., Fifield, D., Mendel, B. & Furness, R.W. 2009. Individual migratory schedules and wintering areas of northern gannets. Marine Ecology Progress Series 391 257—265.
Kühn et al. 2020 Kühn, S., Booth, A.M., Sørensen, L., Van Oyen, A. & Van Franeker, J.A. 2020. Transfer of additive chemicals from marine plastic debris to the stomach oil of northern fulmars. Frontiers in Environmental Science 8 : 138.
Lambert et al. 2015 Lambert, M., Carlisle, S. & Cain I. 2015. The role of brown rat (Rattus norvegicus) predation in determining breeding success of Manx shearwaters (Puffinus puffinus) on Rum. Scottish Natural Heritage Commissioned Report, No. 697. Lane et al. 2023 Lane, J.V., Jana, Avery-Gomm, S., Elmar Ballstaedt, Banyard, A.C., Tatsiana Barychka, Brown, I.H., Brugger, B., Burt, T.V., Careen, N., Johan, Christensen-Dalsgaard, S., Clifford, S., Collins, S.M., Emma, Danielsen, J., Daunt, F., Kyle, Doiron, P. & Duffy, S. 2023. High pathogenicity avian influenza (H5N1) in Northern Gannets: Global spread, clinical signs, and demographic consequences. Ibis 166 633—650.
Langley et al. 2022 Langley, L.P., Bearhop, S., Burton, N.H., Banks, A.N., Frayling, T., Thaxter, C.B., Clewley, G.D., Scragg, E. & Votier, S.C. 2023. Urban and coastal breeding lesser black-backed gulls (Larus fuscus) segregate by foraging habitat. Ibis 165 : 214—230.
Langlois Lopez et al. 2022 Langlois Lopez, S.L., Bond, A.L., O'Hanlon, N.J., Wilson, J., Vitz, A., Mostello, C., Hamilton, F., Rail, J.F., Welch, L., Boettcher, R., Wilhelm, S., Anker-Nilssen, T., Daunt, F. & Masden, E. 2022. Global population and conservation status of the Great Black-backed Gull Larus marinus Bird Conservation International 33 1—11.
Lavers et al. 2020 Lavers, J., J. M. Hipfner, & G. Chapdelaine 2020. Razorbill (Alca torda), version 1.0. In: S. M. Billerman (eds). 2020. Birds of the World). Cornell Lab of Ornithology, Ithaca, NY, USA. Available at: https://doi.org/10.2173/bow.razorb.01 [Accessed: 25/10/2024].
Leigh et al. 2022 Leigh, D., Kersten, O., Star, B., Anker-Nilssen, T., Burnham, K., Johnson, J., Provencher, J. & Boessenkool, S. 2022. Sympatry of genetically distinct Atlantic Puffins Fratercula arctica in the High Arctic. Ibis 165 1022—1030. Lemmetyinen 1973 Lemmetyinen, R. 1973. Feeding ecology of Sterna paradisaea Pontopp. and S. hirundo L. in the archipelago of southwestern Finland. Annales Zoologici Fennici 10 507—525.
Leonard & Wolsey 2014 Leonard, K. & Wolsey, S. 2014. Northern Ireland Seabird Report 2013. British Trust for Ornithology, Thetford. Lock et al. 2022 Lock, L., Donato, B., Jones, R. & Macleod-Nolan, C. 2022. England’s breeding seabirds: A review of the status of their breeding sites and suggested measures for their recovery. RSPB and Natural England report. Available at: https://www. projectlote.life/uploads/1/3/5/6/135667366/seabird_colony_assessment_lote.pdf [Accessed 25/10/2024].
Lock 2006 Lock J. 2006. Eradication of brown rats Rattus norvegicus and black rats Rattus rattus to restore breeding seabird populations on Lundy Island, Devon, England. Conservation Evidence 3 : 111—113. Loeb 2023 Loeb, J. 2023. Scottish seabirds showing immunity to avian flu. Veterinary Record 193 340. Løkkeborg & Robertson 2002 Løkkeborg, S. & Robertson, G. 2002. Seabird and longline interactions: effects of a bird-scaring streamer line and line shooter on the incidental capture of Northern Fulmars Fulmarus glacialis. Biological Conservation 106 359—364. Lorentsen & Anker-Nilssen 1999 Lorentsen, S.-H. & Anker-Nilssen, T. 1999. Diet of Common Murres Wintering in the Northern Skagerrak during 1988—1990: Variation with Sex, Age and Season. Waterbirds: The International Journal of Waterbird Biology 22 80. Macdonald & Standring 1978 MacDonald, S. & Standring, K.T. 1978. An outbreak of botulism in gulls on Firth of Forth, Scotland. Biological Conservation 14 : 149—155.
Macdonald et al. 2015 MacDonald, A., Heath, M. R., Edwards, M., Furness, R. W., Pinnegar, J. K., Wanless, S., Speirs, D.C. & Greenstreet, S.P.R. 2015. Climate driven trophic cascades affecting seabirds around the British Isles. Oceanography and Marine Biology: An Annual Review 53 55—80.
In text ref. Reference
Macgregor et al. 2022
Macgregor, C.J., Boersch-Supan, P.H., Burton, N.H.K., Carss, D.N., Newson, S.E., Pearce-Higgins, J.W., Robinson, R.A. & Taylor, R.C. 2022. Informing decisions on lethal control of Great Cormorant and Goosander in Wales: scenarios from Population Viability Analysis Natural Resource Wales Evidence Report Series, Report No. 615. Macleod-Nolan 2020 Macleod-Nolan, C. 2020. Little Tern Newsletter 2019. Unpublished RSPB Report, Royal Society for the Protection of Birds, Sandy.
Madden & Newton 2004 Madden, B. & Newton, S.F. 2004. Herring Gull Larus argentatus. In: Mitchell, P.I., Newton, S.F., Ratcliffe, N. & Dunn, T.E. (eds). 2004. Seabird Populations of Britain and Ireland 242—262. Poyser, London. Magnusdóttir et al. 2011 Magnusdóttir, E., Leat, E.H.K., Bourgeon, S., Strøm, H., Petersen, A., Phillips, R.A., Hanssen, S.A., Bustness, J.O., Herstiensson, P. & Furness, R. W 2011. Wintering areas of Great Skuas Stercorarius skua breeding in Scotland, Iceland and Norway. Bird Study 59 : 1—9.
Mallory et al. 2009 Mallory, M.L., Gaston, A.J., Forbes, M.R. & Gilchrist, H.G. 2009. Influence of weather on reproductive success of northern fulmars in the Canadian High Arctic. Polar Biology 32 : 529—538. Marchant et al. 2004 Marchant, J.H., Freeman, S.N., Crick, H.Q.P. & Beaven, L.P. 2004. The BTO Heronries Census of England and Wales 1928—2000: new indices and a comparison of analytical methods. Ibis 146 323—334. Masden et al. 2010 Masden, E., Haydon, D., Fox, A. & Furness, R. 2010. Barriers to movement: Modelling energetic costs of avoiding marine wind farms amongst breeding seabirds. Marine pollution bulletin 60 1085—1091.
Mavor et al. 2006 Mavor, R.A., Parsons, M., Heubeck, M. & Schmitt. S. 2006. Seabird numbers and breeding success in Britain and Ireland, 2005. Joint Nature Conservation Committee, UK Nature Conservation, Peterborough. Mederios et al. 2007 Medeiros, R., Ramos, J.A., Paiva, V.H., Almeida, A., Pedro, P. & Antunes, S. 2007. Signage reduces the impact of human disturbance on little tern nesting success in Portugal. Biological Conservation 135 99—106.
Meek et al. 2011 Meek, E.R., Bolton, M., Fox, D. & Remp, J. 2011. Breeding skuas in Orkney: a 2010 census indicates density-dependent population change driven by both food supply and predation. Seabird Journal 24 : 1—10.
Meininger & Flamant 1998 Meininger P.L. & Flamant R. 1998. Breeding populations of Mediterranean Gull Larus melanocephalus in The Netherlands and Belgium. Sula 12 : 129—138.
Melville & Shortridge 2006 Melville, D.S. & Shortridge, K.F. 2006. Migratory waterbirds and avian influenza in the East Asian-Australasian Flyway with particular reference to the 2003—2004 H5N1 outbreak. In: Boere, G., Galbraith, C. & Stroud, D. (eds). 2006. Waterbirds around the world The Stationery Office, Edinburgh, U.K. Milchev et al. 2004 Milchev, B., Kodjabashev, N., Sivkov, Y. & Chobanov, D. 2004. Post-breeding season diet of the Mediterranean gull Larus melanocephalus at the Bulgarian Black Sea coast. Atlantic Seabirds 6 65—78.
Miles et al. 2015 Miles, W.T., Mavor, R., Riddiford, N.J., Harvey, P.V., Riddington, R., Shaw, D.N., Parnaby, D. & Reid, J.M 2015. Decline in an Atlantic Puffin Population: Evaluation of Magnitude and Mechanisms. PLoS ONE 10 e0131527.
Miles 2010 Miles, W.T.S. 2010. Ecology, behaviour and predator-prey interactions of Great Skuas and Leach’s Storm-petrels at St Kilda PhD Thesis, University of Glasgow, Glasgow.
Miles et al. 2020 Miles, J., Parsons, M. & O’Brien, S. 2020. Preliminary assessment of seabird population response to potential bycatch mitigation in the UK registered fishing fleet. Report prepared for the Department for Environment Food and Rural Affairs. Militão et al. 2022 Militão, T., Sanz-Aguilar, A., Rotger, A. & Ramos, R. 2022. Non-breeding distribution and at-sea activity patterns of the smallest European seabird, the European Storm Petrel (Hydrobates pelagicus). Ibis 164 1160—1179. Mitchell et al. 2004 Mitchell, P.I., Newton, S.F., Ratcliffe, N. & Dunn, T.E. (eds). 2004. Seabird Populations of Britain and Ireland Poyser, London.
Monaghan 1992 Monaghan, P. 1992. Seabirds and sandeels: the conflict between exploitation and conservation in the northern North Sea. Biodiversity and Conservation 1 98—111. Monaghan & Coulson 1977 Monaghan, P. & Coulson, J.C. 1977. Status of Large Gulls Nesting on Buildings. Bird Study 24 89—104. Monaghan et al. 1989 Monaghan, P., Uttley, J.D., Burns, M.D., Thaine, C. & Blackwood, J. 1989. The relationship between food supply, reproductive effort and breeding success in Arctic Terns Sterna paradisaea The Journal of Animal Ecology 58 261—274. Morgan 2012 Morgan, G. 2012. The bird populations of Ramsey and Grassholm. British Birds 105 716—732 Montevecchi 1997 Montevecchi, W. 1997. Centurial and decadal oceanographic influences on changes in northern gannet populations and diets in the north-west Atlantic: implications for climate change. ICES Journal of Marine Science 54 608—614 Mougeot & Bretagnolle 2000 Mougeot, F. & Bretagnolle, V. 2000. Predation risk and moonlight avoidance in nocturnal seabirds. Journal of Avian Biology 31 : 376—386
Mudge & Ferns 1982 Mudge, G.P. & Ferns. P.N. 1982. The feeding ecology of five species of gulls (Ayes: Larini) in the inner Bristol Channel. Journal of Zoology 197 : 497—510
Nager et al. 2000 Nager, R.G., Monaghan, P., Houston, D.C. & Genovart, M. 2000. Parent condition, brood sex ratio and differential young survival: an experiment study in gull (Larus fuscus). Behaviour Ecology and Sociobiology 48 : 452—457. NatureScot 2023 NatureScot. 2023. NatureScot Scientific Advisory Committee Sub-Group on Avian Influenza Report on the H5N1 outbreak in wild birds 2020—2023 Available at: https://www.nature.scot/doc/naturescot-scientific-advisory-committee-sub-groupavian-influenza-report-h5n1-outbreak-wild-birds [Accessed: 25/10/2024].
Nettleship 1996 Nettleship, D.N. 1996. Razorbill (Alca torda). In: del Hoyo, J., Elliott, A., Sargatal, J., Christie, D.A. & de Juana, E. (eds). 1996. Handbook of the Birds of the World Alive, Lynx Edicions, Barcelona. Nettleship et al. 2018a Nettleship, D.N., Kirwan, G.M., Christie, D.A., Boesman, P. & Garcia, E.F.J 2018a. Common Murre (Uria aalge) In: del Hoyo, J., Elliott, A., Sargatal, J., Christie, D.A. & de Juana, E. (eds). Handbook of the Birds of the World Alive Lynx Edicions, Barcelona. Nettleship et al. 2018b Nettleship, D.N. Sharpe, C.J. Boesman, P. & Garcia, E.F.J. 2018b. Razorbill (Alca torda) Barcelona. Available at: https:// www.hbw.com/node/54062. [Accessed: 25/10/2024].
In text ref. Reference
Neumann et al. 2021 Neumann, S., Harju, M., Herzke, D., Anker-Nilssen, T., Christensen-Dalsgaard, S., Langset, M. & Gabrielsen, G.W. 2021. Ingested plastics in northern fulmars (Fulmarus glacialis): A pathway for polybrominated diphenyl ether (PBDE) exposure? Science of the Total Environment 778 146313.
Newell et al. 2015 Newell, M., Wanless, S., Harris, M.P. & Daunt, F. 2015. Effects of an extreme weather event on seabird breeding success at a North Sea colony. Marine Ecology Progress Series 532 257—268.
Newson & Austin 2021 Newson, S & Austin, G. 2021. Definition of favourable conservation status for Great Cormorant. BTO Report for Natural England, Report No. RP2952. Natural England.
Newson et al. 2013 Newson, S.E., Marchant, J.H., Sellers, R.M., Ekins, G.R., Hearn, R.D. & Burton, N.H.K. 2013. Colonisation and range expansion of inland-breeding Cormorants in England. British Birds 106 737—743.
Newson et al. 2008 Newson, S.E., Mitchell, P.I., Parsons, M., O’Brien, S.H., Austin, G.E., Benn, S., Black, J., Blackburn, J., Brodie, B., Humphreys, E. & Leech, D. 2008. Population decline of Leach’s Storm-petrel Oceanodroma leucorhoa within the largest colony in Britain and Ireland. Seabird Journal 21 77—84.
Newton 2020 Newton, I. 2020. Uplands and Birds. Collins. London.
Newton & Little 2009 Newton, I. & Little, B. 2009. Assessment of wind-farm and other bird casualties from carcasses found on a Northumbrian beach over an 11-year period. Bird Study 56 158—167.
Newton & Crowe 2000 Newton, S.F. & Crowe, O. 2000. Roseate Terns – The Natural Connection. A conservation/research project linking Ireland and Wales. IWC-BirdWatch Ireland, Monkstown, County Dublin.
Nordberg & Salmi 2019 Nordberg, K. & Salmi, P. 2019. Addressing the gap between participatory ideals and the reality of environmental management: the case of the coromorant population in Finland. Environmental Policy and Governance 29 251—261. Nordström et al. 2003 Nordström, M., Högmander, J., Laine, J., Nummelin, J., Laanetu, N. & Korpimäki, E. 2003. Effects of feral mink removal on seabirds, waders and passerines on small islands in the Baltic Sea. Biological Conservation 109 : 359—368. Nordström et al. 2004 Nordström, M., Laine, J., Ahola, M. & Korpimäki, E. 2004. Reduced nest defence intensity and improved breeding success in terns as responses to removal of non-native American mink. Behavioral Ecology and Sociobiology 55 454—460.
Northridge et al. 2020 Northridge, S.P, Kingston, A.R. & Coram, A.J. 2020. Preliminary estimates of seabird bycatch by UK vessels in UK and adjacent waters. Final Report to JNCC — Revised October 2020. Scottish Ocean Institute, University of St Andrews. Northridge et al. 2023 Northridge, S.P., Kingston, A.R. & Coram, A.J. 2023. Regional seabird bycatch hotspot analysis. JNCC Report 726, JNCC, Peterborough.
Ntiamoa-Baidu et al. 1992 Ntiamoa-Baidu, Y., Nyame, S.K. & Nuah, A.A. 1992. Preliminary report on tern trapping in coastal Ghana. In: Rolland, G. (eds). Proceedings of the Roseate Tern workshop. SEPNB. Brest.
O’Hanlon et al. 2019 O’Hanlon, N.J., Bond, A.L., Lavers, J.L., Masden, E.A. & James, N.A. 2019. Monitoring nest incorporation of anthropogenic debris by Northern Gannets across their range. Environmental Pollution 255 113152. O’Hanlon et al. 2024 O’Hanlon, N.J., van Bemmelen, R.S.A., Snell, K.R.S., Conway, G.J, Thaxter, C.B., Aiton, H., Aiton, D., Balmer, D.E., Are Hanssen, S., Calladine, J.R., Hammer, S., Harris, S.J., Moe, B., Schekkerman, H., Tulp, I. & Humphreys, E.M. 2024. Cross population comparison of complex migration strategies in a declining oceanic seabird. Marine Ecology Progress Series 730 : 113—129.
Oliveira et al. 2015 Oliveira, N., Henriques, A., Miodonski, J., Pereira, J., Marujo, D., Almeida, A., Barros, N., Andrade, J., Marçalo, A., Santos, J., Oliveira, I.B., Ferreira, M., Araújo, H., Monteiro, S., Vingada, J. & Ramírez, I. 2015. Seabird Bycatch in Portuguese Mainland Coastal Fisheries: An Assessment through on-Board Observations and Fishermen Interviews. Global Ecology and Conservation 3 : 51—61.
Olsen & Larsson 2003 Olsen, K.M. & Larsson, H. 2003. Gulls of Europe, Asia and North America. Christopher Helm, London. Olsson & Hentati-Sundberg 2017 Olsson, O. & Hentati-Sundberg. 2017. Population trends and status of four seabird species (Uria aalge, Alca torda, Larus fuscus, Larus argentatus) at Stora Karlsö in the Baltic Sea. Ornis Svecica 27 64—93. Oro 1996 Oro, D. 1996. Effects of trawler discard availability on egg laying and breeding success in the lesser black-backed gull Larus fuscus in the western Mediterranean. Marine Ecology Progress Series 132 : 43—46.
Oswald & Arnold 2012 Oswald, S.A. & Arnold, J.M. 2012. Direct impacts of climatic warming on heat stress in endothermic species: seabirds as bioindicators of changing thermoregulatory constraints. Integrated Zoology 7 : 121—136.
Owen et al. 2018 Owen, E., Prince, O., Cachia-Zammit, C., Cartwright, R., Coledale, T., Elliott, S., Haddon, S., Longmoor, G., Swale, J., West, F. & Hughes, R. 2018. Counts of Puffins in Shetland Suggest an Apparent Decline in Numbers. Scottish Birds 38 223—231.
Paiva et al. 2008 Paiva, V.H., Ramos, J.A., Martins, J., Almeida, A. & Carvalho, A. 2008. Foraging habitat selection by Little Terns Sternula albifrons in an estuarine lagoon system of southern Portugal. Ibis 150 : 18—31.
Paredes et al. 2014 Paredes, R., Orben, R.A., Suryan, R.M., Irons, D.B., Roby, D.D, Harding, A.M., Young, R.C., Benoit-Bird, K., Ladd, C., Renner, H. & Heppell, S. 2014. Foraging responses of Black-legged Kittiwakes to prolonged food-shortages around colonies on the Bering Sea Shelf. PLoS ONE 9 : e92520.
Perkins et al. 2018 Perkins, A., Ratcliffe, N., Suddaby, D., Ribbands, B., Smith, C., Ellis, P., Meek, E. & Bolton, M. 2018. Combined bottomup and top-down pressures drive catastrophic population declines of Arctic skuas in Scotland. Journal of Animal Ecology 87 : 1573—1586.
Perrow et al. 2011 Perrow, M., Skeate, E. & Gilroy, J. 2011. Visual tracking from a rigid-hulled inflatable boat to determine foraging movements of breeding terns. Journal of Field Ornithology 82 : 68—79.
Peschko et al. 2021 Peschko, V., Mendel, B., Mercker, M., Dierschke, J. & Garthe, S. 2021. Northern gannets (Morus bassanus) are strongly affected by operating offshore wind farms during the breeding season. Journal of Environmental Management 279 : 111509.
Peschko et al. 2020 Peschko, V., Mercker, M. & Garthe, S. 2020. Telemetry reveals strong effects of offshore wind farms on behaviour and habitat use of common guillemots (Uria aalge) during the breeding season. Marine Biology 167 118
Phillips et al. 1996
Phillips, R.A., Caldow, R.W.G. & Furness, R.W. 1996. The influence of food availability on the breeding effort and reproductive success of Arctic Skuas Stercorarius parasiticus. Ibis 138 : 410—419.
Phillips et al. 1997 Phillips, A., Catry, P., Thompson, D., Hamer, K. & Furness, R.W. 1997. Inter-colony variation in diet and reproductive performance of great skuas Catharacta skua. Marine Ecology Progress Series 152 285—293.
In text ref. Reference
Phillips et al. 1999 Phillips, R.A., Petersen, M.K., Lilliendahl, K., Solmundsson, J., Hamer, K.C., Camphuysen, C.J. & Zonfrillo, B. 1999. Diet of the northern fulmar Fulmarus glacialis: reliance on commercial fisheries? Marine Biology 135 159—170. Piatt & Nettleship 1985 Piatt, J.F. & Nettleship, D,N. 1985. Diving Depths of Four Alcids. The Auk 102 293—297. Pollet et al. 2023 Pollet, I.L., Lenske, A.K., Ausems, A.N.M.A., Barbraud, C., Bedolla-Guzmán. Y., Bicknell, A.W.J., Bolton, M., Bond, A.L., Delord, K., Diamond, A.W., Fifield, D.A., Gjerdrum, C., Halpin, L.R., Hansen, E.S., Hedd, R., Major, H.L., Mauck, R.A., McClelland, G.T.W., McFarlane Tranquilla, L., Montevecchi, W.A., Parker, M., Pratte, I., Rail, J-.F., Robertson, G.J., Rock, J.C., Ronconi, R.A., Shutler, D., Stenhouse, I.J., Takahashi, A., Watanuki, Y., Welch, L.J., Wilhelm, S.I., Wong, S.M.P. & Mallory, M.L. 2023. Experts’ opinions on threats to Leach’s Storm-Petrels (Hydrobates leucorhous) across their global range. Avian Conservation and Ecology 18 1
Pollet et al. 2014 Pollet, I.L., Ronconi, R.A., Jonsen, I.D., Leonard, M.L., Taylor, P.D. & Shutler, D. 2014. Foraging movements of Leach’s storm-petrels Oceanodroma leucorhoa during incubation. Journal of Avian Biology 45 : 305—314.
Pollet et al. 2019 Pollet, I.L., Ronconi, R.A., Leonard, M.L. & Shutler, D. 2019. Migration routes and stopover areas of Leach’s Storm Petrels Oceanodroma leucorhoa. Marine Ornithology 47 : 55—65.
Pollock et al. 2021 Pollock, C.J., Lane, J.V., Buckingham, L., Garthe, S., Jeavons, R., Furness, R.W. & Hamer, K.C. 2021. Risks to different populations and age classes of gannets from impacts of offshore wind farms in the southern North Sea. Marine Environmental Research 171 : 105457.
Power et al. 2021 Power, A., White, P., McHugh, B., Berrow, S., Schlingermann, M., Tannian, M., Newton, S., McGovern, E., Murphy, S., Crowley, D., O’Hea, L., Boyle, B. & O’Connor, I. 2021. Persistent pollutants in Northern Gannet Morus bassanus eggs in Ireland: Levels and colony differences. Environmental Pollution 268 : 115723.
Pritchard et al. 2021 Pritchard, R., Hughes, J., Spence, I.M., Haycock, B, & Brenchley, A. (eds) 2021. The Birds of Wales Adar Cymru. Liverpool University Press.
Quinn et al. 2016 Quinn, L.R., Meharg, A.A., van Franeker, J,A., Graham, I, M. & Thompson, P.M. 2016. Validating the use of intrinsic markers in body feathers to identify inter-individual differences in non-breeding areas of Northern Fulmars. Marine Biology 163 : 64.
R Core Team 2004 R: A language and environment for statistical computing. R Foundation for Statistical Computing Vienna, Austria. Available at: www.R-project.org [Accessed: 25/10/2024].
Rahmstorf & Coumou 2011 Rahmstorf, S. & Coumou, D. 2011. Increase of extreme events in a warming world. Proceedings of the National Academy of Sciences 108 17905—17909.
Ratcliffe & Merne 2002 Ratcliffe, N. & Merne, O. 2002. Roseate tern Sterna dougallii. In: Wernham, C.V., Toms, M., Marchant, J., Clark, J., Siriwardena, G. & Baillie, S. (eds). 2002. The Migration Atlas: Movements of the birds of Britain and Ireland. T and A.D. Poyser, London.
Ratcliffe et al. 2008a Ratcliffe, N., Craik, C., Helyar, A., Roy, S. & Martin, S. 2008. Modelling the benefits of American Mink Mustela vison management options for terns in west Scotland. Ibis 150 114—121.
Ratcliffe et al. 2008b Ratcliffe, N. Schmitt, S. Mayo, A. Tratalos, J. & Drewitt, A. 2008. Colony habitat selection by little terns Stemula albifrons in East Anglia: Implications for coastal management. Seabird Journal 21 55—63.
Ratcliffe et al. 2000 Ratcliffe, N., Pickerell, G. & Brindley, E. 2000. Population trends of Little and Sandwich Terns Sterna albifrons and S. sandvicensis in Britain and Ireland from 1969 to 1998. Atlantic Seabird 21 211—226.
Raven & Coulson 1997 Raven, S.J. & Coulson, J.C 1997. The distribution and abundance of Larus gulls nesting on buildings in Britain and Ireland. Bird Study 44 13—34.
Reeves & Furness 2002 Reeves, S.A. & Furness, R.W. 2002. Net loss–seabirds gain? Implications of fisheries management for seabirds scavenging discards in the northern North Sea. Unpublished RSPB Report, Royal Society for the Protection of Birds, Sandy. Régnier et al. 2019 Régnier, T., Gibb FM. & Wright PJ. 2019. Understanding temperature effects on recruitment in the context of trophic mismatch. Scientific Reports 9 15179.
Régnier et al. 2017 Régnier, T., Gibb, F.M. & Wright, P.J. 2017. Importance of trophic mismatch in a winter-hatching species: evidence from lesser sandeel. Marine Ecology Progress Series 567 185—197.
Regular et al. 2013 Regular, P., Montevecchi, W., Hedd, A., Robertson, G. & Wilhelm, S. 2013. Canadian fishery closures provide a largescale test of the impact of gillnet bycatch on seabird populations. Biology letters 9 : 20130088. Reid 2004 Reid, J.B. 2004. Great Black-backed Gull Larus marinus. In: Mitchell, P.I., Newton, S.F., Ratcliffe, N. & Dunn, T.E. (eds). 2004. Seabird Populations of Britain and Ireland. Poyser, London.
Rendell-Read 2016 Rendell-Read, S. 2016. Little Tern Newsletter 2015. Unpublished RSPB Report, Royal Society for the Protection of Birds, Sandy.
Rendell-Read 2018 Rendell-Read, S. 2018. Little Tern Newsletter 2017. Unpublished RSPB Report, Royal Society for the Protection of Birds, Sandy.
Richards 1990 Richards, A. 1990. Seabirds of the northern hemisphere. Dragon’s World Ltd, Limpsfield, U.K. Rijks et al. 2022 Rijks, J.M., Leopold, M.F., Kühn, S., in‘t Veld, R., Schenk, F., Brenninkmeijer, A., Lilipaly, S.J., Ballmann, M.Z., Kelder, L., de Jong, J.W. & Courtens, W. 2022. Mass mortality caused by highly pathogenic influenza A (H5N1) virus in Sandwich terns, the Netherlands, 2022. Emerging Infectious Diseases 28 : 2538—2542.
Riordan & Birkhead 2018 Riordan, J. & Birkhead, T. 2018. Changes in the diet composition of Common Guillemot Uria aalge chicks on Skomer Island. Ibis 160 470—474.
Riou et al. 2011 Riou, S., Gray, C.M., Brooke, M.de.L., Quillfeldt, P., Masello, J.F., Perrins, C. & Hamer, K.C. 2011. Recent impacts of anthropogenic climate change on a higher marine predator in western Britain. Marine Ecology Progress Series 422 105—112.
In text ref. Reference
Rock 2005 Rock, P. 2005. Urban gulls: problems and solutions. British Birds 98 338—355.
Rock et al. 2016 Rock, P., Camphuysen, C. J., Shamoun-Baranes, J., Ross-Smith, V. H. & Vaughan, I. P 2016. Results from the first GPS tracking of roof-nesting Herring Gulls Larus argentatus in the UK. Ringing and Migration 31 47—62.
Rodriguez & Rodriguez 2009 Rodriguez, A. & Rodriguez, B. 2009. Attraction of petrels to artificial lights in the Canary Islands: effects of the moon phase and age class. Ibis 151 : 299—310.
Roos et al. 2018 Roos, S., Smart, J., Gibbons, D. & Wilson, J. 2018. A review of predation as a limiting factor for bird populations in mesopredator-rich landscapes: a case study of the UK. Biological Reviews 93 1915—1937.
Ross-Smith et al. 2015 Ross-Smith, V.H., Johnston, A. & Ferns, P.N. 2015. Hatching success in Lesser Black-backed Gulls Larus fuscus — an island case study of the effects of egg and nest site quality. Seabird Journal 28 1—16.
Ross-Smith et al. 2014 Ross-Smith, V.H., Robinson, R.A., Banks, A.N., Frayling, T.D., Gibson, C.C. & Clark, J.A. 2014. The Lesser Black-backed Gull Larus fuscus in England: how to resolve a conservation conundrum. Seabird Journal 27 : 41—61.
Sandvik et al. 2005 Sandvik, H., Erikstad, K.E., Barrett, R.T. & Yoccoz, N.G. 2005. The effect of climate on adult survival in five species of North Atlantic seabirds. Journal of Animal Ecology 74 817—831.
Schreiber & Kissling 2005 Schreiber, J. & Kissling, W.D. 2005. Factors affecting the breeding success of Arctic Tern Sterna paradisaea in a colony at Kaldbaksbotnur, Faroe Islands. Atlantic Seabirds 7 : 97—105.
Schwartz et al. 2023 Schwartz, T., Besnard, A., Pin, C., Scher, O., Blanchon, T., Béchet, A. & Sadoul, N. 2023. Efficacy of created and restored nesting sites for the conservation of colonial Laridae in the south of France. Conservation Biology 37 : e14005. Scott et al. 2015 Scott, P., Duncan, P. & Green, J.A. 2015. Food preference of the Black-headed Gull Chroicocephalus ridibundus differs along a rural–urban gradient. Bird study 62 56—63.
Searle et al. 2014 Searle, K., Mobbs, D., Butler, A., Bogdanova, M., Freeman, S., Wanless, S. & Daunt, F. 2014. Population consequences of displacement from proposed offshore wind energy developments for seabirds breeding at Scottish SPAs. Final report to Marine Scotland Science, May. Available at: https://tethys.pnnl.gov/sites/default/files/publications/searleetal.pdf [Accessed: 25/10/2024].
Searle et al. 2022 Searle, K., Butler, A., Waggitt, J., Evans, P., Quinn, L., Bogdanova, M., Evans, T., Braithwaite, J. & Daunt, F. 2022. Potential climate-driven changes to seabird demography: implications for assessments of marine renewable energy development. Marine Ecology Progress Series 690 185—200.
Searle et al. 2023 Searle, K., Regan, C., Perrow, M., Butler, A., Rindorf, A., Harris, M., Newell, M., Wanless, S. & Daunt, F. 2023. Effects of a fishery closure and prey abundance on seabird diet and breeding success: Implications for strategic fisheries management and seabird conservation. Biological Conservation 281 : 109990.
Sellers & Shackleton 2011 Sellers, R.M. & Shackleton, D. 2011. Numbers, distribution and population trends of large gulls breeding in Cumbria, north-west England. Seabird Journal 24 90—102.
Sellers 2014 Sellers, R.S. 2014. Mass mortality of razorbills and other seabirds on the coast of Cumbria in February 2014. Lakeland Naturalist 2 63—71.
Seward et al. 2019 Seward, A., Ratcliffe, N., Newton, S., Caldow, R., Piec, D., Morrison, P., Cadwallender, T., Davies, W. & Bolton, M. 2019. Metapopulation dynamics of roseate terns: Sources, sinks and implications for conservation management decisions. Journal of Animal Ecology 88 138—153.
Shlepr et al. 2021 Shlepr, K.R., Ronconi, R.A. Hayden, B., Allard, K.A. & Diamond A.W. 2021. Estimating the relative use of anthropogenic resources by Herring Gull (Larus argentatus) in the Bay of Fundy, Canada. Avian Conservation and Ecology 16
Shoji et al. 2016 Shoji, A., Dean, B., Kirk, H., Freeman, R., Perrins, C. M. & Guilford, T. 2016. The diving behaviour of the Manx Shearwater Puffinus puffinus. Ibis 158 : 598—606.
Shoji et al. 2015 Shoji, A., Elliott, K.H., Greenwood, J.G., McClean, L., Leonard, K., Perrins, C.M., Fayet, A. & Guilford, T. 2015. Diving behaviour of benthic feeding Black Guillemots. Bird Study 62 217—222.
Short 2014 Short, D. 2014. Breeding of four species of tern and Black-headed Gull at Forvie National Nature Reserve, 2013
Unpublished Scottish Natural Heritage Report, Scottish Natural Heritage, Edinburgh.
Short 2020 Short, D. 2020. Breeding of four species of tern and Black-headed Gull at Forvie National Nature Reserve, 2019. Unpublished Scottish Natural Heritage Report, Scottish Natural Heritage, Edinburgh.
Short & Watts 2016 Short, D. & Watts E. 2016. Breeding of four species of tern and Black-headed Gull at Forvie National Nature Reserve, 2015. Unpublished Scottish Natural Heritage Report, Scottish Natural Heritage, Edinburgh.
Skórka et al. 2006 Skórka, P., Martyka, R., Wójcik, J.D., Babiarz, T. & Skórka, J. 2006. Habitat and nest site selection in the Common Gull Larus canus in southern Poland: significance of man-made habitats for conservation of an endangered species. Acta Ornithologica 41 137—144.
Smart & Amar 2018 Smart, J, & Amar, A. 2018. Diversionary feeding as a means of reducing raptor predation at seabird breeding colonies. Journal for Nature Conservation 46 48—55.
Smith & Morgan 2005 Smith, J. & Morgan, K. 2005. An assessment of Seabird Bycatch in longline and net fisheries in British Columbia. Technical Report Series Report No. 401. Canadian Wildlife Service.
Snow & Perrins 1998 Snow, D.W. & Perrins, C.M. 1998. The Birds of the Western Palearctic, Volume 1: Non-Passerines. Oxford University Press, Oxford.
Sonntag & Hüppop 2005 Sonntag, N. & Hüppop, O. 2005. Snacks from the depth: summer and winter diet of Common Guillemots Urria aalgae around the Island of Heligoland. Atlantic Seabirds 7 1—14.
Stanbury et al. 2024 Stanbury, A.J., Burns, F., Aebischer, N.J., Baker, H., Balmer, D.E., Brown, A., Dunn, T.E., Lindley, P., Murphy, M., Noble, G., Owens, R. & Quinn, L. 2024. The status of the UK’s breeding seabirds: an addendum to the fifth Birds of Conservation Concern in the United Kingdom, Channel Islands and Isle of Man and second IUCN Red List assessment of extinction risk for Great Britain. British Birds 117 : 471—487.
Stienen et al. 1998 Stienen, E.W.M., Jonard, A. & Brenninkmeijer, A. 1998. Tern trapping along the Senegalese coast. Sula 12 19—26
Stienen 2006 Stienen, E. 2006. Living with gulls trading off food and predation in the Sandwich Tern Sterna sandvicensis. Alterra Stubbings et al. 2017 Stubbings, E.M., Büche, B.I., Riordan, J.A., Moss, J. & Wood, M.J. 2017. Seabird monitoring on Skomer Island in 2017. Unpublished JNCC Report, Joint Nature Conservation Committee, Peterborough.
Suddaby & Ratcliffe 1997 Suddaby, D. & Ratcliffe, N. 1997. The effects of fluctuating food availability on breeding Arctic Terns (Sterna paradisaea). The Auk 114 524—530
In text ref. Reference
Swann 2002 Swann, R.L. 2002. Canna Seabird Studies 2001. JNCC, Peterborough. Swann et al. 2008 Swann, R.L., Harris, M.P. & Aiton, D.G. 2008 The diet of European shag Phalacrocorax aristotelis black-legged kittiwake Rissa tridactyla and common guillemot Uria aalge on Canna during the chick-rearing period 1981—2007. Seabird Journal 21 : 44—54.
Swann et al. 2016 Swann, R.L., Aiton, D.G., Call, A., Foster, S., Graham, A., Graham, K. & Young, A. 2016. Canna seabird studies 2015. JNCC, Peterborough.
Swann et al. 2021 Swann, R.L., Aiton, D.G., Call, A., Foster, S., Graham, A., Graham, K. & Young, A. 2021. Canna seabird studies 2021. Unpublished JNCC Report. Joint Nature Conservation Committee, Peterborough. Syposz et al. 2018 Syposz, M., Gonçalves, F., Carty, M., Hoppitt, W. & Manco, F. 2018. Factors influencing Manx Shearwater grounding on the west coast of Scotland. Ibis 160 846—854.
Tavecchia et al. 2006 Tavecchia, G., Baccetti, N. & Serra, L. 2006. Modelling survival and movement probability of Little Tern Sterna albifrons at a post-breeding moulting site: the effect of the colony of origin. In: Boere, G., Galbraith, C. & Stroud, D. (eds). Waterbirds around the world. The Stationary Office, Edinburgh, UK. Taverner 1970 Taverner, H. 1970. Mediterranean Gulls nesting in Hampshire. British Birds 63 67—79.
Taylor 1983 Taylor, I.R. 1983. Effect of wind on the foraging behaviour of Common and Sandwich Terns. Ornis Scandinavica 14 : 90—96.
Taylor et al. 2012 Taylor, C.J., Boyle, D., Perrins, C.M. & Kipling, R. 2012. Seabird monitoring on Skomer Island in 2012. Unpublished JNCC Report, Joint Nature Conservation Committee, Peterborough. Thaxter et al. 2018 Thaxter, C.B., Ross-Smith, V.H., Bouten, W., Masden, E.A., Clark, N.A., Conway, G.J., Barber, L., Clewley, G.D. & Burton, N.H. 2018. Dodging the blades: new insights into three-dimensional space use of offshore wind farms by lesser blackbacked gulls Larus fuscus. Marine Ecology Progress Series 587 247—253.
Thaxter et al. 2019 Thaxter, C.B., Ross-Smith, V.H., Bouten, W., Clark, N.A., Conway, G.J., Masden, E.A., Clewley, G.D., Barber, L.J. & Burton, N.H. 2019. Avian vulnerability to wind farm collision through the year: Insights from lesser black-backed gulls (Larus fuscus) tracked from multiple breeding colonies. Journal of Applied Ecology 56 : 2410—2422.
Thomas 1993 Thomas, G.E. 1993. Estimating annual total heron population counts. Appl. Statistics 42 473—486.
Thorup et al. 2014 Thorup, S.H., Jensen, J-K., Petersen, K.T. & Kasper, D.B. 2014. Færøsk Trækfugleatlas. The Faroese Bird Migration Atlas. Faroe University Press, Tórshavn.
Tremlett et al. 2024 Tremlett, C.J., Morley, N. & Wilson, L.J. 2024. UK seabird colony counts in 2023 following the 2021—22 outbreak of Highly Pathogenic Avian Influenza. RSPB Research Report No. 76. RSPB Centre for Conservation Science, RSPB, The Lodge, Sandy, Bedfordshire.
Trevail et al. 2019 Trevail, A.M., Green, J.A., Sharples, J., Polton, J.A., Miller, P.I., Daunt, F., Owen, E., Bolton, M., Colhoun, K., Newton, S., Robertson, G. & Patrick, S.C. 2019. Environmental heterogeneity decreases reproductive success via effects on foraging behaviour. Proceedings of the Royal Society B 286 20190795 Tucker & Heath 1994 Tucker, G.M. & Heath, M.F. 1994. Birds in Europe: their conservation status. BirdLife International, Cambridge, U.K. Underwood & Stowe 1984 Underwood, L.A. & Stowe, T.J. 1984. Massive wreck of seabirds in eastern Britain, 1983. Bird Study 31 79—88. Urban et al. 1986 Urban, E.K., Fry, C.H. & Keith, S. 1986. The Birds of Africa, Volume II. Academic Press, London. van Bemmelen et al. 2021 van Bemmelen, R.S., Schekkerman, H., Hin, V., Pot, M.T., Janssen, K., Ganter, B., Rösner, H.U. & Tulp, I. 2021. Heavy decline of the largest European Arctic Skua Stercorarius parasiticus colony: interacting effects of food shortage and predation. Bird Study 68 : 88—99. van Bemmelen et al. 2024 van Bemmelen, R.S., Moe, B., Schekkerman, Are Hansen, S., Snell, K.R.S., Humphreys, E.M., Mäntylä, E. Hallgrimsson, G.T., Gilg, O., Ehrich, D., Calladine, J., Hammer, S., Harris, S.J., Lang, J., Vignisson, S.R., Kolbeinsson, Y., Nuotio, K., Sillanpää, M., Sittler, B., Sokolov, A., Klaassen, R,H.G., Phillips, R.A. & Tulp, I.A. 2024. Synchronous timing of return to breeding sites in a long-distance migratory seabird with ocean-scale variation in migration schedules. Movement Ecology 12 22
van de Pol et al. 2010 van de Pol, M., Ens, B.J., Heg, D., Brouwer, L., Krol, J., Maier, M., Exo, K.M., Oosterbeek, K., Lok, T., Eising, C.M. & Koffijberg, K. 2010. Do changes in the frequency, magnitude and timing of extreme climatic events threaten the population viability of coastal birds? Journal of Applied Ecology 47 : 720—730.
van Donk et al. 2017 van Donk, S., Camphuysen, C.J., Shamoun-Baranes, J., & van der Meer, J. 2017. The most common diet results in low reproduction in a generalist seabird. Ecology and Evolution 7 : 4620—4629.
Vanermen et al. 2015 Vanermen, N., Onkelinx, T., Courtens, W., van de Walle, M., Verstraete, H. & Stienen, E.W. 2015. Seabird avoidance and attraction at an offshore wind farm in the Belgian part of the North Sea. Hydrobiologia 756 51—61.
Van Franeker & Wattel 1982 Van Franeker, J.A. & Wattel, J. 1982. Geographical variation of the fulmar Fulmarus glacialis in the North Atlantic. Ardea 70 31—44.
Van Franeker et al. 2021 Van Franeker, J.A., Kühn, S., Anker-Nilssen, T., Edwards, E.W., Gallien, F., Guse, N., Kakkonen, J.E., Mallory, M.L., Miles, W., Olsen, K.O. & Pedersen, J. 2021. New tools to evaluate plastic ingestion by northern fulmars applied to North Sea monitoring data 2002—2018. Marine Pollution Bulletin 166 112246
Vigfusdottir et al. 2013 Vigfusdottir, F., Gunnarsson, T.G. & Gill, J.A. 2013. Annual and between-colony variation in productivity of Arctic Terns in West Iceland. Bird Study 60 289—297.
Votier et al. 2008 Votier, S.C., Bearhop, S., Fyfe, R., & Furness, R.W. 2008. Temporal and spatial variation in the diet of a marine top predator – links with commercial fisheries. Marine Ecology Progress Series 367 : 223—232.
Votier et al. 2005 Votier, S.C., Hatchwell, B.J., Beckerman, A., McCleery, R.H., Hunter, F.M., Pellatt, J., Trinder M. & Birkhead, T.R. 2005. Oil pollution and climate have wide-scale impacts on seabird demographics. Ecology Letters 8 1157—1164.

In text ref. Reference
Votier et al. 2004 Votier, S.C., Bearhop, S., Ratcliffe, N., Phillips, R.A. & Furness, R.W. 2004. Predation by great skuas at a large Shetland seabird colony. Journal of Applied Ecology 41 1117—1128.
Wakefield et al. 2013 Wakefield, E.D., Bodey T.W., Bearhop, S., Blackburn, J., Colhoun, K., Davies, R., Dwyer, R.G., Green, J.A., Grémillet, D., Jackson, A.L., Jessopp, M.J., Kane, A., Langston, R.H.W., Lescroël, A., Murray, S., Le Nuz, M., Patrick, S.C., Péron, C., Soanes, L.M., Wanless, S., Votier. S.C. & Hamer. K.C. 2013. Space Partitioning Without Territoriality in Gannets. Science Journal 341 : 68—70.
Walsh et al. 1995 Walsh, P.M., Halley, D.J., Harris, M.P., del Nevo, A., Sim, I.M.W. & Tasker, M.L. 1995. Seabird monitoring handbook for Britain and Ireland. Peterborough, JNCC/RSPB/ITE/Seabird Group.
Wanless et al. 2018 Wanless, S., Harris, M.P., Newell, M.A., Speakman, J.R. & Daunt, F. 2018. Community-wide decline in the occurrence of lesser sandeels Ammodytes marinus in seabird chick diets at a North Sea colony. Marine Ecology Progress Series 600 193—206.
Wanless et al. 2007 Wanless, S., Frederiksen, M., Daunt, F., Scott, B.E. & Harris, M.P. 2007. Black-legged kittiwakes as indicators of environmental change in the North Sea: Evidence from long-term studies. Progress in Oceanography 71 30—38.
Wanless et al. 2005 Wanless, S., Harris, M.P., Redman, P. & Speakman, J.R. 2005. Low energy values of fish as a probable cause of a major seabird breeding failure in the North Sea. Marine Ecology Progress Series 294 1—8.
Wanless et al. 2004 Wanless, S., Wright, P.J., Harris, M.P. & Elston, D.A. 2004. Evidence for decrease in size of lesser sandeels Ammodytes marinus in a North Sea aggregation over a 30-yr period. Marine Ecology Progress Series 279 237—246.
Wanless & Harris 1997 Wanless. S. & Harris, M. 1997. Phalacrocorax aristotelis Shag. BWP update 1 3—13.
Watanuki 1985 Watanuki, Y. 1985. Food of breeding Leach's storm-petrels (Oceanodroma leucorhoa). The Auk 102 : 884—886. Wernham et al. 2002 Wernham, C., Toms, M., Marchant, J.H., Clark, J., Siriwardena. & G., Baillie, S.R. 2002. The Migration Atlas: Movements of the Birds of Britain and Ireland. British Trust for Ornithology, Thetford.
Wilhelm et al. 2016 Wilhelm, S.I., Rail, J.F., Regular, P.M., Gjerdrum, C. & Robertson, G.J. 2016. Large-scale changes in abundance of breeding Herring Gulls (Larus argentatus) and Great Black-backed Gulls (Larus marinus) relative to reduced fishing activities in south-eastern Canada. Waterbirds 39 136—142.
Wilson et al. 2020 Wilson, L.J., Rendell-Read, S., Lock, L., Drewitt, A.L. & Bolton, M. 2020. Effectiveness of a five-year project of intensive, regional-scale, coordinated management for little terns Sternula albifrons across the major UK colonies. Journal for Nature Conservation 53 125779.
Wright & Wilde 2015 Wright, D. & Wilde, D. 2015. Cemlyn wardens report 2015. Unpublished NWWT Report, North Wales Wildlife Trust.
Žydelis et al. 2013 Žydelis, R., Small, C., & French, G. 2013. The incidental catch of seabirds in gillnet fisheries: A global review. Biological Conservation 162 76—88.
On behalf of the SMP Organiser and the SMP Steering Group, we would like to thank all surveyors for making the SMP the success it is today, and for your continued support as we take the programme forward. Unfortunately, space does not permit all surveyors to be acknowledged individually but we are very grateful for everyone's contributions.
We would also like to thank all the landowners who kindly allow surveyors access to carry out monitoring on their land, and the organisations who support the programme through staff time to carry out the surveys.
Furthermore, there are 24 organisations on the SMP Advisory Group (see page 2 for the full list), including those managing the monitoring work of the four SMP Key Sites of Canna, Fair Isle, the Isle of May and Skomer Island, the programme partners (BTO and JNCC) and the associate partner (RSPB). We are grateful to those representing the organisations on this group for helping to shape the programme and guide its future direction. We would also like to acknowledge those working behind the scenes at these organisations to enable various parts of the programme to function and to be improved and promoted. This includes Information Systems teams, Administrators, Communications teams, and data analysts and we thank you all!
In time, we aim to form a network of voluntary Regional Coordinators to join the wider BTO Regional Network to assist the SMP Organiser in local engagement and programme coordination. This is currently in the planning stage and the SMP Online system will need to be adapted to support the administrative aspect of this role. However, we already communicate with some of the most recent census coordinators who helped at a local level with the Seabirds Count project and with the existing BTO network. So thanks are also due to those who continue to, or have started to support the SMP through promotion and the sharing of local knowledge which is invaluable to the programme.