
The Desert Housing Report


Produced for Valley agents through the sponsorship and cooperation of GPSR and CDAR by Market Watch LLC ©2022 CDAR & GPSR. All rights reserved. Use and distribution by members only.
May 2024
The Desert Housing Report
May 2024
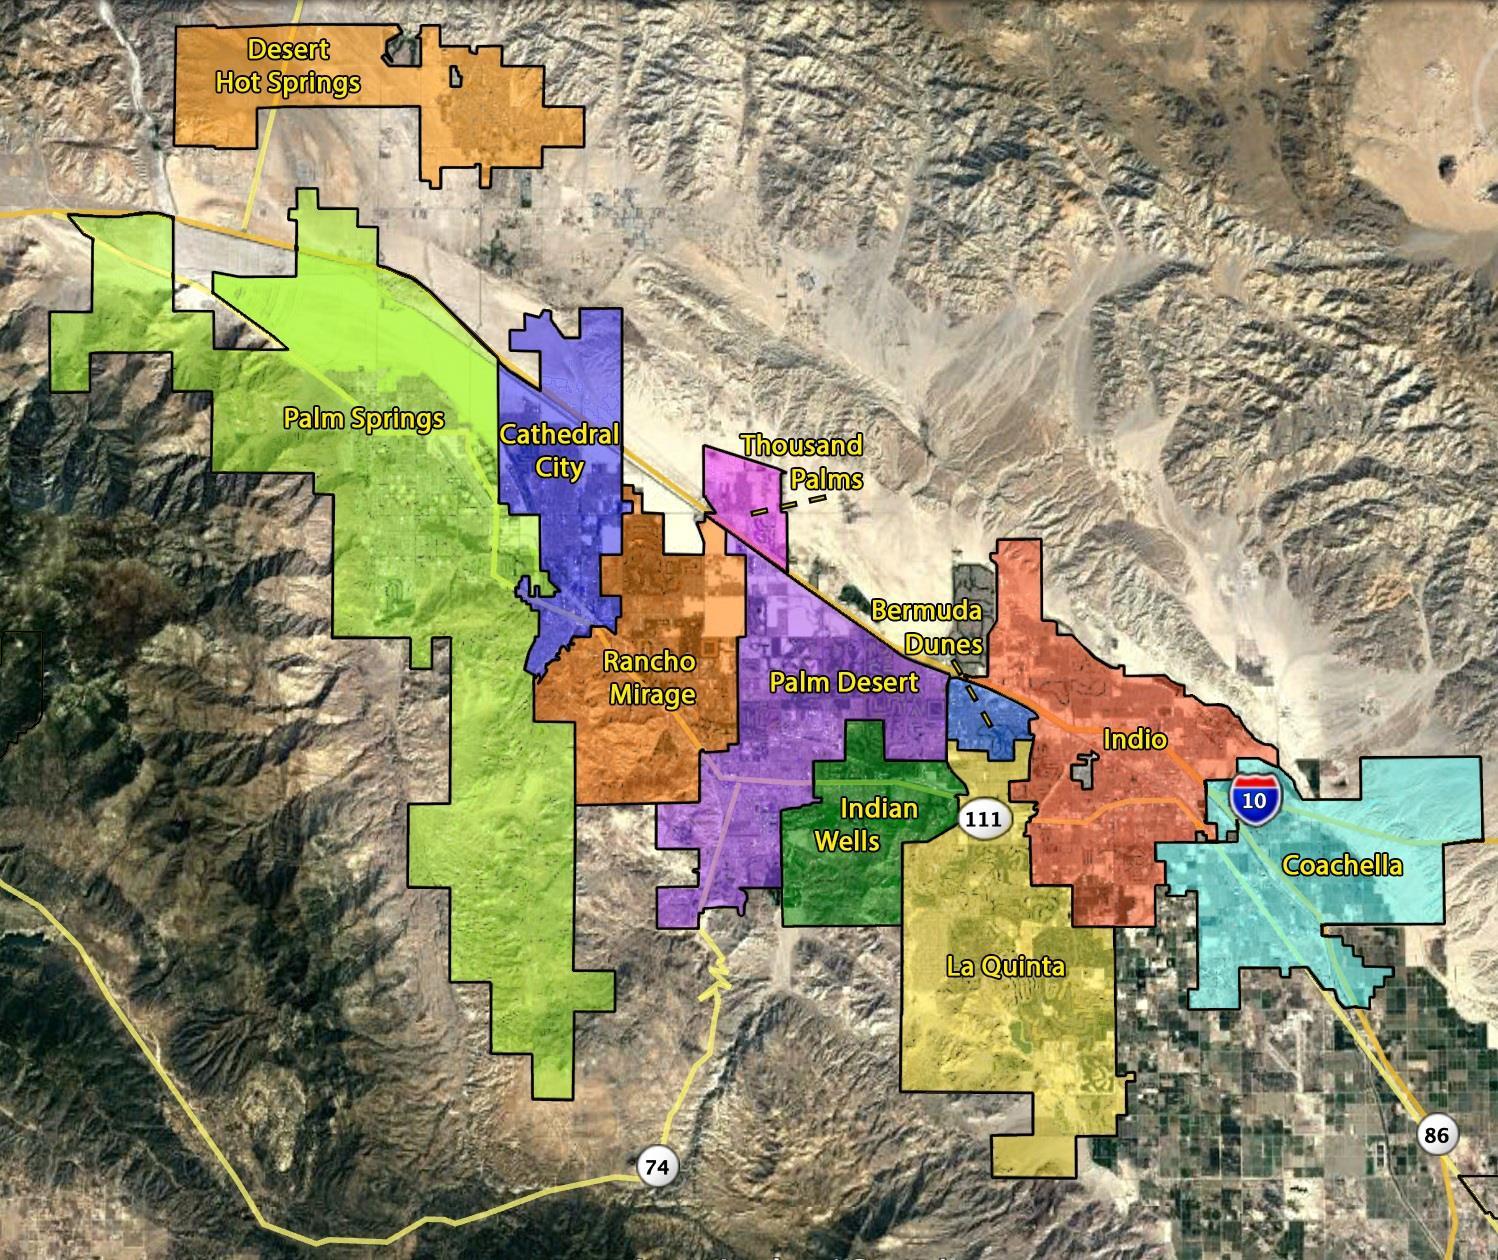
The Coachella Valley
Bermuda Dunes
Cathedral City
Coachella
Desert Hot Springs
Indian Wells
Indio
La Quinta
Palm Desert
Palm Springs
Rancho Mirage
Thousand Palms
Produced for Valley agents through the sponsorship and cooperation of GPSR and CDAR by Market Watch LLC ©2022 CDAR & GPSR. All rights reserved. Use and distribution by members only.
The Desert Housing Report
May 2024
Sales Recovery Chart
Coachella Valley
Sales Above Normal
The Sales Recovery Chart
This seasonally adjusted curve shows where current sales are as a percent of historic norms. The light blue area is when sales are below average, the light green area when they’re above average. What is normal is calculated from sales over the years - 2016, 2017, 2018 and 2019. For example, at the height of the pandemic in May of 2021, sales were 59.5% above the norm. Sales fell to 34.7% below normal by May of 2023, but then began to improve. Sales this month are 20.2% below normal which, as you can see, hasn’t changed much in the last three months. It appears the improvement in sales has halted at 20% below normal, no doubt because mortgage rates remain relatively high.
Produced for Valley agents through the sponsorship and cooperation of GPSR and CDAR by Market Watch LLC ©2022 CDAR & GPSR. All rights reserved. Use and distribution by members only.
Normal Sales
59.4% -34.8% -20.2% -50% -40% -30% -20% -10% 0% 10% 20% 30% 40% 50% 60% 1/1/20 1/1/21 1/1/22 1/1/23 1/1/24 1/1/25
Below Normal
The Desert Housing Report
May 2024
Summary
PRICES: The median price of a detached home in the Coachella Valley in May settled back slightly to $710,000 after reaching an all-time high last month. It’s up 3.6% year over year. The median attached price in the Valley ended May at $494,000, up 1.9%. Year over year price changes in detached homes range from a 14.1% gain in Coachella to a decline of 10% in Bermuda Dunes. Gains of average size attached homes range from 23.7% in Bermuda Dunes to -7% in Desert Hot Springs.
SALES: Three-month sales are slightly behind last year by fourteen units. The number this May was 763 units per month, compared to 777 units a year ago. Sales are now 20.2% below historic norms. Palm Desert has the highest unit sales at 172, followed by Palm Springs with 164. Four cities have higher sales compared to a year ago - Palm Springs, La Quinta, Desert Hot Springs and Indian Wells.
INVENTORY & “MONTHS OF SALES” RATIOS: On June 1st, Valley inventory was 2,610 units, which is the highest number in four years. While inventory has improved, this number continues to be about 1,000 units under what was normal before the pandemic. On June 1st , the Valley’s “months of sales” ratio was 4.2 months, which is 1.2 months more than last year. We are pleased to see that most of the cities continue to have ratios between three and four months.
DIM: At the end of May, the median number of “days in the market” in the Coachella Valley was 45 days, which is five days more than last year. The city of Coachella continues to have the lowest average selling time at 27 days. This is followed by Desert Hot Springs at 36 days and Indian Wells at 39. Rancho Mirage has the highest average selling time at 51 days.
PRICE DISCOUNTS/PREMIUMS: Currently, detached homes are selling at an average discount of 2.1% while attached are selling at 2.6%. Desert Hot Springs has the lowest selling discount at .2%, while the highest average discount is 3.4% in Rancho Mirage. In May, the percent of homes selling over list price was 15.3%. This is just marginally lower than last year.
Produced for Valley agents through the sponsorship and cooperation of GPSR and CDAR by Market Watch LLC ©2022 CDAR & GPSR. All rights reserved. Use and distribution by members only.
Prices
Desert
Produced for Valley agents through the sponsorship and cooperation of GPSR and CDAR by Market Watch LLC ©2022 CDAR & GPSR. All rights reserved. Use and distribution by members only.
The
Housing Report May 2024
The Desert Housing Report
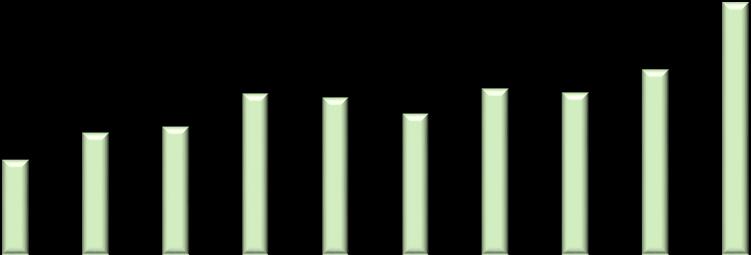
CoachellaValleyMedianDetachedHomePrice
$685,000 $710,000


Coachella Valley Median Detached Price
The median price of a detached home in the Coachella Valley in May settled back slightly to $710,000 after reaching an all-time high last month. It’s up 3.6% year over year. Prices usually peak in May or June due to seasonal patterns and we continue to believe that pattern will occur this year, too. However, as we mentioned in previous months, with inventory rising and sales still growing at a slower rate, we think supply and demand will soon begin to favor buyers.
May 2024
Produced for Valley agents through the sponsorship and cooperation of GPSR and CDAR by Market Watch LLC ©2022 CDAR & GPSR. All rights reserved. Use and distribution by members only.
$450,000
$150,000 $200,000 $250,000 $300,000 $350,000 $400,000
$500,000 $550,000 $600,000 $650,000 $700,000 $750,000 $800,000
Median Price 5.5% Growth 22 Year Chart
The Desert Housing Report
May 2024
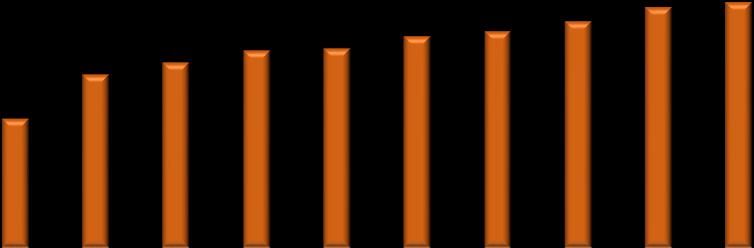
CoachellaValleyMedianAttachedHomePrice
$550,000
$500,000
$450,000
$350,000 $400,000
$300,000
$250,000
$200,000
$150,000

Coachella Valley Median Attached Price
The median attached price in the Valley ended May at $494,000, up 1.9%. As the chart clearly shows, the seasonal range of prices for attached homes is much larger than that of detached homes, and prices seem to be following the normal seasonal pattern. We expect three-month median prices to continue to advance for one or two more months.
Produced for Valley agents through the sponsorship and cooperation of GPSR and CDAR by Market Watch LLC ©2022 CDAR & GPSR. All rights reserved. Use and distribution by members only. $485,000 $494,000
Median Price 4.5% Growth 22 Year Chart
The Desert Housing Report
May 2024
Price of Each City's Average Size Detached Home
Price of Each City's Average Size Attached Home
Price of The Average Size City Home
These two tables display the price and price per square foot of the average size home in each city. The average home size is listed in the second column. The latest price is then compared to the price a year ago. It’s also compared to the all-time lows made in 2011. Year over year price changes range from a 14.1% gain in Coachella to a decline of 10% in Bermuda Dunes. Gains of average size attached homes range from 23.7% in Bermuda Dunes to -7% in Desert Hot Springs.
Produced for Valley agents through the sponsorship and cooperation of GPSR and CDAR by Market Watch LLC ©2022 CDAR & GPSR. All rights reserved. Use and distribution by members only. City Avg. Size Home Pr. per sq/ft Price of Avg. Size Home Price One Year Ago 12 Month Change 2011-12 Price Low %From Low Coachella 1,700 $281.28 $478,176 $419,118 14.1% $111,367 329.4% Indian Wells 3,450 $533.23 $1,839,644 $1,617,395 13.7% $666,885 175.9% Rancho Mirage 3,175 $440.72 $1,399,270 $1,328,452 5.3% $506,317 176.4% Cathedral City 1,800 $328.71 $591,678 $565,767 4.6% $153,216 286.2% La Quinta 2,550 $406.65 $1,036,958 $1,004,930 3.2% $318,164 225.9% Palm Springs 2,175 $589.20 $1,281,510 $1,242,349 3.2% $323,879 295.7% Desert Hot Springs 1,600 $260.68 $417,080 $405,616 2.8% $86,656 381.3% Palm Desert 2,200 $344.18 $757,196 $746,603 1.4% $302,302 150.5% Indio 2,000 $287.01 $574,020 $566,020 1.4% $156,340 267.2% Bermuda Dunes 2,500 $291.67 $729,175 $809,925 -10.0% $239,325 204.7%
City Avg. Size Home Pr. per sq/ft Price of Avg. Size Home Price One Year Ago 12 Month Change 2011-12 Price Low % From Low Bermuda Dunes 1,450 $287.11 $416,310 $336,676 23.7% $89,117 367.1% Indio 1,050 $294.02 $308,721 $282,560 9.3% $56,396 447.4% La Quinta 1,750 $402.99 $705,233 $651,595 8.2% $247,713 184.7% Palm Desert 1,600 $340.63 $545,000 $531,064 2.6% $197,896 175.4% Rancho Mirage 1,775 $336.42 $597,146 $609,198 -2.0% $211,030 183.0% Palm Springs 1,250 $360.68 $450,844 $463,600 -2.8% $129,788 247.4% Cathedral City 1,250 $264.39 $330,488 $344,888 -4.2% $80,544 310.3% Indian Wells 1,950 $382.40 $745,680 $790,277 -5.6% $259,126 187.8% Desert Hot Springs 750 $187.61 $140,708 $151,328 -7.0% $16,013 778.7%
Unit and Dollar Sales
The Desert Housing Report May
Produced for Valley agents through the sponsorship and cooperation of GPSR and CDAR by Market Watch LLC ©2022 CDAR & GPSR. All rights reserved. Use and distribution by members only.
2024
The Desert Housing Report
May 2024
Detached,AttachedandTotalSales

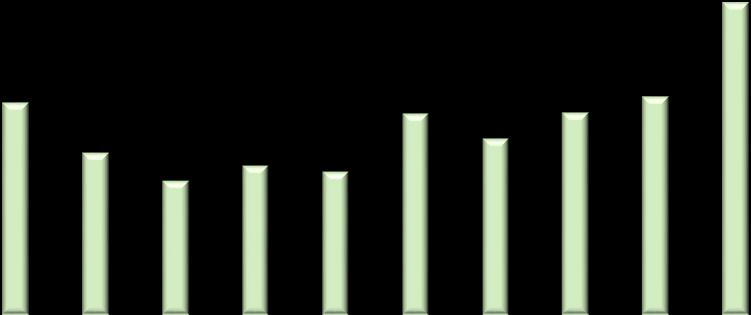
Monthly Sales – Three Month Average
Three-month sales are slightly behind last year by fourteen units. The number this May was 763 units per month, compared to 777 units a year ago. Because of seasonality, it's difficult to determine where sales stand on a historical basis. The first chart in this report was designed to help distinguish seasonal changes from real ones. It shows that sales are now 20.2% below historic norms.
Produced for Valley agents through the sponsorship and cooperation of GPSR and CDAR by Market Watch LLC ©2022 CDAR & GPSR. All rights reserved. Use and distribution by members only. 523 514 253 248 777 763 0 200 400 600 800 1,000 1,200 1,400 1/1/19 7/1/19 1/1/20 7/1/20 1/1/21 7/1/21 1/1/22 7/1/22 1/1/23 7/1/23 1/1/24 7/1/24 1/1/25 Units per month
3 month average Detached Attached Total
The Desert Housing Report
May 2024
Home Salesby City
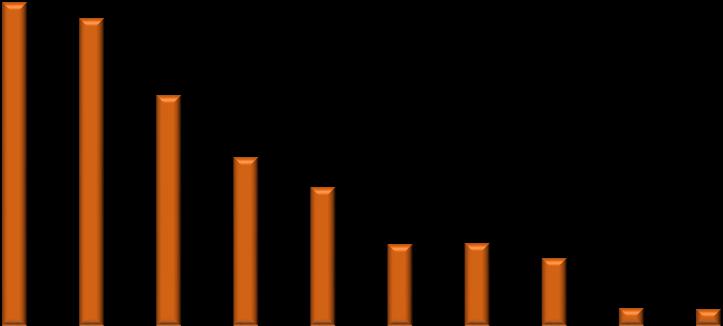


Home Sales by City
Sales by city are now ranked left to right by highest average unit sales. Palm Desert has the highest unit sales at 172, followed by Palm Springs with 164. Four cities have higher sales compared to a year ago - Palm Springs, La Quinta, Desert Hot Springs and Indian Wells. Most of the other cities have sales comparable to year ago levels.
Produced for Valley agents through the sponsorship and cooperation of GPSR and CDAR by Market Watch LLC ©2022 CDAR & GPSR. All rights reserved. Use and distribution by members only. 172 164 123 90 74 43 44 36 9 9 179 156 122 99 75 49 42 29 9 15 0 20 40 60 80 100 120 140 160 180 200
Units per Month
3 month average May Year Ago
Palm Desert Palm Springs La Quinta Indio Rancho Mirage Cathedral City
Desert Hot Springs Indian
Wells
Bermuda Dunes Coachella
The Desert Housing Report
May 2024
Salesby PriceBracket


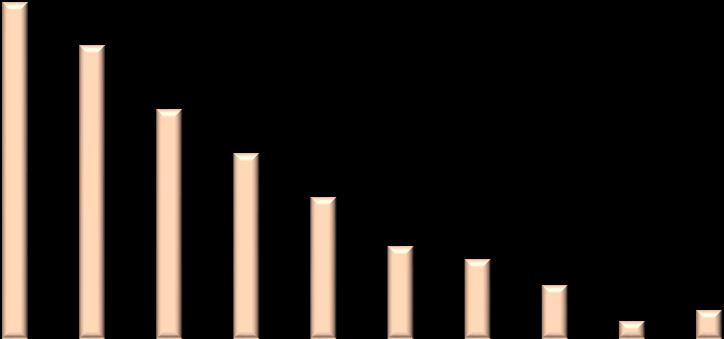
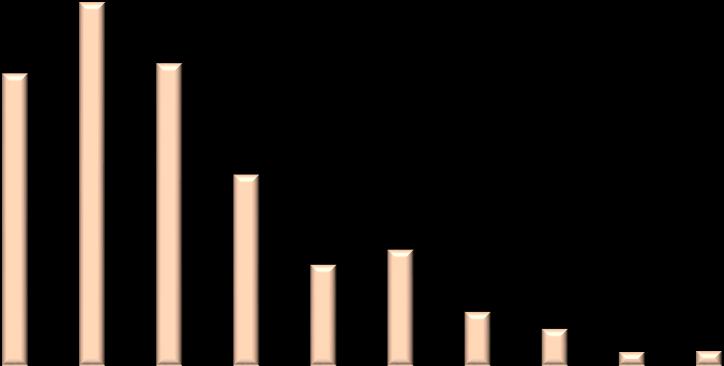
Home Sales by Price Range
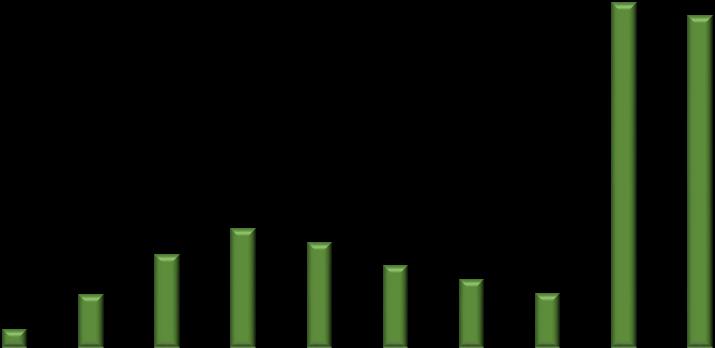
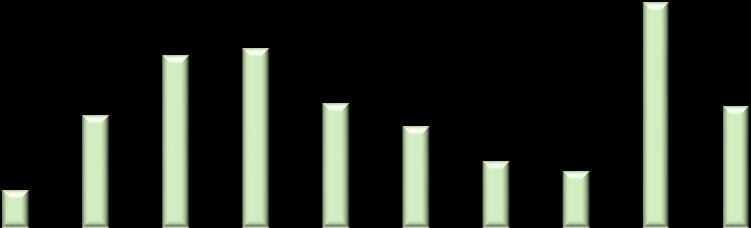
We've changed the price brackets to reflect the price increases of the last few years. The lowest bracket is now $300,000 and there are now two brackets over $1,000,000. The largest sale increase continue to be in homes priced over $1,000,000. Most of the brackets show comparable sales to a year ago except in homes under $500,000. This is positive since it shows the housing market is well balanced in most price ranges.
Produced for Valley agents through the sponsorship and cooperation of GPSR and CDAR by Market Watch LLC ©2022 CDAR & GPSR. All rights reserved. Use and distribution by members only. 41 81 112 118 89 60 44 31 136 51 40 92 135 112 79 72 40 35 122 48 0 20 40 60 80 100 120 140 160 <$300K $300K$399K $400K$499K $500K$599K $600K$699K $700K$799K $800K$899K $900K$999K $1M$1.999M >=$2M Units per Month
3 month average May Year Ago
The Desert Housing Report
May 2024
CoachellaValleyDollarSales

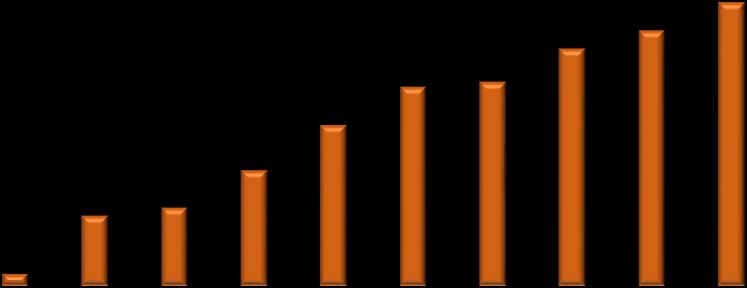
Coachella Valley Dollar Sales (all homes)
This chart graphs dollar sales, averaged over three months, of all Coachella Valley home sales. The scale on the left is in millions of dollars. It shows the same seasonal pattern as the chart of three-month unit sales, except the relative highs and lows are different due to price changes over time. Dollar sales in May were $689 million, which is 1.5% higher than last year.
$679 $689
$100 $200 $300 $400 $500 $600 $700 $800 $900 $1,000 1/1/19
1/1/20 7/1/20 1/1/21 7/1/21 1/1/22 7/1/22 1/1/23 7/1/23 1/1/24 7/1/24 1/1/25 x
$0
7/1/19
Millions
Produced for Valley agents through the sponsorship and cooperation of GPSR and CDAR by Market Watch LLC ©2022 CDAR & GPSR. All rights reserved. Use and distribution by members only. New
The Desert Housing Report
May 2024
New

DollarSalesby City May Year


Ago
Home Sales by City
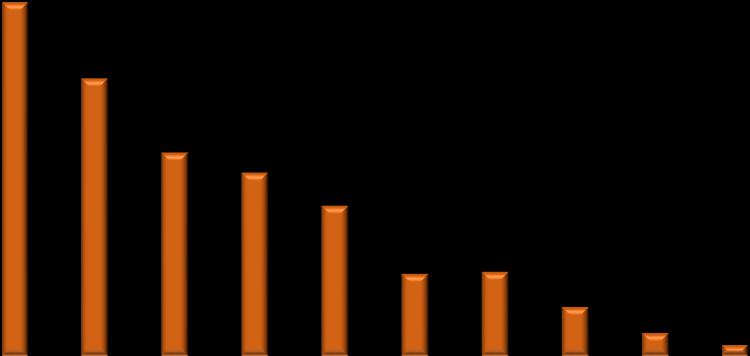
On this graph, cities are ranked left to right by greatest dollar sales. Some of the cities, like Rancho Mirage and Indian Wells, rank higher than their unit sales because of the effect of their higher priced homes. Since revenue depends on dollar sales more than unit sales, the numbers in this chart are better proxies for “revenue” than unit sales.
$153 $141 $138 $93 $63 $51 $23 $18 $5 $4 $137 $170 $142 $89 $47 $54 $25 $17 $7 $7 $0 $20 $40 $60 $80 $100 $120 $140 $160 $180 Palm Springs La Quinta Palm Desert Rancho Mirage Indian Wells Indio Cathedral City Desert Hot Springs Bermuda Dunes Coachella Millions per Month
Produced for Valley agents through the sponsorship and cooperation of GPSR and CDAR by Market Watch LLC ©2022 CDAR & GPSR. All rights reserved. Use and distribution by members only.
The Desert Housing Report May 2024
DollarSalesby PriceBracket


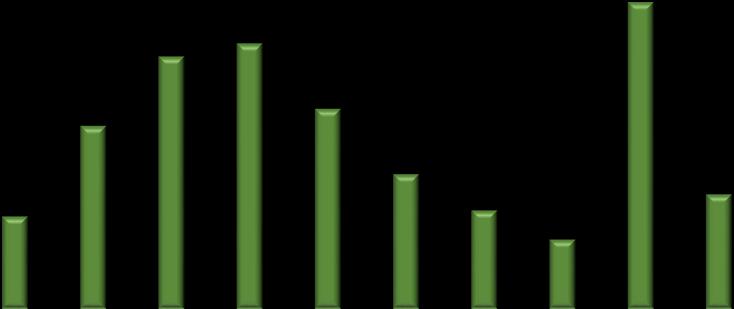
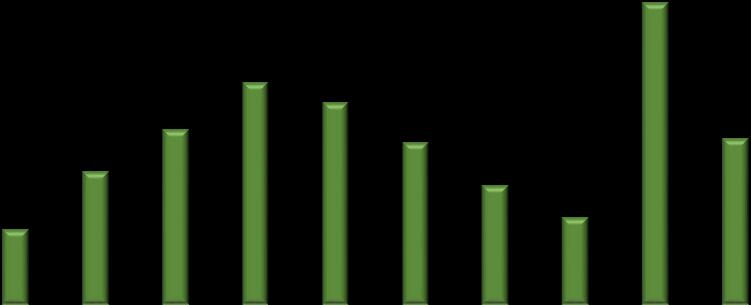
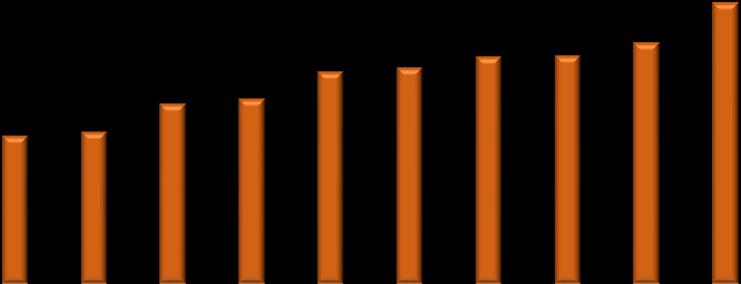
Home Sales by Price Range
This chart of dollar sales by price bracket shows a different pattern than unit sales by price bracket in the earlier chart. The large amounts in the two-million dollar price brackets are accentuated more than the unit sales chart. In fact, dollar sales in these two brackets now account for 50% of all dollar sales in the Coachella Valley.
$10 $29 $50 $65 $57 $45 $37 $29 $187 $180 $10 $33 $61 $61 $51 $54 $34 $33 $168 $190 $0 $20 $40 $60 $80 $100 $120 $140 $160 $180 $200 <$300K $300K$399K $400K$499K $500K$599K $600K$699K $700K$799K $800K$899K $900K$999K $1M$1.999M >=$2M Millions per Month
May Year Ago
Produced for Valley agents through the sponsorship and cooperation of GPSR and CDAR by Market Watch LLC ©2022 CDAR & GPSR. All rights reserved. Use and distribution by members only. New
Inventory & “Months of Sales” Ratios
The Desert Housing Report May 2024 Produced for Valley agents through the sponsorship and cooperation of GPSR and CDAR by Market Watch LLC ©2022 CDAR & GPSR. All rights reserved. Use and distribution by members only.
The Desert Housing Report
May 2024

Coachella Valley Total Inventory
On June 1st , Valley inventory was 2,610 units, which is the highest number in four years. While inventory has improved, this number continues to be about 1,000 units under what was normal before the pandemic. The seasonal pattern now suggests that inventory will begin to decline as we enter the summer months. The key will be how much it declines.
Produced for Valley agents through the sponsorship and cooperation of GPSR and CDAR by Market Watch LLC ©2022 CDAR & GPSR. All rights reserved. Use and distribution by members only. 1,898 2,610 0 500 1,000 1,500 2,000 2,500 3,000 3,500 4,000 4,500 1/1/19 7/1/19 1/1/20 7/1/20 1/1/21 7/1/21 1/1/22 7/1/22 1/1/23 7/1/23 1/1/24 7/1/24 1/1/25
Units
Coachella Valley HousingInventory (all homes)
The Desert Housing Report
Inventory by City


Inventory by City
This chart ranks Coachella Valley cities left to right by highest number of homes for sale. The dark colored bars are current listings, while the lighter colored bars are last year’s number. This chart helps agents know what cities have homeowners with the greatest selling interest and how it compares to last year.
648 509 372 336 275 151 155 90 43 21 464 368 281 215 197 116 132 62 35 21 0 100 200 300 400 500 600 700 Palm Springs Palm Desert La Quinta Indio Rancho Mirage Cathedral City Desert Hot Springs Indian Wells Bermuda Dunes Coachella Units
Ago
6/1/2024 Year
May 2024 Produced for Valley agents through the sponsorship and cooperation of GPSR and CDAR by Market Watch LLC ©2022 CDAR & GPSR. All rights reserved. Use and distribution by members only. New
The Desert Housing Report
Inventory by Price Bracket


6/1/2024 Year Ago
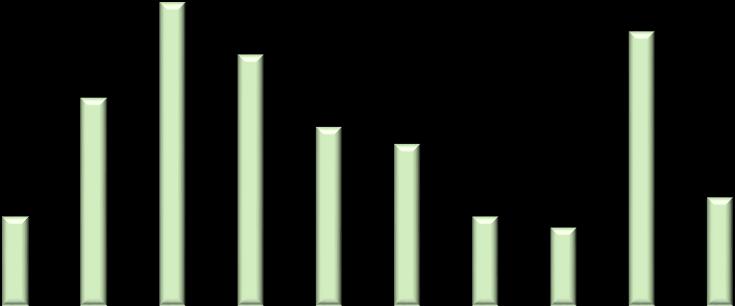
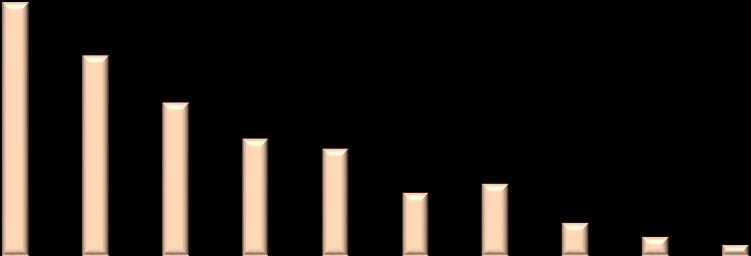
Inventory by Price Bracket
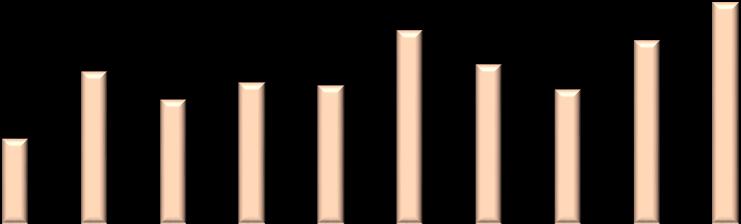
This chart shows the number of homes selling in the different price brackets. Current numbers, shown by the dark colored bars, are compared to last year’s numbers, shown by the lighter colored bars. The price brackets now include the two, new brackets of homes priced over $1,000,000. This chart helps locate what price brackets might be responsible for the growth or contraction of inventory.
120 212 278 352 321 258 189 139 478 263 60 178 273 284 197 161 105 90 357 193 0 100 200 300 400 500 600 <$300K $300K$399K $400K$499K $500K$599K $600K$699K $700K$799K $800K$899K $900K$999K $1M$1.999M >$2M Units
Produced for Valley agents through the sponsorship and cooperation of GPSR and CDAR by Market Watch LLC ©2022 CDAR & GPSR. All rights reserved. Use and distribution by members only. New
May 2024
The Desert Housing Report
May 2024
CoachellaValley"MonthsofSales"Ratio (based on average 12 month sales)

Regional “Months of Sales” Ratio
On June 1st , the Valley’s “months of sales” ratio was 4.2 months, which is 1.2 months more than last year. As you can see from the chart, this fundamental ratio, which measures supply and demand, is now back to pre-pandemic levels. Even though inventory is still relatively low, the low sales numbers keep supply and demand in balance. This is one major reason why home prices have remained stable over the last twelve months.
Produced for Valley agents through the sponsorship and cooperation of GPSR and CDAR by Market Watch LLC ©2022 CDAR & GPSR. All rights reserved. Use and distribution by members only. 3.0 4.2 0.0 0.5 1.0 1.5 2.0 2.5 3.0 3.5 4.0 4.5 5.0 5.5 6.0 1/1/19 7/1/19 1/1/20 7/1/20 1/1/21 7/1/21 1/1/22 7/1/22 1/1/23 7/1/23 1/1/24 7/1/24 1/1/25 Months
The Desert Housing Report
May 2024
"MonthsofSales"by City


The “Months of Sales” Ratio by City
This chart ranks cities left to right by smallest number of “months of sales.” We are pleased to see that most of the cities continue to have ratios between three and four months. The sales and inventory in the ratios includes both attached and detached homes. Since “months of sales” is really the supply-demand equation for housing, it shows if the housing market is balanced. This consistency is a good sign.
Produced for Valley agents through the sponsorship and cooperation of GPSR and CDAR by Market Watch LLC ©2022 CDAR & GPSR. All rights reserved. Use and distribution by members only. 2.4 2.5 3.0 3.0 3.5 3.5 3.7 3.7 4.0 4.6 1.4 2.5 2.0 2.3 2.3 3.2 2.6 2.2 3.0 3.6 0.0 1.0 2.0 3.0 4.0 5.0 6.0
Months
Coachella Indian Wells Palm Desert La Quinta Cathedral City Desert Hot Springs Rancho Mirage Indio Palm Springs Bermuda Dunes
6/1/2024 Year Ago
The Desert Housing Report
"MonthsofSales"by PriceBracket


6/1/2024 Year Ago
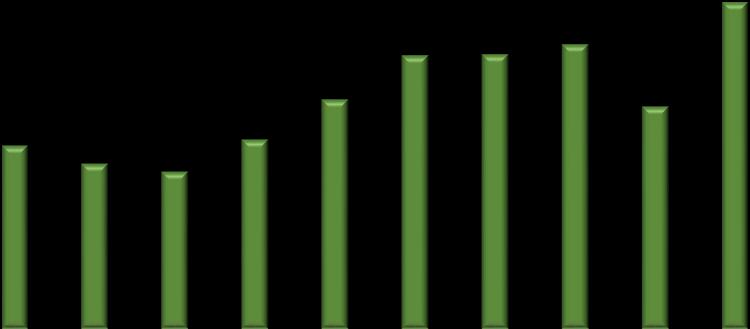
The “Months of Sales” Ratio by Price Bracket
This chart shows “months of sales” by price bracket. We continue to see an increase in year over year ratios of homes priced between $600,000 and a million dollars. The sales and inventory in the ratios includes both attached and detached homes. Since “months of sales” is really the supply-demand equation for housing, this increase shows the supply side of the market in these brackets is increasing.
Produced for Valley agents through the sponsorship and cooperation of GPSR and CDAR by Market Watch LLC ©2022 CDAR & GPSR. All rights reserved. Use and distribution by members only.
May 2024
2.9 2.6 2.5 3.0 3.6 4.3 4.3 4.5 3.5 5.2 1.5 1.9 2.0 2.5 2.5 2.2 2.6 2.6 2.9 4.0 0.0 1.0 2.0 3.0 4.0 5.0 6.0 <$300K $300K$399K $400K$499K $500K$599K $600K$699K $700K$799K $800K$899K $900K$999K $1M$1.999M >$2M Units
DIM & Price
The Desert Housing Report May 2024 Produced for Valley agents through the sponsorship and cooperation of GPSR and CDAR by Market Watch LLC ©2022 CDAR & GPSR. All rights reserved. Use and distribution by members only.
Premium/Discount
The Desert Housing Report
May 2024
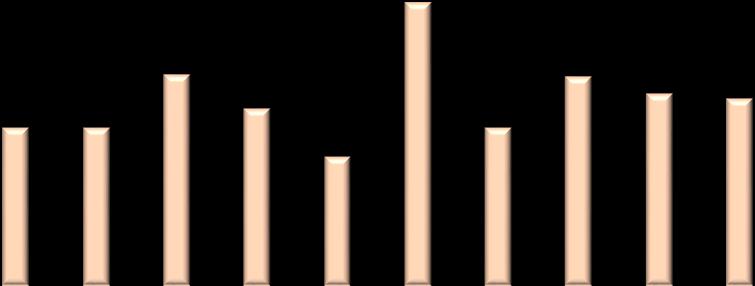
MedianDIM Coachella Valley (all homes)

Regional “Days in the Market”
The median selling time in the region has been stable for the last three months. At the end of May, the median number of “days in the market” in the Coachella Valley was 45 days, which is five days more than last year. This includes both detached and attached homes. We continue to believe the median selling time will remain around current levels as we continue into the year.
Produced for Valley agents through the sponsorship and cooperation of GPSR and CDAR by Market Watch LLC ©2022 CDAR & GPSR. All rights reserved. Use and distribution by members only. 40 45 0 10 20 30 40 50 60 70 1/1/19 7/1/19 1/1/20 7/1/20 1/1/21 7/1/21 1/1/22 7/1/22 1/1/23 7/1/23 1/1/24 7/1/24 1/1/25 Days
The Desert Housing Report
May 2024
MedianDIM by City (all homes)


“Days in the Market” by City
This graph compares the medium number of “days in the market” in each city to their ratios a year ago. The number includes both detached and attached homes. We have sorted the cities left to right by lowest number of days. The city of Coachella continues to have the lowest average selling time at 27 days. This is followed by Desert Hot Springs at 36 days and Indian Wells at 39. Rancho Mirage has the highest average selling time at 51 days.
Produced for Valley agents through the sponsorship and cooperation of GPSR and CDAR by Market Watch LLC ©2022 CDAR & GPSR. All rights reserved. Use and distribution by members only. 27 36 39 41 42 44 45 47 50 51 33 33 44 37 27 59 33 44 40 39 0 10 20 30 40 50 60 70 80
Days
Coachella Desert Hot Springs Indian Wells Palm Springs Cathedral City Bermuda Dunes Palm Desert Indio La Quinta Rancho Mirage
May Last
Year
The Desert Housing Report
MedianDIM by PriceBracket(all homes)


“Days in the Market” by Price Bracket
This graph compares the medium number of “days in the market” by price bracket to the ratio a year ago. The number includes both detached and attached homes. It's important, when looking at these numbers, to notice if any price bracket has an abnormal number of days. A high number might show a slight market disruption in that price bracket.
Produced for Valley agents through the sponsorship and cooperation of GPSR and CDAR by Market Watch LLC ©2022 CDAR & GPSR. All rights reserved. Use and distribution by members only.
May 2024
New 44 47 37 47 45 47 49 42 42 51 30 36 43 39 37 41 43 45 38 37 0 10 20 30 40 50 60 70 80 <$300K $300K$399K $400K$499K $500K$599K $600K$699K $700K$799K $800K$899K $900K$999K $1M$1.999M >$2M Days
May Last Year
The Desert Housing Report
CoachellaValleyAveragePricePremium/Discount

Regional Price Premium/Discount
This graph charts the average price premium or discount of detached and attached homes selling in the region. Currently detached homes are selling at an average discount of 2.1% while attached are selling at 2.6%. We are always amazed to see how close the average price discounts are for both detached homes and condominiums. We also notice how the trends seem to move up and down together. Current discounts are in line with the pre-covid averages.
Produced for Valley agents through the sponsorship and cooperation of GPSR and CDAR by Market Watch LLC ©2022 CDAR & GPSR. All rights reserved. Use and distribution by members only.
May 2024
New 2.2% 2.1% -2.4% -2.6% -5.0% -4.0% -3.0% -2.0% -1.0% 0.0% 1.0% 2.0% 3.0% 4.0% 1/1/19 7/1/19 1/1/20 7/1/20 1/1/21 7/1/21 1/1/22 7/1/22 1/1/23 7/1/23 1/1/24 7/1/24 1/1/25
Detached Attached Discount Premium
The Desert Housing Report
May 2024
AverageSellingDiscountby City

Price Discount by City
This shows the average price discount for detached homes in each city to their ratios a year ago. We have sorted the cities left to right by lowest discount. Desert Hot Springs has the lowest selling discount at .2%, while the highest average discount is 3.4% in Rancho Mirage.
Produced for Valley agents through the sponsorship and cooperation of GPSR and CDAR by Market Watch LLC ©2022 CDAR & GPSR. All rights reserved. Use and distribution by members only. 0.2% 0.9% 1.0% 1.4% 2.0% 2.4% 2.5% 2.9% 3.1% 3.4% -0.7% 0.4% -1.1% -1.2% -2.6% -2.9% -2.9% -2.3% -2.7% -3.0% -4.0% -3.5% -3.0% -2.5% -2.0% -1.5% -1.0% -0.5% 0.0% 0.5%
Desert Hot Springs Coachella Cathedral City Indio Palm Desert La Quinta Indian Wells Bermuda Dunes
Palm Springs Rancho Mirage
May Year Ago
The Desert Housing Report
AverageSellingDiscountby PriceBracket


May Year Ago
Price Discount by Price Bracket
This chart shows the average price discount by price bracket throughout the region compared to the discount a year ago. The average includes both detached and attached homes. As a rule, the average price discount increases with higher priced homes.
Produced for Valley agents through the sponsorship and cooperation of GPSR and CDAR by Market Watch LLC ©2022 CDAR & GPSR. All rights reserved. Use and distribution by members only.
May 2024
3.1% 1.8% 1.4% 1.6% 1.8% 2.3% 2.3% 3.5% 2.8% 3.8% -2.6% -2.0% -1.7% -1.8% -1.8% -2.5% -2.2% -2.5% -2.7% -3.8% -4.5% -4.0% -3.5% -3.0% -2.5% -2.0% -1.5% -1.0% -0.5% 0.0% <$300K $300K$399K $400K$499K $500K$599K $600K$699K $700K$799K $800K$899K $900K$999K $1M$1.999M >$2M
The Desert Housing Report
May 2024
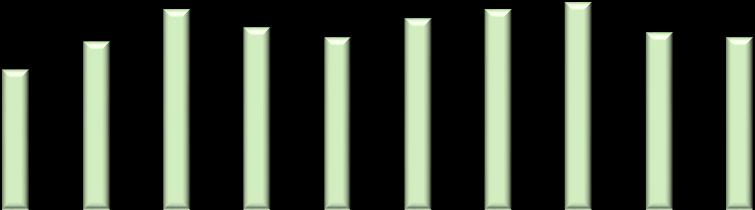
PercentHomesSellingOverList Price (all homes)
Percent Homes Selling Above List
This chart graphs the percentage of Valley homes that sold above list price over the last three months. In May, the percent of homes selling over list price was 15.3%. This is marginally lower than last year. As we said last month, we continue to expect the number of homes selling above list to remain approximately one out of seven.
Produced for Valley agents through the sponsorship and cooperation of GPSR and CDAR by Market Watch LLC ©2022 CDAR & GPSR. All rights reserved. Use and distribution by members only. 16.8% 15.3% 0% 10% 20% 30% 40% 50% 60% 70% 1/1/19 7/1/19 1/1/20 7/1/20 1/1/21 7/1/21 1/1/22 7/1/22 1/1/23 7/1/23 1/1/24 7/1/24 1/1/25
The Desert Housing Report May 2024
Explanation and Description of Market Watch’s Graphs and Calculations
Regional Numbers: For the purposes of this report, the Coachella Valley region consists of these eleven cities or CDPs – Bermuda Dunes, Cathedral City, the city of Coachella, Desert Hot Springs, Indian Wells, Indio, La Quinta, Palm Desert, Palm Springs, Rancho Mirage and Thousand Palms. Regional sales and regional inventory numbers are the sum of sales or inventory of these 11 cities averaged over some time interval – usually three or twelve months. The Coachella Valley median detached home price is the median price of sales of single-family residences over the prior three months in all 11 cities. The Coachella Valley Median Attached Price is the median price of sales of condos and townhomes over the past three months in all 11 cities
City Prices: Our city price tables display the median price per square foot as well as the price of the average size home of all detached or attached sales over the last three months (6 months for Indian Wells). The price of the average size home is determined as follows: the median price per sq. ft. is multiplied by the size of the average home in that city. The size of the average home is determined from the square feet of all sales in that city over the last twenty years, which is then rounded to the nearest 25 sq. ft.. The size of the average home is therefore constant month by month.
Sales: For cities, sales numbers are the sum of sales of SFR, Condos and townhomes We present two sales numbers – three-month average of sales and twelve-month averages The three-month average measures and shows the seasonal variations of the region These three-month averages should only be compared against the same three months of previous years. For example, one should never compare three-month sales in spring to that of the fall. The twelve-month average of sales takes out all seasonality and is very useful when trying to assess the long-term growth or contraction of sales in the region and at the city level. In our calculations every month is represented by sales over the preceding 31 days. This gives equal weight to each month.
Inventory and “Months of Sales”: Our inventory numbers are homes classified as “active” listings; we exclude listings called “active under contract ” We believe this is a more accurate measure of real supply since most “active under contract” listings will soon be closed sales. Remember sales and prices are accumulative while inventory is a momentary snapshot of inventory on a specific date. When we provide a monthly report for, say, the month of May, all sales and pricing are done using transactions through that and the previous two months. However, when we measure inventory at the end of May, it’s the inventory as of May 1st . Even though inventory May be labeled May inventory, it is the inventory on the 1st of the next month. Our inventory is the sum of both attached and detached homes
When calculating the “months of sales” ratio, we almost always use average sales over the last twelve months and not three months. If we do use three month sales, we indicate it. We use the classic “months of sales ratio”, which is inventory divided by sales, and not its inverse called the “absorption rate” since most people feel the ratio is much clearer and more easily understood.
Days in the Market and Sale Price Discount from List Price: These calculations are also the median value of the metrics reported from the MLS listing and are calculated over the last three months of transactions like price and sales This is done to help reduce random variation and movements
Call Out Numbers: The two numbers inserted in the charts are the most recent value(s) and the value(s) one year ago. Each number is connected to the point on the chart it refers to by a small thin line.
To contact Market Watch call Vic Cooper at 714-390-1418
Produced for Valley agents through the sponsorship and cooperation of GPSR and CDAR by Market Watch LLC ©2022 CDAR & GPSR. All rights reserved. Use and distribution by members only.