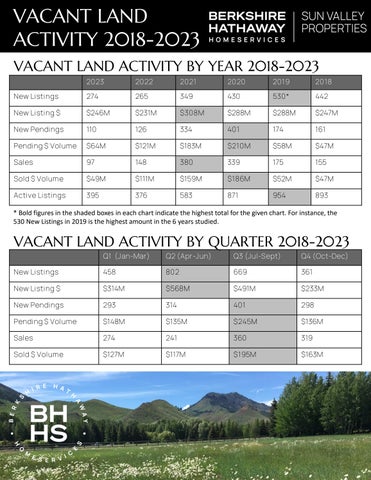

* Bold figures in the shaded boxes in each chart indicate the highest total for the given chart. For instance, the 530 New Listings in 2019 is the highest amount in the 6 years studied.


LAND
2018-2023 2023 2022 2021 2020 2019 2018 New Listings 274 265 349 430 530* 442 New Listing $ $246M $231M $308M $288M $288M $247M New Pendings 110 126 334 401 174 161 Pending $ Volume $64M $121M $183M $210M $58M $47M Sales 97 148 380 339 175 155 Sold $ Volume $49M $111M $159M $186M $52M $47M Active Listings 395 376 583 871 954 893 VACANT LAND
2018-2023 Q1 (Jan-Mar) Q2 (Apr-Jun) Q3 (Jul-Sept) Q4 (Oct-Dec) New Listings 458 802 669 361 New Listing $ $314M $568M $491M $233M New Pendings 293 314 401 298 Pending $ Volume $148M $135M $245M $136M Sales 274 241 360 319 Sold $ Volume $127M $117M $195M $163M
VACANT
ACTIVITY BY YEAR
ACTIVITY BY QUARTER
VACANT LAND ACTIVITY 2018-2023
VACANT LAND ACTIVITY BY QUARTER 2023
LAND
2022
LAND
2021 2023 Q1 2023 Q2 2023 Q3 2023 Q4 New Listings 36 82 104 52 New Listing $ $33M $78M $95M $39M New Pendings 16 21 43 30 Pending $ Volume $7M $6M $30M $21M Sales 13 24 32 28 Sold $ Volume $5M $7M $18M $19M 2022 Q1 2022 Q2 2022 Q3 2022 Q4 New Listings 67 89 76 33 New Listing $ $67M $85M $43M $37M New Pendings 47 43 21 15 Pending $ Volume $69M $27M $15M $10M Sales 47 49 31 21 Sold $ Volume $29M $38M $30M $13M 2021 Q1 2021 Q2 2021 Q3 2021 Q4 New Listings 90 114 112 33 New Listing $ $74M $109M $80M $45M New Pendings 145 91 58 40 Pending $ Volume $60M $51M $46M $26M Sales 133 146 60 41 Sold $ Volume $53M $47M $33M $26M
VACANT
ACTIVITY BY QUARTER
VACANT
ACTIVITY BY QUARTER

LAND
QUARTER 2019
VACANT LAND ACTIVITY BY QUARTER 2020 VACANT
ACTIVITY BY
LAND
2018 2020 Q1 2020 Q2 2020 Q3 2020 Q4 New Listings 87 103 174 66 New Listing $ $41M $68M $134M $45M New Pendings 33 64 171 133 Pending $ Volume $12M $33M $116M $48M Sales 29 41 136 133 Sold $ Volume $14M $10M $83M $78M 2019 Q1 2019 Q2 2019 Q3 2019 Q4 New Listings 87 234 107 102 New Listing $ $49M $144M $62M $32M New Pendings 24 50 59 41 Pending $ Volume $8M $12M $21M $18M Sales 22 42 59 52 Sold $ Volume $8M $9M $21M $14M 2018 Q1 2018 Q2 2018 Q3 2018 Q4 New Listings 91 180 96 75 New Listing $ $50M $84M $77M $35M New Pendings 28 45 49 39 Pending $ Volume $10M $6M $17M $13M Sales 30 39 42 44 Sold $ Volume $18M $6M $10M $13M
VACANT
ACTIVITY BY QUARTER

208.726.3411 info@bhhssunvalley.com www.bhhssunvalley.com WE DELIVER A BETTER REAL ESTATE EXPERIENCE.