Zero Waste

Annual Report | Fiscal Year 2022
ASU succeeds by creating programs and designing models that strengthen institutional sustainability.


Volunteers make a difference and contribute to the success of Zero Waste programs. Contents Overview 1 Mission statement 1 Introduction 1 Goals 1 Highlights 2 Approach 4 Diversion rate 4 Aversion rate 5 Waste streams deep dive 7 A closer look at specialty recycling 8 Waste makeup by location 9 Looking ahead 10
Zero Waste Annual Report | Fiscal Year 2022
Overview
Mission statement
Arizona State University’s Zero Waste department aims to create and implement programs to reach the university’s circular-resources goal and strengthen overall institutional sustainability by designing lasting, universal models that support ASU as a global leader in sustainable solid-waste management.

Introduction
The Zero Waste Annual Report for the Fiscal Year 2022 provides an overview of the solid-waste program at ASU from July 1, 2021, through June 30, 2022. The sustainability reporting boundaries for the university include the four ASU Phoenix metropolitan campuses: Downtown Phoenix, Polytechnic, Tempe and West. This report also includes ASU at Lake Havasu in the reporting boundaries.
Goals
The Zero Waste department is responsible for managing the outcomes of the circular-resource system goal ASU defines a circular-resource system as achieving zero waste by adapting the goods brought onto campus to maximize their use before returning them to the economy for the most productive use possible.
View the ASU Sustainability goals and vision webpage for a complete list of university goals.
Key commitments:
90% Waste diversion from landfill by 2025.
30% Waste aversion over the Fiscal Year 2008 by 2025.
Zero Waste Annual Report | Fiscal Year 2022 1
Collection GIS mapping and labeling
The Zero Waste department collected over 1,000 geographic information system data points for outdoor dual-litter bins, residence hall collection points, specialty collection zones, operational centralization areas and office breakroom kitchenettes. This information will help engage the campus population in new ways that enhance the awareness and accessibility of the university’s sustainability goals and resources.
Compost collection reaches offices

The Zero Waste department expanded the office kitchenette compost program in FY 2022 to university-wide deployment. Of the 395 kitchenettes mapped, 257 were identified as program candidates. More than 80 office leaders completed the Office Compost training and requested 83 bins within the first six months — an initial adoption rate of 3.2%. This has resulted in engaging 57 unique offices to divert an average of 75 pounds per week.
Engagement programs
The Zero Waste department continues to grow engagement programming with interactive activities for internal and external ASU partners throughout the year.
Current engagement programs include:
• Blue Bag sorts — 22 volunteers contributed 44 hours of support over eight events to divert almost 1,500 cubic feet of specialty recycling material.
• Ditch the Dumpster — Residential Hall students donated 29.9 tons back to the community during our annual donation program
• Greeks Trading Post — 129 students engaged in thrifting, generating 358.9 pounds of clothes donations.
• Green Games — ASU received the Rising Star award from the Pac-12 for sustainability and waste efforts during the 2021 football season. ASU achieved an 81.1% diversion rate for the football Green Game.
29.9 tons donated
Zero Waste Annual Report | Fiscal Year 2022 2
Highlights
Ditch the Dumpster
Highlights
• Reaching across the table — Participated in 43 tabling events and engaged 1,385 people in Zero Waste department messaging and programs.
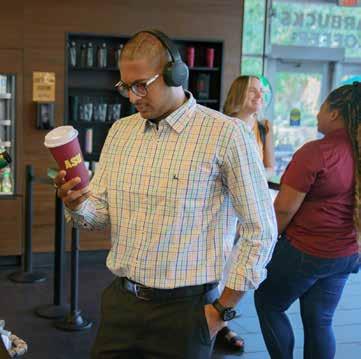
• Reusables at Starbucks — Partnered with Starbucks and Aramark, the university’s on-campus food service company, through the ASU-Starbucks Center for the Future of People and the Planet to increase reusables use on all campuses. Since the program launched in fall 2021 and through the end of FY 2021, more than 21,146 cups have been saved from landfill.
• Social media — The Zero Waste department had an average 30% growth in total followers across all social media accounts, mainly due to its new TikTok account. Engagement also grew on average by 3.7%, with Instagram making the largest contribution of 7.7%.

• Waste directory — The Zero Waste department launched a new waste directory to help the ASU community quickly find answers to what materials are recyclable and how to dispose of them properly. Since its launch, 861 unique visitors have generated 1,850 searches. The top 10 items searched included small batteries, ink and toner, plastic bag, food scraps, glass, pens and markers, laptop, CD/DVD/VHS, cardboard and vegetables.
Front-load monitoring expansion
The Zero Waste department piloted a dumpster-monitoring system to collect data in FY 2021 resulting in an initial 30% increase in service efficiency. After a full roll out, the impact of the improved data accuracy increased efficiency for costs and service demand by 9.8% for landfill and 19.5% for recycling.
Service requests
The Zero Waste operations teams completed 2,023 requests, greater than pre-pandemic levels.

Sustainability initiatives
The Zero Waste department supported student success and behavior change efforts, focusing on compost adoption, reusability and recycling participation. The completed learning outcomes from the following engagements inform innovative and human-centered program design:
• Food waste and composting study — Leveraging students’ consumption patterns in residential life engagement strategies.
• Single-use plastics assessment — Learns the extent of on-campus single-use plastics and pathways to reduce them.
• Sustainable consumption course — Partners with academic units to activate a “learning laboratory” through a curriculum to develop zero-waste interventions.
3
Zero Waste Annual Report | Fiscal Year 2022
Volunteers sort specialty materials for recycling.
Social media promotes engagement with targeted audiences.
Approach — Diversion
Diversion equation:
Tons recycled + Tons composted + Tons of surplus + Tons donated Tons landfilled + Tons recycled + Tons composted + Tons of surplus + Tons donated x 100
Diversion
The ASU Zero Waste department monitors and tracks all solid waste that leaves the university. The data in this report represents known tracking as of Sept. 1, 2022. The Zero Waste department gains more confidence each year in reporting as it seeks to eliminate gaps in data arising from university expansion, contract changes or programmatic shifts.
Diversion rate is an industry-standard term used to track waste-diversion efforts. Universities, government entities and private businesses use diversion to track outgoing waste, allowing ASU to compare itself with other institutions.
ASU diverts waste by sending post-consumer materials and goods outside the institution to be remanufactured or reused, including:
• Deliberate purchase of easily diverted goods.
• Donations.
• Recycling and composting.
• Sale of whole goods.
Diversion is a function of the material makeup of goods purchased, individual choices community members make when disposing of goods and the institution’s diversion systems.
The Zero Waste department tracks diversion each year to measure the percentage of the waste stream being recycled, composted, reused and donated and how ASU is moving closer to its 90% diversion goal.

ASU calculates diversion by tracking the percentage of material sent from ASU campuses to landfills and diverted from landfills through recycling, composting, donation or reuse.
Overall diversion made modest gains in FY 2022. However, overall waste — landfill and diverted — was up 31.3% from FY 2021 because:
• Downtown Phoenix campus landfill waste increased by 13.2%.
• Overall green waste fell by 7.1%.
• Improved diversion measurement from front-load recycling monitoring. ASU made gains from key streams: mixed recycling, donations, food waste and inert, pallets, fats, oils and greases — underscoring the crucial role of centralizing operations and building community partnerships to increase overall diversion.
Zero Waste Annual Report | Fiscal Year 2022 4
diversion rate in tons FY 2022 Diverted 3,895 tons 43% Landfilled 5,231 tons 57%
University
The ASU diversion rate for FY 2022 was 43%.
The Zero Waste refillable athletics cup helps decrease single-use plastics.
Approach — Aversion
Total Waste at ASU FY09–FY22
Aversion
ASU defines aversion as preventing waste from entering the institution and influencing how waste is circulated to reduce overall solid-waste output.
Aversion is a function of the durability of goods individuals choose when they purchase and dispose of goods and the institution’s systems to support repair, reuse and exchange.
The Zero Waste department tracks aversion year-to-year to see if the overall amount of waste produced through ASU educational, research and operational activities has reduced or increased compared to its 2008 baseline year.
Waste produced per person in pounds*
FTE students, faculty and staff
Downtown Phoenix, Lake Havasu, Polytechnic, Tempe and West FY 2008–FY 2022

Ditch the Dumpster supports ASU’s aversion goals. In FY 2022 ASU had a 20% aversion rate.
*Please
Zero Waste Annual Report | Fiscal Year 2022 5
1,000 2,000 3,000 4,000 5,000 6,000 7,000 8,000 9,000 10,000 F Y09 F Y10 F Y11 F Y12 F Y13 F Y14 F Y15 F Y16 F Y17 F Y18 F Y19 F Y20 F Y21 F Y22 Weight (Tons) Landfill Compost Commingled Other diversion Total waste if aversion goal is achieved
Weight (tons)50 100 150 200 250 300 F Y08 F Y09 F Y10 F Y11 F Y12 F Y13 F Y14 F Y15 F Y16 F Y17 F Y18 F Y19 F Y20 F Y21 F Y22
note a correction in the reported aversion rate for FY 2021. As previously published, the correct aversion rate for FY 2021 is 35%, not 38%. This is due to a data collection delay from the front-load monitoring technology, which provides high-quality data and more accurate insights into waste service.
Approach — Aversion
Aversion rate
FTE students, faculty and staff
Downtown Phoenix, Lake Havasu, Polytechnic, Tempe and West FY 2008–FY 2022
Total waste: 9,126 tons
Aversion is waste reduction and reuse. Departments and individuals can positively impact aversion in these ways:
Reduce: Purchase less. Be mindful of purchases and how items will be disposed.
Reuse: Choose reusable items over items that need to be landfilled or recycled.
The FY 2022 aversion rate* returned to pre-pandemic levels, suggesting in-person activities have returned to typical levels. However, with tools like Zoom and other technology, some in-person activities transitioned to a digital format. For example, the New Student Orientation Experience is now entirely online. With waste generation returning to pre-pandemic levels and the transition of some in-person activities to digital formats, the Zero Waste department believes that more actions are taking place.
The Zero Waste department provides waste data to the following reports:
• AASHE Sustainability Tracking, Assessment and Reporting System.
• ASU’s Sustainability Operations annual review.
• EPA Food Recovery Challenge.
• Pac-12 Zero Waste Challenge.
• The Times Higher Education World University Rankings.
The Zero Waste team presented material and information at the ASU Supplier Showcase.

Zero Waste Annual Report | Fiscal Year 2022 6
Waste (tons) Population 10,000 8,000 6,000 4,000 2,000 100,000 80,000 60,000 40,000 20,000 0 FY 2008 Waste Population FY 2022
Waste streams deep dive
Digging into the data
ASU collects different types of materials in the following streams. The Blue Bin commingle and scrap metal programs have had steady growth year-to-year.
ASU waste streams

Material category Waste stream description
Commingled Paper, aluminum, cardboard, glass and plastic.
Donations
Food waste
Donations collected during Ditch the Dumpster at move-out and throughout the year in residence halls.
Food waste, napkins and compostable food service items from athletics events and dining halls.
Green and yard waste Branches, grass clippings, palm fronds, plant trimmings, wood and yard waste.
Inert Concrete, sand and asphalt.
Landfill Municipal and operational solid waste sent to landfill.
Scrap metal
Specialty recycling
Scrap metals salvaged from HVAC upgrades, plumbing retrofits and other operational projects.
Items collected through specialty programming; the material breakdown is in the specialty recycling table.
Zero Waste Annual Report | Fiscal Year 2022 7
FY 2022 57% 19% 6% 11% 3% 1% 1% 2% Landfill Commingled Food waste Green waste Scrap metal Specialty recycling Donations Inert
Green games spark enthusiasm and spread the word about Zero Waste and recycling during gameday.
Waste streams deep dive
A closer look at specialty recycling
The specialty recycling stream makes up 1.07% of the total waste diverted from ASU and encompasses many programs and tracking systems.
The stream covers hazardous and difficult-to-recycle items, such as batteries, light bulbs and motor oil. It also includes items that cannot be recycled in the Blue Bin commingle program but can be recycled through other processes.
Some material streams in the chart are part of university operations, and others are influenced by students, faculty and staff’s personal purchasing choices.
The Zero Waste department provides a Waste Directory so users can find specialty-recycling options and learn how to decrease their use of single-use and difficult-to-recycle items when possible.
Specialty recycling in FY 2022
Zero Waste Annual Report | Fiscal Year 2022 8
Material category Weight (tons) Portion of the total waste stream Pallets 49.56 0.55% Fat, oil, grease 20.10 0.22% Wood 13.42 0.15% e-waste 5.25 0.06% Styrofoam 2.98 0.03% Soft plastic 2.12 0.02% Food donation 2.05 0.02% Coffee pods 0.68 0.01% Rubber gloves 0.14 0.00% Snack wrappers 0.08 0.00% Writing utensils 0.03 0.00% Total 96.39 1.07%
Waste streams deep dive
Diversion by location
FY 2022
Diversion rates differ
Diversion rates vary by campus and are influenced by the waste type generated at each campus and ASU’s ability to divert it. The Downtown Phoenix campus has the lowest diversion rate. The campus is challenging since it is not traditional, and its boundaries blur between ASU and the city of Phoenix community.
However, the ASU at Lake Havasu City location has a high diversion rate because of its small footprint and limited activity compared to the Tempe campus.
Diverted Landfilled 32% 50% 58% 33% 72% 68% 50% 42% 67% 28% 927 tons total 48 tons total 1,507 tons total 5,427 tons total 644 tons total 0 1, 00 0 2, 00 0 3, 00 0 4, 00 0 5, 00 0 6, 00 0 Downt own Phoenix La ke Hava su Pol yte ch nic Te mpe We st Waste (tons)
Zero Waste Annual Report | Fiscal Year 2022 9
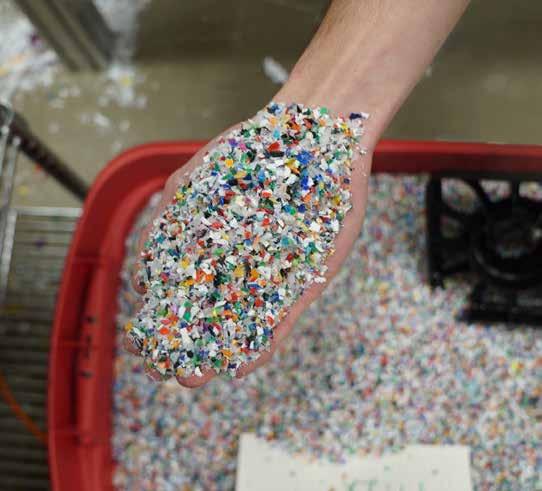
The Circular Living Lab, ASU’s plastic micro-manufacturing facility, produces innovative solutions related to sustainability.
Looking ahead
Working with our stakeholders
ASU takes fundamental responsibility for the communities it serves. The ASU Zero Waste department aims to make a transformative impact on evolving to a circular-resource system. The Zero Waste department accomplishes this by working with a diverse group of students, faculty, staff and enterprise partners to address key areas of opportunity in our waste stream.
FY 2023 goals
Expand residential composting: Food waste and compostable material are essential drivers of ASU’s zero-waste goals. The Zero Waste department will work with Residential Life to increase the amount of food waste and compostable material the university produces.
Expand reusables with Starbucks: ASU will continue to partner with Starbucks to expand last year’s reusables pilots.
GIS data for engagement: Transform GIS data into new engagement tools for the ASU community to interact with and practice zero-waste lifestyles.
Microfactory with precious plastics: In support of ASU’s learning laboratory mission, the Zero Waste department will support a student-led initiative to launch a microfactory for plastic waste generated on campus.
Single-use plastics policy: In response to internal and external interest, ASU will explore the impact of a single-use plastics policy and a roadmap to reduce the effects of plastics on campus.
Waste stream characterization update: Conduct a study to understand the current ASU waste stream and inform future program design.
Visit zerowaste.asu.edu for more information about recycling markets, diversion-program changes, sustainable purchasing and switching to reusables.
Zero Waste Annual Report | Fiscal Year 2022 10
© 2023 Arizona
of
State University.
Photography by Business and Finance Communications Group, Enterprise Marketing
Copyright
Board
Regents for Arizona
All rights reserved.
and Zero Waste team.
Global community Higher education impact Employees ■ Local industry ■ Non-profits Scientific community ■ Standard bodies ■ Students ■ Suppliers
ASU partners with Starbucks to develop reusable products and services on campus.
