SENIORS HOUSING COMMENTARY
SUMMER ����
Introduction
The Seniors Housing and Care industry continues to be one of the most dynamic and sought after real estate silos in all of commercial real estate. Sales volume during the first half of 2025 has increased by 71% year over year and is on pace to exceed 2024 figures. There's more to the story than just total transaction volume.
This article will highlight several themes and trends that outline the compelling investment thesis for investors in the Seniors Housing space: stable, inflation-protected income streams, growing price appreciation, and a supply/demand dynamic that favors experienced operators and newer, well-located, full-acuity products.

Investor Focus
Investor attention continues to concentrate on full acuity assets, as well as newer vintage, amenityrich communities. These communities are viewed by investors as best positioned to benefit from demographic demand, operational margin growth, and limited new competition. With minimal new construction, Berkadia is also seeing investors buying older communities that are located in good markets with pricing well below replacement costs. Assets built or renovated from post2015 are especially favored for their modern layouts and their ability to command higher rents.
Takeaways

Robust Rental Rate Growth
Sustained rental rate growth continues across seniors housing, with average annual increases ranging from 6.5% to 8.5% or higher depending on level of care in Class A communities. Though slightly off 2024 highs, these increases remain nearly double the historic range of 3-5%, underpinning revenue expansion for owners and operators. Rent growth expectations remain strong with a majority of investors and operators anticipating 5-7% increases over the next twelve months.
Bank Lending Reemergence
After years of caution, we continue to see banks re-entering the seniors housing space. New permanent loan volumes have reached their highest level since 2020 reflecting a broader trend of banks re-engaging in the sector, driven by improved occupancy and stabilized operations. As traditional banks and alternative lenders cycle in and out of the market, agency financing has remained a reliable source of capital for high-quality seniors housing assets. The agencies and traditional lenders are all actively competing for business, which is advantageous for borrowers.
Investment Trends
Robust Start to 2025
During the first half of 2025, communities with a majority of Assisted Living units collectively accounted for 54% of domestic investment sales volume, capturing $2.03 billion in publicly reported transactions, according to data from Levin Associates. Compared to one year prior, deal volume for majority AL communities is up by roughly $500 million.
Majority Independent Living communities are on pace to exceed the previous year's investment total with over $1.55 billion in announced domestic transactions through the first six months of 2025, nearly double the amount recorded over the same time period in 2024.
Both entrance fee and rental CCRCs are on pace for roughly the same deal volume as 2024, while the Active Adult sector has experienced a notable slowdown in sales to start 2025.
Skilled Nursing communities reported just over $2.05 billion in sales during the first six months of 2025, representing 92% of total SNF sales in all of 2024.
Percentage of Total Deal Volume by Asset Type
REITs Continue to be Top Investors
Through the first half of 2025, Real Estate Investment Trusts (REITs) continued their torrid acquisition pace. Of the roughly $5.8 billion in domestic investment across all asset types, REITs accounted for 43% of total sales. REIT buyers have been very active in acquiring newer-vintage, performing assets and have been able to aggressively push pricing for target assets.
While REITs have been extremely active as of late, at Berkadia, we have seen private equity be just as aggressive in the first half of 2025. Through the first half of the year, PE firms have represented nearly half of the buyers for Berkadia clients while accounting for 65% of total sales volume.
The increased competition is pushing long-time industry participants, including large owner/operators, to adapt and refine their strategies to maintain their competitive edge.
Most Active Buyer Types - Year to Date
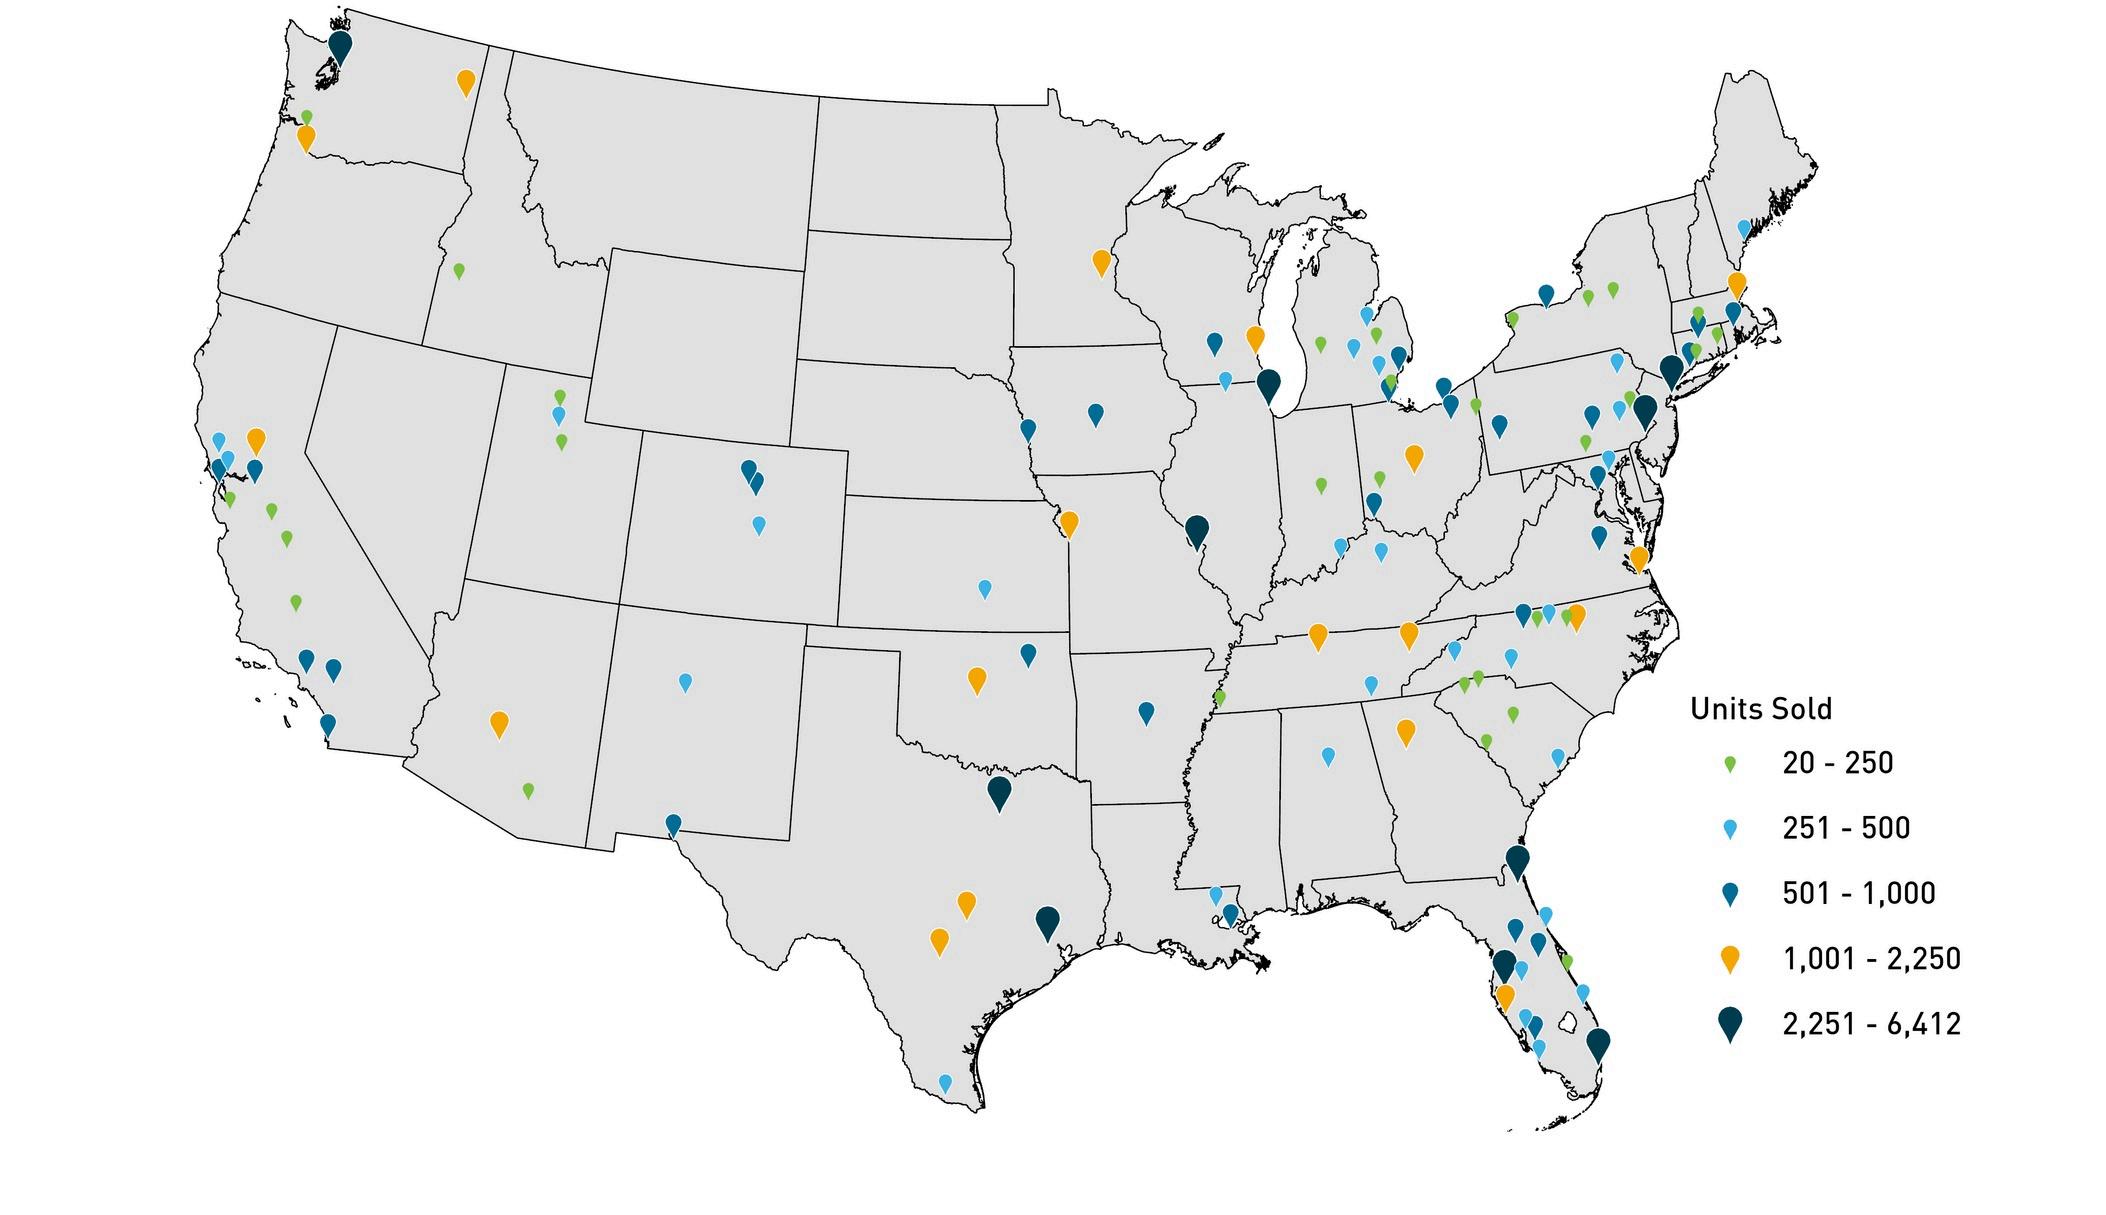
Half Sales Trends
The seniors housing sector has witnessed an impressive upswing in sales trends during the first half of 2025. Total sales volume soared by 71% year over year, approaching the $5.8 billion mark. This achievement propels the rolling four-quarter volume total to over $17.3 billion, marking the highest level since the peak of the post-pandemic sales cycle at the end of the second quarter of 2022. Investment groups are deploying substantial capital, benefiting portfolio sellers significantly. Portfolio volume has seen a remarkable 200% annual increase, reaching approximately $1.9 billion by the end of June. Notably, 68% of all portfolio deals occurred in the second quarter, with portfolio volume surpassing individual property sales by nearly 10%. The surge in portfolio transactions has also led to a substantial increase in the number of units traded. Approximately 30,600 units changed hands in the first six months of 2025, reflecting a 44.5% annual rise. Contrary to typical trends where more portfolio trades might mean fewer properties sold, the number of properties traded rose by an encouraging 27.1%, totaling 513. The first quarter was particularly dynamic, accounting for 56% of properties sold, while the distribution of units sold was nearly even, with a 52% / 48% split between the first and second quarters. This vibrant activity underscores the robust growth and promising outlook for the seniors housing sector.
First Half Pricing Trends
Pricing Shows Sharp Rebound
A decrease in the number of distressed assets, paired with a more active bidding environment has pushed pricing up at both the top and bottom of the pricing spectrum. The average price per unit for the top 25% of deals increased by 37% year over year, finishing the second quarter at $189,486. Conversely, properties that traded at the bottom of the pricing spectrum jumped by 48% annually to $72,717. The increased floor for price per unit helped push the median and average price per unit back to relatively equal levels at approximately $125,000.
According to data from RCA, the average cap rate for majoity independent and majority assisted iving communites has compressed by roughly 60 basis points over the past year to 7.0% at the end of June. At Berkadia, we have found best-in-class communities pushing closer to 6.25%, with a number reaching sub-6% on trailing financials.
Construction Trends
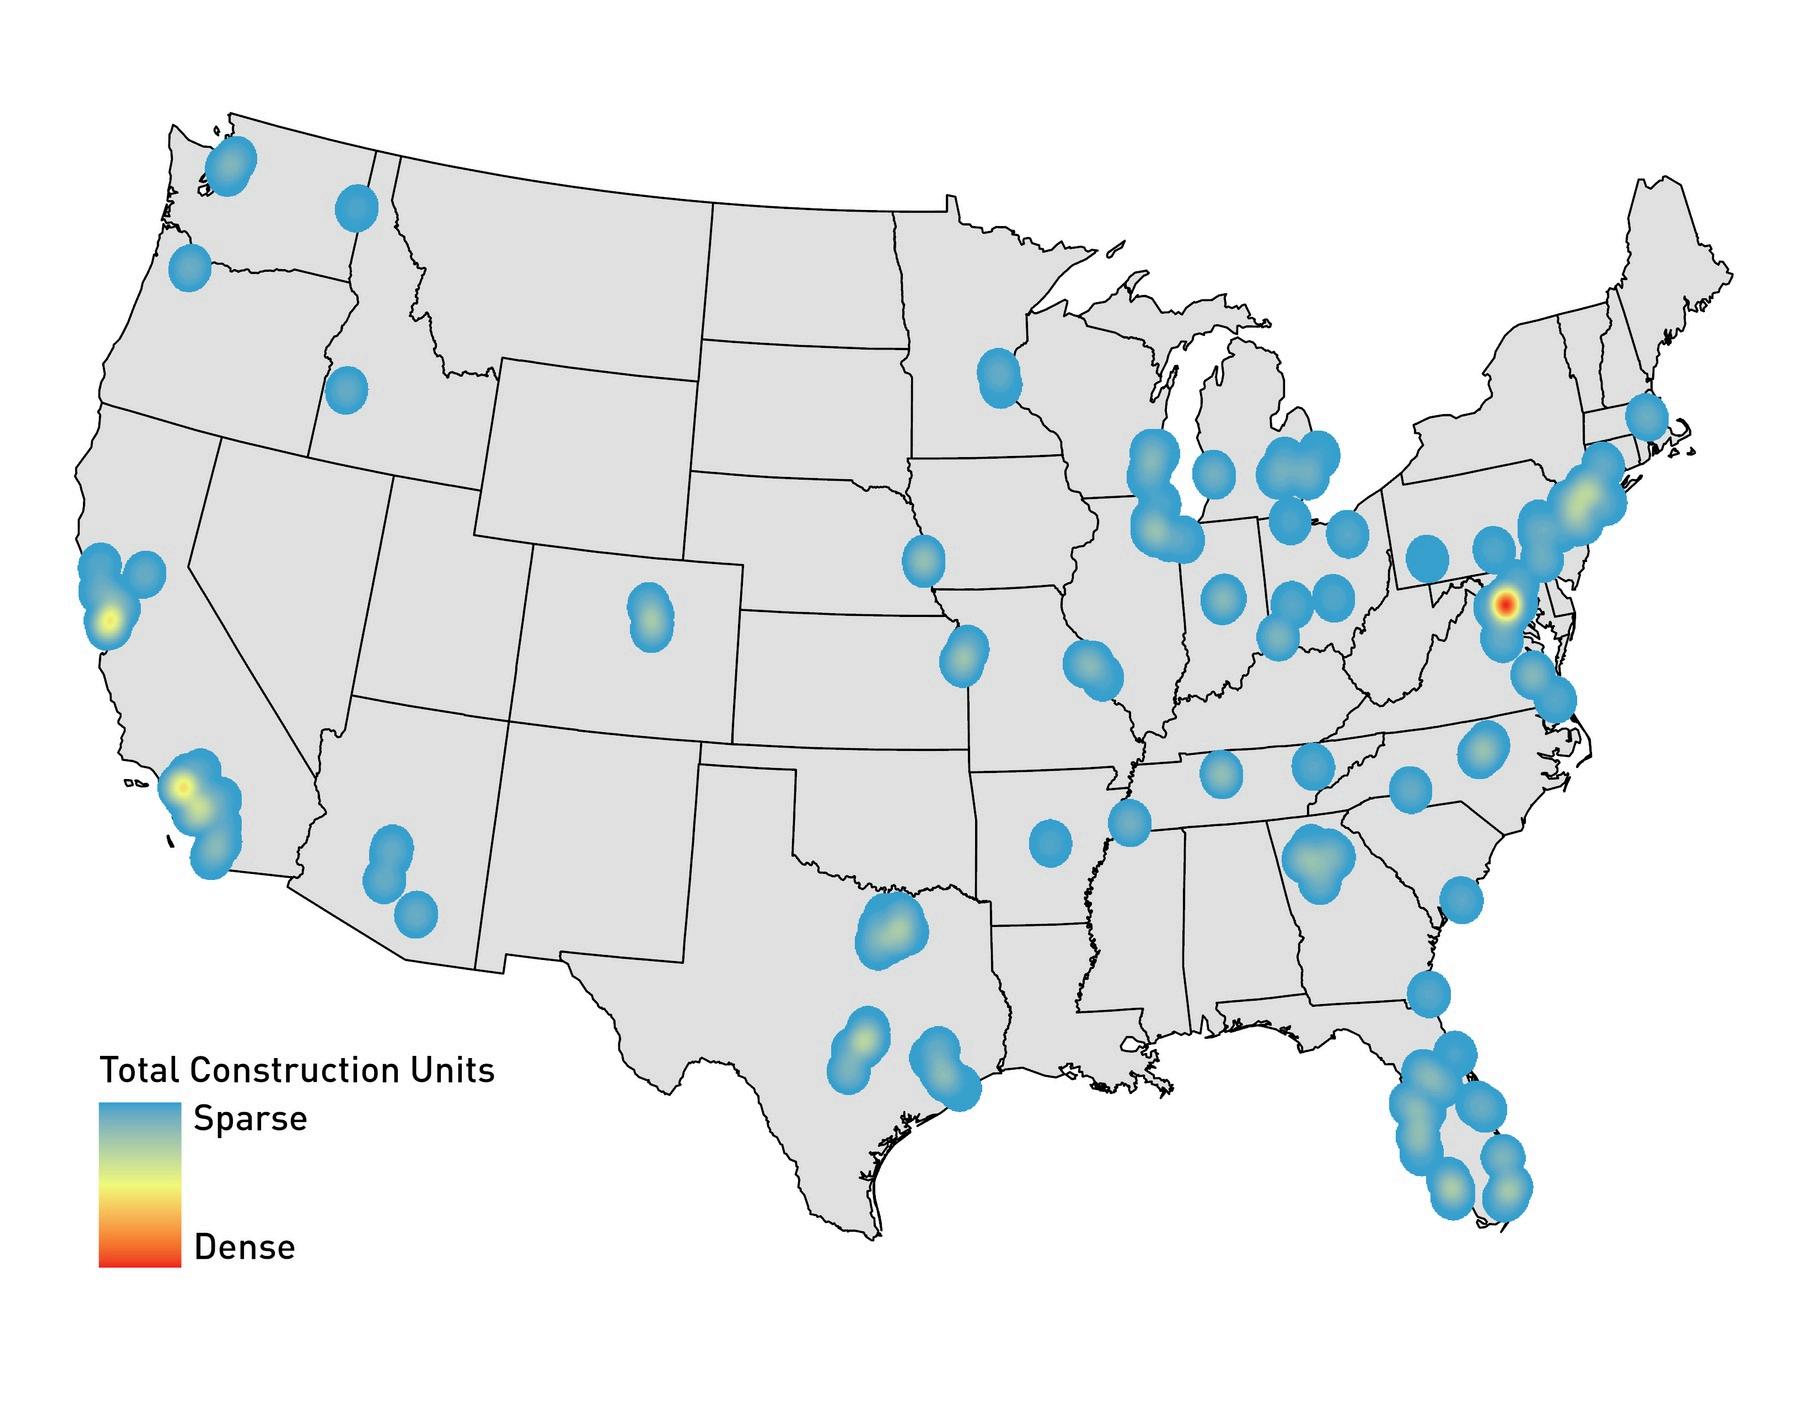
Construction Totals Continue to Decline - California Boasts Large Planning Pipeline
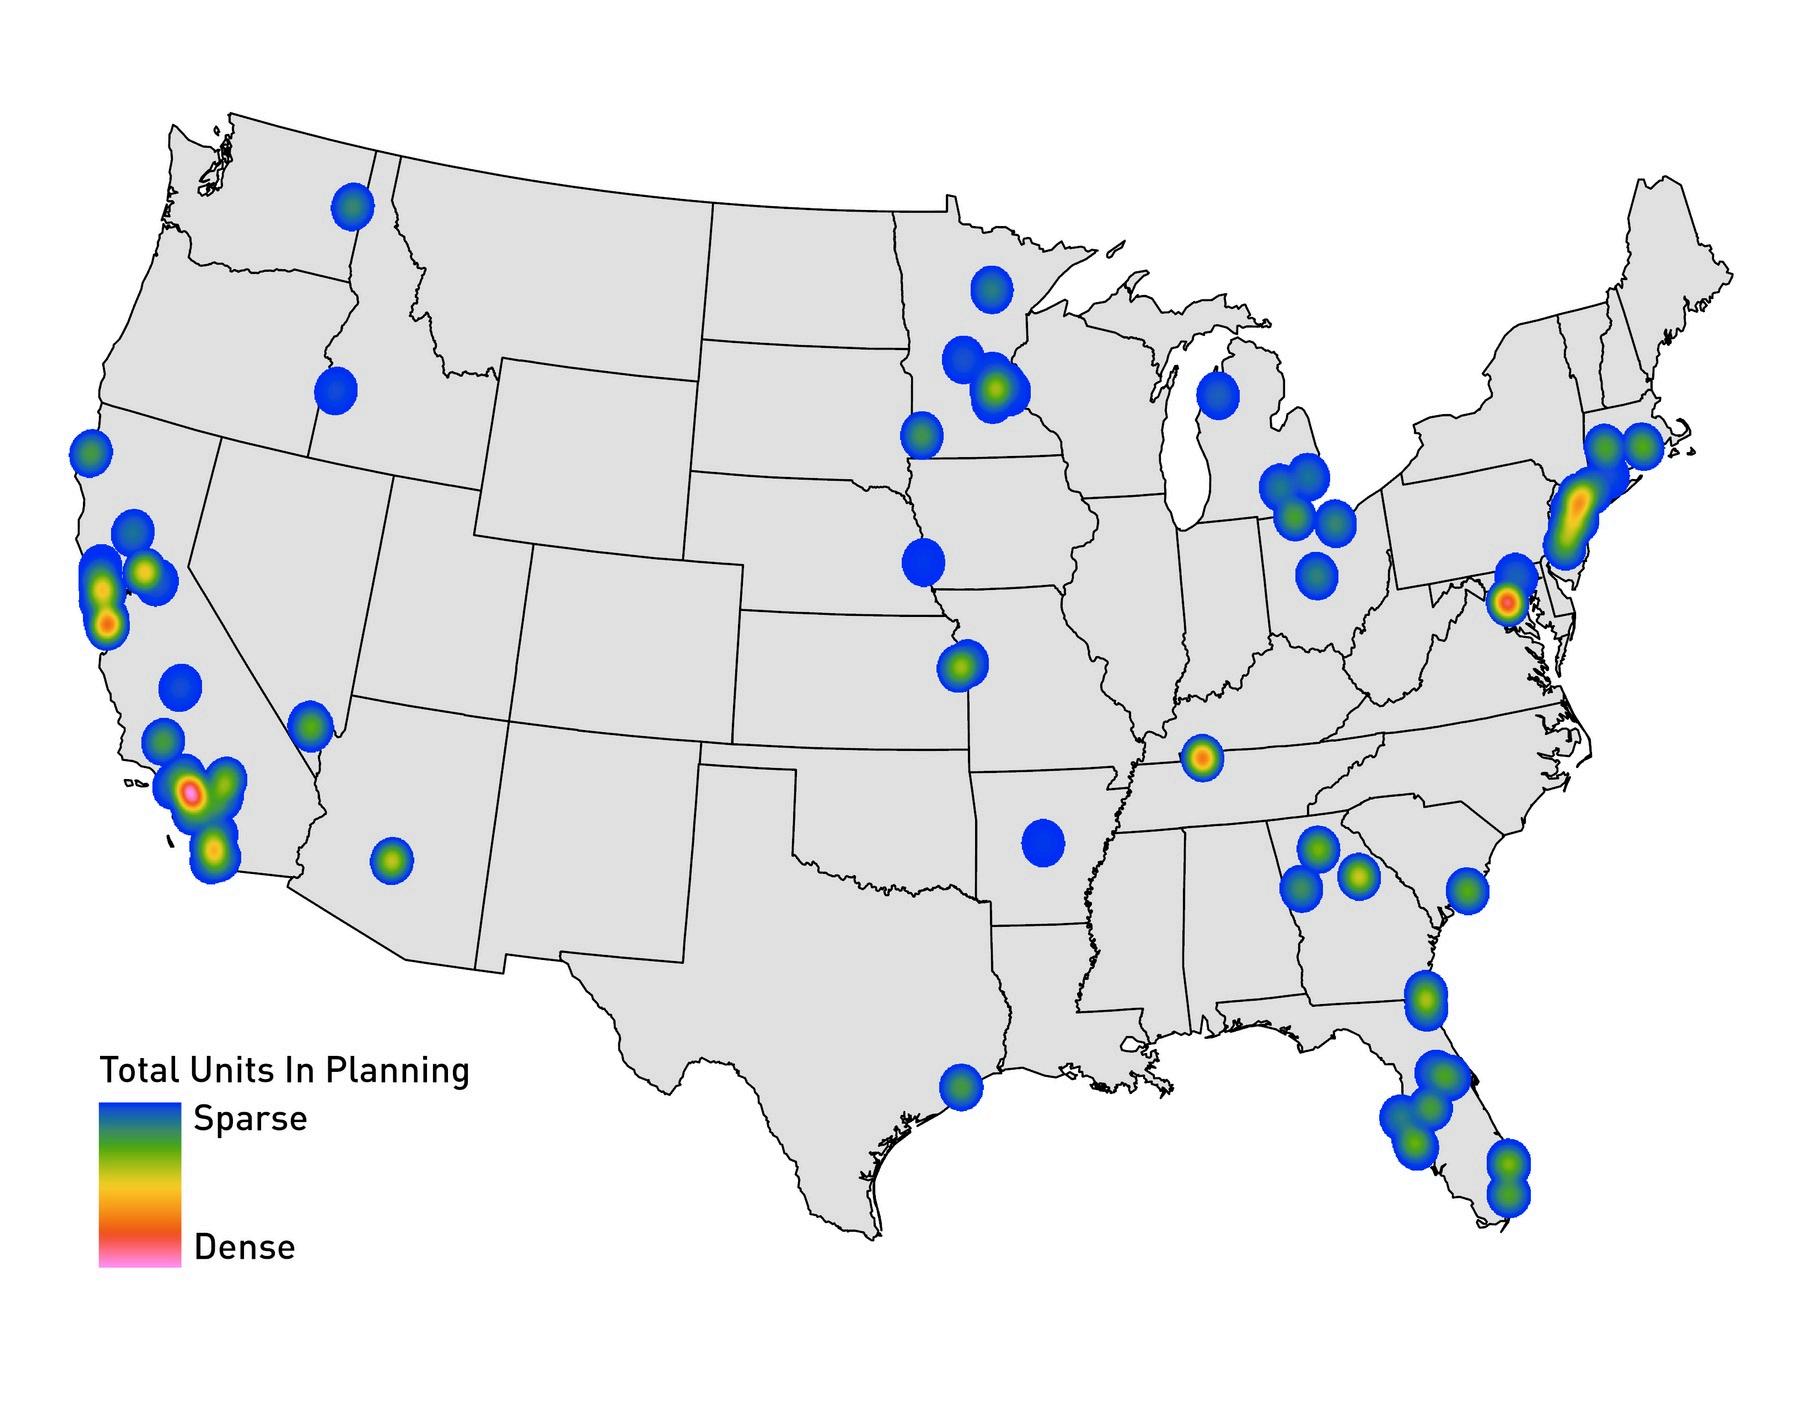
From the end of 2024 to the end of 2Q25, the total number of units under construction has declined by 13.8%, now standing at just over 26,000. Washington, D.C., Los Angeles, and the Bay Area make up roughly one-fifth of the current construction pipeline, while Dallas and Austin account for another 10%. Nearly half of the units being built are located in majority Assisted Living communities. Despite normally high barriers to entry, California continues to attract developer interest. Markets in the Golden State represent 3,120 or 26% of the 12,000 units in the planning stages across the country. The I-95 corridor running from Boston to Washington, D.C. boasts roughly the same number of units as California, while New York accounts for 8% of the units in the planning pipeline with just over 920 units.
2025 Top Transactions - Investment Sales


Stabilized New Assets Lead Rent Growth
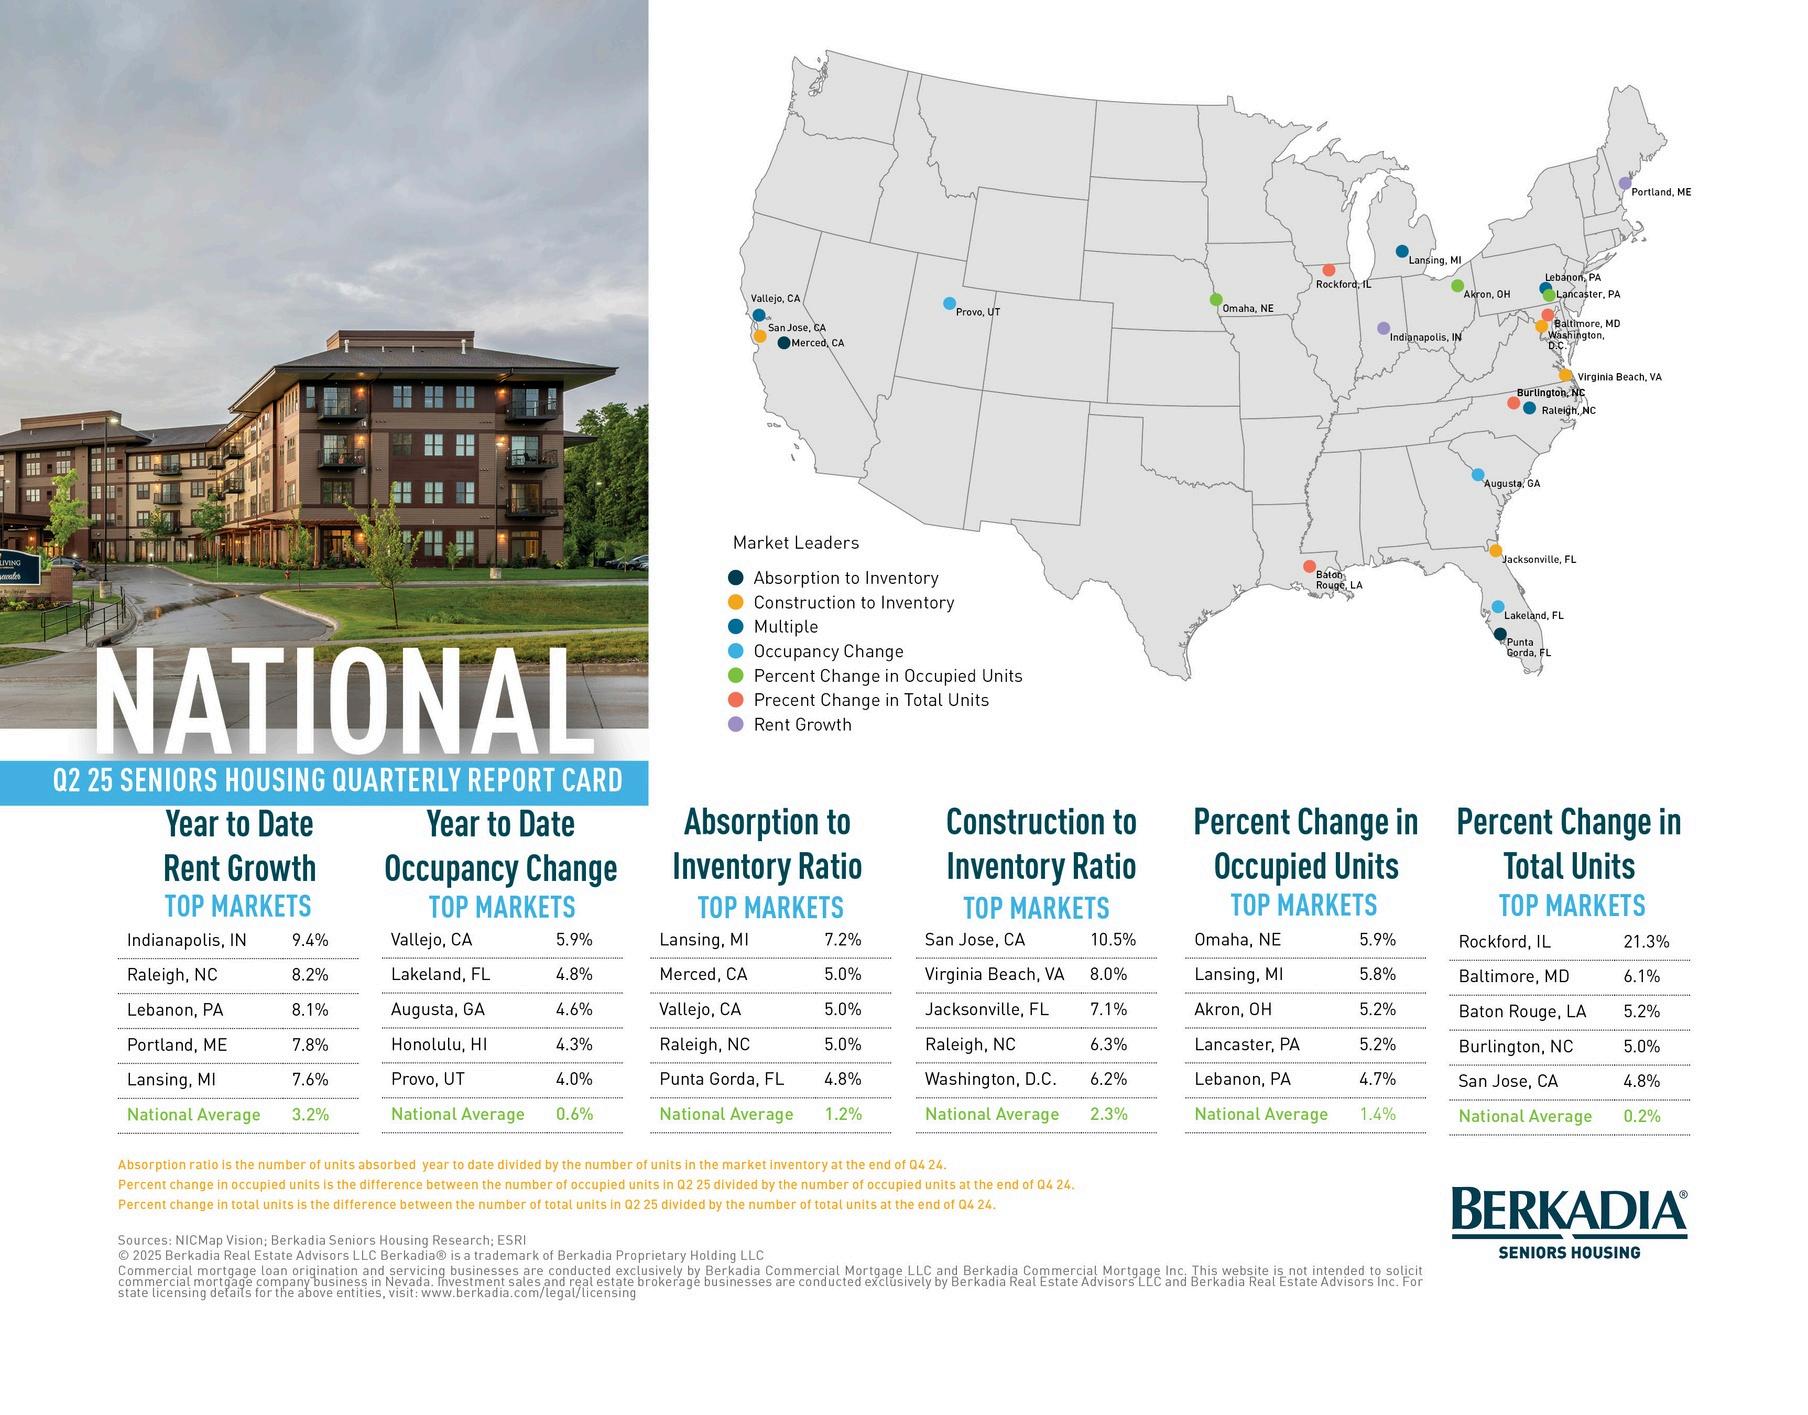
The recent years have witnessed a surge in average rents, primarily driven by assets constructed post-2015 in key markets. Notably, the average rent in stabilized senior housing communities across NIC Maps' top 31 markets has experienced a robust 5.5% increase over the past year, reaching a monthly rate of $6,791. The nationwide average rental growth for assets of all ages stands at a more modest 3.2%.
The senior housing market has witnessed a geographically diverse surge in demand, with regions across the country contributing to the sector's growth. Occupancy rates have risen accordingly, ticking up 60 basis points since the start of 2025 and 170 basis points annually, reaching a robust 91.7% nationwide. This upward trend is supported by a higher percentage change in total units compared to the previous period, showcasing the industry's resilience and appeal to senior residents.
Occupancy Approaches Record Levels
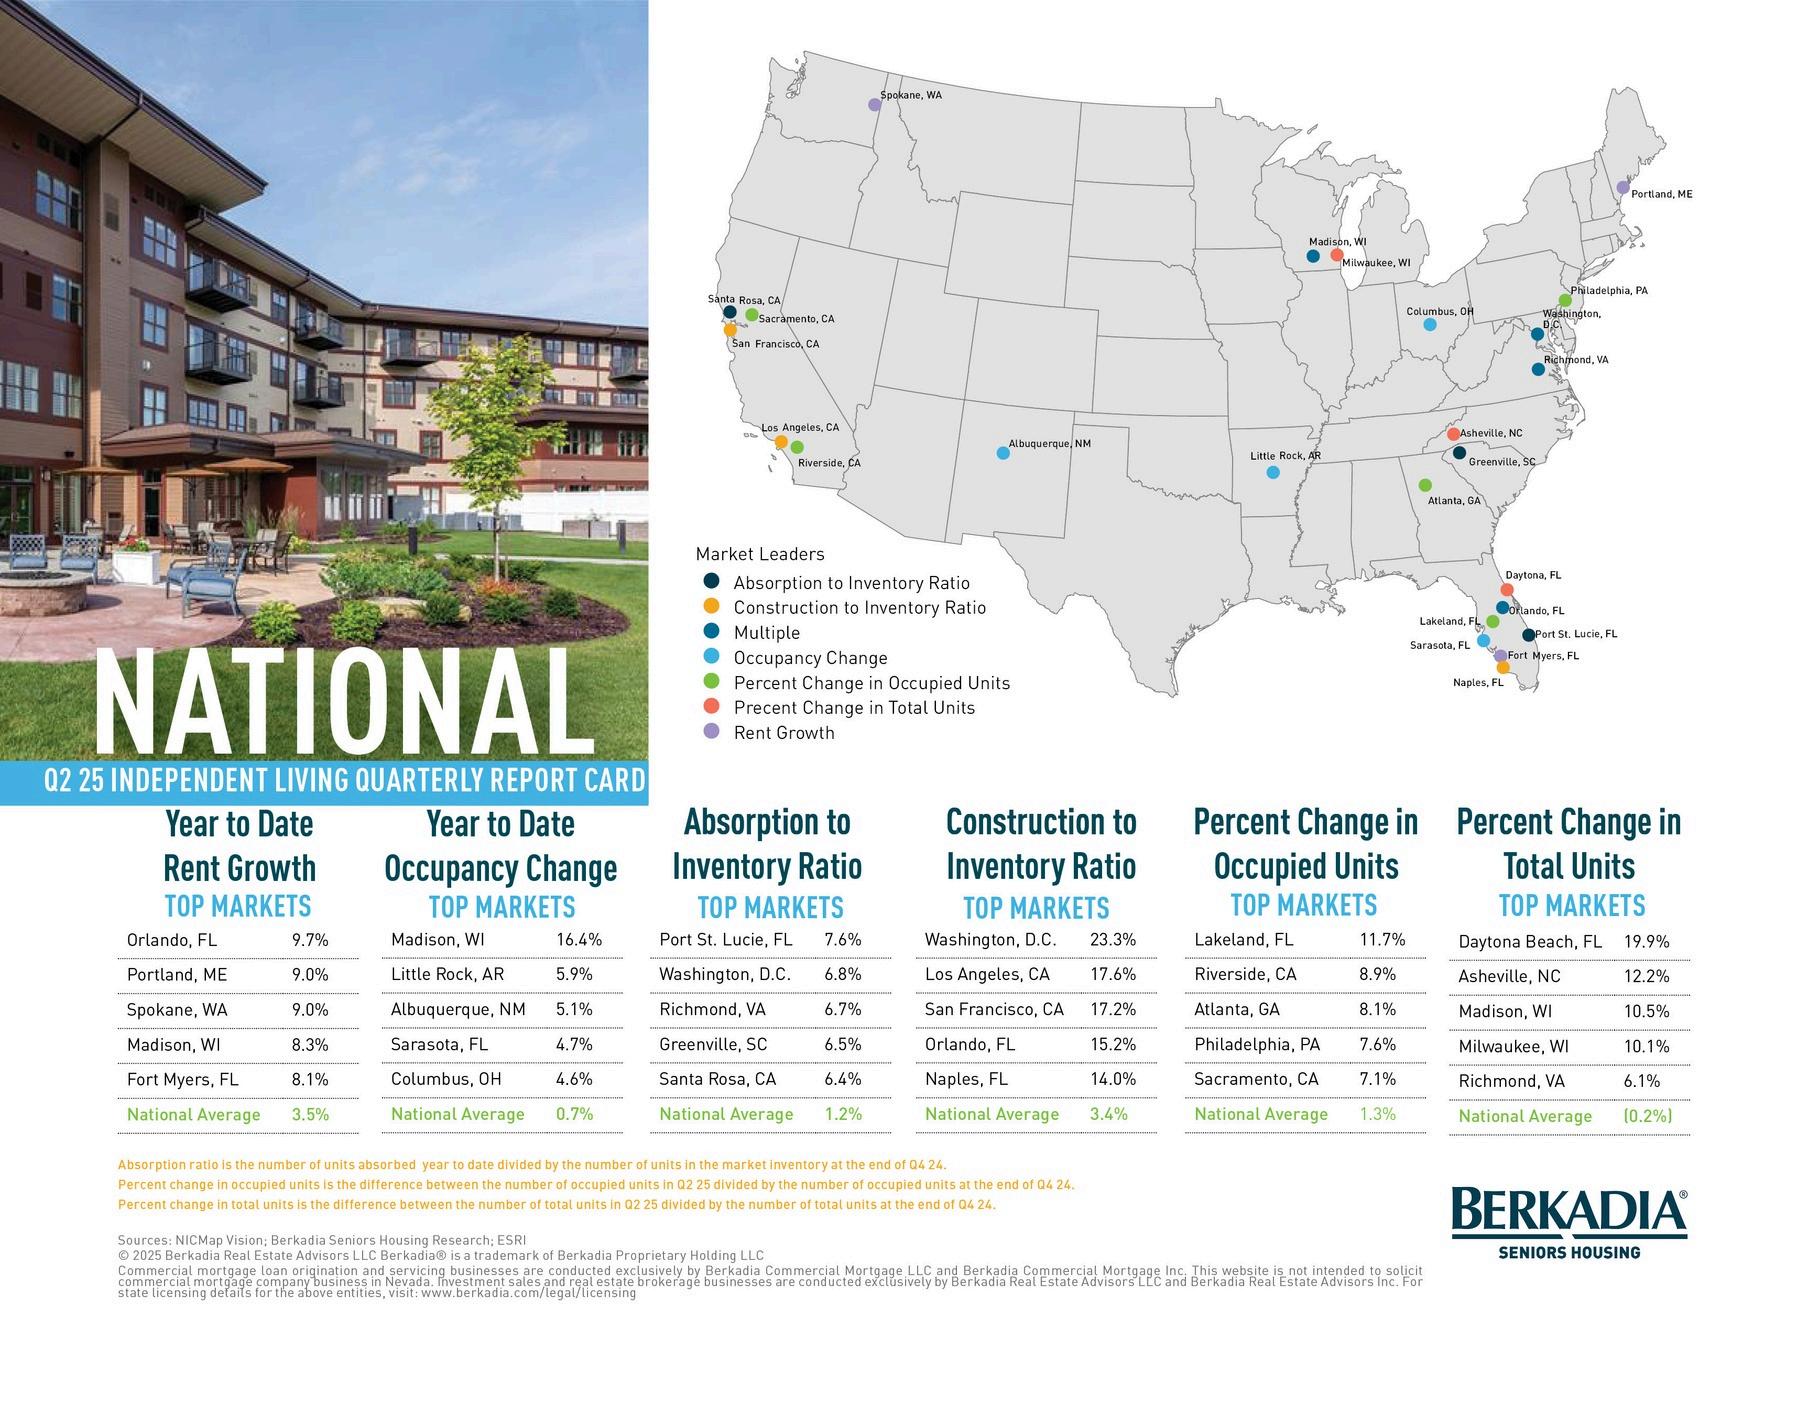
The median occupancy rate for Independent Living communities across all NIC markets has experienced a remarkable resurgence, climbing to a noteworthy 92.3% at the end of the second quarter of 2025.
This figure represents the highest level reported in NIC data since the 92.8% mark recorded at the close of 2018, a testament to the growing demand for senior housing as the baby boomer generation continues to reach the prime resident age. Moreover, the number of occupied units has witnessed a substantial increase of 1.3%, reaching a record-breaking tally of nearly 286,400 since the start of 2025.
Washington, D.C. maintains its position as the national leader in new construction of IL community units, with 1,538 of the 11,000 units currently underway. This figure exceeds the combined efforts of the next two markets, San Francisco and Los Angeles.
As Construction Slows, Demand Rises
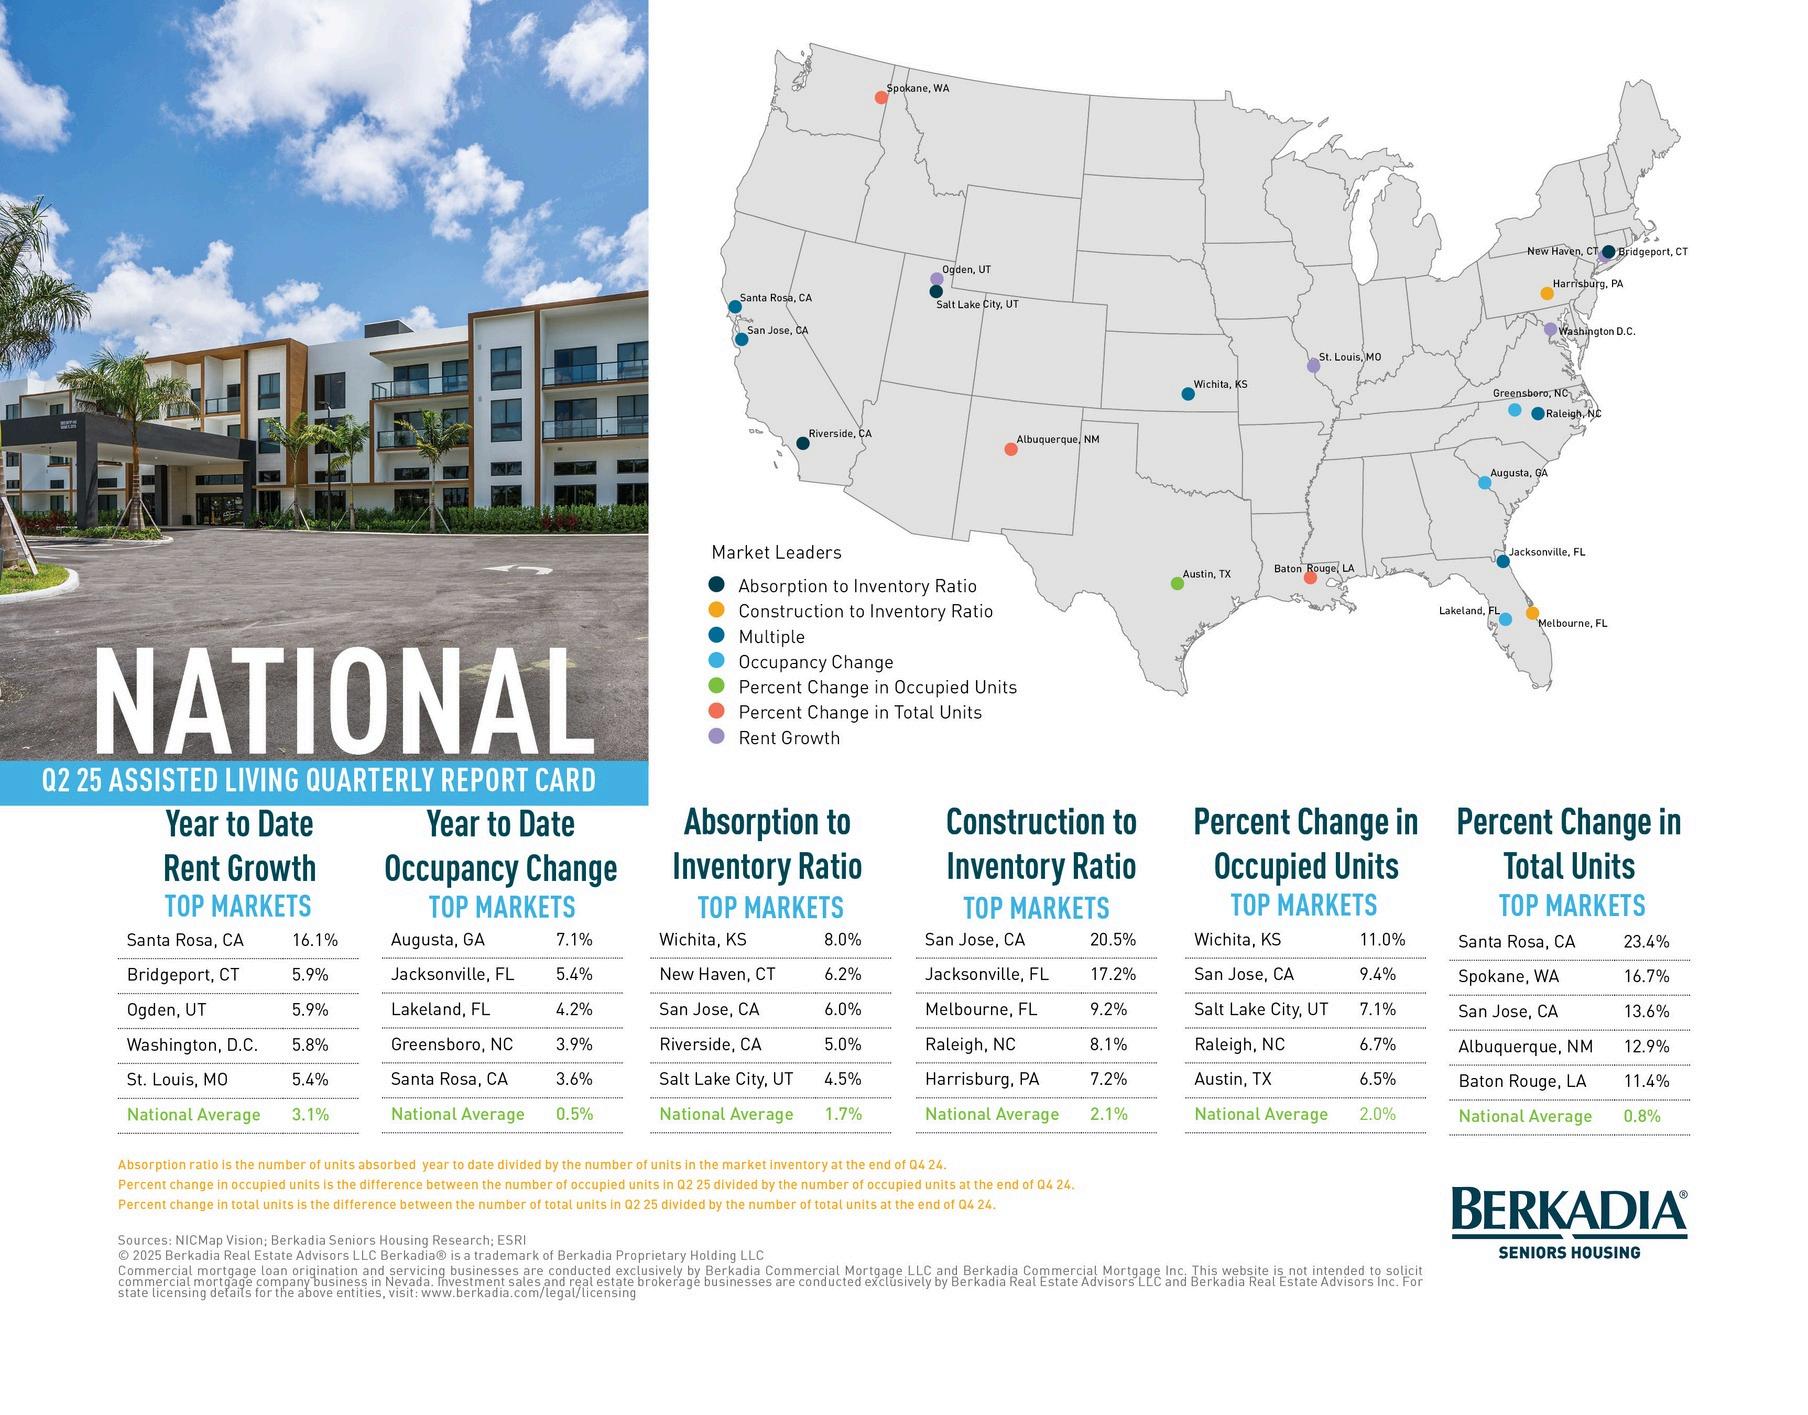
The assisted living (AL) construction pipeline across the 139 NIC Map markets has experienced a staggering 22-quarter decline, with less than 10,000 units currently under development at the close of 2Q25. This figure represents a precipitous 350% contraction from the March 2018 peak of just over 35,340 units.
Despite the near-standstill in construction, the demand for AL accommodations shows no signs of abating. The number of occupied AL community units surpassed the 400,000 milestone at the end of March, and has since increased by an additional 1.2%, now totaling over 406,105.
Parallel to independent living (IL) communities, median occupancy rates for AL remained stable through the first quarter of 2025 but have since rebounded, reaching a nationwide high of 91.2% - the highest level reported since the 91.3% recorded at the close of 4Q18.