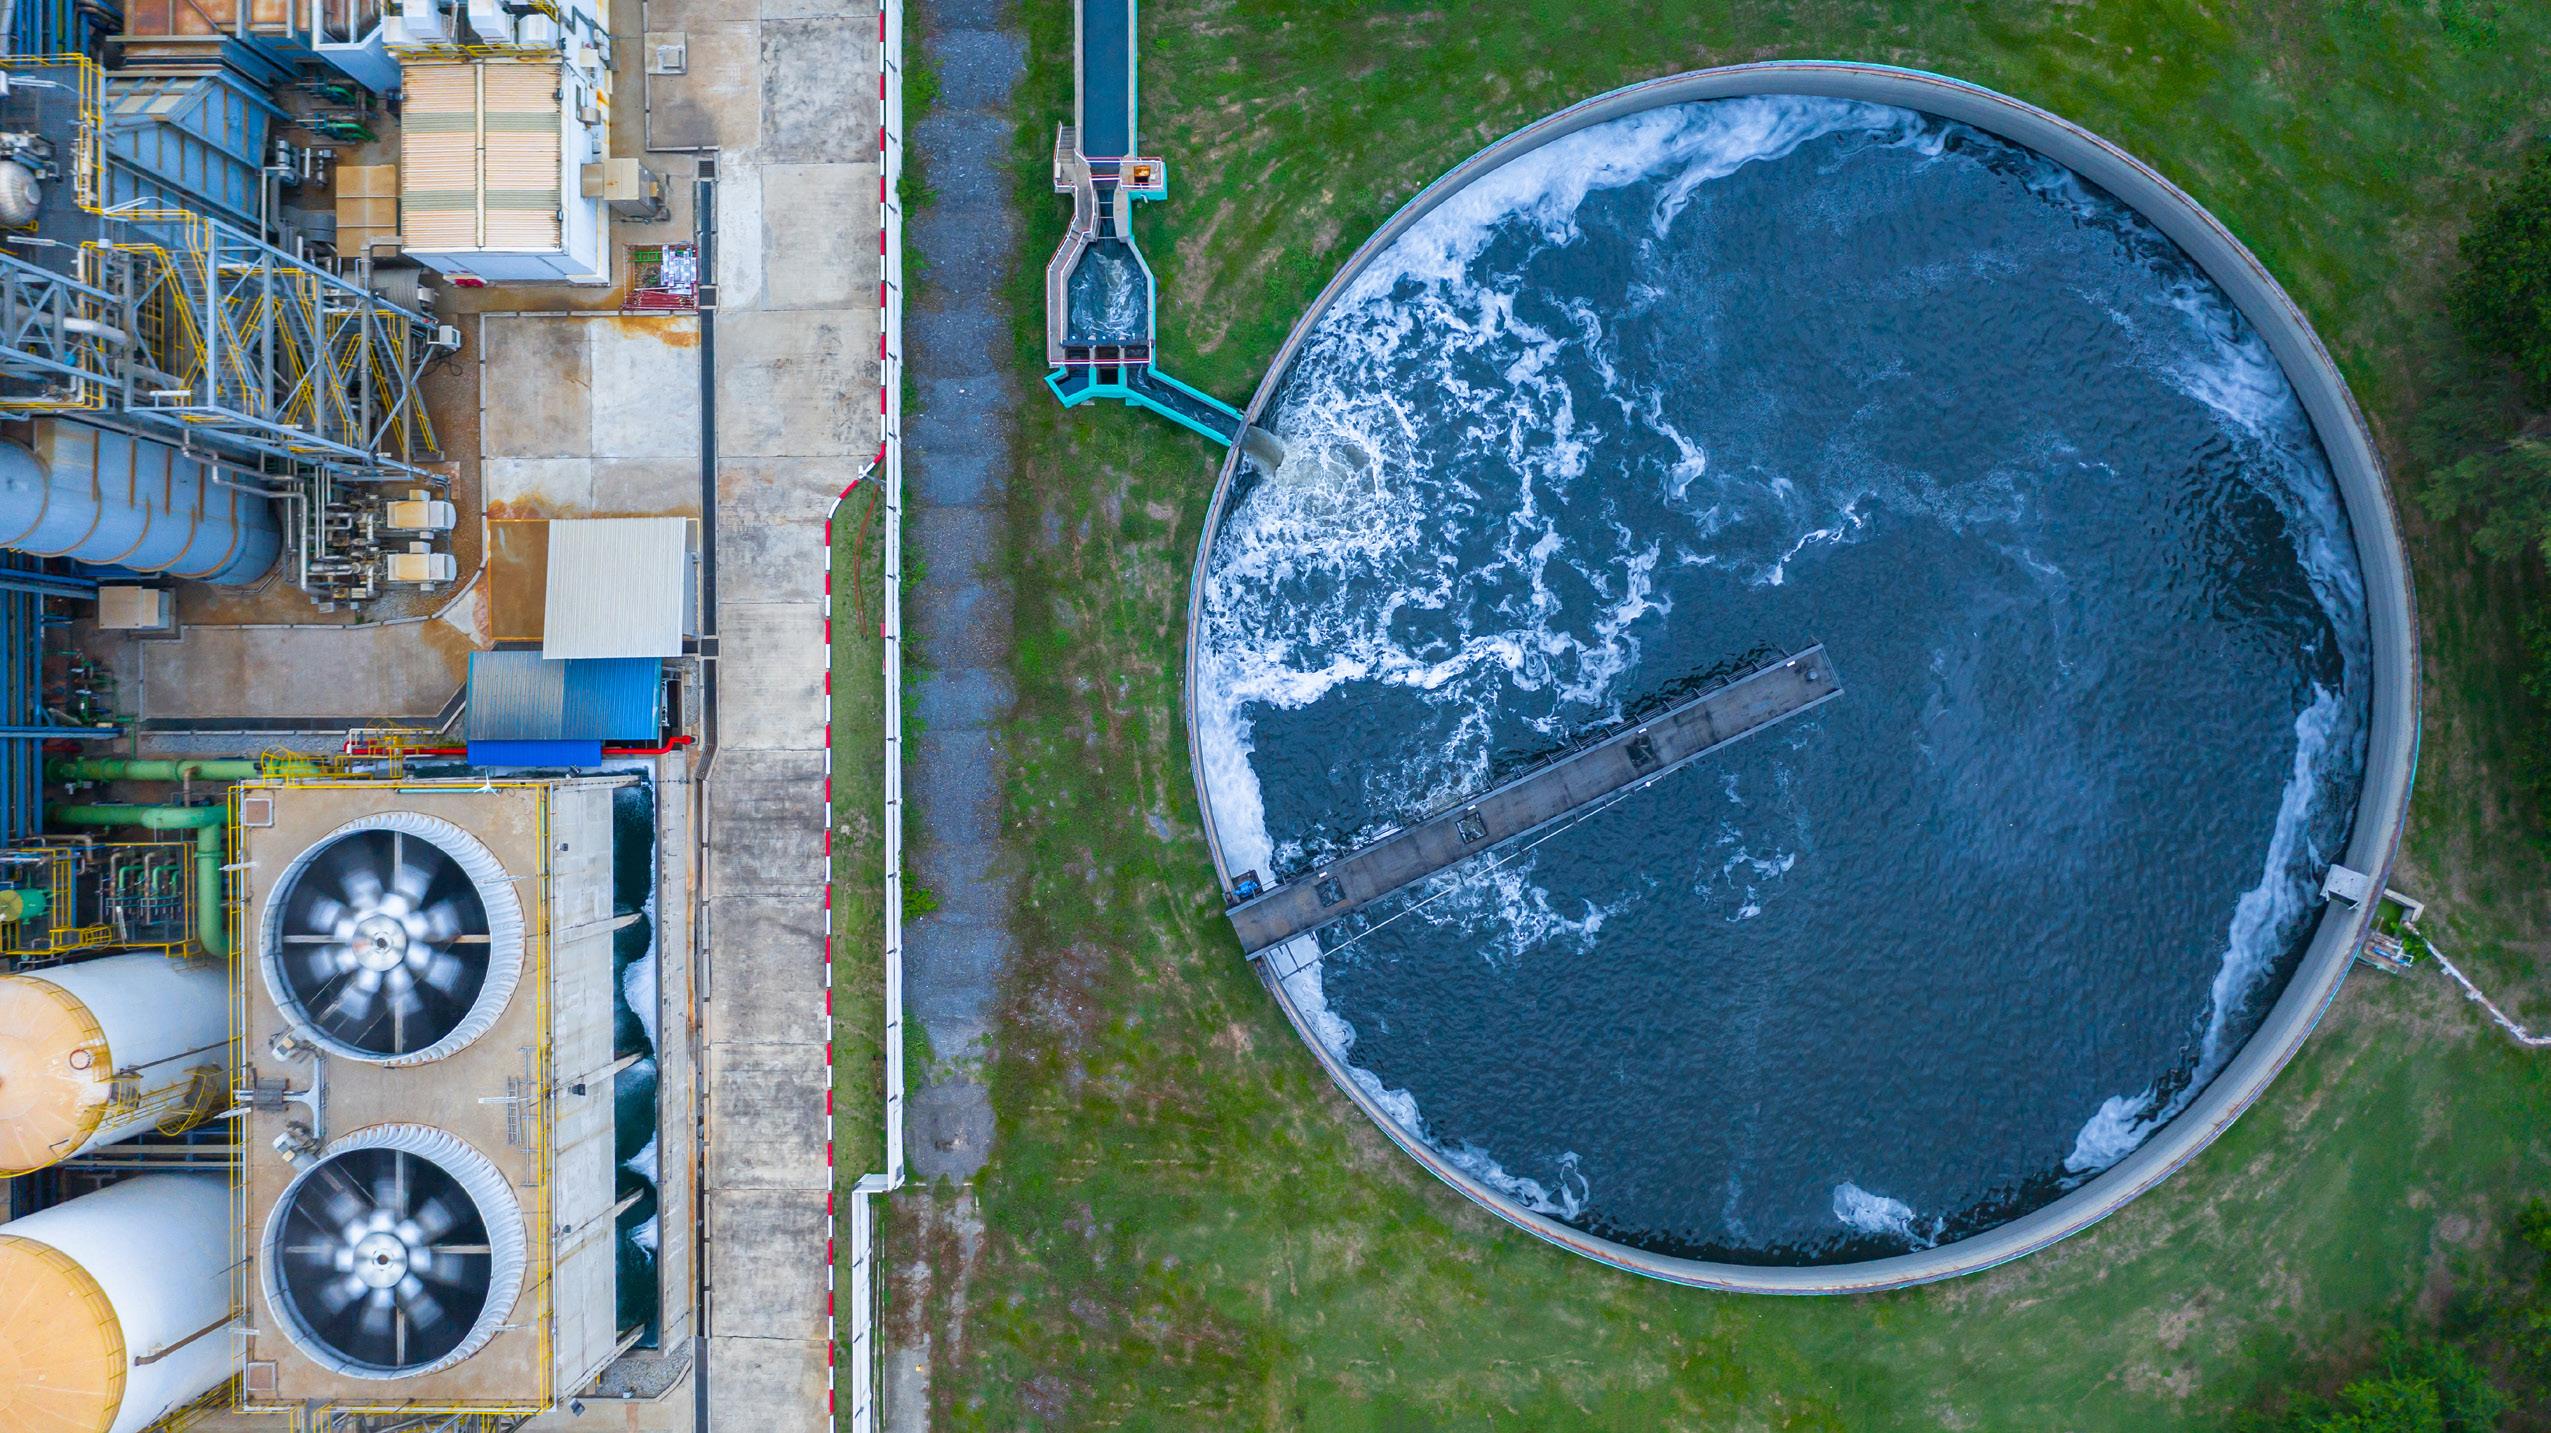
ARE OUR WATER SYSTEMS AT RISK?
Assessing the Financial Sustainability of BC’s Municipal Water Systems
ACKNOWLEDGEMENTS
This report has been prepared by the BC Water and Waste Association (BCWWA), with consulting support from Urban Systems Ltd. and JW Infrastructure Planning Ltd. This initiative is offered through the Municipal Asset Management Program, which is delivered by the Federation of Canadian Municipalities and funded by the Government of Canada.
Special thanks to the City of Fort St. John, the District of Squamish, and the City of Nanaimo for sharing your experience and insights as case study communities.
PREPARED FOR:


PREPARED BY:

APPENDIX
EXECUTIVE SUMMARY
ARE OUR WATER SYSTEMS AT RISK?
This report assesses the financial sustainability of water and wastewater systems in British Columbia (BC) municipalities, building upon the findings of the original Are our Water Systems at Risk? 2015 report. The aim of this work is to empower municipalities in understanding and achieving financially sustainable water and wastewater systems, considering changes and trends in the municipal context.
This study seeks to answer the following questions:
1) Are fees covering the full cost of service delivery, including infrastructure renewal?
2) How vulnerable are we to unexpected events?
3) What is our infrastructure deficit?
4) What is our capacity to finance renewal using debt?
5) What are public opinions about water and wastewater systems?
6) What actions can we take to address findings?
METHODS
The research performed to answer these questions took three phases. First, data was collected from 161 BC municipalities, assessing financial sustainability through key indicators and analysis of each. Second, a survey was conducted to gauge public opinion. Finally, interviews were conducted with communities that have made notable progress towards financial sustainability in recent years to identify lessons learned and best practices.
It is important to note that due to constraints on the data, the analysis is limited to BC municipalities and does not include regional districts, Indigenous communities, or unincorporated areas. Additionally, the focus of the analysis is on existing infrastructure and levels of service, without quantifying investments needed for growth or climate resilience.
Our findings show that since our 2015 report, most BC municipalities have seen incremental improvements in their financial sustainability, covering the cost of service, building resilience, and addressing infrastructure deficits. However, challenges remain, related to small communities, and low public awareness of costs and climate risks. It is crucial to continue to make progress, explore innovative solutions, and improve financial sustainability for future generations.
KEY FINDINGS
The results of our analysis indicate the following:
Most communities have incrementally improved their financial positions in comparison to 2015, but significant gaps remain.
Smaller communities (<1,000 pop.) generally saw a decline in financial sustainability in comparison to the 2015 results.
Significant additional investment will be required to address the eventual infrastructure renewal.
There are opportunities to build awareness among the public on the criticality of these issues.
KEY ISSUES AND TRENDS
The results of the financial analysis have also been considered in the context of the following issues and trends:
Climate change
Climate change poses risks to water systems, requiring increased costs for accessing, treating, and conveying water.
Nature-based solutions
Natural asset management practices are gaining momentum and has the potential to significantly contribute to the resilience and sustainability of our water and wastewater systems.
Inflation
Inflation has escalated capital costs, challenging affordability.
Changing workforce & technologies
The changing workforce demographics and introduction of new technologies presents new risks and opportunities to the operations of our water and wastewater systems.
RECOMMENDATIONS
Actions for local governments
Although the analysis in this report is limited to municipal governments, the following recommendations for improving financial sustainability are also applicable to regional districts:
1. TAKE STOCK OF YOUR SITUATION
Assess the financial sustainability of your water and wastewater systems using your own data and the four ratio calculations included in this report¹. What are the results, and based on current trends and practices, are the results likely to improve or decline? What are the implications of these results on delivery of water and wastewater services? What other significant risks to service delivery exist, and are there plans for managing these risks?
2. SET TARGETS FOR FINANCIAL SUSTAINABILITY
Work with leadership and your council or board to set targets for financial sustainability. Begin by communicating the current state of financial sustainability with leadership and council or your board. Discuss the results in the context of current trends and practices that are relevant to your community – based on the current context, how do you anticipate the financial sustainability will change? Discuss the implications of the results on sustainable delivery of water and wastewater services and implications for the broader community. Identify areas for change and establish targets and timelines.
1 An assessment tool has been developed to support this assessment and is available on the BCWWA website.
3. SELECT AND IMPLEMENT STRATEGIES TO ACHIEVE YOUR TARGETS FOR FINANCIAL SUSTAINABILITY
These strategies may include:
a) Implementing or improving asset management practices and systems, including the identification of risks related to changing climate and actions to manage these risks.
b) Identify and quantify the natural assets relied upon to deliver water services and the risks to these natural assets and the services they provide. Implement approaches to managing these risks.
c) Develop long-term financial plans and align fees accordingly.
d) Raise public awareness of the value of water services and the risks to be managed.
e) Inform land-use planning and decision-making with consideration of infrastructure costs, appropriate levels of service, and potential impacts to natural assets.
Additional strategies for improving financial sustainability of water systems are included in a Canadian Water Network study from 2018 called Balancing the Books: Financial Sustainability for Canadian Water Systems.

1.0 INTRODUCTION
ARE OUR WATER SYSTEMS AT RISK?
Our 2015 report entitled Are Our Water Systems at Risk? commented on the financial readiness of BC municipalities to fund their current and future water and wastewater operations and infrastructure. Based on our findings, we provided five recommendations for municipalities to improve the financial sustainability of their water and wastewater systems and ensure that residents will continue to receive reliable services. In this update of the report, we use the same financial analysis to see how communities have progressed and understand what has changed since the original analysis was completed.
The purpose of this work is to empower BC municipalities to understand, achieve, and maintain financially sustainable water and wastewater systems. This updated report also considers trends and issues in the changing municipal context.
Ultimately, the report seeks to answer the following questions:
1) Are user fees covering the full cost of service delivery, including infrastructure renewal?
2) How vulnerable are we to unexpected events?
3) What is our infrastructure deficit?
4) What is our capacity to finance renewal using debt?
5) What are public opinions about water and wastewater systems?
6) What actions can we take to address the findings?
While the focus of this report is to comment on changes since 2015, much of the analysis methodology and background context remains consistent from 2015. Sections of the 2015 report have been integrated into this update to result in a consolidated, standalone reference for readers.
WHAT DO WE MEAN BY FINANCIAL SUSTAINABILITY?
A financially sustainable municipality is one that has enough funds to cover current expenses related to operating and maintaining water and wastewater systems, and one that can actively plan for the future replacement of aging systems. By prioritizing financial sustainability, we can ensure that water and sewer systems continue to safeguard public health and the environment while contributing to economic development. To meet British Columbia’s water infrastructure needs now and, in the future, it is important to make sound decisions today about how to allocate existing tax dollars and set user rates that fully cover the costs of operating, maintaining, and replacing these systems.
WHO IS RESPONSIBLE FOR OUR WATER & WASTEWATER SYSTEMS?
There are thousands of water and wastewater systems in BC, ranging from wells and septic systems that serve single homeowners, to large and complex systems that serve many households and businesses. Some of these systems are owned and operated by governmental organization like municipalities, improvement districts, regional districts, and First Nations; others are owned and operated by private utilities, stratas, or individual homeowners.
Water resources are governed through several federal and provincial acts, including the BC Water Sustainability Act, the BC Drinking Water Protection Act, the BC Environmental Management Act, and the Federal Fisheries Act. These Acts provide the framework for regulations that establish criteria for water quality and treatment.

ARE OUR WATER SYSTEMS AT RISK?
HOW ARE OUR WATER & WASTEWATER SYSTEMS FUNDED TODAY?
There are two types of costs associated with water and wastewater systems – the “capital” costs to build the systems, and the “operating” costs to run and maintain the systems day-to-day.
CAPITAL COSTS
The capital costs to build, renew, and replace our systems are typically funded primarily by user fees, contributions from the provincial and federal governments and by property developers.
Municipalities in BC have the authority to establish development cost charge (DCC) bylaws that require property developers to contribute to the cost of new infrastructure required for their development. Developers seek to recover the costs of infrastructure construction from the buyers of the developed properties. The municipality typically assumes ownership of the infrastructure, which means that local ratepayers are responsible for paying for the associated operating and maintenance costs.
OPERATING COSTS
The operating and maintenance of water and wastewater services are generally funded through user fees, property taxes, or a combination.
WHAT DID WE LEARN IN 2015?
Water and sewer fees were not covering the full cost of services in many communities
While some communities were financially well positioned to meet current and future service needs, water and wastewater rates in the majority of BC municipalities did not generate sufficient revenues to pay for the full cost of providing services.
The majority of BC municipalities had not set aside sufficient reserve savings to provide a buffer against unexpected changes in water or sewer system operating costs or revenues. Communities were vulnerable to financial shocks
Smaller systems had greater financial gaps
Water and wastewater systems are capital-intensive; smaller communities do not have the benefit of “economies of scale,” and so the costs of their systems are shared across a smaller base of users, which impacts their financial capacity.
Investment is required
As our water and wastewater systems approach the end of their useful life, investment will be required to renew and replace our current infrastructure. In 2015, the shortfall in reserve savings and infrastructure renewal requirements was estimated to be $13B.
RECOMMENDATIONS
Adjust water and wastewater rates to cover the full cost of service
Full cost recovery means that revenues should be sufficient to cover the cost to service and operate the system in perpetuity, including renewal and eventual replacement of infrastructure.
Develop and implement integrated asset management processes
All municipalities should develop integrated asset management processes that assess the state of their infrastructure, evaluate risks, and set priorities for investment in renewal and replacement of water and wastewater assets. These processes should be linked to long-term financial plans that identify how these projects will be financed.
Rank water and wastewater renewal projects as top priorities for capital investment
In an environment where there are competing demands for scarce financial resources, community leaders must make difficult decisions. Renewal of our water and wastewater systems must be a top priority for municipal capital projects.
Adopt “smart growth” principles
Municipalities should adopt “smart growth” principles for their land development policies, to ensure the lifecycle costs of development are well understood, and a funding plan is in place that includes funding for the life cycle of contributed assets from new development.
Collaborative and constructive relationships between local, provincial, and federal governments are essential as municipalities transition to fiscal selfreliance for our water and wastewater systems. Foster collaboration among all levels of government
1.2
A CHANGING CONTEXT
We have identified four key issues and trends that must be considered in evaluating the financial sustainability of our water and wastewater systems. While quantitative analysis cannot draw a direct correlation to these factors in the financial indicators, these trends and issues are important context to be considered in understanding additional stressors on financial sustainability and actions we can take to build financial resilience.
1. CLIMATE CHANGE
Climate change is increasing the risks to our watersheds and critical municipal infrastructure. Storms, wildfires, flooding, landslides, drought, extreme heat, increased invasive species, and sea level rise are all examples of hazards that have significant implications for the delivery of water and wastewater services.
How is this impacting the financial sustainability of our water and wastewater systems?
Service interruptions and unexpected replacement costs are more likely with these greater risks. Climate impacts to ecosystems in watersheds may impact the quality and quantity of source water available, leading to increased costs of accessing, treating, and conveying water. New infrastructure may need to be designed to higher standards to improve climate resilience, incurring additional costs for planned replacements and upgrades. Research conducted by the Financial Authority of Ontario estimated premiums of 29-53% above ordinary replacement costs to design and build climate resilient wastewater infrastructure. (FAO, 2021)
2. NATURE BASED SOLUTIONS
In recent years, there has been an increased focus on the role of natural assets in municipal service delivery, with growing recognition of the value of natural assets in the provision of municipal services such as water supply, flood control, and climate regulation. At least 35 BC communities have undertaken natural asset management efforts since 2016. In 2022, the District of Squamish completed a natural asset inventory that valued the municipal water and wastewater services provided by their natural assets at $114M (Squamish, 2022). Valuing these services helps to make them visible within a municipal decision-making context that does not consistently consider the role that natural assets play in service delivery or the actions municipalities can take to protect, maintain, and enhance them. Mainstreaming these actions will contribute to the resilience and sustainability of municipal services, and broader benefits for both human and ecological communities. (ICCA, 2022)
How is this impacting the financial sustainability of our water and wastewater systems?
Natural asset management has gained momentum as a strategy to improve the sustainability of service delivery. Municipalities can play an active role in protecting, enhancing, and maintaining natural assets to provide more sustainable and resilient water and wastewater systems at a lower cost. Conversely, if risks to natural assets (such as climate change or change of land use) are not managed, municipalities may see increased investment needs to build, maintain, or repair grey infrastructure to maintain current levels of service. Additionally, recent work has found that municipalities could mitigate certain legal risks (including negligence and occupier’s liability) by acting to appropriately manage their natural assets (NAI, 2023). The successful implementation of natural asset management will be a key strategy to building financially sustainable water and sewer systems.
3. INFLATION
BC municipalities currently face an inflationary market, which has escalated the capital costs of water infrastructure. According to the Engineering News Record Construction index (which combines rates for labour, concrete, steel, and lumber), inflation over the five-year period of 2017-2022 was 21%. For large infrastructure projects, interviewed communities had seen increases as much as 50% higher than capital planning estimates performed within the past five years. Raw materials, supply chain issues, labour shortages, and increased operating costs have impacted communities of many sizes and geographies.
How is this impacting the financial sustainability of our water and wastewater systems?
As construction costs for infrastructure exceed capital planning estimates, water and wastewater system operators must either raise rates or tolerate reduced levels of service. At the same time, inflation is affecting affordability in all areas of daily life for Canadians, reducing political appetite for rate increases, squeezing our water and wastewater systems from both sides.
4. CHANGING WORKFORCE AND TECHNOLOGIES
The workforce and technologies employed in managing our water and wastewater systems have been undergoing significant changes in recent years. The average age of the workforce has been increasing, leading to a growing need for succession planning and knowledge transfer. Job duties are often not fully documented by long-time workers, increasing the challenges of that planning.
New technologies may increase complexity, but also provide significant opportunities. Data collection and analysis for asset management – including natural asset management - is becoming more economically and technically feasible. Technology allows for the integration of data from various sources, such as sensors and GIS mapping, to create a comprehensive view of infrastructure and its condition. Technology may also enable more tasks to be completed remotely.
ARE OUR WATER SYSTEMS AT RISK?
How is this impacting the financial sustainability of our water and wastewater systems?
Operational excellence was a key source of cost savings identified by interviewed communities, with assets operating more efficiently and lasting longer when operated by a highly effective workforce. This highlights the importance of effective workforce transitions as large numbers of operators enter retirement, taking decades of experience and knowledge with them. If recruitment challenges are encountered, insufficient staff to replace retirees could impact operations, as well as incurring additional costs for onboarding and skills development to run complex facilities.
Improved data can be used to optimize expenditure through prioritized maintenance and replacement projects and informed financial planning. Technology also allows staff to perform some tasks through monitoring devices and remote access – leading to a potential reduction in staff and associated cost savings. (BCWWA, 2017)

2.0 METHODOLOGY
ARE OUR WATER SYSTEMS AT RISK?
The scope of this report’s analysis is limited to BC municipalities, and does not include regional districts, Indigenous communities, or unincorporated areas. It is likely that many of the systems operated in regional districts and unincorporated areas would have similar trends and observations as identified for municipal systems, however specific data and analysis would be required to make definitive conclusions. The focus of the analysis is on existing infrastructure and levels of service and does not quantify investments needed to address growth or resilience to climate change.
We assessed the financial sustainability of BC’s water and wastewater systems using four steps: Collect Data Estimate Infrastructure Replacement Value Calculate Financial Indicator
1 2 3 4 Conduct Quartile Analysis
2.1 DATA COLLECTION

2021 financial information for 161 BC municipalities was accessed using the provincial Local Government Data Entry System (LGDE) database, and manual data was collected from audited financial statements where LGDE data was not yet available.
The following financial data was collected for each municipality:
1) Community population
2) Annual revenue from water and wastewater service charges/user fees
3) Annual revenue from developer cost charges associated with water and sewer systems
4) Annual water and wastewater operating expenses
5) Annual amortization expense for water and wastewater assets, based on historical cost
6) Annual interest expense associated with water and wastewater
7) Accumulated amortization (or depreciation) on water and sewer system assets, based on historical cost
8) Statutory reserves for water and sewer
9) Accumulated surplus within water and sewer2
2 The 2023 methodology added water and sewer statutory reserves to the accumulated surplus associated with water and sewer funds. Since not all municipalities use their statutory reserves, this creates a more accurate picture of the true funding available than strictly looking at statutory reserves (as was done in 2015)
2.2 ESTIMATING INFRASTRUCTURE REPLACEMENT VALUE

Municipalities are required to record the value of their tangible assets based on the historical (i.e., original) cost, and then depreciate the value of the asset over its anticipated useful life.
For example, consider a water system asset that originally cost $1 million (M) with a useful life of 50 years that has been in service for 20 years. The financial statements would show the original cost of the asset as $1M. Annual depreciation would be recorded as an expense of $20,000 ($1M divided by 50 years – i.e., the useful life of the asset). Accumulated depreciation after 20 years of use would be reported on the financial statements as $400,000 (annual depreciation of $20,000, multiplied by 20 years).
While the current Canadian accounting rules require this “historical cost” method of accounting, it does not reflect the replacement cost of the asset, because of the impact of inflation over the 20 years since the asset was built or purchased. A water system that cost $1M 20 years ago will cost considerably more than $1M when it requires replacement at the end of its 50-year useful life.
To adjust for the impact of inflation in our analysis, an inflation adjustment factor was applied to the historical costs. This approach is further detailed in Appendix A.
2.3 FINANCIAL INDICATORS

The same set of financial sustainability indicators were used as in the 2015 report to enable comparison of results. These indicators were originally selected based on a review of best practices in other jurisdictions, available information, and advice from knowledgeable professionals in the asset management field. The four indicators are outlined below:
Reserves to Operating Expense Ratio
Do reserve savings funds provide sufficient financial resilience against unexpected change?
Operating Surplus Ratio
Do water and sewer rates cover the full cost to operate and sustain the system, including renewal and replacement of existing infrastructure?
Financial Sustainability
Interest Cover Ratio
What is our capacity to finance system renewal using debt?
Infrastructure Deficit Per Capita
How much additional money is needed to fund the replacement of existing infrastructure?
2.4 QUARTILE ANALYSIS

Indicator ratios were calculated for each community and sorted by population into quartiles. Appendix C contains a list of the municipalities included in the report by population grouping.
First, the results were classified based on the population of the community, as this factor is typically associated with the level of complexity of the water system and the resources available to manage it.
Second, we sorted the ratio results from highest to lowest for each population grouping and determined the quartiles. The upper quartile value represents the midpoint of the top 25% of communities with the best outcomes, while the lower quartile is the midpoint of the bottom 25% of communities with the worst outcomes. Within a population grouping, the median value is the midpoint between the highest and lowest ratio values.
Image Source: Turney, S. (2023). Quartiles & Quantiles | Calculation, Definition & Interpretation. Scribbr. https://www.scribbr.com/statistics/quartiles-quantiles/
All graphs report the lower quartile, representing the “worst performing” communities, the median, and the upper quartile, representing the “best performing” communities. These values are used to prevent data distortion by unusually high or low values. Quartile analysis also allows municipalities to assess if their financial status falls approximately in the top 25%, mid-value, or bottom 25% of provincial values. The reporting of values by quartile ensures that results are not skewed by unusually high or low data.

3.0 FINANCIAL SUSTAINABILITY RESULTS
3.1 FINANCIAL INDICATOR #1: OPERATING SURPLUS RATIO
ARE FEES COVERING THE FULL COST OF SERVICE DELIVERY?
The operating surplus ratio indicates whether water and wastewater rates cover the full cost to operate and sustain the system, including renewal and replacement of existing infrastructure.
Surplus Ratio
* Revenue includes funds generated from the sale of services, user fees, and charges.
* Revenue excludes development cost charges (DCCs) because these funds are already allocated towards growth-related infrastructure projects.
* Operating expenses include all operating and maintenance costs, replacement value depreciation, and interest on debt.
INTERPRETING THE RESULTS
An operating surplus ratio of zero or greater
Indicates that rates charged for water and wastewater services are sufficient to fully recover the annual cost to operate and maintain existing water and wastewater infrastructure, including an annual allocation for the eventual renewal and replacement of infrastructure. Full cost recovery is one of the essential elements of achieving good financial standing and sustainable service delivery.
An operating surplus ratio of less than zero
Indicates that the annual costs of providing water and wastewater service are not being covered through water or wastewater rates charged to customers; the ratio value identifies the percentage value that rates would need to increase.
For example, a ratio value of -25% indicates that rates would need to increase by 25% for revenues to cover expenses, including replacement costs. A ratio of less than zero may indicate that these costs are being covered through other revenue sources (i.e., property tax) or that the replacement value of the infrastructure is not being fully funded.
OPERATING SURPLUS RATIO
0.060.090.13
OPERATING SURPLUS RATIO
RESULTS AND OBSERVATIONS
Approximately 1/2 of municipalities are covering the full cost of water and sewer service (including asset renewal) through fees – an increase from 2015 where approximately 1/5 of municipalities were covering full costs.
Although the trend is going in the right direction, approximately half of the analyzed B.C. municipalities do not cover the full cost of service delivery with fees.
*This has generally not led to major service disruptions because the lifespan of water and sewer assets is long – but the risk remains.
The gap between revenues and expenses remains highest with smaller municipalities that don’t have the same economies of scale as larger municipalities.
*This gap is slightly smaller than it was in 2015.
3.2 FINANCIAL INDICATOR #2: RESERVES TO OPERATING EXPENSE RATIO
HOW VULNERABLE ARE WE TO UNEXPECTED EVENTS?
The reserves to operating expense ratio provide an indication of short-term resilience to unexpected changes in revenues or costs, such as those that might occur due to unpredictable events like storms or equipment failure.
Reserves to Operating Expense Ratio
=
Reserves
Cash Operating Expenses
* Reserves include both restricted and unrestricted reserves for water and wastewater, as well as accumulated surplus, but exclude development cost charge reserves.
* Cash operating expenses include all cash-based costs to operate and maintain the system, including the interest on debt. Operating expenses do not include depreciation, as this is a “non-cash” expense.
With the exception of reserves required under the Local Government Act, local governments have flexibility in what reserves are designated for and how funds are spent. There is significant diversity among local governments in the types of reserves held, and available data does not specify if reserves are designated through a local bylaw to capital replacement activities or are available to cover operational expenses.
The appropriate reserve size will vary by municipality and is dependent on specific local conditions, such as condition of infrastructure, financial policies regarding borrowing, borrowing capacity, and asset management plans.
RESERVES TO OPERATING EXPENSE RATIO
50,000-99,999
>100,000
RESERVES TO OPERATING EXPENSE RATIO
RESERVES TO OPERATING EXPENSE RATIO
2,500-9,999 1,000-2,499 0-999
50,000-99,999 25,000-49,999 10,000-24,999
Community Size
Lower Quartile
RESULTS AND OBSERVATIONS
Median Upper Quartile
>100,000
A modified methodology for 2023 to include both statutory reserves and accumulated surplus makes it difficult to compare across the years to 2015 results.
There is no clear relationship between size of municipality and size of reserve.
Reserves in lower quartile across all sizes of municipality were less than annual operating expense.
Reserves can buffer impacts of unexpected changes to operational costs or revenues in the short term.
Reserves alone remain insufficient to fund major infrastructure renewal.
ARE
3.3 FINANCIAL INDICATOR #3: INTEREST COVER RATIO
WHAT IS OUR CAPACITY TO FINANCE RENEWAL USING DEBT?
The interest cover ratio indicates the proportion of revenues required to pay interest on debt.
* Interest expense are the sum of all interest payments for debt servicing.
* Revenues include all annual revenue from sale of water or sewer services, user fees, and charges (excluding DCCs).
INTERPRETING THE RESULTS
The interest cover ratio indicates the proportion of revenues required to pay interest on debt. Municipalities have varying financial policies with respect to borrowing, and varying tolerance for risk.
There is no single recommended interest cover ratio for water and sewer services, but it is important that municipalities make informed decisions about borrowing that also consider future costs for infrastructure renewal and replacement, and how these costs will be covered.
A higher interest cover ratio
Indicates that the municipality is using more debt to finance the cost of their water or sewer assets. Depending on the overall financial commitments of a community, a higher interest cover ratio may limit the municipality’s ability to take on additional debt to finance asset renewal or replacement and may indicate a greater vulnerability to increases in interest rates.
A low interest cover ratio
Indicates that a municipality is using less debt to finance the cost of their water or sewer assets. Depending on the overall financial commitments of a community, a lower interest cover ratio indicates that the municipality may have the financial capacity to use debt to finance asset renewal or replacement.
ARE OUR
SYSTEMS AT RISK?
INTEREST COVER RATIO
2,500-9,999
10,000-24,999
25,000-49,999
Community Size
Lower Quartile
50,000-99,999
Median Upper Quartile
INTEREST COVER RATIO
>100,000
INTEREST COVER RATIO
2,500-9,999 1,000-2,499 0-999
50,000-99,999 25,000-49,999 10,000-24,999
Community Size
Lower Quartile
RESULTS AND OBSERVATIONS
>100,000
Median Upper Quartile
There are municipalities of all sizes with no interest expense for water and sewer.
*The remaining debt capacity depends on use of debt for other expenses with the municipality.
There is an overall decrease in total number of municipalities with interest expense since 2015.
Water services showed an increase in ICR for some of the largest municipalities, and a decrease in ICR for most municipalities with population <50,000.
Sewer services showed a significant decrease in ICR across all community sizes.
Recent increases to interest rates will increase borrowing costs moving forward.
3.4 FINANCIAL INDICATOR #4: INFRASTRUCTURE DEFICIT
WHAT IS OUR INFRASTRUCTURE DEFICIT?
Infrastructure deficit per capita is an indicator of the shortfall in current reserve savings, to replace water and wastewater infrastructure at the end of its useful life.
Replacement Cost Accumulated Depreciation-Reserves
Infrastructure Deficit per Capita
=
Population
* Replacement cost accumulated is the inflation adjusted accumulated depreciation.
* Reserves are funds specifically set aside by the municipality to fund water and wastewater system costs. Reserves include both statutory and general reserves held by the municipality for water and wastewater systems but exclude development cost charge reserves.
* Population is based on the 2021 population estimate for the municipality.
It is important to note that this estimate does not factor in the cost of upgrading existing systems to improve climate resilience, meet new regulations, or address increased capacity demands.
INTERPRETING THE RESULTS
The infrastructure deficit per capita provides an estimate of the unfunded infrastructure investment need per capita. It is based on the theoretical useful life of the water or wastewater asset, its current level of depreciation, less any reserve saving put aside for asset renewal.
Some assets may provide service beyond their estimated useful life, and some may not live up to their useful life. For this reason, infrastructure deficit can be considered an indicator of risk. A higher deficit indicates a higher likelihood of assets failing, and a higher consequence (financial cost) of replacing them. The accuracy of a municipality’s infrastructure deficit can be significantly improved through completing an asset management plan.
The infrastructure deficit calculation takes into account an estimate of the cost to renew the water or wastewater asset today, less any savings (reserves) that may be set aside for renewal of the asset.
There is an infrastructure surplus if current reserves exceed the expected cost to replace the asset.
There is an infrastructure deficit if the expected cost to replace the asset is greater than the current reserves.
An infrastructure deficit due to a shortfall in reserves is not necessarily an indicator of poor fiscal management. Municipalities have several options to finance infrastructure renewal – it can be paid for from “savings” (i.e., reserves that have been set aside for that purpose), or it can be paid for using debt to finance all or a portion of the construction cost when the asset is replaced.
Both strategies (use of reserve savings or debt financing) have merit and are equally valid means of accomplishing asset renewal. It is important, though, for a municipality to have a clear policy about which strategy it wishes to use for asset renewal, so that there is no sudden surprise when an asset reaches the end of its useful life.
INFRASTRUCTURE DEFICIT PER CAPITA
INFRASTRUCTURE DEFICIT PER CAPITA
INFRASTRUCTURE DEFICIT PER CAPITA
RESULTS AND OBSERVATIONS
Infrastructure deficit per capita is highest for small municipalities, but decreases and stabilizes around a population size of approximately 10,000.
Approximately 2/3 of the municipalities showed a decrease in their infrastructure deficit per capita for water and sewer since 2015, and 1/3 showed an increase.
The highest deficits per capita continue to be in smaller municipalities, but those in the 1,000–10,000 population range generally saw decreases.
Infrastructure deficit generally increased for the smallest communities (<1,000 pop.).
The 2023 methodology was modified from 2015 to include consideration of accumulated surplus with reserves, instead of only considering restricted reserves in 2015.
Some trends in the results when compared to 2015 are due to modifications of methodology, however when controlling for differences the trend still shows a decrease.
Median Upper Quartile
Lower Quartile
ARE OUR WATER SYSTEMS AT RISK?
BC’S MUNICIPAL WATER AND WASTEWATER INFRASTRUCTURE DEFICIT
An estimate of the overall water and wastewater infrastructure deficit for BC has been calculated based on the results of the analysis for each community.
A comparison has not been made to the 2015 results because the infrastructure deficit calculation now includes accumulated surplus and calculates historical cost inflation on a percommunity basis. Rather than an evaluation of trend, the total deficit should be considered an evolution toward enhanced estimate accuracy, given significant uncertainty in data quality.
The physical condition of assets provides a more accurate assessment of risk to service delivery than asset depreciation. According to Statistics Canada’s Core Public Infrastructure Survey (CCPI), $7.7B (12%) of BC local government water and wastewater infrastructure in 2020 was in poor or very poor condition (indicating that assets are barely serviceable and require immediate repairs). A further $10.6B (17%) was in fair condition, indicating significant deterioration, but no immediate impacts to level of service and at least 40% of service life remaining. This estimate includes systems run by regional districts.
The discrepancy in our financial statement-based estimates of the total infrastructure deficit in comparison with the data from the CCPI is indicative of the uncertainty and assumptions that exist in high-level estimates of infrastructure deficit due to variability in data accuracy and completeness. These estimates can be used to understand the order-of-magnitude of the deficit. To inform local policy and decision-making, each community should use their own information to a level of detail that is appropriate based on the decision being made.

4.0 WHAT DID WE LEARN ABOUT PUBLIC OPINION?
ARE OUR WATER SYSTEMS AT RISK?
Public opinion about municipal water and sewer services is important to understanding willingness to pay and identifying opportunities and challenges for increasing revenues to improve financial sustainability. We worked with research firm Ipsos to conduct a poll of public opinion to inform recommendations of this report.
KEY FINDINGS FROM THE 2023 POLL ARE:
Public confidence in water and sewer systems is high, demonstrating a trust in local governments to provide reliable service.
Most respondents did not know how much services were worth.
45% did not know what they currently pay for services.
While respondents in the 2014 survey indicated they expected to pay less for water and sewer services, the 2023 survey shows that respondents may be willing to pay slightly more than what they are currently paying.
Even though most respondents believe climate change will impact water and sewer services, most are not willing to pay (much) to adapt to these impacts.
56% of respondents preferred their water provider save funds regularly to pay for costs of infrastructure upgrades or renewals instead of borrowing funds.

5.0 OVERALL FINDINGS
ARE OUR WATER SYSTEMS AT RISK?
Overall, the financial analysis, public opinion survey, and case studies tell a story of incremental improvements for most municipalities when compared to the 2015 results. More communities are covering the full cost of service through fees than in 2015, although approximately half still do not achieve this. Anecdotal information gathered through case studies suggests that investments made to implement asset management practices have contributed to improvements in financial sustainability, alongside other factors such as having supportive leadership from staff and council.
This progress is promising, but significant work remains to avoid service level declines or disruptions – particularly considering impacts of climate change and risks to natural assets in watersheds.
This progress is promising, but significant work remains to avoid service level declines or disruptions – particularly considering impacts of climate change and risks to natural assets in watersheds.
The financial sustainability of small systems continues to be a significant challenge, and the gap between revenues and expense remains highest with smaller municipalities. The infrastructure deficit per capita decreased for most municipalities but increases seen were generally in the smallest municipalities.
There is an opportunity to build awareness among the public about the true cost and value of their water and wastewater services, as well as the need for proactive funding for replacement. Implementing universal water metering can help to build public awareness of the cost of water and wastewater services.

6.0 RECOMMENDATIONS
ARE OUR
SYSTEMS AT RISK?
Improving the financial sustainability of water and wastewater systems in BC will require coordinated action from service providers, the Province and industry associations. This report focuses on recommendations for local government service providers and includes considerations for the Province and industry associations.
6.1 RECOMMENDATIONS FOR LOCAL GOVERNMENTS
Although the analysis in this report is limited to municipal governments, the following recommendations are also applicable to regional districts.
1. TAKE STOCK OF YOUR SITUATION
Assess the financial sustainability of your water and wastewater systems using your own data and the four ratios included in this report³. What are the results? Based on current trends and practices, are the results likely to improve or decline? What are the implications of these results on delivery of water and wastewater services? What other significant risks to service delivery exist, and are there plans for managing these risks?
2. SET TARGETS FOR FINANCIAL SUSTAINABILITY
Work with leadership and your council or board to set targets for financial sustainability. Begin by communicating the current state of financial sustainability with leadership and council or your board. Discuss the results in the context of current trends and practices that are relevant to your community – based on the current context, how do you anticipate the financial sustainability will change? Discuss the implications of the results on sustainable delivery of water and wastewater services and implications for the broader community. Identify areas for change and establish targets and timelines.
3
3. SELECT AND IMPLEMENT STRATEGIES TO ACHIEVE YOUR TARGETS FOR FINANCIAL SUSTAINABILITY
These strategies may include:
1) Implementing or improving asset management practices and systems, including the identification of risks related to changing climate and actions to manage these risks.
2) Identify and quantify the natural assets relied upon to deliver water services and the risks to these natural assets and the services they provide. Implement approaches to managing these risks.
3) Develop long-term financial plans and align fees accordingly.
4) Raise public awareness of the value of water services and the risks to be managed.
5) Inform land-use planning and decision-making with consideration of infrastructure costs, appropriate levels of service, and potential impacts to natural assets.
Additional strategies for improving financial sustainability of water systems are included in a Canadian Water Network study from 2018 called Balancing the Books: Financial Sustainability for Canadian Water Systems.
6.2 PROVIDING FOUNDATIONAL SUPPORT FOR LOCAL GOVERNMENTS
Several organizations and institutions provide support to local governments through means such as capacity building, advocacy, and funding. There are opportunities for these organizations and institutions to take actions to support the financial sustainability of local government water and wastewater systems.
1) Raise public awareness on the value of water systems, what is required to deliver water and wastewater services, and the impacts of climate change. While local governments can take direction action to raise awareness in their communities, resource limitations can make it challenging to reach a broad audience with compelling messaging. Development of an awareness campaign at a regional or provincial level will have better economies of scale and can help to shift attitudes about willingness to pay.
2) Develop a tailored approach to support financial sustainability of systems in small municipalities. Our study categorizes small municipalities as those with a population of less than 1,000. These communities consistently experience challenges with financial sustainability. While most larger communities are demonstrating incremental improvements, the smallest communities are not seeing the same gains – and in some cases are seeing a decline in performance. Small municipalities will likely be challenged to address gaps on their own, and there is an opportunity for organizations who support small municipalities in various ways to evaluate how they can use their available tools to address the gap in financial sustainability, avoiding significant risks to service delivery.
ARE OUR WATER SYSTEMS AT RISK?
Overall, the analysis completed throughout our work tells a story of incremental improvements in most municipalities. Promising progress was seen across most BC municipalities as they took steps towards covering the full cost of service through fees, building financial resilience, and addressing the looming infrastructure deficit. Despite this, significant work remains to avoid future service level declines or disruptions, especially considering the impacts of climate change that BC will continue to face.
More municipalities are covering the full cost of service than in 2015, but they are still in the minority; the impending capital costs of major infrastructure renewal are much higher than the funding available to most BC municipalities, most of all in small communities.
The financial sustainability of small systems that cannot achieve economies of scale continues to be a significant challenge which may necessitate the involvement of higher levels of government to address.
There is also an opportunity to build awareness among the public. Paradoxically, reliable water and wastewater services has led to low public understanding or concern for service delivery and associated risks.
The challenges facing BC’s water and wastewater systems are significant, highlighting the need for municipalities to stay the course in making the incremental progress that has been seen in comparison to 2015, as well as considering the implementation of innovative solutions to enhance the sustainability and resilience of our services.
Nature-based solutions and technology offer promising new means to deliver these services at lower cost, and with many co-benefits such as reduced greenhouse gas emissions and community well-being. These will be of increasing criticality as we chart the path through the turbulent waters of climate change, inflation, and social change. The financial sustainability of these services is a question of generational equity; eventually, the bill will come due; the unknown as of today is which taxpayers will pick up the tab.
ARE OUR WATER SYSTEMS AT RISK?
Blunt, M. (2023). ‘We have to fix it faster’: 28 First Nations communities still under boil water advisories. Global News.
Canada Water Act. (1970). Government of Canada.
Climate Atlas. (2023). Very Hot Days (+30°C) – British Columbia.
Environment and Climate Change Canada. (2020). Municipal wastewater treatment. Government of Canada.
Environmental Operators Certification Program (EOCP). (2017). Water and Waste Wastewater Sector Workforce Strategy. EOCP.
Financial Accountability Office of Ontario. (2019). Costing Climate Change Impacts to Public Infrastructure Project. Province of Ontario.
Getting Nature on the Balance Sheet: Recognizing the Financial Value provided by Natural Assets in a Changing Climate. (2023). University of Waterloo.
Intergovernmental Panel on Climate Change (IPCC) (2023). AR6 Synthesis Report: Climate Change 2023. IPCC.
Municipal Natural Assets Initiative (MNAI). (2023). Natural Asset Infrastructure in British Columbia: Barriers and Opportunities. MNAI.
Municipal Natural Assets Initiative (MNAI). (2017). Defining and Scoping Municipal Natural Assets. MNAI.
Municipal Wastewater Regulation. (2012). Province of British Columbia.
Natural Asset Management Strategy. (2022). District of Squamish.
Statistics Canada. (2022). A culvert operation: Flushing out the data on Canada’s storm water and wastewater infrastructure. Government of Canada
Statistics Canada. (2022). Infrastructure Economic Accounts, average age and remaining useful service life ratio by asset and asset function. Government of Canada
Wastewater Systems Effluent Regulations. (2012). Government of Canada.
Water Sustainability Act. (2016). Province of British Columbia.
Water Today. (2023). Advisories for British Columbia.

APPENDIX A: REPLACEMENT COSTS OF INFRASTRUCTURE
REPLACEMENT COSTS
This excerpt from our 2015 report illustrates the impact of inflation on two key financial indicators.
Two of the four financial indicators utilized in this study are affected by inflation;
1) Operating Surplus Ratio
2) Infrastructure Deficit Per Capita
It is important to consider how inflation can cause the results of each financial indicator above to be misinterpreted. Essentially, when inflation is not accounted for, communities appear to be in a better financial position than they are because their assets are valued at their historical cost, and not the cost of replacement or fair market cost. Historical costs are used in municipal financial statements because accounting is transaction based, and historical costs do not change and can therefore be audited. Historical costs however, need to be adjusted for inflation in order to budget for asset renewal and replacement.
For example: A community owns one well, installed 20 years ago that is at the end of its useful life. They wish to calculate the operating ratio (revenues/ expenses) to determine if their water rates will cover the cost to replace the well. They have the following yearly revenues and expenses:
REVENUES
$17,000 (annual user fees collected)
EXPENSES
$10,000 annual Operating & Maintenance Expense
$1,000 annual Interest Expense
$5,000 annual depreciation cost of well (Original cost $100,000, 20 years ago)
Total annual expense: $16,000
The community calculates their operating surplus ratio (revenue - operating expense/revenue) and determines it to be 6%. This appears to be sufficient because the ratio is greater than zero (revenues are greater than expenses).
Since the well is now nearing the end of its life (2014) the community decides to get a preliminary engineering study completed to determine what they must do to rebuild the well. The study concludes that the well must be replaced and that it will cost $200,000 instead of $100,000 to build the same well because of inflated construction costs.
Now the community notices that its operating surplus ratio drops to -24%. This is just one of the many examples of how inflation can affect the financial indicators which can cause data to be misinterpreted.
To adjust for the impact of inflation in our analysis, an inflation adjustment factor was applied to the historical costs. Accumulated amortization is based on the historical costs of infrastructure, so it must be inflated to achieve a closer approximation of true amortized replacement values. Data was collected for annual amortization expense as well as total accumulated amortization within the water and sewer categories.
Dividing the annual amortization expense by the total accumulated amortization provides the approximate age of a community’s infrastructure. For example, if a community had $7M in accumulated amortization, and an annual amortization expense of $350,000, this would give us an estimated average asset age of 20 years. This allowed us to inflate each community’s accumulated amortization from the approximate average year that it entered a municipality’s financial statements.
With this approach, there is a possibility that results will be skewed by communities with fully amortized assets; this would reduce annual amortization expense, driving the average estimated asset age (and inflation calculations) beyond reasonable levels. To account for this, the oldest estimated date of “purchase” in our analysis was set to 1975.

APPENDIX B: SENSITIVITY ANALYSIS
ARE OUR WATER SYSTEMS AT RISK?
Estimates of replacement costs are not an exact science; while calculating an inflation for each community individually does improve the accuracy of the analysis, there is still considerable uncertainty in true replacement cost values because:
1) The data available for each community is entered by staff into the Local Government Data Entry (LGDE) database; community reporting and segmentation does not always align with LGDE categories (which are the categories of our analysis) so in some cases, the data for accumulated amortization and annual amortization expense may not be accurate.
2) CPI was used to inflate historical costs; this is not an exact measure of the inflation that water and wastewater infrastructure have experienced.
Understating inflationary effects would create the appearance that BC communities are in a better financial position than they truly are; overstating inflation would have the opposite effect. The question is, how much are the results affected by variability in the inflation factor?
To determine the magnitude of the effect, each financial indicator was calculated by reducing the community’s custom-calculated inflation factor by a factor of 50% and then increasing it by a factor of 50%. These created Upper and Lower Bands for all calculated ratios. The first, second and third quartiles were calculated for the Lower Band, Base Values, and Upper Band, for each indicator and within the water and sewer categories.
The following figures illustrate the impact of this variability on the results of our analysis. The vertical lines show the spread of the first, second and third quartile within each inflation factor band.
Figures XA and XB illustrate show that all quartiles of the infrastructure deficit vary significantly as the inflation factor is increased or decreased. As the inflation factor increases, the spread between quartiles increases as well.
Figure XB
ARE OUR WATER SYSTEMS AT RISK?
Surplus Ratio by Inflation Factor Modification Bands
Figure YA
Figure YB

APPENDIX C: MUNICIPALITY
BY POPULATION GROUP
ARE OUR WATER SYSTEMS AT RISK?
100,000 or greater
50,000-99,999
25,000-49,999
Vancouver Nanaimo - C Langford
Surrey Kamloops Vernon
Burnaby Chilliwack West Vancouver
Richmond Victoria Mission
Abbotsford - C Maple Ridge Penticton
Coquitlam North Vancouver - D West Kelowna
Kelowna New Westminster Campbell River
Langley - D Prince George Port Moody
Saanich Port Coquitlam North Cowichan
Delta North Vancouver - C Langley - C Courtenay
10,000-24,999
Squamish Whistler
White Rock
Powell River - C
Fort St. John Parksville
Cranbrook Dawson Creek
Salmon Arm Sidney
Pitt Meadows
Prince Rupert
Colwood North Saanich
Port Alberni Summerland
Oak Bay Terrace
Esquimalt View Royal
Central Saanich Coldstream
Lake Country Nelson
Sooke Williams Lake
Comox Sechelt
ARE OUR WATER SYSTEMS AT RISK?
2,500-9,999
Quesnel Armstrong Lantzville
Qualicum Beach Spallumcheen Pemberton
Ladysmith Oliver Lake Cowichan
Castlegar Metchosin Mackenzie
Revelstoke Duncan Houston
Kitimat Gibsons Enderby
Kimberley Cumberland Princeton
Trail Vanderhoof Elkford
Merritt Bowen Island Sicamous
Hope Sparwood Tofino
Fernie Rossland
Kent Grand Forks
Peachland Golden
Creston Northern Rockies - REGM
Osoyoos Invermere
Smithers Port Hardy
1,000-2,499
Highlands Ashcroft
Chase Burns Lake
Tumbler Ridge Keremeos
Clearwater Nakusp
Anmore Telkwa
Port McNeill Sun Peaks
Chetwynd Lions Bay
Lillooet Fort St. James
Logan Lake Radium Hot Springs
Ucluelet Taylor
Lumby Gold River
Fruitvale Salmo
100 Mile House Valemount
Harrison Hot Springs Kaslo
Barriere Montrose
Warfield
ARE OUR WATER SYSTEMS AT RISK?
Less than 1,000
Cache Creek Stewart
Fraser Lake New Denver
Queen Charlotte Port Edward
Hudson's Hope Alert Bay
Masset Tahsis
Canal Flats Slocan
Sechelt Indian Government Port Clements
Pouce Coupe Granisle
Port Alice Sayward
Greenwood Hazelton
Belcarra Wells
Midway Lytton
New Hazelton Silverton
McBride Zeballos
Clinton
APPENDIX D: CASE STUDIES
CASE STUDY: DISTRICT OF SQUAMISH
COMMUNITY QUICK FACTS
Population:
24,000 (approximately), high growth occurring
Location:
North end of Howe Sound
Geography:
Linearly developed community
Infrastructure Considerations:
Longer linear infrastructure, need to accommodate growth, managing aging infrastructure
This case study summarizes how the District integrated asset management information into capital planning and adjusted rates to cover the full cost of water and water and wastewater services.
CONTEXT
The District of Squamish (the District) adopted their first Asset Management Plan (AMP) in 2010. One of the main findings of the 2010 AMP was that utilities were being underfunded, requiring significant increases in user fees for the water and wastewater utilities.
By adopting the AMP, District Council and staff made a commitment to follow asset management practices and incorporate AM information into planning decisions. This commitment was supported by an Official Community Plan policy requiring regular updates to the AMP and Master Plans (MP).
ADJUSTING RATES
The strategy for increasing rates was informed by public feedback and Council input:
Increasing water utility rates by 15% per year to a total 75% over five years
Increasing wastewater utility rates by per year 13% to total 64% over five years
Ongoing utility rate increases by 1% plus inflation on a yearly basis, generally resulting in a 4% average increase yearly

THE RESULTS
An update to the Water Master Plan that occurred following the rate increase showed that the rate increases had narrowed the funding gap.
The findings of the AMP and MPs inform District financial planning and, in turn, the utility rates. Quarterly reporting to council on utility funding highlights fluctuations in reserve contributions and balances, which may trigger a need to re-evaluate utility rates.
AMPs and asset specific MPs are updated on a five (5) year cycle. This frequency helps the District incorporate changes to economic environment or context that impact costs, including climate change impacts and inflation.
Regular communication between District departments, with Council, and with the public during these updates has resulted in a greater understanding of asset management and the importance of prioritizing water and wastewater investments. Strong asset management practices have significantly improved the financial position of the District’s water and wastewater systems, and emphasize the progress that is possible with incremental movement towards informed goals.

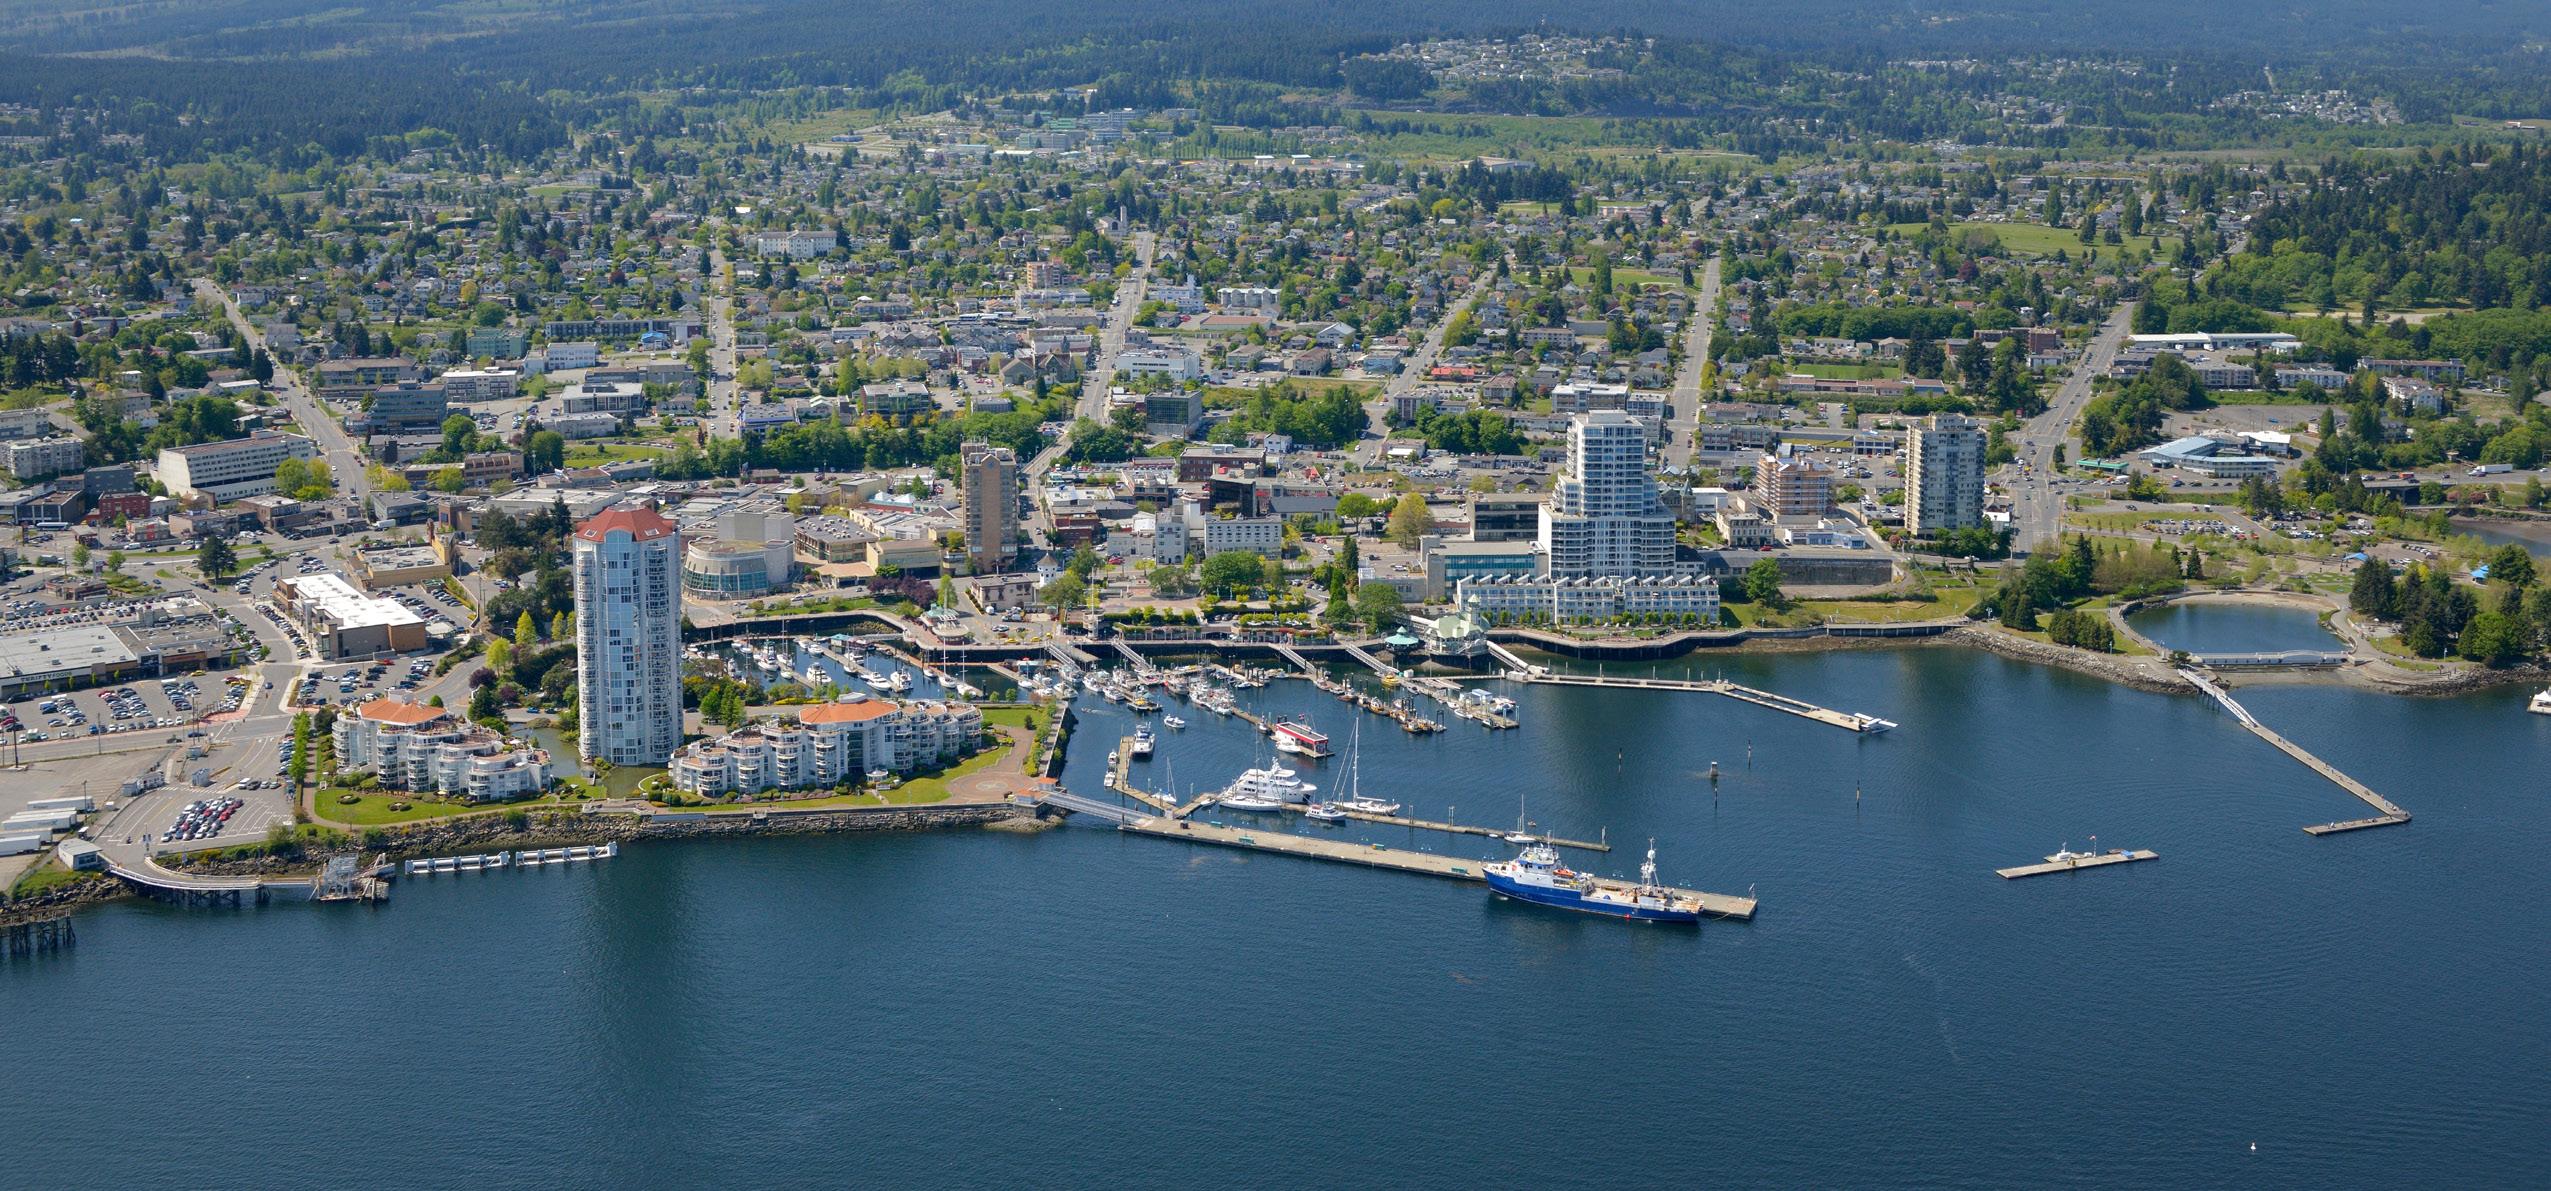
CASE STUDY: CITY OF NANAIMO
COMMUNITY QUICK FACTS
Population:
100,000 (approximately), high growth occurring
Location:
Within Regional District of Nanaimo on east side of Vancouver Island
Geography:
Between ocean and mountains, 5km wide and 20km long
Infrastructure Considerations:
City responsible for collection and movement of sanitary sewage to Regional District facilities
This case study illustrates how the City adopted smart growth principles, and established supportive policy to integrate asset management, land use planning and capital investment decisions.
CONTEXT
Early adoption of universal water metering in the City of Nanaimo (the City) in the 1980s has contributed to broader public awareness of the value of water and an organizational emphasis on cost recovery.
The City adopted their first Asset Management Plan (AMP) in 2010 which provided a "big picture" of projected infrastructure lifecycle replacement needs and current funding levels. This AMP led to the establishment of asset management reserves for infrastructure, including water and wastewater infrastructure. The 2012 AMP update recommended rate increases of 5% for five years for wastewater utility rates and 2.5% for eight years for water utility rates, encouraging effective and informed cost recovery for the services. Updates to the AMP have occurred three times since, with the latest update occurring in 2023. Utility rates are updated regularly to keep up with inflation.
INFORMING LAND USE PLANNING WITH ASSET MANAGEMENT
In 2022, the City adopted a new Official Community Plan (OCP). The OCP was informed by a review of various development options. This review estimated that the central development option would require 25% fewer new roads and utilities than other options, resulting in lower capital costs. This option generated the highest level of public support during the engagement process.
The adopted OCP growth policies encourage central development in urban centres and limit services outside of the established urban containment boundary.

Further OCP policies related to water and wastewater infrastructure encourage asset management life cycle considerations in land use planning and capital investment decisions. These policies support staff to integrate asset management into these critical areas of decisionmaking, a process further enabled by maintaining an updated asset management plan.
RESULTS
By directing growth to areas with existing infrastructure capacity and establishing support for an integrated approach to asset management, land use planning, and capital investment decisions, the City has established a robust framework to support sustainable service delivery and improve the financial position of its water and wastewater utilities.

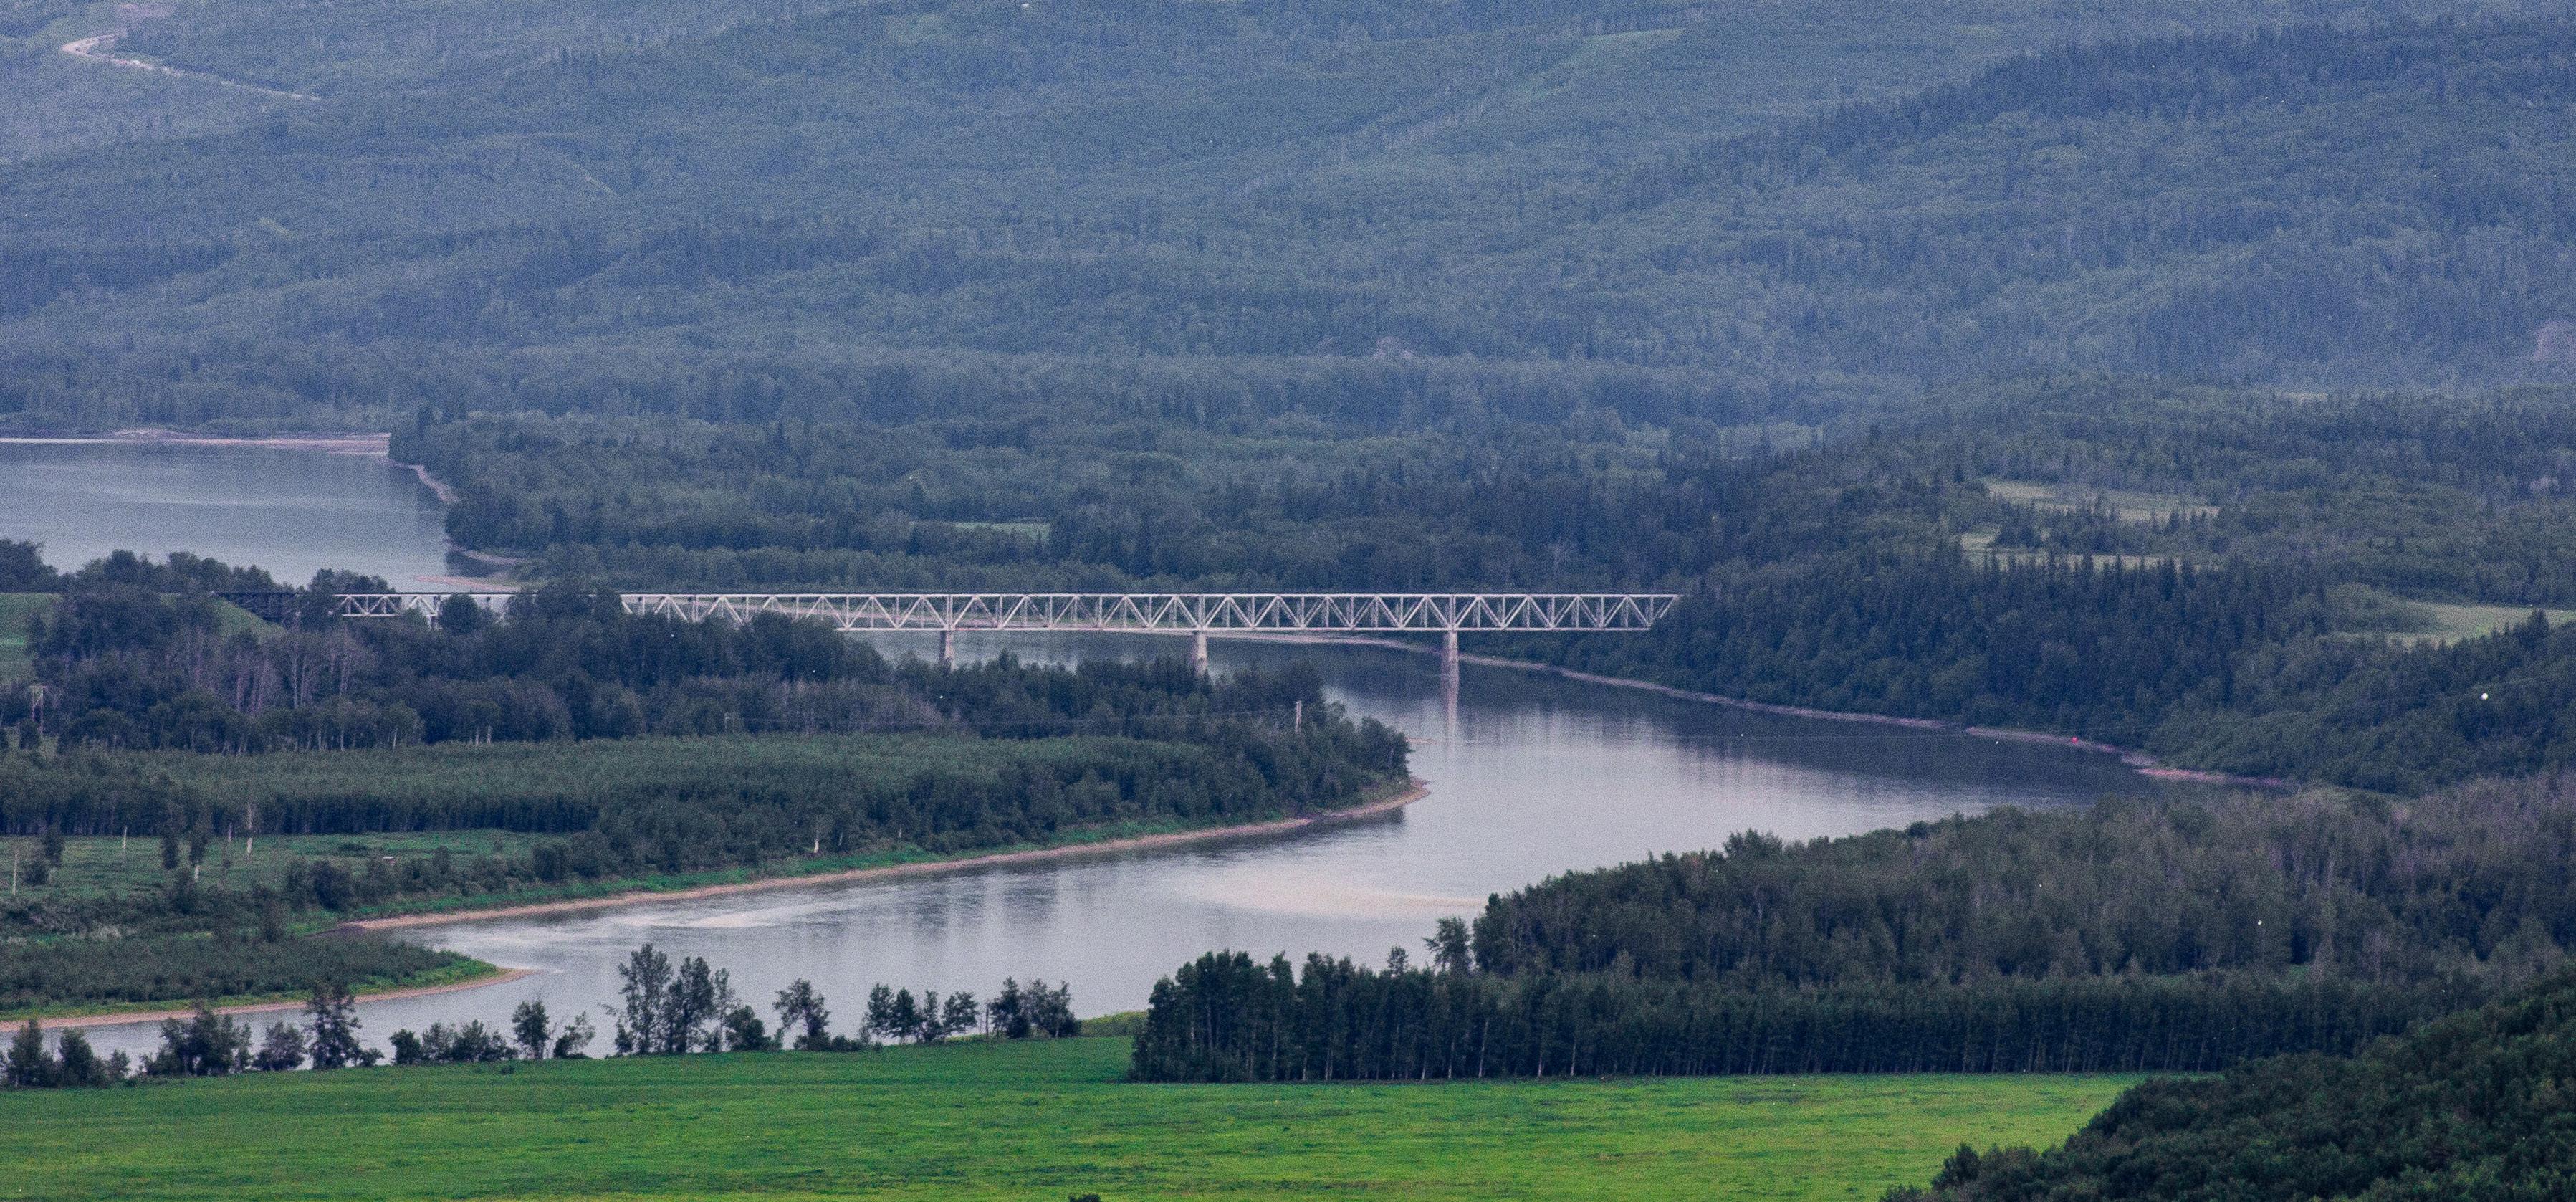
CASE STUDY: CITY OF FORT ST. JOHN
COMMUNITY QUICK FACTS
Population:
22,000 (approximately)
Location:
Within Peace River Regional District in Northern British Columbia close to the British Columbia/Alberta border
Geography:
Radial development pattern, surrounded by Agricultural Reserve Lands
Infrastructure Considerations:
Align long-term priorities to Peace River Regional District considerations
This case study outlines the City’s approach to using asset management to inform capital planning and prioritization of renewal projects.
CONTEXT
Like many municipalities, the City of Fort St. John (the City) has a history of treating water and wastewater services as a "free" resource, charging residents minimal fees. Increases in demand driven by a period of rapid growth from 1995 – 2000 led to capacity challenges with the existing water source and treatment plant, which required a transfer of the main water source intake from Charlie Lake to the Peace River, as well as replacement of the water treatment plant. These events and the associated costs highlighted the need for more proactive utility management and prompted the development of a long-term water supply plan.
FORMALIZING A PROACTIVE APPROACH
Leadership supported a shift in attitudes about water and wastewater services by encouraging management practices to deliver required service levels in a way that is financially sustainable.
Utility management practices were further formalized through policy, incorporating smart growth principals in the 2018 Official Community Plan update, and adopting an Asset Management Policy in 2019. The process of formalization took time, including the establishment of the water metering program, which began in 2006 and fully implemented in 2022.

RESULTS
The City’s time and investment in proactive planning have led to improved sustainability of water and wastewater services.
Annual capital planning addresses asset renewals, prioritizing projects and identifying opportunities for infrastructure upgrades. Operations staff are involved in capital planning, and comprehensive asset management training enables effective feedback and efficient equipment use. Utility rates are adjusted based on funding needs for capital projects. The City maintains a healthy reserve for emergency infrastructure needs.
These consistent practices have contributed to a strong financial position for the City’s water and wastewater services.