EVALUATING AND CONSERVING GREEN INFRASTRUCTURE ACROSS THE LANDSCAPE:


 By Karen Firehock
South Carolina
Practitioner’s Guide February 2015
A

By Karen Firehock
A Practitioner’s Guide
By Karen FirehockThe Green Infrastructure Center Inc.
Edited by Tim Lewis© 2015 The Green Infrastructure Center Inc.
© 2015 The Green Infrastructure Center Inc.
All rights reserved.
Published in Charlottesville, Virginia, USA
By: Full manual by Karen Firehock, Contributions to Chapters Five and Seven by R. Andrew Walker.
Manuscript Editor: Tim Lewis
Select Illustrations: Reed Muehlman
Book Design: Whitney Glick
Funding: Funds for this project were provided by the Urban and Community Forestry Grant Assistance Program administered through the SC Forestry Commission and funded by the USDA Forest Service. Previous editions were also funded by the Blue Moon Fund.


The US Department of Agriculture (USDA) prohibits discrimination in all its programs and activities on the basis of race, color, national origin, gender, religion, age, disability, political beliefs, sexual orientation, and marital or family status (not all prohibited bases apply to all programs). Persons with disabilities who require alternative means for communication of program information (Braille, large print, audiotape, etc.) should contact USDA’s TARGET Center at 202-720-2600 (voice and TDD).
To file a complaint of discrimination, write USDA, Director, Office of Civil Rights, Room 326-A, Whitten Building, Independence Avenue, SW, Washington DC 20250-9410 or call 202-720-5964 (voice and TDD). USDA is an equal opportunity provider and employer.
This book is sold subject to the condition that it shall not, by way of trade or otherwise be lent, resold, hired out of otherwise circulated without the prior consent of the GIC in any form of binding or cover other than that in which it is published and without a similar condition, including this condition, being imposed on the subsequent purchaser.
No part of this book may be reproduced in any form or by any electronic of mechanical means, including information, internet and retrieval systems, without prior written permission from the GIC.
To order copies of the book direct from the publisher contact: Green Infrastructure Center Inc.
P.O. Box 317
Charlottesville VA 22902
434-244-0322
ISBN: 978-0-9893103-3-8
First edition published December 2012, South Carolina Edition published February 2015.
This guide is based upon eight years of research and field tests by the Green Infrastructure Center Inc. (GIC) that sought to evaluate, prioritize and map natural and cultural assets. The GIC is a nonprofit organization which serves federal, state and local government agencies, conservation groups, land trusts and other associations and helps them to make better informed decisions about how to balance growth and development with conservation of their highest quality natural assets.
The GIC seeks to ensure that land-use decisions about what to conserve and how to do it are well informed by the best possible data and objective information. Its overarching goal is to focus development into those patterns that maximize resource conservation and economic efficiency.
This guide is intended to help people make land management decisions which recognize the interdependence of healthy people, strong economies and a vibrant, intact and biologically diverse landscape. Green infrastructure consists of our environmental assets – which GIC also calls ‘natural assets’ – and they should be included in planning processes. Planning to conserve or restore green infrastructure ensures that communities can be vibrant, healthful and resilient. Having clean air and water, as well as nature-based recreation, attractive views and abundant local food, depends upon considering our environmental assets as part of everyday planning.
While there are other books and guides about the benefits of green infrastructure planning, this guide provides practical steps for creating green infrastructure maps and plans for a community. It draws from fifteen field tests GIC has conducted over the past eight years to learn how to evaluate and conserve natural resources. These field tests were conducted in a diversity of ecological and political conditions, at multiple scales, and in varied development patterns –from wildlands and rural areas to suburbs, cities and towns.
During these field tests, the GIC determined three things:
• How to create green infrastructure maps that highlight the most significant resources for conservation.
• Steps to integrate those maps into local and regional plans.
• How to communicate the importance of this work to local officials, planners, developers and others.
While we also drew upon outside case studies, the steps and advice offered here are the GIC’s own interpretation of the most effective ways to evaluate and conserve natural assets. We hope our advice and practical tips can help you become even more effective in your work.
K aren Firehock
Karen Firehock is the author of this guide. She is the executive director and co-founder of the GIC and is on the adjunct faculty in Planning and Landscape Architecture at the University of Virginia. In 1999, she became certified as a mediator to help groups realize common visions for their environmental plans. She also served as the national Save Our Streams program director at the Izaak Walton League of America, where she directed stream and wetland conservation and education programs. She has been the recipient of numerous local, state and national awards for her work, such as a National Greenways Award, a Renew America Award, a United Nations Environment Programme Award and a Virginia River Conservationist of the Year Award, among others. She holds a Bachelor of Science Degree in Natural Resources Management from the University of Maryland and a Master of Planning Degree from the University of Virginia.
R. A ndrew Walker
Andrew Walker is a Geographic Information Systems Analyst and Land Planner at the Green Infrastructure Center. He has a background in geography and urban/environmental planning and specializes in the intersection of geospatial technologies and planning applications, database development, remote sensing for environmental applications, the development of custom GIS models and tools, and dynamic alternatives and scenario assessment. He manages the GIC’s mapping and land planning and provides technical assistance to local governments, regional planning agencies, communities, land trusts and conservation groups. Mr. Walker has a diverse array of public and private sector experience, having worked at the state, county, and local levels on a variety of GIS and planning projects both in the United States and internationally. Since 2013, he has taught graduate courses on advanced spatial analysis in the Department of Urban and Environmental Planning at the University of Virginia (UVA). He holds a bachelor’s degree in Geography from Arizona State University and a Master of Urban and Environmental Planning degree from UVA.
The GIC wishes to extend special thanks to the many partners and colleagues without whom this guide would not be possible. While we cannot thank everyone who has supported the GIC – there have been many – we want to specifically acknowledge the GIC’s past and present Board of Directors and the states of Virginia, Arkansas, North Carolina and New York who were the first recipients of this planning guide. Those who contributed to the South Carolina edition are thanked in the Appendix.
This guide and its accompanying training program were funded by the Blue Moon Fund and the U.S. Forest Service’s Southern Region. These groups also funded several of the field tests. Other field tests were funded by the U.S. Environmental Protection Agency’s Healthy Watersheds Initiative, the Chesapeake Bay Program, the Virginia Environmental Endowment, the Robins Foundation, the Oak Hill Fund, the Altria Group and others. Each state chapter has been funded by its respective state. These partners, as well as community members of the regions, counties and towns in which we worked, have made this planning guide possible.
Jason Bulluck, PhD, Virginia Department of Conservation and Recreation, Division of Natural Heritage.
Patti Erwin, Urban and Community Forester, Arkansas Forestry Commission
Bill Jenkins, Director, Office of Environmental Information and Analysis, U.S. Environmental Protection Agency, Region III.
Buck Kline, Director, Forestland Conservation Division, Virginia DOF
Alan Moore, Regional Urban Forestry Specialist, North Carolina Forest Service
Paul Revell, Urban and Community Forestry Coordinator, Virginia DOF
Richard Roth, PhD, Professor and Chair, Geospatial Science Department, and Director, Radford University Environmental Center, Department of Geography.
Nancy Stairs, Urban Forestry Program Coordinator, North Carolina Forest Service
Allison (Schwarz) Weakley, NC Natural Heritage Program, North Carolina Department of Environment and Natural Resources
Imagine a world where clean water is plentiful, air in our towns and cities is clean and fresh, native species of plants and animals are abundant, access to outdoor recreation is plentiful, natural beauty and verdant landscapes envelop our communities, historic landscapes are well preserved and protected and locally grown food is easily accessible. And imagine that these resources are available to everyone, regardless of income or social status.
While this vision may seem difficult to achieve, it is not impossible. However, it requires greater awareness and more thoughtful attention to how we plan our communities and care for our natural resources. We can have communities that are healthful and people that are healthy – but only if we plan for it. And the time to do that is now.
As far back as 1863, George Perkins Marsh, long considered the father of America’s conservation movement, cautioned in his book Man and Nature that, “The earth is fast becoming an unfit home for its noblest inhabitant…[and]…to threaten the depravation, barbarism, and perhaps even extinction of the species.”
Since Marsh wrote that statement, the United States has come a long way in recognizing the need to actively protect its natural resources. It now has an impressive array of national and local regulations to protect and clean its air, water and soil which compliment voluntary actions, such as reforestation or adopt-astream programs. Yet we have been developing landscapes in patterns that are not sustainable over the long term and do not account for the many ecological services provided by forests, wetlands, rivers, aquifers, soils and geology.
Consider the enormously aggregated ecological consequences of more than 39,000 local government entities – counties, municipalities and townships –that are regulating the use of 70 percent of the U.S. land base. At the site scale, add to that those private landowners and consumers who are making decisions about how they develop or manage their land, such as which forest to harvest, where to channel water flow, or how to draw water from a river or aquifer or how to fertilize their lawns. Without offering all these decision-makers a comprehensive understanding of the interconnectedness of our air, water and land systems, we risk taking steps that could inadvertently compromise or damage the present and future health of our environment. Until we see our natural resources as being part of a connected infrastructure that supports our everyday lives by providing clean air, water and soil, we may not recognize the need to actively conserve them.
While most people would prefer to make land-use decisions that restore rather than deplete our environment, land planners and decision makers may still overlook key natural resources. Just as we plan for our gray infrastructure – roads, bridges, power lines, pipelines, sewer systems, and so on – so should we plan to conserve landscapes and natural resources as our ‘green infrastructure.’
Green infrastructure is “a strategically planned and managed network of wilderness, parks, greenways, conservation easements, and working lands with conservation value that supports native species, maintains natural ecological processes, sustains air and water resources, and contributes to the health and quality of life for America’s communities and people.”
— Benedict and McMahon, Green Infrastructure, 2006.
Green infrastructure can be thought of as the sum of all our natural resources. It includes all the interconnected natural systems in a landscape, such as intact forests, woodlands, wetlands, parks and rivers, as well as those agricultural soils that provide clean water, air quality, wildlife habitat and food. In their book Green Infrastructure, Benedict and McMahon defined it as “a strategically planned and managed network of wilderness, parks, greenways, conservation easements, and working lands with conservation value that supports native species, maintains natural ecological processes, sustains air and water resources, and contributes to the health and quality of life for America’s communities and people” (2006).
Conserving green infrastructure is critical to building and sustaining wildlife and human communities that are healthy, both ecologically and economically. For example, American Forests has estimated that trees in the nation’s metropolitan areas contribute $400 billion in storm water retention by eliminating the need for expensive storm water retention facilities (Benedict and McMahon 2006).
This is not a guide about how to stop development or to limit population growth. Rather, it describes the steps a community can take to determine what is important and to develop a rationale for what to protect. Development can then occur in a manner that recognizes and protects the area’s most important landscape resources. This guide presents a way to think about and catalogue a community’s natural assets as its ‘green infrastructure.’ It shows how to evaluate the different natural assets and to prioritize them for long-term stewardship. This guide provides the steps for determining how to facilitate development in ways that reduce its impact on the landscape, or to restore environmental functionality where it has been lost. Its application can benefit residents, businesses and government.
The intended audience for this guide comprises local land-use decision-makers, such as appointed and elected officials (planning commissioners, planning boards, boards of commissioners, boards of supervisors, city and town councils, town or city managers, and the staff of planning district commissions); college students and faculty in fields such as architecture, natural resources management, conservation biology, environmental science and landscape architecture; natural resource agencies and professionals (rural and urban foresters, extension agents, game and inland fisheries, wildlife managers and conservation groups); associations that manage significant land holdings (land conservancies and land trusts); homeowner associations charged with taking care of open-space lands; and realtors, developers and builders.
While the above list covers an extremely diverse audience, it includes those people who make decisions on how, when and where to develop and conserve land. It is a challenging audience to address because the level of its members’
knowledge of natural resources and planning regulations varies greatly. In order to ensure a level playing field for all readers, the guide includes several definitions of the field’s more common technical terms. Text boxes and sidebars are utilized whenever possible to avoid slowing down the more advanced reader.
The guide also includes examples that demonstrate several different approaches to creating green infrastructure plans, as well as examples of the GIC’s field tests. It is hoped that this guide will spur its users to evaluate, map and conserve their natural assets. Finally, citizens who read this guide can use its ideas to educate local officials about the importance of planning to conserve their community’s natural assets.
This guide is structured as follows:
In Chapter One, we provide an overview of green infrastructure planning, its definitions and a short history of the field.
In Chapter Two, we provide the reasons for undertaking a green infrastructure planning process.
In Chapter Three, we provide the steps to organize a planning initiative including stakeholder engagement and expert consultation.
In Chapter Four we cover steps to evaluate and prioritize natural assets.
Chapter Five provides a case example for mapping natural assets.
Chapter Six includes ideas to build community support for a green infrastructure plan, key messages and options for expanded engagement.
Chapter Seven covers state-specific natural asset models and data sources.
The natural assets that sustain us including:
• Forests
• Water resources: Rivers, wetlands, lakes, estuaries, aquifers
• Soils that support agriculture
• Unique geologic features and landscape forms
Chapter one provides a rationale for why we need to think of environmental resources as ‘green infrastructure.’ It includes a definition, explanation and short history of the term ‘green infrastructure,’ along with basic ecological concepts and the reasons for undertaking an inventory of natural assets to create a green infrastructure network.
Thin king about environmental resources as ‘green infrastructure’ is a way to recognize that they have value to people. Unfortunately, many of us take natural resources for granted, even though they sustain our very existence. Without clean air, water and agricultural soils, we could not survive. How we manage our landscape directly translates into whether we have the high-quality air, water and nutrients to keep us healthy.
In addition, these natural resources are valuable to us in social terms – terms that are difficult to quantify, but include the social and emotional benefits provided by natural beauty and the open, unspoiled vistas that many of us appreciate. In short, they should be considered our ‘green infrastructure.’
Thinking of natural resources as ‘green infrastructure’ helps us recognize that they provide life-sustaining functions, along with tangible economic and social benefits. It also emphasizes that these natural resources need to be connected as a network because they are interdependent and because connected landscapes allow species to recover and repopulate areas that may have been damaged by such disturbances as drought, forest fires, diseases and hurricanes.
“Green infrastructure (GI) planning is a strategic landscape approach to open space conservation, whereby local communities, landowners and organizations work together to identify, design and conserve their local land network, in order to maintain healthy ecological functioning.”
In the wake of Hurricane Katrina which devastated New Orleans and Hurricane Sandy which bludgeoned states in the mid-Atlantic, states are looking to restore and protect their ‘green infrastructure.’ New York and New Jersey, which suffered many billions of dollars of damage from Hurricane Sandy in 2012, are beginning to look towards green infrastructure as a way to mitigate risk and prevent damage.
In New York they are looking to replenish the marshes that once acted as natural storm surge protectors and restore the wetlands that once provided water filtration and flood control. Many scientific studies demonstrate that restoring ‘natural infrastructure’ can reduce significantly the damage from storm surges. “A 2007 study of New Jersey’s wetlands, for example,
estimated that freshwater wetlands saved the state $9.4 billion per year in filtrating and flood control costs, while its saltwater wetlands delivered $1.2 billion per year in protection. Hackensack, NJ – one of the hardest hit states in Hurricane Sandy – lost more than 75% of its wetlands between 1889 and 1995, according to the US Geological Survey” (Cassin 2012).

The recognition of the need to plan for conserving our natural assets has led to the field of green infrastructure (GI) planning, in which local communities, landowners and organizations work together to identify, design and conserve their local land network to maintain healthy ecological functioning. In short, it is an organizing construct that enables us to think about our natural resources as a critical part of our life support system. They are ‘green’ because they are part of the natural environment, and they are ‘infrastructure’ because they provide those basic services that we all need for healthful and restorative living.
Green infrastructure planning evaluates the types of natural and cultural resources available today and prioritizes those assets that are most important to us, or that best meet our current and future needs. In other words, a green infrastructure strategy includes the process of identifying, evaluating and prioritizing those areas we deem critical to preserving a healthy community for the future. Most importantly, we need to not only prioritize them; we need to implement actions to ensure their conservation over the long term.
To create a green infrastructure plan, you should follow these six steps:
Step 1. Set Goals: What does your community or organization value? Determine which natural assets and functions are most important to you.
Step 2. Review Data: What do you know or need to know, to map the values identified in Step 1?
Step 3. Make Asset Maps: Map your community’s highest-valued natural assets that contribute to a healthy ecology and also support cultural and economic values –Based on the goals established in Step 1 and data from Step 2.
Step 4. Assess Risks: What assets are most at risk and what could be lost if no action is taken?
Step 5. Determine Opportunities: Determine Opportunities for protection or restoration. Based on those assets and risks you have identified; determine which ones could or should be restored or improved? And which need the attention soonest?
Step 6. Implement Opportunities: Include your natural asset maps in both daily and long-range planning such as park planning, comprehensive planning and zoning, transportation planning, tourism development and economic planning.
During its field tests, the GIC identified six steps necessary to create a natural asset inventory and strategy. The following is a summary of those steps; they are explained in more detail in the following chapters.
STEP 1. S et Your G oals: W hat Does Your Community or organization Value? Determine W hich Natural A ssets and Functions A re Most Important To You.
All GI planning efforts must start with the establishment of goals. What does your community or organization most value about your natural resources? Is it:
• Forests that provide clean air, water filtration, wildlife habitat or wood products?
• Recharge areas to replenish aquifers used for drinking water supplies?
• Water quality to support healthy fisheries?
• The landscape settings around historic landscapes and battlefields?
• Working farms?
• Nature based recreation, such as hiking trails and recreation areas?
• Landscape features, such as key views and vistas?

• Connections across the landscape for wildlife corridors?
STEP 2. Review data: what do you know, or need to know, to map the values identified in step 1?
Once you have established your goals, it is time to assemble and review all the existing relevant data for your local area:
• Research existing studies and available data: What are their findings and are they relevant? Are the data accurate?
Examples of data include watershed plans, wildlife plans, open space plans, ecological inventories, groundwater studies and air studies.
• Determine what data are still needed if you are to implement your goals: If you are using a Geographic Information System (GIS), you will require data to be arranged spatially in digital layers, which can be analyzed by overlaying them to show patterns and priorities.
Examples of data that you might need to collect include stream buffers, watersheds, key agricultural soils, recreation routes, forested areas, historic structures and wetlands.
A viewshed is a landscape that can be seen from a particular vantage point. It is particularly important in the context of historical sites, such as battlefields and historic houses, where it forms part of those assets’ history or supports scenic vistas for nature-based recreation.
Agritourism is tourism based upon local agricultural products, such as pick-your-own fruit orchards and farms, wineries, cideries, honey producers, local organic beef, pork and chicken farms, or fruit and vegetable stands.

STEP 3. Make A sset Maps: Map Your Community’s H ighest-valued Ecological and Cultural A ssets –Based On the G oals Established In Step 1 and Data From Step 2
Once you have assembled all the existing data and collected additional data to match your goals, it is time to create a natural asset map. This is not a map of all your natural resources, but only those you rank as most important because they fulfill a key goal or are the most unique example of a community value. Depending on your goals, and what your community has valued as of high importance, your maps may include elements such as:
• Large intact forests that provide interior habitat for wildlife.
• Watersheds that provide municipal water supplies.
• Key geological features, such as unique rock outcrops or bluffs.
• High-quality agricultural soils that support farms and farming districts.
• Streams, rivers, wetlands and groundwater recharge areas.
• Nature-based recreational areas (for fishing, boating, hiking, biking, birding, etc).
• Tourist sites that depend on the landscape.
• Historic and cultural features (such as battlefields and historic landscapes).
• In urban areas: street trees, the tree canopy, parks and streams.
• Locations and routes for agritourism (such as pick-your-own fruit orchards and farms, wineries, honey producers, local beef, pork and chicken farms, and permanent vegetable stands).
• Scenic views (viewsheds) or routes through historic or cultural assets that should be protected.
Most at R isk and W hat Could Be L ost If No Action Is Taken?
Once you have created your natural assets map, it is time to assess those assets most at risk:
• Which areas are zoned for development and do they overlap key natural assets?
• Where are new roads or subdivisions planned – will they fragment key assets?
• Which steams are impaired and need restoration or, which streams are in good condition but may decline in the future?
• Which historic structures are in danger of destruction if no action is taken?
• Are there impaired areas where habitat can be restored?
• What viewsheds are threatened?
• Is any mining, drilling or quarrying planned for your region that might affect air or water quality?
• Which assets are most impacted by present zoning and currently planned developments?
STEP 5. Determine O pportunities: Determine O pportunities For Protection or Restoration. Based On T hose A ssets and R isks You Have Identified; Determine W hich Ones Could or Should Be Restored or Improved? A nd W hich Need the attention S oonest?
• Which forests or woodlands that are most threatened, or that offer the most value for forestry, recreation and wildlife habitat, are at risk? Specify why.

• Which historical structures are most important and most under threat? Again, specify why.
• Which recreational areas are of most value and are most threatened? (Perhaps an important hunting area is threatened by a new housing development, or is zoned for industrial purposes, or a trout steam is at risk of pollution from expanded land development and runoff.)
• Explore the extent to which current zoning adequately addresses your county’s or region’s land assets.
• Where should towns or developments be located in the future, so as to allow retention of key resources or to take advantage of access to outdoor recreation?
• Where are new roads or transportation projects likely to impact your assets – should those projects be modified to minimize or prevent impacts?
Based on how you have ranked the key natural assets in your area, and which assets are at risk, you may need to implement projects or policies or make changes in local laws, zoning and comprehensive plans to ensure that the priorities you have outlined are achieved. Here are some examples of questions to consider:
• Given your rankings of your landscape’s top natural assets, where should towns or developments be located in the future?
• Should zoning or the comprehensive plan be changed to better conserve high-priority assets?
• How can the key forests, farms and waterways you have identified be preserved?
• Should funding be sought to acquire development rights?
• Should there be a landowner education program to encourage voluntary conservation action?
• Could the area’s natural assets be utilized in marketing campaigns to expand tourism or attract new businesses?
• Can highly-ranked natural assets be used to prioritize locations for future parks?
• What further data need to be collected, in order to monitor future changes and threats to the area?
• How can local communities, businesses and farmers be best involved in your green infrastructure plan?
• Determine areas important for growth and development, as well as for conservation.
To create a green infrastructure strategy, you need to:
• Determine which natural assets and functions are most important to your community.
• Make an inventory of the location and extent of your natural assets and determine which are of the highest quality and how they are (or could be) connected.
• Identify opportunities for the protection or restoration of these highest-quality assets.
• Develop a coordinated strategy to channel development and redevelopment to the most appropriate locations.

The following are examples of how you can think of natural resources as assets within a green infrastructure planning effort.
Forests play a key role in the water cycle, helping to evapotranspire water into the atmosphere while slowing overland runoff and providing better infiltration of rain into underground aquifers. New York City relies on the vast forests of upstate New York to filter its drinking water and provide some of the cleanest water in the country to its five boroughs. This slowing and storage of runoff water also reduces flooding, since water is released much more slowly from forested landscapes to surface waters than from open fields or impervious areas, such as parking lots.
A forest is not only its trees but also includes the structures and assemblages of forest soils, accumulated leaf litter – also known as the ‘duff’ layer – soil microbes, fungus and the myriad habitat niches provided by overstory and understory trees, shrubs and plants (e.g. herbaceous plants and vines).

Forest cover is the most effective land cover type for reducing runoff pollutants. Tree canopy breaks the energy of rain drops, while the duff layer of the forest floor acts like a sponge, soaking up water, reducing the velocity of overland runoff and breaking down pollutants. In addition, forests absorb air pollutants such as volatile organic compounds, sequester carbon (which helps to abate climate change impacts) and produce oxygen.
Forests also provide habitat for wildlife. Larger forests can support a greater diversity of habitat types and thus more wildlife diversity. In general, the larger an intact forested area, the more likely it is to support a greater diversity of species. In order to support a diversity of wildlife, plant and insect species, a good rule-of-thumb for the size of a forest in the eastern U.S. is a minimum interior size of 100 acres made up of native tree species (e.g. not a pine plantation, but a natural forest with a diversity of tree species). In the semi-arid and mountainous regions of the western and southwestern U.S., a much larger area is needed to support many native forest species. Consult your state’s Natural Heritage Program or wildlife department to determine a good minimum size of forest to support a high diversity of native species in your locality.
Alternatively, some regions may recognize the value of non-forested areas as functioning ecosystems and habitat for viable suites of plant and animal species. For example, throughout the midwest, only minute remnants of native prairie remain, relative to pre-European settlement. As a
result, conservation priorities in these regions are focused on preserving those patches that remain and on finding opportunities to restore native vegetation assemblages. In parts of the country, marshland and open water are the preservation priorities, and not forests, which may actually be encroaching on those areas. Natural resource agencies in your region can provide guidance on the priorities for your locale and the minimum size requirements for such areas.
Natural resources are not just found in wild and rural areas. They also protect and enhance our urban life. Street trees and woodlots keep cities cooler, reduce air-conditioning costs, absorb stormwater and provide habitat for birds and other wildlife. They also provide habitat values for people by producing oxygen and absorbing pollutants. Within new subdivisions, yard trees increase property values and wooded lots are advertised as an amenity.
By raising the attractiveness of an urban area, natural assets improve both aesthetic and economic values. Even individual trees have value. A recent five-city study discovered that, on a per-tree basis, cities accrued benefits from their trees ranging between $1.50 and $3.00 for every dollar invested in their management (McPherson et al, 2005). For example, a large mature oak can transpire 40,000 gallons of water per year; this is water that is not entering storm drains and thereby causing runoff, excessive stream flows and downstream erosion (EPA: Reducing Urban Heat Islands: Compendium of Strategies).
Trees offer many advantages to an urban landscape. They can:
• Raise the attractiveness of an urban area.
• Form part of the ambiance of shopping districts.
• Shade a pedestrian walkway or open-air mall.
• Draw businesses, such as shops and street vendors.
• Revive blighted urban areas.
• Keep city streets cooler and reduce indoor airconditioning costs.
• Filter pollutants from the air and provide oxygen.
• Reduce stress and otherwise improve health.
• Offer shade for seating, children’s play areas and other recreation sites.
• Reduce stormwater runoff.
• Provide respite from the heat and opportunities for social gathering as pocket parks and squares.
• Provide recreational opportunities and wildlife corridors, such as urban river walks and other tree-lined routes.
• Provide habitat for birds and other wildlife.
Trees are also part of the ambiance of many shopping districts. On a visit to Charlottesville, Virginia, Ian McHarg, the Scottish landscape architect who wrote the landmark book Design With Nature, praised the city for replacing what was once the city’s main street with a pedestrian walkway shaded by large willow oaks.
Forested urban green spaces, such as the well-known Central Park in New York City or Rock Creek Park in Washington, DC, are large urban parks that provide respite and enjoyment for people from every social and economic background. Even small parks – often called pocket parks – make some cities very special, as, for example, the green tree-covered squares and gardens of Savannah, GA., which create both an identity as well as a degree of connectivity. Similarly, urban river walks, such as the 13-mile Tennessee River Walk through Chattanooga, TN, or the river walk park along the Connecticut River through Hartford, CT, have led to the revivals of those area’s downtowns, spurring new businesses and greater opportunities for community fitness.

Rivers, Wetlands, L akes, Estuaries, Aquifers
Most people realize that water is vital to our existence. The cleaner the water available, the healthier our human population will be.
All types of surface water, such as streams, wetlands, lakes and groundwater aquifers, springs and seeps, support life: birds and mammals, aquatic plants, fish, invertebrates, crustaceans and mollusks, reptiles and amphibians and people. Estuaries support vital nurseries for young fish, clams and crabs, as well as provide wonderful places to enjoy water sports and scenic views. Surface water also generates opportunities for recreation, such as fishing, boating and birding, and provides aesthetic qualities, such as scenic beauty. Local governments know that rivers, lakes and other water features translate into higher property values and directly support their tax base.
Keeping water supply sources clean can be supported through a thoughtful green infrastructure plan. For example, New York City spent 1.5 billion dollars to acquire 80,000 acres of the watershed that provides its drinking water, in order to restrict development and protect water quality. While this was a large sum of money, it was far less than the $8 billion required to build an adequate filtration plant and an additional $300 million annually for its operating costs (Tibbets, in Benedict and McMahon 2006).
Soils
While soil is defined as the unconsolidated mineral or organic material on the immediate surface of the earth that serves as a medium for the growth of vegetation, we can also think of it as part of our infrastructure. It serves as a medium for growing food, supports vegetation, absorbs water, breaks down wastes and absorbs carbon.

In terms of food production, certain soils are better for supporting agricultural uses, such as row crops or forage for livestock. If we have a map of where those soils are located, we can ensure that areas designated for agriculture can best support those uses. USDA-classified agricultural soils are available as GIS data layers and can be used to evaluate where those soils are located. (For more on this, see Chapter Five.)
In addition, soil data can promote smart planning by showing where soils are well drained and viable for septic systems, or where rural development is not appropriate because the soil is not suitable for septic treatment. Even good soils are becoming important in urban areas as farming takes off in many cities, including Richmond, VA, Asheville, NC and Little Rock, AR.
Geologic features such as rock outcrops, cave and karst features, mountain ridges and unique rock formations are part of what we consider natural assets. These landscape resources contribute to its aesthetic value, whether it is El Capitan in Yosemite, Carlsbad Caverns in Texas, or the Grand Canyon. People place an aesthetic value on types of rocks and minerals, as well as on vistas of ridge tops and valleys.
Geology can also determine the location and extent of unique natural communities/vegetation. The minerals within the rocks as well as physical elements of slope and aspect can determine whether it supports certain species. A landscape’s geology of mountains, hills and valleys also plays a significant role in agriculture, especially for crops such as fruit, that do well on slopes, or those crops that need the fertility of lowlands where soils are deposited. In addition, many developers seek to take advantage of outstanding geological features and emphasize them to their prospective buyers.
Karst and limestone features, such as springs, sinking springs and caves, are also critical natural assets. Not only do those areas provide habitat for many rare, threatened and endangered species (such as cave arthropods or the Indiana bat), they are directly linked to groundwater quality. So are many other types of rock. As a result, impacts above ground might not only affect beautiful natural features, but may have quick and potentially detrimental impacts on drinking water and wildlife habitat. The residents of several coal mining areas in Tennessee, Kentucky and West Virginia are acutely aware of this, as mountain
top removal for mining and filling of narrow stream valleys have impaired water quality. Thus, an understanding of rock types and geologic resources in an area may help prevent a future need to mitigate impacts to the quality and supply of drinking water or wildlife.

Floodplains are also key natural assets because they absorb the energy of floodwaters by allowing them to spread out and slow down during high-water events; accordingly, they reduce the downstream erosive force caused by flooding. Similarly, dune systems buffer coastal areas from floods and erosion associated with storms and protect both man-made structures and coastal land from damage.
Areas that possess a unique geology, such as rare mineral deposits, might be included on a map of natural assets, perhaps for future extraction, but perhaps also for aesthetic reasons. Examples of this are the staurolite ‘Fairy Stones’ of southern Virginia, which are cross-shaped and were formed under the great heat and pressure of the Appalachian Mountain orogeny; the zircon crystal mines in the Wichita Mountains; and the shale barrens of Canada. These are all unique geologies that, while mostly open, serve as hosts to suites of uncommon and rare plants found almost exclusively in these habitats.
Unique geologic features can span many states, such as the quartz crystal deposits that are 30-40 miles wide and run from Little Rock Arkansas to eastern Oklahoma. There
are cliff escarpments and mountain ranges that run for hundreds of miles, each of which forms a unique geology that supports rare plant and animal assemblages, such as the Catskill Escarpment (referred to as the Catskill Front by geologists), a range forming the northeastern corner of the Catskill Mountains in New York state, or the unique vegetation of the “Islands in the Sky” of Arizona and New Mexico.
Across the U.S., communities are mapping and evaluating natural resources as they recognize that their integrity and the interconnections between them are key to long-term community well-being. Historically, these efforts have been known by different names – greenways, greenprints, conservation plans and asset maps. They are often initiated by state agencies, such as forestry and park departments, but other organizations also promote them: natural heritage programs and regional planning districts; university departments; conservation groups, such as the Nature Conservancy, Defenders of Wildlife, the Conservation Fund, the Trust for Public Land and the Green Infrastructure Center; and associations such as the National Arbor Day Foundation and the American Planning Association.
Federal agencies, such as the U.S. Forest Service, the U.S. Fish and Wildlife Service, the U.S. Environmental Protection Agency (EPA), the National Oceanic and Atmospheric Administration and even the U.S. Department of Defense (as a large landholder of significant environmental resources) are taking an active role in supporting green infrastructure conservation and planning efforts. In 2006, federal agencies collaborated on a national publication called Eco-Logical: An Ecosystem Approach to Developing Infrastructure Projects, which was developed primarily to promote conservation and avoid habitat fragmentation by road projects.
In 2007, a consortium of federal agencies supported the Conservation Fund to develop a national self-reporting database of projects (www.greeninfrastructure.net). Also in 2007, the USFS published Forest Service Open Space Conservation Strategy: Cooperating Across Boundaries to Sustain Working and Natural Landscapes, in which Strategy #10 calls for the “development of tools to help communities strategically connect open spaces to build a functioning green infrastructure.” In addition, the joint USFS and EPA’s Healthy Watersheds Initiative have supported the use of green infrastructure as a way to achieve watershed protection.
A greenprint is another name for a green infrastructure plan. For example, Miami-Dade calls its GI plan GreenPrint: Our Design for a Sustainable Future and describes it as ”a fully collaborative process among the many diverse stakeholders of our community.”
A greenway is a strip of natural land or riverside that passes through areas where the public can walk, ride bicycles and horses, picnic, or otherwise enjoy recreation. It also serves as a wildlife corridor that provides species with access to the inner cities.
Green infrastructure planning is not an entirely new concept and its underpinning principles arise from multiple disciplines.
The term ‘green infrastructure’ was first coined in Florida in 1994 in a report to the governor about land conservation strategies. Combining the words ‘green’ and ‘infrastructure’ was intended to reflect the notion that natural systems are equally, if not more, important components of our ‘infrastructure’ and should be included in the planning process. Since it is generally accepted that we have to plan for gray infrastructure, the idea of planning to conserve or restore our natural resources, as in taking care of our ‘green infrastructure,’ was intended to help people recognize its key role in civil society.
In 2007, twelve years after the application of the term ‘green infrastructure’ to refer to natural resources, the EPA began to apply the same term to site-scale best-management practices, such as biofilters (rain gardens), planted (green) rooftops and other stormwater management structures. Previously, these practices were primarily referred to as low-impact development (LID). An LID approach offsets runoff pollution from the built environment by the use of integrated best management practices, such as a series of rain gardens to slow and filter stormwater within recessed planting beds whose plants and soil break down pollutants.
The application of the term ‘green infrastructure’ to site-scale, engineered stormwater management has led to confusion. This guide employs the term strictly as it was first coined by Florida – as a landscape-level evaluation of natural assets for a region, county, town or city. We also introduce the term natural asset evaluation and mapping to more directly reflect the GIC’s focus on evaluating natural landscape resources and conserving them first, before seeking engineered solutions to mitigate impacts from the built environment.
However, while this guide focuses on the larger landscape scale, it does not ignore the importance of these site-scale solutions at all. Rather, it explores how to think at multiple scales – from the site to the neighborhood, to the town, city, county, watershed and region – and then back again. In fact, it is important to realize that natural assets need to be assessed and reconnected at multiple scales. So first, protect natural assets and minimize land disturbance while keeping the landscape connected. Then second, employ LID features to mitigate stormwater runoff at the site scale.
“Green infrastructure planning provides an opportunity for communities to approach land-use planning in a new way by evaluating, prioritizing and managing the landscape as a connected and interdependent system.”
Several disciplines have addressed the idea of a connected landscape and the importance of selecting and connecting large habitat areas, including the fields of planning, landscape architecture, ecology and conservation biology, forestry, and more recently, transportation. The following is a brief summation of the key concepts they have developed.
Greenways or green corridors are “linear open spaces that preserve and restore nature in cities, suburbs and rural areas…to link parks and open spaces and provide corridors for wildlife migration.”
The notion of a connected landscape was popularized by the greenways movement. In the late nineties, Charles Little wrote Greenways for America (Creating the North American Landscape), which popularized an existing movement to get Americans out of their cars and into the landscape through what he called “greenways” (Little, 1995). These were loosely defined as “linear open spaces that preserve and restore nature in cities, suburbs and rural areas…to link parks and open spaces and provide corridors for wildlife migration.” Later, the concept of green corridors was introduced, with much the same meaning.
However, green infrastructure is far more than greenways.
In the early 21st century, authors such as Benedict and McMahon defined green infrastructure as “a strategically planned and managed network of wilderness, parks, greenways, conservation easements, and working lands…” They defined this network in terms of “hubs” that were joined by “links.” They also brought in the notion of multiple scales, and stressed the importance of connecting specific local sites into a wider system of links and hubs. Other writers then developed the concept, though they often used different terms.
Around the same time, Hellmund, Smith and Somers updated the notion of greenways to incorporate the connection of large-scale habitats in their book Designing Greenways: Sustainable Landscapes for Nature and People (2006). Significantly, they developed a more useful and wider description of green infrastructure that built upon the greenways movement but also incorporated theories of landscape ecology from earlier work by noted landscape ecologist R.T.T. Forman. They discussed Forman’s notion’s of edges, patches, and why the shape and size of habitat areas are extremely important as drivers for the dynamic flow of materials, insects, plants and animals into and out of these habitats.
Green infrastructure encompasses much more than river greenways or green corridors. While GI planning appreciates corridor greenways as critical connectors between habitats, it sets them within a wider structural context. Rather than regarding the corridors as the focal point of a green strategy, it emphasizes the role of those corridors as links between larger blocks of intact habitat that provide sizable, wildlife-sustaining cores capable of supporting a diversity of species. It places a significant value on these core habitats, depending on their integrity, size and quality. The corridors are important, but without the cores, there is significantly less overall diversity in the landscape.
W hether you prefer to use the terminology of “hubs, links and sites,” “patches, cores, corridors and sites,” or “cores, corridors and sites,” (which we use in this guide), the principle is still to conserve large blocks of intact habitat that are connected by corridors that allow for species movement. Species use the corridors to forage, nest, breed, and move and disperse between core areas.
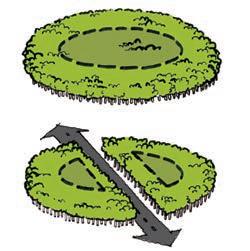
Note also that each core consists of two parts: a central area of undisturbed wildlife habitat, which is surrounded by an edge area that absorbs impacts from outside the core (such as erosion, wind, human intrusion and invasive species). This edge habitat serves as a buffer; protecting the inner core habitat from encroachment.

Patch: a relatively homogeneous, nonlinear area of natural cover (such as a forest, desert region, marshland, or grassland) that differs from its surroundings.

Core: A core is an area or patch of relatively intact habitat that is sufficiently large to support more than one individual of a species. Consider that the greater the number of interior species present and the greater the diversity of habitats, the more important it is to conserve the core intact.
Edge: The transitional boundary of a core, where the vegetation assemblage and structure differs markedly from the interior, such as forest edges. The structural diversity of the edge (with different heights and types of vegetation) affects its species diversity, as well as the prevalence or abundance of native or invasive species.
need to be wide enough to allow wildlife to progress across the landscape within conditions similar to their interior habitat. For this reason, it is recommended that these connections be at least 300 meters wide: a central 100-meter width of interior habitat, with a 100-meter edge on either side to protect safe passage and buffer against human intrusion and invasive species. Streams are natural corridors and the width of the vegetative corridor on either side should reflect the stream order (i.e. larger streams need wider forested buffers).
In addition to wildlife movement, corridors allow populations of plants and animals to respond to changes in land cover, surrounding land use and microclimate changes over the long term. For example, if a species in a core area is compromised because habitat conditions become unsuitable, it is more likely to survive if it can occupy corridors outside its core that provide some connection to surrounding areas. Thus, the larger a network of interconnected corridors and cores happens to be, the more likely it is that overall species diversity and functioning ecosystems can be maintained amidst a changing landscape.
Corridor: A more or less linear arrangement of a habitat type or natural cover that provides a connection between cores and differs from adjacent land. Corridors are used by species to move between cores, so they
Effects of sun, wind and human disturbance can cause impacts to the edge area. This disturbed area or edge is not counted as part of the interior of the habitat. The interior is mostly protected from these edge effects.
The edge width is determined by taking the average tree height, e.g. 100 feet, and multiplying that values times three. So in the eastern U.S. where average tree heights are 100 feet, the width of the edge is 300 feet. Whatever is leftover equals the interior habitat. Notice how the shape of the core affects the amount of interior. When there is more length of edge, three is less interior.


Stepping Stone: Throughout this network of core areas and corridors, certain smaller areas can provide ‘stepping stones’ between cores. A stepping stone tends to be a smaller area of intact habitat that may not be large enough to sustain a species on its own, but is vital to a population’s success over the network as a whole, as it provides a way to move across the landscape.
If you wish to ensure species diversity, particularly for native species, it is critical to identify, map and protect a series of intact core habitats and their connecting corridors, as well as identify those smaller areas of habitat that serve as stepping stones between larger cores.
In the image below left, a stepping stone has been lost. As a result, if something causes a decline of a species in an isolated core, such as a hurricane, forest fire, disease or over-harvesting of vegetation, the species may be unable to re-colonize it.


Although a similar scenario can occur when a corridor is breached, a cluster of closely-related stepping stones can provide substitute connections and alternate routes for plants and animals. The size and spacing of these areas will determine whether or not the species can cross between them and maintain viability.

Fortunately, corridors can be restored through replanting. Also, some species have a remarkable ability to adapt and discover new paths between core habitats. There was a mountain lion that recently journeyed the hills and prairies of the Midwest from South Dakota to Connecticut, an incredible journey of 1,100 miles (Patch News, Greenwich Connecticut, July 26, 2011). In the summer of 2011, a similarly adventurous black bear migrated from the coastal plain up to Chapel Hill and Greensboro, presumably using the riparian buffers along the Cape Fear River and its tributaries as corridors (Weakley 2012).
Together these cores and corridors form a network. A green infrastructure network seeks to connect habitats to allow species movement.

There are several key advantages of a green infrastructure planning approach:
1. A green infrastructure strategy protects species. The key point to focus on when embarking on a GI planning process is to think at multiple scales. Begin with the wider landscape and consider how connections can be made across multiple areas. By thinking about connections in this way, your strategy will avoid isolating core areas and unintentionally aggravating species loss.
2. A green infrastructure approach can create a more resilient ecosystem. And a resilient ecosystem is better able to maintain its core functions. Here, ‘resilience’ refers to the amount of change a system can undergo and still retain the same controls on its function and structure. (Holling 1973). A resilient ecosystem has the ability to withstand more impacts, such as storm damage, human impact or diseases, and still maintain its core functions.
In order to maintain resilience, it is critical to protect the natural state of an ecosystem as much as possible. Permit as little disturbance to it as you can: as little human intrusion, such as road building; as little fragmentation; as little noise; and as few introductions of alien species.

3. A green infrastructure strategy allows multiple objectives to be met at once. Often referred to as multi-objective planning, a green infrastructure plan should include multiple objectives for open space recreation, habitat conservation and biodiversity, tourism and economic development. Cores, corridors and other land areas that meet multiple goals can be targeted for conservation.
In this chapter we have covered definitions. In the next chapter, we will focus in more detail on the benefits of green infrastructure planning.
Pollinators also benefit from habitat protection.
• Avoiding risk
• Ecosystem services
• Cultural assets
• Vibrant communities
By considering environmental resources as ‘natural assets,’ based on the functions described in previous chapters, we can begin to assign appropriate values to them and recognize their importance to our lives and livelihoods. Determining how to evaluate and manage these resources as key assets will help us meet important community values – for example, if you value wildlife or recreation, assessing your natural assets will help you protect them.
Other values you might wish to emphasize are stormwater treatment, energy savings, aesthetic values, improved community health or a sustainable local economy.
While the idea of natura l resources as ‘green infrastructure’ (GI) has been around for several decades, most local governments are not familiar with it. As a result, it is important to articulate and promote GI’s benefits to staff planners and both appointed and elected officials. We need to stress that these assets need to be evaluated and catalogued as the first stage of land planning, in order to ensure the long-term ecological, social and economic health of our communities, and to enable them to benefit from the considerable financial savings of a green infrastructure approach.
When Ian McHarg was putting forward his ideas in his book Design With Nature (1969), planners had to rely on trace paper, transparencies and long hours of coloring to show the relationships between the land’s natural features, laying one transparent sheet over the other to see where critical drainage or key soils overlapped or intersected. Today, we have digital Geographic Information Systems (GIS), through which we can see these relationships almost instantly by turning on and off digital layers that are spatially related.
However, even with the advent of computer software, remote sensing technology and much faster computers that can analyze as much data on a laptop in seconds as it once took days to process on a mainframe, we do not always utilize the wealth of data available to us. But we need to. We need to do it consistently and as a first step.
A natural a sset planning effort identifies and evaluates existing natural and cultural resources and prioritizes those assets that are most unique, or that best meet current and future needs. To achieve this, any strategy should include a prioritization process to select, rank and conserve those areas that are most critical to a resilient and healthy community.
Ideally, if enough natural assets are protected in the first place, there will be less need to build engineered structures to deal with such problems as stormwater runoff or sea encroachment over coastal areas. Once you have conserved your key natural resources and buildings have been sited to minimize impacts and landscape fragmentation, your focus can turn to mitigating the impacts from buildings and developed surface areas. For example, you can treat stormwater runoff through site-scale low-impact development approaches using rain gardens, green rooftops, permeable paving and a host of other best-management practices that contain, detain and filter runoff.
An illustration of the need to assess existing natural assets on a site as the first step was witnessed by the author. A developer of an affordable housing program proposed cutting down several mature oak trees and replacing them with rain gardens. The trees were already absorbing and filtering the rainwater, while also providing the proposed homes with shade and wind shelter. Fortunately, when the benefits of the existing trees were pointed out by the local planning commission, the developer changed his plans to cut them down. Whenever possible, natural infrastructure should be conserved before seeking an engineered solution to replicate its functions.
While saving a handful of trees on one site may seem to have a small impact, these site-scale conservation approaches can soon add up. A national study of the value of urban tree cover in reducing stormwater problems and improving air quality showed that the trees in our cities are worth more than $400 billion in terms of money saved by not having to build such structures as stormwater ponds or biofilters (Benedict and McMahon 2006).
planning. To quote a past president of the Virginia Homebuilders Association, when he was addressing county planners, “I just want to know what you want and where you want it. You can save us both time and money by telling me in advance what the community desires.”
If you have your key assets mapped out in advance, it allows developers to propose projects that meet current and future community needs. It also saves time later by not having to make multiple reiterations of site plans when yet another key resource is discovered or a new community concern is brought up.
With a map already in place, your community can also choose to enhance its green infrastructure by proactively selecting areas to restore through new plantings, acquisition of land or the creation of new conservation easements that re-link disconnected landscapes.
The key to maximizing a community’s success is to ensure that it has as many choices and options available to it as possible. This is a similar approach to creating an investment portfolio – risk is minimized by having multiple kinds of investments.
In some respects, a healthy community needs to have a diversity of options to provide it with its necessary ecosystem services and ensure that today’s decisions do not unduly foreclose on future options. Evaluating resources now and making sure there are enough of each type ensures that future populations can have abundant natural services and sufficient community character to build a successful community.
“Whenever possible, natural infrastructure should be conserved before seeking an engineered solution to replicate its functions.”
If you identify those assets that are at risk and that you wish to conserve, a map can mitigate against future economic challenges and threats to public safety. For example, if you identify those assets within floodplains and make them off-limits to future development, you can meet your needs to conserve wildlife corridors, while also preventing the loss of life and property damage.
While it is useful for future contingencies to map your natural assets, their links to key cultural resources and their desired future uses, it is also very useful for everyday
Every community that has a zoning ordinance can decide whether or not to allow building in flood zones. However, those that choose to allow it must still follow federal regulations. The United States guaranteed flood insurance opportunities for communities through the Flood Disaster Protection Act of 1973 and amended regulations
of 1994, but those laws only allow localities to develop their floodplains as long as they follow Federal Emergency Management Act (FEMA) guidance for floodwater ingress and egress.
You can also identify other areas of high risk, such as regions vulnerable to sea level rise, and you can include them on your map as areas to avoid. There are currently models and maps available from NOAA that identify these sections of coastline. For more, see Chapter Seven.
example, as land managers and municipalities search for ways to abate the damage and costs of flood events, such as the repeatedly devastating floods of the Mississippi-Missouri river system, many are realizing that the most cost-effective way to alleviate future costs and minimize risk is to avoid building in hazardous areas in the first place, and to infiltrate a lot more water throughout our watersheds by planting far more forested land. Instead of continually trying to flood-proof buildings, some managers are realizing it is cheaper to let floodplains perform their natural function of absorbing floodwater. As a result, the economics of a green infrastructure approach have gained increased recognition, even though we may not always realize that we need to expend time and effort to ensure that these ecosystem services are well maintained. See the text box for an example.
If land planning begins within the context of a local ecological system, it ensures that development is channeled into the most appropriate areas, while environmental functions are protected. This saves both money and energy. In already developed areas, green assets can be reconnected while new development takes place in more suitable areas. And you can even begin to restore lost areas vital to the ecosystem.
In the past ten years, there has been a renewed interest both in landscape-scale planning and in linking ecological services and community needs. Increasingly, localities recognize that livable and healthy communities require the conservation and restoration of healthy forests, accessible open spaces and connected landscapes, in order to provide clean air, clean water, public fitness, wildlife diversity and aesthetic benefits. Often referred to as ecosystem services, these largely free environmental functions are key to creating livable communities. Ecosystem services have quantifiable economic benefits which reduce the cost of providing services within a community.
Ecosystem services are those positive benefits nature provides us, generally for free, that are essential for a thriving community. They include clean air and water, recreational opportunities, beautiful vistas, natural heritage sites, stormwater remediation, healthy foods and places to rest the soul and recuperate.
The notion of ecosystem services has now begun to gain credibility with economists and land planners. For

A very wet fall in 1992, followed by heavy snowmelt in 1993, caused dramatic runoff to swell the banks of the Mississippi River and its tributaries. Streams and rivers overran the levees in the Dakotas, Minnesota, Wisconsin, Illinois, Iowa, Nebraska, Kansas and Missouri. The result was the death of 48 people and $15–$20 billion in property and land damage.
Flood waters covered 2.6 million acres of land. A total of 74,000 people became homeless as navigation was closed on the system’s major rivers for almost two months. The government declared 525 counties in nine states – including all of Iowa – disaster areas.
As a result, the towns of Pattonsburg, and Valmeyer in Illinois and Rhineland in Missouri agreed to relocate to higher ground, thereby letting the floodplain perform its natural function of absorbing flood energies without placing people and property in the watershed at risk. (Los Angeles Times, July 12, 1998).
Even at environmentally impaired sites where some contamination has occurred, natural systems and habitats can be restored. And, more importantly, plans that seek to conserve natural assets can create or sustain linkages so that animals and people are able to move across the landscape.
We can think of ‘green infrastructure’ as an environmental insurance policy that enables traditional economic growth and development in focused growth areas without compromising the health and well-being of the community. If we identify key watershed recharge areas, the best agricultural lands and the most unique and productive forests as a first step, we can ensure that growth does not deplete the resources upon which we all depend for healthy and strong communities. This is especially true when trying to ensure a long-term water supply or seeking to comply with mandates for clean water. If we avoid damaging our best areas and identify opportunities for restoration, we will save both our ecological and economic health over the long term.
“We can think of ‘green infrastructure’ as an environmental insurance policy that enables traditional economic growth and development in focused growth areas without compromising the health and well-being of the community.”
We need to consider the values that these natural resources provide, in order to ensure that we can be intentional about conserving, protecting and restoring them. We need to understand where these natural assets are located, how abundant they are and what is their current condition. This will enable us to determine how best to manage them.
Perhaps the greatest long-term obstacle to local governments adopting new ways of planning that include evaluating and conserving natural assets are the fiscal challenges they face. An often-heard refrain is, “We can’t afford to do more planning in these tough economic times. We need to get rid of rules, plans and regulations in order to attract more development.”
However, that is a false economy. Local governments, chambers of commerce and others should be aware that green infrastructure planning is not an additional burden; it is a way to plan more efficiently and effectively. Having better information at one’s fingertips can both speed up the planning process and make it easier to develop in a way that benefits both the environment and the economy and avoid pitfalls from poor decisions later on. They need not be seen as enemies. Rather, they are compatible elements that will both improve our communities if they are both considered.
If a community wants to be more effective in luring businesses and growing during tough economic times, it should remember that green communities attract companies. Sound planning also helps to ensure predictability for those locating to a new area.
This is also true for real estate development; studies have shown that those who include green space or natural areas into development plans sell homes faster and for higher profits than those who take the more traditional approach of building over an entire area without providing for community green space (Benedict and McMahon 2006).
There is one other compelling fiscal reason for planning the conservation of natural assets as part of a green infrastructure strategy: avoiding costly natural disasters. By including the natural landscape as part of infrastructure planning, it is possible to reduce the threat of extensive flooding by identifying and protecting floodplains, allowing for natural drainage and avoiding building in hazard locales. The risks and costs associated with wildfires can also be reduced or eliminated by evaluating where forests are most sensitive to disturbance and avoiding overdevelopment in those areas. And, if you live in an earthquake zone, you can put strict building codes in place that are intended to mitigate future damage and seek to avoid building close to or on top of fault lines.

It is not a new idea to evaluate natural assets at the beginning of the land development process. Ian McHarg published his seminal book Design With Nature in 1969, in which he proposed that planning must begin with a consideration of the land’s natural features: its soils, slopes, waters and drainage. He proposed the notions of layering information and considering landscape features as resources that must be evaluated in tandem, in order to create a development plan that worked with nature instead of against it.
His approach actually saved money, since it avoided problems of improper site development – such as poor drainage and flooding – and created developments that were more attractive and less destructive.
A study by the National Association of Realtors found that 57 percent of voters surveyed were more likely to purchase a home near green space and 50 percent were willing to pay 10 percent more for a home located near a park or other protected area. A similar study found that homes adjacent to a greenbelt in Boulder Colorado were valued 32 percent higher than those 3,200 feet away (Correll et al 1978). Ensuring property values are maintained is important for localities that need stable tax revenues and for homeowners who need to maintain the investment value of their properties.
Preserving open space helps attract companies that offer good jobs. Small companies, especially those that have a well-paid and skilled workforce, place strong importance on the ‘green’ of the local environment (Crompton Love and Moore 1997). The creative class – artists, media workers, lawyers, and analysts – makes up 30 percent of the U.S. workforce and its members place a premium on outdoor recreation and access to nature (Florida 2002).
In addition, many jobs are dependent on large intact landscapes. A high proportion of southern forest lands that are suitable for harvest are within a zone denoted as the wildland-urban interface – the zone where human encroachment occurs within a largely forested landscape – making it more difficult to harvest trees and manage forests there. For example, controlled burns may be needed to restore forests or encourage native species. When people live close to or within these areas, such management practices
become unpopular or unsafe (2003 Southern Wildland-Urban Interface Assessment). For many states in the Southern U.S., forest industry revenues are in the billions of dollars, so continued urban encroachment into rural areas threatens their rural economies.
A wildland-urban interface (WUI) is a zone of transition between unoccupied land and urban development where development begins to encroach upon and within previously undeveloped areas.
A survey by the American Water Works Association found that a 10 percent increase in forest cover reduced the chemical and treatment costs of providing safe drinking water by 20 percent (Barten and Ernst 2004). Since half of the country depends on surface waters for its potable water supply, reducing treatment costs will benefit more than half the nation and have considerable cost savings.
There are multiple studies of the benefits of urban forest canopy in mitigating the cost of urban impacts. For example, USFS researcher David Nowak studied Washington, D.C.’s urban canopy and found that it stored about 526,000 tons of carbon, which he calculated provides benefits to the city of $9.7 million. The urban canopy also removed about 16,200 tons of carbon per year, at an estimated value of $299,000, along with 540 tons of air pollution, estimated to be worth an additional $2.5 million per year (Nowak 2006).
For those who depend on well water, forests recharge aquifers by holding water, filtering it and allowing it to slowly infiltrate down, instead of running off quickly (and causing other problems, such as downstream flooding). The longer a well can remain in service, the lower the cost, since it will not need to be relocated or re-drilled to reach a deeper water table.
American Forests has estimated that “the value of urban tree cover for reducing stormwater problems and improving air quality in cities is worth more than $400 billion.” (Human Influences on Forest Ecosystems: The Southern Wildland-Urban Interface Assessment, 2003).
The Clean Water Act, the Safe Drinking Water Act and a host of other state and local regulations require us to protect the quality of our environment. We can reduce the costs of pollution prevention and cleanup by ensuring that our landscape is as forested as possible. We can also prevent pollution in the first place. Forested landscapes are the most effective land cover for infiltrating water and for filtering and cleaning polluted runoff. Sediment, nitrogen and phosphorus are the three primary types of pollution targeted for reduction as part of the mandatory plan to clean up the Chesapeake Bay, which affects the states of Maryland, Virginia, West Virginia, New York and Pennsylvania, as well as the District of Columbia. And trees and forested landscapes are the most effective way of reducing all three of those pollutants in our waterways.
Protecting watersheds with forested land cover and buffering streams from runoff also help prevent future water quality impairments that are expensive to mitigate under the Clean Water Act’s Total Maximum Daily Loading
(TMDL) provisions. These mandate modeling and cleanup plans for waters found to be impaired, something that affects every state. Planning, with water issues in mind is far less costly in the long run, than trying to rehabilitate an impaired stream.
Forest cover reduces surface temperatures, which keeps cities cooler and more livable. Furthermore, trees absorb volatile organic compounds and particulate matter from the air, improving air quality.
Forests and other natural areas also benefit people who suffer from Attention Deficit Hyperactivity Disorder (ADHD). A study of children who moved closer to green areas found that those who relocated tended to have the highest levels of improved cognitive functioning following the move, regardless of level of affluence (Wells 2000).
Green outdoor settings appear to reduce ADHD symptoms in children across a wide range of individual, residential, and case characteristics (Kou and Taylor 2003).


As you evaluate your natural assets, it is important to consider how they link to or support cultural assets. A cultural asset is a place or feature that is important to the human experience. It forms part of the daily life of a community and is supported by, or includes, natural assets. For example, an historic plantation manor home and its associated outbuildings are set within a landscape. Both the structures and the setting of trees and vegetation are what we consider to be assets.
A cultural asset is a place or feature that is important to the human experience. It forms part of the daily life of a community and is supported by, or includes, natural assets.
A cultural landscape has been defined as “a geographic area, including both cultural and natural resources and the wildlife or domestic animals therein, associated with a historic event, activity, or person, or exhibiting other cultural or aesthetic values” (Birnbaum 1994). For more, see the text box on page 30.
While National Register nominations document the significance and integrity of historic properties, in general, they may not acknowledge the significance of the landscape’s design or historic land uses, and may not contain an inventory of landscape features or characteristics. Additional research is often necessary to provide the detailed information about a landscape’s evolution and significance that is useful in making decisions for the treatment and maintenance of a historic landscape. Existing National Register forms may be amended to recognize additional areas of significance and to include more complete descriptions of historic properties that have significant land areas and landscape features.

When creating a map of natural assets, it is important to identify which natural features also support cultural assets.
A cultural asset is a place or landscape resource that is important to the human experience and is landscape dependent. For example, an historic plantation, a battlefield or an historic district are not simply the obvious and immediate features, but are dependent on the landscape that surrounds them. Imagine Vicksburg without the Mississippi River.
It is important to identify those natural assets that surround and support key cultural and historic features, in order to preserve their context and setting and to buffer them from intrusion. Taken together with other natural and culturally important structures and land uses across a larger scale, these features may comprise a particular cultural landscape.
An example of such a landscape surrounds the Jamestown Settlement in Virginia, where the neighboring James River, the surrounding tidal marshes and the small island itself need to be preserved to maintain the feel of those early settlement years.
A cultural landscape has been defined as “a geographic area, including both cultural and natural resources and the wildlife or domestic animals therein, associated with a historic event, activity, or person, or exhibiting other cultural or aesthetic values” (Birnbaum 1994).
There are four general types of cultural landscapes, but they are not mutually exclusive: historic sites, historic designed landscapes, historic vernacular landscapes, and ethnographic landscapes.
• Historic sites: These are particular structures or highly localized areas, such as battlefields, colonial houses, historic bridges, Indian mounds, lighthouses and tobacco barns.
• Historic designed landscapes: These are wider, more encompassing landscapes that offer an historic context to an important aspect of our past, such as that around the Cahokia Indian Mounds in Illinois.
• Historic vernacular landscapes: These evolved through use by the people whose activities or occupancy shaped them. Their alterations to the landscape determined its current physical, biological, and cultural character. The cultural region of the Ancient Pueblo in southern Arizona and New Mexico, encompassing such sites as Chaco Canyon and Canyon de Chelly, is one example. The Oregon Trail is another.
• Ethnographic landscapes: These contain a variety of natural and cultural resources that people have defined as heritage resources. Contemporary settlements, religious sacred sites and geologic structures can comprise these landscapes. Small plant communities, animals, subsistence and ceremonial grounds are often components. For example, Acoma Pueblo in New Mexico is such a landscape as it is a settlement carved into a massive rock formation that is occupied by indigenous peoples. Another example might be Bear Lodge (Mathó Thípila, or Devil’s Tower) in Wyoming, which is sacred to the Indians of that region.
Oftentimes, when people think about what makes their community special, they have difficulty in pinpointing exactly what makes up its character. When they say they like the rural character or the feel of their neighborhood, it can be challenging to define exactly what they mean. This is due, in part, to the fact that the landscape they see is made up of an assemblage of features that are so familiar, they take many of them for granted.
When asked to define rural character in GIC’s workshops, participants often reply vaguely, in terms similar to, “It looks like home.” Similarly, in urban areas, community members may say imprecise things like, “The street where I live and my neighborhood are important,” “I like the sunset from that bridge,” or “That’s the place where we like to ride our bikes.” No matter how non-specific these comments are, they are part of the notions that build an individual’s and a community’s sense of place.
Indeed, the character of a place largely comprises familiar, non-specific stimuli that create these vague individual feelings – such as a pretty view where you went on your first date, a tree filled streetscape that you helped plant as a child, the park where you’ve walked your dog for the last ten years, or an historic area where your grandfather lived – along with the memories, stories and shared community experiences that together create something indefinably special. Many of these special or unique experiences are tied to our immediate surroundings – the built and natural resources of our landscape. Their vagueness does not mean they should be disregarded. Rather, we need to find ways to define them and incorporate them into our planning.
It is important to identify these culturally significant landscapes, natural features and settings as part of a green infrastructure planning effort. A Civil War battlefield, the spot where people were sold into slavery, or the view from a family-run orchard can be essential to a community’s sense of identity. For example, a 2012 ceremony recognized the importance of the Rappahannock River in central Virginia, across which hundreds of slaves escaped to freedom during the Civil War. The river is a natural resource, but it is also a cultural artifact that is part of community history and identity. Recognizing that natural resources serve as a context for the built environment and often serve as the historic feature themselves, is key to evaluating the importance of natural assets.
Often, those areas that can be seen from a particular vantage point are referred to as viewsheds. A viewshed is made up of key landscape features and includes those iconic components – cultural resources, ridgelines or geology – that form part of a landscape’s context. An important viewshed can be identified by a community and included in a map of its natural and cultural assets. It may be an attractive view from a scenic road or include cultural resources such as an old barn, a 19th century church or an historic mill.
A few years ago, a large, privately owned observation tower was removed from the viewshed of Gettysburg in an attempt to restore the view looking across the battlefield. At Monticello, President Jefferson’s former home in Virginia, the summit of a nearby hill was recently purchased to prevent any development taking place on it that would ruin the view Jefferson once appreciated. Similarly, at President George Washington’s home, the Mount Vernon Ladies Association, which owns and runs his estate, worked with the State of Maryland and landowners across the Potomac to avoid building in ways that would mar the view from Mount Vernon across the river.
Usually, a community will have already identified those iconic views that are important to its character and provide the context for the statement that, “It feels like home.” However, they may not have been recognized as such by the local government in its policy or planning documents, nor be protected by regulations. An historic house may be protected, but the land around it might remain open to a variety of possible developments, such as a quarry or huge retail distribution warehouse.
A viewshed is made up of key landscape features and includes those iconic components – cultural resources, ridgelines or geology – that form part of a landscape’s context and can be seen from a particular vantage point.

A common refrain often relayed in community meetings and public hearings is, “Why did someone put that eyesore (a billboard, cell tower, giant gas station canopy, etc.) in the middle of our favorite view?”
Oftentimes, it is because the viewshed was not identified on any maps or planning documents. Yet, once the damage is done and the view is obstructed, it is often very difficult to restore it.
While those who own the resources in a viewshed have certain rights to develop their properties (based on existing regulations, such as zoning), there are many steps that can be taken to reduce visual impact to other users while still allowing development. Buildings can be shielded from view by putting them in places that take advantage of topography (low areas or areas screen by hills), or they can be screened with trees and vegetation to hide or disguise those built resources that would otherwise detract from the scenic view. For example, structures can be positioned below grade or towers can be disguised. Furthermore, the need for additional cell towers can be reduced by co-locating them with existing towers or attaching them to existing structures, such as grain silos and church steeples.
From the standpoint of economic development, protecting the vistas that visitors can see from a scenic road is very important to ensure a positive experience for tourists. The first impression of an area often influences how long tourists stay and explore, which translates into direct
financial benefits for the region in terms of the number of nights of lodging, meals purchased, visits to gift and craft shops, money spent on entrance fees and gas, and other travel-associated spending. Tourists are less likely to travel through blighted areas to reach an historic or natural area. However, if an area’s scenic roadways are designed to enhance the locality’s historic and architectural character and its beautiful landscape, they will be more inclined to stop and visit its towns and landmarks.

Natural setting is very important to property values. They decline when areas begin to look rundown or overcrowded with signage and dilapidated buildings. It is important to have strong standards for signage size and design, as well as good building codes to address blight, in order to protect a landscape’s natural beauty and its cultural and historical context.
In addition, many businesses depend on key views. Quite a few microbrewers have located to Nelson County, VA, to take advantage of its scenic vistas. People are willing to drive 40 or more miles to drink their beers, not just so they can enjoy a fine glass of malted hops, but to do so while gazing out at a beautiful forested mountain landscape. These microbreweries also depend on the mountainous forested landscape to absorb and filter the water they use in their brewing processes. Similarly, many hotels, inns and restaurants depend on their views to attract visitors. Wineries offer patios with vistas to entice visitors to spend a few hours imbibing both nature and their best chardonnays.
The challenge is to identify those supporting landscapes and natural features and ensure a mutual cooperation between landowners to protect them. The brewer or vintner depends on his view to lure customers, but he usually does not own it.

In Virginia, visitors spend $9.1 billion each year visiting historic and cultural sites (Hollberg and McMahon 1999). Most of them come to experience historic settings, such as Mount Vernon or Monticello, to visit Civil War sites such as Appomattox, The Wilderness and Chancellorsville, or to experience the wondrous vistas from the Blue Ridge Parkway. All of those sites are enhanced by preserving their viewsheds.
Sky Meadows State Park in Virginia works with their neighbors to preserve this historic landscape view seen from the park.In some Western states, landowners who want to preserve a viewshed will pay neighboring landowners to keep it that way. Some ranchers are reimbursed by adjacent homeowner associations to maintain their ranches because the viewshed is what attracted the homebuyers to the area in the first place, and is what continues to support their property values.
Water supply is another key application for natural asset plans. If a community is likely to need to draw from other surface or groundwater sources to supply future population growth, additional land use covenants may be needed now to protect any drainage area that will supply a future reservoir, groundwater aquifer or drinking water intake pipe. All too often, lax zoning regulations and overdevelopment around reservoirs mean that, when communities seek to tap those supplies, they learn that treatment costs have risen substantially or that reservoirs have silted in and lost capacity. Groundwater aquifers may also lose capacity when impervious paved surfaces prevent rainfall from filtering into the soil and recharging them.
When assessing cultural assets as part of your green infrastructure map, it is important to ask yourself two questions:

• Is this feature landscape-dependent?
• Does it need to be supported by neighboring green infrastructure resources, such as mature trees, a forest vista, protective sand dunes, an estuary, or any other unique geologic feature, if it is to retain its character?
If the answer to both is no, then the resource may not be critical to include on your green infrastructure map. If the answer to either is yes, you should consider preserving its viewshed in addition to preserving the feature itself.
If your community has already conducted an historic survey, then those maps can be overlaid with green asset maps (and possibly topography) to determine which areas are supported by the landscape and are dependent on landscape settings.
An illustration of why you need to have a map of key watershed areas was witnessed by the author when a senior university environmental scientist asked the chair of a board of supervisors in 2007, “Why did you permit a large subdivision to be built on top of land that is the groundwater recharge area for our community’s drinking water supply?” One can reasonably guess at the reply from the supervisor; “We didn’t know it was a recharge area.”
All too often, we plan first and ask questions later. This is not the result of a lack of caring; it is simply that local governments are not always in the habit of planning with natural assets in mind as a first step.
The consequences of considering environmental impacts too late in the game can be numerous and very expensive: impaired waters; expensive cleanup plans; higher costs to treat drinking water; flooded towns and neighborhoods; fires that inflict high property damage and loss of life; landslides that destroy neighborhoods; contaminated rivers; brownfield sites; dredging costs; new reservoirs and dams; deeper and more costly wells; lost opportunities for recreation, clean air, attractive landscapes and strong economies… The list goes on and on.
Conserving natural assets also avoids risk. One particular example of risk avoidance is to reduce exposure to wildfires in the high-risk areas of the wildland-urban interface (WUI), which include a large proportion of Southern forest lands. From a risk perspective, homeowners and firefighters face a higher threat when trying to save properties in these areas. Furthermore, the suppression of natural fires in WUI areas has other consequences. It reduces the diversity of the landscape while increasing the frequency of insect infestations. Avoid development in these areas to keep forests healthy and people safe.
By better managing your natural assets as part of a local land-use planning process, you can:

• Preserve biodiversity and wildlife habitat.
• Combat climate change impacts (through carbon sequestration) and improve air quality.
• Protect and preserve local water quality and supply.
• Provide cost-effective stormwater management and hazard mitigation.
• Improve public health, quality of life and recreation networks.
• Ensure food security by conserving good agricultural soils and preserving local farms.
• Preserve cultural resources, such as historic landscapes and scenic vistas.

• Support rural economies dependent on forest products.
If you want to create a vibrant and healthful community and incorporate demographic trends into your land conservation plans it is key to have a vision for how you want your community to look in the future. A well established trend being discussed today is that of ‘aging in place.’ Baby boomers (those born between 1946 and 1964) are tending to stay in their homes after retirement, rather than move into an elder care facility.
As people age, they are less able to drive to natural areas, parks and trails and they appreciate having them closer to their residences. If you can identify those areas that could
be future pocket parks, greenway or rail-to-trail pathways, not only will they serve a population that chooses to age in place, but they will provide extra habitat for wildlife, birds and pollinators.
Similarly, the younger generation, those under 30, who are sometimes called the “millennials” or “generation Y,” are trending towards urban areas and yet they still want access to green spaces for hiking, biking, kayaking and other recreational activities. Growing populations demand new schools and walking routes that include natural trails, so that their children can walk to school and learn about nature and science locally.
There are many abandoned rail lines, such as the one to the left, that could be re-purposed as trails. A rail-to-trail pathway or bikeway is an old railway line that has been converted into a hiking or biking trail. One notable recent example of this approach is the High Line Park in New York which took an abandoned elevated subway track in West Manhattan and turned it into a greenway that runs right through the heart of the borough. Another example is the American Tobacco Trail (ATT) which is a 20 mile long rail trail built from an abandoned railway that served the American Tobacco Company in the 1970s. Today it crosses through the city of Durham and the counties of Durham, Chatham and Wake in North Carolina. It then links into the larger East Coast Greenway spanning multiple states.
Now that we have laid out the reasons for undertaking a green infrastructure planning and mapping process, we can delve into the steps for organizing your initiative, which is the focus of Chapter Three.

• Determine the scope
• Get organized
• Engage stakeholders
In this chapter, we focus on two key steps to organize a green infrastructure planning initiative: first, how to create a process to engage stakeholders; and second, how to formulate relevant goals.
However, before we start, it is important to consider two other points: the scope of your effort – how extensive it will be; and the geographic scale of your effort: will it cover your community, county, city, region, or an even wider area?
It is vital that you consider the amount of work you are prepared to do, the amount of time and effort you are willing to put in, the resources you have available, and the finances you have to see it to completion. You need to assess these factors before you delve into data collection and analysis. You should develop a clear rationale for what you want to achieve and why you feel there is a need to evaluate and map certain critical natural assets. Otherwise, you may become lost and collect too much, or not the right type of data.

As part of discussing the scope of your project, you need to consider the geographic scale of your effort. There are various scales you can consider, bearing in mind that it is often best to take a multi-scale approach. This means seeing your local effort in terms of a wider regional, or multi-state connective scale. So, even though you may be simply considering your local community park and a river greenway, be aware that it fits into a larger network of green spaces. By taking a wider approach to your green infrastructure plan, you may be able to achieve far more than otherwise.
When considering how best to develop a particular site, a developer should consider how it links to neighboring
sites and into the larger landscape. Similarly, when planning at a regional, county or city scale, a planner should consider how areas of regional or county-wide importance can link to and influence individual sites. No matter which scale you start from – large to small or small to large – you need to think about impacts and influences at multiple scales.
Even when working at the level of a specific landscape or defined area, it is helpful to consider the overall distribution of natural assets in the region and determine how your area fits into such ecological systems as wildlife migration routes, watersheds, bird flyways or other cross landscape features. How does a city or town park fit within a wider scheme that allows wildlife to move into and out of the city, or that allows for a variety of recreation opportunities and wildlife interactions for your population (both people and wildlife) as a whole? For example, could individual parks be linked to regional trails? Frederick Law Olmsted’s ‘Emerald Necklace’ was an early attempt to think of Boston’s city parks as a connected network. Today, we can think about linkages across a city to the region beyond. The Appalachian Trail is a multi-state trail to which there are many spur trails and links to other parks.
In practice, mapping your natural assets as part of a green infrastructure scheme should focus at a landscape scale,

looking across multiple parcels and ownerships. Ideally, this occurs before land development begins. This allows land managers, landowners and planners to consider which areas should be selected for protection or restoration, in order to provide such ecological services as wildlife habitat, recreation areas, stormwater treatment, energy savings, aesthetic values, improved community health and a sustainable economy. This ensures that areas are not cut off, or that ecosystem functions, such as groundwater recharge, are not unintentionally disrupted.
Even inner suburbs, towns and cities can contain unique habitats within them, as well as substantial open spaces. In such urban areas, green infrastructure planning focuses on different scales and types of data. For example, it assesses the citywide tree canopy and the condition of public trees, riparian habitats and stream corridors, as well as the trees and streams in a local district, neighborhood or watershed. It looks at where there are connected blocks of habitat, such as large city parks, trail systems, good locations for community gardens and opportunities for small-space habitat restoration, water features or water infiltration.
Once your plan has identified the types of resources that are important at your chosen scale, you will need to prioritize which resources to conserve and to determine how these resources can best be connected or restored.
Then, once you have prioritized those assets, you should evaluate what opportunities you have to implement your goals at the site scale. If specific sites are proposed for development, you should determine how to best connect their natural resources to your area’s larger, landscape-scale assets.
The illustrations to the right show why it is important to think regionally and act locally. In the first picture, each developer has independently established his own little parcel of green space, conserving green assets locally but fracturing the habitat at a larger scale.
In the second picture, land is developed more densely on the far-right parcel and at medium density in the middle parcel, while the far-left parcel has been entirely preserved as green space through the use of one or more planning tools.

Examples of tools that could be used to avoid development on the left-hand parcel include purchasing development rights (PDRs), transferring development rights (TDRs) and establishing conservation easements to restrict further development, while allowing some existing uses, such as farming or forestry, in exchange for a tax break.

You are now ready to begin your community engagement process by engaging stakeholders and formulating relevant goals.
If you have already organized a group to evaluate and map your natural assets, or if your group consists of an appointed or elected body, such as a planning commission or city council, you may not need to read the following chapter sections. Similarly, your group may be a local land
trust and you may be consulting primarily with your board of directors and not seeking broader community engagement. Or you may be conducting an internal evaluation of assets to decide on where to put a conservation easement. Whichever is your scope, you may still need to engage outside stakeholders to review your plan at some point, so you may want to at least skim this chapter for pertinent ideas.
Community members should be engaged in a green infrastructure planning process as early as possible. They should not learn about the plan for the first time after it is completed. Local citizens should have a role in setting or reviewing a project’s goals so that they have buy in. And they should be re-engaged before the plan is completed, while there is still time to provide meaningful input.
Deciding which natural assets are the most important to identify and conserve is a value-driven process. Determining what is valuable, requires some form of community engagement in order to determine which are the most important natural assets to include. For example, while the best available science can tell us the types of habitats that are important for wildlife, we must first decide that wildlife conservation is important. Furthermore, community support is usually needed for implementation, so establishing goals that meet community needs can be key to ensuring that any strategy to protect those assets is implemented. However, public engagement adds a layer of complexity to any mapping effort because of the multiple and often conflicting perspectives that will be offered.
Notwithstanding the difficulty of public engagement concerning issues that can be highly technical and may lead to conflict, there are many good reasons for engaging the broader community. Daniel Fiorino notes that there are substantive, normative and instrumental reasons why the public should be involved in environmental decision-making (1990). Substantive reasons are that citizens are often able to see problems, issues and solutions that experts miss. Community knowledge can inform and enrich environmental understanding of both problems and potential solutions. Normative reasons are that community engagement can legitimize the committee and its conclusions, while also legitimizing the citizens themselves; giving them a sense of ownership and control based on their participation. Lastly, instrumental reasons include citizens’ ability to aid in implementing the chosen solutions. Simply put, communities are more likely to ’buy into’ ideas that meet goals which they helped to create.
Lastly, change is often initiated from outside of local government. It may be that a community land trust, watershed coalition or other local stakeholder group is the one to begin a process and seek to engage their local government, so their involvement will naturally be from the beginning. The outside group may be able to foster new innovation and may become the key catalyst for green infrastructure planning.
While we have stressed the importance of community engagement; it is not without challenges. Often, when the public is engaged, it is difficult, if not impossible, to incorporate or address the multiple perspectives that are offered. Some ideas can be detrimental or run counter to a project’s goals, while others may challenge you to achieve more with your plan than you first thought possible. However, even if you disagree with the public’s comments or cannot fit their requests into changes or expansion of the project, it is important to allow time for genuine input. This is an important distinction. Genuine input means that each public comment will be considered thoughtfully and may potentially result in a change to the project.
When requesting public comments, it is important to understand that the public is not a monolithic body. Consider that there are actually many publics. Sometimes, they have been characterized as “communities of place,” based on where they live, or as “communities of interest,” based on a particular concern, such as hunters, hikers or heritage tourists.
“Simply put, communities are more likely to ’buy into’ ideas that meet goals which they helped to create.”
A good beginning is usually essential to a good ending, so how you begin and with whom you engage are worth careful consideration as a first step in your process. It is important to ensure that the results of your planning efforts will actually be utilized by the community by engaging stakeholders early in the process. If key stakeholders are not engaged at the beginning, they may not accept or adopt the final outcomes. For example, a state park agency developed a detailed green infrastructure map, but did not first gain agreement from end users that it was needed. The result was a plan that was nice to look at, but was not actually utilized (Duerksen and Snyder 2005). Citizens may even try to thwart the process because they were not part of its inception.
The diversity inherent in the term “public” can result in conflicts over perspectives. Since communities are made up of individuals and organized sub-groups, they may offer suggestions that are polar opposites, such as, “Open this area to recreation,” or “Close this area to protect rare species.”
It is often possible to reach some common ground between differing opinions. In the above example, it may be possible to provide some public access while also protecting other, more fragile habitat areas.
Some opinions, however, might be impossible to reconcile, and a decision will have to be made about which route to take. For example, GIC staff heard these two non-resolvable comments arise in the same meeting: “Bring back the beaver!” and “Kill all the beaver!”
While it is important to consider all comments, you should communicate to stakeholders that your project will not be able to solve or address all community needs and desires, nor should it. If possible, document all comments received, whether or how they were addressed and the reasons for the decisions made.
Before you engage anyone, you may want to conduct a preassessment of the key issues and stakeholders for your effort. This can be useful in formulating or refining your project’s vision. You may want to conduct interviews with those stakeholders to get a sense of community priorities and gain insights on which issues are accepted or controversial.
Some counties and states like the term ‘green infrastructure,’ while others prefer to use the term ‘natural assets.’ Some communities do not want to use the term ‘green’ for anything, out of concern that some members of the public will be afraid of a ‘green agenda.’ These types of hot button issues, which include climate change, green ideas and other terms you might want to avoid, can be learned about during the pre-assessment effort and can help you sidestep unnecessary conflicts later on.
To conduct a pre-assessment, utilize experienced interviewers who can maintain confidentiality. Encourage stakeholders to be as frank and open as possible by assuring them that their identities and responses are kept confidential. You may also decide to conduct several confidential interviews on your own as part of scoping your project. Who to interview is up to you, but one way to frame your assessment is to limit it to those who will have a say in implementing the project, such as the board of supervisors, city council, leaders of conservation groups and agency representatives.
It is advisable to engage potential skeptics early on. People often fear new initiatives because they are not sure what they are about. They may wonder, “Is this a plot to take away my property rights?” or “Is it going to raise my taxes or waste time?” Find out early on what are likely to be people’s concerns. If it is property, development or hunting rights, make sure you have framed your project in a way that alleviates, rather than adds to, those fears. For example, a green infrastructure plan can help to connect habitat that facilitate wildlife movement. This benefits other users such as hunters who need populations of animals to be healthy and abundant to enjoy their sport.
Devise questions based on what it is you need to learn and utilize interview responses to determine how to frame your project in a way that is non-controversial. You can also use them to ensure that you are consulting the key people and data sources, that you have thought through all the possible end uses for the mapping effort, and as a way to build support for your initiative. Prepare a short summary introduction about the project and share that with participants before seeking their input.
Examples of questions that could be used in a stakeholder pre-assessment to scope your project and mapping needs include:
• What is it you want to be able to do (that you can’t do now) e.g protect sensitive watersheds or identify the best lands for agricultural uses?
• At what scale do you want to plan to restore or conserve your assets (town, city, region, watershed)?
• What is most important to you (clean water, forestry, scenic vistas, etc)?
• How would you like to be engaged (as advisors during the process, end-users, or both)?
• What themes (topics) are most important to evaluate and map (wildlife habitats, water, working lands, nature-based recreation)?
• What are some of the key sources of information that we should consult as we try to map our natural resources?
• What areas are at greatest risk from changes to their current land use and which areas might need greater effort to ensure they are maintained?
• Who should be engaged in a mapping effort and why?
Keep in mind that there are many ways and multiple venues – you can utilize to gather community input, such as open houses, presentations, workshops and online questionnaires. These can be collated and used as part of on-going review and engagement.
Consider creating a “Frequently Asked Questions” document and add it to your website, if you have one, to answer questions or concerns that you have anticipated, or learn about during your pre-assessment.
You can also conduct assessments periodically throughout your project by using a focus group or other surveys to gauge community support and address concerns before the project is concluded.
Misinformation can lead to a great deal of headaches for project organizers and conveners. Many times, GIC staff have observed people who come to meetings with the intent to protest a project, but who then change their minds and offer to support it once they understand what it is about. So, the best way to gain community support is to fully understand and address community concerns as early and as often as possible.
Consider creating a “Frequently Asked Questions” document and add it to your website, if you have one, to answer questions that you have anticipated, or learn about during your pre-assessment.
If you are inexperienced in running meetings where multiple and conflicting viewpoints may arise, consider whether you need to hire a professional facilitator. There are many excellent guides for how to facilitate groups, set clear agendas and goals, and resolve conflicts about what is important to include on a map.
All too often, GIC staff have been contacted by localities or planning districts who have created an overly long and impossible list of everything that is important (aka the kitchen sink approach) and have asked the GIC to help them map everything they have listed. Usually the GIC staff begin by first asking, what is important and from there help the community to determine what could or should be mapped.
In practice, the assets that can be mapped and the actions that can be taken are limited. One helpful approach can be to mine existing documents (such as the comprehensive plan, open space plans, vision statements from the board of supervisors or city council) to see what are their existing goals. Then ask, are these goals things that can be mapped and evaluated?
Chapter Four has more details about how to create goals that can be represented with mapping.
Most advisory processes can be separated into three distinct stages – and you need to be aware of the different tasks allotted to each stage.
These three stages are visioning, asset evaluation, and implementation:
At the start of any advisory process, agencies, community leaders, elected and appointed officials, and the general public should consider what kind of community process they want to create and what they would like it to achieve. These discussions will inform the process’s values and goals and will highlight the type of natural assets participants feel it is important to map. Be sure to consider whether your community has an existing vision that can be utilized or modified to suit your project’s needs.
Follow ing on from the visioning stage, scientists, land managers and designers need to evaluate and rank the area’s natural and cultural resources according to the goals and values already set in place. Examples of such experts include landscape ecologists and architects; environmental and open space planners; wildlife biologists; floodplain managers; foresters; and agricultural experts. Those who will be most active in developing the asset map should also be engaged at this stage, so bring in your GIS analysts as well. If you are creating a local plan, you may want to engage laypeople who have local knowledge about where unique resources can be found. You will probably find that many such assets have not been monitored or evaluated and may be missed entirely if you only rely on existing data. And note that expert review will be required of any new data you collect.
This fi nal part of the advisory process involves federal and state land managers, local and regional conservation groups, land trusts, developers, sports groups and others who have a role in managing or conserving the land affected by your goals. At this stage, it is important to re-engage participants from the visioning stage, such as planning commissioners, landowners and local stakeholders, in order to help with implementation. Lastly, consider if the effort will require additional funds to carry it out – whether it is for staffing, land acquisition or public education and outreach.
Planning commission, planning board, environmental review board, appearance commission, agriculture advisory board or other relevant local planning group.
Extension Service
Soil and Water Districts
County/Regional Forester
Game and Inland Fisheries
Farm Bureau
Land trusts
Agencies holding easements
Conservation and environmental groups or associations
Responsible for comprehensive plans, zoning recommendations, land use and area plans.
Determine their priorities for resource conservation (specific types and locations) and programs to help with implementation.
Presentation to seek their input on goals and learn of key needs that could be met by a study.
Personal meetings or in one meeting.
Determine current land that is conserved. Determine if new maps can help them prioritize.
Learn about conservation priorities and current programs to help with implementation. Some groups may have science experts and own or manage key land reserves.
Personal meetings, or in one resource meeting. If working at a regional scale, consider one meeting with all land trusts.
Personal meetings, as part of a committee, or through meetings with individual groups.
Scientists and resource experts
You may need to consult with experts to rank the value of natural resources, such as which forests have more biodiversity or which rivers are most ecologically unique or at risk.
Personal visits or a committee meeting. May consider having committees by theme, such as water, agriculture, forests, recreation, history and culture.
Large land holders
Homeowners or homeowner associations
Developers and homebuilder associations
May have a significant role in land management or may be able to add land to conservation (programs or easement).
If working at smaller scales where joint or coordinated management of open space would make a difference.
Those who are making plans to develop large tracts of land can help to ensure the right pieces are conserved and open space connections are made/maintained.
Personal visits or a landowners’ meeting.
Neighborhood meetings or a community workshop.
Participate on stakeholder committees and through personal contacts.
Representatives of local or regional financial institutions and potential funding organizations.
Regional governance agencies
Regional planning district commissions
Watershed basin commissions
Regional transportation agencies
Engaging those who will or could fund the effort is important to do early on.
If working at a regional scale or including resources that cross jurisdictional boundaries. If crossing state boundaries, consider agencies from other state(s).
As advisors or on a committee.
Individual meetings or presentations to the board or regularly scheduled board meetings.
*Any of these groups may also be part of an advisory committee.
There are several ways to structure an advisory process. A key consideration is that people may not agree on priorities and may need some assistance to reach consensus and manage their competing perspectives. Given that possibility, consider what may be the best structure to enable consensus to happen.
The following are a variety of options to consider. For
additional ideas – both traditional and unusual –about how to build support for the effort, see Chapter Six. Enlisting the help of a professional facilitator also can be a useful way to manage the process.
Stakeholders include anyone with a key stake in the outcome of the process. This may include owners of large and significant land parcels, conservation groups or land trusts who are targeting lands for conservation
and protection, managers of natural area reserves, farmers, foresters, hunt clubs, businesses engaged in forestry, tourism or outdoor recreation, or any category of people who will be affected by or have important knowledge to assist your mapping and prioritization process.
It is key to engage the owners of large land holdings early on. For example, if your plan depends on cooperation and collaboration with a national park or large timber tracts owned by a corporation, you may want to have them serve on your committee from the start. If they do not want to serve on a group, you may want to meet with them individually to share the project’s aims and learn about their concerns and priorities. For example, a land developer may not want to serve on a committee, but may be amenable to adopting a land development plan that maintains a wildlife corridor, as long as they are consulted early on.
If your group wants its green infrastructure maps formally adopted by an appointed or elected body (such as the planning commission, planning board, supervisors or town or city council) you may want to ask a representative of that body to serve on your stakeholder committee. In this way, they can ensure some level of buy in/support for the effort early on, as well as to help guide your committee and share key insights with your group. For example, if your group labels an area for conservation that the county has already identified as a future growth area, this conflict can be highlighted, discussed and evaluated.
Alternatively, the elected or appointed body may actually be your committee. During a project run by the GIC in Madison County, VA, the planning commission was the review body and it reviewed information, data and applications for the data over several meetings.
Also consider that not all stakeholders will be local, especially key funders such as foundations or state and federal grant-makers. It can be critical to your success to engage those funders early on.
One of the best examples of this was the Healing Waters Retreat initiated by Nancy Ailes, Director of the Cacapon and Lost River Land Trust in West Virginia. In 2002, before the trust began its work, she engaged both stakeholders and funders to create maps and formulate a unified vision. According to the trust, this approach was the foundation for its success, and it is now the largest
land trust in West Virginia, and the seventh largest in the Chesapeake Bay Watershed.
It is unlikely that you will have all the expertise you need within your organization. Based on the types of things you may wish to map and the issues you may want to address, you should invite experts to serve as reviewers. For example, if you want to map key cultural assets, such as historic buildings, you may want to invite local historians to provide advice. Similarly, if you want to map key habitats, you may want to engage scientists from your state’s natural heritage program. For an example see text box on the Northern Virginia Regional Commission on page 49.
If you want to map key habitats, you may want to engage scientists from your state’s natural heritage program. Some of these programs are run by a state agency while others are maintained by universities or libraries. To find your state’s listing, see http://www.natureserve.org/visitLocal/
One key caution is that experts may want you to map everything or conduct extensive new surveys. You’ll need to provide them with the limits to the project’s scope. For example, when the GIC asked local historians to tell it what historic resources to include on a five county regional map, they got so excited they suggested we categorize resources into multiple separate data sets: as colonial, antebellum, post-industrial, and so on. This was too much detail for a map at a five-county scale. Later, when we asked a biologist which key landscapes to include his response was that, first, we needed to establish field plots in all the forests across all five counties, then create a map of forest diversity types, then… This was not necessary for the scale of the project or for the goals the group had established.
So, engage experts, but provide clear guidance for what you need to know, why you need to know it, and how the information will be applied. This will help them to give you the appropriate information at the right scale. Natural heritage programs (NHP) will advise on using the best available data instead of unnecessarily creating new data. Additionally, if new data are needed, NHPs may be able to assist in creating that data in a timely manner for that region.
A simple way to structure engagement in your project is to determine the role each person or group will play. You need to assign roles for everyone (advisor, reviewer, modeler, end-user) and determine who will make the final decisions. But note that, depending on the stage of your project, you may need to involve different persons with different types of input at different times. If you analyze your stakeholders by their role in each stage of the process, you can utilize each person effectively and efficiently. Essentially, you will be creating a vision for what you hope to achieve, evaluating your natural assets and developing an implementation plan.
While some organizations recommend that you form a multi-stakeholder committee at the beginning of your process that comprises all possible interests, it can be difficult for all these groups to agree on what to evaluate, how to prioritize and how to map landscape features. As a result, you may want to restrict your consultation with a multi-stakeholder group to just asking it: “How would you use a GI map?” Or, a thoughtful survey can be used to help gauge the interest and priorities from diverse groups.
Since you will almost certainly need some level of expert, scientific help, it is important at the beginning of your advisory process to think about what types of expertise and what levels of technical knowledge are needed to inform your mapping effort – taking into consideration the awareness levels of your lay participating members, as well as the final product you want to see. If you are building a model that will rank natural resources, you will probably want a technical (science) committee that is familiar with the extent and importance of the area’s natural resources. They will also likely be aware of available data that can be utilized. If you want to ensure that the information you map is in a form that can be readily applied, you will want to consult those who will be using the information regularly – the end users – such as planners, state natural resource agencies and land trusts.
In summary, you may want to form a technical committee and consult with stakeholders periodically. The technical committee made up of modelers, scientists and other experts can collaborate to actually create your map or model. You can re-engage your end users once you have a draft in hand, to learn if the way the information is presented is useful, applicable and accurate.
• Involve local and regional stakeholders, including local government bodies and grant-funders.
• Meet with potential stakeholders to discuss issues and decide on your approach.
• Discover potential objections early on and engage potential opponents.
• Consider bringing in a facilitator to work through potential issues and disagreements.
• Engage experts, but give them clear parameters.
• Assign precise roles to group members.
You may decide you want to set up a standing committee or you may choose not to utilize a committee at all. On the other hand, you might decide that you need several committees, or sub-committees, to handle different aspects of your process: for example, one committee can gather GIS data and create your asset map; another can provide a forum for stakeholders.
The following are examples of the types of committee you could utilize during your process, along with their pros and cons. They include the option to forgo a committee process altogether.
The process recommended by GIC is found in the text box on page 46.
A technical committee is a core group of experts who create a mapping protocol and map and evaluate the results. This committee can identify and evaluate the best available data, and identify any data gaps; this group can also document the methods used to evaluate and rank data for use in mapping.
It may include those scientists who can determine which landscape types are most significant for wildlife, water resources, agricultural uses, habitat corridors, and so on. It may also include those staff who will be responsible for the mapping, since data will need to be evaluated for consistency and whether it can be represented spatially on a map – for example, are the data consistently available, accurate and represented across the entire study area?
The GIC has found this four-part engagement process to be very effective in soliciting community input.
This process does not include all technical review. It gives you several options, depending on specific circumstances:
PART 1 - PRE-ASSESSMENT: Conduct preliminary interviews or surveys to determine which key issues to investigate, how to frame the project, and who to engage.
PART 2 - STAKEHOLDER REVIEW: Implement a stakeholder review committee, made up of key groups to help frame the project’s goals. If the goals have already been established, move onto discussing what needs to be mapped to help achieve them.
Option 1: Form a small technical sub-committee to work on data and maps.
Option 2: Have the review committee be the planning commission or other decision body.
This process involves three two-hour committee meetings with the following formats:
Meeting 1: Introduction to Natural Asset Mapping and Discussion of Community Goals and Values
• This meeting requires some prior research on what data are available and what could be mapped.
• Which of the community’s goals and values can be translated into a map?
Meeting 2: Proposed Mapping Strategy
• The strategy should be based on Meeting 1 outcomes.
• During the meeting, review options for what to map and why, and gain agreement about how to create your maps.

Meeting 3: Review Maps
• The format of this meeting should include several aspects: a review of accuracy; a prioritization of assets; and whether the maps present their messages clearly.
• During this meeting, make edits to your maps based on feedback; then create final versions for further review and final adoption.
Option: Instead of the three-meeting process, have a focus group review the maps prior to public release of the information; then revise them based on the focus group’s input.
Following the three meetings, you have several options before you:
Option 1: Host a fourth meeting to review and adopt the final version. Celebrate!
Option 2: Have a community open-house to show the draft maps, in addition to or instead of a committee meeting.
Option 3: Make individual presentations to key stakeholder groups who cannot attend public meetings, such as sportsmen’s groups and civic groups, in addition to or instead of a committee process.
PART 3 - FINALIZE YOUR MAPS: Make final changes to your maps based on feedback, and present them to the decision makers. Make revisions as needed.
PART 4 - STRATEGIZE AND BREAK INTO TASKS: Create a strategy for implementation of your goals and break it into specific tasks.
Option: Form an implementation committee to ensure your strategy and its allocated tasks are completed. Establish a timeframe to achieve your strategy, as well as each specific task.
For ideas on strategies, see Chapter Five.
Keep in mind that your ‘experts’ may comprise citizens who are very familiar with the landscape, such as retired ornithologists or experienced birders who have kept accurate records of key nesting sites. The main challenge in consulting any person about the ecology or habitat of an area is to ensure that whatever knowledge is tapped, it represents an accurate and reliable picture of the entire region under investigation. It is important that one area not be labeled as particularly unique or important, simply because there were more data collected in that location. The area in question may be actually less unique; it may simply have been studied more.
This is a larger group of key-interest representatives who can inform the technical committee about what is important and why. For example, they may place a high value on nature based recreation -- sports that require a large and connected landscape, such as hunting, hiking or cross country horseback riding, or they may want to map key scenic vistas that are important to tourism, or areas that are important to future drinking water supplies (reservoirs or river intakes) or drinking water recharge zones.

A group such as this can be consulted both at the beginning of a process, to determine the community’s key values, and again at the end, to evaluate if the mapping effort has met its needs.
It is important to note that not all values can be met and anyone running the stakeholder process should clearly articulate what can and can’t be mapped or what is outside the scope of the project. For example, it is not uncommon for a group to identify something that is important to them, but for which no data exist. To put something on a map for a region two things must be true:
1. The data must exist (or be readily obtainable in the near term).
2. The data must be spatially represented and consistent.
To put something on a map two things must be true:
1. The data must exist (or be readily obtainable in the near term).
2. The data must be spatially represented and consistent.
Rather than have a standing committee, you may instead (or in addition) enlist a focus group to test out ideas before proposing them to the broader public or to appointed or elected bodies. Focus groups are often used by marketing firms to test consumer preferences for products, such as cereal, or by political or advertising campaigns to test key messages. A focus group comprised of key interests can determine if current green infrastructure maps best represent key assets or to test the popularity of implementation ideas, such as conservation easements, land swaps or purchases of development rights.
Key messages or strategies can be tested within the group by having them react to ideas, either through discussion or by ranking them on charts or in ballots. This approach was one of several used by the GIC in Nelson County, VA. The focus group was appointed by the board of supervisors and was very helpful in pointing out how to best represent key messages on the maps. It also let GIC staff know which policy ideas would be more or less likely to be viewed favorably by citizens, businesses and elected officials. This information was then used to modify the data representation (graphics) of the maps and to inform a policy implementation document prepared for the county’s planning commission.
Another approach to diversify input, without having to form multiple committees and sub-committees or host focus groups, is to visit experts individually and then share their perspectives with the larger group. This allows you to focus the review on their particular area of expertise, such as providing wildlife corridors or choosing the highest quality agricultural areas.
Lastly, you may not need to have any committee at all. Your effort may be for a government agency or other singular entity. For example, if you are conducting your study for a land trust or conservation group, your board of directors or your membership may already serve as your review group.
Alternatively, you may prefer to solicit input through a series of one-on-one meetings with key stakeholders and presentations (see the earlier chart on who to engage). In this form of engagement, you will need to consider the various functions of your stakeholders. A downside to this approach, however, is that experts will not be able to readily inform one-another’s views because they are not listening to each other and engaging in live dialogue. However, an upside to holding individual expert consultations is that interviewees may offer you more candid viewpoints when they are not being observed by others.
Instead of trying to have all needs met through one committee or focus group, you may want to base your engagement with them upon the needs and timing of your work. For example, if you need the planning commission and board of supervisors to adopt your plan or maps when they are completed, it is a good idea to engage them early on to review the goals and work plan. This will ensure that they agree with the project’s direction and are prepared to play an active role in its implementation. If you need to prioritize your natural resources, you may require a science or technical committee to rank or rate the quality of various assets and assign weights or scores to them. For example, a waterway could be valued more highly by the community if it also provided drinking water.
One advantage of a committee is that stakeholders can hear and learn from one another. A common refrain experienced in GIC’s field tests was that developers will not support an idea, or that the board of supervisors would never vote for it. If you have a member of the body present to say, “Actually, we can support that,” or “Oh, we never thought of things that way, let’s see how we can make it work,” then it can smooth the way for agreement within the stakeholder group, and for its adoption and implementation later on.
Another advantage is that most natural asset maps and strategies include lands that fall under multiple ownership, as well as numerous zoning or land use regulations that require cooperation amongst diverse interests to manage them effectively, in order to maximize conservation and community values. The committee brings these varied interests together under one aegis, which allows them to discuss differences and resolve them.
In conclusion, all projects will need to have some level of community consultation and coordination. However, each community is unique and coordinators of natural asset planning efforts will need to consider the best way to advance their goals for strategic landscape conservation.

In the Northern Virginia Regional Commission (NVRC) project there were multiple levels of expertise needed to create regional themed maps. Rather than having every possible expert sit on one very large committee, they decided to have one core committee and create additional subcommittees to explore particular issues or themes in greater depth.
A standing committee was formed of representatives from the localities in the region, along with regional conservation groups and land trusts. They worked collaboratively to advise the NVRC about what to include or exclude from the regional asset map.

They convened subgroups of experts from the committee, as well as additional experts on the subject area – such as watershed health and heritage and culture experts to create overlay maps on particular themes. This allowed professionals to advise the project by providing their expertise in key areas.
We have covered how to get organized and create a structure for your mapping process. In the next chapter, Chapter Four, we provide guidance about what can be mapped and how data can be evaluated in terms of meeting a community’s goals.
• Step 1: Set Goals
• Step 2: Review Data
• Step 3: Make Maps
• Step 4: Assess Risks
• Step 5: Opportunities
• Step 6: Implement
In this chapter, we present the steps you should take to identify, evaluate and prioritize your natural assets as part of a green infrastructure plan. These six steps were initially presented in Chapter One, but are expanded upon here.
This is a key chapter to read before Chapter Seven, where we present specific suggestions regarding the data and models to use when creating your maps.
There are Six Steps you should consider to identify, evaluate and prioritize your assets as part of a green infrastructure plan:
Step 1. Set Goals: What does your community or organization value? Determine which natural assets and functions are most important to you.
Step 2. Review Data: What do you know or need to know, to map the values identified in Step 1?
Step 3. Make Asset Maps: Map your community’s highest-valued natural assets that contribute to a healthy ecology and also support cultural and economic values –Based on the goals established in Step 1 and data from Step 2.
Step 4. Assess Risks: What assets are most at risk and what could be lost if no action is taken?
Step 5. Determine Opportunities: Determine opportunities for protection or restoration. Based on those assets and risks you have identified; which ones should be restored or improved? And which need the attention soonest?
Step 6. Implement Opportunities: Include your natural asset maps in both daily and long-range planning such as park planning, comprehensive planning and zoning, transportation planning, tourism development and economic planning.
We will now outline these steps in detail.
All GI pla nning efforts that involve the public must start with the establishment of goals. However, before asking people what their goals are for evaluating an area’s natural assets, they may need an introduction on what natural assets are and why cataloging them is important.
It is likely that lay members of your community will be new to the concepts of green infrastructure (GI), natural assets and ecological services and not understand why it is important to evaluate and map them. In fact, some may not realize the need for mapping assets at all; they may assume that this information is already taken into account as part of everyday planning activities. It is worth spending some time at your initial meeting, or in your preliminary engagement process, to ensure that they fully grasp these – and other – basic ideas and understand their central role in the GI planning process. You may also need to explain the overall process to them, so that they can see how their interests and values are incorporated into your plans and will be realized on the ground.
Before you discuss goals, you may need to spend some time helping your community develop a vision of what it would prefer its landscape to look like.
and goals they fulfill. So, establishing your goals has to be your first step. And those goals should arise from the vision you have established, either as part of your established purpose, or from engaging stakeholders in a visioning exercise.
You may recall from Chapter One that a map of natural assets is a “strategically planned network,” and is not simply an inventory of assets. Yet it is common for groups engaged in green infrastructure mapping to start by making lists, with statements such as, “Clean the water!” or, “Provide recreation.” However, you need to give careful thought to how those values can be translated and represented on a map, as well as managed for long-term conservation or restoration. A list answers the question, “What do we have?”, while a strategy answers, “Of those things we have, which are the most important to conserve and how can we do that?”
Green infrastructure planning involves the prioritization of catalogued assets to create a strategy for conserving what is most important. To prioritize, you must have some way of setting aside ideas that are not critical or relevant. The only way to achieve that is to strictly adhere to your goals. The more specific your goals are, the easier that will be.
“Green infrastructure planning involves prioritization of catalogued assets to create a strategy for conserving what is most important. To prioritize, you must have some way of setting aside ideas that are not critical or relevant. The only way to achieve that is to strictly adhere to your goals. The more specific your goals are, the easier that will be.”
On the other hand, if you are a local authority or organization that already has a clear vision statement or comprehensive plan that includes a proposal for the future, you may not need to do anything more than reaffirm that vision and apply it to the particular process you now have in mind. However, you might still need to ensure that the community as a whole understands the inspiration and participates in translating it into specific planning goals.
Since it is likely that you are being strategic in your approach, your mapping effort will not simply entail taking everything that is ‘natural’ and might be construed as an ‘asset’ and putting it on a map. Rather, the purpose of mapping is to identify key priorities based on the values
When you initiated your mapping project, you clearly had a reason for doing so. In a rural area, your initial goals might have been as broad or vague as, “To identify large, intact habitats that will conserve our region’s biodiversity.” Or they may have been as specific as, “To identify critical natural resources, habitat areas and key viewsheds that can support and sustain a strong, natural resource-based economy.”
Once people understand why you are undertaking a natural asset mapping initiative, they can consider what goals need to be addressed. However, before you begin asking your group or community to establish goals, be sure to avoid the pitfalls of generating a long, cumbersome laun-
dry list. The challenge is to create some consensus around a limited, defined set of goals that everyone can agree on – in other words, which four or five goals can people agree are the most important?
You may want to utilize goals that already exist for the community by consulting existing documents, such as the comprehensive plan or zoning ordinance. Since these have been adopted already, it may make it easier for them to gain acceptance. Another simple way to begin is by asking stakeholders what is important to them.
A goal for an urban area might simply state, “To identify and protect the city’s natural resources and restore habitat and natural area connections wherever possible, in order to create a livable, resilient, attractive and healthful city.” Or it might specify particular natural aspects to focus on, such as stream buffers or the tree canopy.
A goal might focus less on wildlife and more on human-based ecosystem services, such as clean air, clean water or recreation, and might be framed in such a way: “To conserve the city’s natural areas, urban tree canopy and forested stream buffers, in order to protect native species, keep the city cool, maintain clean streams, and provide abundant opportunities for nature-based recreation.”
• To preserve regional forests for wildlife.

• To ensure biodiversity and a healthy ecosystem.
• To protect a rural economy (that comprises, say, timber stands, farms and grazing lands).
• To maintain forested land cover in order to facilitate recharging groundwater aquifers for drinking water supplies.
• To conserve community character and heritage by protecting an historic landscape.
• To preserve and promote natural-resource-based recreation, such as hiking, birdwatching and hunting.
• To save money by directing development into areas where services (roads, schools, power lines) already exist.
• To protect public safety and prevent future hazards by identifying hazards such as unstable slopes, floodways and areas prone to sinkholes.
An example of linking goals to natural assets is to promote outdoor recreation by protecting landscape corridors for those activities, such as hunting, that rely on intact habitats – the better connected a landscape is, the easier it is for animals to move and repopulate areas and for hunters to enjoy their sport without conflict. Other non-consumptive outdoor sports, such as cross-country skiing or long-distance hiking also require a connected landscape.
As we have discussed, your community may have undergone a visioning process to determine what it wants to achieve. Now, you can set your goals for that vision over several time periods: say, 10, 20 or 50 years. For example, after 10 years, your goal might be to preserve the following natural assets and ecological services: abundant clean water; clean air, a strong natural, resource-based economy; an intact landscape that supports outdoor recreational activities; abundant and biologically diverse native species; attractive vistas; and so on. Then, after 50 years, it might be to have a truly connected landscape that further enhances all those assets.
Or your community might have a more singular goal in mind, which it wants to achieve relatively quickly, say over just five years. An example would be an immediate economic goal to protect an agriculturally-based economy by identifying and conserving areas with high-quality agricultural soils though zoning protections and support for farmers markets. Another example might be to map your city’s tree canopy and target gap areas where canopy can be restored through city and citizen-based planting programs to meet a target canopy level.
You will need to consider if your adopted goals address all the issues your community or organization thinks are important and whether they are specific enough to provide direction for your evaluation of assets. If not, you may need to modify your goals to add specific qualifying statements. For example, if you already have a community goal, “To keep the county’s water clean,” you may need to add specifics such as, “To keep the county’s water clean by protecting forested buffers along streams.” You may also need to add specific objectives, such as details of how wide the buffers should be and whether there are areas of higher priority, such as headwater streams or streams that feed into the drinking water supply. One way to flesh out specific parameters for your objectives is to have a panel or committee of topical experts discuss them and suggest refinements.
Also, you may not be exactly sure what your goals should be, without looking at existing data and assessing it. So use those maps and GIS layers you already have, or gather new data if you feel you need additional information to make an informed decision on what your goals should be. For example, your initial goal might be to protect core forest habitats and corridors, but you have little idea where they are, or which ones to prioritize. So you decide to consult existing GIS layers and county forest maps to make an initial determination of those that are the most important. You then enter a full data-gathering and mapping process, and as you do so, discover another key core piece of forest, or decide to remove one from your list.
Thus, you will probably need to take an iterative approach when establishing and refining your goals. An iterative approach involves setting goals, creating a map and then determining the condition of the resource and what should be prioritized. For example, you may find that forested land cover is more fragmented that you realized and that there are less cores than originally supposed. This may lead you to put greater priority on conservation actions for certain areas of the landscape. Or, you may determine new corridor possibilities to connect intact core areas.
One cha llenge that all projects face at some point is how to address conflicting perspectives. Some stakeholders will want to target an area for growth, while others will want to preserve it. One way to minimize this is to develop clear decision metrics early on.
A decision metric is a standard that helps you prioritize what to conserve first and why. Creating decision standards early on can help resolve potential conflicts in the future.
These metrics define priorities into a ranking of what is considered most important by the community, and might include such things as:
• Protect the area that shelters rare or endangered species first.
• Protect the habitat cores with the highest rankings first.
Decision metrics can provide a way to sort through data and decide more quickly which aspects of your landscape are most suited for conservation. Evaluating natural assets within a green infrastructure context means conserving those resources that offer the greatest conservation and community values first, and not simply trying to protect everything that is natural or green. You’ll need to keep asking yourself, “Does this meet our highest priorities?” and “Will it ensure achievement of the multiple community values or goals we identified earlier?”
As described previously, an area may be deemed more valuable because it provides multiple community benefits, such as a forested area that helps with groundwater recharge and buffers runoff into an existing drinking water reservoir. However, you are likely to find more conflicts around such areas, because there will be more demands on them. For example, a high-value habitat area for recreation may also be indicated by the locality as the best location for a new school or shopping center, precisely because of its proximity to an existing population center.
Similarly, if you are evaluating your soils for food production as part of your green infrastructure network, you may find that the best soils for growing food are also the best soils for septic systems. This was the case in Accomack County, VA, where soils with lower clay content that were well drained were less common and were thus in high demand by both farmers and developers since both groups needed well-drained soil; one needed this for crops and the other for septic.
Next, consider how a green infrastructure map can help you achieve your goals. For example, if you map forest cover, that will help you protect your forests, which will help you facilitate groundwater recharge. If you map forest
corridors, you can protect them and identify where there are gaps, which can help you promote biodiversity. Those corridors can also help you draw up plans to facilitate animal movement and support hunting, hiking and cross country horseback riding, since they all depend upon a connected landscape. Similarly, if you map your soils, you can protect your agricultural economy by identifying and conserving those landscapes that have the best soils for growing crops. The key is to match community needs and interests to the functions you want to achieve by identifying natural assets on a green infrastructure map.
You will need to determine if your goals can be evaluated spatially (on a map) and whether they can be used to create real on-the-ground actions. As part of this, you need to consider those resources you will have available to you to collect data and implement your goals. For example, if your community relies on local water from wells or from a stream-fed reservoir, both surface water protection and groundwater recharge may be important. However, you will need an existing study of groundwater recharge areas in order to map them.
If you do not have data on exactly which areas are best for recharge, you can still undertake actions to help your drinking water. It is well known that forests help with retaining and infiltrating water, so if you protect the forest cover across the headwaters of local streams, around your reservoirs and across watershed areas that are upstream of your reservoirs, you can link your goals for clean and abundant drinking water to land management actions, such as protecting your forests through easements, stewardship plans or replanting.
The aim here is to have realizable goals that are practicable, can be mapped and are actionable in order to help you realize the vision defined for your local landscape.
Once your community, locality, land trust, or other organization has established the purpose of its project (what it is seeking to conserve or restore, and why), the next step is to determine how to implement that purpose.
To do that, you need to assess what information you already have and what you still need to gather. Keep in mind that the goal is not to put everything on your map, but rather to prioritize. A green infrastructure map – a map of natural assets that support community functions – is most effective as a strategic tool if your natural resources are ranked in terms of importance for achieving your goals. It is not uncommon for communities to make long lists of what should go on their maps without having first investigated if the data are available. That is frustrating, time-wasting and ultimately pointless. Natural resources should be ranked in large part based on how well the data represent the conservation value of those resources.
If everything currently known is put on your map (such as all forested land and all agricultural soils), it is likely to result in a map that does not show priorities and is lacking in definable strategies. To avoid this, decide how the available data relate to each of your goals, and how they data can be catalogued, evaluated, prioritized and mapped.
For example, if your community decides that it values clean water, then rather than mapping all watersheds, it could identify and conserve just those with high levels of forest cover and intact stream buffers. This can be mapped in GIS by creating a watershed boundary layer, adding in forest cover and determining the highest value forest cover you desire for a watershed, e.g., at least 70 percent cover overall, with extra buffering for headwater streams.
Every community is different and you will need to evaluate whether or not such a simple mapping metric makes sense for your area. For example, in mountainous areas, it is not uncommon to have highly forested slopes that are not developed, since they are difficult to clear for farming or housing, and to have open lands with grazing or crops located alongside valley streams. This could mean that, even though you have a high-forest-cover watershed, it lacks adequate forest buffers in the right places – alongside streams where
“A green infrastructure map – a map of natural assets that support community functions – is most effective as a strategic tool if your natural resources are ranked in terms of importance for achieving your goals.”
they can help protect water quality. So you could add an equation into your GIS mapping to select (‘clip’) areas of 100 feet alongside each stream and determine if they are also adequately forested for filtering land runoff.
Since forested streams often make good wildlife corridors, this is another reason to select them as a high conservation priority in your green infrastructure prioritization process. If you are also seeking to protect or create a wildlife corridor, then 300 feet on either side of the stream will be needed. In this case, both wildlife and water quality are supported.
If your community decides that locally-sourced food is important, you might want to map the locations of good agricultural soils. Thinking strategically, you should map only the highest quality agricultural soils instead of selecting every soil classification. Then compare these class IV and V soils (from the USDA) with land cover to ensure that they are actually available for farming (and not underneath a factory or urban area).
There are many other site-specific criteria for all types of crops. For example, vineyards may perform well on poorer soils and most fruit production does best on slopes between 1.5 and 15 percent and at higher elevations than valley floors, to avoid spring and fall frosts. Vineyards also do best in open areas with good airflow that avoid interaction between cultivated grapes and wild grapes (which carry a fungus that can harm cultivars). So, if you are interested in areas that are best for fruit growing, these can be included on your agricultural asset map as well.

With guidance from your local extension agent, you can identify areas suitable for each crop and include them on a map of key agricultural zones. In Madison County, VA, the extension service mapped areas with soils and conditions most suitable for grape growing, to make it easier for prospective vineyards to locate within the county.
In order for something to be mapped, data must already be available. Stating this seems obvious, yet it is common for groups to identify things that they want to include in a map for which no data currently exist. A data table of available state data is found in the last chapter of this guide. You may also have additional local data such as a groundwater study conducted by your county.
Simple rules of thumb for what can be mapped are:
• The data must exist (or be readily obtainable in the near term).
• The data must be represented spatially.
• The data must be consistently available over the entire area.
Simple rules of thumb for what can be mapped are:
• The data must exist (or be readily obtainable in the near term).
• The data must be represented spatially.
• The data must be consistently available over the entire area.
If your group identifies something it wishes to map, but for which there are no data, consider how this data might be collected. Given that field studies could take years and require grant funds to support, think carefully about how to create a map with the data now available and how you might update and reprioritize the map in the future, when new or more accurate data become available. For example, can you map known high-value habitats now, and then update the map later when a more comprehensive inventory can be conducted?
If groundwater recharge is important to your community, a detailed study can take time and resources to complete. In the meantime, you could create a map that only includes watersheds that currently supply a large number of existing wells; that have community wells (usually those wells serving 20 or more users); or that feed into public reservoirs.
When the desired data are not available, proxies may be used. A proxy is a way to simulate (create a surrogate for) what you want to map. For example, most localities have not completed extensive surveys of all of their wildlife. While it is likely that some rare species have been catalogued and recorded at your state’s Natural Heritage Program, you are only allowed to show these data with large buffers around the sites, in order to blur the actual locations of the rare species. This is to prevent anyone from locating, stealing or destroying them.
Your state’s wildlife action plan may have also identified locations that are likely to contain key species, but these areas may not have been monitored to confirm the actual existence of those species. Thus, even the wildlife mapping data that are available may not be very useful.
If you want to take a proxy approach and map likely locations that can support native species, pick areas of your landscape that are still intact (as undisturbed and unfragmented as possible) and large enough to support a diversity of habitat types or niches. For example, in Virginia, the state uses a proxy of 100 acres of intact interior forest as a minimum size and land cover type of forest to support a diversity of native, interior forest species. The larger the area, the more likely there will be suitable habitat for area-sensitive species, such as forest-breeding migratory songbirds, black bears and mountain lions. Consult with your state to determine a minimum acreage. If you also know that a specific area supports rare species or rare habitat types, you may rank those areas higher.
to use that data for your map. Other data may cover too large an area, lacking in the precision necessary for mapping. An example of this is bird flyways, which are often represented as large swathes many miles wide. To make matters worse, these flyways can change year-by-year depending on weather, temperature, food sources and other factors. To learn more see http://www.birdnature.com/flyways.html
Another point to be aware of is that, when you look at the habitat demanded by a particular species, it may require the entire area of your project, making it difficult to prioritize one part of it over another. For example, when the GIC reviewed the bear habitat needs for one Virginia county, the entire county was highlighted.
If you face a similar problem in your locality, a better way might be to select those core areas and corridors that offer the very best of all possibilities. It is important to contact scientists/experts for guidance on what can be mapped, including natural heritage programs and wildlife resource agencies.
You also need to consider data consistency. This means that all your data must have been evaluated in a consistent manner, as opposed to collected sporadically. It is often a common desire for members of the public or local stakeholders to want to add something on a map that they happen to know about – such as their favorite duck pond or beaver dam. If you allow these personal ad hoc details to be included, as opposed to using data that were gathered consistently across a landscape or in all potential habitats, you will probably create an inconsistent mishmash on an inaccurate map that is not useful for identifying anything, let alone the highest priority areas.
Consider the following two examples (both are real examples):
Since the mapping rule requires that all data be represented spatially, it must all be tied to location.
Some studies randomly select species in order to characterize abundance for an area, such as an entire county, and do not record actual locations. You will not be able
In the first, a stretch of river had been included on a map as significant for bald eagles because canoeists had seen an eagle nest there and a single breeding pair; in the second, an area had been mapped as significant for trilliums because one particular researcher had established a study plot on a slope and noted that it had abundant numbers of the locally rare woodland plant.
The question is, why trilliums, why eagles? And why there? Putting data on a map just because it is
A proxy is a way to simulate data that represents what you want to map.
available, absent of a defined rationale and protocol for doing so, can result in a map that is full of data points but lacks any clear way to prioritize those areas that need better stewardship or management.
While certain areas may, indeed, contain bald eagles and trilliums, there is no way to determine whether or not they represent the best areas for eagles and trilliums in the locality. In fact, eagles and trilliums may be far more abundant in other, less disturbed areas, or in areas with more suitable soils or more abundant food sources.
If these communities had wanted to create maps of the best bald eagle and trillium habitats, so they could prioritize them, it would have been better to conduct a county-wide eagle survey or an examination of soils and slopes where trilliums are most likely to be found. In addition, these data should be provided to natural resources professionals and heritage programs so that they can be included in broader inventories and incorporated into your state’s existing assessments.
STEP 3: MAKE ASSET MAPS: MAP YOUR COMMUNITY’S HIGHEST-VALUED NATURAL ASSETS THAT CONTRIBUTE TO A HEALTHY ECOLOGY AND ALSO SUPPORT CULTURAL AND ECONOMIC VALUES –BASED ON THE GOALS ESTABLISHED IN STEP 1 AND DATA FROM STEP 2.
Once you have at least an initial sense of what data are available, consider which data could help you meet the goals you established in Step One. Then assemble them.
Once you have brought together all the existing data you want and collected any additional data that matches your goals, it is time to create your natural asset map. Depending on what those goals are, this map might include:
• Large intact forests, native meadows, marshlands.
• Key geological features.
• Farms and farming communities.
• Streams, rivers, wetlands and reservoirs and ground-water recharge areas.
• Recreational areas.
• Historic and cultural features.
• Viewsheds.
• In urban areas: street trees, the tree canopy, parks, community gardens and streams.
Although several states have models covering the entire state, each intra-state regional or community natural asset mapping project still needs to develop its own locally relevant model or base map. Some states that lack comprehensive models have statewide datasets, which are very useful for creating a local natural asset map. However, for any local project, whether or not there is a state model available, creating a local base map of natural assets will require the addition of new data from both state and federal sources and locally sourced data.
In GIS, data are collated in layers. Each layer represents a specific type of data, such as forest cover, roads, or streams and is often called a theme because it focuses on one specific type of data. These themed layers are saved together as projects. A project is a series of overlain layers that build into a composite map that contains all the information you have added to it.
In order to show as many pictures and patterns as possible, it is recommended that you keep your data sets in discrete layers, often called themes because each one focuses on a specific type of data.
In GIS, data layers are saved as projects. A project is a map that contains all the information you have added to it.
It is recommended that you keep each type of information as a separate layer of information so you can grab it and add it to any map to show new patterns and relationships. This will allow you to create new projects easily as you compare different data sets. For example, you may want to overlay your Protected Lands data layer onto your Highest-Quality Agricultural Soils layer to answer such questions as, “How many areas with high-quality agricultural soils are already protected from development under conservation easements?”
Another example applies to historic resources. You might add your Conservation Easement layer to your Key Cultural Resources layer to determine how many of historic sites are within landscapes protected from development or encroachment by incompatible uses.
Keeping your data as discrete layers allows you to use
your data for multiple applications and to build maps as and when you want to, with the specific information you wish to have represented. You can combine these layers to see new relationships such as areas that are important for both water quality and habitat (water theme map + wildlife habitat map).
The data for each GIS layer are kept in a linked data table. Each table can then be used to sort and compare data, perform data analysis and create new maps. The data can also be used to run calculations and categorize and rank information.
A GIS user can run calculations or sort the data tables in those ways that are most helpful to your local needs. For example, you may be able to calculate the acreage of all habitat cores that have been given the highest ranking or sort the data for all habitat cores that contain rare, threatened or endangered species. Similarly, you may be able to select all habitat cores that intersect or are within 50 feet of a waterway that has a high priority for conservation.
Green infrastructure maps have been created at many different scales. The mapping and modeling that have occurred in the past few decades have been made possible by advances in GIS software, as well as improvements and increased access to high-resolution satellite imagery, new data management tools and the increased processing power of the desktop computer. These all allow you to create data layers that are scalable and that enable you to view your data at various different ‘heights’ – much like zooming in and out of Google Maps.
This allows you to see connections at multiple levels, such as between core areas or development areas, over a regional as well as local scale, and to understand how your local efforts fit into a much wider network.
The approach recommended by the GIC requires that you use GIS software to overlay data, in order to see the emergence of patterns and priorities. You can use this GIS software and its associated data tables to establish your priorities. For example, if you want to protect water quality, you can overlay watershed boundaries with forest canopy to determine whether the canopy is sufficient to protect your water quality. Does the canopy cover most
of the watershed (e.g. 80 percent) or just 10 percent? Will you need to reforest part of the watershed, or nearly all of it? Where is forest cover most needed? Are forests located along streams to buffer runoff and stabilize banks?
If you want to determine whether or not streamside buffers are adequate, you may want to draw a boundary polygon 100 feet either side of the center line of the stream to determine if adjacent forest coverage is adequate and if there are sections of the stream that would benefit from a reforestation effort.
Your state’s Impaired Waters List will indicate if there are known impairments for your surface waters. Contact your state’s department of environmental quality or department of conservation (or equivalent).
It is worth a reminder that, while there are several more simplistic mapping programs available to you, many of them do not include analytical properties available in GIS programs, such as the Environmental Systems Research Institute’s ArcGIS software products.
Simpler programs, such as Green Maps, and graphic tools such as Google Maps, do not allow you to run more complex calculations such as, “Select all cores that include 200 acres of habitat and slopes greater than 20 percent.”
ArcGIS is the easiest GIS software to use and is more translatable if you want to share your data with local, state or regional government agencies. It can also perform calculations that analyze information. Once you draw boundaries (polygons) around key areas, you can calculate the total acreage of those polygons, the distances between them, and so on. This is very helpful when you want to discover such information as, “What percentage of the region contains land protected by conservation easement?” or, “How many miles of rivers and streams have a linear forested buffer of 100 feet wide to filter nutrients?”
Every data layer should have an associated set of metadata attached to it that describes where the data came from, as well as a data table that includes source data for the layer and other associated attributes, such as accuracy information (resolution) and details on how data were collected. Your GIS expert should help you with this, but make sure that he or she is including it in all your data layers.
Metadata is information about data that gives details such as where, how and when the data was collected. A data table is an Excel spreadsheet that lists every data unit in columns that you can select, compare and analyze, just like any other digital spreadsheet. An attribute table contains information about a set of geographic features, usually arranged so that each row represents a feature (such as soil type) and each column represents a feature attribute (such as loam, clay, sand, etc.).
You may find this web page useful. It is a dictionary of GIS terms:
http://support.esri.com/en/knowledgebase/ GISDictionary/term/attribute%20table
If you use existing data from another source, then modify or update it, you should make a note of this in the metadata and attribute table. For example, if your data layer maps water features, your metadata should always record the source of the data (for example, that it came from the National Hydrography Data Set), the year of the data collection (for example, land cover from 2010), and other key data regarding such attributes as resolution scale (e.g. 30-meter resolution).
Your attribute table will contain all the data in a map layer in tabular format. Since this is usually in the form of an Excel spreadsheet, you can open that spreadsheet and perform a number of different calculations from the table, such as adding up the total acreage of your parks or the linear length of your streams.
If you do not have GIS capabilities, consider hiring a consultant or a local university student proficient in GIS to work with you. There are new, low-cost software licenses available for just $100 for nonprofits from ESRI, so it is more affordable to own and use GIS than ever before. Universities and colleges usually have their own GIS licenses, so students can use their school’s software to help create maps.
The first step is to create a base map
A base map is a master map of your prioritized natural assets. It is used to compare other key land use concerns or management needs. If you want to add more nature-based recreational trails, your base map can be used to determine if your trails take advantage of key natural assets, such as exceptionally unique forests or connecting wildlife corridors. Similarly, you can use your base map to overlay key cultural assets, such as tourist destinations, and ask, “Does this priority landscape also support key views from these sites?” In general, we recommend you begin with your state’s model of intact interior habitats and connecting corridors – if it has one – and then create themed maps to show how this base map supports other cultural and community values.
Here, we give a list of the steps we recommend you follow to create your base map. Turn to the chapter on your specific state, to learn how these steps relate to your own situation. Your state chapter also outlines how your base map can be modified or updated to meet your community’s needs.
We recommend you follow this procedure to create your base map:
1. Begin with your state’s basic land-cover model of cores and corridors, if one is available, and determine the date of the version you are using to ensure you have the most up-to-date data available.
2. Consider core habitat distribution.
3. Consider what corridors and steppingstones you will need between cores to create a viable habitat network.
4. Identify those habitat cores and corridors that have the highest priority for conservation.
5. Identify gaps in the network of cores and corridors.
6. Identify and rank any additional local priorities.
7. Assess the risks to those areas.
8. Review the levels of protection you have assigned.
9. Reality test your model and finalize its data.
Once collected, your data can be utilized to demonstrate the relationship between your priorities. For example, if you overlay your digital layer of protected lands (such as lands under easement or within national parks), it may show you that the natural assets you have identified as key resources are not, in fact, as protected as you thought; in fact, they may be at serious risk of disappearance without
concerted conservation action. You may also notice that a large tract of habitat ranked as average connects two highly ranked areas. As a result, you may decide to raise the ranking of that ‘average area’ and add it to your map as a priority area because it is a key corridor that helps connect your local landscape and facilitates a more resilient natural network that can better withstand change.
The more connections you have across a landscape, the greater its potential to ensure that species diversity is maintained. Likewise, expanses of connected areas of natural cover can also allow for recreational uses such as cross country sports (skiing, riding or hunting) which depend upon a connected landscape.
Each natural asset map needs to include a map of the natural and cultural assets that are most significant and of highest priority to your local community. Determining ‘significance’ requires that you set goals for what is most important. This was covered earlier in this chapter.
The process of creating maps allows new priorities to emerge. You may discover that an asset you thought was abundant is actually in short supply, thus driving a new goal for restoration. Or you may find that overlaying additional data layers highlights previously unrecognized landscape features worthy of protection. For example, a forest may gain greater local significance because an historic event occurred there, such as a Civil War encampment, an Indian burial mound, or a battle at a frontier fort.
In one county, considering this historic data overlaid with the forest layer, turned an otherwise insignificant piece of woodland into one worthy of protection. It led the local county to prioritize that woodland for its historic significance. From an ecological standpoint, that piece of forest was not the most remarkable in the county, but its historic resources elevated its preservation importance. It also turned out that the site provided a wonderful setting for a newly constructed ‘green’ elementary school adjacent to the woodland, because it afforded the children an accessible place to study nature while also learning about Civil War history. Without its historical significance and educational opportunities, it is likely that the woodland would have been developed long ago.
Similarly, an area could be ranked more highly based on local knowledge of its ecological function. For example, a local river or wetland could contain a unique feature
such as a heron rookery (a place where many herons breed and nest) to be more highly valued at the local level and thus increase the ranking for that feature. In this way, overlays of data sets help bring out new priorities. Combining data sets in new ways can bring out hidden values and can lead to new conservation or restoration goals.
These examples show why it is important to use your data layers to look at land development patterns and compare that with known problems. In urbanized areas, even streams with wide forested stream buffers can be polluted by stormwater runoff, if there are pipes carrying untreated stormwater from urban areas directly into waterways.
For each problem known or suspected, use the data to help answer the question, “Can a green infrastructure strategy help address the problem?”
A community may hold in high regard certain intrinsic values, such as wildlife, or promoting a landscape that is biologically diverse. But how do you map such values? Well, you can map the desire to protect wildlife by including those habitats that support the greatest species diversity. But how do you do determine that?
Your community will need to establish a series of metrics and protocols for what types of habitats to conserve and where. A metric is a measurable quantity, such as buffer width, acreage, the number of tree species, the age of a forest, or water quality. A protocol is a scientific method that turns those measurable quantities into discrete spatial data that suit your needs.
When you try to capture community values on a map of natural assets, be sure to use appropriate and defensible scientific protocols. For example, to map corridors for wildlife, consult the academic and scientific literature. A local expert can also help – such as a qualified employee from your state natural resources or wildlife agency. Use this information to determine how wide the corridors need to be, where might be the best locations, and so on. For example, as part of the 1996 federal Farm Bill, the Natural Resources Conservation Service (NRCS) encourages landowners to install buffer strips ranging from a minimum of 30 feet for some herbaceous filter strips to a maximum of
150 feet for forested riparian buffers (Fischer and Fischenich 2000). Most states have their own requirements as well. Similarly, if you wanted to protect drinking water intakes, your state likely has guidance on how far upstream the river needs to be protected, so use your legal standards when establishing protection zones on a map. The specific models, data sources and suggested methods for doing this are covered in Chapter Seven.
Your community will need to establish a series of metrics and protocols for what types of habitats to conserve and where. A metric is a measurable quantity, such as buffer width, acreage, the number of tree species, the age of a forest, or water quality. A protocol is a scientific method that turns those measurable quantities into discrete spatial data that suit your needs.
So far, we have discussed natural assets and the protocols for mapping them. But your project may also want to include assets that are valued for cultural reasons. Green infrastructure is a construct that helps us think about the importance of natural resources for people. Yet because people place an intrinsic value on nature and biodiversity – in other words, they value something because it exists, even if they have never experienced it personally – human use of a natural feature is not a prerequisite for including it in a natural asset map. That said, there are cultural resources and values that depend upon the support or context provided by neighboring natural areas.
It can be a complex undertaking to help communities make the link between culture and nature. However, when community members are asked to think about a cultural place that they really enjoy, such as a plantation, a battlefield or an historic farmhouse, it is often the setting that makes it particularly special.
The setting can be made up of forested hills or mountains, large trees around a building, an adjacent river or marsh, or an uninterrupted vista of green. A view looking out from the structure is part of the experience of enjoying it. Similarly, many recreational pursuits depend upon nature and intact landscapes to make them possible – such as hunting, cross

country horseback riding, skiing, landscape and nature photography, birding, canoeing and kayaking.
In Nelson County, VA, views of the intact forested landscape pay dividends to businesses that bring in clients largely to enjoy those vistas while eating or drinking their products. Several local breweries have sprung up in the past five years that depend upon on the county’s clean, clear spring-fed streams, as well as on the breathtaking scenery that lures urbanites from nearby densely populated counties and cities. These views keep tourists, hikers, bikers and birders in the county longer, offering refreshment after a fun day in the field or touring local amenities.
According to one Nelson County brewer, “The water in this region is an integral part of the success of our brewery process.” One forester called the all-important views of the mountains from the breweries, cideries and wineries “the brewshed” – those views afforded to each brewery that lure and retain customers throughout the seasons. In fact, Nelson County has combined marketing for nature-based recreation on the Appalachian Trail and Blue Ridge mountains with enjoyment of beer in natural settings by creating a “Brew Ridge Trail,” which links hikers, birders and boaters to the many breweries and wineries in the area.
Built structures, which include features such as plantation houses, historic log cabins, old, one-room schoolhouses and 18th century mills, are likely to have a country setting and their backdrop landscapes of hills, forests, marshes, or streams contributes to their historic character.
A simple way to identify these cultural assets is to contact your state’s office of historic resources to learn the location of its historic features. It is then relatively easy to map them at a large scale (county or region), where you plot each point and create a buffer around it. Draw the buffer as large as it needs to be. One suggestion is to include contributing natural resources within 500 feet, with a 1300 feet (¼ mile) boundary around areas dependent on a larger setting.
A more accurate (and more time consuming) approach is to use digital mapping tools. There are several add-ons to GIS that can map elevations, and thus sightlines, such as using the GIS-based digital elevation model and Crystal Reports. These can map elevations, which determine where vistas are more or less visible and thus more or less important for a visitor’s or resident’s experience from a site. It only takes a few minutes to run a digital elevation model and output an elevation map. The time-consuming aspect is to analyze the results, which will likely require site visits to confirm what is actually visible. ESRI’s web site provides guidance on mapping viewsheds as well.
Another method of collecting data about culturally significant features is to ask community members and stakeholders about them. Just be careful to verify the data, as anecdotal information is not always reliable.
Some cultural resources may need to have their locations masked, such as Native American burial mounds or other sacred sites where artifacts could be plundered or compromised by disturbance. Adding a buffer – say 1000 feet -- around those sites can hide their exact locations.
The advantage of linking cultural and natural resources is that it helps a community recognize the importance of natural resources to its well being, identity and sense of
place. These natural resources may be taken for granted until they are destroyed. County boards are often asked, why did the cell phone company propose to put their tower (or other obstruction) in our most iconic view? Besides the obvious answer that the location was probably in a good reception area for cell signals, it may also be because most localities have not taken the time to create cell-tower location guidance that avoids mapped viewsheds.
An important caveat when adding cultural resources to a mapping effort is to carefully bound the discussion; otherwise, people begin to add in ‘everything.’ At some GIC workshops, participants have even requested we map the locations where things used to be – as in the place where an old store burned down in 1942, or the location of the old school they attended before it closed.
It is important that people understand they are not making a map of everything they value, but rather those key cultural items that depend on a natural setting for their enjoyment and function. So nature-based recreation means a walking trail through the woods or along a river greenway trail, but does not mean a pedestrian walk through the mall; it means a field set aside for birding, but not one for drag racing.
If people in your community really want to put their favorite nature- and culture-based resources on a map, let them. The GIC calls these maps ‘Favorite Places Maps’ or ‘Peoples’ Maps.’
As long as a resource relates to green infrastructure in some way it can be recorded on its own GIS layer. Allow people to write on a map at a community meeting (or have them add their ‘data’ digitally through programs such as Green Maps). Create a common nomenclature or symbology (such as different colored dots) for the different classes of features on the maps, such as “fishing spots,” “best hiking,” “best sunset view,” and use the symbols to create a coherent and readable map (see the illustration for Accomack County, Virginia on page 64).
Such a ‘favorite places map’ can prove useful when it comes to evaluating your green infrastructure priorities. For example, you may find that it closely overlaps
areas that had already been prioritized by your local county administration as natural assets and thereby provides community validation for what local government and conservation groups had already identified as priorities to conserve.
The following chart provides examples of goals and potential data sources to indicate spatially how values and goals
can be translated into a map of natural and cultural assets. The degree to which they are achieved – for example, how much natural area is protected or how much acreage of intact forests are preserved within the locality – will be determined by the specific objectives you set to achieve each goal. The purpose of the chart is to help you match your goals with resources that can be represented and evaluated spatially.

Protect habitat for native species. Intact Forests or other habitat types (i.e. large dune systems, wetlands, marshes, natural heritage areas)
Habitats that have adequate interior area which is unfragmented by intrusions such as roads or power lines that create edges which facilitate problems from invasive species or predators. In the eastern U.S., 100 acres of interior conditions (that do not include the necessary 300 foot buffer from surrounding land use) is a minimum size to accommodate a diversity of native forest-dwelling animals, bird and plants.
States such as VA and MD have mapped intact forested, wetland and dune areas (cores) already. The National Land Cover Dataset can be used to create a core layer. A fragmentation layer can then be used to determine which areas remain intact. Those areas that have at least 100 intact acres that are not bisected may form a new core.
Prevent urban heat islands.
Protect aesthetics. Reduce stormwater (developed areas). Sequester carbon to mitigate climate change. Clean the air.
Protect habitat. Protect water quality. Protect aesthetics. Support fish nurseries (if tied to waterways or ocean).
Promote agriculture row crops.
Forest Canopy Canopy is the coverage by forests (bird’s eye view) and is more commonly applied to urban areas where other values (besides forest interior) also become important, such as tree cover to keep cities cooler, aesthetic values of trees to downtown areas, and habitat for urban birds and other animals. Trees also mitigate urban stormwater and sequester carbon and clean the air.
Forest canopy may be available from the Department or Division of Forestry. In urban areas, along with the canopy (or if no canopy data, you can use street tree inventories, if available, or create your own).
I-Tree is a software tool to help evaluate canopy.
Wetlands Wetlands include forests, meadows, bogs, shrub swamps, ponds, lakes, streams or bays, and depending on location, may be tidal or non-tidal. Many species can only thrive in wetlands and they provide nurseries for many birds, fish, crustaceans, insects and animals.
Agricultural Soils Prime (best) agricultural soils occur in certain locations. If crops are important to the area, then agricultural soils can be mapped.
Promote fruit orchards or vineyards. Slopes Soil Type
Fruit trees and vineyards do best on south or west facing slopes in well drained soils. A local extension agent can help suggest the best areas for orchards or vineyards.
National Wetlands Inventory Data (NWI).
The NWI may not be very precise. If local or county wetland data are available, add that to this layer.
USDA Soils Data Mart, select classes IV and V (top ranked). Use land cover to select and remove areas already covered by urban uses (cities, towns, industrial parks) since not suited to large scale farming.
Use a digital elevation model to select slopes.
Use the USDA Soils Data Mart, select appropriate soil classes.
Protect watersheds and clean water.
Watershed Boundary Forest Cover Stream Buffers
Municipal Water Supply Watershed
Boundaries
Water Quality Data
Streams should be included in most GI maps as they provide habitat and are often good corridors for wildlife, as well as sources of drinking water. To determine how well forested the watershed is, the forest cover can be clipped in GIS to match up to the watershed boundary and used to determine the percentage of area covered by forests. For water quality, map stream buffers by using GIS to find center lines of streams and map 100 feet widths on either side to see extent of forested stream buffers for buffering runoff. For large rivers use stream edge if known.
If using streams for wildlife corridors, select 300 meters on either side of stream and intersect with forest layer to see if adequate forest buffer to provide a protected corridor. If protecting headwater streams, use steep slopes and elevations to select upland streams for protection.
National hydrography data set for stream locations and augment with additional local data. See forest canopy above. In Virginia, a new modeling tool InFOREST can be used to map land cover and get N, P, Sediment loadings by watershed. State 305B Reports contain water quality ratings and the 303D lists contains impaired waters.
Protect settings of cultural resources. Historic Sites (in rural areas), battlefields, cemeteries, tribal lands, etc.
Historic sites are often dependent on the context of the surrounding landscape. Buffer each point (building) by 300 meters. You may also want to protect the views from this site for visitors.
Obtain historic data from State Division of Historic Resources. Some sensitive data, such as Indian burial sites, may not be available. Viewsheds can be mapped using the ArcMap Viewshed tool. It uses point data and Digital Elevation Models to calculate the visible area. Moderate to advanced GIS skill necessary.
Promote vibrant business districts.
Tree Canopy Street Trees Parks/Other green spaces
Trees provide aesthetics, shelter, and stormwater management. Treed business districts see higher revenues per shopper. Parks, river greenways and trails also attract business to downtowns. Offices are more likely to locate in greener downtowns.
See forest canopy. Also, use local data for trail and park locations.
Promote healthy lifestyles and nature based-recreation.
Parks Trails State Forests Wildlife Management Areas
Parks whose primary or majority of uses requires natural areas.
Existing regional trails, rail trails, wildlife viewing areas. Select areas that are close to existing or proposed trails, to either buffer the users’ experience or provide for potential new connections in the future.
Making a map of your assets is just the first step to conserving those resources. While it is important to know what your organization or community values and to be able to represent those values spatially on a map, these mapped assets must be evaluated to determine if they are at risk from roads, redevelopment, dams, or other factors.
‘Risk’ refers to whether a natural asset is likely to remain intact or not and will help to prioritize which areas to conserve, how to rank them, and what actions may or may not be needed to protect them.
Remember that a map of natural resources is a snapshot in time. Land uses can change and land may be converted from one use to another. It is important to conduct even a cursory analysis of which resources are likely to remain and which may change or disappear.
To do this, we need to ask such questions as:
• W hich areas are zoned for development and do they overlap key natural assets?
• Which forests and other key natural areas are threatened with fragmentation by roads or subdivisions?
• Are there areas threatened by natural enemies, such as pests or diseases?
State or locality park data. Wildlife and Birding Trails. State Parks. Open space lands. State Forests (if open for visitors). Rail to Trail Routes/regional trails. Important Birding Areas (publicly accessible).
• Are there areas at risk from natural disasters, such as extreme floods or wildfires?
• Which streams are likely to be impaired in the future?
• Are there impaired areas where habitat can be restored?
• What viewsheds are threatened?
• Which assets are most threatened by present zoning and currently planned developments?
In the future, zoning can be reviewed, land may change ownership, natural events such as floods or tornadoes can alter landscape conditions, populations may increase or decrease, and localities may have more or less money to spend on roads, land acquisition and conservation easements. Thus, it will be important to update maps and data along the way.
The chart of risks and associated actions provides a checklist of possible actions to forestall potential or unforeseen risks to natural assets. For each threat to an asset ask, “How can we change our plans to better protect it?”
But first, before taking action, it is best to evaluate how great the actual threat is. For example, if a highly ecologically sensitive area has been zoned for development, it may be worth finding out just how likely the land is to be developed, and how soon. If it turns out that there are already plans in process, then prioritize the area and search for alternative ways to protect it.
Incompatible Zoning Overlay existing zoning with current natural resource priorities. Identify areas where uses are incompatible, such as industrial or residential zoning overlain with large intact forests or wetlands.
Zoning can be changed if a comprehensive evaluation is conducted. Zoning can also be changed if a ‘mistake’ is shown to have been made, such as information that was unknown or incorrect when the zoning was determined. Consider a rezoning effort to channel new development into other areas or build more densely and consider infill options. Even within areas zoned for development, is there room to include wildlife/recreation corridors to keep the landscape connected?
Future Land Use Changes
Review future land use maps to see where the community plans to grow in the future. Where are proposed service districts? Consider if people will encroach into forested areas. This can cause problems for wildlife as well as increase the risk of wildfire impacts to people. Invasive species may also be introduced by new residents.
Is the map still current? Is it based on actual/accurate population projections? Should it be changed? And when is the next update scheduled? Does the community need more education about the risks of living within these forested zones (also known as the wildland urban interface).
Impaired Waters
Waterways, lakes and bays can be designated as impaired and placed on the 303 list as required under the federal Clean Water Act. Overlay this list with those water features you consider to be important, in order to see which waters are polluted. For example, are impaired waters a threat to drinking water or trout fishing?
Consider whether more waters could become polluted in the future: Are currently pristine areas zoned for more growth?
Population Growth If the area is likely to grow at a fast rate, where will people live? Evaluate whether there are currently enough housing units in the right places to meet this growth.
Determine why the surface water is impaired. If the impairment is caused by land runoff, you could help meet the regulatory requirements under the Total Maximum Daily Loading (TMDL) requirements by conserving more land in the watershed. When reviewing impaired waters, consider which are harmed by a cause that can be addressed through habitat or land-use mitigation. For example, if a stream suffers from excessive sediment or habitat destruction, your strategy could address needs for reforestation or enhanced stream buffers. If a cleanup plan has not yet been created, determine whether setting aside land for conservation could help to restore the water quality. Protecting key habitat cores for wildlife could also benefit a stream’s health, depending on its location in the watershed.
Where are designated growth areas relative to key natural assets? Do people have opportunities for recreation near to where they will be living? Consider whether land could be set aside to accommodate future recreation needs. Also consider whether waterway impairments could increase the costs of cleanup requirements, or if additional environmental regulations and incentives (such as density bonuses to encourage infill that also provide for low-impact development measures, such as rain gardens to mitigate stormwater runoff) could help modify development patterns.
Transportation Plans Will planned roads bisect natural features? Will new roads lead to increased development that may also impact natural features?
Can other, less impactful routes be considered? Are the roads needed? Are transportation demand models based on up-to-date population projections? Can alternative transportation models solve some of the demand to move people? If road projects need to purchase land to mitigate impacts, such as wetlands or open space, can the natural asset map be used to prioritize which land to acquire? Also consider new approaches to green highway design that are less impactful to wildlife.
Impaired Landscapes Are there areas that have a high degree of pavement causing excessive runoff and high urban temperatures? Are there old industrial sites? In rural areas are there overgrazed fields or streams without forest buffers? Are there restoration opportunities to reconnect core wildlife habitats?
Which areas could be reforested? Which streams could be planted with forested buffers? Could impervious areas be demolished and re-greened? Can brownfields be remediated through state and federal grant programs?
Just because a parcel or tract is currently zoned for development does not mean that it will be developed. A developer may be willing to swap land that is desirable to a locality in exchange for land closer to existing roads or transportation, or that offers him other benefits.
Remember that green infrastructure asset planning does not try to halt development per se; rather, GI planners should evaluate and map their natural assets to be as strategic as possible in using land for its best functions, so communities can achieve a balance of ecological, economic and health goals.
The risk chart includes examples of common resources to evaluate for risk and what to address. This list will likely need to be informed by local planners. Other risks within the community, such as abandoned mines, Superfund sites and large paved areas lacking adequate stormwater controls, will need to be evaluated as well to determine their risk and what actions, if any, can and should be taken.
It is important to evaluate the potential that any identified risk has to affect your natural assets and what you can do, if anything, to remediate that threat. For example, a risk can exist, but its impact could be low, even though you could easily remedy the situation. Alternatively, it could have a high impact but not be changeable at all. Consult with local planners, the development community, land trusts and conservation groups and others to evaluate whether the potential risk actually exists and if the development plan has already been proposed. You can also use this process to determine whether or not it is not too late to propose an alternative land development scenario that leaves some of the area as open space.
Sometimes, land can be swapped or traded so that areas more valuable for natural resource conservation or hazard mitigation can be protected in exchange for moving development to places more suitable for new growth. In an example from Albemarle County, Virginia, a nonprofit housing agency, Habitat for Humanity of Greater Charlottesville, owned land that is surrounded by the borders of newly designated state park land. Working with the county and state, the nonprofit housing provider proposed to swap some acreage of land inside the park for land outside the park, thus preventing interior land uses incompatible with a state park. This allows Habitat for Humanity to create habitat for people and land for the county to construct an active-use recreational facility. All sides – the
park agency, the nonprofit housing agency and the county – thus get a better deal. Both habitat for animals and for people can now be in their appropriate locations.
A challenge can arise in trying to plan for your locality when an adjacent or nearby locality has created plans that conflict with your goals. Frederick County, Maryland has a border with Pennsylvania. It has designated this area as its agricultural preservation area, but Pennsylvania is allowing development to amass on its side of the border.
Such conflicts are also found between cities and counties. While it makes sense from a ‘smart growth’ perspective for counties to encourage development near urban areas, tall buildings and encroachment into once-forested areas are troubling for some city residents in low residential density areas, who are now faced with buildings and denser development just across the county boundary.
Your evaluation of risk should also consider the quality or health of the natural asset in question. For example, an area that seems to be worth preserving because it is covered by forest canopy and seems to provide good habitat for many species may, on closer examination, reveal that the trees are second or third growth, mainly pines and scrub oaks, and are suffering from diseases or pest infestations. If this is the case, additional management or forest restoration would be needed to help bring the forest back to a state that would be found naturally, had not logging, invasive species or pests altered it.
Based on assets and risks, determine what land can or should be conserved or restored. This may also point to areas that are more appropriate for development, either because they do not contain rare or unique natural assets, or because they could provide recreation and other benefits to residents.
Once assets most at risk have been identified, rank them –to prioritize those natural assets that should be preserved or restored. Engage your community in ranking the key areas of importance. Map opportunities and draft strategies to conserve them.
Be sure to indicate why each asset is of greater significance. Also, how assets are ranked should conform to pre-established goals. If one of the goals is to avoid impacts from new development on existing forests and woodlands, then prioritize those parcels of forest and woodland most at risk from new development.
Basically, there are two things to consider here: Which assets meet your community’s goals for conservation? And which are most threatened? It is those that fall into both categories that should have the highest ranking to protect first.
Here are some things to consider:
• Which are the top five/ten areas of forest or woodland that are most threatened, or that offer the most value for forestry, recreation and wildlife habitat? Specify why.
• Which are the top waterways to preserve, and why?
• What are the top geological features and viewsheds that need to be preserved, and why?
• Which historical landscapes are most important and most under threat?
• What recreational areas are of most value and are most threatened?
Your map can also include desired future assets:
• Where should future parks and recreational areas be located?
• Suitable locations and routes for future agritourism businesses (such as pick-your-own fruit orchards, wineries, honey producers, local beef, pork and chicken farms, and vegetable stands).
• Scenic views or routes through historic or cultural assets that should be protected and enhanced.
• The best areas for future industrial parks and housing developments.
Consider areas that will not be preserved or which may require extra care:
• Growth areas already set aside for new development.
• Industrial zones that may be incompatible with conservation.
• Areas that are currently contaminated, such as brownfield sites, and which may be reclaimable in the future.
Ranking is another way to assign human values to data. Everything that is included on a green infrastructure map is based on a value. A specific value may be more objective
or more subjective, but each resource included on a natural assets map is there because a value has been assigned to it.
An example of an objective approach would be: “Put all third-order or higher-order streams on the map.” The parameter that the streams should be “third order” is objective, in that it was chosen to provide a specific size stream. Another example is to select all forested corridors at least 300 meters wide that connect large intact forest cores, to help facilitate wildlife movement.
Both parameters for mapping listed above are objective because they provide specific decision metrics for their selection and inclusion on a green infrastructure map. However, the reason for choosing them is more subjective. You may have selected large streams because they are more likely to serve as significant corridors for wildlife. Large forested corridors may have been selected because of a value placed on the importance of wildlife movement and enhanced opportunities for biodiversity from a connected landscape.
If you are planning a green infrastructure network without the aid of an existing state model, you may need to create your own data layers and overlay them to create your green infrastructure network. This will still require making a determination of what is most important. If you are following a community consensus-based project then you may have to resolve diverse or conflicting values for what is most important. People will value things differently and the values assigned may depend on their purpose.
Following clear scientific principles for how much habitat species need to survive and thrive can help to create more objective mapping guidelines. If you do not know this information, create a technical advisory committee of qualified scientists.
Assuming that clear goals have been established for why you are mapping the natural resources of your landscape, you may want to rank those resources. One way to do this is to incorporate weighted overlays to establish your conservation network.
Weighted Overlay
Weighted overlay is a standard technique used with rasterized GIS data to determine the suitability of a landscape to meet existing objective criteria (determined previously). Each raster is a matrix of cells containing data, such as aerial images (captured in a grid and made up of individual cells).
Weighted overlay is a standard technique used with rasterized GIS data to determine the suitability of a landscape to meet existing objective criteria. Weighting allows an area that has a higher value to be selected.
Cells can be selected based on their values (e.g. they have a certain color denoting tree cover) and these values can be weighted. This allows you to select an area that has a higher value. You can create a technical committee to assign weights and help in ranking.
Certain values could be added to a green infrastructure map to give some areas more points (weights) for human values, such as a watershed area that supports drinking water uses (+3 points), known endangered species (+4 points), and so on. When Virginia created its Natural Landscape Assessment, it assigned values (points) to different attributes that were used to rank forest cores. So areas that were larger received more points, as did areas that had more surface waters, unique geology and other factors. As a result, it came up with five different levels of ranking. In order to assign values, a science review panel is recommended to ensure that values relate to known importance.
Remember that many natural landscape elements can be restored. A successful green infrastructure strategy often includes, not only protecting existing natural assets, but improving their quality and extent.
When reviewing a map of existing natural assets, you may find areas that are disconnected or degraded. If two habitat cores lack a connection, a new corridor could be planted. Similarly, a forest or wetland core could be expanded by planting more trees or removing invasive vegetation. You may also need to manage specific rare habitats if they support a particular species that has been deemed important. An example of this are bogs that might need to be cleared of trees periodically to ensure that water elevations remain high enough to support rare amphibians.
Landscape features that tend to remain in place, such as streams, can be selected as corridors for a green infrastructure network. Their permanence in the landscape makes them well suited to serve as long-term corridors. However, to provide an adequate passage for wildlife, native vegetation may need to be re-established. This is especially true in livestock areas, where farmers may have cleared land right down to the stream edge.
If your goal is to provide a buffer to protect a stream’s water quality, then a minimum width of 100 feet is recommended (for more on buffer design, see Bibliography). However, if you wish to encourage wildlife passage and protect the buffer from invasive species, a wider strip is recommended, say 300 meters (approximately 1000 feet) on both sides of the watercourse.
Ridges can also serve as key corridors. They are often undeveloped because of their elevation and steeply sided slopes. They are important because many species, such as bears, migrating butterflies, bats and raptors, rely upon high elevations to survive or migrate. They use them as corridors.
For other species, such as bighorn mountain sheep or the north American pika, these higher elevation ridges and meadows are their special habitat niches – places with the unique conditions necessary for their survival.

In most urban areas, green spaces have become disconnected. City parks and waterways can serve as the core resources of a revitalized urban green infrastructure network. Your city may also have large vacant lots that have become overgrown as people moved to the suburbs and businesses relocated. Some of these can be quite large – if a foundry or steelworks closed, a paper mill or a car factory, there can be hundreds of acres of land available.
These vacant, abandoned spaces can become part of a restored green infrastructure network, though they will
Pica can only live at colder, high elevation ranges.These maps show opportunities for re-greening Richmond Va. The top map shows vacant parcels and the bottom map intersects those parcels with water features. This helps to show which vacant parcels could provide water quality benefits if re-greened.


almost certainly need to be replanted, cleansed of invasives and pollutants, or otherwise regenerated. If it is a brownfield site, there may have been past industrial uses that need to be remediated, if you want the public to be able to access it.
that needed to be re-greened if they were to become part of a connected network. In fact, several key parcels needed to complete the network were found to already be owned by the city, thus facilitating creation of an integrated network!
When you consider which vacant or abandoned parcels could be targeted for re-greening, you can rank them according to their ability to contribute to a wider green infrastructure network. By developing a series of questions and scoring each question by importance (weighting the answers), you can develop a systematic approach to determine which parcels to acquire, where to obtain an easement, where to conduct a restoration project, and so on.
There is often enough vacant land in an urban landscape that a green corridor or ‘green finger’ could stretch across the back of several parcels. Planners may want to consider whether to request additional protections for parcels that contain unique natural assets or offer an opportunity to create a connected network.

In cities, even paved areas can become part of a green infrastructure network. There may be large areas of concrete or asphalt that are no longer occupied or utilized. Abandoned car lots. Derelict factories. Demolished warehouses. Such areas are not uncommon in cities that are going through a post-industrial reorientation of their employment base.
“There is often enough vacant land in an urban landscape that a green corridor or ‘green finger’ could stretch across the back of several parcels.”
The illustration on the following page depicts an approach for recognizing regreening potential. Note that adding new green spaces and corridors does not necessarily preclude new development or redevelopment.
Such areas can be nothing more than large expanses of cracked, trash-strewn, scrubby pavement that lack any respectable urban trees. However, even these old paved areas can be regreened by removing the pavement, regrading, bringing in good quality topsoil, opening up culverts to recover streams, and replanting them. On the other hand, if left alone, vacant areas can sometimes regenerate themselves, and over time, come to possess significant natural habitats or even rare species.
Vacant lots and large paved areas can also be connected to form new corridors and urban greenway trails. In its Richmond Project, the GIC created a database of all vacant and underutilized parcels by combining several city databases into one master, sortable data source. This resulted in a list of 9000 vacant and underutilized parcels! This was then overlain with the city’s green infrastructure network to determine where vacant parcels could support a wider green infrastructure’s existing natural assets. It further identified those lots that were vegetated and those
In urban areas, when evaluating natural assets at smaller scales (fractions of acres instead of hundreds of acres), minor landscape resources become important to consider and can make a large cumulative difference. An example of this concept is the urban tree canopy, which can be restored one tree at a time.
An urban tree canopy (UTC) does not constitute a forest per se, but taken city-wide, can serve a vital role in keeping built-up areas cool. Urban forests also intercept stormwater, which many cities need to reduce or better control. Studies have shown that the urban canopy can reduce a city’s stormwater runoff by anywhere from two to seven percent.
Even one tree can play an important role in stormwater management and the benefits of many trees can mitigate the impact of a city’s surface water runoff considerably. For example, estimates for the amount of water a


typical street tree can intercept in its crown range from 760 gallons per tree per year to 4000 gallons per tree per year, depending on the species and age.
If you have access to an UTC assessment, you will see that, while your town, city or urbanized county may have an acceptable city-wide percentage of trees (American Forests recommends at least a 40 percent canopy for urban areas east of the Mississippi), certain areas will have far fewer trees than others. For example, In Virginia, Richmond City’s canopy is 42 percent overall, but some downtown areas are as low as 9 percent.
Tree canopy assessments can be used to target priorities for reforestation of those areas most in need.
You can use small-scale raised beds and greenhouses to locate agriculture in areas where it would not naturally occur, or where contaminated soils on brownfield sites require you to do so for health reasons. While raised beds are not dependent on locations of good agricultural soils, you can use GIS to map areas where community gardens exist and also notice where they are lacking and could be added.
Once land has been prioritized for its importance in a green infrastructure network, the question needs to be asked, “What is the best way to include it?”
Should it be acquired, or would a partnership or management agreement with the landowner ensure that it is managed in a way that contributes to the locality’s ecological health or to other goals, such as stormwater infiltration and attractive views?
Sometimes, a parcel is already under government ownership and simply requires a joint management arrangement with the appropriate agency. Or only part of the parcel may be needed to meet conservation goals. A large parcel might be improved to contain an office building in the front half and a restored stream buffer on the back half.
This checklist is intended to help planners prioritize the land they want to conserve in urban areas at the parcel scale. Add additional questions that meet your own specific goals.
Does the parcel help maintain an existing goal for the city, such as infiltrating water or providing recreation?
Does the parcel contain natural features, such as mature trees, a meadow or a waterway?
Is the parcel adjacent to a stream, such that its conservation can contribute to good water quality?
Does the parcel contain a wetland?
Does the parcel contain any rare, threatened or endangered species?
Does the parcel contribute to a larger natural network?
Does the parcel provide a key recreation opportunity?
Does the parcel offer an opportunity to change a noxious use into a productive one?
Does the parcel provide an environmental educational opportunity, such as open space next to a school, community center, or other community facility?
Would the parcel help form a corridor between two or more key landscape features?
Is the parcel near to another significant natural area? For example, in urban areas, wildlife, bees, butterflies and birds can utilize a stepping stone approach to movement, so that even areas that are close, but not touching, can create a connected habitat network and support biodiversity.
Does the parcel present a restoration opportunity? For example, are the trees invasive, non-native species that could be removed and the area replanted with native species?
Does the parcel provide a buffer to an existing priority feature? For example, does it abut a Civil War or Revolutionary War site? Is it part of the viewshed for a key cultural asset? Does it shelter a sensitive area, such as a bog?
What are the quality of the existing trees/vegetation on the neighboring properties? Are there re-development plans that could impact the site?
Cities such as Cleveland Ohio have begun using their large vacant parcels to create urban farms, thus creating a more livable city with a future that includes abundant local food. This also creates a new urban economy for residents who can now sell produce to their neighbors. Urban agriculture can be done on rooftops, on school grounds, on vacant lots and many places where there is open land and people need access to healthy food. These garden spaces (or garden potentials) can be included on an urban green infrastructure plan. See the community gardens map created for Southside Richmond. In this map, existing gardens were mapped as well as vacant parcels to determine options to add more gardens to the area.
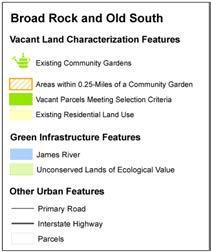


Restoration is not always feasible from a practical or a financial standpoint. For example, high-quality agricultural soils cannot be relocated. Similarly, areas that have a unique geology, or contain old-growth or high quality forests or other rare habitats should be protected wherever they are found, and whenever possible. Wetlands also may have unique hydrology, plant assemblages and amphibians, as well as recharge processes that cannot be fully replicated when moving (recreating) the wetland somewhere else. And, of course, once a unique local species has become extinct, it can never be brought back.
Green infrastructure plans can fit into existing city and county planning efforts and can compliment already-identified conservation goals. The following are examples of how green infrastructure assessments may be utilized to inform planning:
• Environmental chapters in comprehensive plans, or to implement existing comprehensive plan goals for resource assessments and conservation.
• Park, open space and recreational planning or strategic land acquisition.
• Strategies for determining where to zone land for conservation or growth.
• Lands for the purchase, or transfer, of development rights.
• Heritage tourism strategies and viewshed protection.
• Urban tree canopy surveys and management.
• Transportation planning for roads and multi-modal planning.
• Targeting land for conservation easement programs.
• New ordinance development, (stream buffers, watershed protection, historic landscape or other conservation district overlays, codification of requirements for landscaping within developments).
• A rezoning decision for more or less dense development (upzoning or downzoning).
• Conserving forest cover to protect surface water quality and supply, mitigate stormwater runoff and facilitate the infiltration of water into groundwater aquifers.
• The identification of areas where conservation is appropriate or needed.
This section includes examples of how to ensure that your maps are utilized for informing daily land-use decision-making: what is meant by ‘implementation.’ However, it does not cover all aspects of planning regulations and practices, as it assumes some familiarity by the reader.
Of course, natural asset planning is not limited to ‘natural’ or pristine areas. It is often needed because of the challenges posed to those remaining green areas in suburbs and towns when more and more gray infrastructure is being built. In already developed areas, green assets can be reconnected through new corridors. They can also be restored by revitalizing a brownfield site with trees and shrubs.
Planning to conserve natural assets involves more than identifying what to protect. The converse is also true. Once you have identified areas to conserve, you can identify areas where development may be more appropriate. If an area does not contain rare species, key water features or does not meet other conservation objectives, it may meet development goals such as, proximity to an existing urban development area, access to a primary road, or lies in a service district for urban wastewater and drinking water treatment. Thus your map can also be used to point to areas less suited for conservation and more suited to development.
Of course, all developed land should also have some ‘green resources’ (parks, open spaces, tree canopy). The key is to think at multiple scales, of how resources connect, and to ensure that the best use is envisioned for each parcel and region based on its actual landscape features and infrastructure conditions.
Once you have evaluated and mapped your community’s natural and cultural assets, it is time to utilize this information as part of everyday planning and conservation work. It is likely that, unless you take some action, your assets will decrease over time. For example, fragmentation caused by roads, buildings and other disturbances is the single greatest threat to forests in the southern U.S. (USDA Southern Research Station). And, left uncontrolled, it will get worse. But this fragmentation could be
avoided by careful planning to prevent bisecting critical natural areas that may be serving key purposes that should be recognized.
Of course, you can also increase your natural assets by setting new areas aside for restoration, such as replanting forests, restoring stream buffers and habitat and removing invasive species. You may also suggest additional measures to buffer a high-value asset from adjacent or potential disturbances.
Since decisions affecting land uses occur within many different branches of government, you may need to hold briefings and workshops for other agency staff, as well as local conservation groups, in order to explain your project’s goals, outcomes and priorities. Hopefully, some of this already occurred during your stakeholder engagement and outreach efforts, but it is common for people to prefer to engage with a process at the end, when there is a product (maps) to work with.
The following are examples of how to use GI information in your planning efforts. In addition, the GIC’s website has factsheets on implementation ideas and examples:
http://www.gicinc.org/resourcesonlinelit.htm#gifactsheets
We have discussed two concepts: first, the notion of risk assessment – determining which assets will be lost if no action is taken; and second, the notion of opportunity mapping – figuring out where there are opportunities to achieve community goals. Prioritizing opportunities, however, is key to ensure you can move from ideas to implementation.
Consider which opportunities are the most timely. For example, you may already have a mandate to create a new water supply plan in the next twelve months, in which case it will be key for you to identify and conserve the watershed around any new reservoirs you are planning. Similarly, if the new reservoir’s construction will require mitigation actions, consider which landscape elements are highest priority to restore. Also, consider whether there are some objectives that can be achieved more easily than others, or right away. For example, have your community work to reforest a stream buffer as part of Earth Day activities. Or incorporate your natural asset maps into a
current update process for the local comprehensive plan.
You may decide you want to have a formal strategy just to implement the conservation of your natural assets. However, consider how to make use of your natural asset evaluation as part of everyday planning to ensure that your maps are consistently applied to planning activities.
The following are examples of how green infrastructure information can be implemented in specific fields.
Could an area that is already large and has intact habitat be acquired as a park to ensure its long-term conservation?
If your community is currently developing plans for future parks, consider adding a natural asset criteria for location selection: Does the location support a key natural asset identified on your community’s natural asset map?
You may also want to co-locate parks with features that provide other community benefits. For example, would placing a park in a particular location also protect an area around a reservoir? Could existing parks be better protected and buffered by conserving large landscape blocks adjacent to them? Current and potential trails and tourism routes can be overlaid with natural asset maps to show how they support the locality’s tourism. In addition, they can be used to lure new businesses to the area.
Make sure your parks department or open space committee is aware of (and using!) your natural asset maps.
Purchase of Development Rights (PDR) programs allow local governments to purchase these rights from willing landowners. Ensure that your state allows PDR programs. These programs allow landowners to reap some of their land’s financial development potential without having to sell it. They also help local government agencies conserve land they do not want to develop because it provides other, more important values, such as watershed protection. Localities
usually have ranking criteria to allow them to objectively determine which lands are most strategic to conserve through PDRs.
The Transfer of Development Rights (TDR) program has similar aims. It allows a local government to adopt an ordinance that enables existing development rights to be transferred from a sending zone to a receiving zone. Sending zones are those areas where development should be limited because the area will not support it (e.g. the area lacks the necessary infrastructure, such as roads, rescue facilities and schools; or the local government is trying to keep development density low there). A receiving zone is an area that is more desirable for development.

Sending and receiving zones must be ascertained in advance by local governments as part of their ordinances. Their natural asset maps can inform decisions about which zones to allocate by highlighting high-priority natural asset areas for their sending zones and, similarly, avoiding them when establishing receiving zones. If your state allows TDR programs, your local government will probably require an implementing ordinance.
Overlay future land use and zoning maps to see where natural assets may conflict with existing zoning. Then decide, should zoning and land use be changed? Should we try to work with landowners to conserve a buffer or corridor through the area? If these areas will be lost, does other land need to be set aside to make up for these losses in the future?
Use natural asset maps to set aside areas for conservation of key species.
Are there areas where rare, threatened or endangered species are known to exist? Local governments can usually obtain this information from their state’s natural heritage program. Also, consult the state wildlife action plan for key strategies. Areas containing rare species can be ranked higher or given greater priority for conservation. It is easier to protect species than to try to restore populations later on. Also, ensure that areas are linked by corridors to allow species movement and repopulation. Of course, protecting species ahead of time to avoid having to list them not only save the species but also saves valuable staff time and money later. It is much more expensive (and sometimes ineffective) to seek to restore something once it has been lost.
Work with the tourism director to explain how to use natural asset maps to bolster your visitor’s experience and conserve key natural assets. Create a map that overlays key recreation areas, trails and activities with natural assets. Which activities do these assets support? For example, a connected network may support cross-country horseback riding, or a large lake may require a forested watershed to adequately protect water quality and support fishing.
As noted earlier in this guide, comprehensive plans provide goals and data about how a community should grow and develop in the future. When zoning is changed from its original designated use, it generally requires a demonstration that there is new information – a substantial change – that warrants a new zoning class.
Or, if a comprehensive analysis has been completed, this can also be a basis for rezoning. A natural asset evaluation and map can form the basis for why new zoning is needed.
One tourism director from a very rural county recently used their natural asset maps to show a business why they should locate its outdoor adventure camp in their county. They were able to search their digital maps of natural assets to find parcels with intact forests, water features, views and access to meet the client’s demands.
Also consider whether there are special routes and key heritage features that should be added to your asset maps, in order to be better protected. Consider partnerships with state and local land trusts to seek permanent protection for key heritage assets and viewsheds that support local businesses and tourism.
Agricultural and forestal districts provide a way to recognize and foster agriculture and forestry operations. Most states require parcels to be contiguous, but some distance gap is usually allowed, to account for roads or other intersections. These districts allow member parcels to pay lower taxes based on their use for agriculture or forestry. Some localities offer both ag and forestal districts and use value assessments or present use value. These use values allow for lowered tax rates based on the actual use, such as a farm use which is operating in an area zoned for commercial development. In localities with use value assessment this is less helpful, but having a district can also signal to landowners and decision-makers where agriculture is desired.
A natural asset map can be used to inform where there are key agricultural soils for row crops, or you can utilize other data from your state department of forestry to determine which areas are most conducive to timber management. Overlay your green asset maps with existing districts or areas which have use value assessments in place. Should forestal districts be expanded to include natural assets or should new districts be created?
Most loca lities follow multi-year plans for transportation. Incorporate natural asset awareness and review of natural asset maps as part of this planning. Use your natural asset maps to inform environmental impact assessments. Mitigating road impacts could mean conserving a key natural asset somewhere else. The key is to have an already-prioritized map for what should be protected next.
VA, the GIC helped the city identify trails and new routes to create a multi-modal plan for transportation that included off road routes – even through the woods! Similarly Lynchburg VA found people commuted to work on their trail network following creation of a convenient trail that linked city neighborhoods to the business district. Cities such as Portland Oregon or Arlington Virginia have also had long standing trails that serve as commuting routes for bikers and walkers.
In the Richmond project, the GIC combined the themes of watersheds and healthy water with community walkability – the Walkable Watersheds Project is gaining traction by linking healthy people to healthy landscapes. It is creating new green routes though the community and to key sites, such as schools, community centers and parks. For more information visit the Walkable Watershed Project at http://www.gicinc. org/projectbellemeade.htm.
Total maximum daily loadings (TMDL) assessments and implementation plans are required for waters that have not met state standards and are listed as impaired. Natural asset maps can be used to prioritize which lands to set aside to buffer impaired waters and to avoid future risks. For example, if your locality has a TMDL based on bacteria and human fecal coliform, is this occurring in an area that is already mapped as having poor soils for septic systems? Consider evaluating areas where septic function is poor and making them off limits to development, in order to avoid future TMDLs. In Virginia, you can use tools such as InFOREST to model current and future loadings of nitrogen, phosphorus and sediment based on various future development scenarios.
Similarly, think about trails as part of transportation plans. They are not just for bird watching; people use them to commute by foot or bike. In Charlottesville,
Watershed Improvement Plans (WIP) affect states in the Chesapeake Bay Drainage. Consider how they can help you conserve areas of natural assets and help your state or local governments achieve credits for pollution reduction. Conversely, since restoration of natural assets will be important in many WIPs, conserving the existing natural assets can serve as an insurance policy to protect investments in restoration. For example, large amounts of money have been spent on restoration, only to have these projects literally washed away because of a lack of conservation planning upstream.

As noted earlier, natural asset maps can show where land should be conserved to meet mandates for water supply plans. Will current and future zoning allow enough forested land cover to adequately protect drinking water supplies? Will current drinking water intakes be affected by changes in land use that may degrade the quality of intake water? Although water can be treated, it is much cheaper to keep water clean to begin with by maintaining the drainage’s buffering potential with natural land cover.
Hazard mitigation is another planning need that is often mandated and can be met by identifying areas that are more likely to be subject to problems such as floods, landslides or wildfire. These areas may be set aside as places to conserve or avoid developing to protect future property damage and loss of life. They may also meet other goals for conservation. And if you live in a coastal or tidal area, you may need to consider future threats such as sea level rise and plan on how to protect your low-lying areas now.
Some groups are already addressing climate change. They are mapping current and predicted future water levels in 25, 50 and 75 years. They are asking whether communities at risk will need to be moved and if they will need financial assistance to do so. And they are wondering if their public parks will soon be underwater, necessitating the acquisition of new areas that will be waterside in the future, as lakes, bays and rivers migrate inland.
A major, and too often overlooked, part of developing your implementation strategy is figuring out how you will finance it over the long term. This necessitates that you develop a strategy to ensure you have the fiscal resources to implement, monitor and manage your strategy over many years. It requires financial resources to be available for individual projects over their entire lifespan. The University of Maryland’s Environmental Finance Center has some good information on these approaches, and the distinction between funding and financing.
If you foresaw that your project would need funds for both its implementation and long-term viability, hopefully you included members of the funding community early on. If you did not, and you need implementation funds, it is time to engage them now!
If you already have a strategy for land conservation and natural asset/green infrastructure priority maps in place,
Ideas for funding land conservation are listed below:
• Conservation Easements: Partner with local land trusts (you may be the land trust) to seek easements for those lands assessed at the highest conservation value. Many land trusts have used green infrastructure maps to prioritize their efforts and create a connected landscape.
• Ask landowners to donate the highest-value lands. For example, both North Carolina and Virginia, have a conservation tax credit that can reimburse developers for loss of development value if they put land under easement. Development rights can also be purchased if the locality has such a program.
• Work with developers to create schemes that develop homes in new patterns and possibly on smaller lots to conserve open land as part of their development. Publish maps of key resources and examples of how landscapes could be connected. (Contact GIC for permission to use illustrations from this guide.)
• If your locality has proffers, let the development community know which land resources, viewsheds or trails you want to acquire or protect. In states that accept proffers in exchange for new zoning or variances, it is perfectly okay to have a wish list of items; it helps developers know exactly what you want and have available.
• Transportation programs will fund viewshed protection. Showing how a GI network gives added value to viewsheds from designated scenic roads has been used to secure funds to conserve land within the viewshed.
Note: A proffer offsets the impacts from new development by conserving land or providing walking access and can be seen as offsetting the impact of new residents on existing parks and infrastructure. As noted before, apply natural assets to criteria for PDR or TDR programs.
they can be very effective fundraising tools. They demonstrate to funders that you have engaged in a strategic and science-based process to determine your priorities and that you are serious about them. You are not just full of empty idealism. You have a plan in hand.
If you establish clear goals based on your priorities, it will show funders that your effort is worthy of funding because it has used a logical and defensible approach and (assuming you engaged the community in your process) that it represents and meets real community needs.
You may want to seek planning grants to provide funding for more staff time for a local government or nonprofit agency to develop maps and conduct community engagement. If a local government is not eligible for grants, partner with a nonprofit that is. The GIC has partnered with local governments to help fund projects. In addition, urban and community forestry grants are available at the state level to conserve forests in developed and developing areas. Similarly, NOAA’s Sea Grant program has funds available for coastal work.
Most importantly, consider how much of this work can be done with existing resources. If the staff planner, GIS expert and parks and tourism staff each spent a few hours a week creating and reviewing maps and strategies, a new set of asset maps and action steps could be created in fairly short order.

Also consider the tremendous resources available from local universities. Students have provided free mapping, model building and implementation assistance to local governments. Students who do this work receive valuable work experience and often college credit if the work is part of a class.
In this chapter, we presented the steps to create a green infrastructure strategy along with myriad ways to implement long term stewardship. In the next chapter, we re-visit the steps in an actual project to help you envision how to utilize maps to create your priorities.
• Step 1: Set Goals
• Step 2: Review Data
• Step 3: Make Maps
• Step 4: Assess Risks
• Step 5: Rank Assets
• Step 6: Implement
This case example takes the reader through the Six Steps of Green Infrastructure planning discussed in prior chapters of the planning guide, in order to demonstrate how green infrastructure maps are created and evaluated. Berkeley County is the case study pilot undertaken to provide a model for replication by other counties in South Carolina. The case study describes how the green infrastructure network was created by selecting the highest-value habitats; shows how the network was updated to reflect new development; and summarizes how other green infrastructure assets, such as agricultural soils or forestry are analyzed. Those who are interested in creating green infrastructure maps should refer to Chapter Seven and its Technical Appendix for instructions to build a green infrastructure model using a constructed Geographic Information Systems (GIS) model. The green infrastructure base map was created using existing state and national spatial data that met quality assurance requirements for resolution, age of information and reliability. A list of the data used is found in the Technical Appendix of this guide. However, before we describe the Berkeley County case study, we discuss a few of the special factors that contribute to the richness of South Carolina’s landscape.

South Carolina has a climate that is humid subtropical and has a particularly rich assemblage of species, in part due to the elevation changes of the hilly Piedmont to the relatively flat coastal plain, and also to the state’s geologic and hydrologic diversity. While the state has changed over the years, it still contains diverse and abundant flora and fauna. Since colonial times, the land cover of South Carolina has changed dramatically from forest to farm and back to forest, and other types of landscapes have also been affected. For example, in the early 1760s Dr. George Milligen wrote that wetlands were the “Golden Mines of Carolina,” and that the rich “cypress, river, and cane swamps [were the] source of infinite wealth, and will always reward the industrious and persevering planters,” and over the next century or so, the state’s coastal wetlands were extensively manipulated for rice production (College of Charleston’s Low Country Digital Library).
Today, the greatest land changes are from conversion of forest or fields to suburban or urban landforms. Wetlands are still being drained; but not for rice; rather, it is to support development. From 2010-12, Berkeley County was the state’s fastest growing county, with a 6.7 percent increase in population. South Carolina’s northeastern coast, which includes the popular resort area of Myrtle Beach, was among the fastest growing areas in the entire U.S., based on 2014 census estimates.
Despite these changes, South Carolina still has a great deal of forests. At 13.1 million acres, forests comprise approximately 68 percent of its land cover. These forests support South Carolina’s forest industry, which is the largest sector in the state. The economic impact from forestry is worth approximately $17.4 billion and it provides the most jobs by industry in the state, at 90,624 (State of South Carolina’s Forests: http://www.state.sc.us/forest/ stateofsc.pdf ).
Since public agencies control just 12 percent of the forested landscape, good forest stewardship by the private sector is key to ensuring that forests remain healthy and abundant. Of course, forest coverage is not uniform across the state and those areas that are seeing high rates of development are losing forested wetlands at a much greater rate.
In addition, recall from Chapter One that the size and intactness of a forest are critical to its health. As populations increase so does impact to natural areas, wildlife and fish, water quality, air quality, scenic quality and other landscape values. Population can increase with less damage if development is planned to minimize the amount of land clearing and bisecting.
Ecoregions are areas which have a geographically distinct assemblage of species, natural communities, and environmental conditions. South Carolina contains five major (Level III) ecoregions: the Piedmont, Middle Atlantic Coastal Plan, the Southeastern Plain, the Blue Ridge and the Southern Coastal Plain. These areas are further divided into subclasses, as can been seen in the ecoregion map graphic.

Berkeley County is characterized primarily as Middle Atlantic Coastal Plain, with portions of the Southern Coastal Plain along the Cooper River. Forest cover in the region, once dominated by longleaf pine, is now mostly loblolly and some shortleaf pine, with patches of oak, gum and cypress near major streams, as compared to the mainly longleaf-slash pine forests of the warmer Southern Coastal Plain. Its low terraces, marshes, dunes, barrier islands and beaches are underlain by unconsolidated sediments. Poorly drained soils are common and the region has a mix of coarse and finer-textured soils.
A remarkable feature of the Middle Atlantic Coastal Plain is its Carolina Flatwoods region, which boasts more rare Carolina bays. The Flatwoods subregion also supports greater biological diversity and more rare species than similar areas in North Carolina or Virginia. Drainage of the area for past uses, such as rice production, or for on-going development, has removed some of the once-abundant Carolina bays.
The Southern Coastal Plain has changed a great deal from forest communities that included trees of longleaf pine, slash pine, pond pine, beech, sweet gum, southern

magnolia, white oak and laurel oak. It has migrated to mostly slash and loblolly pine and oak-gum-cypress forests. The floodplains, marshes and swamps of the Southern Coastal Plain contain bald cypress and water tupelo and oak-dominated bottomland hardwood forests which provide important wildlife habitat (Griffith, Glenn and Omernik, James, Ecoregions of South Carolina , July 31, 2002).
Fund ing for this project was provided by the US Forest Service’s Southern Region to the South Carolina Forestry Commission (SCFC). They hired the Green Infrastructure Center to create a model for ranking and mapping South Carolina’s highest-value landscapes and to pilot test the model at the county scale. In spring 2014, the South Carolina Forestry Commission invited coastal counties to apply to be a pilot county for the Green Infrastructure Planning Guide Counties were presented with an orientation webinar and invited to submit a request to be the test case. Of all the excellent applications, Berkeley County was selected as a representative county.
Berkeley County is characterized by relatively flat terrain, generally wet and made up mostly of sedimentary rock and unlithified (uncompressed) sediments. Of the 785,920 acres that make up the county, 84,160 – or roughly ten percent – are open water. About two-thirds of the county is under forested land cover (both natural and plantation), at 527,006 acres. One reason for such a high percentage of tree cover is the presence of the Francis Marion National Forest, which makes up a significant portion of that at 193,040 acres (the forest extends into Charleston County, so the total forest size is larger). While Hurricane Hugo leveled more than a third of the forest in 1989, much of it has re-grown over the past 25 years.

The Francis Marion Forest is especially known for its Carolina bays and limestone sinks. Over 90 percent of the original bays in South Carolina (once estimated to have numbered 2,600) have disappeared, leaving only 200 today. The USFS estimates that there are about 25 well defined bays in the Francis Marion Forest and which many pond breeding salamanders take advantage of, such as the Eastern tiger salamander (Ambystoma tigrinum), slimy salamander (Plethodon grobmani) and frosted flatwoods salamander (Ambystoma cingulatum). Forest management tools, such as prescribed burns, have been used to restore and expand habitat for the frosted salamander.

 Map 2 – Berkeley County Location
Frosted Salamander.
Map 2 – Berkeley County Location
Frosted Salamander.
Reptiles such as the venomous eastern cottonmouth (Agkistrodon piscivorus), southern copperhead, (Agkistrodon contortrix), eastern diamondback rattlesnake (Crotalus adamanteus), larger timber rattlesnake (Crotalus horridus), Carolina pygmy rattlesnake (Sistrurus miliarius miliarius) and eastern coral snake (Micrurus fulvius) are found in the forest, along with less feared reptiles, such as the eastern hognose snake (Heterondon platirhinos), southern hognose snake (Heterondon simus) and common eastern garter snake (Thamnophis sirtalis). The American Alligator is also abundant and most active in summer months, primarily in freshwater areas.

The forest is actively managed to support wildlife conservation. Large mammals present in the forest include the American black bear (Ursus americanas), as well as common species such as otters, beavers, bobcats, deer, raccoons and coyotes. Its significance for both resident and migratory birds has led to designation of the forest as an Important Bird Area by both the National Audubon Society and the American Bird Conservancy. Burns at intervals of 2-3 years aid in maintaining habitat conditions for avian species such as the red cockaded woodpecker (Picoides borealis) and Bachman’s sparrow (Aimophila aestivalis). Due to aggressive habitat management and installation of over 2,800 artificial cavities, the red cockaded woodpecker population has rebounded to approximately 439 active clusters, as of January 1, 2013. (https://fs.usda.gov/Internet/FSE_DOCUMENTS/stelprdb5446515.pdf )
A continuing challenge for wildlife management is the growth of the urban and suburban population. Despite being a rural county, the Census Bureau estimated Berkeley County’s 2013 population at more than 194,000 and its rate of growth from 2010-2013 was around nine percent compared with a state average of around three percent. The county’s proximity to Charleston also results in growth pressure for Berkeley as a more affordable bedroom community. With the addition of 75,846 new homes from April 2010 to July 2014, the county landed in the U.S. Census’ list of the top 100 fastest growing counties in the United States. Berkeley County is also experiencing growth from the influx and expansion of its own industries, such as the national Google Data Center, DuPont Valley Forge Flag, Parker Hannifin, Jomar Logistics and Pegasus Steel, as well as the Boeing Plant in nearby North Charleston.
As more people move into once rural areas, more wildlife conflicts, such as with deer or black bears, can occur. In addition, the greater the number of people, the greater the fire risk. (See the fire risk map on page 108.) More people also make it more difficult to initiate prescribed burns needed to manage flora and fauna of the forest.


People have made their mark on the landscape for hundreds of years. Over time, populations have come and gone. Land which was once a town or plantation has reverted to fields and forests. Several towns, such as Childsbury Town, founded by James Child in 1707 along the Cooper River, remain only as archaeological heritage preserves, while others, such as Historic Pineville, are much smaller than they once were, although they still contain historic structures such as the church. Large areas were flooded to make way for the lakes built for the Santee Cooper Power Company and whole towns were moved while historic and archaeological sites were lost to the lake.


The county also manages other habitats, such as the Blackwater Swamp, now called the Cypress Gardens Preserve. Formerly used to hold water for rice fields for the 1750 Dean Hall Rice Plantation, the site is now a restored/constructed wetland and provides an opportunity for people to interact with nature though trails and boat rentals. Bald cypress and water tupelo are the dominant trees, along with red maple, black willow, sweet bay, swamp dogwood, button bush, sweet gum, black gum and various upland hollies. The swamp supports several threatened species, such as the wood stork and the swallowtail kite, as well as more common species, such as the black bear and American alligator.
 Pineville Historic Marker.
Children playing on Lake Marion.
Historic Church, Pineville.
Pineville Historic Marker.
Children playing on Lake Marion.
Historic Church, Pineville.
Many of the original bald-cypress tupelo gum swamps of South Carolina were cleared by slaves to create rice fields, while the oldgrowth cypress trees were harvested for their valuable wood, that was both rot and insect resistant, to use for shingles, ships, fence posts, paneling and coffins, to name just a few of the products. While most of those old-growth trees are long gone, it is still possible to see them at the 11,000 acre Francis Biedler Forest in Four Holes Swamp, which straddles Berkeley, Dorchester and Orangeburg counties. About 3,050 acres of the forest is protected in Berkeley County. One bald cypress there is at least 1,500 years old, and according to Cypress Gardens, the forest contains the largest stand of old-growth bald cypress and tupelo gum swamps remaining in the world.
Established through a land conveyance and designated a court in 1682, the county holds a rich cultural history. Named for brothers Lord John and Sir William Berkeley, it evolved to its ‘modern’ form in 1882, though several boundary changes occurred in the years following. As a result, natural and cultural landscapes are woven together across the county.
The original settlers were Native Americans made up of the Muskogean and Sioan peoples. They included the Etiwans (also called Itiwans and Eutaws) in upper and central Berkeley County and the Wantos north of Charles Town. The Cherokees may have ventured as far as the Santee River near Eutawville. The Wassamassaw Swamp was supposedly named for a tribe of that name.
This cultural landscape continues to affect our interpretation of the natural landscape today. For example, one swamp has two names; Wassamassaw Swamp to the north of U.S. 176 and to the south it is called the Cypress Swamp. Old river and swamp names make understanding the county’s hydrology complex, since a swamp may be renamed farther ‘downstream’ even though it is essentially the same system. Cyprus Gardens.


Built before the American Revolution secured our freedom from Britain, the Anglican Biggin Church is another reminder of the lost communities of Berkeley County. Established in 1706, and erected in 1712, it was burned in a forest fire in 1755, restored but then burned by the British in 1781, restored and then destroyed by forest fire again in 1886. Locals, in search of readymade bricks, dismantled parts of the structure in successive years, leaving only the ruins we see today.
Many Revolutionary and Civil War sites are found in the county, along with older archaeological sites. The landscape itself not only provides the historic setting for these sites, but is also part of the history as well. Berkeley County residents are particularly proud of at least one famous ancestor, Francis Marion, after whom the national forest is named. Known as ‘The Swamp Fox,’ he refused to give in following two terrible Revolutionary War defeats at Charleston and Camden in the summer of 1780. Taking refuge in the swamps, he waged guerrilla warfare, using his brigade of ‘volunteer soldiers’ to attack British troops and cause general mayhem. He helped ensure the war’s end and an American victory. A map of the area’s military activities is available here: http://www.carolana.com/SC/ Revolution/sc_revolution_engagements_berkeley_county.html


Many other churches, and famous plantations such as Medway and Middleburg still stand, while others, such as Brabrant were lost to fire or abandonment. Many historic homes and archaeological sites were lost when the lakes were created by Santee Cooper to provide power, such as the Eutaw Plantation (1808), Pond Bluff (1820) or Belvidere (1786) For more see the Waterman Report of 1939 at: http://www.rootsweb.ancestry.com/~scbchs/Waterman.html

The process of identifying and prioritizing intact core habitat uses GIS. For a description of cores and their role in a green infrastructure network, please see Chapter One. Once core habitats have been identified, they can be used as a base map on which to overlay other important natural assets related to water quality, recreation, working lands, and more. This section of Chapter Five provides examples of these maps created for Berkeley County. Chapter Seven contains a step-by-step methodology for creating a county-scale base map of core habitats.
Habitat cores provide an optimal area for a healthy diversity of species. The base map is used in concert with other
Biggin Church Ruins.data layers to analyze different natural resource priorities, ranging from water quality and biodiversity to recreation, culture and working landscapes. This process of overlaying themed data on top of the habitat cores data is important for identifying overlapping assets, assessing risks and opportunities and developing priorities for natural resource management.
The goals of this process were derived from the county’s existing comprehensive plan, the motto of which is “Planning the future while preserving the past.” This recognizes that history, heritage and culture are very important aspects of the county’s identity.
One of the county’s five key visionary principles is to: “Respect and enhance historical and natural resources and expand their public accessibility.” The goals and policies to achieve this principle are found in the text box at the right.
One particularly relevant strategy identified by the County to carry out its goals is to “Designate areas of sensitive natural and/or scenic and/or historic resources for conservation or resource protection.” However, until this mapping project, the County did not have a method to identify and prioritize those areas.
As part of the mapping process, county stakeholders were invited to offer their input. Conference calls, orientation meetings, webinars and on-line and in person trainings provided opportunities for county staff to ask questions, provide insights and learn new methodologies. The County Planning Director Eric Greenway served as the project liaison, assisted by County Planner Holly Backus.
Additional review was also provided by the County Planning Commission, along with consultations with several groups that comprised key stakeholder interests and major landholders, including the Low Country Open Land Trust, the Lord Berkeley Conservation Trust, the Clemson Cooperative Extension Service, the Berkeley Charleston Dorchester Council of Governments, Francis Marion National Forest, The Nature Conservancy, Santee Cooper (power company), Meade Westvaco, and others. Additional input was received from community members and appointed and elected officials who attended the public open house held in October 2014.
G3.1 Berkeley County will support local agricultural and forestry practices through the preservation of its rural areas.
1. The County will support the protection of agriculture and farmlands, including timberlands, from development pressures, recognizing the contributions of farming and the rural character of the community.
2. The County will support policies and programs that provide opportunities for agricultural activities to remain an integral part of the community.
3. The County will promote agri-tourism opportunities.
4. The County will support the aquaculture industry through preservation of water quality.
G3.2 Berkeley County will develop and market heritage and eco-tourism opportunities based on its cultural and natural resources.
1. Protection and conservation of the County’s cultural and natural resources will play a vital role in the decision-making process.
2. The County will promote and support the protection and enhancement of the County’s unique historic resources.
G3.3 Berkeley County will adopt and apply land use principles and development practices which ensure development works in harmony with cultural and natural resources.
1. The County will encourage new development to locate in suitable locations in order to protect and preserve natural resources, environmentally-sensitive areas, or valuable historic or cultural resources from encroachment.
2. The County will adopt and implement policies and standards that minimize impacts of site development, including land disturbance, infrastructure and structures, on the quality of wetlands and other nonrenewable natural resources.
The data gathering and mapping process described next provided a way for the county to find key resources and prioritize them.
The GIC began its data mapping process by preparing a data checklist to determine which datasets Berkeley County’s GIS Department had available. The data checklist contained data layers needed to build the habitat cores model, to create thematic natural assets maps and to assess risk. Once this process with the county was completed, any gaps in data were filled from state and national data, as appropriate.
The primary use of the data is to identify and rank the highest value habitat cores. The GIC has built its habitat cores model in such a way that it can be used anywhere in South Carolina. The use of state-level data ensures that anyone can obtain it to construct their maps. Nonetheless, local data need to be added to create useful maps that reflect local priorities. In addition, if local land cover data are available that are more recent or accurate, that data may be a better choice to use in lieu of statewide data. For example, while 30-meter resolution land cover data are available statewide, some counties have created high-resolution (e.g. 1 meter resolution) land cover datasets. In this case, the high-resolution data should probably be substituted for the lower-resolution data to produce a more accurate result.

Additional datasets are needed to complete the mapping process, beyond the base map. The simple rules to follow when deciding what can be mapped are:
1. The data must exist (or be readily obtainable).
2. The data must be represented spatially (or be able to be represented spatially, as in a spreadsheet of coordinates for wellheads).
3. The data must be consistently available over the entire study area.
Land Cover
Land cover data show the geography of different cover types in the area of interest, such as forest, cultivated land, open water or fields. Some datasets use more refined land cover classes than others. For example, instead of simply showing ‘forest,’ a land cover dataset may also distinguish between deciduous and evergreen forests.
The most important question to keep in mind when building the habitat model is: Can I distinguish between natural and human-modified areas? For example, you may know that the ‘Forest’ type represents natural forests, whereas the ‘Urban’ type represents urbanized land. This is a basic example, but what if your land cover data identifies ‘Barren’ land cover? Does this type represent areas that have been cleared in preparation for development, natural sandy areas that encompass coastal ecosystems, or both?
The goal is to be able to differentiate between what is natural land cover and what is non-natural or modified cover and then to determine the intactness of the landscape. Remember that a habitat core (ideally) should constitute a minimum of 100 acres of interior natural habitat (not including the edge area).
It is important to fully understand the type of data you need or have access to. In the case of Berkeley County, federal data (available statewide) was used as the land cover layer for the habitat model, as there was no higher-resolution alternative. However, through discussions with the US Forest Service, it was determined that the land cover type identified as ‘Shrubland’ in the federal data represented natural shrublands and pocosin ecosystems within the Francis Marion National Forest. Outside the forest, it mostly represented vacant, cleared, or fallow land (land that had been heavily disturbed). Knowing this, it was possible to edit the land cover layer to more accurately represent actual conditions. Don’t be afraid to correct your land cover layer using either local knowledge or the creative use of other datasets that you know to be accurate.
The ability to distinguish between natural and human-modified landscapes is one of the main things that differentiates land cover data from zoning data. Land zoned ‘Residential’ may have actually been used for residential dwellings or it may have remained as undeveloped forest land. Likewise, it is important to recognize the unit of measurement in your land cover data. For example, Berkeley County had a Land Use GIS dataset that was created as part of its most recent comprehensive plan. However, this could not be used for two main reasons:

1. Land Use is not the same things as Land Cover. For example, an area with a land use of ‘Vacant’ might either be a naturally forested area, or a cleared parcel with abandoned buildings on it.
2. The best way to present land cover is in grid cells of the same size, for instance 30 meters by 30 meters. This is referred to as raster data. However, Berkeley County used parcels as the unit of measurement for land cover. This made the data unsuitable for mapping natural ‘actual’ landscape features. For example, a parcel may be identified as ‘Industrial,’ but still have a significant forested area around the structures, or might not be fully built out. However, Berkeley County’s data would show that entire parcel as industrial land cover.
Location information for development and infrastructure helps identify how the landscape has been fragmented into smaller tracts. Fragmenting features such as roads and highways, rail lines, buildings, pipelines, and electrical transmission lines are often available in GIS format. Land cover can often be used to identify impervious surfaces and other developed areas, but depending on the resolution of that data, bringing in additional information can provide a more detailed picture of development.
When considering road data, it is important to know additional information about each road. Using such additional information, such as surface type or number of lanes, you can better assess the road’s actual impact on the landscape. In Berkeley County, there are a number of rural logging roads that experience very low levels of traffic and thus do not significantly impede wildlife movement. Therefore, they were not considered to be fragmenting features.
The location of buildings is another important piece of information that is not collected at the state level, but is sometimes available at a county or city level. Data on new buildings can show where landscapes have been impacted since the most recent land cover data were created. Either address points or building footprints (the actual shape of the building) can be used. If buildings are likely to be very large, such as industrial or warehouse structures, then the building shape is more important, since a 6000 square foot warehouse is a far larger fragmenting feature than a small house. The figures at the left illustrate the process by which address points can be used to reassess a habitat core.


Intact natural landscapes help protect water resources. Depending upon internal land cover, cores can filter pollutants, allow for groundwater recharge, cool streams, and provide habitat and food for a variety of species (Weber, 2003). Surface waters within cores add value by providing habitat for aquatic and semi-aquatic species, as well as water sources for terrestrial creatures. Both the extent (stream miles, wetland acreage) and the condition (water quality) are important to collect.
This core has had development since the first model run. A 100-meter buffer was added around each building to account for the area of impact (driveways, lawns, edge).In South Carolina, several types of biodiversity and rare species data are available. As part of the South Carolina GAP Analysis Program, species richness was mapped statewide. From a list of 455 species identified by experts as relevant to biodiversity, a predictive model was created to show which areas have the potential to support each species. The number of potential species that an area may support is used to create its species richness score. Note that this is modeled data, as opposed to field-assessed data and may not be fully accurate. If there are also field studies available, they can be used to confirm the model’s predictions.
The South Carolina Department of Natural Resources’ Heritage Trust Program tracks observations of rare, threatened, and endangered species, based on the well-established classification system from NatureServe. Note that these data are based on field observations. The exact locations of observations are not disclosed, in order to prevent the disturbance of sensitive species and ecosystems.

Both the modeled species richness and the observations of rare, threatened, and endangered species were incorporated in the Berkeley County study. Each dataset has its own strengths; for example, while the observed data tends to be geographically biased to areas that are more easily accessible or that have been studied more, the species richness model has no such bias. These datasets both help to approximate the biodiversity in each habitat core.

The very first map to create is the Base Map. This is the map of the intact landscape habitat. Land cover data are used to create a natural land cover data layer. Recall that we are looking for intact landscapes or ‘habitat cores.’ To determine habitat intactness, you will need to overlay and analyze fragmenting features, such as buildings, roads, rail lines and power lines, in order to assess the fragmentation of the natural landscape.
Once you subtract areas that are fragmented, you need to look at what is left and ask “Is the remainder area large enough to constitute a core?” This is done by applying a 100 meter buffer around each fragmenting feature to account for its impact zone. Natural land that is within this buffer is considered to be ‘edge habitat,’ or the transitional zone between a fragmenting feature and interior habitat. After distinguishing between edge habitat and interior habitat, unique habitat cores can be identified.
1) Natural land cover – fragmenting features – edge buffer area = unfragmented natural land cover.
2) Is the remaining unfragmented land cover ≥ 100 acres? If yes, it is a core. If no, a habitat fragment or other feature.
Identifying intact habitat cores should be one of the first mapping tasks, as it will provide the foundation for the rest of the mapping and planning process. The full process used in Berkeley County (and applicable statewide) is described in detail in Chapter 7, but the methodology can be broken down into two overarching tasks:
1. Identify the location and shape of all habitat cores.
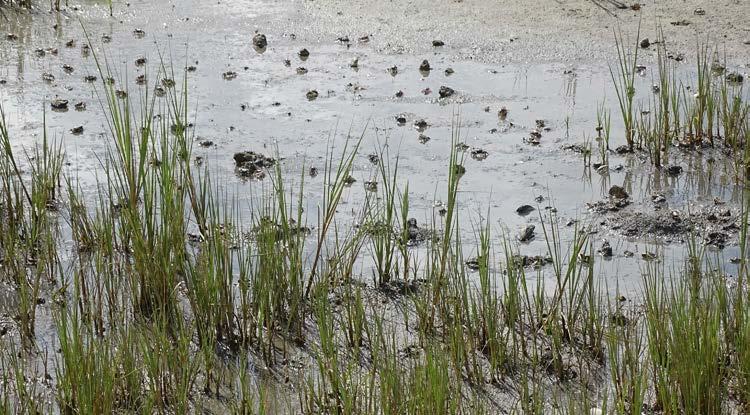
2. Rank the cores based on their ecological integrity using the best available data and science.
Identifying the cores requires using land cover data to find potential habitat and overlaying development layers to assess how that habitat has been fragmented. Distinct patches of intact habitat can then be identified as cores.
Since it is most often infeasible to conduct a complete survey of the cores, especially in a large study area, it is necessary to approximate their ecological significance by using the data that are available. Metrics that are difficult or time-consuming to measure, such as biodiversity, can be approximated by using a series of other quantitative metrics. For instance, several metrics that can approximate biodiversity are soil diversity and topographic diversity, since more varied soils and topography provide more opportunities for a diversity of flora and fauna.
The habitat cores model used in Berkeley County ranked cores on a scale of one to five, according to ten different metrics. A score of one indicates that the core’s score is lower than the 20th percentile when compared to the other cores being assessed. A score of five indicates that the core’s score is higher than the 80th percentile. In other words, the cores are ranked against one another. They are divided into quintiles for each of the ten metrics and each core is given a score based on which quintile it is part of. As an example, a core has an area of 250 acres. It is compared against the acreage of all other cores in the study area. If its acreage falls below the 40th percentile, but above the 20th percentile, it is given a score of two. Above 40% but below 60%, a score of three. The same process is used to assign a score for the other nine metrics.
To obtain a composite score, all ten metrics need to be multiplied by weights relating to their relative importance and then summed. The result will be a composite score from one to five.
The GIC created the composite scores of all habitat cores in the county, and this map then provided the foundation for the final green infrastructure network.
The Base Map shows the intact habitat cores identified in Berkeley County, symbolized by their overall Core Quality Index (CQI) score (which uses geometric, species and hydrologic data to rank the cores). It is best to create this map before the theme maps, as it is useful to overlay themed information (e.g. recreation or scenic drives) onto core information. The Base Map of Berkeley County is dominated by the large cores in the Francis Marion National Forest, but large intact landscapes also exist along the Cooper and Santee Rivers, as well as in the Francis
Beidler Forest on the western border. Note where cores may be at risk, such as the eastern area and the area ringing Lake Moultrie.
Once the base map of habitat cores has been created, a series of themed overlay maps can be created by combining various datasets. The themed maps are used to explore the relationships between habitat cores and other important natural and cultural assets. Each community determines what themes are important to

them. In Berkeley County, forestry is a significant part of the economy, so a forestry assets map was made to show current forestry operations as well as potential for future forestry. Additionally, Berkeley County’s history and culture are very important to local residents so a historic and cultural map layer was added to create another themed map. This map can be used to show how the natural landscape also supports protection of these key cultural features.
Remember to have fun with the asset mapping process – you can combine disparate GIS layers to reveal new patterns or issues that no one has thought to look for before!
While making your thematic maps, as with any map, consider these three questions before beginning:
1. What is the purpose of the map?
Addressing this question will help you include relevant information and, perhaps more importantly, exclude information that does not contribute to the purpose of the map. It is easy to make maps cluttered and confusing, so remember Antoine de Saint-Exupéry’s famous quote, “Perfection is achieved, not when there is nothing more to add, but when there is nothing left to take away.”
2. Who is the audience?

Will the people viewing your map be technical experts or members of the public? Maps are about communicating ideas and, as with any type of communication, are most effective when you know your audience.
3. What will be the final format?
A good map designer will design their map according to a desired format. For example, a large map printed on a three-by-four-foot poster can include more detail than a map that in a PowerPoint presentation. If a map is to be projected, colors will need to be a bit bolder for them to be distinguishable, whereas colors on a printed map can be more subtle. Knowing if the map will need to be printed in both color and blackand-white versions, and designing accordingly, is another common example.
A themed map highlights a parcticular land use or resource as it relates to the green infrastructure base mapo of intact habitats and locational information, such as towns and highways. As noted in earlier chapters, not everything can go on one map because it becomes unreadable and unuseable. Selecting themes to focus on allows a map to highlight a key topic of interest. For example, a themed map about agricultural soils can show where there are lands containing high quality agricultural soils, not currently covered by forests, that may be suitable for farming.
Themed maps can also show relationships. For example, you can place a recreational acticvity layer that highlights key areas for birding, hunting or hiking over a map of highquality habitats to see how large intact landscapes also support acticities that depend upon a connected landscape.
One of the major benefits provided by natural landscapes is their capacity to improve and preserve water quality. By overlaying information related to water resources onto habitat cores, we can see the landscapes that have the greatest influence on water quality and quantity.
• Habitat cores can filter pollutants, increase water storage capacity, reduce erosion, and provide shade that cools water and maintains oxygen levels in surface water.
• The Water Resources Map can also show resources that are at risk or have been degraded.
• It is often useful to create a separate map showing impairments.

Agricultural resources can be mapped to show the connection between agriculture, habitat, and water quality. They also show areas where soils are important for agriculture, since agricultural soils are an important green infrastructure asset.

• The agriculture industry is a significant economic driver that provides jobs, food and other products.
• It relies on the surrounding landscape to maintain productivity.
• Habitat cores support pollinators and species that prey on invasive pests that harm crops.
• Farms can also support agri-tourism by maintaining their scenic qualities.
• Farmers markets and Pick-Your-Own style farms are also important resources that nurture a community’s relationship with the local landscape.
In Berkeley County, as in much of South Carolina, forestry is a significant economic driver and has a large presence on the landscape. This map shows which lands are actively managed for forestry, as well as lands that could potentially have significant forestry opportunities. Parcel size, forest cover, and wetlands were factors utilized to approximate viability for forestry. Parcels less than 20 acres were excluded. Next, the amount of forest cover in each parcel was identified.

• If a parcel had between 20 and 50 acres of forest, it was categorized as having potential for forestry.
• If it had more than 50 acres, it was categorized as having high potential.
• If the parcel had at least 50 acres of forest land, as well as at least 100 acres of core habitat, it was categorized as having both forestry and wildlife management potential.
• If more than 20 percent of the parcel was wetlands, the acreage requirements for forest cover were doubled, since sensitive wetland areas would need to be avoided.
Nature-based recreational assets rely on the surrounding landscape to remain viable. For example, Berkeley County has a network of ‘Blueways’ that are paddling trails along streams and bodies of water, and are attractive to both residents and tourists because the habitat along the water bodies remains intact.

• Blueways provide scenic views, opportunities for wildlife viewing and clean water in which to paddle.
• Other sports, such as hunting, rely on intact landscapes to allow both wildlife and sportsmen to move across the landscape.
Berkeley County’s history is intimately related to its natural and scenic landscapes. It has both beautiful and historic cypress swamps and Francis Marion, ’The Swamp Fox’ used them to confound the British Army during the Revolutionary War.
• Context matters with historic resources, which is why a plantation home can lose some of its historic value if it is encircled by development, even if the house itself remains untouched.
• Berkeley County has a number of designated scenic roads that rely on the natural and rural character of the adjacent landscape.
• It is beneficial to be able to see historic resources and natural assets on the same map.

Once all natural and cultural assets have been mapped, risks to those assets should be assessed. As discussed in Chapter Four, there are a variety of factors that determine the risk to a habitat core and the likelihood that it will remain intact or not. One of the most common risks is development pressure. A core with a high level of such pressure can be viewed in one of three ways:
1. The values the core provides warrant action to preserve it. For example, it protects the community’s source of water.
2. The loss of the core is acceptable, as conservation efforts and resources can be directed towards higher-value cores.
3. The loss of the core is not acceptable, but it is unavoidable. For example, it lies in the path of a federal road project or natural gas pipeline that is already permitted and underway.
This is an example of assessing risk to determine conservation priorities. Of course there might be options that present a combination of factors, such as conserving part of the core or redesigning a development with environmentally sensitive features, or moving the path of the pipeline to minimize the area of disturbance. However, not all assets can be saved from risks, so prioritizing your highest-value resources as early as possible is a critical step when planning for green infrastructure conservation.
The simplest way to assess risk is to ask which lands may or may not be developed. The map of Protected Lands shows which lands are protected from development by their various designations, such as land under conservation easement or lands within US Forest Service ownership. The Francis Marion National Forest is a very large, mostly protected landscape of 259,000 acres.
A two-part, GIS-based risk assessment was performed in Berkeley County. First, individual risk factors were mapped.
This included risks from development pressure, as well as special risk factors such as wildfire risk (see the Wildfire Ignition Density Map). While fires can be caused by natural sources, such as lightning strikes, most forest fires are caused by people.
Fire is often an important factor in maintaining healthy forest ecosystem overtime, yet forest fires are often suppressed when they threaten homes and property. However, a forest which has had too much fire suppression can be at risk of more extreme fires as excessive dry material accumulates on the forest floor.
This forest risk map, shown on page 108, can be used, not only to show risks to forests, but also where development is less appropriate, when considering public safety concerns.

‘Protection’ can mean different things, and there are various degrees of protection. Generally, anything that greatly reduces the chance of habitat loss could be a candidate for this map. Conservation easements, for example, are widely used in Berkeley County as a form of protection from habitat loss, and there has been much success in the past several decades to focus easement acquisition efforts along the Cooper River. Geographically targeted acquisitions
such as this are beneficial in creating continued large, unbroken tracts of protected land. In total, there are about 60,000 acres of conserved land in the county. However this map also shows what is not protected. For example, the Santee River, which borders the northern edge of the county, contains vast intact landscapes, but much of it is not protected. This points to potential focal areas for land trusts and others working in the land conservation field.

Anyone living within a forested landscape is at potential risk from forest fires. Some areas are more prone to burning due to the type of forest, how wet or dry the landscape is, the types of adjacent uses and other factors. The Southern Group of State Foresters has created a Wildfire Ignition Density data layer for 13 states, including South Carolina. The darker colored areas in the map above are more prone to fire risk. Humans are often the cause of wildfires; campfires not doused properly, lit cigarettes thrown from car windows or backyard burns that escape

are some examples of human causes. Knowing about areas at risk of fire helps inform where new development may not be a wise choice. It can also inform planning where to site new fire stations.
Sometimes, forests are burned intentionally by resource professionals to help the system return to a more natural state or to renew an area that has been overrun by invasive species. Since many fires have been suppressed over the years, some areas are now at greater risk of hotter and
more destructive fires. This is because more debris has built up on the forest floor that provides an unusually great amount of fuel. When fires burn hotter they are more likely to destroy a tree, as opposed to just singeing its lower trunk. Overly hot fires also destroy the soil biota and make it more difficult for a forest to regenerate. Those who already live in a fire-prone area, whether a single house or a subdivision, can take steps to keep their homes safer by adopting fire-wise landscape principles. To learn more visit: http://www.firewise.org
The waters listed as impaired have failed their standards for dissolved oxygen (DO). Many coastal waters in South Carolina have DO levels below the established DO criteria. Wastewater dischargers and other anthropogenic influences may contribute to low DO in coastal waters. Natural factors, such as organic loading and reduced oxygen levels from wetlands and marshes and estuarine dynamics in the mixing zone where freshwater and saltwater come together can also create naturally low DO conditions. The Upper Ashley is highly influenced by local rainfall and during dry weather there is less inflow from the cypress and other swamps so flushing is reduced. Since, in this case, the sources of low oxygen tend to be ‘natural’, in the river’s sections within Berkeley County there are no particular actions for the county to take for this particular TMDL. However, as the county continues to grow, increases in impervious surfaces or removal of vegetation along waterways may contribute to more local water quality problems. For more about the impaired waters see: http://www.scdhec.gov/HomeAndEnvironment/Docs/Chas_ Hbr_DO_TMDL.pdf


The above map shows waterways designated as not meeting their water quality standards for Berkeley County. Waterways, lakes and bays may be designated as impaired if they fail water sampling standards and are placed on the 303d list, as required under the federal Clean Water Act. Each of the waters above has a requirement to be improved. This means that the source of the impairment must be determined and a cleanup plan developed.

When looking toward the future, the county can consider
if currently pristine areas are zoned for more growth or if waters will be harmed by a cause that can be addressed through habitat or land-use mitigation. For example, if a stream suffers from excessive sediment or habitat destruction, your strategy could address needs for reforestation or enhanced stream buffers. If a cleanup plan has not yet been created, determine whether setting aside land for conservation could restore the water quality. Protecting key habitat cores for wildlife could also benefit a stream’s health, depending on its location in the watershed.
To assess risks to cores, each one was mapped in a binary fashion – that is, the maps visualized whether or not each core met the specific risk factor. For example, the Proximity to Major Roads Map shows cores that are within 500 feet of a major road (interstate, US or state highway) in red. Proximity to roads is one factor that contributes to the development pressure an area can face, as areas that are more accessible are typically

more attractive to develop than areas that are difficult to reach.
A second step in the risk assessment process was creating a composite risk map to see where multiple risk factors for development overlapped, and which cores were most at risk. The Risk Overlay Factors graphic shows some of the risk factors that were assessed.
Below are several potential factors that influence development pressure:
• Serviced by infrastructure:
– roads (interstates, major, minor, etc.)
– water and sewer
– airports
– areas close to major intersections or interstate/ highway ramps
– future infrastructure improvements
• Policy incentives
– zoning is favorable to development
– area is inside a designated growth area
• Proximity to services
– schools
– healthcare
– recreation (trails, parks, etc.)
– fire and police protection
• Prevalence of many small, undeveloped parcels
• Soils capable of supporting development
Factors that can reduce development pressure:
• Proximity to hazards or noxious uses such as areas subject to frequent floods or noise
• Legal protection status (conservation easements, special zoning overlay districts)
• Public ownership
• Difficult building conditions (wetlands, etc.)
All of these factors have a geographic component and can therefore be mapped.
These maps were then added together using GIS, in effect adding up points of risk. The result is a composite picture where areas with more overlapping risk factors can be clearly seen.
Once the risk maps have been added together, the second step is to account for factors that decrease development pressure. In Berkeley County, wetlands and land under formal protection were deemed to be at a lower risk of
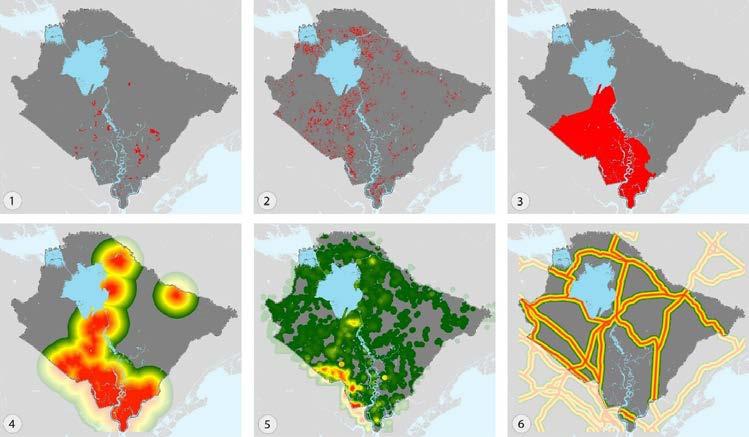
Red indicates that the risk factor is present in that location. Yellow and green indicate that the risk factor is present, but at a lesser intensity (due to proximity, for example). Gray indicates that the area is not considered to be at risk.
Map 1 shows portions of core habitat that are zoned for moderate to high-intensity residential development.
Map 2 shows cores that are inside small (< 10 acre) parcels, which are not currently developed.
Map 3 shows the area designated to receive the most development in the future.
Map 4 shows proximity to incorporated places, with the assumption that growth will occur closer to existing population centers.
Map 5 shows the intensity of development, represented as the square footage of built land per acre with warmer colors (reds, oranges, yellows) showing the greatest development pressure. This assumes growth will occur faster near areas that are more intensely developed.
Map 6 shows proximity to major roads, with the assumption that growth is more likely in areas with better access.
development, and the final map was adjusted accordingly (i.e. risk points were subtracted). Factors that decrease risk can influence the final map either by decreasing the risk, or in some cases completely eliminating risk.
The risk map informs the next stage of planning, which is identifying opportunities: What should be done? The decision about how much to decrease the risk is made on a case-by-case basis depending on whether decreasing the risk is likely or necessary. As explained earlier, not all land can be conserved. A community could decide to remove a hab-
itat core because it needs the land for other important uses, such as a new school or road connection. The likelihood that a core will be lost may affect decisions about which other cores to conserve. The GIC recommends protecting the highest ranked cores whenever possible, but other factors may play into the decision about what to conserve. For example, a lower-ranked core could be conserved in an area of the county where open space is lacking.

In addition to risks to the natural environment posed by people, there are also ‘natural’ risks to be aware of. As mentioned in the introduction, the FMNF suffered significant damage from Hurricane Hugo several decades ago. Other research indicates that the FMNF has been affected by at least 18 hurricanes, averaging one every 16 years. It is unclear from the predictive models whether these intervals may increase.
While not much can be done to stop a hurricane, knowing that it is possible is important when planning for a resilient community. Having funds in place for tree planting and replacement, as well as planning for how to handle storm debris, such as large scale mulching, are examples of how you can plan for natural risks. In coastal areas, it is key to map areas at risk from sea level rise, elevate buildings and to acquire uplands to compensate for the loss of coastal resources that may later be under water.
In its 2010 Comprehensive Plan Update the County identified the conservation of natural areas, including agricultural lands and open spaces, as a key implementation priority. Substrategies were developed, such as the establishment of agricultural preservation districts supported by tax incentives to discourage agricultural land conversion; the limitation of development practices; low-impact strategies for areas identified as rural or sensitive resources areas; the use of density bonuses, TDR programs; and the promotion of low-impact development/conservation subdivisions as a means for encouraging the use of such programs. Another implementation strategy was to adopt standards for preservation of significant trees/tree stands in the County’s Zoning and Land Development regulations. The county also identified the need for a countywide recreation plan that includes open space conservation and a trail system between parks and cultural sites.


The maps provided in this chapter provide the locations for the county to consider for greater protection or restoration. They also highlight where these areas are most at risk and can be used in setting new priorities for the next comprehensive plan update.
While the habitat cores model provides the foundation for the Green Infrastructure Network, the final version is developed by incorporating all of the information discussed previously – habitat cores (often the highest
ranked), risks, opportunities and local priorities – what can or should be done. Also remember that the key is to build a true network – ensuring that there is good dispersal of habitat throughout the study area (county, region, watershed or city) and that the habitat is well connected (whether through habitat corridors, stepping stones of habitat fragments or both).
The process used in Berkeley County for developing the final green infrastructure network map (shown above)

identified those priority areas that contribute to a landscape scale network for the County. Note that the map is a selection of habitat cores and other landscape elements. It does not attempt to show every identified core, just those selected as a priority.
Make sure that anything added to the map helps to communicate your community’s priorities. For example, if a lower-ranked core is added back in, does it help make a connection between two higher ranked cores?

To build the final network for Berkeley County, the habitat cores model was used as the starting point. (Map 1 shows the highest-ranked habitat cores with scores of four or greater on the scale of one through five). These represent areas that typically have the largest amount of interior forest and wetlands, most rare species, and other indicators of biodiversity. However, stopping at this point would exclude many cores that can contribute to a more connected and complete network.
Map 2 adds cores that were in close proximity to the highest ranked cores (from the previous step), using 30 meters as the threshold. Thus, even if a core wasn’t ranked as highly, it was added to the map if it supported a higher ranked core by being very close to it. These cores can provide an additional buffer against disturbance for the highest ranked cores, and often provide linkages between highly ranked cores. This can increase the effective size of the highest ranked cores (one of the most important variables for preserving ecosystem functioning), which is why these cores are prioritized, ceteris paribus, above more isolated cores.
Map 3 adds land important for preserving water quality. These are cores within 100 meters of a lake or that had a stream running through them. These lands provide the valuable functions of filtering stormwater runoff and reducing nutrient loads entering surface water.
Map 4 adds those cores that are fully or partially protected by conservation easements. However, even if the entire core was only partially conserved, we show the entire core to highlight opportunities for increasing conserved lands where they can make the most impact in meeting green infrastructure values (clustered together instead of scattered).
Map 5 adds existing vegetated stream buffers. If land was within 150 meters of a named stream, and was forested, it was added. Map 6 uses professional judgment, local knowledge and visual review to select cores that met the specific goals of the project, such as increasing connectivity or providing geographic representation, even if the areas selected do not fall under any of the prior selection criteria. In other words, based on the staff and planning commission review, it was felt that these core should be added.
Potential locations for wildlife corridors were modeled in GIS and overlaid onto these maps. They were then considered for inclusion into the network. The results of

the computer model found potential corridors, but they needed to be vetted to assess practicality, such as whether their location was protected by easement or in conflict with zoning.
If a piece of land was under a reasonably strong level of protection (conservation easement, owned by the US Forest Service, etc.) but was not inside a habitat core, it was shown on the map as ‘Additional Conserved Land’ and was in a different color from the rest of the network. This differs somewhat from other methodologies, which include land in a green infrastructure network solely because it is already conserved, before assessing its quality and the benefits it provides.
After the map had been built up by this process, it was necessary to remove several areas from the network due to impending development plans. This was done after discussions with local developers and by confirming that the development plans would, in fact, diminish those areas’ values as cores enough to warrant removing them from the map.
However, just because a piece of land is planned for development does not mean that it should automatically be removed from the network. There were several instances in which a core was at risk from development but was left on the map because it still possible to have development while preserving much of the core’s value. Since the primary purpose of the map is to show opportunities for conservation and connectivity, it would have been inappropriate to remove the core.
Berkeley County is now in the implementation stage. The mapping process was completed at the end of November 2014 (a few months before this publication). A final working session with the Planning Commission was held to discuss opportunities to use the data to inform planning. In addition, the Berkeley County GIS technicians and planners were trained in how to use and update the network model.
Once the asset mapping and green infrastructure network is completed, it can be used to inform not only strategic policy decisions, but also common planning activities in both long-range planning and day-to-day operations. For instance, the maps and analyses produced
can inform elements of a comprehensive plan update; and since the assets maps include themes, such as agriculture and recreation, their usefulness isn’t limited to the natural resources/conservation section. Your maps can be used as additional ‘layers’ to view when reviewing site plans or subdivision applications.
Land use change is the result of many small decisions that end up having large impacts, and your asset maps will help keep the ‘big picture’ in sight. For example, they can show opportunities for a master plan to link into the larger green infrastructure network by maintaining connectivity, and likely increasing property values and recreation opportunities while doing so!
 Map showing a statewide view of habitat cores, by their size. The location of Berkeley County is highlighted. It is important to look outside the boundaries of a study area to see potential connections and other contextual issues. [Note that showing this map within a printed book makes some of the smaller cores difficult to see, but on a computer one can zoom in to find them.]
The following is a list of ideas for how the county can use the data:
• To update the comprehensive plan by identifying key county assets, determining priorities, establishing goals for the future, establishing the basis for future zoning decisions, etc.

• To create master plans.
• To create transportation plans that include areas to avoid or where more care is needed in planning.
• To work with developers and builders to identify opportunities for keeping the landscape connected, both within their sites and to adjacent landscapes.
• To identify opportunities for new parks. While the county does not currently manage any parks beyond those operated by the power company Santee Cooper and the state, they may determine that public parks are needed in the future as the county grows and develops, especially as it continues to become a bedroom community for Charleston. The need for parks was identified in the last comprehensive plan.
• To provide strategies for local land trusts. The GIC met with land trusts to discuss future areas needing focus especially along the Santee River.
• To locate areas for future study and for daily planning decisions.
The following images illustrate several examples of how your green infrastructure maps can help you make smart land-use decisions. Note that these are just a small number of examples, and more complete lists of how to use your results can be found elsewhere in this guide. These examples are purely for illustrative purposes and relate to themes covered in this book. They do not represent actual recommendations made by either the Green Infrastructure Center or Berkeley County.
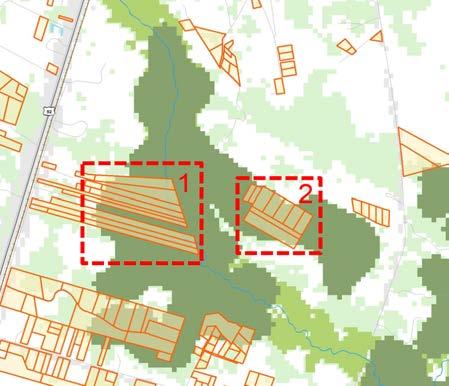
The top image shows a habitat core, while the bottom image shows the same core with small (<10 acres) undeveloped parcels overlaid. This is an example of a core that is likely to be at high risk. If these parcels were to be developed using traditional patterns, there would be little left of the core.

• To create new ordinances to zone land appropriately.
• To protect key species at risk and promote abundant wildlife.
• To attract new heritage tourism and identify and protect viewsheds.
• To determine areas where land management planning may be needed to protect critical resources.
• To inform transportation planning to avoid sensitive areas.
• To select future trails and utilize corridors for wildlife.
• To identify hazardous areas and avoid developing in those locations
This case study described how the green infrastructure network and how it was created by selecting the highest value habitats; showed how to use the network was updated to reflect new development; and described how other green infrastructure resources, such as working lands or agriculture could be included.
In Chapter Six, we provide options for making the case to decision-makers and building community support for this work. Chapter Seven provides details for how to obtain data to build your own green infrastructure map in South Carolina by using the model and adding your local data and priorities.
• Building Consensus
• Outreach
• Key Messages
This chapter provides a number of options for gaining community support for a green infrastructure plan. As described earlier in this guide, citizens will usually work to help implement ideas that they had a hand in creating. Similarly, elected and appointed officials should feel some ownership of ideas if they are expected to carry the implementation torch. In this chapter we describe options and ideas on how to build broader community support for your green infrastructure plan along with examples of ‘key messages’ you may want to use to build community support for conserving natural assets.
There are many ways to engage people. However, you are not likely to have unlimited funds for public engagement or to build community support, so whatever methods you pick should be those that are most likely to engage key stakeholders. Note that not every member of a community will be interested in your project.
Assuming that you have developed some clear target groups to reach out to, the following are some options, both traditional and non-traditional, for community engagement.
There are many methods of engagement. We discussed committee formation and consensus building in Chapter Three. In this chapter we discuss:
• targeted presentations
• online surveys and maps
• open houses
• engaging with decision makers
We recommend that you make presentations to your appointed and elected officials about your project at least three times: at the beginning; during the middle; and near the end. This will ensure that people are not caught off guard – or that they worry the process was hidden intentionally from public view.
In addition to government officials, key groups to target for presentations include conservation groups, land trusts, hunt clubs, cross country horse clubs, or nature groups. Many people will not attend committee meetings, public meetings, open houses or other civic events, but they may be very active in other civic groups, such as the Lions Club, the Rotary or their church. Make plans to outreach to those groups as well.
Consult with community leaders and local planners to learn which groups are key to engage. If the locality is not yet on board with the need to evaluate its assets, it may be necessary to conduct your own research to obtain community input. Contact agencies that interact with key stakeholders, such as your forestry division, soil and water district, or watershed council for suggestions on whom to reach out to. If possible, find out if there are meetings at which several groups will be present, such as a community faith day in which multiple churches participate, an Earth Day event or a county fair.
Next, plan how to target your message to the group’s interests. For example, if you are speaking to a chapter of the National Wildlife Federation, focus your message on wildlife habitat and access to nature. If you are addressing a hunt club or the local equestrian club, discuss the importance of a protected landscape for wildlife movement and uninterrupted cross country rides.
More ideas about targeting your messages are found later in this chapter.
One option for reaching more people is to create an on-line survey, where you can ask people to comment on your goals or rank areas as top priorities for conservation. Off-the-shelf on-line survey tools, such as Survey Monkey, allow you to make a short, simple on-line survey for free or a more complex and longer survey for a small fee.
To ensure that you collect objective information, enlist help from a local university or survey research firm to review your questions and ensure they are not misleading. One caveat is to determine first whether your community has access to adequate computer resources and the requisite computer skills; some rural areas or areas with high poverty rates may not be able to access on-line resources. In these cases, if possible, project information and surveys can be deposited at local libraries or other public places to be filled in and picked up later.
You could also have people mark up a map through programs like Green Maps or your own custom software application. You can make your on-line map more interactive by setting it up so that people can click to turn layers on and off. While this will require some engineering on your part (and possibly the use of GIS add-on software, such as ArcEditor), it allows members of the public to see relationships easily. Keep in mind that if people add
information or factual comments to your map, you will need to ground truth and fact check them before adding them. You may want to ask for their emails or phone numbers, so you can follow up with questions, if needed.
You may recall from Chapter Three that ‘no committee’ was an option. It is quite possible that you prefer to simply conduct expert consultations and then hold a public ‘open house’ to invite review of the work. An open house may or may not involve an introductory presentation but remember that the central notion of an open house is that it has an informal setting, allowing people to drop in when it’s convenient for them. Perhaps you can videotape a presentation or provide an automated introductory slide show for people to watch when they do drop in.
An open house allows participants to interact with project staff in small groups or one-on-one. Engaging people in this way can be much more interactive and meaningful than the traditional public meeting, where people sit in an audience and offer short comments into a microphone. In addition, if you are seeking input on maps of natural and cultural assets, it is important that people can see the maps up close, ask questions and offer corrections or suggestions.
Most loca lities have comprehensive plans that describe community goals, as well as future land-use plans that depict where and how they plan to grow in the future. However, these plans may not include key green infrastructure information, such as soils data, which can designate the best areas for agriculture.
If your board of supervisors, planning board, planning commission or other elected or appointed officials are unfamiliar with the new green infrastructure information you are presenting, they will need to understand the system you used to prioritize key natural assets. They will need to know what values led to your decision to select certain areas as high value. Make your decision process as transparent as possible by writing down your process. And be sure to carefully document the methods you used for prioritization, as well as special considerations for features added to your map (e.g. a natural area which supports outdoor learning for a nearby school).
Despite your efforts, decision makers may still decide to replace or impact the highest-quality natural area with a
• To maximize options for public participation, offer flexible hours to drop in, such as from 3pm to 8pm, to allow people to arrive when it suits their schedules.
• Avoid meeting conflicts by checking calendars for other related or popular community events.
• Allow more families to participate by offering child-sitting services, kid-friendly activities, and advertise that families are welcome.
• Advertise the event through public service announcements on radio and television and post flyers in places where people will see them, such as at schools, libraries or grocery stores.
• Offer refreshments. Seek corporate or community sponsorship for snacks or a light meal – food is a great magnet for busy families and singles.
• Use separate areas for commenting, to avoid overcrowding. If you are using themed overlay maps, begin with a base asset map and have a table for each of the themed overlays. For fun, use a train motif and emphasize that people should visit each ‘station.’
• If you forgo a formal presentation, have an orientation ‘station’ where a team member (‘conductor’) explains the project and the purpose of each map before the participants chug around the stations.
• To avoid overcrowding by too many people at one station, stagger participants as they enter. Begin with an orientation at the base map for everyone, but change which map each participant visits next. If adopting the train motif, provide each participant with a numbered ticket and stagger the starting location so the first person starts at station one and moves to station two, while the next person begins at station two, then goes to three, and so on. This avoids participants overcrowding each station as they move around the room.
• At each ‘station,’ provide introductory information concerning the themed map’s purpose and graphics. Prepare a series of questions, such as, “Does this look accurate to you?,” “Is the map easy to understand?,” and ”Are the map symbols
and graphics easy or difficult to interpret?” You may also have specific data-related questions, such as, “Does this map include all the key areas for natural resource-based recreation?”
• Provide a map for people to contribute their own data or favorite places, to validate or correct assumptions about community priorities. However, try to avoid non-uniform or inconsistent methods of adding data to maps. Consider asking key questions such as ‘Where is your favorite place to view nature?’
• Avoid overcrowding maps with notes by using numbered sticky dots that reference corresponding numbers on a flip chart. For example, dot #1 = favorite bird watching area; dot #2 = best area for a forested buffer; dot#3 = best fishing spot. Alternatively, heavy clear plastic sheeting (available from art supply stores) can be overlaid on maps to allow people to mark key areas with permanent markers. Once a sheet gets overly congested with illustrations, save it and lay down a new sheet. Once comments have been reviewed, the favorite places and priorities data can be digitized to provide common symbology and phraseology, such as fishing, hunting, best views, and then included as a reference map.
• Let people know where information will be posted and how they can follow the process to completion. Be sure to have a sign-in sheet for people’s contact information so they can be included in future updates.

new industrial park or school, but if they have a map of key natural and cultural resources, at least it allows them to make their decision with a fuller understanding of what may be lost.
Acknowledging that something will be given up to permit development could also lead to conserving other areas through acquisition or zoning changes to compensate for the loss of a key area. They may decide to compensate for that loss by adding better protection to another high-value area or taking on a habitat restoration project to mitigate the loss.
In Chapter Two, we made the case for why mapping and evaluating natural assets makes good sense for the economy, public health, safety and aesthetic reasons. In this section, we provide some of the facts and studies that we have used to best communicate key messages. Feel free to utilize these arguments and create your own local examples. Much of the advice in this section is based on the GIC’s experience in effectively targeting messages to multiple audiences across the U.S.
Messaging is shorthand for how you communicate your project’s purpose and goals. How and what you communicate is critical to your project’s success and could make the difference between a project that is widely accepted or one that is turned down before it begins. The way you describe or frame your project’s aim can affect whether it appeals to a wide range of interests or whether it is seen as overly narrow or something to be stopped.
Messaging is shorthand for how you communicate your project’s purpose and goals in a way that people can understand and find meaningful to them.
Politics in the United States has been growing more acrimonious by the day. The poor state of the economy has led to a great deal of worry, concern and fear about the future. Related to this, many environmental efforts and institutions are under attack or suffering from excessive criticism. Anything labeled as ‘green’ may be attacked and accused of trying to take property rights away, or of adding to regulation and red tape. In addition, the accusations that regulations stifle industry and prevent
‘progress’ have been levied against the environmental movement, although there exists much evidence to support the claim that having clean water, clean air, healthy communities and safe and productive workers actually benefits the economy and can reduce future costs for environmental cleanup and public health.
One central point you can make to answer these concerns is a cost-benefit analysis: If we identify and protect resources before they are damaged, we can avoid future cleanup costs of polluted waters and soils. And prevention of air quality impacts will save money in the long run. You will not face the costly expenses of establishing a Total Maximum Daily Loading of Pollutants (TMDL) for an impaired water or preventing your area being listed as a Non-attainment Area under the federal Clean Air Act. You can also protect public safety and future loss of both life and property by conserving sensitive areas and identifying areas that are at high risk from impacts of storms or sea level rise.
The fi rst step in developing a key message is to know your audience. So you may want to conduct a pre-assessment of stakeholder interests and values before you begin your project, in order to learn what are the hot-button issues and to get different community perspectives on the key issues involved with your project.
You can also utilize a focus group to test your ideas, review the effectiveness of your message and map graphics before presenting them to the public or to decision makers. The worst time to find out that you have created an unintentional controversy is in the middle of a public meeting. It is best to pre-anticipate and address potential conflicts before they come to a head. However, it is likely that you will still need to actively respond to tough questions throughout the duration of a project. Having well-informed answers at the ready can help you to navigate the pitfalls and firestorms inherent in most land planning efforts.
Assuming you know who your audience is and what are its main concerns, you can tailor your message to preaddress many of them. When possible, it is better to answer the question that has not yet been asked and allay concerns and fears during your presentation, as opposed to afterwards. Develop a set of key messages and put them on your web pages, in project brochures, in presentations,
in a Frequently Asked Questions (FAQ) document, or in other written, filmed or on-line communications.
Which topics are most relevant to your audience will vary depending on your community and the specific setting. One evening you might be presenting your project to the chamber of commerce, on another it might be to the biodiversity council. You should not actually change your project’s mission and purpose, but you may utilize arguments and descriptions that most resonate with your intended audience. You may also modify the format (making it more formal or informal), depending on the setting and timing of your presentations.
You will also have to decide if your audience will resonate more with one of the following types of information:
• evidence based on studies (e.g. academic journals)
• stories and anecdotes (especially local or familiar)
• pictures and evidence they can see for themselves (take a field trip)

• support from key community members and respected community representatives (testimonials)
we tend to copy what our peers do. Peer pressure originates not just from verbal communications from your peers, but also your own tendency to copy your colleagues’ and neighbors’ behavior.
Much of the academic literature about peer pressure influences stems from studies of recycling or littering behavior, which examined people’s motivations. Recycling studies found that the most effective way to gain participation in recycling programs was not to tell people to avoid making excessive waste, but rather to place recycling bins strategically at several homes and watch people ask to join once they saw their neighbors recycling. Similarly, programs that tried to reduce littering by posting negative signage (Don’t litter, big fines!) were not as effective as ensuring that places were kept clean, since people would throw trash in areas where there was trash already, but tended not to litter in cleaned areas (Reiter and Samuel 2006).
The tone and approach of your message is relevant because you want to make evaluating and mapping your community’s assets the ‘normal’ thing to do. So, instead of discussing what you will lose if you do not evaluate and map your assets, present the many benefits of doing this work and point out how many other communities are doing it already, and with what success (try to pick communities similar to your own to model exemplary behaviors with which people can resonate).
Key messages are short statements (stated directly or implied) that get to the heart of the argument you wish to make.
Your central message needs to share the benefits of protecting and restoring key natural assets as part of your green infrastructure strategy. Whichever arguments you decide to use, remember that positive points resonate more effectively. In addition, many psychological studies have shown that people respond best when told what they can do, rather than what they can’t. Studies of signage in national parks saying do not do X, Y, or Z have sometimes made it more likely people will do those things. Similarly,
Economic reasons are probably the most important benefits to highlight in the early 21st century, when most of the world’s economies are struggling. They also provide a way to use economic analogies to which most people can relate.
Earlier, we introduced several of these ideas. Here, we will show how these concepts can be structured as arguments for why it’s important to map and evaluate natural assets. Each sub-section has a ‘key message’ that you may wish to utilize when making your case for natural asset planning; it is then followed, either by scientific evidence or by examples that you can use to back up the message’s claim.
MESSAGE: You Make Informed Decisions About Managing Your Own Financial A ssets, So Make Sure You Are Also Well Informed A bout the Values of Your Natural A ssets!
Do you hand out blank checks to the cashier at the grocery store or sell your home or stocks for just a dollar? Of course not! That is because we sell or buy things based on some understanding of their economic value. So, just as we know the value of our financial assets, we should know the value of our natural assets before we decide what to do with them. By mapping our natural assets, we can determine which land features are the most valuable and make wise, informed decisions about their management.
MESSAGE: Mapping Green
A ssets Saves Both Kinds of “Green”!
Utilize the argument that restoring green spaces attracts redevelopment. For example, “By converting an old levee on the Savannah River to a riverwalk, the town’s investment of $8 million in the trail has attracted $198 million in new commercial investments” (Benedict and McMahon 2006).
The creation of a new riverfront park in downtown Hartford Connecticut led to $1 billion dollars in new reinvestment within walking distance of the park, according to the nonprofit group Riverfront Recapture, which developed and runs the park (Riverfront Recapture 2012).
MESSAGE: Creating or Restoring Natural Areas Protects and Increases Property Values!
Property va lues and real estate revenues rise 10 to 30 percent when green spaces are preserved, raising property values without raising tax rates. Properties near green spaces sell faster and for more money.
For example: “The National Association of Realtors found that 57% of voters would be more likely to purchase a home close to green space, and 50% said they would be willing to pay 10% more for a home located near a park or other protected area” (Benedict and McMahon 2006.) And, “a developer who donated a forty-foot-wide, sevenmile-long easement along a popular trail in Front Royal,
Virginia, sold all fifty parcels bordering the trail in just 4 months” (Benedict and McMahon 2006).
There are many studies of the benefits of parks and natural areas on property values and some make a distinction concerning the size and type of green space. One of the evaluation methods used in a study of home sales in Portland, Oregon, found that the 193 public parks analyzed had a significant, positive impact on nearby property values. The existence of a park within 1,500 feet of a home increased its sale price between $845 and $2,262 (in 2000 dollars) (The Economic Benefits of Recreation, Open Space, Recreation Facilities and Walkable Community Design 2010).
MESSAGE: Size and Quality of Natural Areas Matter For Benefitting Property Values (and Quality of Life).
The size of natural areas matters not only for wildlife but also real estate values. The Portland study also showed that the larger the park, the more significant the property value increase.
Another study found that large natural forest areas have a greater positive impact on nearby property prices than small urban parks or developed parks, such as playgrounds, skate parks and even golf courses. Homes located within 1,500 feet of natural forest areas enjoy statistically significant property premiums, on average $10,648, compared to $1,214 for urban parks, $5,657 for specialty parks and $8,849 for golf courses (in 1990 dollars).
Similar studies in Howard County, Maryland, Washington County, Oregon, Austin, Texas, Minneapolis-St. Paul, Minnesota, and other areas used data from residential sales, the census and GIS to examine marginal values of different types of parks. They too found that the type of open space affects the benefits for property values (The Economic Benefits of Recreation, Open Space, Recreation Facilities and Walkable Community Design 2010).
MESSAGE: Protect Natural Areas –Especially Trails – To Attract Home Buyers.
When citing sources for economic studies, the National Association of Realtors (NAR) proves very useful since it is in the business of selling homes and is considered to be an avid supporter of economic growth. It compiles many useful statistics, such as the NAR national study, which
has found that, of all homebuyers polled about what they were looking for in recreational amenities, ”1-2% golf, 5-6% swim and more than 50% use paths.” This shows that creating trails in a development is a very appealing investment.
Ma ny businesses depend on clean water for their production process. For example, computer chip manufacturers require a great volume of water that is as pristine as possible. Of, course, bottled water plants require clean water, but so do beer and spirits companies. In addition, those type of businesses that depend on a healthful environment tend to be good stewards of the earth.
MESSAGE: To Attract a Well-Paid Workforce, Offer Abundant Green A reas and O utdoor Recreation.
The goal of attracting companies with well-paid jobs is shared by most localities. However, well-paid positions are often harder to come by than low-paid service jobs. To attract good paying jobs, the focus should not be on ‘industrial parks,’ but actual parks.
Small companies, especially those that have a well paid and skilled workforce, place a strong importance on the ‘green’ of the local environment (Crompton Love and Moore 1997). Also, the creative class of artists, media personnel, lawyers, analysts, and so on, tend to reflect a better paid workforce. They make up 30 percent of the U.S. workforce and place a premium on outdoor recreation and access to nature (Florida 2002). So, to attract a skilled, creative workforce (and thereby the companies that employ them), it is key to provide them with green areas and outdoor recreation.
In addition to clean water and recreation, remember that green infrastructure includes natural resources that we depend on for agriculture, timber, honey and other non-extractive and regenerative assets. These resources support a large economy. For example, in Virginia, forests and associated forest products bring the state $27.5 billion dollars in annual revenue while agriculture brings in $55 billion annually and provides more than 357,000 jobs. Similarly in North Carolina, the state’s top grossing industries are agriculture (farms and forestland) and tourism; both highly dependent on existing natural resources and the quality of those resources.
In rural areas, these numbers can be used to justify a focus on conserving those landscapes that contribute to the rural economy – they are both economic and ecological assets!
MESSAGE: Nature-Based Recreation Spurs New Businesses!
While service jobs are usually low paid, those that require some skill, such as guides for hunting, fisheries and whitewater rafting, depend on a green and well-connected landscape. These types of businesses bring in hotels, bed and breakfast inns, restaurants, craft and boutique stores, and all the other services needed, such as gas stations, groceries and outdoor gear shops.

The Creeper Trail in Virginia has lured $2.5 million in new tourism dollars to Virginia and $1.5 million to Grayson County, along with 27 new jobs in new businesses near the trail (Bowker and Bergstrom 2004). These include everything from trail-side cafes to bike and equipment rentals and lodging.
Green assets tend to attract tourists who are high spenders. Those people whose outdoor sport requires the purchase of expensive gear, such as ATVs, snowmobiles, powerboats, mountain bikes and fishing equipment, will often shop locally and get their equipment serviced locally as well. They will spend money on boats, camping gear, high-powered cameras, camouflaged survival gear and other equipment.
Some tourists also tend to spend more on amenities. Even birders, who may appear to need nothing more than a pair of binoculars, a chewed pencil and a notebook, spend more than other types of tourists. This is due, in part, to the type of recreation, as well as the type of individual who engages in that sport. In addition, they tend to stay in bed and breakfast inns (which cost more and generate more revenue in taxes than budget inns) and eat out at finer restaurants (e.g. a nice bistro, not fast food), which results in higher bills and greater tax revenue per person. They will also buy better binoculars, more bird guides and
more expensive scopes. Those sales add up. Similarly, heritage tourists, those who like history and culture as part of their tourism experience, spend, on average, two and half times more per person than all other types of tourists (Thomas Jefferson Planning District Heritage Tourism Project). However, they also are choosy about the areas they visit – therefore protecting scenic vistas, conserving viewsheds along scenic roadways and preventing the encroachment of development into historic landscapes are important to lure them and keep them visiting as long as possible. They will not want to travel through multiple blighted areas simply to reach a historic site.
As noted earlier, people shop longer and spend more money per item in shopping areas with trees, so providing and restoring the tree canopy in business districts and downtowns is critical to getting and keeping dollars from residents and tourists alike. Charlottesville, Virginia, bricked its main street in the 1970s. Today, this pedestrian, mall with many trees planted where there was once a street offers a unique outdoor and green café scene, with which modern malls are not able to compete.

MESSAGE: Bigger Is Better –Especially For W ildlife!
A general rule of thumb is that the larger the natural area, the greater the diversity of habitat types that are possible. A minimum size for forested cores is 100 acres, but most models assign higher points for larger areas. Seek to conserve as large an intact area as possible.
MESSAGE: Connections Count!
A connected landscape helps with species diversity by providing multiple pathways for plants, pollinators and animals to live and travel. If a species is reduced in one area (due to disturbance or disease), connections facilitate colonization. They also ensure that, if one pathway is lost or broken, there will be other ways to cross the landscape.
An analogy that is easy to relate to and that the GIC has used in college towns
is, if you are hungry when the big football game is on and game day traffic has closed down the roadways, you’ll be out of luck if you only have one route to the grocery store. But if you know a favorite shortcut, or where there’s an alternative store, you have more chance of getting what you require. In nature, we also need to have multiple routes and pathways to ensure we don’t get stuck, go hungry – or go extinct!
Existence value or intrinsic value, is a human value that something should exist and possesses its own independent value in and of itself, whether or not the person perceiving that value has ever experienced it directly.
MESSAGE: People Value Natural A ssets For Their Own Sake!
Ma ny people appreciate nature and wild things just because they exist. Known as existence value or intrinsic value, many people take heart in knowing something exists, even if they have never, or will never, see it in real life – the Emperor penguin is an exotic example, but think of how many people get excited by the possibility of a mountain lion in the nearby hills? As famous naturalist Aldo Leopold once said in his Sand County Almanac, “There are some who can live without wild things and some who cannot. I am one of those who cannot.”
TREES PROVIDE MANY VALUES –AND THEY WORK FOR FREE!
Trees:
• Provide habitat and food for wildlife.
• Provide oxygen.
• Remove particulate pollution, sequester carbon and mitigate global climate change.
• Absorb and filter runoff, and protect water quality.
• Conserve land by preventing soil erosion.
• Mitigate urban heat islands and reduce energy demand.
• Increase property values.
• Improve children’s performance in school.
• Reduce levels of domestic violence.
• Attract shoppers and tourists who stay longer and spend more.
• Reduce mental fatigue and stress.
Urban Forestry News, Spring 2004.
One theory posited about why people relate to and care about nature is known as biophilia . First proposed by Erich Fromm and later popularized by noted ecologist E.O. Wilson, it is described as “the connections that human beings subconsciously seek with the rest of life.” These connections are thought to be deeply rooted within our own biology as animals. Whether or not one subscribes to this notion, it is true that simply looking at something natural or ‘green’ improves our attitude and state of mind.
Simply looking at pictures of natural objects can improve your attitude and make you more altruistic. In a recent study, participants immersed in natural environments reported a higher valuing of intrinsic aspirations and a lower valuing of extrinsic aspirations. In essence, seeing nature made people more caring (Weinstein, Przybylski, Ryan 2009). It might seem incredible to link them, but occurrences of both attention deficit disorder and domestic violence are significantly reduced around trees, while people’s IQs actually increase (Southern Forest Research Station).

Increasingly, green infrastructure planning is being linked to the field of public health. According to the US Centers for Disease Control, as of 2010, 25.6 million, or 11.3% of all people over the age of 20 have
diabetes and it rose to the seventh leading cause of death in 2007. Twice that number of Americans are at risk of contracting diabetes. However, many studies show that diabetes can be prevented by weight loss and exercise. Green infrastructure planning can help communities link people to trails and parks that reduce stress while getting them fit and healthy.
Doctors are beginning to prescribe walking to lower the risk of heart disease, obesity and diabetes from lack of fitness and weight gain by ordering trail walks for their patients (Washington Post 2009). Walking just 30 minutes a day significantly increases your health, avoiding metabolic syndrome – the cluster of risk factors that raise the odds of developing heart disease, diabetes and stroke (American Journal of Cardiology 2007).
recovery. Dr. Ulrich measured patient’s alpha rates, which are associated with stress and levels of relaxation. He found that those patients who could experience natural scenery were more relaxed than those who had urban views and, as a result, those experiencing nature views had “shorter post-operative stays, fewer negative comments from nurses, took less pain medication and experienced minor post-operative complications” (Ulrich 1984). Many hospitals are beginning to provide views from their rooms. Since it is likely that most hospitals do not own those views, they depend on local planners and developers to maintain the green space that is helping their patients heal faster. They are also incorporating ‘healing gardens’ and outdoor trails for their more ambulatory patients, as well as for the enjoyment of staff and visitors, who also experience their own forms of stress.
“The last word in ignorance is the man who says of an animal or plant, “What good is it?” If the land mechanism as a whole is good, then every part is good, whether we understand it or not. If the biota, in the course of eons, has built something we like but do not understand, then who but a fool would discard seemingly useless parts? To keep every cog and wheel is the first precaution of intelligent tinkering.”
— Aldo Leopold, in Round River: From the Journals of Aldo Leopold.
Most articles also find that having access to recreation opportunities makes it more likely that people will exercise. The fitter employees are, the lower the health care costs for businesses. That is why businesses are attracted to areas that offer abundant recreation and opportunities for people to walk near to where they work.
Even having a view of green spaces can reduce illness. One study found that employees without views of green spaces, in response to questions concerning 11 different ailments, reported 23 percent more incidences of illness in the prior six months (Kaplan 1989). Less illness means more productive workers.

Similarly, studies of hospital patients by the Center for Health Systems and Design at Texas A&M University found that physical or visual contact with natural spaces leads to faster
A great deal of research shows that residents within lower-income urban neighborhoods have higher rates of health problems. While less income and lack of access to health care are certainly factors, the surrounding environment also plays a role in a community’s emotional and physical health.
Dense urban areas often lack trees and vegetation. Trees’ role in improving air quality is fairly well-known. They
absorb volatile organic compounds and other contaminants from the air while also providing oxygen. However, what may be less well known is that they influence our propensity to walk and exercise. The green of our environment exerts a positive influence on our desire to walk outdoors. Downtown urban areas often have less trees. For example, the GIC’s urban canopy maps of Richmond, Charlottesville and Staunton show less trees in these cities’ downtowns. The closer one gets to the urban core, the less trees are found. In the case of Charlottesville and Richmond, these less-treed areas correlate to areas suffering from greater poverty.
Studies concerning factors that motivate people to walk show that, while having opportunities to stroll on sidewalks and other pathways is important, it is also important, if not equally so, to have trees to walk under and alongside. Research has shown that residents in neighborhoods with abundant green spaces have better health than those in areas without green space. People are more likely to walk in areas with green space, a correlation that is strongest for the elderly, homemakers, and lower socio-economic groups.
Destinations that must be reached through areas without trees and vegetation are perceived to be farther away, perhaps influencing people’s reluctance to walk through them (Wolf 2008). Thus, residents of inner city urban areas with less trees have greater poverty, poorer health and less desire to walk and exercise outside. This demonstrates why urban green spaces, the tree canopy, a connected landscape and other natural assets are key factors to include in any green infrastructure plan.
People’s lack of access to outside spaces, as well as their reluctance to venture outside, have received new attention in recent years. The term nature deficit disorder refers to the effects that occur when children do not have access to outdoor natural areas. The popular book Last Child in the Woods by Richard Louve synthesized literature concerning
the importance of nature to reduce attention deficit disorder and create healthier kids. It also stressed why we need to actively ensure that our kids are out in nature as part of their emotional, physical and cognitive development.
In this chapter, we have covered opportunities for building public support and examples of key messages that can be tailored and utilized to appeal to your community. In Chapter Seven, we provide detailed information about data sources and models.

• Building a Habitat Model
• Identifying and Ranking Habitat Cores
• Connecting Habitat Cores
• Creating Themed Map Overlays
• Working with County Data
This chapter presents guidance on using state and local data to create natural asset maps in South Carolina. Before embarking on the steps presented in this chapter, read prior chapters to understand why it is beneficial to create a green infrastructure network and how to set clear goals and priorities that will guide the mapping process. Chapter 5 highlights a case study of natural asset mapping in Berkeley County, South Carolina. There is intended to be some overlap between that chapter and this one, however this chapter presents more technical information directed at geographic information systems (GIS) specialists. The Technical Appendix presents the detailed step-by-step walkthrough to create a habitat cores model using ESRI’s ArcGIS software.
Asset mapping is an invaluable tool in planning for healthy and resilient communities. In order to set priorities and develop strategies, it is necessary to know what your assets are. In land use planning and natural resource management, it becomes extremely important to know not only what your assets are, but where they are as well. Creating a program to protect water quality by preserving and restoring forests can be far more effective if the location of land that has the greatest impact on water quality is known. This may sounds obvious, but often geographically-rooted issues are not addressed with a geographical approach. Mapping and understanding your assets in a geographic context takes time and resources up front, but ultimately sets you up for successful implementation.
The most unique and high quality natural assets can be identified through a mapping process. The term “assets” is used here because natural features can fulfill one or more community goals, and can be prioritized and ranked using objective and consistent criteria. Assets can be natural features like forests and wetlands, or constructed features like a hiking trail or a historic building. In the case of constructed features, the common theme that connects them is that their value is partially derived from the natural landscape that surrounds them. For example, the area visible (or “viewshed”) from a historic plantation home influences its character and historic integrity.
Mapping can be done at any scale, and ideally should be done at multiple scales. For example, some details may be hard to see at a regional level that would be obvious at a county level. Likewise, some larger patterns and connections might be missed at a county scale that would be clear at a regional level. Mapping across administrative boundaries can be a challenge, largely because data may have to be collected for a number of different localities and merged into a consistent database. However, trans-boundary assets can
easily be overlooked, but if seen from a regional scale can be managed cooperatively. Rivers and large waterbodies are examples of features that frequently cross administrative boundaries. However, large tracts of intact forests and wetland complexes also need to be assessed at a regional view to better understand the benefits they provide and their level of risk.
The following chapter can be used by technical staff charged with building a landscape-scale habitat model and creating natural resource-based asset maps.
how this methodology was put into use in South Carolina, see Chapter 5 which presents a case study from Berkeley County.
At a minimum, the use of GIS software will be required to make asset maps and map intact habitat. This guide will hereafter assume the use of ESRI’s ArcGIS software, although there are other options available.
The Spatial Analyst extension to the ArcGIS suite is also an invaluable tool for conducting landscape analysis. It allows for the manipulation of raster data in more complex ways. As this methodology relies on land cover data in raster format, this extension is necessary for completing the model.
The ModelBuilder tool inside of ArcGIS is a useful way to document your steps, as well as be able to quickly re-run a series of GIS operations (i.e. automate a workflow). For example, you might finish building your model, but want to go back and change one parameter that was used in the middle of the analysis. Instead of redoing the analysis step by step, you can simply change the parameter and let the computer redo the entire process while keeping all other parameters the same.
Identifying high quality habitat should be the first step in an asset mapping process. Since the network of intact natural landscapes forms the backbone from which the benefits of green infrastructure are derived, it is important to understand its condition before proceeding with other thematic maps. This map will help address questions such as:
• What are the largest and best quality tracts of habitat?

• What areas have the most intact habitat?
• Which areas are most fragmented by development?
• Which habitat is most connected?
• Which habitat is the most isolated?
The methodology presented in this chapter identifies the cores and corridors in your study area, which can then be used to answer the above questions. For an example of
If you do not have access to these tools, then it is recommended that you partner with a non-profit organization or an educational institution that does have these capabilities. You may want to join with your Regional Council of Governments to create a mapping project.
The Technical Appendix presents a step-by-step guide to building a habitat model in South Carolina. These steps can be readily followed by any GIS technician. This also makes it easier to deviate from the methodology along the way, if you are so inclined. A second option, also discussed in the Technical Appendix, is to use the GIS script tools to automate the entire process. The user can tell the tool where to find the data (using a simple drag-and-drop interface) and the tool runs the model. Deviating from the methodology, however, is not possible when using the script tools without knowledge of the Python scripting language, although the tool does provide some options that can be tweaked. One of the major advantages of GIS
is the ability to automate a series of data processing operations to save time and to allow even those users with rudimentary GIS knowledge to obtain the data and run the model. See the Technical Appendix for more information.
There are two major steps to mapping intact habitat cores:
1. Identifying the location and shape of habitat cores
2. Ranking the cores based on their ecological integrity using the best available data and science
It is ideal to perform both steps, but completing only the first step is preferable to not completing either step. Step 2 is not possible to complete without first completing Step 1.
There are several datasets that are necessary to complete the first step:
• Land cover. Popular land cover datasets that cover the entire state of South Carolina include the National Land Cover Database (NLCD) and the Cropland Data Layer (CDL). Both of these are free to download. Some localities have high resolution land cover datasets and can consider using this in the analysis. See Chapter 5 for a detailed discussion of how to use local land cover data.
• Infrastructure. These data will usually be comprised of multiple GIS layers, and include roads, bridges, rail lines, pipelines, electrical transmission lines, and any other above ground infrastructure that divides the landscape. In the model, these will be treated as fragmenting features. Natural lands within 100 meters of these features are considered to be “edge habitat.”
• Development. This refers to what land has been “developed” or “urbanized.” This can usually be approximated using your land cover layer (i.e. “urban” or “impervious” may be one of the land cover classes in your dataset). Another very useful piece of information is building locations. This is not necessary to run the model if you can distinguish developed land from your land cover layer, but it will make the results much more accurate. In the model, these will be treated as fragmenting features. Natural lands within 100 meters of these features are considered to be “edge habitat.”
The goal of the second step is to rank the habitat cores after they have been identified. This is the first step in defining priority areas for conservation. This step involves using additional datasets to learn more about the cores that have just been identified. See the Technical Appendix for a full list of data sources that are recommended to complete the model (all are publicly available). It is also acceptable to incorporate specific or locally relevant metrics that are not on the list into your model (e.g. trout spawning waters), but make sure you have the data to do so (e.g. a countywide survey of trout spawning waters).
To rank the cores, it is necessary to use additional data layers. These data layers will be used to compute statistics about the cores, which can be summarized in a composite “score.” This score, called the Core Quality Index in the model presented in this guide, represents the quality of the core using quantifiable metrics.
The locations of observed rare, threatened, or endangered species is one part of the data required to rank the habitat cores that will require special effort. Due to the sensitive nature of these data, it is necessary to formally request the dataset from the South Carolina Department of Natural Resources Heritage Trust Program. The species and communities tracked by the Heritage Trust Program are referred to as elements of biodiversity, and their individual locations are referred to as element occurrences (EO).
Data on protected/conserved areas are also necessary for completing the asset mapping process. These data will likely have to be collected from several sources; for example, the most up-to-date conservation easement data is not always maintained by the same agency that maintains other information such as park boundaries or designated wilderness areas. Calculating which core habitats are in a permanent state of conservation or a resource management use shows how protected a core is from fragmentation and degradation. This is also useful for identifying gaps in protected habitats, or where limited resources will be best spent to increase the network of protected lands.
Defi ning a study area is a critical step to achieving quality results. Note that the methodology presented here is most appropriate for relatively large areas, such as county, large watershed or the state.
Study areas will vary depending on the goals of the asset mapping program. For example, a study area could be a county or group of counties, or a watershed or group of watersheds. To include natural features that cross the outer boundary of your study area, you will need to decide on a buffer to apply to your study area . For a county, a good rule of thumb is to apply a 10 kilometers (6 miles) buffer. This means that your model will include data that are within 10 kilometers of the county. This prevents features that cross the boundary from being misconstrued as smaller than they really are, and being ranked incorrectly by imposing a political boundary on the habitat analysis. Note any special geographic features (large forests, reservoirs, wetland complexes, etc.) that cross the boundary of your study area and make sure to that your buffer size will allow them to be fully captured in the analysis.
Regarding data collection, make sure you collect data for your entire study area, including the buffer you defined
If your study area is a county, for example, you will most likely need to collect information from neighboring counties. If your study area is a watershed, you will mostly likely have to collect some types of information from the counties and incorporated places that are within the watershed, as many datasets are maintained at the local level.

Before creating a habitat map, it is necessary to identify the location of high quality habitat. However, this requires performing some analysis using GIS, since these data usually cannot be acquired “off the shelf,” unlike land cover, water bodies, and other simple datasets. It is also important that this analysis be as up-to-date as possible (i.e. use the most recent data possible as inputs).

The first step, as mentioned above, is identifying the location of habitat cores. Cores are the main building block of green infrastructure networks, and can be made up of different types of habitat. In this case, habitat is referred to in a general sense, and is mostly synonymous with natural landscapes. For example, even though cropland can provide habitat for some species, it is not considered to be eligible to be part of a core here, as it is not a natural landscape.
This
Some lands, such as land managed for forestry, can either be very similar to natural habitat or very dissimilar. The decision of whether or not to include these managed lands will have to be made on a caseby-case basis depending first on the quality of data available (i.e. to be able to identify these areas), and any specific goals of the study (e.g. if a community desires very specific strategies related to forestry operations).
The main thing that differentiates a core from being just a patch of trees is size of interior habitat. This means that the trees, for example, are far enough away from fragmenting features such as roads or houses to not be significantly affected by edge effects (100 meters is the general rule of thumb for the southeastern United States). One hundred acres of contiguous interior habitat qualifies as a core. However, many methodologies, including this one, recommend also identifying patches of contiguous habitat that are smaller than 100 acres (from 10 – 99 acres). This is because these areas can provide some of the same benefits as cores, but are often the largest patches of habitat that can be found in more urbanized or developing areas. This methodology is intended for landscape scale applications (e.g. county, region, etc.) and not for site-scale applications such as locating amphibian habitat on an individual parcel. However, this methodology can be used to great effect by informing how development on one site will influence the quality of the overall habitat network (positively or negatively).

Once cores have been identified, they can be ranked based upon their interior features. The primary purpose of ranking is to summarize the estimated values that these lands provide, such as supporting wildlife and supporting clean water. The detailed steps for identifying the cores and ranking them is presented in the Technical Appendix.
While cores form the main building block of a green infrastructure network, the ways in which they are connected are also critical for the success of the network. It is useful to think of these connections as corridors that connect the cores. Corridors can be existing, or they might need some restoration work in a specific area to restore a connection. Corridors should be a minimum of 300 meters wide, to provide enough space to allow 100 meters of edge habitat on each side while still maintaining 100 meters or more of interior habitat.
There are various ways to identify corridors. One way is simply observing any obvious connections, or opportunities for connections, on a map. For example, rivers and their buffer zones often provide natural corridors across the landscape. You can also use GIS models to identify potential corridors. It is recommended to use both techniques; first, using a computer model to identify potential corridors, and then vetting those results as you observe the overall network for potential connections.
To use GIS to identify potential corridors, it is necessary to first identify any impedances to movement across the landscape. By identifying impedances, or factors that discourage the movement of plants and animals, it becomes possible to model the path of least resistance between two areas (i.e the easiest path). In ArcGIS, this is referred to as “least cost path” analysis. To run a least cost path analysis, it is necessary to create a single layer that represents all impedances, in raster format. To build a single raster layer that represents impedance, you will need to use multiple data sources. The list below highlights some major categories of features that encourage and discourage movement across a landscape. A plus sign indicates that the feature encourages movement, while a minus sign indicates that it impedes movement.
• Habitat cores (+)
• Interiors forest (+)
• Riparian forest (+)
• Land cover (+/-)
• Steep slopes (-)
• Proximity to major roads (-)
• Proximity to urban land (-)
• Proximity to building/address point (-)
Note that this will create a general impedance layer (i.e. not species-specific). Corridor modeling can be done for extremely specific purposes, for example modeling corridors for pollinators. In this case, the goal is to connect habitat cores using natural landscapes and avoiding features like urban areas and roads. Several questions you should consider when assessing potential corridors are:
• What are potential corridors that can connect the largest and most important habitat cores?

• How can smaller cores be used to connect larger and more important cores? This is related to the stepping stone concept discussed in Chapter 1. Are there smaller fragments of natural land that, while they do not meet the requirements to be considered a habitat core, can play a role in connecting habitat cores?
• Are there natural features -- forests, wetlands, dunes or mountain ranges -- in your study area that form natural connections between larger areas of natural land?
• Are there any barriers that are effectively impassable, such as a very wide river or major interstate? Remember though that many rivers cross under roads and large bridges may allow enough of a passage under the road, so do not assume roads are a corridor barrier without first considering this.
• Do future plans for land development, such as a new subdivision, render a potential corridor infeasible? If so, is there a possibility to work with the developer to maintain natural connections in the master plan?
• How can currently protected lands serve as corridors? These areas are often great choices for corridors as their land cover is less likely to change.
• Are there areas that, if restored (reforested, etc.), would provide a key connection between cores?
Restoration work can be time and resource intensive, but a better case for restoration can be made if an area would create key connections for important habitat.
• Remember to visit potential corridors in person! This is the best way to make a final determination of whether a corridor is viable.
Running a corridor analysis in ArcGIS can be a time-intensive process due to the amount of processing that needs to occur, and this is multiplied when performing corridor analyses between many cores. To automate the process of performing many least cost path analyses, scripting is required. The Technical Appendix presents more detail about how to use the scripts that accompany this guide to automate the process of modeling corridors.
Surface Water Features
Agriculture Map
Base Map
Birds Map
Drinking Water
Favorite Places
A map showing all wetlands, floodplains and habitat cores.
A map showing prime and important agricultural soils, agricultural districts, and habitat cores.
A map showing all of the habitat cores displayed by their overall Core Rank.
A map showing important bird habitat, bird watching opportunities and habitat cores.
A map showing important reservoirs, reservoir catchments, aquifers, waters classified for drinking water use and habitat cores.
A map created by the community during an open house which has their favorite places labeled. Create a large printed map that can be marked with the public’s favorite places (that relate to green infrastructure!). These points can then be digitized by GIS staff to make a final map.
Forestry
Historic, Cultural, and Scenic Resources
Hunting and Fishing
Recreation
Water Resources
A map showing forestry tax use lands, forestry stewardship plans, potentially viable silvicultural lands and habitat cores.
A map showing cultural trails, scenic roads, mountain peaks, wineries, breweries, distilleries, historic areas, agricultural tourism trails and locations, and habitat cores.
A map showing public hunting lands, private hunting lands, trout waters, top fishing waters and habitat cores.
A map showing publicly accessible recreational features such as hiking, equestrian and bicycle trails, swimming areas, etc.
A map showing state regulated wetlands, waters ranked for biodiversity, major watersheds and habitat cores.
The purpose of creating your themed maps is to highlight all of the green infrastructure elements in your study area. Since trying to include all of the elements on a single map would be too complex and visually overwhelming, it’s necessary to categorize your data layers by theme. Once completed, your theme maps will inform your final green infrastructure network maps and strategies.
Some theme maps, like a Protected Lands Map or an Agriculture Map, should be done no matter where your study area happens to be, because these are themes that are relevant almost everywhere. However, it is also beneficial (and fun!) to create special theme maps that highlight a unique or idiosyncratic aspect of your study area. For example, you may want to highlight rare ecosystems that occur in your study area. Chapter 5 includes examples of theme maps that were made for Berkeley County.
Data availability is the main limiting factor in thematic mapping. You can potentially fill missing data gaps by engaging local organizations. Bird watching groups, historical societies, professional farming or forestry groups, outdoor recreation enthusiasts, and tourism departments can all provide valuable information that can be included
on your themed maps. Community workshops and open houses with relevant groups are also excellent opportunities to gather local knowledge (some of which can be mapped) and determine local priorities.
The final green infrastructure network map will illustrate the most important natural landscapes in your study area, or in other words, your community’s priorities. “Importance” can be a relative term; what is important to one community may not be so in another. Some things, such as the size of a habitat core, are always a positive factor and will increase the importance of an area. Other factors may only be locally relevant. For example, a community seeking to secure its future water supply may place more importance on habitat cores that protect their drinking water reservoirs. Or, a community seeking to restore water quality to an impaired stream may place more importance on restoring small cores along the stream in question. These examples illustrate why creating the themed maps, and using them to inform your final green infrastructure network map, is such a critical step in the process.
As stated previously, your first map will be a base map that shows all of the habitat cores that you identified in your study area, as well as their rank. In the final network, it is typically most effective to not show cores unless they are a priority and/or a critical part of the network (see Chapter 5 for a discussion of how this was done in Berkeley County). You will use the base map (showing the core ranks), along with the theme maps, to determine which cores will be shown on the final green infrastructure network map. In other words, while the base map showing cores can help inform land use planning on its own, it gains the most value when paired with thematic maps that represent local goals for natural resource use. So while the final green infrastructure network map may be the centerpiece of your planning effort, the theme maps are the legs that support it. They also allow you to do more in-depth analysis on particular issues such as exploring how the natural asset (cores) network support tourism or scenic roads.
If your m aps are poorly designed, no matter how high-quality your data, their message will not be effectively communicated to the viewer. While it is outside the scope of this guide to review cartographic technique (there are plenty of resources on this topic), it is worth noting several important points, in addition to the three rules outlined in Chapter 5:
Visual hierarchy. Remember that the focus of the map should be on natural assets. As such, these are the elements that the viewer’s attention should be drawn to when they first look at the map. So, for example, if you find that showing local roads is too visually distracting, it would be wise to only show major roads. The same could be done for streams, watershed boundaries, etc.

Common map elements. It is a best practice to include certain map elements on any map, including a legend, scale bar, and north arrow. If you rotate your map (to better fit your area of interest inside a specific layout, for example), features such as the north arrow become even more important.
Base features. The main purpose of base features is to provide reference points for the viewer. Specific elements will vary according to the scale of the map, but features such as roads and rivers are common examples. If your area of interest is mountainous or hilly, it can be useful to use a “hillshade” effect (can be created if you have a digital elevation model - DEM) as the bottom layer, and making the top layers semi-transparent to let the hillshade effect come through. Another good idea for your base is to leave no white space in the map, which is to say any space that looks “empty” to the viewer. For example, on a map showing where forests are located, it’s relatively simple to show non-forest land as a very light beige to avoid the “empty” look. Beige may then represent open spaces such as fields or lawns, while grey is urban, green is forests, blue is water, and so on.
The methodology presented here involved mapping land use and land cover, which change on a daily basis. New and improved datasets will be created for your study area, or will continue to be updated. For these reasons, your asset maps should be treated as living documents that can be updated as needed. The cores and corridors GIS models should be re-run on a periodic basis (the script tools that automate this process makes this a relatively simple task). Having up-todate maps that reflect the reality on the ground will improve their legitimacy and help gain support for consulting them during routine planning activities, such as reviewing new development proposals.
Note that the methodology presented in this chapter does not reflect site scale issues, such as deer browse or damage from invasive species. These issues require very fine resolution data that are usually not available for large areas. The model can, however, help prioritize where to expend effort on further field investigations.
Finally, it is worth repeating that the GIS modeling of habitat cores and corridors can be automated with the script tools that are described in the appendix. They can also be tweaked to a limited extent to make the results more accurate for your particular study area. Government agencies, nonprofit groups, universities or other public interest agencies may obtain a digital copy of the tool and script instructions by contacting the Green Infrastructure Center.

The habitat cores model accomplishes several major things:
1) It identifies large, intact patches of habitat (habitat cores).

2) It identifies smaller patches that do not provide the same degree of benefits as cores, but are still valuable for habitat (habitat fragments).
3) It calculates metrics for each core and habitat fragment, and ranks it based on these metrics to help prioritize conservation decisions.
The model is designed to be replicable anywhere in the State of South Carolina.

This appendix also describes how to model corridors to connect the habitat cores.
The methodology presented in this appendix uses data available statewide to identify intact core habitat. The results of the methodology are very effective when used as a base from which to find opportunities and risks to an area’s highest-quality habitat. For example, by overlaying recreational trails data on top of the green infrastructure (GI) assets identified by this model, one might notice opportunities for extending an existing trail to improve recreational opportunities, as well as how to link two high-quality habitat cores.
The model presented here (and the maps produced with its results) should be updated as new data become available. No model can accurately capture all local knowledge, which is why it is important to supplement the results with knowledge, data, and priorities at the local level. In addition, local land-use decisions, such as zoning, water supply needs, tourism, natural resource economies and other considerations, will determine whether areas are more or less important to the community. These land uses will need to be considered when employing the model to set goals and determine opportunities.
The script tools that accompany this report automate the processes described in the pages that follow, but the methodology is presented here to help the user better understand the operations involved, as well as to make it easier to adapt the methodology should it be necessary. Government agencies, nonprofit groups, universities or other public interest agencies may obtain a digital copy of the tool and script instructions by contacting the Green Infrastructure Center.
NOTE: The exact steps presented in this walkthrough do not always match those performed by the script tool that accompanies this report. In cases where it proved more efficient to perform a task using options only available to Python scripting, it was done so as to improve performance and reduce script length. However, the end results are the same.
The model can be broken into four steps.
STEP 1: The first step identifies areas that have the potential to be part of a habitat core, such as forests, wetlands, water bodies and dunes. Agricultural fields are not considered eligible to be in a core.

STEP 2: The second step brings together features including roads, urbanized area, buildings, and railroads, which create significant disturbances and fragmentation effects. Any part of the habitat land (from Step 1) that is within 100 meters of a fragmenting feature is removed. Once this ‘edge habitat’ is taken out, individual cores of interior habitat are identified by calculating their area in acres. Habitat patches of less than 10 acres are also deleted.
Habitat patches with areas ranging from 10 to 100 acres are then classified as ‘habitat fragments’ and remain in the analysis, while habitat patches of greater than 100 acres are classified as cores.
The corresponding edge habitat of each core or habitat fragment, which was previously removed to calculate the size of each core, is then added back in.
STEP 3: After the cores have been identified, calculate a variety of statistics that describe each core and what is inside it, such as how many rare species there are. Some of these statistics are used in the final step to create a composite score that approximates each core’s ecological integrity and quality.
STEP 4: The final step ranks each core based on those key attributes that were calculated in Step Three. Each core is ranked according to ten attributes: area (acres); thickness (how many feet across at its widest); topographic diversity (standard deviation of elevation); species richness (mean predicted number of species); percent wetland cover; soil diversity (number of SSURGO associations); compactness ratio (optimal shape); stream density (linear feet per acre); and abundance of rare, threatened, and endangered species (number of total observations), and the diversity of rare, threatened, and endangered species (number of unique species observed).
They are divided into quintiles for each of the attributes mentioned, and given a score based on which quintile each core falls into. In other words, the cores are ranked against each another and then divided into 20 percent aggregations.
Each core is then scored for every attribute, for a total of ten scores, each ranging from one to five. A score of one indicates that the core’s score is lower than the 20th percentile when compared to the other cores being assessed. A score of five indicates that the core’s score is higher than the 80th percentile.
Each core’s ten scores are then summed, after being multiplied by the following weights:
Area 0.40
Thickness 0.10
Topographic Diversity 0.05
Species Richness 0.10
Percent Wetland Cover 0.05
Soil Diversity 0.03
Compactness Ratio 0.02
The raw surface area of a core is the single most important variable for supporting ecosystem functions.
Core thickness measures the radius of the largest circle that can be drawn within each core, without going outside the core. Interior habitat is important for many species, and this metric is also a measure of fragmentation.
There are higher diversity of communities where there is vertical stratification of land.
Predicted (modeled) number of species present, on average. Weight is less than actual observations (RTE Element Occurrences).
Wetlands are some of the most productive ecosystems, and provide a number of benefits including wildlife and fish habitat, water filtration and erosion and flood control.
Contributes to a potential diversity of plant communities.
The compactness ratio is the ratio between the area of the core and the area of a circle with the same perimeter as the core. This is one measure of ‘roundness’; a circular core functions better than an elongated core because the depth to its interior is more consistent and it has less edge compared to interior (all other things being equal).
Stream Density 0.10
Streams within interior forests are more likely to contain pristine aquatic conditions than unforested streams, in addition to providing valuable habitat, a source of water, and improving water quality. The greater the density of surface waters the more aquatic habitat is likely, which relates to greater potential for more diverse species of flora and fauna.
RTE Species Abundance 0.05
The raw number of observations. Weighted less than the number of unique species observed (since there may be many observations of a single species). Only observations since 1980 are included. Older observations may no longer be accurate.
RTE Species Diversity 0.10
The number of unique species observed in the core. Only observations since 1980 are included. For example, if there are 10 observations of rare, threatened, and endangered species inside a core, but nine of them are of the same species, the Species Diversity score would be 2.
Note that the resulting Core Quality Index (CQI) is relative and will not be comparable to results from another run of the model for a different location. For example, if two counties run the model individually, the results will not be comparable. However, if comparable results are desired, it is simply a matter of using the entire two-county region as the input area of interest. This approach avoids using hard thresholds that may not apply in all areas of the state, and also creates differentiation between core rankings within the area of interest where it may not exist if hard thresholds were used. This also allows localities to identify their best habitat relative to their area rather that compared to the entire state or region. This comparison could be made by running the model at two scales: for example, one local and one regional.
1. ArcGIS Desktop 10.1 or greater.
2. The Spatial Analyst Extension for ArcGIS for Desktop.
3. Python 2.7 and the Numpy site package for Python (both are installed by default when ArcGIS for desktop is installed).
4. An ArcInfo level license is required for certain features of the corridor model.
Your workspace is where you will save all of your output data and intermediate files. Create a new file geodatabase named GI_Network. It is recommended you place copies of all the input data layers (described below) into this geodatabase. The methodology assumes that the input data use the coordinate system parameters described below. You will need to project the input data layers that do not use this coordinate system by employing the PROJECT tool (not the DEFINE PROJECTION tool).
It is strongly recommended that you work only from local data (ie that you save a copy of your data to the hard drive of your workstation). Many problems can arise when geoprocessing tools in ArcGIS try to access data saved in a remote location (ie over the internet or an intranet), so it is best to work locally to reduce the chance of complications.
Coordinate System Parameters:
NAD_1983_UTM_Zone_17N
WKID: 26917 Authority: EPSG
Projection: Transverse_Mercator
False_Easting: 500000.0
False_Northing: 0.0
Central_Meridian: -81.0
Scale_Factor: 0.9996
Latitude_Of_Origin: 0.0
Linear Unit: Meter (1.0)
Environment settings are additional settings that affect the result of GIS tools, and are particularly important when manipulating raster data. When running tools in ArcGIS, environment settings can be accessed using the Environments… button at the bottom of the tool dialog box. If using ModelBuilder in ArcGIS, environments only need to be set once.
For this walkthrough, it will be assumed that the following environment settings will be used:
• Workspace: GI_Network
• Processing Extent: Same as your Land Use/Land Cover layer (after you have clipped it to your study area)
• Snap Raster: Same as your Land Use/Land Cover layer (after you have clipped it to your study area)
• Cell Size: 30 meters
Data set: Study_Area
Description: A polygon layer representing the area of interest (eg a county’s boundary).
Dataset: LULC
Description: Land Use/Land Cover data, in a raster format. Use of either the Cropland Data Layer or the National Land Cover Dataset is recommended.
Acquisition: Available from the USDA National Agricultural Statistics Service’s CropScape web portal (Cropland Data Layer) or The National Map viewer and download platform (National Land Cover Database).
Note: Although the script tool that accompanies this report accepts both the Cropland Data Layer and NLCD as valid inputs, values relating to land use/land cover will be presented here in terms of the CDL for the sake of brevity.
Dataset: NWI_wetlands
Description: National Wetlands Inventory.
Acquisition: U.S. Fish and Wildlife Service state download portal.
Dataset: SSURGO_soils
Description: Soil Survey Geographic Database (SSURGO 2.2).
Acquisition: National Resource Conservation Service data gateway.
Dataset: National Hydrography Dataset
Description: The National Hydrography Dataset represents water features. The three pieces of the dataset used in this methodology are ‘flowlines’, ‘areas’, and ‘waterbodies’. These are represented in three separate feature classes (hereafter referred to as NHD_flowline, NHD_area and NHD_waterbody).
Acquisition: The National Map viewer and download platform.
Dataset: species_richness
Description: South Carolina Species Richness raster dataset, created as part of the GAP program.

Acquisition: South Carolina Department of Natural Resources GAP analysis download portal.
Dataset: element_occurrences
Description: South Carolina Rare, Threatened, and Endangered Species inventory.
Acquisition: South Carolina Department of Natural Resources.
Dataset: dem
Description: A digital elevation model for the area of interest.
Acquisition: The National Map viewer and download platform.
Dataset: roads
Description: Interstates, highways, and local roads. Note that SCDOT provides roads maintained by SCDOT and roads not maintained by SCDOT in two separate files.
Acquisition: South Carolina Department of Transportation GIS/Mapping portal.
Dataset: rr_tracks
Description: Railroad tracks.
Acquisition: South Carolina Department of Transportation GIS/Mapping portal.
Dataset: buildings
Description: Building locations
Acquisition: May be included in local government databases.
Dataset: NOAA_CCAP
Description: Coastal Land Use (NOAA C-CAP).
Acquisition: The NOAA Coastal Services Center C-CAP download portal.
Ad ministrative boundaries are rarely the best boundaries to use when assessing landscape features. This is especially true in the case of green infrastructure, where shape, size, and connectivity are key features that influence conservation priorities.
While only a small portion of a core may exist within your area of interest, it may be integral to a larger, high-value network in a neighboring state, county, council of governments region or watershed. If only the small portion is assessed, much of its conservation value may be missed. Therefore, it is recommended to use a buffer around the area of interest to expand the study area. A minimum buffer size of 10 kilometers (approx. 6 miles) is recommended, but a larger buffer will capture more landscape features and increase the accuracy of the model outside the study area. Take note of any special landscape features that may require the use of a larger buffer, such as large river watersheds and mountain ranges.
Try to obtain data for the entire buffer area, not just the area of interest. In many cases, data can be acquired for the entire area of interest at once, but will occasionally require piecing together datasets from multiple jurisdictions. Note that the following walkthrough will assume all data layers are clipped to the entire buffer area that you have chosen for your area of interest. Clipping your data is strongly recommended to reduce processing time. Use the CLIP (ANALYSIS) (for vector data) and CLIP (DATA MANAGEMENT) (for raster data) to create subsets of the layers covering only the area of interest.
• Names of files and workspaces are in italics
• CAPITAL letters indicate a GIS tool
• Quotation marks ( “” ) are placed around the names of attribute fields.
• Key strokes and menu items are in Bold.
• SQL, Python, and Raster Calculator expressions are denoted with this font
Note that in cases where a tool’s default parameter is used, it is not specified in this walkthrough.
Wherever the Field Calculator is used, the Parser will be set to ‘Python’ (not VB Script). This is done by selecting the appropriate radio button at the top of the Field Calculator dialog.
Objective: Identify the landscapes that can contribute to a habitat core.
1. RECLASSIFY LULC to extract forest, wetland, and aquatic habitats.
a. Input: LULC
b. Reclass Field: “VALUE”
c. Reclassification (the values shown are for the CDL. NLCD will use different values):
i. [0 – 110, 112 – 140, 144 – 189, 191 – 194, 196 – 255, NoData] : 0
ii. 111 : 1 (open water)
iii. 141 – 143 : 1 (forest classes)
iv. 190 : 1 (woody wetlands)
v. 195 : 1 (herbaceous wetlands)
d. Output: corehab_lu
2. SELECT only natural wetlands from NWI_wetlands (not ditched, farmed, excavated, or artificial)
a. Input: NWI_wetlands
b. Output: wetlands_select
c. Expression: ATTRIBUTE NOT LIKE ‘%d’ AND ATTRIBUTE NOT LIKE ‘%f’ AND ATTRIBUTE NOT LIKE ‘%r’ AND ATTRIBUTE NOT LIKE ‘%x’
3. Convert the selected wetlands to raster with FEATURE TO RASTER.
a. Input: wetlands_select
b. Field: “ATTRIBUTE”
c. Output: wetlands_r
4. RECLASSIFY the selected wetlands to a binary raster.
a. Input: wetlands_r
b. Reclass Field: “VALUE”
c. Reclassification:
i. 0 – 9999999: 1
ii. NoData: 0
d. Output: corehab_wet
If the area of interest is not within 5 kilometers of the Atlantic coastline, you can skip to Step 9.
5. SELECT ocean features from NHD_area features
a. Input: NHD_area
b. Output: ocean_poly
c. Expression: FType = 445
6. Run EUCLIDEAN DISTANCE to find areas that are within 5 kilometers of the Atlantic coast.
a. Input: ocean_poly
b. Output: ocean_5km
c. Maximum distance: 5001
7. Find coastal land uses within 5 km of the coast with EXTRACT BY MASK
a. Input raster: NOAA_CCAP
b. Input raster or feature mask data: ocean_5k
c. Output: ccap_coast
8. RECLASSIFY ccap_coast to identify coastal core habitat
a. Input: ccap_coast
b. Reclass Field: “VALUE”
c. Reclassification:
i. [0 – 7, 21, 23 – 255, NoData] : 0
ii. [8 – 20, 22] : 1 (natural features)
d. Output: corehab_coast
9. Combine core habitat rasters with CELL STATISTICS.
a. Input rasters or constant values: corehab_lu, corehab_wet, corehab_coast (if using coastal data)
b. Output: core_habitat
c. Overlay statistic: MAXIMUM
Objective: A fter identifying the areas that can contribute to habitat cores, we will now use additional data to assess fragmentation. After fragmentation has been assessed, individual cores take shape.
10. SEL ECT only paved roads. It is recommended to use roads data from a local source (e.g. County GIS database). If you download roads data from the South Carolina Department of Transportation’s GIS portal, the roads data may be distributed in two datasets: highways (maintained by SCDOT); and other/local roads (not maintained by SCDOT). In this case, repeat this step for each dataset.
a. Input: roads
b. Output: roads_paved

c. Expression: This expression will vary depending on the way the roads attributes are organized. An example SQL expression that selects paved roads would be ROAD_CLASS = ‘County_paved’ OR ROAD_CLASS = ‘State_Highway’ OR ROAD_CLASS = ‘Interstate’. If the dataset has a unique attribute that indicated if a road is paved or not, the expression will be very simple, for example: PAVED = ‘Yes’
11. Covert the roads data to raster with FEATURE TO RASTER
a. Input: roads_paved
b. Field: Use the field that was used to determine if the roads was paved (see “ROAD_CLASS” from the example SQL query from the previous step.
c. Output: roads_paved_r
12. RECLASSIFY roads_paved_r to a binary raster.
a. Input: roads_paved_r
b. Reclass Field: “VALUE”
c. Reclassification:
i. Table 0 – 9999999: 1
ii. NoData: 0
d. Output: roads_frag
R ailroad Tracks
13. Convert railroads to raster with FEATURE TO RASTER
a. Input: rr_tracks
b. Field: OBJECTID
c. Output: rail_r
14. RECLASSIFY rail_r to a binary raster.
a. Input: rail_r
b. Reclass Field: “VALUE”
c. Reclassification:
i. 0 – 9999999: 1
ii. NoData: 0
d. Output: rail_frag
15. Extract fragmenting features from LULC with RECLASSIFY
a. Input: LULC
b. Reclass Field: “VALUE”
c. Reclassification:
i. [0 – 120, 132 - 255] : 0
ii. 121 – 131: 1
d. Output: lu_frag
If building location information is not available, skip to Step 19.
If bui lding location information is in point format (eg address point), skip to Step 18. Otherwise, convert the polygon data (e.g. building footprint polygon) to points with Feature to Point. Note that this tool requires an ArcInfo level license to run. If you do not have an ArcInfo level license, GIC has created a tool that that can be used in its place. See the Selected Script Code section at the end of this appendix for the script code, or use the FIND CENTROIDS tool included in the ArcGIS toolbox file provided with this guide.
16. Use ADD FIELD to add a new field to your building points file.
a. Field Name: “RASNUM”
b. Field Type: SHORT
17. Use CALCULATE FIELD to populate the new “RASNUM” field with the number 1.
a. Field Name: “RASNUM”
b. Expression: 1
18. Convert the building points to raster with FEATURE TO RASTER.
a. Input: Your building points file
b. Field: “RASNUM”
c. Output: bldg_frag
Skip to step 21 if your area of interest is not within 5 kilometers of the Atlantic coast.
19. Find ‘Developed’ land uses in LULC to override coastal data (assuming LULC data is more current than the coastal land use data) using RECLASSIFY.
a. Input: LULC
b. Reclass Field: “VALUE”
c. Reclassification:
i. Table [0 – 120, 125 - 255] : 0
ii. 121-124 : 1
d. Output: lu_developed
20. Now execute an expression that will create a new lu_frag raster. This new raster will only be changed if a cell is within 5 kilometers from the coast, and will use land use data from the NOAA_CCAP layer unless an area has been identified as ‘Developed’, in which case it will override the CCAP data. This step assumes that the LULC data is more current, which is why we want to capture the developed areas using this dataset. However, the CCAP data better identifies land uses along the coast, which is why we will use that to modify the lu_frag raster so we do not incorrectly consider an area fragmented (the identification of beaches/dunes is one of the primary reasons for using a 5 kilometer threshold. The value of using the CCAP drops after about 5km because it no longer captures beaches and dunes). Use the RASTER CALCULATOR tool (note that you will have to add the necessary input layers (corehab_coast, lu_developed, and lu_frag) to the map view for them to show up in the Raster Calculator dialog).
a. Expression: Con((“corehab_coast” == 1) & (“lu_developed” != 1), 0, “lu_frag”)
b. Output: lu_frag_mod
A ssess Fragmentation
21. Combine all fragmenting features with CELL STATISTICS.
a. Input rasters or constant values: roads_frag, rail_ frag, bldg_frag (if you completed Steps 16-18), and lu_frag (or lu_frag_mod if you completed Steps 19-20).
b. Output: frag_raster
c. Overlay statistic: MAXIMUM
22. Extract fragmenting cells with EXTRACT BY ATTRIBUTES
a. Input: frag_raster
b. Where clause: Value = 1
c. Output: frag_cells
23. Identify edge habitat zones with EUCLIDEAN DISTANCE
a. Input: frag_cells
b. Output: edge_zone
c. Maximum distance: 100
24. Remove edge zones from core habitat raster to identify interior core area. Use the RASTER CALCULATOR.
a. Expression: Con(IsNull(“egde_zone”), “core_ habitat”, 0)
b. Output: cores_raw
25. Remove cores outside the area of interest with EXTRACT BY MASK.
a. Input: cores_raw
b. Input feature mask data: Study_Area
c. Output: cores_aoi
26. Use REGION GROUP to identify unique cores.
a. Input: cores_aoi
b. Output: cores_reggrp
c. Number of neighbors to use: FOUR
d. Zone grouping method: WITHIN
e. Add link field to output: unchecked (false)
f. Excluded value: 0 (zero)
27. Use EXTRACT BY ATTRIBUTES to remove cores less than 10 acres in size. This operation will select only those cores that are composed of more than 45 cells, which is approximately 10 acres when using a cell size of 30 meters.
a. Input: cores_reggrp
b. Where clause: Count >= 45
c. Output: cores_culled
28. Set background value to NoData with SET NULL
a. Input conditional raster: cores_culled
b. Expression: Value = 0
c. Input false raster: cores_culled
d. Output: cores_nonull
29. Find potential edge areas surrounding the newly identified cores using EUCLIDEAN ALLOCATION.
a. Input Raster: cores_nonull
b. Minimum Distance: 90 (strict interpretation to preserve separation between cores).
c. Output Raster: cores_ca
30. Add back in edge habitat if it is a natural land cover type using the RASTER CALCULATOR.
a. Expression: Con((cores_ca & core_habitat), cores_ca)
b. Output: cores_final
31. Convert the cores_final raster to a polygon layer with RASTER TO POLYGON. This will be the primary cores layer.
a. Input: cores_final
b. Field: “Value”
c. Output: Cores_poly
d. Simplify Polygons: Unchecked (False) is recommended unless you are having performance problems with non-simplified polygons.
Objective: Now that unique cores have been identified, several metrics will be calculated for each one. These statistics will be used to help rank and prioritize the cores, in addition to providing useful measurements about the composition of each core.
Calculate G eometric Statistics For Each Core
32 . Calculate geometric statistics with ZONAL GEOMETRY AS TABLE. This step will create a new table that includes the Area, Thickness, Perimeter, and Centroid Coordinates of each core.
a. Input feature zone data: Cores_poly
b. Zone field: “gridcode”
c. Output table: geo_stats
Calculate the Topographic Diversity of Each Core
33. Calcu late topographic diversity with ZONAL STATISTICS AS TABLE.
a. Input feature zone data: Cores_poly
b. Zone field: “gridcode”
c. Input value raster: dem
d. Statistics type: STD
Calculate Average Species R ichness For Each Core
34. Calculate the average species richness with ZONAL STATISTICS AS TABLE.
a. Input feature zone data: Cores_poly
b. Zone field: “gridcode”
c. Input value raster: species_richness
d. Statistics type: MEAN
Calculate the A mount of Aquatic Habitat In Each Core
35. SELECT bodies of water that are lakes, ponds, or reservoirs.
a. Input: NHD_waterbody
b. Output: waterbody_select
c. Expression: FType = 390 OR FType = 436
36. Convert selected water bodies to raster with FEATURE TO RASTER.
a. Input: waterbody_select
b. Field: “FType”
c. Output: waterbody_r
37. Create a binary raster with the RASTER CALCULATOR.
a. Expression: Con(IsNull(“waterbody_r”), 0, 1)
b. Output: waterbodies
38. SELECT other water areas (of type ‘SeaOcean’, ‘StreamRiver’, and ‘CanalDitch’).
a. Input: NHD_area
b. Output: waterarea_select
c. Expression: FType = 336 OR FType = 445 OR FType = 460
39. Covert selected water areas to raster with FEATURE TO RASTER.
a. Input: waterarea_select
b. Field: “FType”
c. Output: waterarea_r
40. Create a binary raster with the RASTER CALCULATOR.
a. Expression: Con(IsNull(“waterarea_r”), 0, 1)
b. Output: waterareas
41. Combine waterbodies and waterareas with BOOLEAN OR.
a. Input raster 1: waterbodies
b. Input raster 2: waterareas
c. Output: water_cells
42. Count the water cells in each core with ZONAL STATISTICS AS TABLE.
a. Input zone data: Cores_poly
b. Zone field: “gridcode”
c. Input value raster: water_cells
d. Output table: water_stats
e. Statistics type: SUM
Calculate the A mount of Wetland Habitat In Each Core
43. SEL ECT features from NWI_wetlands
a. Input: NWI_wetlands
b. Output: wetcount_select
c. Expression: WETLAND_TYPE = ‘Estuarine and Marine Wetland’ OR WETLAND_TYPE = ‘Freshwater Emergent Wetland’ OR WETLAND_TYPE = ‘Freshwater Forested/Shrub Wetland’
44. Covert selected wetlands to raster with FEATURE TO RASTER.
a. Input: wetcount_select
b. Field: “WETLAND_TYPE”
c. Output: wetcount_r
45. Create a binary raster with the RASTER CALCULATOR.
a. Expression: Con(IsNull(“wetland_r”), 0, 1)
b. Output: wetcount_cells
46. Count the wetland cells in each core with ZONAL STATISTICS AS TABLE.
a. Input zone data: Cores_poly
b. Zone field: “gridcode”
c. Input value raster: wetcount_cells
d. Output table: wetland_stats
e. Statistics type: SUM
Calculate S oil Diversity In Each Core
In the event that your SSURGO soils data was downloaded in separate files (for example, by county), you will need to merge all soils data for your area of interest into a single file. The GIC has created a script to automate this in the event that you have many separate files to merge. See Selected Script Code section at the end of this appendix for the script code, or use the Merge SSURGO Soils tool included in the ArcGIS toolbox file provided with this guide.
47. Convert soils data to raster with FEATURE TO RASTER.
a. Input: SSURGO_soils
b. Field: “MUKEY”
c. Output: soils_r
48. Count the variety of soil types in each core with ZONAL STATISTICS AS TABLE.
a. Input zone data: Cores_poly
b. Zone field: “gridcode”
c. Input value raster: soils_r
d. Output table: soil_stats
e. Statistics type: VARIETY
Calculate the A bundance of R are, T hreatened, and Endangered (RTE) Species In Each Core
49. Select only element occurrences that have been observed since 1980.
a. Input: element_occurrences
b. Output: rte_select
c. Expression: LAST_OBSER LIKE ‘198%’ OR LAST_OBSER LIKE ‘199%’ OR LAST_OBSER LIKE ‘20%’
50. Count the number of RTE species that have been observed in each core with SPATIAL JOIN.
a. Target Features: Cores_poly
b. Join Features: rte_select
c. Output: abundance_stats
d. Join Operation: JOIN_ONE_TO_ONE
e. Keep All Target Features: checked (true)
f. Match Option: INTERSECT
Calculate the Diversity of R are, T hreatened, and Endangered (RTE) Species In Each Core 51. IN TERSECT Cores_poly and element_occurrences.
a. Input 1: Cores_poly
b. Input 2: rte_select (from step 49)
c. Output: diversity_int
52. DISSOLVE based on the core ID and each unique species.
a. Input: diversity_int
b. Output: diversity_dis
c. Dissolve Fields: “SNAME”, “gridcode” (check both)
53. Use SUMMARY STATISTICS to find the number of unique species occurring in each core.
a. Input: diversity_dis
b. Output: diversity_stats
c. Statistics Field: “SNAME”
d. Statistic Type: COUNT
e. Case Field: “gridcode”
Calculate the Total L ength of Streams In Each Core
54. SELECT streams for the centerline calculations.
a. Input: NHD_flowline
b. Output: flowline_select
c. Expression: FType = 460 OR FType = 558
55. Find the streams in each core with INTERSECT.
a. Input 1: Cores_poly
b. Input 2: flowline_select
c. Output: core_stream_int
56. Sum all stream lengths for each core using SUMMARY STATISTICS.
a. Input: core_stream_int
b. Output: stream_stats
c. Statistics fields: “Shape_Length”
d. Statistic Type: SUM
e. Case field: “gridcode”
Add Metrics To the Master Core L ayer
57. Add new fields to Cores_poly to hold the metrics. Repeat this step for each new field listed below (run the Add Field tool repeatedly), or run the Add Field tool in ‘batch’ mode. All inputs will remain the same except for the field name of the field being added.
a. Input table: Cores_poly
b. Field Names: “AREA”, “PERIMETER”, “THICKNESS”, “XCENTROID”, “YCENTROID”, “TOPO_STD”, “S_RICHNESS”, “WATER_AREA”, “WET_AREA”, “SOIL_ DIV”, “COMPACT”, “PA_RATIO”, “STRM_ LEN”, “RTE_ABUND”, “RTE_DIV”.
c. Field type: DOUBLE
58. This step will involve joining the tables containing the metrics to the master Cores_poly feature class. To join a field to the Cores_poly layer, first add it to your map in ArcMap. Right click on the layer name in the table of contents, mouse over ‘Joins and Relates’, and click ‘Join…’. Alternatively, you can use the JOIN FIELD tool.
For each join table in the list below, several steps will be required.
1. Join the table to Cores_poly
2. Populate the appropriate field in Cores_poly using the expression provided
3. Remove the join before performing the next join. Repeat the preceding three steps for each join table: geo_stats, topo_stats, bio_stats, water_stats, wetland_stats, soil_stats, stream_stats, abundance_stats, diversity_stats.
Note that each join will be based on the “gridcode” field, which is the common field in both Cores_poly and each join field, except for the geo_stats table, which will use the “VALUE” field to join to the Cores_poly “gridcode” field.
After the respective table has been joined, use the Field Calculator to populate the appropriate field(s) in Cores_poly, using the expression provided. To calculate a field, open the attribute table of Cores_poly, right click on the name of the field you wish to calculate, and click Field Calculator…
After geo_stats has been joined:
• Calculate the field “AREA” using the following expression, which converts square meters to acres:
– [geo_stats.AREA] / 4046.86
• Ca lculate the field “PERIMETER” using the following expression, which converts meters to feet:
– [geo_stats.PERIMETER] * 3.28084
• Calculate the field “THICKNESS” using the following expression, which converts meters to feet:
– [geo_stats.THICKNESS] * 3.28084
• Ca lculate the field “XCENTROID” using the following expression:
– [geo_stats.XCENTROID]
• Calculate the field “YCENTROID” using the following expression:
– [geo_stats.YCENTROID]
After topo_stats has been joined:
• Calculate the field “TOPO_STD” using the following expression:
– [topo_stats.STD]
After bio_stats has been joined:
• Calculate the field “S_RICHNESS” using the following expression:
– [bio_stats.MEAN]
After water_stats has been joined:
• Calculate the field “WATER_AREA” using the following expression, which converts square meters to acres, assuming a cell size of 30 meters:
– ([water_stats.SUM] * 900) / 4046.86
After wetland_stats has been joined:
• Calculate the field “WET_AREA” using the following expression, which converts square meters to acres, assuming a cell size of 30 meters:
– ([wetland_stats.SUM] * 900 ) / 4046.86
After soil_stats has been joined:

• Calculate the field “SOIL_DIV” using the following expression:
– [soil_stats.VARIETY]
After stream_stats has been joined:
• Calculate the field “STRM_LEN” using the following expression, which converts meters to feet. The expression also gives a value of zero should the total stream length be a null value in the stream_stats table. Be sure to select the Python radio button under Parser, and to check Show Codeblock
– Pre-Logic Script Code (Note that the second and third lines are indented exactly two spaces):
def Calc_Stream_Length( meters ):
length = meters * 3.28084 if meters is not None else 0 return length
– Cores_poly.STRM_LEN =
Calc_Stream_Length( !stream_stats.SUM_Shape_Length! )
After abundance_stats has been joined:
• Calculate the field “RTE_ABUND” using the following expression:
– [abundance_stats.Join_Count]
After diversity_stats has been joined:
• Calculate the field “RTE_DIV” using the following expression. The expression also gives a value of zero (0) should the number of unique species be a null value in the diversity_stats table. Be sure to select the Python radio button under Parser, and to check Show Codeblock .
– Pre-Logic Script Code (Note that the second and third lines are indented exactly two spaces):
def Calc_Div(frequency):
diversity = frequency if frequency is not None else 0 return diversity
– Cores_poly.RTE_DIV =
Calc_Div( !diversity_stats.FREQUENCY! )
59. Use the Field Calculator to calculate the “COMPACT” field, which will contain the compactness ratio of each core. The compactness ratio is the ratio between the area of the core and the area of a circle with the same perimeter as the core. Note that in the code below, the ratio is multiplied by a modifier to avoid extremely small numbers:
a. Field calculator Pre-Logic Script Code: def Calc_Compactness(perimeter, area ): radius = float(perimeter) / ( 2*math.pi ) core_area = float(area) area_circle = math.pi * math.pow( radius, 2 ) compactness = core_area / area_circle return compactness * 100000
b. COMPACT = Calc_Compactness( !PERIMETER!, !AREA! )
60. Use the Field Calculator to calculate the “PA_RATIO” field, which will contain the perimeter to area ratio for each core. The P/A ratio is the ratio between a core’s perimeter and its area:
a. PA_RATIO = [PERIMETER] / [AREA]
Part 4: Calculating the Core Quality Index
61. Add a new field to Cores_poly that will hold the score:
a. Input table: Cores_poly
b. Field Name: “SCORE”
c. Field Type: DOUBLE
62. Use the Field Calculator to calculate the “SCORE” field. Paste the code below into the pre-logic script code. For each attribute being used in the ranking (e.g. thickness), the script makes a list containing the value of every core. Based on these values, the cores are divided in quintiles for each ranking attribute and given a score corresponding to their quintile, 1 through 5, with 1 being the lowest score (values in the 20th percentile). The scores for each value are then added, with a weighting factor applied to each score. In the very first line, replace the placeholder text with the path to your Cores_poly file. Make sure that you follow the indentation rules of Python – use indentation levels of two or four spaces. Your code should use the same indentation as the Pre-Logic Script Code below. Also, when a line was too long to fit on the page and had to run onto a new line, it is denoted with this symbol [ → ]. In these cases, this should not be a new line in the code. The format for your path should look something like this:
“
C:/GI_Network/cores_poly”
Notice that forward slashes are used, not back slashes. The quotation marks should also be included.
a. Pre-Logic Script Code:
Cores_poly = “ADD YOUR PATH HERE”
import arcpy, numpy ranking_fields = [“AREA”, “THICKNESS”, “TOPO_STD”, “S_RICHNESS”, “WET_AREA”, “SOIL_DIV”, “COMPACT”, “STRM_LEN”, “RTE_ABUND”, “RTE_DIV”]
stats_master = {}
quintile_breaks = {}
for i in ranking_fields: stats_master[i] = [] quintile_breaks[i] = []
with
arcpy.da.SearchCursor(Cores_poly, ranking_fields) as cursor: for row in cursor:
stats_master[“AREA”].append(row[0]) stats_master[“THICKNESS”].append(row[1]) stats_master[“TOPO_STD”].append(row[2]) stats_master[“S_RICHNESS”].append(row[3]) stats_master[“WET_AREA”].append(row[4]/row[0])
# Normalized by area (% Wetlands) stats_master[“SOIL_DIV”].append(row[5]) stats_master[“COMPACT”].append(row[6]) stats_master[“STRM_LEN”].append(row[7]/row[0]) # Normalized by area (i.e. feet of stream per acre) stats_master[“RTE_ABUND”].append(row[8]) stats_master[“RTE_DIV”].append(row[9])
for i in ranking_fields:
values = numpy.array(stats_master[i]) for break_point in range(20, 101, 20): quintile_breaks[i].append(numpy.percentile(values, break_point)) quintile_breaks[i].sort()
def Score(value, break_points):
if value <= break_points[0]:
return 1
elif value <= break_points[1]:
return 2
elif value <= break_points[2]:
return 3 elif value <= break_points[3]:
return 4 else:
return 5
def Calc_Score_Field(area, thickness, topo_std, s_richness, wet_area, soil_div, compact, strm_len, rte_abund, → rte_div):
area_score = Score(area, quintile_breaks[“AREA”])
thick_score = Score(thickness, quintile_breaks[“THICKNESS”])
topo_score = Score(topo_std, quintile_breaks[“TOPO_STD”])
species_score = Score(s_richness, quintile_breaks[“S_RICHNESS”])
wetland_score = Score(wet_area/area, quintile_breaks[“WET_AREA”]) # Normalized by area (% Wetlands)
soil_score = Score(soil_div, quintile_breaks[“SOIL_DIV”])
compact_score = Score(compact, quintile_breaks[“COMPACT”])
stream_score = Score(strm_len/area, quintile_breaks[“STRM_LEN”]) # Normalized by area (i.e. feet of
→ stream per acre)
rte_abund_score = Score(rte_abund, quintile_breaks[“RTE_ABUND”]) rte_div_score = Score(rte_div, quintile_breaks[“RTE_ABUND”]) score = (area_score*0.4)+(thick_score*0.1)+(topo_score*0.05)+(species_score*0.1)+(wetland_score*0.05)+
→(soil_score*0.03)+(compact_score*0.02)+(stream_score*0.1)+(rte_abund_score*0.05)+(rte_div_score*0.1) return score
b. SCORE = Calc_Score_Field( !AREA! , !THICKNESS! , !TOPO_STD! , !S_RICHNESS! , !WET_ AREA! , !SOIL_DIV! , !COMPACT! , !STRM_ LEN! , !RTE_ABUND! , !RTE_DIV! )
Calculate the Size Class For Each Core
63. Th is step will add an additional attribute that will indicate whether each core is a Large, Medium, or Small core, or a Habitat Fragment. First, add a new field to cores poly that will hold the size class.
a. Input table: Cores_poly
b. Field Name: “CLASS”
c. Field Type: TEXT
64. Use the field calculator to populate the new “CLASS” field with the appropriate value:
a. Field calculator Pre-Logic Script Code:
def Calc_Core_Class(area, water_area): if area-water_area < 100: return “Habitat Fragment”
elif area-water_area < 1000: return “Small”
elif area-water_area < 10000: return “Medium”
else: return “Large”
b. COMPACT = Calc_Core_Class( !AREA!, !WATER_AREA!)
To use the script tools that accompany this guide to automate the process described above, first add the toolbox to your current session of ArcMap or ArcCatalog.
Double click on South Carolina GI Tool to open the tool interface, which looks like this:


If the Help sidebar is not visible when you open the tool, click Show Help at the bottom of the dialog box to make it visible. This sidebar will describe what the tool expects for each of the input parameters. As you click on each Input text box, the text in the sidebar will change to display the relevant description.
As d iscussed in Chapter 7, “least cost path” analysis can be used to identify potential corridors across the landscape that can serve as connections that allow for the movement of plants and animal across the landscape.
At the highest level, performing a least cost path analysis requires two overarching steps:
1. Create an impedance raster.
2. Run the LEAST COST PATH tool (“Cost Path” tool in ArcGIS).
An impedance raster is a raster dataset that estimates the “cost” to travel across the landscape, cell by cell. The cost can be described in specific units, such as minutes, or in relative values (ie a cell with a value of 5 is five times more costly to travel across than a cell with a value of 1). The values must be numeric units.
To create an impedance raster, it is recommended to first create a ‘base’ raster using land cover data. This can be done by using the RECLASSIFY tool to reclassify the values in the land cover raster. The new values will represent the cost to travel through that particular land cover type.
Once you have the base raster, you can use other data layer to increase (make travel more costly) or decrease (make travel less costly) the values on the base raster. These can be thought of as ‘bonuses’ and ‘penalties’ to travel.
For examples, penalties to travel can be factors such as proximity to major roads, proximity to urbanized land and steep slopes. You can then create a raster for each factor that represents how large of a penalty to travel that factor represents. Then, you can combine all of the individual factors into a single raster that represents all penalties. Where penalties overlap, they are added together (this can be done using the RASTER CALCULATOR tool in ArcGIS). The same process can be done for bonuses.
Finally, you can modify the base raster with the penalties and bonuses. You add the penalties and subtract the bonuses
because a penalty means increasing the travel time, and thus increasing the value on the impedance raster.
Therefore:
Final Impedance Raster = (Base Raster) + (Penalties Raster) – (Bonus Raster)
In order to run a least cost path analysis, you first need to decide upon an origin and destination: Where does the path start and end? Your goal is to connect your habitat cores using this analysis. Therefore, these will act as nodes in your network of corridors, serving as origins and destinations.
There are several ways to approach the question of which cores serve as origins and which serve as destinations. Some examples are:
• Manua lly select cores to serve as origins and destinations.
For example, only the largest or most ecologically significant cores could be selected as origins and destinations, and least cost paths could be created between them.
Alternatively, cores at the edge of the area of interest may be selected as origins and destinations, and by creating least cost paths between them a network across the entire study area is created. Mapping rules for core selection are necessary in order to allow this process to be automated.
• Creating a least cost path between each core and every other core.
This can be automated if cores are chosen based on objective factors such as size.
• Creating a least cost path between each core and nearby cores.
Since the first example is manual and subjective, it will not be discussed further here. The second example can be performed relatively simply using Python to loop through all of the cores, creating many least cost paths (corridors) and then combining them at the end. Example Python code that accomplishes this is presented at the end of this section. The third example is too complex to fully lay out here, which is why an automated tool was made. This tool is described in the section Using the Automated Script Tools to Model Habitat Corridors.
#Import arcpy and set environments, relative pathways. print “Running script...”
import sys, os print ‘sys.argv[0] =’, sys.argv[0] pathname = os.path.dirname(sys.argv[0])
print ‘path =’, pathname print ‘full path =’, os.path.abspath(pathname)
import arcpy from arcpy import env from arcpy.sa import * pathname = os.path.dirname(sys.argv[0])
env.workspace = pathname + “\GI Network.gdb”
env.overwriteOutput = True env.extent = “study_area”
if arcpy.CheckExtension(“spatial”) == “Available”: print “Spatial Analyst is available.” arcpy.CheckOutExtension(“spatial”)
print “Spatial Analyst is checked out.”
#Variables for script.
bklink = arcpy.CreateUniqueName(“backlink”)
#Reduce imp_all_math to study area using extract by mask. cost = arcpy.sa.ExtractByMask(“imp_all_math”, “study_area”) cost.save(“imp_all”)
print “Cost distance raster reduced to study area to avoid unnecessary calculations.”
#List nodes in workspace for geoprocessing. listNodes = arcpy.ListFeatureClasses(“Node*”)
print “Nodes found: “ + str(listNodes)
#Execute CostDistance for listNodes. for node in listNodes:
outCostDist = arcpy.sa.CostDistance(node, cost) outCostDist.save()
print “A Node’s cost distance has been calculated.”
listCostDist = arcpy.ListRasters(“CostD*”)
print “Node Cost Distance rasters created: “ + str(listCostDist)
#Execute BackLink for listNodes. for node in listNodes: outBkLnk = arcpy.sa.CostBackLink(node, “imp_all”) outBkLnk.save()
print “A Node’s cost backlink has been calculated.”
listBkLnk = arcpy.ListRasters(“CostB*”)
print “Node Cost Back Link rasters created: “ + str(listBkLnk)
#Execute Cost Path to for listCostDist and listBkLnk. for costdist in listCostDist: for costbk in listBkLnk: for node in listNodes: coreCoPa = arcpy.sa.CostPath(node, costdist, costbk, “EACH_ ZONE”, “CoreID”) coreCoPa.save()
print “A Cost Path has been created.” listCoPa = arcpy.ListRasters(“CostPat*”)
print “Cost Paths created: “ + str(listCoPa)
#Add Cost Paths together using raster calculator. SingleCoPa = arcpy.sa.CellStatistics(listCoPa, “SUM”, “”) SingleCoPa.save(“Combined_CoPa”)
print “Cost Paths have been combined.”
#Convert Cost Path raster into shapefile. CoPaPo = arcpy.RasterToPolygon_conversion(“Combined_CoPa”, “CoPaPoly”)
print “Combine Cost Paths have been converted to a polygon.”
#Buffer Cost Path shapefile by 300meters. arcpy.Buffer_analysis(“CoPaPoly”, “CoPaPoly_Buff”, “300 METERS”, “FULL”, “”)
print “Combined Cost Path polygon has been buffered by 300 meters.”
#Reclassify LULC to identify natural land cover. lulc = arcpy.sa.Reclassify(“LULC”, “Value”, RemapRange([[10,42,0],[50,101,1],[200,208,0],[209,210,1]]), “NODATA”)
lulc.save(“LULCNat”)
print “Reclassified LULC data to identify natural land cover.”
#Convert LULC natural land cover to polygon.
arcpy.RasterToPolygon_conversion(“LULCNat”, “LULCNatural_poly”, “NO_SIMPLIFY”, “Value”) print “Converted LULC to polygon.”
#Intersect buffered cost paths with LULC natural land cover to identify potential wildlife corridors. arcpy.Intersect_analysis([“CoPaPoly_Buff”, “LULCNatural_poly”], “Wldlf_Corr”)
print “Intersected buffered cost paths with natural land cover to identify wildlife corridors.”
#Dissolve Wildlife Corridors to simplify data. arcpy.Dissolve_management(“Wldlf_Corr”, “Wildlife_Corridors”) print “Dissolved wildlife corridors to simplify data.”
arcpy.CheckInExtension(“spatial”) print “Spatial Analyst has been checked in.” print “Script complete.”
The script tools that accompany this guide can be used to model potential habitat corridors between the cores created using the methodology detailed in the first part of this chapter. To use the script tool to model corridors, first add the toolbox to your current session of ArcMap or ArcCatalog. Double click on Corridor Analysis. This will open the tool’s dialog, shown BLANK.
If the Help sidebar is not visible when you open the tool, click Show Help at the bottom of the dialog box to make it visible. This sidebar will describe what the tool expects for each of the input parameters. As you click on each Input text box, the text in the sidebar will change to display the relevant description. The output from the Habitat Cores model is required to run this tool.
This tool completes both operations required to perform a habitat corridor analysis: creating an impedance raster and finding least cost paths between cores. Specifically, the tool:
• Reclassifies the input land cover layer into a base impedance raster.
• Creates rasterized versions of Bonuses and Penalties.
• Subtracts the bonuses and adds the penalties to the base impedance raster.
• Selects highly ranked cores based on their CQI score and finds the centroid of each.

• Determines the cost distance for each node (centroid).
• Determines the cost backlink for each node.
• Performs a cost path operation between each node and every other node; or between each node and its neighboring nodes.
• Converts each least cost path from a raster to polyline.
• Combines all polylines into a single feature class.
• Buffers the least cost paths by 150 meters (to create 300 meter wide corridors).
• Saves the buffered corridors (“Corridors_raw”) to the specified workspace.
• Finds natural land cover types from the land cover raster.
• Creates a polygon layer of natural land cover.
• Intersects the corridors with the natural land cover to show which areas of the potential corridors are currently forested/natural.
• Saves the intersected corridors (“Wildlife_Corridors”) in the specified workspace.
Note: The option to compute least cost paths only between neighboring cores requires an ArcInfo level license to use. This is because the generation of thiessen polygons is necessary in the workflow, and the functionality to do this is limited to the highest level license.
There are a number of variables and assumptions that are used during this process. For example, the CQI score that a core must achieve to be considered a node in the analysis may need to be changed depending on the particular circumstances of the study area. These variables are removed from the main python script and placed in a file called ca_config. py, shown BLANK.
This configuration file can be opened in a text editor – such as Notepad – to view and edit the assumptions. For example, the file shows all of the impedance values used for the base raster, bonuses and penalties. These default values are adapted from the 2007 Virginia Natural Landscape Assessment. To change these values, it is recommended to first save a copy of the original version. Then, the variable values can be changed, and the file can be saved.


The GIC would like to thank the following people for their help in reviewing, testing, and providing guidance on data for the GIS model created during this process:
David Betenbaugh, Affiliate, National Oceanic and Atmospheric Administration
Harry Blount, GIS Manager, South Carolina Forestry Commission
Jason Bullock, Ph.D., Virginia Department of Conservation and Recreation, Division of Natural Heritage.
Barry H. Jurs, Economic Development Facilities Planner, Santee Cooper
Matthew C. Moldenhauer, Land Resource Manager, Charleston County Park & Recreation Commission
Harun Rashid, Senior GIS Planner, Berkeley-Charleston-Dorchester Council of Governments
James D. Scurry, Ph.D., Technology Development Program Director, S.C. Department of Natural Resources
Lisa W. Shealy, Conservation Planner, Lowcountry Open Land Trust

Melissa Strickland, GIS Manager, The Nature Conservancy
J. Raleigh West III, Director of Land Protection and General Counsel, Lord Berkeley Conservation Trust
Gregory K Rines, Bo Castillo, and the Berkeley County GIS staff.
Special thanks to the following persons for their support of this project:
Holly E. Backus, Planner, Berkeley County
Eric L. Greenway, AICP, Planning Director, Berkeley County
Everett Lowe Sharpe, Jr., Urban Forestry Program Coordinator, SC Forestry Commission
Frances Waite, Coastal Region Urban Forester, SC Forestry Commission
Members of the Berkeley County, SC Planning Commission
Francis Marion and Sumter National Forests staff, USDA Forest Service
The following bibliography is not comprehensive but does provide a snapshot of the diversity and age of relevant titles. It includes technical references, exemplar plans, programs, web sites and technical assistance. There are many case studies that have been published individually and links to those are provided on the Green Infrastructure Center’s website at: www.gicinc.org .
________ Precious Heritage: The Status of Biodiversity in the United States. Washington, D.C.: The Nature Conservancy, 2000.
________ Environmental Law Institute. Planning for Biodiversity: Authorities in State Land Use Laws. Washington, D.C.: Environmental Law Institute, 2003.
________ Trust for Public Land. Building Green Infrastructure: Land Conservation as a Watershed Protection Strategy. San Francisco: Trust for Public Land, 2000.
________ Ecological: An Ecosystems Approach to Developing Infrastructure Projects (FHWA, Brown, 2006). <http://www. environment.fhwa.dot.gov/ecological/eco_index.asp>
________ The Economic Benefits of Recreation, Open Space, Recreation Facilities and Walkable Community Design. May 2010. Active Living Research.
Adams, Jonathan S., The Future of the Wild: Radical Conservation for a Crowded World. Boston: Beacon Press, 2006.
Akbari, H., Kurn, D. et al. 1997. “Peak power and cooling energy savings of shade trees.” Energy and Buildings 25 (1997): 139–148.
Barten, P.K., and C.E. Ernst., “Land Conservation and Watershed Management for Source Protection.” Journal of American Water Works Association 96(4) (2004):121-135.
Benedict, Mark A. and McMahon, Edward T. Green Infrastructure: Linking Landscapes and Communities. Washington, D.C.: Island Press, 2006.
Benedict, Mark A. and McMahon. “Green Infrastructure: Smart Conservation for the 21st Century.” Washington, D.C., Sprawl Watch Clearing House, May 2002. Accessed July 2010 http:// www.sprawlwatch.org/greeninfrastructure.pdf
Birnbaum, Charles A. “Protecting Cultural Landscapes: Planning, Treatment and Management of Historic Landscapes” September 1994. Accessed May 21, 2012 http://www.nps.gov/ hps/tps/briefs/brief36.htm
Bowker, J.M., Bergstrom, J.C. and Gill, J.K., The Virginia Creeper Trail, An Assessment of User Demographics, Preferences and Economics, USDA Forest Service and the University of Georgia Department of Agriculture and Applied Economics, 2004.
Cassin, Jan. “Hurricane Sandy Highlights Need to Protect Green Infrastructure” Ecosystem Marketplace. Nov. 2, 2012. Accessed December 13, 2012. www.ecosystemmarketplace.com/pages/dynamic/article.page.php?page_ id=9401§ion=news_articles&eod=1
Crompton, J., Love, L., and Moore, T. (1997). “An Empirical Study of the Role of Recreation, Parks, and Open Space in Companies’ (Re) Location Decisions.” Journal of Park and Recreation Administration 15(1), (1997): 37-58.
Correll, Mark R., Lillydahl, J., Jane H. and Singell, Larry D. “The Effect of Greenbelts on Residential Property Values: Some Findings on the Political Economy of Open Space.” Land Economics 54(2), (1978): 207-217.
Cross, Russel J. Historic Ramblin’s Through Berkeley. Columbia: R.L. Bryan Company, 1985.
Dale, Virginia H. “Ecological Principles and Guidelines for Managing the Use of Land.” Ecological Applications 10, (3): 639–670.
Dale, V.H. and Haeuber, R.A. eds., Applying Ecological Principles to Land Management. New York: Springer-Verlag, 2001.
Dale, V.H. and English, M.R. eds., Tools to Aid Environmental Decision Making. New York: Springer-Verlag, 1999.
Dramstad, Wenche E., et al. Landscape Ecology Principles in Landscape Architecture and Land Use Planning. Washington D.C.: Island Press, 1996.
Duerksen, Christopher and Snyder, Cara. Nature Friendly Communities, Habitat Protection, and Land Use Planning. Washington, D.C.: Island Press, 2005.
Fiorino, Daniel J. “Citizen Participation and Environmental Risk: A Survey of Institutional Mechanisms.” Science, Technology and Human Values 15(2) (Spring 1990): 226-243.
Florida, Richard. “The Rise of the Creative Class.” Washington Monthly. Last modified May 2002. Accessed May 2009. http://www.washingtonmonthly.com/features/2001/0205.florida.html
Fischer, R.A. and Fischenich, J.C. Design Recommendations for Riparian Corridors and Vegetated Buffer Strips, (No. ERDCTN-EMRRP-SR-24). Army Engineer Waterways Experiment Station Vicksburg Ms Engineer Research And Development Center, April 2000.
Forman, R. T. T. Land Mosaics. The Ecology of Landscapes and Regions. Cambridge: Cambridge University Press, 1995.
Frank, Lawrence, Engelke, Peter. and Schmid, Thomas. Health and Community Design: The Impact of The Built Environment on Physical Activity. Washington, D.C.: Island Press, 2003.
Frumkin H, Frank L, Jackson R. Urban Sprawl and Public Health: Designing, Planning, and Building for Healthy Communities. Washington, D.C.: Island Press, 2004.
Fulton, Pendall, Nguyen, Harrison. “Who Sprawls Most: How Growth Patterns Differ Across the U.S.,” Brookings Institute(July 2001) Accessed May 2006. http://content.knowledgeplex. org/kp2/img/cache/kp/2631.pdf
Hellmund, Paul Cawood, Smith, Daniel Somers. Designing Greenways: Sustainable Landscapes for Nature and People Washington, D.C.: Island Press, 2006
Holling, Crawford Stannley. “Resilience and Stability of Ecological Systems” Annual Review of Ecology and Systematics, 4 (November 1973): 1-23
Hopper Joseph R. and Mc Carl Nielson, Joyce, “Recycling as Altruistic Behavior: Normative and Behavioral Strategies to Expand Participation in a Community Recycling Program.” Environment and Behavior 23(2) (March 1991): 195-220
Huang, J., H. Akbari, and H. Taha. “The Wind-Shielding and Shading Effects of Trees on Residential Heating and Cooling Requirements.” Paper presented at the Winter Meeting of the American Society of Heating, Refrigerating and Air-Conditioning Engineers. Atlanta, Georgia, 1990.
Johnson, Bart and Hill, Kristina, eds. Ecology and Design Washington D.C.: Island Press, 2001.
Kraus, We, Torgan CE, Duscha BD, Norris J, Brown SA, Cobb FR., Bales CW, Annex BH, Samsa GP, Houmard JA, Slentz CA. “Studies of a Targeted Risk Reduction Intervention Through Defined Exercise,” American Journal of Cardiology” Medicine and Science In Sports and Exercise , 33(10) (December 15, 2007): 1774-1784
Kaplan, R. & S. Kaplan. The Experience of Nature: A Psychological Perspective. Cambridge: Cambridge University Press, 1989. Kawachi I, Berkman LF. Neighborhoods and Health. Oxford(UK): Oxford University Press, 2003.
Kurn, D., S. Bretz, B. Huang, and H. Akbari. The Potential for Reducing Urban Air Temperatures and Energy Consumption through Vegetative Cooling (PDF) (31 pp, 1.76MB). ACEEE Summer Study on Energy Efficiency in Buildings, American Council for an Energy Efficient Economy. Pacific Grove, California. 1994
Little, Charles E. Greenways for America, Baltimore: Johns Hopkins University Press, 1995.
Lynn, William S. The Ethics of Social Marketing for Conservation: A Learning Module. RARE Training Manual. London: RARE. 2001. Accessed January 10, 2012. May 2011. http:// www.rmportal.net/library/content/tools/biodiversity-conservation-tools/putting-conservation-in-context-cd/communication-and-education-approaches-resourses/The-Ethics-of-Social-Marketing-for-Conservation-A-Learning-Module/view
Louve, Richard. Last Child in the Woods. Chapel Hill: Algonquin Books, 2005
Lyman, Martha West. “Trust for Public Land, Quebec Labrador Foundation and the Northern Forest Community Forests: A Community Investment Strategy.” San Francisco: Trust for Public Land, 2007.
Macie, Edward A.; Hermansen, L. Annie “Human Influences on Forest Ecosystems; the Southern Wildland-Urban Interface Assessment: summary report.” General Technical Report SRS64. Asheville, NC: U.S. Department of Agriculture, Southern Research Station. 13 pages. 2003.
McPherson, E.G., J. R. Simpson, P. J. Peper, S. E. Maco, and Q. Xiao. 2005. “Municipal forest benefits and costs in five US cities.” Journal of Forestry 103(8), (2005): 411–416.
McHarg, Ian. Design with Nature. Garden City: American Museum of Natural History, Natural History Press, 1969.
Miller, Daphne, “Take a Hike and Call Me in the Morning.” Washington Post Health Section. Tues, Nov 17, 2009. Accessed November 1969. http://www.washingtonpost.com/wpdyn/content/article/2009/11/16/AR2009111602899.html.
Morris M, Duncan R, Hannaford K, Kochtitzky C, Rogers V, Roof K, Solomon J. Integrating planning and public health. Chicago: APA Planning Advisory Service, 2006.
Nolon, John. Open Ground: Effective Local Strategies for Protecting Natural Resources. Washington, D.C.: Environmental Law Institute, 2003
Nowak, David J; Hoehn, Robert E. III; Crane, David E.; Stevens, Jack C.; Walton, Jeffrey T., “Assessing Urban Forest Effects and Values”, Washington D.C. USDA Forest Service, Northern Research Station, Newton Square, PA (24 pages). 2006
Reiter, Susan. M. and Samuel, William. “Littering as a Function of Prior Litter and The Presence or Absence of Prohibitive Signs.” Journal of Applied Social Psychology, 10 (February, 1980): 45–55.
Riley, Ann L. Restoring Streams in Cities. Washington D.C.: Island Press, 2001.
Stafford, Margaret. “Uprooted Town Moves To Higher Ground After Midwest Deluge Of ‘93. Disaster: Government Offered Pattonsburg, Mo., And Other Communities Millions To Move Out Of Harm’s Way Rather Than Remain In Flood Plain.” Associated Press. July 18, 1998. Accessed October 201. http://articles.latimes.com/1998/jul/12/news/mn-2946
Tassel, Sandra J. The Conservation Program Handbook. A Guide for Local Government Land Acquisition, San Francisco: Trust for Public Land, 2009.
Ulrich, Roger S. “View Through A Window May Influence Recovery.” Science. 224 (April 27, 1984):224-5. Weakley, Allison, November 2012. Personal Communication.
Winter, Patricia L., Sagarin, B. J., Rhoads, K., Barrett, D. W., and Cialdini, R. B. “Choosing to Encourage or Discourage: Perceived Effectiveness of Prescriptive Versus Proscriptive Messages. “ Environmental Management. 6(26) (December 2000 ): 589-594. December 2000.
Winter, Patricia L., Cialdini, R. B., Sagarin, B. J. “An Analysis of Normative Messages in Signs at Recreation Areas.” Journal of Interpretation Research. 3(1) (Winter 1998): 39-47.
Howell Andrew J.; Dopko Raelyne L.; Passmore Holli-Anne; et al. “Nature connectedness: Associations with well-being and mindfulness.” Personality And Individual Differences 51(2) (July 2011): 166-171
Hinds Joe; Sparks Paul. “The Affective Quality of Human-Natural Environment Relationships.” Evolutionary Psychology 9(3) (2011): 451-469.
Weinstein, Netta, Przybylski, Andrew K, and Ryan, Richard M. “Can Nature Make Us More Caring? Effects of Immersion in Nature on Intrinsic Aspirations and Generosity.” Personal Social Psychology Bulletin 35 (October 2009): 1315-1329 (first published on August 5, 2009).
Winter, Patricia L., Sagarin, B. J., Rhoads, K., Barrett, D. W., and Cialdini, R. B. “Choosing to Encourage or Discourage: Perceived Effectiveness of Prescriptive Versus Proscriptive Messages.” Environmental Management 26(6) (December 2000): 589-594.
Winter, Patricia L., Cialdini, R. B., Sagarin, B. J. “An Analysis of Normative Messages in Signs at Recreation Areas.” Journal of Interpretation Research. 3(1) (Winter 1998): 39-47.
Wolf, Kathleen L. “City Trees, Nature and Physical Activity,” Arborist News, 17(1) (February 2008)
EPA Healthy Watersheds Initiative: http://www.epa.gov/ owow/nps/healthywatersheds/examples.html
Green Infrastructure Projects: www.greeninfrastructure. net
Green Infrastructure Center Projects: http://www.gicinc. org/projects.htm
Green Maps: http://www.greenmaps.org
Historic Vernacular Landscapes http://preservapedia.org/ Historic_vernacular_landscape
Human Dimensions of Urban Forestry and Urban Greening. List of articles and presentations for download http:// www.naturewithin.info/products.html
Landscope America: http://www.landscope.org/ introduction/
Video: Green Infrastructure, Protecting Our Commonwealth. Available on YouTube at: http://www.youtube.com/watch?v=fb7HLYPwJ4I&uid= Vr9xSKUIWQoQ0LjEFyYm-w&lr=1