2nd Quarter | Apr-Jun 2024
{THIS PAGE INTENTIONALLY LEFT BLANK}

INTRODUCTION
Construction Quarterly is a publication of the Berkeley-Charleston-Dorchester Council of Governments. It is designed to provide a detailed analysis of construction trends in the region. While we make every effort to collect all available data, if we were unable to obtain information from a jurisdiction those fields will reflect zero permits. We offer three methods to evaluate change. The last five quarters are shown, allowing a comparison between last quarter and the same quarter last year. In most categories, the current quarter is also compared with the average of the previous four quarters. We hope you find this report useful and welcome your feedback.
(843) 529-0400
Construction activity as reported by jurisdictions to the Berkeley-Charleston-Dorchester Council of Governments
ALL NEW CONSTRUCTION BY JURISDICTION
ALL NEW CONSTRUCTION
This section refers to all new construction, which includes Commercial, Single Family, Single Family Attached, Mixed Use and Multi-Family permits. The table for all new and existing permits is at the end of this document.
The number of building permits issued for all new construction in the region in the first quarter of 2024 to the second quarter of 2024 decreased by 7.2%. The construction permit values decreased by roughly 18% during the same time.
The year-over-year number of permits increased by about 31%, while the value of the permits issued increased by 3.2% from the second quarter 2023 to the second quarter 2024.
The number of permits issued for the second quarter of 2024 was 31.4% above the average of the previous four quarters while the value of permits issued was 12.1% higher than the average of the previous four quarters.
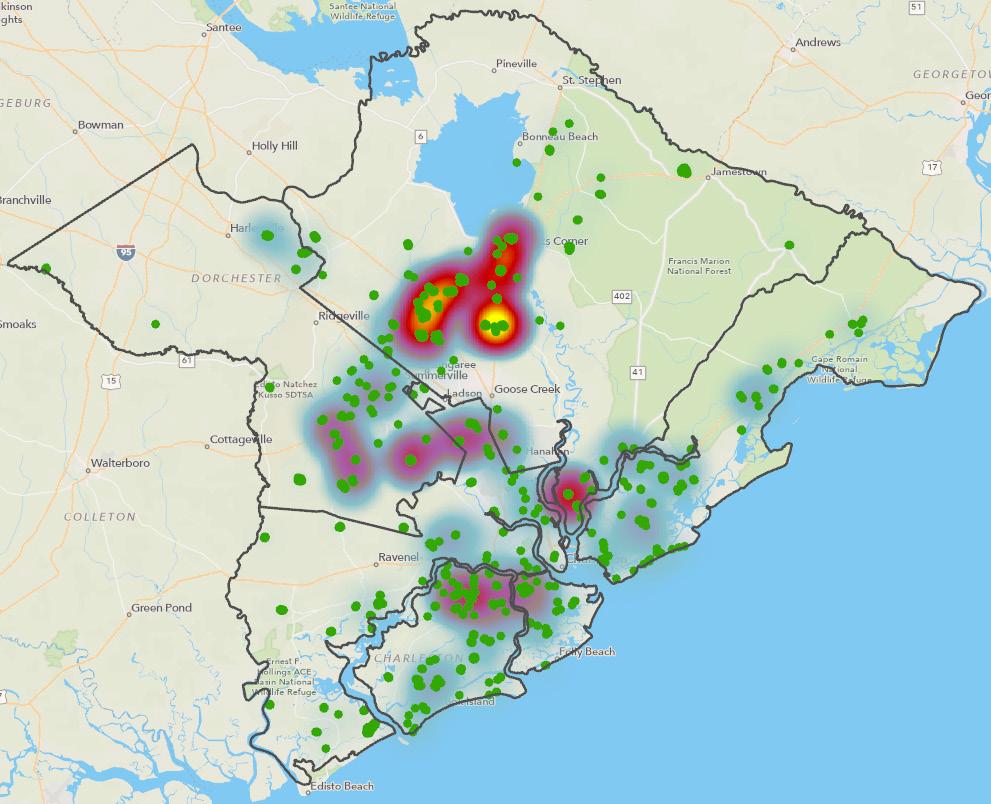
MAP OF NEW CONSTRUCTION PERMITS BY CLUSTER

ALL COMMERCIAL CONSTRUCTION BY JURISDICTION
ALL COMMERCIAL CONSTRUCTION
Commercial permits account for construction of nonresidential structures such as hotels, office buildings, warehouses and other industrial use buildings. These values also include commercial “upfits” which are categorized as new construction for reporting purposes. Upfit permits are issued when a new tenant leases a space or the purpose of the space changes. Business remodels and renovations are listed separately in this report.
In the second quarter of 2024, the number of commercial permits issued decreased over the first quarter of 2024 by 18.8%, while the value decreased by 61.4%.
The number of permits decreased by about 22.2% year-over-year, from the second quarter of 2023 to the second quarter of 2024, while the value increased more than 68.5% in the same time period.
The number of commercial permits for the second quarter of 2024 was 19.9% below the average of the previous fourth quarters and the value of the permits issued was roughly 39% above the average.
A summary of commercial permits by quarter and jurisdiction is in the table to the right. A map depicting commercial permit clusters is on the next page.

MAP OF COMMERCIAL PERMIT CLUSTERS
ALL SINGLE FAMILY CONSTRUCTION BY JURISDICTION
ALL SINGLE FAMILY RESIDENTIAL PERMITS
Single Family (SF) Residential Construction can best be defined as a free-standing residential structure, designed to house one family unit. Single Family construction does not generally include townhouses, duplexes, condos or apartments. These types of permits are compiled separately and covered later in this document.
From the first quarter of 2024 to the second quarter of 2024, the number of SF permits issued showed an decrease of 7.4%, while the value decreased by 7.5% in the same time interval.
Year-over-year, second quarter of 2023 to the second quarter of 2024 the number of permits increased by 4.7%, and the overall value of permits increased by 14.8%.
The number of permits in the second quarter of 2024 was roughly 3.8% above than the average of the previous four quarters and the value was approximately 20.3% above the average of the previous four years.
A breakdown of SF permits by quarter and jurisdiction can be found in the table to the right. Permits issued reflect the number of individual units. A map depicting SF residential permit is available on the next page.
MAP OF SINGLE FAMILY HOUSING PERMITS BY CLUSTER
ALL SINGLE FAMILY ATTACHED RESIDENTIAL CONSTRUCTION
Single Family Attached (SFA) construction permits are issued for the construction of a single family structure that shares a common wall with one or more other single family structures. Units have separate utilities, plumbing and heating/air. These are generally considered to be townhomes, and do not normally include multi-family structures such as condos, duplexes or apartments.
SFAs are sometimes included in a development as an “affordable housing“ component, as they are frequently less expensive to build and to purchase than their detached counterparts. Permits issued reflect the number of individual units.
The number of single-family attached residential permits increased from the first quarter of 2024 to the second quarter of 2024 by roughly 1.8%. The total permit values also increased by approximately 13% in the same time frame.
The number of single-family attached permits issued year-over-year from the second quarter of 2023 to the second quarter of 2024, iccreased by 2.5%. Additionally, the single-family permit values increased by approximately 34.5% when compared to the same quarter from the previous year.
The number of single-family permits for the second quarter of 2024 was 6.2% above the average of the previous four quarters; the permit values were higher than the average by 20.3%.
A summary of all single-family attached permits can be found by quarter and jurisdiction in the table to the right and a map of housing clusters can be found on the next page.
ALL SINGLE FAMILY ATTACHED CONSTRUCTION BY JURISDICTION

MAP OF SINGLE FAMILY ATTACHED RESIDENTIAL PERMITS BY CLUSTERS
ALL MULTI-FAMILY RESIDENTIAL CONSTRUCTION
Multi-Family (MF) Residential construction permits are issued for a classification of housing where multiple separate housing units are contained within one building. This construction includes mainly apartments, but can also include condos and duplexes.
Multi-Family permit issuance is expected to increase in the future to accommodate the growing population in the region. Permits are generally reported as the number of buildings or complexes, not the number of individual units. The number of units can be found in the text below.
In the second quarter of 2024, just 3 multi-family building permits were issued in the region for a value of about $45.15 million.
Multi-family permits issued in the second quarter of 2024 decreased in both numbers, 85%, and value, 52%, from the first quarter of 2024.
When compared year-over-year, from the second quarter of 2023 to quarter two, 2024, the number of permits decreased 92.9. Additionally, the value of the permits decreased 82.4%.
For comparison, the number of multi-family permits in the second quarter of 2024 decreased by 88%, while the average value was 67.5% below the average of the previous four quarters.
A breakdown of multi-family permits by quarter and municipality can be found in the table to the right. A map of multi-family permits is available on the next page.
ALL MULTI-FAMILY CONSTRUCTION BY JURISDICTION

MAP OF MULTI-FAMILY RESIDENTIAL PERMITS BY CLUSTERS
ALL REMODELS/RENOVATIONS BY JURISDICTION
ALL REMODEL/RENOVATION CONSTRUCTION
Remodel, Renovation, or Addition (RA) construction permits are issued when a homeowner or business owner seeks approval to update, enlarge or otherwise alter an existing structure. Alterations are made for several reasons, including the need for additional space and the desire to increase property values.
Remodels and Renovations are an important indicator of reinvestment in a property. (Note that commercial “upfits” are not included in these numbers, but business remodels, renovations or additions are included.)
In the second quarter of 2024, a total of 1171 remodel, renovation or addition permits were issued in the region for a value of about $158,711,456 million. This represents a 4.5% increase in value from the first quarter of 2024. The number of permits increased from 700 to 1171, year over year, second quarter 2023 versus second quarter 2024 while the permit values increased, as well, by 75.7% over the same time.
A breakdown of remodel/renovation permits by quarter and municipality can be found in the table to the right.
ALL OTHER CONSTRUCTION BY JURISDICTION
ALL OTHER CONSTRUCTION
This category of construction permitting is compiled for those projects that do not fit under any other category. These projects include, but are not limited to: swimming pools, accessory structures (garages, sheds, etc.), solar panels and decks.
In the second quarter of 2024, there were 1050 “other” permits issued for a value of over $56.7 million.
A breakdown of “other” construction permits by quarter and municipality can be found in the table to the right.
ALL CONSTRUCTION BY JURISDICTION
SUMMARY
At the conclusion of 2023 the regional construction industry continued to grapple with numerous challenges. Labor shortages, supply chain disruptions, higher material costs and rising interest rates were among the obstacles affecting production. The fourth quarter of 2023 showed some decline over the previous quarter regionally in the number of permits issued (15.5%), but an increase in value (4.1%). Berkeley County had decreases in both the number of permits issued (4%) and the total value (8.3%) over the previous quarter. Dorchester County experienced increases in both the number of permits issued (11.7%) and value (36.6%). Inversely, Charleston County took a step back in terms of number of permits issued (33.7%), while the values decreased slightly by .03%
THE QUARTER AT A GLANCE
COMMERCIAL PERMITS (In Value, by Jurisdiction)
THIS QUARTERS MOST ACTIVE SUBDIVISIONS