Draft Existing Conditions Report
Carolina Crossroads
BCDCOG US 52 Corridor Study
Berkeley and Charleston Counties, South Carolina
Draft 02
Prepared for BCDCOG
Prepared by


Table of Contents 1 Introduction……………………………………………………………..………3 1.1 Purpose of Study……………………………………… ..3 1.2 Study Process………………………………………………………………. ………..…….3 1.3 Study Area………………………………….……………………………………..………...4 1.4 Stakeholder Framework……………………………………………………………………..5 1.4.1 Steering Committee….…………………………………………………...……..…5 1.4.2 Stakeholder Engagement…………………………………………………………..5 1.4.3 Public Outreach……………………………………………………………………5 2 Existing Conditions………………………………………………………...……6 2.1 Land Use…………………………………………………………..………..……………..…6 2.1.1 Existing Land Uses…………………………………………… 6 2.1.2 Future Land Use Recommendations: Plan Review ……10 2.1.3 Existing Corridor-Wide Land Use Vision…………………… 20 2.2 Socioeconomic Conditions………………………………… …24 2.2.1 Population……………………………………… …24 2.2.2 Race and Ethnicity……………………………………...……………….………..27 2.2.3 Income…………………………………………………………………………….30 2.2.4 Housing……………………………………………………………………….…..33 2.2.5 Journey to Work………………………………………………….……..….….….34 2.2.6 Population & Employment Projections…………………..………………………37 2.2.7 Environmental Justice Population…………………………………………….…..45 2.3 Human and Natural Environment……………… ……49 2.3.1 Water Resources……………………………………… 49 2.3.2 Federally Protected Species………………………… 50 2.3.3 Cultural Resources………………………………………………… 51 2.3.4 Prime Farmland…………………………………………………………….……..51 2.3.5 Underground Storage Tanks…………………………………………..………….52
2.3.6 Parks, Recreation and Protected Lands…………………………...…...…….……52 2.3.7 Community Facilities……………………………………………….……….……53 2.4 Transportation Network………………………………………...…………………………..59 2.4.1 Active Transportation……………………… .....59 2.4.2 Transit…………………………………………………… 71 2.4.3 Freight Rail and Goods Movement ………… ……89 2.4.4 Traffic and Safety………………… ……….110 3.4.5 Highway…………………………………………………………………………130 3 Forces and Trends…...….……………………………………………..……..139 4 Short Term Recommendations…………………………………..….……....140 4.1 Traffic………………………………………………………………………..……………140 4.2 Highway………….……………………………………………………………..…………141 4.3 Freight……………………………………………………………………………………..141 4.4 Transit………….………………………………………………………………………….144 5 Vision and Goals…….……..……...……………………………………...…..145 5.1 Goals and Objectives………….……………...……………………………………...……145 5.1.1 Land Use Development………………………………………………….………145 5.1.2 Economic Development…………………………………………………………146 5.1.3 Community Services and Facilities 146 5.1.4 Environment……………………… 146 5.1.5 Overall Multimodal Transportation 147 5.1.6 Highway and Street Network…… ……… …………… …………………..…147 5.1.7 Freight and Goods Movement…………...……………………….………..……147 5.1.8 Public Transit Services……………………………………..………………….. 148 5.1.9 Active Transportation…………………………………………………………...148
List of Figures
Figure 1-1: Project Study Area
Figure 2-1: Land Use Percentages in the Study Area
Figure 2-2: Existing Land Use
Figure 2-3: Berkeley County Future Land Use Map
Figure 2-4: Goose Creek Future Land Use Map (Centered on Study Area)
Figure 2-5: Hanahan Future Land Use Map (Centered on Study Area)
Figure 2-6: Moncks Corner Future Land Use Map
Figure 2-7: North Charleston Future Land Use Map (Centered on Study Area)
Figure 2-8: Future Land Use Percentages in Study Area
Figure 2-9: Future Land Use
Figure 2-10: Study Area Population (ACS 2015-2019 Block Group Data)
Figure 2-11: Study Area Population Density (ACS 2015-2019 Block Group Data)
Figure 2-12: Percent Population by Race in Study Area (ACS 2015-2019 Block Group Data)
Figure 2-13: Percent Minority Population in Study Area (ACS 2015-2019 Block Group Data)
Figure 2-14: Median Household Income (ACS 2015-2019 Block Group Data)
Figure 2-15: Percent Population in Poverty (ACS 2015-2019 Block Group Data)
Figure 2-16: Travel Time to Work
Figure 2-17: Time of Departure for Commute
Figure 2-18: Projected Population in 2020 by TAZ
Figure 2-19: Projected Population in 2040 by TAZ
Figure 2-20: Projected Employment in 2020 by TAZ
Figure 2-21: Projected Employment in 2040 by TAZ
Figure 2-22: Employment in 2020 and Change in Employment from 2020 to 2040 by Sector
Figure 2-23: Share of Employment Growth by Sector from 2020 to 2040
Figure 2-24: Environmental Justice Population
Figure 2-25: Households without Access to a Vehicle
Figure 2-26: Households without Access to the Internet
Figure 2-27: Segment 1 Environmental Constraints
Figure 2-28: Segment 2 Environmental Constraints
Figure 2-29: Segment 3 Environmental Constraints
Figure 2-30: Segment 4 Environmental Constraints
Figure 2-31: US 52 Corridor Environmental Constraints
Figure 2-32: Moncks Corner Bicycle and Pedestrian Facilities
Figure 2-33: Central US 52 Bicycle and Pedestrian Facilities
Figure 2-34: Goose Creek Bicycle and Pedestrian Facilities
Figure 2-35: Existing Transit
Figure 2-36: Proposed BRT Lite
Figure 2-37: Housing to Jobs Ratio
Figure 2-38: Groups with Higher Transit Propensity
Figure 2-39: Transit Demand Index
Figure 2-40: US 52 Cross Section
Figure 2-41: US 52 Existing Industrial and Commercial Zoning with Truck Counts
Figure 2-42: Future Commercial and Employment Areas with Truck Counts
Figure 2-43: Intersections with Turning Movements Collected
Figure 2-44: Existing Zoning and Rail Infrastructure
Figure 2-45: FLUM and Rail Infrastructure
Figure 2-46: West Branch Commerce Park
Figure 2-47: Mundy Company
Figure 2-48: Charleston Steel & Metal Company
Figure 2-49: Vulcan Materials Company
Figure 2-50: Century Aluminum
Figure 2-51: Crashes by Time of Day
Figure 2-52: Typical Section US 52 – Otranto Road to US 78 Interchange
Figure 2-53: Typical Section US 52 – Through US 78 Interchange
Figure 2-54: Typical Section US 52 – Goose Creek Bridge to Camelot Drive
Figure 2-55: Typical Section US 52
US 176 / Red Bank Road to Button Hall Avenue
Figure 2-56: Typical Section US 52 – Seewee Drive to Goose Creek Community Center
Figure 2-57: Typical Section US 52 – Goose Creek Community Center to Rembert C. Dennis Boulevard
Figure 2-58: Typical Section US 52 – in Moncks Corner
Figure 2-59: Typical Section US 52 and Rembert C. Dennis Boulevard
List of Tables
Table 2-1: County/Municipality Zoning Categories for Each Corresponding Land Use Category
Table 2-2: County/Municipality Zoning Categories for Each Corresponding Land Use Category
Table 2-3: Population and Households in the Study Area (ACS 2015-2019)
Table 2-4: Population by Race in Study Area (ACS 2015-2019)
Table 2-5: Households Living Below Poverty Level
Table 2-6: Median Household Income
Table 2-7: Summary of Housing Units
Table 2-8: Housing Units by Year of Construction
Table 2-9: Median House Value and Gross Rent
Table 2-10: Summary of Labor Force
Table 2-11: Travel Time to Work
Table 2-12: Mode of Travel for Commute
Table 2-13: Time of Departure for Commute
Table 2-14: Summary of Population and Employment Projections
Table 2-15: Summary of Environmental Justice Population
Table 2-16: Federally Listed Threatened and Endangered Species
Table 2-17: Monthly Ridership by TCL Route
Table 2-18: Intersections with Turning Movements Collected
Table 2-19: Intersections with Highest Truck Turning Movements
Table 2-20: Old US 52 Truck Turning Intersections
Table 2-21: FRA Grade Crossing Inventory Data
–
Table 2-22: Heavy Vehicle Percentages- US 52 South of Mt. Holly Plantation Lane
Table 2-23: 85th Percentile Speed Ranges- US 52 South of Mt. Holly Plantation Lane
Table 2-24: Heavy Vehicle Summary- Multiple Locations
Table 2-25: Crash Data Analysis (January 2015-June 2020)
Table 2-26: Crashes at Signalized Study Intersections by Manner of Collision
Table 2-27: Crashes at Signalized Study Intersections as a Percent of Total Intersection Crashes
Table 2-28: Existing Intersection Capacity Analysis Results
Table 2-29: Warrant Analysis Summary
Table 2-30: US 52 Corridor Functional Class Summary
Table 2-31: US Corridor Posted Speed Summary
Table 2-32: US 52 Typical Section Summary
Table 2-33: US 52 Corridor Median Acceleration Lane Length Summary
Table 2-34: US 52 Pavement Marking Recommendations Summary
Table 2-35: Summary of Project History for the US 52 Corridor
1 Introduction
The US 52 corridor is an important connection between North Charleston, Goose Creek and Moncks Corner and is poised for consequential growth and development. Its proximity to Charleston and North Charleston makes it attractive for both residential and employment development. The population within the corridor is anticipated to increase by approximately 70 percent between 2020 (21,000 residents) and 2040 (36,000), increasing the demand for upgraded infrastructure and additional residences1
The US 52 corridor’s character changes dramatically along the approximate 18 miles between US 17 Alt. in Moncks Corner and US 78 in North Charleston. The corridor’s character has evolved over the many decades of community growth, with roadway improvements completed between 1958-1973. Subsequent intersection improvements at Stephanie Drive, Hollywood Drive, Old Fort Road, and US 176 followed in the 1980s and 1990s.
The US 52 corridor is identified as part of a High-Capacity Transit (HCT) network for the region and is recommended for future Bus Rapid Transit (BRT). This future transit investment will enhance resident’s quality of life and support economic growth for the region.
1.1 Purpose of Study
The US 52 Corridor Study seeks to establish a vision for the US 52 corridor between Moncks Corner and North Charleston. The study will define the relationship between the roadway and adjacent land uses while planning for the corridor’s overall future growth. This study reviews previous plans for the area, examines land use trends, and provides an inventory of the environmental and transportation elements within the corridor. The study will also offer a range of context-sensitive multimodal solutions, such as High-Capacity transit, that attempt to maximize existing infrastructure, improve roadway safety, increase the corridor’s accessibility, and create new, long-term capacity to accommodate future growth. Finally, the US 52 Corridor Study will support coordinated land uses and corridor preservation across all impacted jurisdictions.
1.2 Study Process
Future development and visioning must first evaluate the current infrastructure in order to thoughtfully guide the corridor into the next phase of residential, commercial, and transportation uses.
3 Existing Conditions Report
1 CHATS Travel Demand Model
The corridor was analyzed to identify existing conditions, deficiencies, and opportunities and touches on:
• Land Use,
• Socioeconomic Conditions,
• Human & Natural Environment,
• Multimodal & Intermodal Transportation Network,
• Freight,
• Rail, and
• Recommendations.
The use of a Steering Committee assists in establishing the region’s vision and goals for the corridor and guide the Study Team through concept development, identification of a preferred concept, and adoption of a plan for the corridor.
1.3 Study Area
The US 52 Corridor Study area is located in Berkeley and Charleston counties and extends approximately 18 miles between the intersection of US 78 (University Boulevard) in North Charleston and US Highway 17 Alt. and Rembert C. Dennis Boulevard in Moncks Corner. The study area also encompasses the approximately 12-mile parallel roadway along Old US 52 and Rembert C. Dennis Boulevard/US 52 Bypass in Moncks Corner.

The study area was further broken down into segments to consider subarea context along the corridor (from south to north):
• Segment 1: Goose Creek (US 78/UniversityAvetoOldMountHolly Rd/Pine Grove Rd)
• Segment 2: Berkeley County / Goose Creek Annexation Areas (Old Mount Holly Rd/Pine Grove Rd to Cypress Gardens Rd)
• Segment 3: Berkeley County / Moncks Corner Annexation Areas (Cypress Gardens Rd to Gaillard Rd)
• Segment 4: Moncks Corner (Gaillard Rd to US 17 Alt)
4 Existing Conditions Report
Figure 1-1: Project Study Area
1.4 Stakeholder Framework
Stakeholder engagement plays an important role in any transportation study that impacts the daily lives of community members and business owners. Input from local stakeholders provides invaluable feedback on conditions and issues that may not be identifiable by the planners, engineers, and designers of the project team, looking at data alone.
1.4.1 STEERING COMMITTEE
The Steering Committee (SC) is made up of representatives from Moncks Corner, Berkeley County, Goose Creek and SCDOT. The SC is working with the Study Team throughout the duration of the study to review concepts, land use scenarios, and findings to provide valuable input and to ultimately select a preferred corridor plan. The committee offers technical guidance to the project by reviewing and providing feedback on study analyses and findings, building consensus around a shared corridor vision, and final plan recommendations and implementation.
Various members of the SC met on April 7, 2021 to discuss preliminary findings along the corridor and to discuss deficiencies, gaps in connectivity and opportunities.
1.4.2 STAKEHOLDER ENGAGEMENT
Stakeholders were engaged throughout the Phase I Existing Conditions process to solicit information and feedback for the report. Meetings with stakeholders to discuss the Phase I Existing Conditions Report include:
• BCDCOG Kickoff Meeting: December 17, 2020
• Charleston Area Regional Transit Authority & Tri-County Link Meeting: January 22, 2021
• Goose Creek Stakeholder Meeting: February 25, 2021
• Moncks Corner Stakeholder Meeting: February 19, 2021
• Berkeley County Stakeholder Meeting: March 1, 2021
1.4.3 PUBLIC OUTREACH
An interactive public engagement process is being undertaken to ensure recommendations outlined in the study are consistent with community goals and objectives for the corridor. The process began with a December 2020 project team kickoff workshop where the project was formally introduced, along with anticipated milestones and schedule. The meeting also provided an opportunity to solicit early feedback and establish project goals and a vision for the corridor.
Introductory presentations were also made at the following council meetings:
• Moncks Corner Town Council: January 19, 2021
• Berkeley County Council: February 8, 2021
• Goose Creek City Council: February 23, 2021
5 Existing Conditions Report
2 Existing Conditions
2.1 Land Use
2.1.1 EXISTING LAND USES
This section presents existing land uses along the corridor. Figure 2-1 illustrates the land use distribution within the study area. For simplicity and consistency, zoning categories have been generalized across municipal lines. For example, Moncks Corner’s M-2 Industrial Park District, Berkeley County’s HI Heavy Industrial District, and Goose Creek’s GI General Industrial District are all displayed as “Industrial” land uses. Table 2-1 details the specific zoning categories within each jurisdiction that are designated by each land use category.
Existing Conditions Report 6
Residential 2,886.20 acres 25.14% study area Transitional 4.57 acres 0.04% study area Commercial 1,974.56 acres 17.20% study area Conservation 194.13 acres 1.69% study area Industrial 1,719.49 acres 14.98% study area Office 118.88 acres 1.04% study area Planned Development 2,886.20 acres 25.14% study area Agriculture 1,696.23 acres 14.78% study area
Figure 2-1: Land Use Percentages in the Study Area
Existing Conditions Report 7
Map Key Land Use Berkeley County Zoning Goose Creek Zoning Hanahan Zoning Moncks Corner Zoning North Charleston Zoning Agriculture (Flex 1) Agricultural District (GC) General Commercial (RNC) Rural & Neighborhood Commercial (OIGC) Office & Institutional, General Commercial (GC) General Commercial (RC) Restricted Commercial (C-2) General Commercial (B-2) General Business (B-1) Limited Business Commercial Conservation (CO) Conservation & Open space Industrial (LI) Light Industrial (HI) Heavy Industrial (LI) Light Industrial (M-1) Light Industrial (M-2) Industrial Office (OI) Office and Institutional (C-1) Office & Institutional (ON) Neighborhood Office (PD-OP/IP) Planned Development, Office & Institutional (PD-MU) Planned Development, MixedUse (PD) Planned Development (PD-R) Planned Development, Residential (D) Development (PD-C) Planned Development, Commercial (PDD) Planned Development Planned Development (R2) Manufactured Residential (R1) Single-Family Residential (R1-R) Rural SingleFamily Residential (R-1) Low Density Residential (R-2) Medium Density Residential (RS) Single-Family Residential (RM) Multi-Family Residential (R-3) Multi-Family Residential (R-2) Single-Family Residential (R-1) Single-Family Residential (MH-1) Mobile Home Park (R-1) SingleFamily Residential (R-2) MultiFamily Residential Residential Transitional (TD) Transitional
Table
2-1: County/Municipality Zoning Categories for Each Corresponding Land Use Category
Figure 2-2 shows the corridor’s existing land uses The southern end of the US 52 corridor within the study area contains primarily commercial and residential uses. Some office, conservation, planned development, and industrial uses punctuate the study area in North Charleston and Goose Creek but are not the primary land uses. The section spanning from Pine Grove Road to Black Tom Road has large land areas devoted to industrial uses, and industrial, planned development, and some commercial and agricultural land uses abut US 52. There are also residential land uses in this portion of the study area that are located further from the roadway. The northern portion contains a mix of land uses surrounding both the US 52 and Old US 52 corridors.
This variation in land uses is most prominent within Moncks Corner, where commercial, industrial, office, residential, and transitional uses all occur in close proximity to one another. Despite this mixture, commercial and residential are the predominant land uses in the northern section of the study area.
Existing Conditions Report 8

Existing Conditions Report 9
Figure 2-2: Existing Land Use
2.1.2 FUTURE LAND USE RECOMMENDATIONS: PLAN REVIEW
Each jurisdiction within the study area has its own future land use map that serves to guide development densities and patterns. The Existing and Future Land Use Recommendations sections of this report discusses the specific land uses proposed and discusses land use recommendations that promote transit and growth management.
Berkeley County Comprehensive Plan 5-Year Review (2015)
The Berkeley County Comprehensive Plan was updated in 2010 and underwent a five-year review and minor revisions between 2015 and 2018. A full update is currently underway and is expected to be submitted for review and adoption in late 2021. This latest comprehensive plan update will likely affect future land use designations and policies. At the time of this existing conditions report, however, the 2015 document is the most up-to-date plan for Berkeley County’s future land use development.
The County’s vision for future land use includes large areas of low-density residential development with several employment and moderate-density nodes. The specific future land use categories assigned to the US 52 corridor are below. See Figure 2-3 for specific land use designation locations and the approximate location of the US 52 study area boundaries.
Existing Conditions Report 10

Existing Conditions Report 11
Figure 2-3: Berkeley County Future Land Use Map
Low Density Suburban areas are the primary future land use designation along the central portion of the study area. These will be developed with diverse housing choices in neighborhoods and at densities that can be served by existing infrastructure. Primary uses are single-family detached houses, agricultural uses, civic and recreation, and mixed-uses where appropriate.
Conservation/Recreation areas are located along Old US 52 in the center of the study area. These are historic areas under conservation easements, set aside for protection from development and to provide space for recreation. Development is permitted in this area but must minimize impacts to natural features and environmentally sensitive areas. Primary uses are active/passive recreation, eco-tourism, wildlife refuges, wateroriented commercial, and community and neighborhood parks.
Moderate Density Suburban areas are present in the study area at both the northern and southern terminus, centered on Moncks Corner and Goose Creek respectively. These are intended to provide a transition from lowdensity suburban development to areas of higher residential and/or commercial density. Priority locations for this land use are co-located with neighborhood centers of within one mile of a designated Town Center. New developments should be walkable, include trail or sidewalk networks, and connect to parks, recreation, and open space areas. Primary uses are single-family detached and attached housing, multi-family housing, commercial and/or mixed-uses, and civic and recreational facilities.
Three Employment designations within the study area are located along US 52 between Moncks Corner and Goose Greek. The first is located to the north of Pine Grove Road and west of the US 52/railroad divergence. The second employment node spans north and south of Cypress Gardens Road, and the third employment node spans Gaillard Road to Ben Barron Lane, between US 52 and Old US 52. Intended for development of large office and light-industrial use with associated and supporting land uses (such as restaurants, hotels, and retail), these areas will concentrate development to preserve surrounding open space.
Of the three employment designations, the area west of the US 52/railroad divergence was further classified as an Industrial/Employment Node. This designation allows for more intensive industrial and commercial uses that generate externalities, such as noise. Parcels developed for these uses will be large enough to include land buffers that mitigate negative impacts on adjacent parcels. The Berkeley County Comprehensive Plan identifies one Industrial/Employment node within the study area, centered on the Employment area at Cypress Gardens Road.
Moncks Corner and Goose Creek are categorized as Town Centers. These are designated for development and infill and are intended to concentrate future mixed-use commercial, civic, office, and higher density residential uses.
City of Goose Creek Comprehensive Plan (2015)
The City of Goose Creek’s comprehensive plan was issued in 2010 and updated in 2015. A full update is currently underway and is likely to be submitted for adoption in 2021. At the time of this existing conditions report, the 2015 document is the most up-to-date plan for Goose Creek’s future land use development. The City of Goose Creek has proposed updates to the future land use map, drafted as part of the comprehensive plan update. This section of the existing conditions report provides an overview of the adopted future land use designations in the study area as well as changes anticipated with the comprehensive plan update, once adopted.
Existing Conditions Report 12
Goose Creek’s comprehensive plan establishes a future land use map that acts as an overlay to the Berkeley County future land use plan; areas that are not specified with land use categorizations by the City of Goose Creek take on the land use character proposed by the County. The specific future land use categories proposed for the US 52 corridor are described below. See Figure 2-4 for specific land use designation locations and the approximate location of the US 52 study area boundaries.
Commercial Districts are located at the southern end of the study area surrounding Red Bank Road and north and south of Button Hall Avenue. These are commercial land uses and suburban style shopping centers. Goose Creek envisions these districts for high-density residential and mixed-use redevelopment projects.
Conservation/Recreation areas are located adjacent to US 52 in existing undeveloped areas both north and south of existing suburban residential development. These are set aside for protection from future development to preserve habitats and water quality. These areas are prioritized for recreational activities, and development is constrained to land uses that minimize impacts to the natural environment.
The Downtown Mixed Use District centers on the US 52/US 176 interchange. Goose Creek aims to enhance and expand the center of the City by increasing light commercial and residential land uses that vary in intensity and density. Development regulations such as decreased setbacks, walkable and interconnected street networks, and street trees are key to creating economic development and a desirable location for restaurants, family-owned businesses, and specialty shops.
The Employment Growth District is north of Goose Creek’s existing development density and aims to provide access to major transportation corridors and freight rail lines. The Employment District is meant for office parks, industrial operations, and clusters of professional buildings that can support high employment volumes.

The Institutional District located on US 52 houses Goose Creek’s Municipal Center and is intended to maintain this use in the future. Institutional Districts are not compatible with other land uses, and new institutional needs will colocate within existing areas when possible.
Low Density Residential Districts make up both the southernmost portion of Goose Creek within the study area and the northern portion of US 52 between two designated Employment Growth Districts. This district is intended
Existing Conditions Report 13
Image Source: Base image from Goose Creek Comprehensive Plan (2015); Study Area added as overlay
Figure 2-4: Goose Creek Future Land Use Map (Centered on Study Area)
primarily for single-family detached housing with open space, civic and recreation, and mixed-uses where appropriate.
Moderate Density Residential Districts are in the study area between commercial areas and Low Density Residential Districts. Intended as transition areas, these districts are best situated among neighborhood centers of nonresidential development.
Neighborhood Mixed-Use Districts are located adjacent to US 52 on the eastern side of the corridor. These districts are intended to integrate commercial and residential land uses by promoting low intensity, serviceoriented businesses among a mix of residential housing types and densities. These districts emphasize a consistency in character between new and established development, creating a smooth transition between existing neighborhoods and new land uses.
Goose Creek designates US 52 as a Limited Access Corridor, intending the route as a community bypass. These corridors limit both vehicle and pedestrian access to adjacent land uses; adjacent uses are accessible via perpendicular streets. These corridors primarily function for transportation mobility.
Anticipated Updates
Goose Creek’s Comprehensive Plan 2020 update is nearing completion, and adoption and will include an updated future land use plan. Key changes from the 2015 plan include a new Village Node District, changes to the future land use map, and a phased annexation strategy.
Most future land use categories remain consistent between the 2015 and anticipated 2020 update. However, the 2020 update proposes a Village Node District that replaces the 2015 plan’s Downtown Mixed-Use and Neighborhood Mixed Use Districts. The Village Node District will encourage mixed residential, commercial, and institutional land uses while promoting walkability. Medium-density residential land uses will include townhomes, duplexes/triplexes/quadplexes, accessory dwelling units, and small apartment/condominium buildings. Any new development will be visually consistent with existing residential and/or institutional areas.
Based on a drafted future land use map, the 2020 Plan update will likely propose increased residential density and smaller, but more concentrated, areas of mixed-use development. The new future land use map proposes distinct Village Node Districts rather than the current dispersed Neighborhood and Downtown Mixed-Use Districts. Moderate Density Residential uses will encompass a larger share of land to the east of and adjacent to US 52, while the Village Node Districts will replace some institutional land uses found in the 2015 future land use map. Finally, the future land uses south of the US 52/US 176 intersection will change to commercial rather than mixeduse, and the future residential land use to the west of the US 52/US 176 intersection will change from moderatedensity to low-density residential use.
Existing Conditions Report 14
Goose Creek’s Comprehensive Plan 2020 update proposes a phased annexation plan. Phase 1 annexation is expected to take place between 2021-2024 and would incorporate the “donut holes” that exist within the City’s legal limits. These small unincorporated areas create service delivery issues and inefficiencies for Berkeley County and Goose Creek. Several of these “donut holes” are located to the east of and adjacent to US 52. Phase 2 annexation would take place between 2025-2027 and would encompass the Century Aluminum property to the north of Goose Creek. The eastern portion of this property falls within the study area. Phase 3 annexation would take place between 20212031 and would incorporate the parcels between Goose Creek’s existing boundaries and the City of Hanahan to the south. Several parcels within this annexation phase are located at the southern portion of the study area, primarily to the east of US 52.
Hanahan Comprehensive Plan (2012)
The City of Hanahan adopted their most recent future land use map as part of the 2012 Hanahan Comprehensive Plan. Only the northernmost residential portion of the City of Hanahan is located within the study area. See Figure 2-5 for specific land use designation locations and the approximate location of the US 52 study area boundaries.
The portion of Hanahan located within the study area is primarily slated as Low-Density Neighborhood. This designation aims to create new and/or continue existing low-density residential development. Primary land uses are single family detached houses and traditional neighborhood developments.
The High-Density Neighborhood land use designation is slated for small areas within Hanahan’s Low-Density land use. High-Density Neighborhoods encompass multi-family residential developments.

Existing Conditions Report 15
Image Source: Base image from Hanahan Comprehensive Plan (2012), Study Area added as overlay
Figure 2-5: Hanahan FutureLand Use Map (Centered on Study Area)
Town of Moncks Corner Comprehensive Plan (2017)
The Town of Moncks Corner adopted their most recent comprehensive plan, including a future land use map, in 2017. The future land use map acts as an overlay to the Berkeley County future land use map; areas that are not specified with land use categorizations by the Town of Moncks Corner take on the land use character proposed by the County. See Figure 2-6 for specific land use designation locations and the approximate location of the US 52 study area boundaries.
Existing Conditions Report 16

Existing Conditions Report 17
Figure 2-6: Moncks Corner Future Land Use Map
High-Density Residential districts are located throughout the study area and are often situated between commercial and moderate-density residential land use designations. Moncks Corner includes single-family attached and multi-family developments in its High-Density Residential land use definition. These districts are intended to integrate high-density residences with nonresidential uses to create walkable communities.
Moncks Corner’s Downtown (Corner Renaissance) surrounds Main Street and intersects with US 52 at the northern end of the study area. This district is designated for future mixed-use development that can support nonresidential uses as well as higher density residential uses. Downtown development is intended to be walkable with a mix of building types and housing options.
The Commercial areas are located along US 52 and Old US 52, making up most future land use designations for parcels adjacent to the corridors within Moncks Corner. Commercial areas are designated for retail and services uses that are auto-oriented and incompatible with residential neighborhoods. These areas surround major transportation infrastructure and are developed in anticipation of future transit node locations. Future development should focus on increasing mobility and creating attractive entrance points.
Two Employment areas correspond with those set out in the Berkeley County Comprehensive Plan (2018) and are reserved for large-scale commercial and industrial development. Additional parcels at the northern end of the study area are established for Employment use with an emphasis on commercial and industrial development.
The Public/Institutional uses are located throughout the Moncks Corner portion of the study area. These land uses are already established, and future institutional facilities should be co-located with existing facilities where possible.
Recreation/Conservation or Green Spaces within Moncks Creek are located north of the designated Downtown area and at the northernmost point of the study area. These are areas prioritized for protection from development. There is also a Recreation Node envisioned east of Main Street, adjacent to Old US 52.
Prime North Charleston Comprehensive Plan (2020)
The North Charleston Comprehensive Plan was updated in 2020 and established a future land use map to guide the city’s development. See Figure 2-7 for specific land use designation locations and the approximate location of the US 52 study area boundaries.
Existing Conditions Report 18

Existing Conditions Report 19
Figure 2-7: North Charleston Future Land Use Map (Centered on Study Area)
The Suburban Residential land use category is located at the southernmost terminus of the study area and aims to support lower-density neighborhoods. Primary land uses are single-family detached homes with large yards and open space. This land use designation also supports mixed-use corridors, multi-family development, and commercial use where adjacent to Mixed-Use Corridor future land use designations and where compatible with Suburban Residential character.
The Mixed-Use land category is located north of the US 52/US 78 interchange. This designation supports a mix of residential and commercial use and is intended to promote compact, pedestrian-oriented developments. North Charleston will provide for increased density in areas supporting future transit centers.
Transit-Supportive Development Recommendations
Berkeley County establishes Town Centers as compact developments that encourage pedestrian mobility within the centers, while still accommodating vehicular accessibility; Town Centers also provide a full complement of services and amenities including access to future transit services. Town Centers may be up to 50 acres in size and must be within a one-mile radius of the associated intersection. Berkeley County also lists transit as a development strategy: public transit can centralize higher-density land uses, serving as a development incentive and providing more equitable access to jobs and housing opportunities.
Moncks Corner limits Commercial Areas to locations where major transportation infrastructure already exists and where transit nodes may develop in the future.
North Charleston’s Mixed-Use land use designations provide for increased density in areas surrounding transit centers. Ideal development in these areas will be walkable and compact, contain mixed uses, be near a transit stop/station, and have public spaces. Lowcountry Rapid Transit (LCRT) is a proposed bus rapid transit alignment that follows US 78 and US 52 with a station area at Melnick Drive and US 52 at the southern terminus of the corridor. Future station areas are identified as development nodes.
Growth Management Development Recommendations
Comprehensive plans for Goose Creek, Hanahan, Moncks Corner, and North Charleston all promote infill and increased density in areas with existing development and available infrastructure, allowing conservation and recreation areas to remain largely undeveloped.
Berkeley County has a Principal Growth Area (PGA) that includes the existing urbanized area, incorporated towns, and areas where infrastructure is available to support additional development. Priority areas for development within the PGA are existing and identified town and neighborhood centers.
2.1.3 FUTURE LAND USE PLANS: CORRIDOR-WIDE VISION
The jurisdictions within the study area each present their own future land use plans and aggregating these proposed land uses creates a corridor-wide vision. Figure 2-8 illustrates the proposed future land use distribution within the entire study area. For simplicity and consistency, future land uses have been generalized across municipal lines. For example, Goose Creek establishes a Downtown Mixed-Use District and a Neighborhood Mixed-Use District, and Moncks Corner calls for a Downtown District. All three of these districts have the same purpose: to establish an area of mixed residential and low-impact commercial uses, so they are categorized as mixed-use. Table 2-2 details the categorization for specific future land uses set forth within each jurisdiction’s comprehensive plan.
Existing
Report 20
Conditions
Existing Conditions Report 21
Commercial 561.63 acres 4.52% study area Conservation/ Recreation/ Open Space 1,336.38 acres 10.76% study area Employment 1,734.48 acres 13.97% study area Institutional 355.7 acres 2.86% study area Mixed Use 1,500.78 acres 12.09% study area Low Density Residential 4,704.76 acres 37.89% study area Medium Density Residential 1,947.79 15.69% High Density Residential 274.1 acres 2.21% study area
Figure
2-8: Future Land Use Percentages in Study Area
Figure 2-9 shows the proposed future land use designations. The proposed future land uses in the southern portion of the study area are primarily mixed-use and low/medium-density residential areas. Some conservation/recreation/open space, commercial, and institutional uses are interspersed south of Pine Grove Road From Pine Grove Road to Black Tom Road, the study area is primarily planned as low-density residential land use. Within this section, jurisdictions have proposed large employment centers, conservation/recreation/open space designations, concentrated nodes of medium and high-density residential, and a commercial area at the intersection of Cypress Gardens Road and US 52. The segment north of Black Tom Road has the greatest variety of future land uses, most of which are in Moncks Corner’s central downtown at the northern terminus of the corridor. All densities of residential land use are interspersed with institutional, employment, commercial, and conservation/recreational land uses at this end of the study area.
Existing Conditions Report 22
Map Key Land Use Berkeley County Land Use Goose Creek Land Use Hanahan Land Use Moncks Corner Land Use North Charleston Land Use Commercial Commercial District Commercial Conservation/ Recreation/ Open Space Conservation/ Recreation Conservation/ Recreation Recreation/ Open Space Employment Employment Employment Employment Institutional Institutional Public/Institutional Downtown MixedUse Neighborhood Mixed-Use Downtown Mixed-Use Mixed-Use Low-Density Residential Low-Density Suburban Low-Density Residential Low-Density Neighborhood Low-Density Residential Suburban Residential MediumDensity Residential Moderate-Density Suburban Moderate-Density Residential Medium-Density Residential High-Density Residential High-Density Neighborhood High-Density Residential
Table 2-2: County/Municipality Zoning Categories for Each Corresponding Land Use Category

Existing Conditions Report 23
Figure 2-9: Future Land Uses
2.2 Socioeconomic Conditions
This section summarizes socioeconomic trends in the study area, defined as the quarter-mile spatial buffer around the US 52 and Old US 52 corridors. Demographic data for this corridor is sourced at block group level from the US Census Bureau 2015-2019 American Community Survey (ACS) Five Year Estimates Future projections of population and employment are based on the traffic analysis zone (TAZ) level population forecasts from the CHATS Travel Demand Model, which is developed and maintained by the Berkeley-Charleston-Dorchester Council of Governments (BCDCOG).
For Census Block Groups and TAZs which were not contained completely within the study area, the share of their demographic and socioeconomic characteristics proportional to their area within the study area boundary was included in the summary. For example, if 20 percent of a block group’s area was within the study area, then 20 percent of its population and other socioeconomic characteristics were assumed to be a part of the study area. As a large part of the corridor is in Berkeley County and a small part is in Charleston County, demographic and socioeconomic summaries for the two counties are presented in the summary tables to provide geographic context.
2.2.1 POPULATION
The study area includes around 19,000 residents from 7,000 households. The majority of these households (72 percent) are family households, which is comparable to the household makeup in Berkeley County. While most households are family households in Charleston County as well, its share is lower compared to Berkeley County. The weighted average of median age for study area block groups was estimated to be 34.0, which is lower than both Berkeley and Charleston counties. Table 2-3 summarizes population and household characteristics.
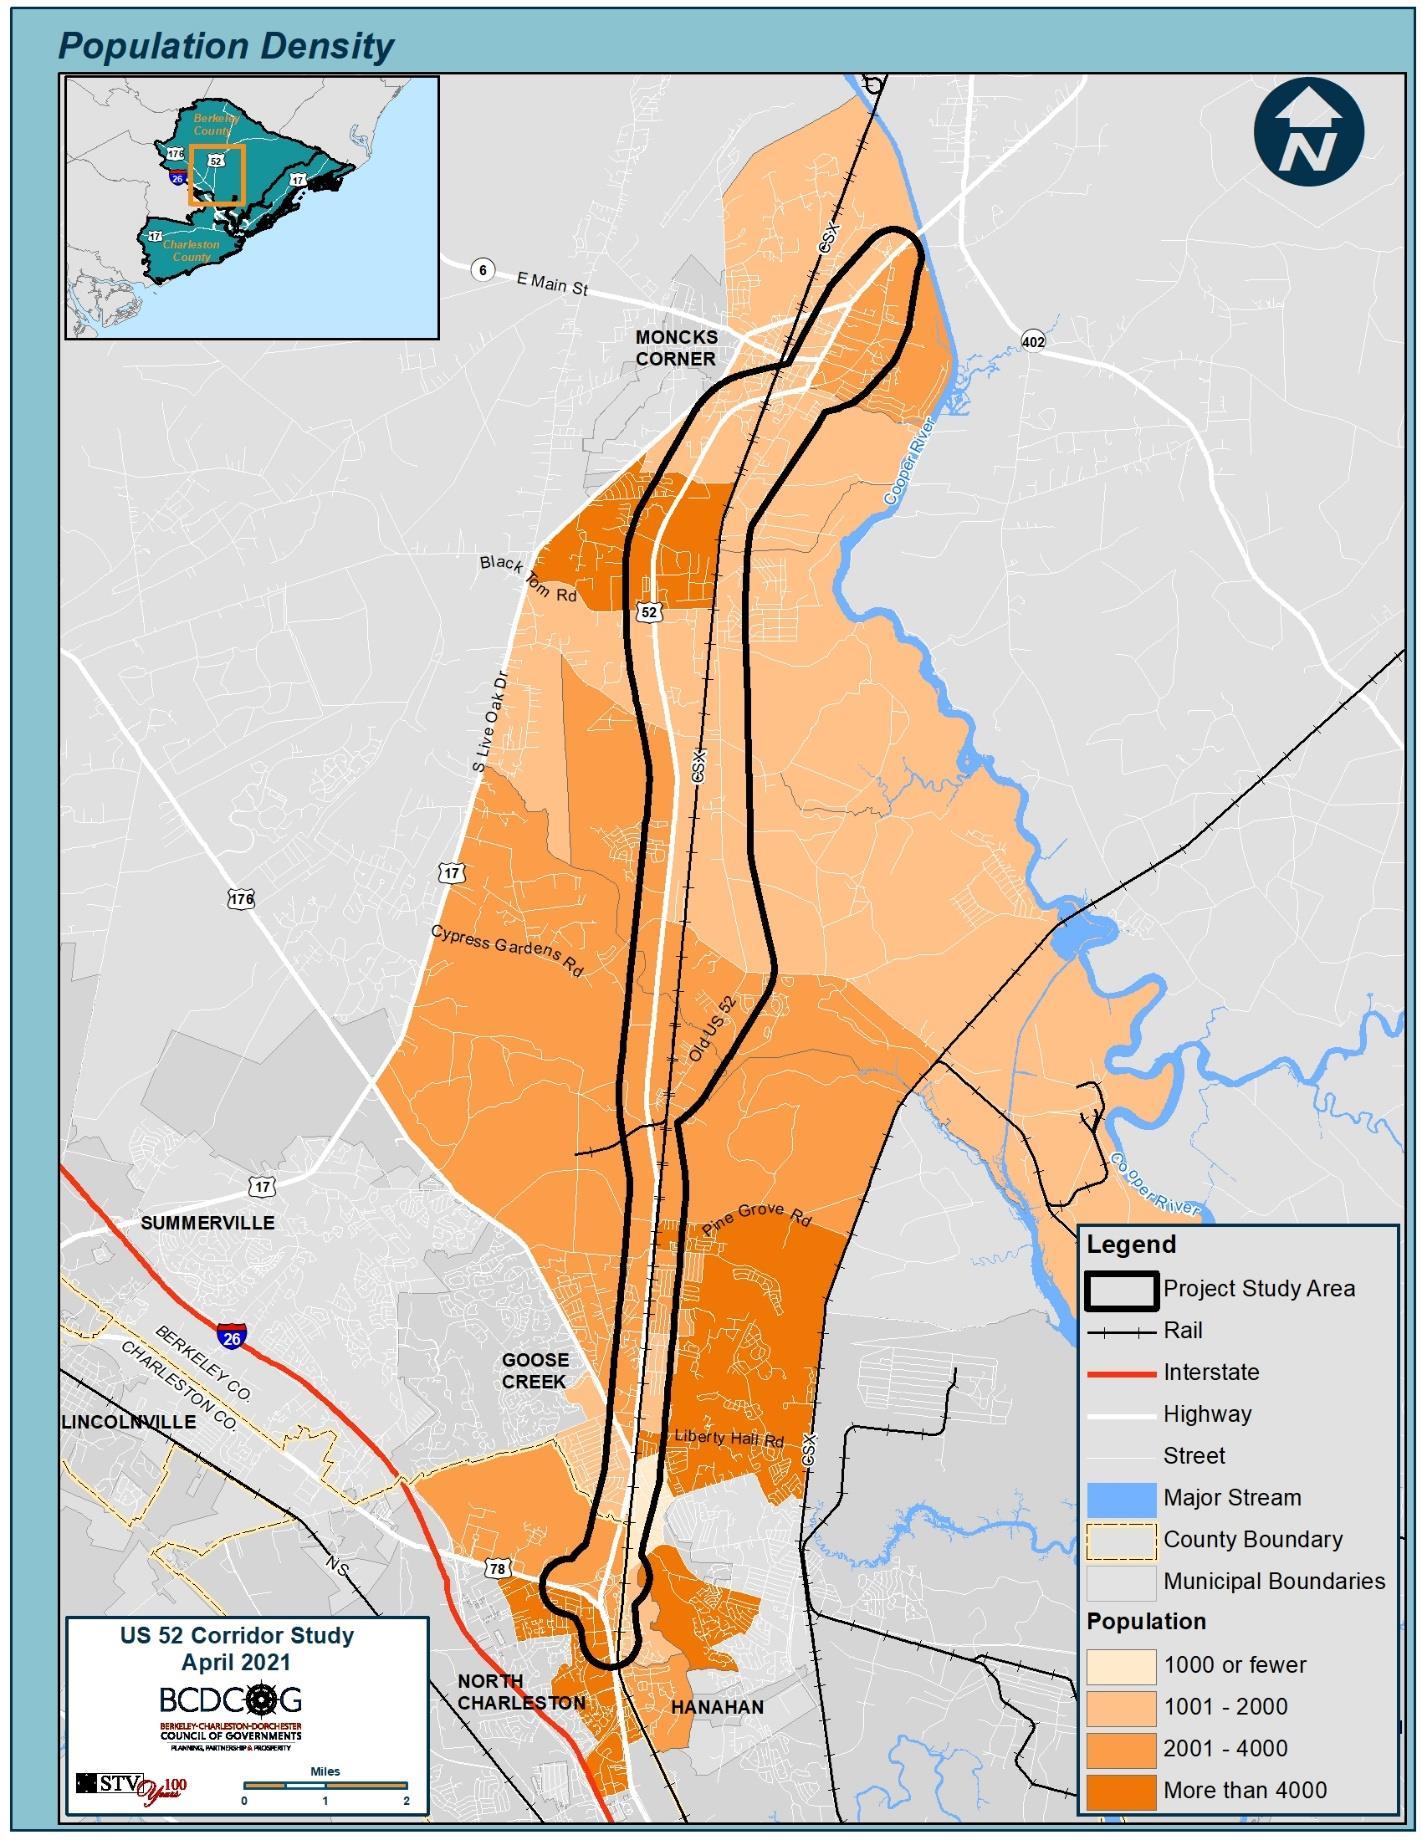
The central portion of the corridor, between Moncks Corner and Goose Creek, has a lower relative density than the rest of the corridor. Conversely, the southern part of corridor has a higher relative population density compared to the rest of the corridor. Figure 2-10 and Figure 2-11 illustrate population and population density of Census Block Groups overlapping the study area.
24 Existing Conditions Report
Area Population Median Age Households Family households Nonfamily Households Study Area 19,218 34.0 6,911 4,971 (72%) 1,940 (28%) Berkeley County 215,044 36.1 76,881 55,155 (72%) 21,726 (28%) Charleston County 401,165 37.8 159,195 92,380 (58%) 66,815 (42%)
Table 2-3: Population and Households in Study Area (ACS 2015-2019)
25
Conditions
Existing
Report
Figure 2-10: Study Area Population (ACS 2015-2019 Block Group Data)

26 Existing Conditions Report
Figure 2-11: Study Area Population Density (ACS 2015-2019 Block Group Data)
2.2.2 RACE AND ETHNICITY
Race and ethnicity data were sourced at block group level from the US Census Bureau 2015-2019 American Community Survey (ACS) Five Year Estimates. Nearly 43 percent of the study area population is considered minority which is higher than the proportionate minority population in either Berkeley or Charleston counties. Table 2-4 shows a summary of study area study area population by race in comparison to Berkeley and Charleston counties, while Figure 2-12 shows the make-up of the population by race. Black or African American was the largest minority group in the study area representing nearly a third of the population. Figure 2-13 illustrates the share of minority population in block groups overlapping the study area. Census Block Groups in the northern part of the corridor near Moncks Corner and those near the southern part of the corridor have a higher relative number of minority residents.
1 ACS table B03002 – Hispanic or Latino Origin by Race was used to estimate the table and figures. Hispanic or Latino origin population of all races is summarized separately as Hispanic population and is not included in their respective totals.
Existing Conditions Report
27
Area Population American Indian and Alaska Native Asian Black or African American Hispanic Native Hawaiian and Other Pacific Islander White Some other race Two or more races Total Minority Population Percent Minority Study Area 19,218 29 232 5,997 1,291 24 11,011 108 526 8,207 43% Berkeley County 215,044 792 4,726 51,286 14,206 188 136,645 671 6,530 78,399 36% Charleston County 401,165 717 6,036 106,449 20,591 269 258,868 627 7,608 142,297 35%
Table 2-4: Population by Race in Study Area (ACS 2015-2019) 1
Two or more races, 3%
Some other race, 1%
American Indian and Alaska Native, <1% Asian, 1%
Black or African American, 31%
White, 57%
Hispanic, 7%
Native Hawaiian and Other Pacific Islander, <1%
28 Existing Conditions Report
Figure 2-12: Percent Population by Race in Study Area (ACS 2015-2019 Block Group Data)2
–
2 ACS table B03002
Hispanic or Latino Origin by Race was used to estimate the table and figures. Hispanic or Latino origin population of all races is summarized separately as Hispanic population and is not included in their respective totals.

29 Existing
Report
Conditions
Figure 2-13: Percent Minority Population in Study Area (ACS 2015-2019 Block Group Data)
2.2.3 INCOME
Household income and poverty data is based on block group level data from the US Census Bureau 20152019 American Community Survey (ACS) Five Year Estimates Table 2-5 and Table 2-6 summarize populations with income below the poverty level and median household income within the study area, while providing contextual comparison with Berkeley and Charleston counties. The study area has higher relative percentage of residents living below the poverty level compared to Berkeley County as a whole and Charleston County.
Figure 2-14 and Figure 2-15 illustrate median household income and percent of population with income below poverty level. Census Block Groups near the northern and southern termini were observed to have higher relative share of the study area population living below the poverty line, while Census Block Groups in the central part of the corridor had a lower relative share of the study area population living below the poverty line.
30 Existing Conditions Report
Area Income in the past 12 months below poverty level Percent Poverty Study Area 2,942 16% Berkeley County 25,080 12% Charleston County 53,486 14%
Table 2-5: Households Living Below Poverty Level
Area Households Median Household Income Study Area 6,911 $58,051 Berkeley County 76,881 $63,309 Charleston County 159,195 $64,022
Table 2-6: Median Household Income
Existing Conditions Report

31
Figure 2-14: Median Household Income (ACS 2015-2019 Block Group Data)

32
Existing Conditions Report
Figure 2-15: Percent Population in Poverty (ACS 2015-2019 Block Group Data)
2.2.4 HOUSING
Housing characteristics are based on block group level data from the US Census Bureau 2015-2019 American Community Survey (ACS) Five Year Estimates Table 2-7 summarizes housing unit occupancy in the study area. A larger percentage of available housing within the corridor are occupied compared to Berkeley or Charleston counties. While the percentage of owner-occupied units within the study area is less than that in Berkeley County, it is higher than the percentage of owner-occupied units in Charleston County
Table 2-8 shows the age of the housing stock. On the other hand, in Charleston County, over a quarter of the housing units were built in 1969 or earlier. However, it should be noted that characteristics vary significantly within Charleston County itself, with the peninsula and islands developing very differently than the inland portion of the county. Therefore, some of the statistics may be skewed away from characteristics of the corridor.
Table 2-9 summarizes the median value of housing units and median gross rent per month. Median home value in the study area is similar to that in Berkeley County as a whole, while it is significantly lower than the median home value in Charleston County. Median gross rent, however, is similar across the study area, Berkeley County, and Charleston County.
Existing Conditions Report
33
Area Housing Units Occupied Owner occupied Renter occupied Vacant Study Area 7,424 6,911 (93%) 4,414 (59%) 2,497 (34%) 513 (7%) Berkeley County 84,098 76,881 (91%) 55,295 (66%) 21,586 (26%) 7,217 (9%) Charleston County 187,953 159,195 (85%) 97,986 (52%) 61,209 (33%) 28,758 (15%)
Table 2-7: Summary of Housing Units
Area Housing Units Built 2010 or later Built 2000 to 2009 Built 1990 to 1999 Built 1980 to 1989 Built 1970 to 1979 Built 1969 or earlier Study Area 7,424 1,170 (16%) 1,379 (19%) 1,081 (15%) 1,306 (18%) 1,252 (17%) 1,236 (17%) Berkeley County 84,098 12,591 (15%) 20,975 (25%) 13,868 (16%) 14,786 (18%) 12,613 (15%) 9,265 (11%) Charleston County 187,953 19,760 (11%) 32,755 (17%) 31,407 (17%) 28,841 (15%) 25,566 (14%) 49,624 (26%)
Table 2-8: Housing Units by Year of Construction
2.2.5 JOURNEY TO WORK
This section delves into the commute characteristics of residents. As these summary statistics are based on the US Census Bureau 2015-2019 American Community Survey (ACS) Five Year, any changes due to Covid-19 pandemic are not reflected in these summary statistics.
Table 2-10 summarizes the working age population and their participation in the labor force. The share of the population that is unemployed is similar across the study area, Berkeley County, and Charleston County.
Table 2-11 and Figure 2-16 summarize travel time to work for residents. Travel time distribution of study area residents is fairly similar to that of Berkeley County. However, it differs from Charleston County, with a higher percentage of residents in Charleston County experiencing a shorter commute.
Based on the Longitudinal Employer-Household Dynamics Origin-Destination Employment Statistics (LODES) data for the year 2018, 29,511 workers reside within the Census Block Groups intersecting the study area boundary. Of the 29,511 workers, 4,251 (14 percent) live within the study area’s Census Block Groups, while the rest – 25,296 workers (86 percent) are employed outside. Of the 29,511 workers residing in study area block groups, nearly 52 percent commute to Charleston County for their work, while just about a quarter of residents are employed in Berkeley County.
The study area’s Census Block Groups provide employment to nearly 26,339 workers, of which 22,154 (nearly 84 percent) reside outside the block groups. Of the 26,339 workers employed within the study area, nearly 42 percent reside in Berkeley County, while just over 20 percent live in Charleston County.
34 Existing Conditions Report
Area Median value (dollars) Median gross rent Study Area $184,285 $1,115 Berkeley County $185,500 $1,109 Charleston County $315,600 $1,190
Table 2-9: Median House Value and Gross Rent
Area Working Age Population Civilian Employed Armed Forces Unemployed Not in labor force Study Area 14,429 8,729 (60%) 226 (2%) 365 (3%) 5,109 (35%) Berkeley County 168,641 100,320 (59%) 4,741 (3%) 5,273 (3%) 58,307 (35%) Charleston County 329,650 204,353 (62%) 3,158 (1%) 7,814 (2%) 114,325 (35%)
Table 2-10: Summary of Labor Force
The commute mode share in the study area is similar to Berkeley County as a whole and Charleston County, as shown in Table 2-12. Driving alone is a predominant mode for commuting for work in the study area, similar to Berkeley and Charleston counties. Use of transit for commute seems minimal, but about 10 percent of workers carpooled to work.
35
Existing Conditions Report
Area Total workers Less than 15 minutes 15 to 29 minutes 30 to 44 minutes 45 to 59 minutes 60 or more minutes Study Area 8,437 1,750 (21%) 2,871 (34%) 2,207 (26%) 1,092 (13%) 517 (6%) Berkeley County 98,670 17,921 (18%) 35,798 (36%) 26,316 (27%) 11,337 (11%) 7,298 (7%) Charleston County 189,800 41,108 (22%) 83,019 (44%) 46,870 (25%) 11,992 (6%) 6,811 (4%)
Table 2-11: Travel Time to Work
Figure 2-16: Travel Time to Work
21% 18% 22% 34% 36% 44% 26% 27% 25% 13% 11% 6% 6% 7% 4% 0% 10% 20% 30% 40% 50% 60% 70% 80% 90% 100% Study
Less than 15 minutes 15 to 29 minutes 30 to 44 minutes 45 to 59 minutes 60 or more minutes
Area
Berkeley
County Charleston County
Table 2-13 and Figure 2-17 illustrate the time of departure for commute. Study area residents’ departure times peak between 6 AM to 8 AM. Charleston County residents left for work later than Berkeley County or study area residents, which seems consistent with their proximity to most jobs.
36 Existing Conditions Report
Area Drove alone Carpooled Public transportation (excluding taxicab) Walked Taxicab, motorcycle, bicycle, or other means Total number of workers Study Area 7,464 (88%) 802 (10%) 41 (<1%) 84 (1%) 46 (1%) 8,437 Berkeley County 84,569 (86%) 9,739 (10%) 410 (<1%) 2,727 (3%) 1,225 (1%) 98,670 Charleston County 160,760 (85%) 16,185 (9%) 2,381 (1%) 5,647 (3%) 4,827 (3%) 189,800
Table 2-12: Mode of Travel for Commute
Area Total workers 12:00 a.m. to 4:59 a.m. 5:00 a.m. to 5:59 a.m. 6:00 a.m. to 6:59 a.m. 7:00 a.m. to 7:59 a.m. 8:00 a.m. to 8:59 a.m. 9:00 a.m. to 9:59 a.m. 10:00 a.m. to 11:59 a.m. 12:00 p.m. to 3:59 p.m . 4:00 p.m. to 11:59 p.m. Study Area 8,437 391 (5%) 1,018 (12%) 2,223 (26%) 2,340 (28%) 1,213 (14%) 347 (4%) 215 (3%) 321 (4%) 369 (4%) Berkeley County 98,670 4,314 (4%) 12,872 (13%) 26,521 (27%) 23,598 (24%) 12,714 (13%) 4,488 (5%) 3,051 (3%) 4,863 (5%) 6,249 (6%) Charleston County 189,800 4,704 (2%) 9,099 (5%) 34,121 (18%) 56,413 (30%) 37,506 (20%) 16,189 (9%) 8,387 (4%) 11,451 (6%) 11,930 (6%)
Table 2-13: Time of Departure for Commute
Population and employment projections in this section are based on demographic data from the CHATS Travel Demand Model. As shown in Table 2-14, significant growth is projected in Berkeley County with 85 percent population growth and nearly 70 percent employment growth between 2020 and 2040. The study area population growth lags behind Berkeley County slightly, with projected population growth of 70 percent and employment growth of 42 percent but is projected to outperform the rates of population and employment growth in Charleston County (51 percent and 40 percent, respectively). The study area is expected to have nearly 36,500 residents and 12,500 jobs by 2040. As residents are projected to outnumber jobs in the corridor three to one, the majority of workers living within the corridor can be expected to continue to commute to employment centers outside the corridor in the future, assuming continuation of the development patterns similar to the existing conditions
37 Existing Conditions Report
Figure 2-17: Time of Departure for Commute 2.2.6 POPULATION AND EMPLOYMENT PROJECTIONS
Area Population in 2020 Employment in 2020 Population in 2040 Employment in 2040 Population –Change from 2020 to 2040 Employment –Change from 2020 to 2040 Population –Percent Change from 2020 to 2040 Employment –Percent Change from 2020 to 2040 Study Area 21,414 8,828 36,482 12,534 15,069 3,706 70% 42% Berkeley County 281,996 79,542 521,175 135,226 239,179 55,684 85% 70% Charleston County 430,451 300,717 651,420 419,801 220,969 119,084 51% 40% 5% 12% 26% 28% 14% 4% 3% 4% 4% 4% 13% 27% 24% 13% 5% 3% 5% 6% 2% 5% 18% 30% 20% 9% 4% 6% 6% 0% 5% 10% 15% 20% 25% 30% 35% 12:00 a.m. to 4:59 a.m. 5:00 a.m. to 5:59 a.m. 6:00 a.m. to 6:59 a.m. 7:00 a.m. to 7:59 a.m. 8:00 a.m. to 8:59 a.m. 9:00 a.m. to 9:59 a.m. 10:00 a.m. to 11:59 a.m. 12:00 p.m. to 3:59 p.m. 4:00 p.m. to 11:59 p.m. Study Area Berkeley County Charleston County
Table 2-14: Summary of Population and Employment Projections
Figure 2-18 and Figure 2-19 show the projected population in the study area by TAZs in 2020 and 2040 respectively. While the TAZs throughout the study area are expected to grow, higher growth seems to be clustered around the central part of the corridor.
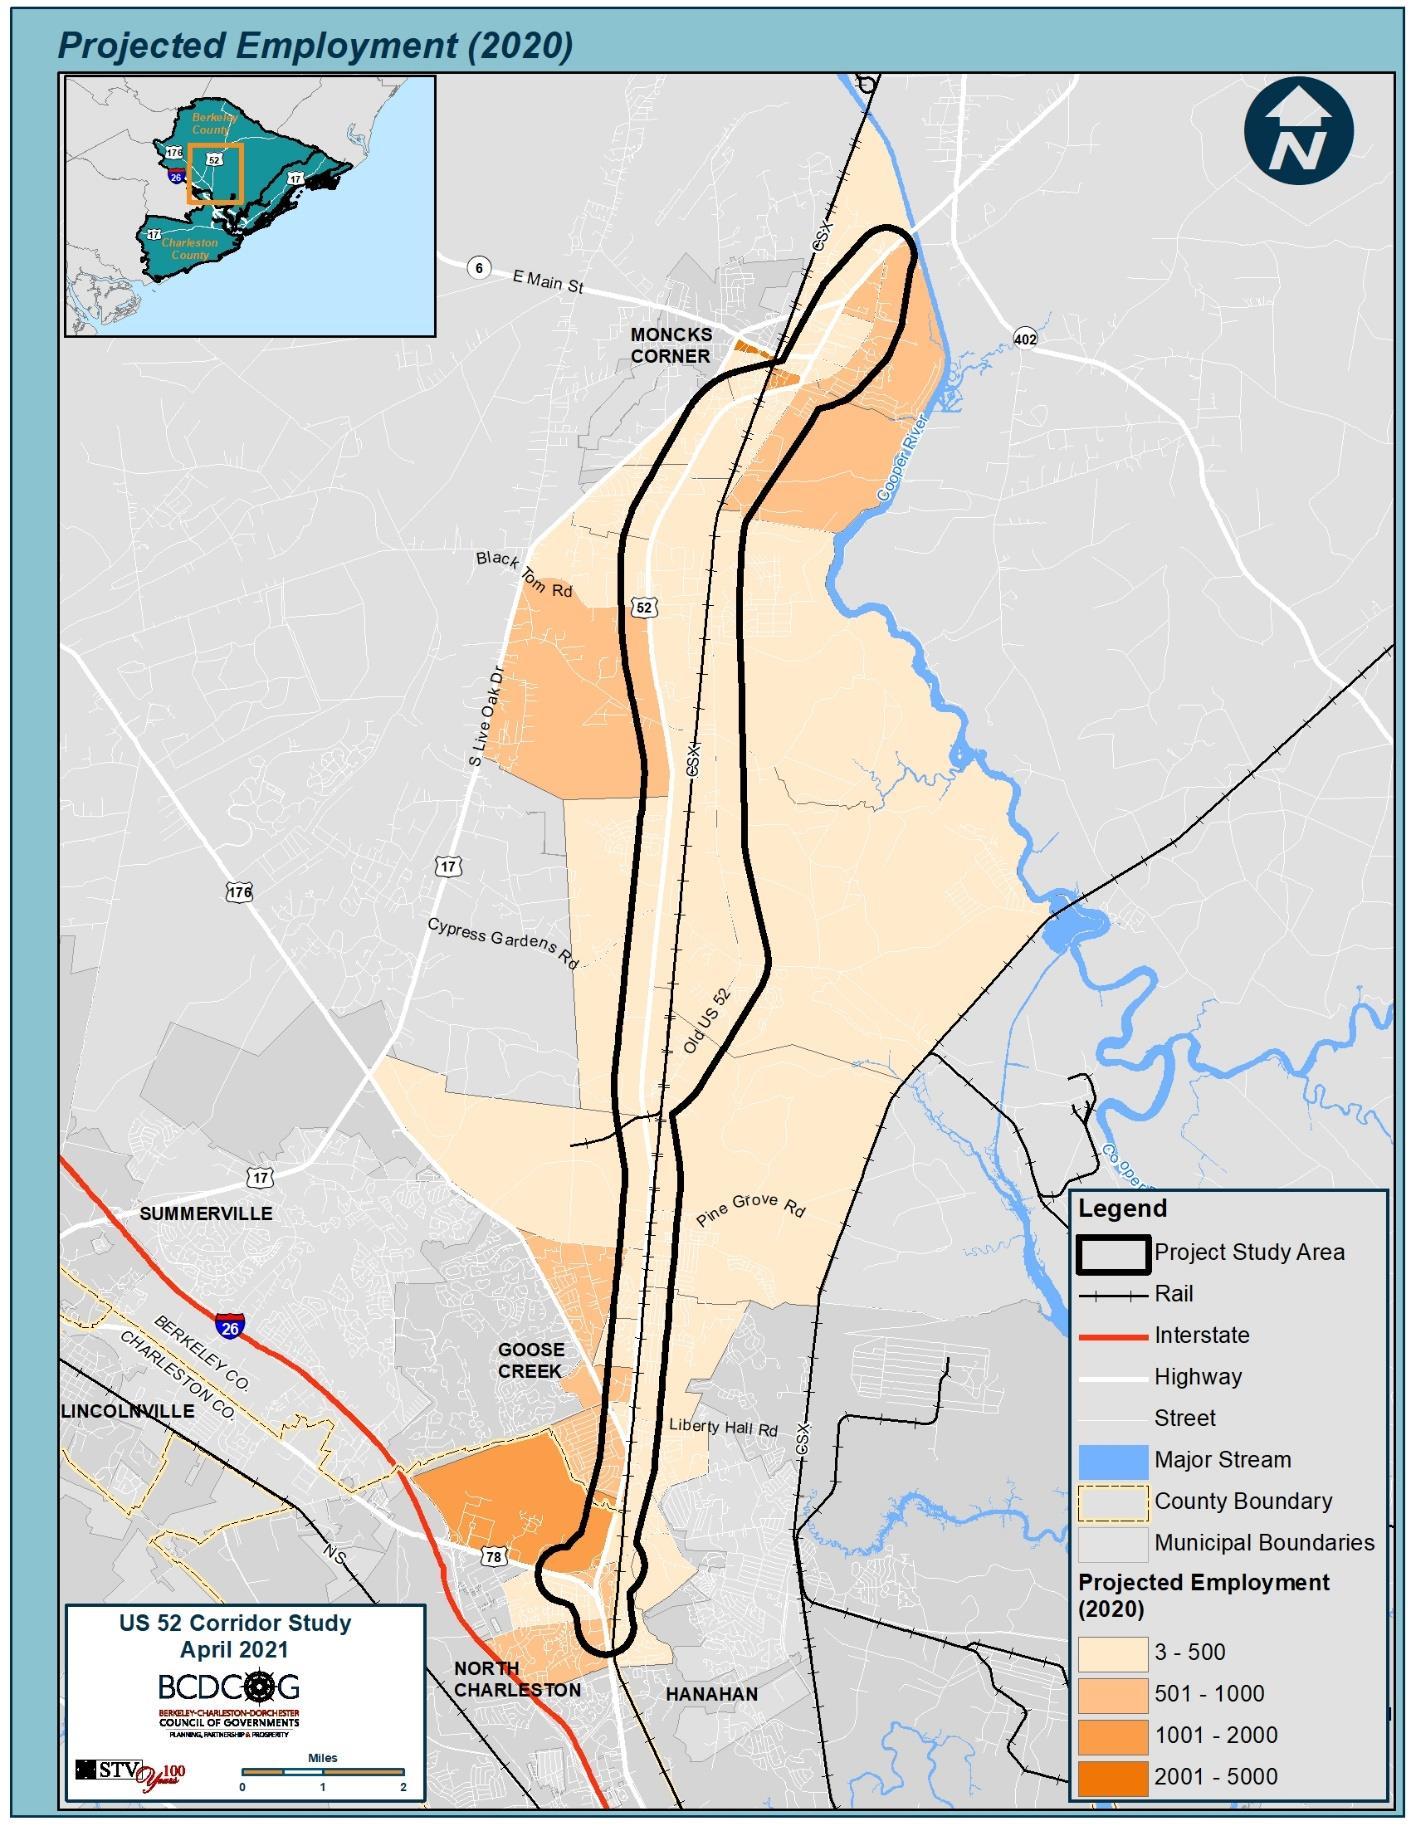
Figure 2-20 and Figure 2-21 illustrate projected employment in 2020 and 2040 respectively. Unlike the population growth, employment growth is not spread over the study area, but is expected to have more focused growth near northeastern and southwestern parts of the corridor.
As shown in Figure 2-22, Retail and Public Administration were the two largest employment sectors in the corridor in 2020, followed by Accommodation & Food Services, Healthcare, and Administrative & Support. Retail, Healthcare, and Education sectors are expected to experience the highest rates of growth in the study area, leading to Education sector breaking into the top five employment sectors by 2040. Figure 2-23 illustrates the share of each employment sector in the total expected growth in jobs from 2020 to 2040. Retail leads the group with nearly half of the projected job growth, followed by Healthcare and Education, which are projected to account for 17 percent and 9 percent of the total job growth, respectively. However, these projections are subject to change based on the future development patterns in the corridor. For example, Berkeley County is working on updating its Comprehensive Plan, which includes various development scenarios for the County. Some of these projections may need to be revisited after some of these ongoing planning efforts.
38 Existing Conditions Report

39 Existing Conditions Report
Figure 2-18: Projected Population in 2020 by TAZ

40
Report
Existing Conditions
Figure 2-19: Projected Population in 2040 by TAZ
41 Existing Conditions Report
Figure 2-20: Projected Employment in 2020 by TAZ

42 Existing Conditions Report
Figure 2-21: Projected Employment in 2040 by TAZ
43 Existing Conditions Report
2 0 290 254 301 180 1,624 91 134 359 136 233 0 575 503 736 94 1,148 558 1,601 5 0 0 0 5 147 53 1873 0 25 99 117 5 0 35 322 624 71 180 70 75 0 0 500 1000 1500 2000 2500 3000 3500 4000 Agriculture Mining Utilities Construction Manufacturing Wholesale Retail Transportation and Warehousing Information Finance and Insurance Real Estate Professional and Scientifc Management of companies Administrative and Support Education Healthcare Arts, Science and Recreation Accommodation and Food Services Other Services Public Administration Unclassified Employment (2020) Change in Employment (2020 to 2040)
Figure 2-22: Employment in 2020 and Change in Employment from 2020 to 2040 by Sector
44 Existing Conditions Report Figure
Manufacturing, 4% Wholesale, 1% Retail, 51% Information, 1% Finance & Insurance, 3% Real Estate, 3% Administrative & Support, 1% Education, 9% Healthcare, 17% Arts, Science, & Recreation, 2% Accomodation & Food Services, 5% Other Services, 2% Public Administration, 2%
2-23: Share of Employment Growth by Sector from 2020 to 2040
2.2.7 ENVIRONMENTAL JUSTICE POPULATION
As shown in Table 2-15, the study area population has a larger share of minority population and of population with incomes below the poverty level than Berkeley and Charleston counties Figure 2-24 illustrate the EJ population for minority and low-income persons, respectively. Block groups with a higher percentage of its population identifying as anything other than white than the surrounding county were identified as Minority EJ Populations. Similarly, block groups with a higher percentage of population with income below poverty level than the surrounding county were identified as Low Income EJ Population. The study area includes about 12 percent senior population, defined as those with age 65 or above, which is lower than the percent senior population in both Berkeley and Charleston counties.
Five percent of households within the corridor did not have access to a vehicle, which is lower than Charleston County but higher than Berkeley County. Figure 2-25 illustrates the percentage of households in each block group that do not have access to a vehicle.
With a possibility of virtual outreach due to the ongoing pandemic, the number of households without access to the internet were also identified to ensure appropriate strategies are in place for public outreach Figure 2-26 shows the percentage of households without access to the internet in each Census Block Group in the study area.
Table 2-15: Summary of Environmental Justice Population
45 Existing Conditions Report
Area Population Percent Minority Percent LowIncome Percent Senior Population (Age 65 or above) Households Households without access to a vehicle Households without internet access at home Study Area 19,218 43% 16% 2,384 (12%) 6,911 5% 15% Berkeley County 215,044 36% 12% 28,877 (13%) 76,881 4% 14% Charleston County 401,165 35% 14% 63,833 (16%) 159,195 7% 14%

46 Existing
Report
Conditions
Figure 2-24: Environmental Justice Populations

47 Existing Conditions Report
Figure 2-25: Households without Access to a Vehicle

48 Existing Conditions Report
Figure 2-26: Households without Access to the Internet
2.3 Human and Natural Environment
GISdataonenvironmentalfeatureswithintheUS52CorridorStudywasprovidedbytheBCDCOG and include data from BCDCOG, South Carolina Department of Healthand Environmental Control (SC DHEC), SC ArchSite, Homeland Infrastructure Foundation, and the Nature Conservancy. The GIS data reflects the most current data available (February 2021). Additional sources used to obtain information include the US Census Data, US Fish & Wildlife (USFWS) Endangered Species website, National Hydrography Dataset (NHD), the National Inventory Wetlands (NWI), and the Natural Resources Conservation Service(NRCS) websoil survey data. The websites for Charleston and Berkeley counties, the City of North Charleston, the City of Goose Creek, and the Town of Moncks Corner were also used. Figure 2-27 through Figure 2-31 depict the following existing humanandnaturalenvironmentalfeatureswithinastudyareaencompassingone-halfmileoneither side of US 52, Old US Highway 52, and US 52 Bypass for the length of the study corridor:
• NHD rivers and streams
• NWI wetlands and FEMA 100-year Flood Area floodplains
• Federally protected species
• Cultural resources including historic buildings and archaeological sites (SC ArchSite)
• Prime farmland
• Underground storage tanks (USTs)
• Parks, recreation facilities, and protected lands (BCDCOG)
• Community facilities including places of worship, health care, and schools, etc.
2.3.1 WATER RESOURCES
Waters of the United States (US) are defined by 33 CFR 328.3(a)-(c) and protectedby Section 404 of the Clean Water Act (CWA) and generally include wetlands, streams, and water bodies. The USArmyCorpofEngineers(USACE)regulatesWatersoftheUS.Whenindividual projects along the US 52 Corridor are identified for development, field surveys and delineations of wetland areas and streams and an evaluation of impacts and mitigation, will be required. Any project that proposes to place fill or discharge into Waters of the US will require a permit from the USACE.
SC DHEC also has jurisdiction over Waters of the US in South Carolina through Section 401 of the CWA. A Section 401 water quality certification from SC DHEC is required whenever a project needs a federal license or permit for an activity that may result in a discharge to Waters of the US.
Section 303 (d) of the CWA requires that all states develop a list of water bodies that do not meet water quality standards set by the US Environmental Protection Agency (EPA). The 303(d) list helps identify impaired waters, describes the source of impairment, and serves as a guide for corrective actions that can be implemented to improve water quality.
Floodplains are low-lying areas subject to periodic flooding during rain events and are located near rivers, streams, and water bodies. Federal agencies are required, as per Executive Order (EO) 11988 entitled “Floodplain Management,” to avoid making modifications to and supporting development infloodplainswherever practical.Severalfederal,state,andlocallawsfurthermandatetheprotection of floodplains and floodways. The Federal Emergency Management Agency (FEMA) regulate floodplains that are subject to inundation by the 1-percent annual chance flood event. FEMA
49 Existing Conditions Report
publishes maps representing areas of regulated floodplains and floodways. Local jurisdictions are responsible for floodplain management within their jurisdictions. FEMA regulated floodplains are located throughout the study area. 100-year flood areas are depicted on Figure 2-27 through Figure 2-31.
The National Hydrography Dataset (NHD) managed by the US Geological Survey (USGS) represents the surface water of the US used for mapping and modeling applications. The US 52 Corridor study area is located within the Santee River basin, one of South Carolina’s eight major river basins. The Santee River basin extends from the confluence of the Congaree and Wateree Rivers southeast to the Atlantic Ocean. This basin includes parts of nine South Carolina counties, including Berkeley and Charleston Counties. Furthermore, the study area is within the Cooper River watershed (Watershed No.03050201).
Streams, creeks, tributaries, and unnamed tributaries (UT) are located within the study area, with several crossing under US 52, Old US Highway 52, and US 52 Bypass. Based on GIS mapping, there are approximately 12 stream crossings on US 52, four stream crossings on Old US Highway 52, and two stream crossings on US 52 Bypass at the northern end of the study area.
The Tailrace Canal (Old Santee Canal) that connects the Cooper River to Lake Moultrie crosses US 52/US 17 Alt immediatelynorthof the study area boundary. Namedstreamsin the studyarea include Goose Creek, Lindley Branch, and Molly Branch. Goose Creek, a tributary to the Cooper River, crossesunderUS52atthesouthernendofthecorridorjustnorthoftheUS78(UniversityBoulevard) interchange. Goose Creek is on the South Carolina 2018 303(d) list of impaired water bodies. A water quality monitoring station is located at this crossing (Station No. MD-14). Goose Creek feeds GooseCreekreservoirwhichprovidespotablewaterfortheCooperRiverwatershed. LindleyBranch crosses US 52 north of the new Goose Creek City Fire Department headquarters and Molly Branch crosses US 52 and Old US Highway 52 between Oakley Road and Gaillard Road.
The US Fish and Wildlife Service (USFWS) of the US Department of the Interior (DOI) administers the National Wetland Inventory (NWI) program. The NWI is a publicly available resource that provides information on wetlands on a regional scale. The NWI information is used by federal, state, and local agencies and the private sector to determine location and distribution patterns to help conserve and restore wetlands. As shown in Figure 2-34, NWI wetlands are prevalent but scattered throughout the study area, mostly adjacent to or near creeks, streams, and UTs.
2.3.2 FEDERALLY PROTECTED SPECIES
Section 7 of the federal Endangered Species Act (ESA) mandates consultation with USFWS and the National Oceanic and Atmospheric Administration (NOAA) for projects that “may affect” federally protected species. Known occurrences of federally designated Threatened and Endangered (T&E) species located within the study area are shown in Figure 2-31. Individual projects along the US 52 Corridor will require field surveys for federally protected species and theirhabitats.Table2-16providesalistoftheUSFWSpotential occurrenceofT&Especieswithin Berkeley and Charleston counties.
There is one known bald eagle occurrence within the study area (Figure 2-31). The bald eagle is no longer protected under the ESA, but the species is afforded federal protection through the Bald and Golden Eagle Protection Act (BGEPA), as well as the Migratory Bird Treaty Act (MBTA). The BGEPA, 16 USC 668-668c, prohibits the “take” of bald eagles including their parts, nests, or eggs by anyone, without a permit issued by the Secretary of the Interior.
50 Existing Conditions Report
Name of Species
Table 2-16: Federally Listed Threatened and Endangered Species
Scientific Name
Frosted Flatwoods Salamander Ambystoma cingulatum
Bachman’s Warbler Vermivora bachmanii
American Chaffseed Schwalbea americana
Piping Plover Charadrius melodus
Eastern Black Rail Laterallus jamaicensis ssp.
jamaicensis
Kemp's Ridley Sea Turtle Lepidochelys kempii
Northern Long-Eared Bat Myotis septentrionalis
Status County
Threatened Berkeley, Charleston
Endangered Charleston
Endangered Berkeley, Charleston
Threatened Charleston
Threatened Charleston
Endangered Charleston
Threatened Berkeley, Charleston
Endangered Berkeley, Charleston, Red Knot Calidris canutus rufa
Red-Cockaded Woodpecker Picoides borealis
Threatened Charleston
Green Sea Turtle Chelonia mydas Threatened Charleston
Pondberry Lindera melissifolia
Loggerhead Sea Turtle Caretta caretta
Endangered Berkeley, Charleston
Threatened Charleston
Threatened Berkeley, Charleston, Leatherback Sea Turtle Dermochelys coriacea
Wood Stork Mycteria americana
Endangered Charleston
Threatened Berkeley, Charleston, Seabeach Amaranth Amaranthus pumilus
West Indian Manatee Trichechus manatus
Canby's Dropwort Oxypolis canbyi
Threatened Charleston
Endangered Berkeley, Charleston
Source: USFWS February 2021 Endangered Species | Home Page (fws.gov)
2.3.3 CULTURAL RESOURCES
Individual roadway projects along the US 52 Corridor using federal funds will be subject to Section 4(f) of the US Department of Transportation (USDOT) Act of 1966 (49 USC § 303) and 23 CFR § 771.135, as described in Section 7.8.3, which includes protection for significant historic sites. Historic sites protected by this regulation include sites that are eligible for listing or listed on the National Register of Historic Places (NRHP). In addition, all proposed projects will need to comply with Section 106 of the National Historic Preservation Act of 1966, codified as 36 CFR Part 800.
There are several known archaeological sites located within the study area. Most notably, a larger archaeological site is associated with the Gippy Plantation just east of Old US Highway 52 in Moncks Corner. Also, there are three historic sites listed on the NRHP: the Otranto Plantation in Hanahan, the Gippy Plantation in Moncks Corner, and the Old Santee Canal in Moncks Corner. Three additional historic sites have been determined to be eligible for the NRHP: the Oaks Plantation House, the Gippy Plantation House, and the Swamp Fox Drive-In Theater (see Figure 2-30).
2.3.4 PRIME FARMLAND
Created in 1981, the Farmland Protection Policy Act (FPPA) aims to prevent and lower the irreversible conversion of farmland to non-agricultural use by federal agencies. An evaluation must be completed when a federal project has the potential to impact farmlands. Certain activities are exempt from the FRRA, including projects within an urbanized or urban development area.
Using NRCS web soil survey data,prime farmland soilsare prevalent throughout the US 52 Corridor study area, including in the non-urbanized areas. These farmland soils are eligible for protection under the FPPA. Preliminary screening of farmland conversion impacts will need to be completed for federal projects within the US 52 Corridor to assess impacts to farmland soils.
51
Conditions Report
Existing
2.3.5 UNDERGROUND STORAGE TANKS
Using Berkeley County GIS data, nearly 40 known underground storage tank (UST) sites are located throughout the study area, with concentrations in the urbanized areas of Goose Creek and MoncksCorner.Projectsthatimpactthesesitesmayrequireremediationandcanresultinincreased constructioncosts.
The Berkeley County Landfill is located on the west side of US 52 in Moncks Corner just south of Oakley Road.
2.3.6 PARKS, RECREATION AND PROTECTED LANDS
Inadditiontosignificanthistoricresources,Section4(f)oftheUSDOTActalsoprovidesprotection for publicly owned parks, recreation areas, and wildlife and waterfowl refuges.
There are four public parks located within the study area of the US 52 Corridor Study. North Charleston Wannamaker County Park is located at the southern end of the project study area immediately west of US 52. The park has over 1,000 acres of woodlands and wetlands and provides nature-oriented activities for groups and families. Park amenities include the Whirlin’ Waters Adventure Waterpark, bike and boat rentals, picnic shelters and facility rental space for meetings and receptions, exercise and nature trails, playgrounds, and a dog park.
Etling Park, a small neighborhood park with a playground located in Goose Creek, is in a neighborhood just west of US 52 and south of US 78. Dennis Park next to the CSX rail line east of US 52 andjust south oftheMichael J.Heitzler Recreational Complexhas abaseball field and picnic tables.
Old Santee Canal Park is located east of US 52 Bypass at the northern end of the study area. The 195-acre park includes an Interactive Center that records the history of the area as far back as 4,000 B.C. Other attractions include four miles of boardwalks throughthe swamp and backwaters of Biggin Creek and the Berkeley County Museum & Heritage Center.
The Goose Creek Community Center and the Michael J. Heitzler Recreational Complex are both located on the west side of US 52 just south of the Old Mt. Holly Road intersection. The Town of Moncks Corner Regional Recreational Complex is partially located within the project study area on Main Street west of US 52. The complex has four baseball diamonds, other sports fields, basketball courts, and a market pavilion. The sports complex has direct access to US 52 via Peagler Way. The Town of Moncks Corner hosts several festivals and events at this complex throughout the year.
Three tracts of privately-owned, protected lands are located within the study area. A small part of the Blue House Swamp Tract of Medway Plantation is located within the study area east of Old US Highway 52 near the intersection with US 52 (Figure 2-27). The large Wappaoolah Plantation tract islocatedimmediatelyeast of Old US Highway 52 between Cypress Gardens Road and N.Mulberry Lane (Figure 2-28 and Figure 2-29). The Gippy Plantation tract is located further north just east of Old US Highway 52 off of Gilly Dike Road (Figure 2-30). All three tracts are part of the Lord Berkeley Conservation Trust, a private nonprofit organization that works with private landowners to secure conservation easements to restrict extensive development. Conservation easements are permanent and ensures that the land will be preserved in perpetuity.
52 Existing Conditions Report
2.3.7 COMMUNITY FACILITIES
Community facilities, including places of worship, schools, medical facilities, libraries, and parks, are mostly concentrated in the urbanized areas of Goose Creek and Moncks Corner (see Figures 227 through 2-31)
More than 20 places of worship are scattered throughout the study area. Two large cemeteries, Whispering Pines Memorial Gardens and St. James Goose Creek Chapel of Ease are located east of Old US 52 between US 52 and Cypress Gardens Road.
The North Charleston and Goose Creek area at the southern end of the study area has numerous childcare facilities, two medical facilities, three public parks, and a school. Wannamaker County Park and Etling Park arein North Charleston, and Dennis Park is in Goose Creek. The new Goose Creek City Fire Department headquarters is located on the east side of US 52 just north of the Button Hall Road intersection. Goose Creek Police Department, Goose Creek Community Center, and the Michael J. Heitzler Recreational Complex are all located on the west side of US 52 just south of the Old Mt. Holly Road intersection. The Goose Creek Rural Fire Department Station #2 is located across from the Goose Creek Community Center on Old Mt. Holly Road.
Berkeley Middle School in Moncks Corner is on US 17 Alt near the intersection with US 52 at the northern end of the study area. Also located in this area is a library and two medical centers, Moncks Corner Medical Plaza and Moncks Corner Medical Center. Moncks Corner Regional Recreational Complex on Main Street is partly located within the study area and the Berkeley County YMCA is located on US 52 Bypass just south of the Main Street intersection. Berkeley County Museum and Heritage Center is located within Old Santee Canal Park.
53 Existing Conditions Report


! ² å å ! ! ! ( ! ! ( ! ! ! ! ! ! # 0 # 0 # Æ [ Goose Cre ek Com m unity Center Goose Cre ek Rural Fi re Dep artm ent Sta t on 2 Goose Cre ek Pol ce Departme nt Otran to Pl antatio n The Oaks Plan tation House St Jame s' Church, Go ose Creek Michae J Heitzl er Recreationa l Com p e x G o o s e C r e e k Northwood Aca demy Bou der Blu ff Ele mentary Schoo WANNAMAKER PARK DENNIS PARK Environment al Constraint s I § ¨ 26 £ ¤ 52 £ ¤ 176 £ ¤ 52 CSX £ 78 BERKELEY COUNTY US 52 Corridor Study April 2021 0 0.3 0.6 Miles CSX North Charle ston Legend Pro ect S tudy Ar ea Ra l Inters at e Highway Street Ma or St ream Æ Libraries å Schools î P aces o f Wo rsh p ² Commun ity Cen ters ! Recreat ion Po ice S tations " Y F re Stat ions ! Undergr ound S torage Tanks Hist or c Si tes # Nat ona l Re gis ter # Pote nti al y E i g bl e Fede ral ly P rot ect ed S pec ies [ ® Water bird Co on y (Woo d S tor k) NWI Wetlands NHD Stre ams FEMA 10 0-year F ood A rea Pr vate y Protect ed Lan ds Pr m e F arm land Ope n Sp ace Pub ic P ark O l d M t H o l yl R d Blue House Swamp Tract of Medway Plantation Goose Cree k Hanahan
COUNTY £ ¤ 78 Goose Cree k
CHARLESTON
! ² å ! ! ! ! ! Æ Wh spering Pines Mem orial G ardens Goose Cre ek Com m unity Center Goose Cre ek Rural Fi re Dep artm ent Sta t on 2 Goose Cre ek Police Departme nt Michae J Heitzl er Recreationa l Com p e x Boul der Blu ff Ele mentary School DENNIS PARK Environment al Constraint s I £ ¤ 176 £ ¤ 52 CSX CypressGardensRd US 52 Corridor Study April 2021 0 0.3 0.6 Miles CSX St. James Goose Creek Chapel of Ease Wappaoolah Plantation Monc ks Corner £ ¤ 52 Legend Project S tudy Ar ea Rai Highway Street Major St ream Æ L brar es å Schoo s î P aces o f Wo rship ï Cemete ries ² Commun ty Cen ters ! Recreat ion Po ice S tations " Y F re Stat ions ! Undergr ound S torage Tanks NWI Wet ands NHD Stre ams FEMA 10 0-year Flood A rea Pr vate y Protect ed Lan ds Pr m e F arm land Ope n Sp ace Pub ic P ark O l d M t H o l yl R d Big H ouse Swamp Tract of Medway Plantation Old Highway 52 Goose Cree k
! ! ! ! ! ( ! ! ! [ b MollyBranch Environment al Constraint s I £ ¤ 17 £ ¤ 52 CSX CypressGardensRd US 52 Corridor Study April 2021 0 0.3 0.6 Miles CSX Wappaoolah Plantation Monc ks Corner £ ¤ 52 Legend Pro ect S tudy Ar ea Ra l Highway Street Ma or St ream î P aces o f Wo rship ! Undergr ound S torage Tanks Fede ral ly P rot ect ed S pec ies [ Bald Ea g e NWI Wet ands NHD Stre ams FEMA 10 0-year Flood A rea County Historic A reas Privately Protect ed Lan ds Prim e F arm and G a i l l a r d R d Blue House Swamp Tract of Medway Plantation Old Highway 52
Environment al Constraint s
Legend
Project S tudy Ar ea
Rai
Highway Street
Ma or St ream
Æ Libraries
å Schools
î P aces o f Wo rsh p
! Recreat ion
CSX
Gippy Pl anta tio n Gippy Pl anta tio n Hou se
Po ice S tations
Y Fire Stat ions
! Undergr ound S torage Tanks
p Boat Ra mp
Moncks Co rne r Fi re Dep artm ent
Berkele y County Sheriff s Office
Moncks Co rne r Po ice Departmen t
Moncks Co rne r Recreationa Com plex
Moncks Co rne r Fi re Dep artm ent Sta tion 1
YM CA
Hist oric Si tes
# Nat ona l Re gis ter
# Pote nti a ly Eli g bl e
Fede ral ly P rot ect ed S pec ies
b Bald Ea g e
®
Water bird Co on y (Woo d S tor k)
NWI Wet ands
NHD Stre ams
FEMA 10 0-year Flood A rea
Coun y Histor c A reas
Pr vate y Protect ed Lan ds
Pr m e F arm land
Ope n Sp ace
Berkele y M ddle Sch ool
CSX
Swam p Fox Drive-In Th eate r
State Patro l O ffice
Berkele y In term ediate Schoo l
Old Santee Cana l
! ! å å ! ! ! ! ! ! ! ! ! ( ! ! ! ! ! ! ! ! ! ! ! ( ! ! ! ! ! ! ( ! ! # 0
# 0 # 0 Æ [ [
#
MollyBranch Tailrace Canal
I
¤ 52
¤ 17 £ ¤ 17
¤ 52
£
£
£
¬ « 6 US 52 Corridor Study April 2021 0 0.3 0.6 Miles
"
[
[
¤
Wappaoolah Plantation Gippy Plantation Gippy Dairy Plant Monc ks Corner £
52
! ! ! ² Æ Æ [ [ ® [ E Main St Bl ack Tom Rd S Live Oak Dr Cypress GardensRd OldUS52 PineGrove Rd L iberty Hall Rd Monc ks Corner I En viro nmen tal Co n strain ts CHARLESTONCO . BERKELEYCO . NS £ ¤ 78 § ¨ 26 £ ¤ 17 Cooper Ri v re C S X ¬ 402 ¬ 6 £ ¤ 17 £ 52 Legend Proje ct Study Area Rail Interstate Highway Street Maj or Stream County Boundary Æ Libraries å School s î Pla ce s of Worsh ip ï Cemeteries ² Comm unity Ce nters ! Recrea tion Pol ice Stati ons " Y Fire Stations ! Underground Storage Tanks p Boat Ramp His tor ic Site s # Natio nal R egi ste r # Po te ntia lly Eli gi ble Fed er ally Pr ote cted Spe cies [ Ba ld Eag le [ Wa te rbi rd Col ony (Wood Stork) NWI We tlan ds NHD Strea ms FEMA 10 0yr Fl ood Area Privately Protected Land s Pri m e Fa rm lan d Ope n Space Pu bli c Park County Histo ri c Area s § ¨ 26 Charleston County Berkel ey County £ ¤ 17 £ 52 £ 17 £ 176 CSX US 52 Corridor Study April 2021 0 1 2 Miles Hanahan North Charle ston Goose Cree k
2.4 Transportation Network
2.4.1 ACTIVE TRANSPORTATION
Existing conditions along US 52 for bicycle and pedestrian facilities were analyzed in order to identify gaps in the bicycle and pedestrian network, identify insufficient bicycle and pedestrian facilities, and evaluate connectivity for active transportation in the overall study area.
2.4.1.1 Local Plans and Policies
The following local plans and studies were reviewed to evaluate existing conditions and proposed improvements for bicycle and pedestrian facilities along the US 52 Corridor. Each of these plans will be taken into consideration as potentially impacting active transportation recommendations contained in this study.
Goose Creek Hiker-Biker Trail Plan (2018)
BCDCOG Regional Transit Framework Plan (2018)
Moncks Corner Comprehensive Plan (2017) Walk Bike BCD Master Plan (2017)
BCDCOG Park and Ride Study (2018)
Goose Creek Comprehensive Plan Draft (2021)
Charleston Area Transportation Study (CHATS) 2040 Long Range Transportation Plan (2019)
BCDCOG Rural Long-Range Transportation Plan (2020)
Charleston Area Transportation Study 2040 Long Range Transportation Plan
Adopted in 2019, the Charleston Area Transportation Study (CHATS) 2040 Long Range Transportation Plan (LRTP) intends to guide the region towards a robust multimodal transportation system and addresses in detail the current and future needs for the CHATS transportation network.
Relevancy to the US 52 Corridor Study
• The CHATS 2040 Long Range Transportation Plan identifies US 52 (N Goose Creek Boulevard) as a “safety hot spot corridor” and is recommended for access management and intersection improvements at various points along the corridor.
• The CHATS Bicycle and Pedestrian chapter echoes recommendations made in the Walk Bike BCD Master Plan, recommending shared use path along US 52 (N Goose Creek Boulevard) from Sewee Drive to St. James Avenue.
• The plan recommends sidewalks on both sides of major roadways and along one side of collectors, minor arterials, and residential streets, if not both sides.
• Pedestrian and cyclist safety should be a priority at intersections; future designs should increase visibility, accessibility, and separation from vehicular traffic.
• Bicycle parking facilities should be installed at designated destination points throughout the CHATS area.
Existing Conditions Report 59
Walk Bike BCD
Adopted in 2017, the Walk Bike BCD plan envisions a network of infrastructure for active transportation so that walking and bicycling are a common part of everyday life. The plan establishes an overarching, long-term vision for active transportation in Berkeley, Charleston, and Dorchester counties.
Relevancy to the US 52 Corridor Study
• Identifies the corridor as a bicycle and pedestrian opportunity
• Categorizes US 52/78 as a constraint that limits bicycle and pedestrian mobility and poses serious safety concerns.
• Identifies the corridor as having a higher active transportation demand.
• Identifies the corridor as having a high level of bicycle level of traffic stress, meaning bicyclists experience decreased comfort due to the number of adjacent motor vehicle lanes, posted speed limit, and a lack of existing bikeway facilities.
• Notes that bicyclist- and pedestrian-involved collisions and injuries have increased over the last five years of available data.
• Recommends linear and spot improvements along the corridor, including recommended intersection projects at the intersection of US 52 and US 176, Stephanie Drive, Old Mount Holly Road at Henry Brown Jr. Boulevard and Rembert C. Dennis Boulevard.
• Includes recommendations for a shared-use path along the entire project corridor from Moncks Corner to Goose Creek, connecting the two municipalities as well as employment centers along the corridor
• Recommends paved shoulders or bicycle lanes along Old Highway 52.
• Recommends a shared-use path along Old Highway 52 between Gaillard Road and Rembert C. Dennis Boulevard.
Goose Creek Hiker-Biker Trail
Master Plan
The City of Goose Creek published a Hiker-Biker Trail Master Plan in 2018. The plan is a single map depicting the proposed city bike trail, future city bike trail, downtown sidewalk system, existing sidewalk system, existing city bike trail, and the private Crowfield Trail System.
Relevancy to the US 52 Corridor Study
The plan recommends a “city bike trail” connecting Thomason Boulevard to Liberty Hall Road across US 52 and connecting Old Mount Holly Road to Montague Plantation Road across US 52.
Goose Creek Comprehensive Plan Draft
The purpose of the Goose Creek Comprehensive Plan is to guide growth and development. The plan includes an inventory of existing conditions, a vision statement with corresponding needs and goals, an assessment of the nine elements of a comprehensive plan required by state law, and an implementation strategy with practical steps, actions, responsible parties, and designated timeframes for achievement.
Relevancy to the US 52 Corridor Study
Part 1 of the Goose Creek Comprehensive Plan discusses Micromobility within the municipality. The section highlights the existing walkway network including the Crowfield Plantation Trails and the Goose Creek Trail system. Goose Creek represents a high demand for walking and biking within the tri-county region; according to the American Community Survey 5-year estimates, approximately 10.8% of Goose
Existing Conditions Report 60
Creek residents walk as their primary mode to work. This outpaces the 2.1% statewide and 2.7% nationwide walk-commute rate. The Goose Creek Comprehensive Plan delineates proposed sidewalk, side path, shared-use path, separated bike lane, and at-grade pedestrian crossing projects. While some of these projects overlap with the Walk Bike BCD plan proposed improvements, others are specific to this plan.
BCDCOG Regional Transit Framework Plan
Published in 2018, the Regional Framework Transit Plan provides recommendations on how the region will continue to establish a true multimodal transportation network.
Relevancy to the US 52 Corridor Study
• The BCDCOG Regional Transit Framework Plan identifies the US 52 Corridor as a HighCapacity Transit (HCT) Corridor that serves wide-ranging needs, connects the region, enhances quality of life, and supports economic growth and development.
• Projected daily transit ridership of the US 52 HCT Corridor from Moncks Corner is projected to be approximately 4,400 riders daily by 2040.
• In order to establish a multimodal transportation network, a mid-term goal identified within the plan (5-10 years) is to implement bicycle and pedestrian improvements on HCT corridors wherever possible; improvements such as enhanced transit stops, sidewalk improvements, and bicycle-to-transit connections are proposed.
In addition to the local plan review, SCDOT intersection, bicycle and pedestrian count data was collected, and SCDOT crash data was analyzed to assess bicycle and pedestrian conditions along the project corridor.
2.4.1.2 Existing Active Transportation Network
Transit Service and Active Transportation
Access to transit is an important element of the region’s mobility, providing choice, particularly when combined with walking and biking. Bicycle and pedestrian amenities increase access to transit, which can contribute to an increase in transit ridership and overall levels of active transportation
Currently, four primary transit routes travel within the study area:
• TriCounty Link CS1 Moncks Corner-North Charleston fixed route along US 52;
• TriCounty Link B102 Moncks Corner-Hanahan-Goose Creek fixed route along US 52 and surrounding areas
• CARTA Route 10 Trident Medical Center/HealthSouth fixed route, along US 78 and US 52 continuing to North Charleston and Downtown Charleston; and,
• CARTA Route 12 Upper Dorchester/Ashley Phosphate Road fixed route serves the Melnick Park-and-Ride continuing along US 52/Rivers to Ashley Phosphate and the CARTA Express 1 (James Island-North Charleston) express route serving the Melnick Park-and-Ride and continues along US 52 south to Downtown Charleston and James Island
Five additional TCL routes operate in some part of the study area, generally in Moncks Corner:
• B101: Moncks Corner/Jamestown
Existing Conditions Report 61
• B105: Moncks Corner/Mt. Pleasant
• CS2: Summerville/North Charleston
• CS5: Moncks Corner/St. Stephen/Salter
• CS8: Moncks Corner Link to Lunch
There are four Park-and-Ride locations within the study area, serving as transit stops:
• Moncks Corner, US 52, and Riverwood Drive; currently there are no bicycle or pedestrian facilities serving this site
• Moncks Corner, US 52, and Altman Street; currently there are no bicycle or pedestrian facilities directly serving this site, however, there are crosswalks located at the Altman Street and US 52 intersection
• Goose Creek, Button Hall Avenue, and US 52; there is a crosswalk on the western side of the Button Hall Avenue and US 52 intersection. Additionally, there is a sidewalk along Button Hall Avenue connecting to US 52.
• North Charleston, Melnick Drive, and Antler Drive; currently, sidewalks exist around the Park and Ride site, but do not connect to the US 52 corridor. Sidewalks exist along one side of Antler Drive and Otranto Road and connect to US 52. Additionally, there is a sidewalk along the south side of Melnick Drive connecting to US 52 north of the Park-and-Ride site. There are no designated bicycle facilities serving this site.
As noted above, existing Park-and-Ride locations contain very little to no bicycle and pedestrian connections to surrounding areas.
Moncks Corner
The Moncks Corner section of US 52 is a two-lane principal arterial transitioning into a four-lane divided highway at the intersection of US 52 at Rembert C. Dennis Boulevard/Old US 52. There are segments of a 6-lane section with center turn lanes. According to 2019 SCDOT traffic counts, approximately 20,300 vehicles per day (VPD) travel along the Moncks Corner section of the US 52 corridor. There are medians throughout the 4-lane divided highway in the Moncks Corner section and no medians within the two-lane section; these medians currently serve as the only form of pedestrian refuge along the automobiledominated corridor. As a result, this section of the corridor is unhospitable to pedestrian or bicycle traffic and currently contains very limited bicycle facilities and intermittent pedestrian facilities within the study area.
Existing Bicycle Facilities: Moncks Corner
• The Swamp Fox Passage of the Palmetto Trail is located north of the corridor and provides access to Francis Marion National Forest. The Swamp Fox Passage is the longest section of the crossstate Palmetto Trail at 47.6 miles in length. While bicyclists can bicycle along the Swamp Fox Passage, it is primarily used as a pedestrian facility.
Additionally, the Coastal Route, one of the SCDOT Parks, Recreation and Tourism Touring Routes, is a signed bicycle route that bisects the US 52 project corridor in Moncks Corner, traveling along Black Tom Road/Galliard Road towards Old Fort Road/Old US 52, then traveling southeast on SC 402. The signed route provides suggested bicycle connectivity without providing separate bicycle facilities. The Coastal Route roughly parallels the coastline for almost 230 miles and is designed as the Adventure Cycling Association’s Virginia to Florida Route.
Existing
Report 62
Conditions
Currently, there are no additional on- or off-street bicycle facilities in Moncks Corner; bicyclists share the outermost lane with vehicular traffic.
Existing Pedestrian Facilities: Moncks Corner
• Crosswalks exist at the intersections of US 52 and East Main Street and the intersection of US 52 at Rembert C. Dennis Boulevard/Old US 52.
• Much of the existing sidewalk network is located along North Live Oak Drive and US 52; these sidewalks serve the primary commercial corridor in Moncks Corner.
• Existing sidewalk facilities are sparsely and intermittently located within neighborhoods and apartment complexes adjacent to the corridor.
Walk Bike BCD Plan proposes bicycle and pedestrian improvements within the Moncks Corner project area, including high-priority pedestrian spot improvements at the intersection of US 17 Alt/US 52 and US 52/ East Main Street in Moncks Corner.
Existing Conditions Report 63
Figure 2-32 depicts existing bicycle and pedestrian facilities within Moncks Corner.

Existing Conditions Report 64
Figure 2-32: Moncks Corner Bicycle and Pedestrian Facilities
Central US 52
The Central section of the corridor is primarily a four-lane divided highway. According to 2019 SCDOT traffic counts, approximately 35,200 VPD travel along this section of the US 52 corridor and there are several bicycle and pedestrian destinations including Foxbank Elementary School, a large number of homes, Freedom Church, Bethel Church, and Pelican’s Snoballs. A CSX railway runs parallel to US 52 and spatially constrains future development
Existing Bicycle Facilities: Central US 52
Currently, the US 52 corridor is an automobile-dominated roadway. The central portion of the US 52 corridor does not provide bicycle facilities.
Existing Pedestrian Facilities: Central US 52
There are no existing sidewalks or crosswalks within the central portion of the US 52 corridor. Pedestrian connectivity in the Central US 52 is hindered by the automobile-dominated roadway, speed of the roadway, and constrained right-of-way.
Existing Conditions Report 65
Figure 2-33 depicts existing bicycle and pedestrian facilities within Central US 52.

Existing Conditions Report 66
Figure 2-33: Central US 52 Bicycle and Pedestrian Facilities
North Charleston/Goose Creek
The North Charleston/Goose Creek section of the corridor changes from a four-lane divided highway to a six-lane divided highway with portions of eight-lane sections with turn lanes at each signalized intersection. According to 2019 SCDOT traffic counts, approximately 56,400 VPD travel along this section of the corridor each day. A CSX railway runs adjacent to the US 52 corridor on the eastern side and constrains future development of bicycle and pedestrian destinations and infrastructure. Crash data, obtained from SCDOT, indicates that between 2016 and 2020, there were 13 bicycle- and pedestrianrelated crashes within the Goose Creek area of the project corridor. The North Charleston/Goose Creek section of the US 52 corridor is the most robust in terms of existing bicycle and pedestrian infrastructure.
Existing Bicycle Facilities: North Charleston/Goose Creek
• Approximately six miles of the existing 7.25-mile city bike trail system fall within the study area. The existing bike trail runs along US 52, serving the Goose Creek Community Center, Municipal and Recreation Complexes, and Windsor Mill Road The trail continues along US 52 from Camelot Drive to the US 78/US 52 intersection and terminates at the US 52 at Otranto Road intersection.
• Approximately 250 feet of the Crowfield Plantation Trail, a private multi-use path, is located along Westview Boulevard within the study area.
Proposed Bicycle Facilities
• There are 5.8 miles of proposed city bike trails within the study area, located at US 52 and Liberty Hall Road and Old Mount Holly Road, north of the Goose Creek Community Center, along the US 52 at Red Bank Road intersection, and along US 78 towards the US 52 at Otranto Road intersection continuing south towards North Charleston.
• A proposed bicycle trail is planned along Montague Plantation Road, intersecting with US 52. A proposed city bike trail plans to connect to the future bike trail along Montague Plantation Road with the existing city bike trail at Goose Creek Community Center.
The Walk Bike BCD plan proposes bicycle and pedestrian improvements within the Goose Creek/North Charleston study area:
• The Walk Bike BCD plan also recommends paved shoulders or bicycle lanes along Old Highway 52 and Red Bank Road; these roads are parallel or perpendicular to and intersect the US 52 corridor, respectively. Additionally, the plan recommends a shared-use path along US 52 for the length of the study corridor where gaps exist, a shared-use path along Old Highway 52 between Gaillard Road and Rembert C. Dennis Boulevard, and a paved shoulder on Old Highway 52 between Cypress Gardens Road and Gaillard Road.
• In addition, SCDOT has proposed adding crosswalks at US 52 and Button Hall Avenue and US 52 and Liberty Hall Road
Existing Pedestrian Facilities: North Charleston/Goose Creek
• The only crosswalks in the study area within this segment exist at the intersection of US 52 at Windsor Mill Road and at Otranto Road.
Existing Conditions Report 67
• Goose Creek has 116 miles of existing sidewalks and 2.65 miles of additional sidewalks as a part of the downtown sidewalk system. Of the approximately 118 miles of sidewalk within the city, approximately 16 miles are located within the study area.
• Neighborhood sidewalks are located along US 176 (St. James Avenue) and Red Bank Road.
• The downtown sidewalk system connects St. James Avenue, near Westview Primary Middle and Elementary Schools, to US 52; it also connects St. James Avenue to Liberty Hall Road.
• The Goose Creek City Trail is intermittent along the western side of US 52 running south towards North Charleston.
• A series of sidewalks are planned for major connections within the existing network; along:
o Henry E. Brown Jr. Boulevard
o Amy Drive
o Old Moncks Corner Road
o Westview Boulevard.
• Mid-level spot improvements refer to the phasing of the plan. Each project was scored on safety, active transportation demand and supply, equity and transit access, local access, regional access, and network connectivity. Walk Bike BCD discusses priorities as Phase I-V. Pedestrian spot improvements are proposed along US 52 at the intersections of:
o US 52 at US 176 - Phase 2
o US 52 at Stephanie Dr - Phase 1
o US 52 at Old Mount Holly Rd/Henry Brown Jr Blvd - Phase 3
o US 52 at Old Highway 52 - Phase 1
• Walk Bike BCD recommends sidewalks on:
o Liberty Hall Road and Amy Drive east of the US 52 Corridor
o Red Bank Road between US 52 and N. Rhett Avenue/ Henry Brown Jr Boulevard
o Liberty Hall Road between US 52 and Henry Brown Jr Boulevard
o Hollywood Drive between US 52 and Amy Drive
o Stephanie Drive between U S52 and Amy Drive
Existing Conditions Report 68
Figure 2-34 depicts existing bicycle and pedestrian facilities within North Charleston/Goose Creek

Existing Conditions Report 69
Figure 2-34: Goose Creek Bicycle and Pedestrian Facilities
2.4.1.3 Deficiencies and Needs Assessment
A safe and direct active transportation network provides convenient access to key destinations, while minimizing exposure to motor vehicle traffic. In addition to physical safety, user comfort is an important aspect of implementing a multimodal network. Bicycle infrastructure along the US 52 corridor is sporadic and disconnected, and at present the facilities that do exist are largely insufficient for safe cycling. With the exception of the existing intermittent Goose Creek City Trail, side paths and shared-use paths do not exist within the study area. Though local plans and data indicate a demand for enhanced bicycle and pedestrian facilities within the communities, the existing speed and volume of vehicular traffic and varied densities of driveways and curb cuts along the corridor create potential conflicts and safety issues between bicycle, pedestrian, and automobiles.
As growth and development continue along the corridor, the need for safe and accessible bicycle and pedestrian connections across and along the corridor will increase. BRT Lite is recommended along the corridor which would include stops and stations. Additionally, the proposed Lowcountry Rapid Transit alignment follows US 78 and US 52 with a station area planned at Otranto Road and US 52 at the southern terminus of the study area. This transit infrastructure and station areas, identified as nodes, would necessitate the need for bicycle and pedestrian accessibility and connectivity.
Because US 52 has grown to primarily serve vehicular traffic, connections that could provide easy movement for pedestrians and bicycles have considerable gaps that must be closed in order to implement a vision of a well-connected, multimodal corridor, linking people with jobs, transit, and recreational opportunities. Specific bicycle and pedestrian recommendations and improvements at key location are included in the Lane Use Scenarios section of this report.
Existing Conditions Report 70
2.4.2 TRANSIT
2.4.2.1 Existing Transit Services
The US 52 corridor is served by TriCounty Link (TCL), the rural bus service operating in Berkeley, Charleston, and Dorchester counties. The TCL system is comprised of eleven regular fixed routes and five commuter routes. The ten fixed routes include a route deviation option, which allows drivers to go up to three-quarter mile off the fixed route alignment to pick up customers that cannot meet the bus at designated stop locations. These routes do not have marked bus stops but rather operate on a flag stop basis which means they will stop at the location where a rider is “flagging” them down, provided it is safe to do so. TCL uses cutaway buses exclusively which have a seating capacity up to 32 passengers.
There are two TCL bus routes operating entirely along US 52, with connections to other routes on both the north and south ends of the corridor. These routes stop at four park and ride lots in the corridor.
“Commuter Solution” (CS) Route CS1, which originates at the US 52/Riverwood Drive (Santee Cooper) Park and Ride lot at the north end of Moncks Corner, travels along US 52. It has stops at the park and ride lots at US 52/Altman Avenue (Berkeley County Administration Building) in Moncks Corner; at US 52/Button Hall Avenue in Goose Creek and terminates at the CARTA Melnick Drive/Antler Drive (Rivers Avenue) Park and Ride lot, North Charleston. On the north end, the route connects with TCL Route CS4 to and from the towns of St. Stephen and Cross. On the south end, the route connects with fixed route bus service operated by the Charleston Area Regional Transportation Authority (CARTA). CARTA operates public transportation in the metropolitan area of Charleston.
There are eight scheduled weekday round trips on TCL Route CS1, with four operated during morning and four in the afternoon and evening peak periods, at 30 to 60 minute intervals. Scheduled end-to-end running time is 45 minutes. Unlike TCL local routes which uses flag stops, commuter routes only stop at timepoints listed in published timetables; all stops are at the park and ride lots along US 52. The route has a heavy concentration of reverse commuters who work at Santee Cooper, one of the park and ride stops.
TCL local route B102 also uses a major portion of US 52 between Moncks Corner and Goose Creek. This route consists of a single morning trip operating over a broad, triangular loop originating at the TCL garage in Moncks Corner and then serving Summerville, Goose Creek, the Melnick/Antler (Rivers Avenue) Park and Ride lot, Yeamans Hall Plaza Shopping Center, Goose Creek High School, Family Dollar in Goose Creek, then returning to Moncks Corner via US 52. This loop is reversed for the only other trip, conducted in the early afternoon. The morning trip is scheduled to take 3 hours 50 minutes and the afternoon trip 3 hours 30 minutes.
71
Report
Existing Conditions

72 Existing Conditions Report
Figure 2-35: Existing Transit
Five additional TCL routes operate in some part of the study area, generally in Moncks Corner:2
• B101: Moncks Corner/Jamestown (2 round trips daily)
• B105: Moncks Corner/Mt. Pleasant (2 round trips daily)
• CS2: Summerville/North Charleston (11 daily trips, peak periods only)
• CS5: Moncks Corner/St. Stephen/Salter (2 round trips daily)
• CS8: Moncks Corner Link to Lunch (midday demand response service)
Fares on all TCL routes are the same; $2.25, with reductions available through use of weekly and monthly tickets. There are reduced fares for seniors and other categories of riders.
Ridership was strongest on routes CS1 and CS8; the strongest route ridership was on B105, which only serves the far north end of the study area. All of the routes have suffered severe ridership losses during the COVID pandemic, with CS8 and B105 suffering the least (both routes terminate in Moncks Corner). This implies that these two routes likely have the most transit dependent ridership in the study area. It is thought that riders on B 105 do not have other mobility options, and riders on the CS8 Link to LunchMoncks Corner are most likely riders who did not drive their own vehicle to work and use the bus midday to get back and forth to restaurants. Route CS1 shows the most transfer activity with other TCL routes, with a high proportion of their ridership (30 percent) transferring.
2-17: Monthly Ridership by TCL Route*
The CARTA routes operating in the US 52 Corridor are:
• Route 10 to Charleston via Rivers Avenue
• Route 12 to Upper Dorchester/Ashley Phosphate Road
• Express Route 1 (XP1) to downtown Charleston and James Island via I-26
TCL riders can transfer to CARTA Routes XP1, 10, and 12 at the Melnick/Antler (Rivers Avenue) Park and Ride lot A 50-cent charge applies to transfers from CARTA to TCL but not from TCL to CARTA. However, it is noted that there are minimal transfers between these CARTA routes and the TCL routes. On a sample day in April 2017, only six transfers were made, five to Route 10, and one to Route 12.
There were 732 boardings in 2015 at the Rivers Avenue Park and Ride (now the Melnick/Antler Park and Ride) per the 2018 Regional Transit Framework Plan (RTFP). Riders accessed the Park and Ride lot
Existing Conditions Report
73
Route December 2019 December 2020 Transfers to other TCL routes Ridership Change B101 412 159 1 -159% B102 318 72 0 -342% B105 506 273 0 -85% CS1 636 217 65 -193% CS2 427 188 8 -127% CS8 573 371 0 -54%
Table
*2019 data is from before the Covid pandemic; 2020 data is during the Covid pandemic
2 CS3 and CS4 have been temporarily suspended as a result of the COVID pandemic. They would serve Moncks Corner and the north part of Berkeley County if operating
either by walking to it, (21%), were dropped off (16%), drove themselves and parked (42%) or transferred between buses (21%).
2.4.2.2 Review of Existing Plans and Projects
The following plans and projects related to transit planning in the region were reviewed and summarized as follows:
Charleston Area Transportation Study (CHATS) 2040 Long Range Transportation Plan (2019)
The Long-Range Transportation Plan (LRTP) provides a look forward to the transportation future of the Charleston Area Transportation Study (CHATS) Metropolitan Planning Organization (MPO) planning area in the year 2040. The LRTP included proposals for a number of themes for increasing use of transit to improve conditions in the region, as follows:
• Improve transit access to major employment centers, with enhanced local and express transit service including development of park and ride lots.
• Enhance local service with improved frequency and reduced travel times, including introducing transit signal priority.
• Implement Bus Rapid Transit (BRT) (starting with Lowcountry Rapid Transit (LCRT) with expansion to other priority corridors.
• Enhance bus stop amenities (i.e. signs, shelters, and real-time “next bus” signs) and signal protection and lighting for pedestrian access.
• Strengthen coordination between CARTA and TCL.
• CARTA, TCL, and other stakeholders should expand marketing and public outreach to promote benefits of transit and provide incentives to target markets such as commuters, universities, and visitors.
• Coordinate land use and transportation policy at both the regional and the local level. To achieve this, local zoning regulations should be reviewed and updated to incorporate transit-oriented development (TOD) principles around station-area nodes to the extent possible. Other strategies including incorporating transit-supportive amenities including pedestrian access facilities and coordinating land use and transit planning initiatives at the regional level are recommended.
The Public Transportation chapter contains a comprehensive listing of funding sources for transit capital projects and operations. Sources relevant to the US 52 study area include:
• FTA Section 5307/5304 Urbanized Area Formula program: Grants to urbanized area for transit capital, planning, job access and reverse commute projects.
• FTA Section 5309 Capital Investment Grant Program: A discretionary grant program for fixed guideway systems. The most relevant category within this program would be Small Starts.
• FTA Section 5311 Formula Grants for Rural Areas: This program provides capital, planning and operating assistance to states to support public transportation in rural areas with populations less than 50,000.
• FTA Section 5339 Bus and Bus Facilities: This program provides both formula and competitive grants for buses and bus facilities, including technology improvements.
• SCDOT State Mass Transit Fund (SMTF): Distributes the quarter cent per gallon fuel tax based on a formula but can also provide local share for federal grants.
• BUILD (Better Utilizing Investments to Leverage Development) Grants : now RAISE The Rebuilding American Infrastructure with Sustainability and Equity program of federal
74 Existing Conditions Report
discretionary grants is a highly competitive program that funds a wide variety of highway and transit projects that have significant local or regional impact.
BCD 2040 Rural Long-Range Transportation Plan (2020)
The Rural Long Range Transportation Plan (RLTP) establishes the overreaching vision of the future of transportation in the rural areas of the Berkeley Charleston Dorchester (BCD) region. It is a comprehensive transportation planning document that guides the investment in rural transportation infrastructure over a 20-year timeframe. The plan implements a performance-based planning and programming (PBPP) approach to inform investment and policy decisions, and to achieve goals for the region’s multimodal system. The Vision Statement is:
• Focus on enhancing and maintaining the quality of life and economic vitality of the rural BCD region, and accomplishing this by ensuring accessibility and mobility needs of all users and goods through providing an efficient, effective, safe and holistic transportation system that minimizes impacts on the natural environment.”
Stated goals pertinent to the US 52 Corridor Study include support mixed-use development, promote a feasible pedestrian-friendly environment, and provide and plan for transit service expansion. Proposed visionary projects in each community were identified and then ranked based on established criteria including whether the project supports transit. Projects were awarded points if they enabled the functioning of existing TCL and CARTA transit routes or improved accessibility to them. A cost table and implementation table for all projects was provided.
Moncks Corner Comprehensive Plan (2017 Update)
The Moncks Corner Comprehensive Plan provides a primary basis for evaluating all future development, redevelopment, and land use decisions in the Town of Moncks Corner. The plan is long-range with a planning horizon of 20 years. The plan goals and policies include a few strategies which are relevant to the enhancement of public transportation options:
• Coordinate with the WalkBike BCD plan to identify gaps in the existing sidewalk systems and potential funding sources for construction of new or improved sidewalk facilities particularly for linkages to schools and transit stop locations.
• Coordinate with TCL to identify and secure needed park and ride facilities.
• Support TCL services by distributing information on the regional transit systems, particularly commuter services, to the public.
• Pursue grant funding for identified infrastructure needs in neighborhoods that qualify for community development block grants (CDBG) support.
• Coordinate with TCL to develop and provide transportation to ensure access to training programs and future employers.
• Coordinate public facilities and services plans with land use planning to promote more compact development and encourage infill and redevelopment opportunities when possible.
• Coordinate with Berkeley County and SCDOT to establish parameters for requiring sidewalks within new developments.
Park and Ride Study (2018)
75
Existing Conditions Report
The purpose of the study was to assess the 19 existing park and ride lots in the BCD region, develop a list of new park and ride lots to analyze, prioritize those sites and make short-term, mid-term and long-term recommendations for retention and additional park and ride facilities in the region. Sites that were reviewed and are located within the US 52 study area include:
• 001: Santee Cooper, 1 Riverwood Drive, Moncks Corner
• 009: N Charleston/Rivers Avenue, 8551 Rivers Avenue, North Charleston (this has since been replaced by the Melnick/Antler Park and Ride lot)
• 069: Goose Creek, 303 N. Goose Creek Blvd (US-52), Goose Creek
• 076: Berkeley County, 1003 US 52, Moncks Corner
All four park and ride lots are served by TCL Route CS1.
Potential park and ride sites in/near the corridor that the Park and Ride Study identified are:
• 066: Goose Creek Municipal & Community Center, 519A N. Goose Creek Blvd., Goose Creek
not chosen to advance but identified as having good potential.
• 071: Gateway Community Church, 3537 live Oaks Dr., Moncks Corner - not chosen to advance.
• 075: Roper Berkeley Hospital, 100 Callen Blvd/US 176, Moncks Corner – potential site in conjunction with new hospital.
Regional Transit Framework Plan (RTFP) (2018)
The goal of the RTFP is to identify and prioritize a High Capacity Transit (HCT) network for the BCD region that serves wide ranging trip needs, connects the region, enhances the quality of life, and supports economic growth and development. The RTFP serves as a blueprint for future transit investment in the region through 2040
RTFP Recommendation
The RTFP selected the US 52 corridor (Corridor C) as the second highest ranked project by ridership/productivity of the five recommended primary high capacity corridor projects for the region giving it an overall rating as “High.” Corridor C is the one of the longest corridors at approximately 32 miles in length. The RTFP recommended operating the Corridor C service from the Santee Cooper lot in Moncks Corner to the south end of downtown Charleston on US 52, connecting to US 78 (Rivers Avenue). See Figure 2-36. At US 78, the service would operate on the future infrastructure of the proposed Lowcountry Rapid Transit (LCRT) right-of-way between North Charleston and downtown Charleston.
Existing Conditions Report
76
–

77 Existing Conditions Report
Figure 2-36: Proposed BRT Lite
“BRT Lite” was recommended for this corridor. BRT Lite can be considered a hybrid of regular fixed route service with bus rapid transit service (BRT). Whereas BRT operates on a dedicated guideway separated from traffic, BRT Lite operates in mixed traffic but utilizes features such as transit signal priority and stations that are spaced farther apart to encourage faster service. Also, BRT Lite stops are simpler than BRT stations but do have shelters, seating, lighting and passenger information.
The FTA STOPS model was used to project ridership. The analysis assumed that service would be operated about 21 hours per day with high frequencies; every 10 minutes during peak hours, every 20 minutes during midday and early evening, and every 30 minutes during the later evening period. This totals to almost 75 trips per weekday in each direction. End-to-end running time was estimated at 1 hour 42 minutes in each direction. With round trip running time in excess of 3 hours 20 minutes, at least, 21 buses would be required to operate Corridor C service in peak periods. Corridor C weekday ridership in the segment in the US 52 study area was estimated at 881 passengers per direction in the 2015 “base case” and projected to be 1,098 riders in 2040 (assuming the same infrastructure and level of service). This averages out to about 12 riders per trip in the 2015 base case and 15 in 2040. Total weekday ridership on Corridor C trips, in both directions and including local ridership in the North Charleston to Charleston segment, was estimated at 3,995 in 2015 and 4,328 in 2040 resulting in a substantial reduction in auto trips.
The RTFP summary noted that Corridor C scored well during the technical analysis, but the corridor lacks contiguous density to support dedicated high capacity transit, such as BRT or light rail transit (LRT). Growth is projected in the corridor and important actions are needed to provide additional mobility once demand materializes; actions such as preserving right-of-way, improving neighborhood connectivity, and increasing transit service to establish more transit ridership in the corridor in anticipation of eventual HCT improvements.
I-26 ALT Study (2016)
The purpose of the I-26ALT Study was to improve transit service and enhance regional mobility along the 22-mile I-26 corridor connecting Summerville, North Charleston, and downtown Charleston. It investigated various forms of high capacity transit. The study effort identified a fixed guideway transit alternative for the US 78 and US 52 corridors. There was initially some consideration of light rail or commuter rail, but interest coalesced on BRT in this corridor. The recommended preferred alternative from the I-26 Alt study was advanced for further development and the project is now known as the Lowcountry Rapid Transit (LCRT) project and is expected to serve as the backbone of a larger more comprehensive high capacity transit network. Refer to the exhibits below for a map of the proposed alignment and the type of infrastructure treatment for various segments of the corridor. The project is now in NEPA analysis and it has advanced to development of 30% design.
78
Conditions Report
Existing


79 Existing Conditions Report
One Berkeley Comprehensive Plan Update (Due for Completion in 2021)
Berkeley County kicked off its 10-year Comprehensive Plan update, called “One Berkeley,” in October 2020. One Berkeley is an opportunity for residents to create a roadmap for the County’s future. The County chose the One Berkeley name to stress the importance of creating a plan that highlights the holistic future for the County. The comprehensive plan is updated every 10 years and reinforces a countywide vision for housing, land use, economic development, transportation, priority investments, natural resources, cultural resources, and community facilities. County planners are developing the Plan in coordination with BCDCOG planners, ensuring coordination with plans for the region.
CARTA Comprehensive Operational Analysis (2016)
CARTA’s Comprehensive Operational Analysis (COA) of the transit system provides an in-depth review of the existing transit system and includes a detailed market, service and operational analysis to develop short range, mid-range, and long-range transit recommendations, and a plan for implementing those changes over the next 20 years. The COA provides information on the existing CARTA services, funding sources, fare characteristics and revenue, demographic information, ridership statistics, performance measures and performance data. Working with stakeholders and the public, short range and mid-range goals and objectives were identified and include:
Short Term:
• Improve reliability of service.
• Increase ridership and route efficiencies.
• Develop high capacity transit corridors.
Mid-Range:
• Improve transit convenience by increasing service frequencies and connections.
• Add new routes and transit markets as new funding and increased demand is identified.
• Introduce new and innovative transit services, such as Bus Rapid Transit, to attract new customers. Short range and mid-range service plan recommendations were provided. Routes that intersect with the TCL Routes in the US 52 corridor which are recommended for service improvements include Route 10 and Route 12. Route 10 is CARTA’s most productive route and is a candidate for premium transit service in the future; route recommendations also include capital improvements to increase passenger capacity and pedestrian access as well as service modifications to improve travel time. Route 12 recommendations in the mid-to-long range include capacity improvements, service enhancements to improve travel time, and an extension to serve the Airport area. In the short term, the route was recommended to be split into two rotes: Route 12: Upper Dorchester Road and Route 14: Ashley Phosphate.
TCL Comprehensive Operational Analysis (2014)
A Comprehensive Operational Analysis (COA) was conducted for TCL in order to review existing routes and proposed route changes prepared by staff. It is important to review routes and make adjustments to reflect travel patterns of the community. An analysis was conducted for each route including total ridership and ridership by fare. The COA also provided information on financial data, system performance, performance by route including passenger trips per revenue hour, and cost per passenger trip. A peer comparison with five peer agencies in South Carolina and a passenger survey was conducted.
80
Conditions Report
Existing
Overarching goals were defined and include the following:
• Goal 1: Maintain existing ridership, while attracting new riders
• Goal 2: Continue to have financial and economic sustainability
• Goal 3: Provide high quality, customer-oriented service
• Goal 4: Provide efficient, effective and safe services
• Goal 5: Promote all TCL services
Several transit service alternatives were identified and described for existing routes and new routes were proposed. Other recommendations including improvements in technology, facilities, bus stop amenities, and organizational oversight were made. Many of the recommendations in the COA have been implemented.
Rural Workforce Transportation Study (2020)
This was a study conducted by BCDCOG which outlines a regional strategy focused on improving access to job training and employment for the region’s rural workforce. The study identified concentrations of unemployed and underemployed people in the region and the most promising concepts for connecting them to training and/or jobs A concentration was identified in Moncks Corner. Four broad initial transportation strategies were identified including enhancing TriCounty Link Service coverage and frequency, micro-transit, car sharing and carpools or vanpools. Based on the evaluation of potential strategies, stakeholder input and additional considerations, the most appropriate transportation approach identified in this study was some form of subsidized carpool or vanpool.
2.4.2.3 Community Resources in the US 52 Corridor
Transit is often used to access community facilities, including parks, schools, libraries, recreational facilities, childcare facilities, and social service agencies. The most common community resource in the study area are childcare facilities. There are 12 of these facilities, most near Goose Creek and North Charleston. A school and a library are in Moncks Corner. Parks and recreational facilities are limited along the corridor, but a large regional park, Wannamaker County Park is located near the south end of the corridor in North Charleston. It is expected that facilities such as the large park may attract recreational transit users from around the region, while the childcare facilities may attract work transit trips. Refer to Section 2.3 for information on the community resources in the study corridor.
2.4.2.4 Transit Users Characteristics
In order to understand the propensity to use transit, certain demographic characteristics within the US 52 study corridor were reviewed. In general, higher employment or residential densities are needed to sustain transit rather than highly sparse rural areas. The demographic groups selected for additional analysis are known for having a higher propensity to use transit than the general population per national transit research The demographic data will be used to develop a transit demand index, which compares census tract data to determine where the greatest transit demand in the corridor will be.
Population and Employment
81
Report
Existing Conditions
The US 52 study area is mainly rural with the highest population center located in the City of Goose Creek at the southern end of the corridor. The predominant housing type is single family; as one travels north along the corridor, lot sizes become bigger and the density decreases.
Employment density in the corridor tends to be concentrated in the south as well, although there is also a concentration of jobs in Moncks Corner. These jobs are predominantly in the retail sector, although the Santee Cooper utility company is located here. There are also larger industrial zoned uses in the middle of the study area, but these companies tend to be logistics and warehousing companies with low employment per square foot.
Overall, the population in the study area exceeds the number of jobs by a 2 to 1 ratio, making the study area primarily a population center rather than an employment destination. However, there are certain areas in the corridor where the number of jobs and residents is balanced with a ratio that is nearly 1 to 1. This indicates that these areas have a good balance of employment and retail demand with residential trip demand a balance that is favorable for supporting existing and future transit services. Census Tract 31.15 (the interchange of US 52 and US 78) and Census Tract 205.06 (in the center of Moncks Corner) have the highest number of jobs and residents in the study area, and there is an almost 1 to 1 ratio in these areas as seen in Figure 2-37
Key Demographic Groups
Research has shown that certain population groups use transit more than others:3
• Individuals over 65 years are 1.5 times more likely to use transit (than the general population).
• Minority populations are more than 2.0 times as likely to use transit.
• Persons with a disability are 5.5 times more likely to use transit.
▪ Low income residents are about 1.5 times more likely to use transit.
▪ Individuals without access to a vehicle are nearly 8.0 times more likely to use transit.
A census tract analysis of each of these groups in the US 52 corridor as depicted in Figure 2-45 indicates that:
• Those over 65 years comprise over 10 percent of the population, mostly near Goose Creek
• Most of the minority residents in the corridor live in the middle of the study area and just northwest of the US 52 - US 78 interchange
• There is an area with a relatively high concentration of people with disabilities in Moncks Corner
• There is a concentration of residents with low income in the south part of the study area
This information as well as future projections of each of these population groups will provide a basis for understanding what type of public transportation or other forms of transportation can be supported in the corridor in the future.
Transit Demand Index
The previous demographic and employment information was combined into a Transit Demand Index to numerically capture and identify the greatest demand for transit service in the study area. The population is separated into the following demographic groups:
82
Conditions Report
Existing
3. “TCRP Report 28: Transit Markets of the Future: The Challenge of Change” Table 4
▪ Older Adults (65+ Years)
▪ Minority Population
▪ Persons with a Disability
▪ Low Income Population
▪ Zero Vehicle Households
Since these demographic groups have different propensities to use transit (as shown in the section above), multiplying the population of the groups by these factors will provide a more accurate snapshot of transit demand rather than just using total population. The equation also takes into account the density of the census tracts surveyed. Note that the Transit Demand Index will tend to favor denser areas and areas that have a good mix of jobs and housing.
––––––––––––––––––––––––––––––––––––––––––––––––––––––
83 Existing Conditions Report
�������������������� + (����������������������1.6) + (������������������2.3) + (����������������������5.5) + (��������������������1.4) + (������������ℎ����������8.0) + (����������0.5) + (������������������������0.75)
������������������������������������

84 Existing Conditions Report
Figure 2-37: Housing to Jobs Ratio

85 Existing Conditions Report
Figure 2-38: Groups with Higher Transit Propensity
The results of the analysis indicate that the highest demand is in Woodland Heights area of Goose Creek, which is also the area with the highest population density and the highest percentage of low-income residents. See Figure 2-38.
86 Existing Conditions Report

87 Existing Conditions Report
Figure 2-39: Transit Demand Index
2.4.2.5 Deficiencies and Needs Assessment
As the study moves forward with recommended improvements for an increase in the transit mode share in the corridor it is important to understand that the existing motor vehicle focused land uses along the US 52 corridor are not conducive to fixed route transit services. Given the current development patterns, it would be very difficult for a resident to access a transit vehicle along US 52; there are limited multimodal connections between their residence and the corridor, the residential subdivisions and commercial areas do not front the US 52 corridor, and there are limited access points. These development patterns only increase the distance a transit user would need to travel to get to a transit stop along US 52. Although TCL routes pick up passengers at the four park and ride lots along the corridor some of these park and ride lots tend to be underutilized. Encouraging different opportunities for connections to not only the park and ride lots but also to the US 52 corridor will support greater transit use.
If the transit mode share is to be increased, new development should be built based on walkable, bikeable, higher density development, i.e. Transit-Oriented Development (TOD) principles. Specifically, this means that there should be higher density uses at key nodes as well as direct walking/bike routes throughout the community with safe, convenient access to US 52. These routes could include short-cuts not available to autos. Nodes with a mix of uses should be developed at key intersections such as state routes and Mountain Pine Road; these nodes will be where transit stops will be located. In the short term, efforts should be focused on ensuring that any new development is built consistent with these principles for the longer-range plan Zoning and site plan approvals should encourage higher density developments at certain key points in the corridor. New walk/bike shortcuts such as this could be retrofitted to serve existing residential developments.
Even with the encouragement of more transit friendly land use patterns, a particular concern regarding existing conditions in the US 52 corridor is that the speed limits are very high, and most intersections are not signalized. Consequently, there is no safe way for passengers to get to/from stations on the opposite side of the roadway. Thus, new traffic signals, crosswalks and other pedestrian or bicycle amenities including street lighting will be needed to allow transit passengers to safely cross US 52 to access transit stops at key nodes in the corridor
Transit can only be successful if the land use densities and type of developments allow for walkable and bikeable communities so that potential riders can easily reach transit stops. An integrated approach to land use planning, multimodal connectivity, and transit planning is critical for a successful multimodal corridor.
88 Existing Conditions Report
2.4.3 FREIGHT RAIL AND GOODS MOVEMENT
The ability for freight to move by truck and rail adjacent to the US 52 corridor is imperative for the local, regional, and national economy. If there are ideas, concepts, or rules that have already been developed to maintain or enhance freight movements, relative to the study area or region, then they should be further explored and considered alongside this research effort. Likewise, understanding both freight facilities and potential freight activity centers within and around the corridor will help to solidify where freight roadway design improvements could be made along the corridor to improve the movement of goods. Using data related to truck volumes and intersection movements, current and future land uses, identifying existing freight generators, and identifying facilities with rail freight access will help identify where roadway and rail improvements can be made as well as the identification of areas where freight activity centers could be developed within the study area.
2.4.3.1 Freight Modal Policies, Plans and Regulations
Understanding existing relevant policies, plans, and regulations at the federal, state, regional and local level will help build a foundation to understand freight within the US 52 Corridor Study Area. The plans that were reviewed for this section were:
• Federal Railroad Administration (FRA) State Highway-Rail Grade Crossing Action Plan (SAP);
• SCDOT Statewide Multimodal Transportation Plan;
• SCDOT Statewide Rail Plan; and
• Charleston Area Transportation Study (CHATS) 2040 Long Range Transportation Plan (LRTP).
FRA State Action Plan
Alabama, California, Florida, Georgia, Illinois, Iowa, Louisiana, Ohio and Texas were mandated by the Rail Safety Improvement Act of 2008 to develop SAPs as it was determined they had the most highway-rail grade crossing collisions between 2006 and 2008. A new FRA SAP Final Rule was published in the Federal Register on December 14th, 2020, and went into effect on January 13th, 2021.4 This new rule mandates that the aforementioned 10 States must update their existing SAPs and provide reports on how they implemented their previous SAP. The 2021 FRA SAP Final Rule mandates that the remaining 40 States and the District of Columbia must also submit SAPs to the FRA by February 14th, 2022. The updated SAPs and implementation reports, where required, must be submitted to the FRA by February 14th, 2022. The FRA SAP Final Rule allows for the Secretary of Transportation to insert a condition into future grants that would prevent states’ from receiving awards if their SAP is not completed.
The focus of a SAP is to improve safety for pedestrians, motor vehicles, and trains for at-grade rail crossings. An at-grade crossing is the intersection of pedestrian pathways, roads, and railroad tracks. The SAP must identify atgrade crossings that:
• Have experienced one incident within in the last three years;
• Have experienced multiple (more than two) incidents within the last five years; and
• Are considered High-Risk.
TheFRAestablishescategoriestodefinewhat High-Riskat-gradecrossingsaretoaidinthedevelopmentofmetrics that can be measured to improve safety. High-Risk at-grade crossings will be determined by each state in their respective SAP, with each data source identified and that includes, at minimum:
4 https://www.federalregister.gov/documents/2020/12/14/2020-26064/state-highway-rail-grade-crossing-action-plans
89 Existing Conditions Report
• AADT;
• Total number of trains per day that travel through the crossing;
• Total number of motor vehicle collisions at each crossing during the previous five-year period;
• Number of main tracks at the crossing;
• Number or roadway lanes at the crossing;
• Sight distance (stopping, corner, and clearing) at each crossing;
• Roadway geometry (vertical and horizontal) at each crossing; and
• Maximum timetable speed.
The SAP must discuss specific strategies that improve crossing safety. These strategies may include at-grade crossing closures or grade separation projects. A timeline for implementing these strategies must be included in the SAP as well. An official state DOT representative must be designated to oversee the SAP process and implementation of the specific strategies.
SCDOT Statewide Multimodal Transportation Plan
The 2040 SCDOT Statewide Multimodal Transportation Plan (MTP) designates US 52 as part of its Strategic Freight Network (SFN). The SFN was developed by examining commodity flows in tonnage through the TRANSEARCH network by looking for the highest volume flows within the State. Next the TRANSEARCH data was compared against the travel demand model showing that roadway segments with roughly 500 trucks per day generally corresponded with the highest commodity flows. There were a few exceptions, such as US 78 in Charleston, which was added as a recommendation from the South Carolina Ports Authority. Freight growth in South Carolina, by tonnage, is expected to grow by 65 percent from 2016 to 2040. Truck freight was expected to grow by 60 percent, with rail freight growing 69 percent over the same period. The SFN assets, such US 52, are thus important to maintain so that goods can move readily about and through the region.
In order to improve the SFN, freight strategies were developed by SCDOT. Some of the strategies developed are important to the US 52 corridor and will be discussed further, including:
• Reduce Unacceptable Congestion:
o Eliminate freight bottlenecks; and
o Explore technological solutions, such as Intelligent Transportation Systems (ITS) to reduce congestion.
• Improve Average Speed on Congested Corridor:
o Prioritize improvements along major truck corridors; and
o Promote the use of real-time traffic information to support private sector routing decisions.
• Improve Safety, Security, and Resilience of the Freight Transportation System:
o Create a commercial vehicle crash database to identify particular patterns so that those situations can be addressed;
o Develop proper signage where non-motorized transportation users and the freight network overlap; and
o Enter into a partnership with railroads to prioritize at-grade crossing improvements.
• Increase or Maintain Pavement Condition to Good:
o Higher truck volumes along a roadway segment will need more maintenance dollars.
90
Report
Existing Conditions
SCDOT Statewide Rail Plan
The rail network within South Carolina is important for the movement of people, freight, and for military movements, if necessary. The SCDOT Statewide Rail Plan addresses each of these topics by discussing passenger travel, rail freight, and identifying the military train routes. The rail line adjacent to the US 52 corridor serves all train movements for each of the aforementioned. South Carolina does not have a dedicated funding source to improve the rail network throughout the State. However, there are Federal Section 103 funds available that are used toimprove18to20at-gradecrossingsperyear.ThesefundsareprioritizedbySCDOTannuallyandusedtoimprove lights and gates.
Amtrak operates the Palmetto and Silver Meteor passenger service trains along CSX Transportation (CSXT) rail that parallels the US 52 corridor. Both the Palmetto and Silver Meteor passenger service schedules are staggered throughout the week, with arrival and departure times that are outside of any peak roadway travel times. However, train interference (freight train delaying a passenger train or vice-versa) causes significant delays between New York and Miami along the rail network. These unforeseen incidents may cause schedule delays across the entire system and can adversely affect scheduled stops in South Carolina.
Rail freight is important to both the economy in South Carolina and to the reduction of truck trips along the roadways. The SCDOT Statewide Rail Plan shows that 14 percent of the rail movements by tonnage contain 13 percent of rail freight value passing through the State. The forecast in South Carolina for rail tonnage is expected to grow from 63.2 million in 2016 to 106.5 million by 2040. This represents almost a 68 percent increase over a 29year period. CSXT operates and maintains approximately 1,269 route miles in South Carolina, which is makes it the largest operator in the State. CSXT owns, operates, and maintains the track adjacent to the US 52 corridor.
Commodities that travel to-and-from South Carolina by rail varied in 2016. Coal represented 36.9 percent of inbound freight (tonnage), totaling 1.7 percent of the entire State’s rail freight value. Whereas, Chemicals or Allied Products represented 16.7 percent of inbound freight (tonnage), and 29.6 percent of the State’s rail freight value. Outbound commodities that are shipped out of South Carolina were led by Chemicals or Allied Products, with 18.8 percent (tonnage), and 24.8 percent of the State’s rail freight value. Commodities that travel through the State were led by Chemicals or Allied Products, with 21.7 percent (tonnage), and 20.1 percent of the total value.
In an event that the United States Military needs to use rail for the movement of assets, they have established the national Strategic Rail Corridor Network (STRACNET). Both Joint Base Charleston and the Naval Weapons Station South are served by CSXT, and the rail network along US 52 is part of the STRACNET system.
Strategies from the SCDOT Statewide Rail Plan that may benefit the US 52 Corridor are:
• At-grade crossing design and safety improvements;
• At-grade crossing consolidation by closing crossings to reduce railroad induced congestion along the roadway network;
• Railroad relocations by expanding or constructing rail sidings;
• Implementation of Quiet Zones;
• Grade separated crossings;
• Explore a dedicated rail funding program; and
• Partner with FTA, MPOs, COGs, and transit providers to implement premium transit in urban areas.
CHATS 2040 LRTP
The CHATS 2040 LRTP was established to guide andprioritize future transportation funding forthe urbanized area in the Charleston region. Not all projects in the LRTP can be funded as there are limited federal, state, and local dollarsfortransportationimprovements.ThesegmentoftheUS52corridorbeingstudiedfallswithinthisurbanized
91 Existing Conditions Report
area. Projects in the LRTP are developed and brought forth by previous iterations of the document, public participation, local governments, and SCDOT. All of these projects are then vetted through a scoring criteria that ranks projectsbased onseveral factors,such ascost, environment,freight improvements,etcetera.Oncetheprojects are scored, they are then ranked and available for funding, pending availability. TheRoadway Connectivity Chapter contains freight recommendations, potential projects for intersection and roadway enhancements, and a design concept for the corridor.
Relevant recommendations from the LRTP for US 52 are:
• Implement technology such as Graybox so that truck drivers can communicate with shippers;
• Communicate that freight is imperative to economic development so that it has a place at the table when roadway or intersection designs are being developed;
• Sharing good data that is used for freight statistics; and
• Emphasize bottleneck locations for trucks.
Specific projects identified in the LRTP along the US 52 corridor that need to consider CSXT crossings during any improvements are:
• Access Management Improvement Projects:
o North Live Oak Road to Gaillard Road;
o Button Hall Avenue to Red Bank Road; and
o Montague Plantation Road to Oakley Road.
• Intersection Improvement Projects:
o Old US 52 and Gaillard Road;
o US 52 and Cypress Gardens Road; and
o US 52 and Liberty Hall Road.
Lastly, a cross section was developed for a 2.2-mile segment along US 52, between the northern entrance of the Foxbank Community at Red Leaf Boulevard to south at Tom Hill Road across from Vulcan Metals and Charleston Steel and Metal, as shown in Figure 2-40. The recommendations for the segment were as follows:
• Redesign signalized intersections with crosswalks, lighting, and pedestrian refuges;
• Eliminate free flow right turns; and
• Install 10-foot meandering protected sidepath.
92 Existing Conditions Report
Source: 2040 CHATS LRTP
2.4.3.2 Freight Facility/Freight Activity Center Inventory
Understanding existing and future industrial and commercial land uses, through truck movements, truck turning movements at intersections, freight businesses, and train movements within the US 52 study area will help identify how the transportation network handles freight movements. It will also help identify any potential Freight Activity Center (FAC) locations for future consideration. FACs are major economic hubs that increase jobs and truck or rail freight movements by consolidating similar industries closely. The general land use characteristics of FACS are:
• Major industrial areas including manufacturing, warehousing, and distribution centers;
• Intermodal transshipment locations, includingairports,seaports, and associatedlandsideactivities and rail intermodal facilities; and
• Incubators for future industrial growth.5
As the US 52 study area develops with a mixture of residential, commercial, industrial, and other uses, it may be beneficial to consider areas where a FAC may be used to agglomerate industrial and some commercial uses. Likewise, residential and some commercial may be compatible and needed within the study area. Generally, industrial and residential should be separated as noise pollution, movement of industrial equipment and vehicles, and freight movements (truck or rail) may compromise quality of life factors for residents. Understanding the existing and future land uses within the study area will help factor where the placement of FACs might be
5 https://www.tampabayfreight.com/pdfs/study-docs/Freight%20Activity%20Centers%2007-05.pdf

93 Existing Conditions Report
Figure 2-40: US 52 Cross Section
appropriate. Examining existing freight businesses andthe land uses that surround them or are planned around them will also be factored in.
Truck through movements and turning movements will help determine where the roadway network is most heavily utilized by freight vehicles. Analyzing these truck freight movements within the US 52 study area, a generalization can be offered on where FACs may be developed or are already developing. A benefit of developing a FAC is that future roadway or rail improvements could be prioritized and targeted around a FAC to better serve the freight industry as proper access and roadway segments could be developed. Likewise, understanding how trains move through the corridor crossing the roadway network and serving businesses will aid in the overall understanding of freight movements as well. Freight moved by a train can consist of through movements or have the potential to serve businesses along the corridor. Highway-rail grade crossing (at-grade crossing) data will be analyzed to generate assumptions along the corridor for safety improvements within the study area.
Study Area Land Use and Truck Transportation
Existing zoning and future land use maps are used with traffic counts in this analysis. The existing zoning map gives the current conditions present on the ground today, and is a compilation of data from Berkeley County, Charleston County, City of North Charleston, City of Goose Creek and the Town of Moncks Corner. The Future Land Use Map (FLUM) shows where commercial and employment centers may potentially be formed in the future. The traffic counts and turning movements were collected in late 2020. The traffic counts and turning movements represent heavy vehicles (trucks), excluding buses, and are represented by intensity of through movements and turning frequency, respectively.
Figure 2-41 shows existing industrial and commercial zoning within and near US 52. It also depicts the locations where traffic counts were conducted. Within the US 52 study area, commercial zoning aligns logically in North Charleston and Goose Creek to the south, and Moncks Corner to the north. Industrial zoning begins around Old Mount Holly Road, north of Goose Creek, and runs along the US 52 corridor north, largely in unincorporated Berkeley County. Truck volumes stay fairly consistent within the US 52 study area, except south of Camelot Drive where they increase to over 1,000 during the count. This may be induced by extra truck trips traveling down the US 176 or coming from I-26 and University Boulevard to move on US 52.
94 Existing Conditions Report

95 Existing Conditions Report
Figure 2-41: US 52 Existing Industrial and Commercial Zoning with Truck Counts
The FLUM shows potential commercial centers within the study area in a few places, but primarily located in Moncks Corner (Figure 2-42). The future employment areas are:
• US 52 and Old Mount Holly Road to the south, Century Aluminum to the north and west, and the CSX tracks to the east;
• US 52 and Cypress Gardens Road area; and
• West of US 52 and east of Old US 52 between Ben Barron Lane to the north and Gaillard Road to the south.
These employment areas do not have to be explicitly for industrial use, but there are existing industrial uses already in place. It is important to note that FACs are typically considered as employment hubs in a region. To assist in identifying areas to consider as FACs, turning movements and rail infrastructure will be examined next.
96 Existing Conditions Report

97 Existing Conditions Report
Figure 2-42: Future Commercial and Employment Areas with Truck Counts
Existing truck turning movements can be used to further evaluate where future intersection improvements may be needed. If intersection improvements are needed for trucks, a case can be made to help situate FACs if the land uses allow for industrial and large commercial and specific site facilities have or can accommodate freight related industries. Truck turning movements were sampled between 6:00 AM and 8:45 AM and 4:00 PM and 6:45 PM on all legs of each intersection identified in Table 2-18. Figure 2-43 depicts the intersection locations within the US 52 study area.
Table
Intersections with Turning Movements Collected
2
98 Existing Conditions Report
Map ID Intersection
Reid Hill Road / Rembert C Dennis Boulevard and US 52
2-18:
1
North Live Oak Drive and US 52
Stoney Landing and US
East Main Street and US
Sterling Oaks Drive and US
Heatley Street and US
Rembert C Dennis Boulevard
Old US
and US 52
Gaillard Road and US
Gaillard Road and Old US
Cypress Gardens Road and US
Cypress Gardens Road and Old US 52
Mt. Holly Commerce Park and US 52
Google and US 52
Old US 52 and US 52 15 Old Mt Holly Road and US 52 16 Stephanie Drive and US 52 17 Hollywood Drive and US 52 18 Central Avenue and US 52 19 Button Hall Road and US 52 20 Liberty Hall Road and US 52 21 Red Bank Road and US 52 22 N.A.D. Interchange and US 52 23 US 78 and US 52 Interchange 24 Otranto Road and US 52
3
52 4
52 5
52 6
52 7
/
52
8
52 9
52 10
52 11
12
13
14

99 Existing Conditions Report
Figure 2-43: Intersections with Turning Movements Collected
Not all truck turning movements imply that freight is destined for the US 52 study area as some are considered through movements that are destined for other parts of the region or state. For instance, North Live Oak Drive has 82 truck turns making a left on US 52 and heading away from the US 52 study area in the morning. This is logical, as North Live Oak Drive is the US 17 Alternate (US 17A) that connects I-26 to US 52. Therefore, almost half of the turning movements are really through movements that travel away from the US 52 study area during the AM period. In the PM period, 75 trucks turn westward on North Live Oak Drive when traveling south on US 52 while 57 trucks turn north to US 52. This means that 132 trucks are heading away from the study area during evening hours. However, even accounting for these freight movements outside of the study area, the ranking of intersections does not change as all roads have various outlets for through movements that exist.
100 Existing Conditions Report
Table 2-19 shows the top six intersections where trucks turn within the study area. North Live Oak Drive, Rembert C. Dennis Boulevard, and Reid Hill Road are all to the northern end of the study area in Moncks Corner. Cypress Gardens Road and Gaillard Road are in the middle of the corridor, while Red Bank Road is to the south, in Goose Creek. The turning movements are totaled for all directions at each intersection for both the AM and PM periods.
Map ID Intersection Truck Turns AM Truck Turns PM Total Truck Turns Rank 2 North Live Oak Drive and US 52 186 186 372 1 10 Cypress Gardens Road and US 52 154 72 226 2 8 Gaillard Road and US 52 138 46 184 3 7 Rembert C Dennis Boulevard and US 52 112 66 178 4 21 Red Bank Road and US 52 89 58 147 5 1 Reid Hill Road and US 52 81 51 132 6
Table 2-19: Intersections with Highest Truck Turning Movements
Old US 52 only had two intersections within the study area where truck turning movements were counted, as shown in Table 2-20. Since there were only two intersections, no ranking was applied, but it does solidify that Cypress Gardens Road does carry more trucks than Gaillard Road, which corresponds with more truck turning movements on both roads at US 52. Cypress Gardens Road does connect to Bushy Park Road where there are a lot of industrial uses and may explain the increase in truck turns on US 52.
Study Area Land Use and Rail Transportation
CSX owns and operates the rail line through the US 52 corridor study area. The line is mostly single track with dual tracks between Dennis Park (Dennis Drive) and Charleston Steel and Metal, a distance of approximately 3.5 miles. Double stacked cars are allowed on the rail with no height restrictions in the study area. There are 12 at-grade crossings within the study area as shown in Figure 2-44. Table 2-21 details the existing conditions for each atgradecrossingfromtheFRA’sCrossingInventorydataset.ItalsoshowstheAverageAnnualDailyTraffic(AADT) of total vehicles that move through the at-grade crossing and gives a truck percentage as well.6 Only one crossing, FRA ID 640940E, crosses US 52. It is considered a single line industry track that serves Century Aluminum. There are five sites that should be considered as major freight generators within the study area as they currently have access to rail:
• Century Aluminum;
• Mundy Company;7
• Charleston Steel & Metal;
• Vulcan Materials Company; and
• A&R Logistics.
Each of these businesses fall within land that has been zoned industrial in the existing land use map with the exception of A&R Logistics. However, this facility is located very close to an employment land use category in the FLUM (Figure 2-45). Mundy Company and Century Aluminum are both within employment land use areas of the FLUM as well.
6 The current US DOT FRA Inventory Reports for highway-rail grade crossings use 2013 AADT.
7 On-site industry rail line exists, but it is not connected to the spur. The functionality or usability of the line is unknown without an inspection and would take work to re-connect.
101 Existing Conditions Report
Map ID Intersection Truck Turns AM Truck Turns PM Total Truck Turns 9 Gaillard Road and Old US 52 31 14 45 11 Cypress Gardens Road and Old US 52 60 18 78
Table 2-20: Old US 52 Truck Turning Intersections

102 Existing Conditions Report
Figure 2-44: Existing Zoning and Rail Infrastructure
103 Existing Conditions Report
8 CSX Rail Infrastructure DOT Crossing ID Crossing Location Train Count Conducted Day Trains 6am-6pm Night Trains 6pm6am Switching Trains Max Timetable Speed (MPH) Typical Speed Range over Crossing (MPH) Roadway Network 2013 AADT Percent Trucks 631975G Goose Greek Road 2019 5 12 2 79 60 to 79 24,524 10% 631974A Red Bank Road 2020 6 11 2 79 60 to 79 22,367 12% 631973T Liberty Hall Road 2019 5 12 2 79 60 to 79 11,548 6% 640453H Brandywine Boulevard 2018 5 12 2 79 60 to 79 671 3% 631972L Hollywood Drive 2018 5 12 2 79 60 to 79 3,371 5% 631971E Windsor Mill Road 2018 5 12 2 79 60 to 79 5,827 5% 631970X** Montague Plantation Boulevard 2018 5 12 1 79 40 to 70 2,807 5% 631968W** Medway Rd 2018 5 12 1 49 40 to 70 1,023 5% 631966H Cypress Garden Road 2018 5 12 0 79 60 to 79 2,338 5% 631965B Oakley Road 2018 5 12 0 79 60 to 79 692 5% 631964U Gaillard Road 2018 5 12 0 79 60 to 79 1,175 6% 640940E* US 52 2018 0 0 2 10 10 to 10 26,150 10% *Only Crossing that directly crosses US 52 ** Dual Tracks 8
highway-rail
Table 2-21: FRA Grade Crossing Inventory Data
The current US DOT FRA Inventory Reports for
grade crossings use 2013 AADT.

104 Existing Conditions Report
Figure 2-45: FLUM and Rail Infrastructure
US 52 Study Area Freight Generators and Activity Centers
A&R Logistics and West Branch Commerce Park
A&R receives bulk in by rail, repackages, and then exports polyethylene to the Port of Charleston on international containers by train. A high-resolution image from January 10th, 2021 shows that A&R Logistics has 98 rail cars in the rail yard, and 116 containers either on the ground or trailer ready for truck shipping on site. Knowing that Gaillard Road has a significant amount of truck turns, both at US 52 and Old US 52, some freight is also moving to and from A&R by truck.

A&R Logistics is located in West Branch Commerce Park, which has the potential to develop into a FAC within the US 52 study area (Figure 2-46). CSX markets the area through CSX Site Select and lays out eight parcels that fit within 362 acres. Lands to the north of the commerce park are currently zoned for a planned development, while the FLUM shows most of this area as employment. There may be opportunity to develop a FAC slightly to the north between US 52 and the CSX mainline as well.
The parcels to the south which are adjacent to Gaillard Road are currently occupied by Mercedes Benz for Sprinter Van storage. Moving the Mercedes Benz Sprinter vans is done by truck as there is no rail access to this section of West Branch Commerce Park.
105 Existing Conditions Report
Figure 2-46: West Branch Commerce Park
Mundy Company
Mundy Company manufactures polyester staple fiber and PET resins that are shipped by truck. Figure 247 displays 33 containers on site and an industry rail track that appears to be disconnected from the mainline. Cypress Gardens Road is to the south of the Mundy Company and has a lot of truck turning movementsat US52andOldUS52,tothewestandeast respectively.TheexistinglandusesaroundMundy Company are commercial and industrial, while the FLUM shows employment. The area between US 52 and the CSX Mainline is fairly narrow, and the potential for a FAC here is plausible.

106 Existing Conditions Report
Figure 2-47: Mundy Company
Charleston Steel & Metal Company
Charleston Steel & Metal Company moves scrap steel and metal by rail and truck. On May 8th, 2020 the image in Figure 2-48 was captured and shows over 90 scrap metal containers on the ground. They have direct access to and from US 52 to the northwest, and rail access to the southeast. With residential development encroaching east of the rail line, industrial and commercial expansion could occur to the north, between Cypress Gardens Road and Charleston Steel & Metal and US 52 and the CSX mainline, to the west and east.

107 Existing
Report
Conditions
Figure 2-48: Charleston Steel & Metal Company
Vulcan Materials Company
Vulcan Materials Company is the parcel located immediately to the south of Charleston Steel & Metal. An image captured on May 8th, 2020 shows 11 trucks on site and five railcars (Figure 2-49). Vulcan Materials Company has its own dedicated access to US 52 and the internal geometry is configured for freight trucks to move around. The existing land use to the south is part industrial, but mainly commercial.

108 Existing
Report
Conditions
Figure 2-49: Vulcan Materials Company
Century Aluminum
Century Aluminum is located to the west of US 52 and east of US 176, to which it has truck access to either roadway. There are only 11 truck containers on the ground during an image captured on January 25th, 2021. Century Aluminum does have a CSX industry track that runs across US 52 with 15 railcars stored at the time of the image in Figure 2-50. The surrounding lands to the north and south are all currently zoned for industrial. This area, overall, could be considered for a FAC as access to US 17A is available to the north.

Next Steps
After identifying the most frequent truck turning movements within the corridor, comparing existing and future land uses for industrial compatibility, and identifying freight generators and potential FACs, improvements to the roadway and rail network can be proposed and considered. The next steps will be to include short, medium, and long-term recommendations that will improve freight movements within the corridor. An in-depth analysis with short, medium, and long-term recommendations for 12 at-grade rail crossings in the study area will be given as well to improve crossing safety and movements. These recommendations should be considered in the context of existing planned or programmed projects, planned development in the area, municipal planning priorities, and the availability of fiscal resources. Potential grant funding avenues should be explored to supplement local funding.
109 Existing Conditions Report
Figure 2-50: Century Aluminum
2.4.4 TRAFFIC AND SAFETY
This Section summarizes the traffic data collection and analyses performed for the assessment of existing conditions within the project study area.
2.4.4.1 Data Collection
The following data collection activities were performed within the study area.
Network Inventory
The existing roadway and intersection geometrics, speed limits and traffic control were inventoried throughout the US 52 corridor.
US 52 has multiple names throughout the project corridor. In Moncks Corner, it is known as ‘N US Hwy 52’. Between its intersection with Old US 52/Rembert C Dennis Boulevard and Goose Creek, the road is known as ‘US 52’. In Goose Creek, it is named ‘N Goose Creek Boulevard’ to the north of Red Bank Road and ‘S Goose Creek Boulevard’ from Red Bank Road to the Charleston County line. In Charleston County, US 52 is named ‘Rivers Avenue’.
US 52 enters the Town of Moncks Corner at the north end of the study area as a four-lane section with a paved center median and a posted 45 miles per hour (mph) speed limit. Approximately 1,100 feet north of the signalized intersection with Reid Hill Road/Rembert C Dennis Boulevard, the speed limit changes to 40 mph. Beginning at its intersection with Dock Road, the paved median is re-striped as either dedicated left turn lanes or as a two-way left turn lane to separate turning traffic from through traffic at various intersections and driveways. US 52 is also designated as US Route 17 Alt north of its intersection with N Live Oak Drive (US 17Alt).
At the intersection of Rembert C. Dennis Blvd and Old US 52, US 52 curves to the southwest as a fourlane roadway with a grass median. The speed limit increases to 45 mph approximately 200 feet east of the railroad bridge and approximately 1,700 feet northeast prior to exiting the Moncks Corner town limits near Merrimack Boulevard (S-8-978).
After exiting Moncks Corner, the road curves to the south. The speed limit increases to 60 mph approximately 225 feet south of its intersection with Wigfall Street/Hopkins Drive. Continuing to the south, it continues as a four-lane roadway divided with a grass median. Periodically, a third lane will develop that functions as a storage lane for left turn/u-turn median crossovers.
An at-grade railroad crossing is present approximately 1,350 south of the Old Fort Road (Old US 52) intersection. This crossing is for a railroad spur line to the Century Aluminum Company. The speed limit drops to 55 mph approximately 4,550 feet south of the railroad crossing. This location is where a single-track railroad line begins to run parallel to US 52. The railroad will continue to run parallel in close proximity to US 52 for approximately three miles, crossing streets which intersect the roadway from the east between Pine Grove Road and Red Bank Road.
US 52 enters the City of Goose Creek near Old Mount Holly Road. The speed limit drops to 50 mph approximately 500 feet south of the Windsor Mill Road/Stephanie Drive intersection and to 45 mph approximately 1000 feet north of the Central Avenue intersection.
Existing Conditions Report 110
The roadway changes from a four-lane grass median divided roadway to a six-lane roadway approximately 400 feet north of the Button Hall Avenue intersection and continues as a six-lane roadway with a center two-way left turn lane south of this intersection.

US 52 enters Charleston County and the City of North Charleston as a six-lane road with a 50-mph posted speed limit. A short segment of curbed grass and concrete median is present approaching the bridge over Goose Creek and continues southbound through the US 78 interchange. The speed limit drops to 45 mph south of the interchange and becomes an eight-lane section with a curbed median to the Otranto Road intersection.
Old US 52 runs generally parallel to US 52 for approximately 9.7 miles between its intersection termini. At the north end of Old US 52, the roadway transitions in 800 feet from a four-lane section to a two-lane undivided section with a 40-mph posted speed limit. The speed limit increases to 55 mph approximately 2,350 feet south of its northern terminus. The two-lane, 55 mph section continues until it widens to provide a paved, striped median approximately 950 feet north of its signalized intersection with Cypress Gardens Road. South of Cypress Gardens Road, the roadway continues to the south with a two-lane section with a striped median. The speed limit is reduced to 45 mph approximately 600 feet south of Cypress Gardens Road (just north of Man O War Lane). It transitions back to an undivided two-lane section approximately 750 feet south of its intersection with Old Cypress Plantation Road/Colony Post Loop and continues in this way to its southern terminus.
Rembert C Dennis Boulevard (US 52 Bypass) runs generally parallel to US 52 for approximately two miles Starting at its northern terminus at its intersection with US 52 opposite Reid Hill Road in Moncks Corner, Rembert C Dennis Boulevard runs for approximately 1,200 feet as a two-lane roadway with a striped paved median with a posted 45 mph speed limit before continuing south as a two-lane undivided roadway to its southern terminus with US 52/Old US 52.
Non-Traditional Intersection Control
The intersection of US 52 with Oakley Road (S-8-50) is an unsignalized ‘R-Cut’ intersection. R-Cut intersections are an alternative to traditional intersections that allow left turn and through movements from side streets At an R-Cut intersection, traffic that would normally turn left from the side streets, or that would travel straight across are instead required to turn right to make use of a u-turn downstream As shown below, the R-Cut u-turns on US 52 are located approximately 800 feet to the north and south of the Oakley Road intersection.
Existing Conditions Report 111
Crash Data
Crash Data was obtained from the South Carolina Department of Transportation (SCDOT) Safety Office for the period between January 1, 2015 and June 30, 2020 for the US 52 corridor and for the intersecting routes. The Crash Data is summarized in the Traffic Analysis Summary Report, to be submitted separately.
Traffic Volume Data
A wide range of traffic volume data was obtained throughout the corridor. Traffic volume data included current and historic turning movement counts, historic and current SCDOT Average Annual Daily Traffic, SCDOT Automatic Traffic Recording (ATR) stations, vehicle classification/speed, and travel time/delay.
Existing Turning Movement Counts
Turning movement count data were collected in 15-minute intervals during the morning peak period (6:00 to 9:00 AM) and afternoon peak period (4:00 to 7:00 PM) on Tuesday, October 27, 2020 or Wednesday, October 28, 2020 at the following signalized intersections:
• US 52 at Reid Hill Road (S-8-1173)/Rembert C Dennis Boulevard (US 52 Bypass)
• US 52 at N Live Oak Drive (US 17 Alt)
• US 52 at E Main Street (SC 6)/Main Street Extension (S-8-1072)
• US 52 at Altman Street (S-8-43)
• US 52 at Old US 52/Rembert C Dennis Boulevard
• US 52 at Gaillard Road (S-8-357)
• US 52 at Cypress Gardens Road (S-8-9)
• US 52 at Google Driveway
• US 52 at Old US 52
• US 52 at (S-8-45) Old Mt Holly Road /Montague Plantation Road
• US 52 at Windsor Mill Road/Stephanie Drive (S-8-400)
• US 52 at Hollywood Drive (S-8-281)
• US 52 at Central Avenue (S-8-1109)
• US 52 at Button Hall Avenue (S-8-644)
• US 52 at (S-8-529) Thomason Boulevard /Liberty Hall Road
• US 52 at St James Avenue (US 176)/Red Bank Road (S-8-37)
• US 52 at Otranto Road (S-10-542E)
• Rembert C Dennis Boulevard at Stoney Landing Road (S-8-316)/(S-8-1243)
• Rembert C Dennis Boulevard at Main Street Extension (S-8-1072)/Sterling Oaks Road
• Old US 52 at Cypress Gardens Road (S-8-9)
Turning movement count data was also collected between 6:00 AM and 7:00 PM for the following unsignalized intersections:
• US 52 at Tom Hill Road (entrance to Mt Holly Commerce Park)
• Old US 52 at Gaillard Road (S-8-357)
• University Boulevard (US 78) at Old University Boulevard (S-10-821)
• Goose Creek Road (US 78) at N.A.D. Road (S-10-2533)
Existing Conditions Report 112
Based on the cumulative turning movement traffic count data, the study area morning peak hour was between 7:00 and 8:00 AM and the afternoon peak hour was between 4:45 and 5:45 PM. The turning movement traffic count data are contained in the Traffic Technical Report, submitted separately.
Historic Turning Movement Counts
Adjustments to existing traffic volumes were anticipated to be necessary to account for reduced traffic under the current pandemic. Available historic turning movement counts were obtained from SCDOT District 6 to assist in evaluating potential adjustments to reflect pre-pandemic conditions.
Vehicle Classification and Speed Counts
Vehicle classification and speed counts were collected on Tuesday, October 27, 2020 on US 52 south of Mt Holly Plantation Lane. The classification and speed reports for this location are summarized in the Traffic Analysis Summary Report, to be submitted separately.
The daily, morning and afternoon peak hour total heavy vehicle percentages, the percentage of Single Unit vehicles (FHWA classifications 4-7) and percentage of Semi/Tractor-Trailer (FHWA classifications 8-13) are shown for the two-way, northbound and southbound directions in Table 2-22
Table 2-22: Heavy Vehicle Percentages- US 52 South of Mt. Holly Plantation Lane
The daily, morning and afternoon 10-mph speed ranges in which the 85th-percentile speed falls and the percentage of total traffic traveling at less than 70 mph at the count location are shown in Table 2-23.
Table 2-23: 85th Percentile Speed Ranges- US 52 South of Mt. Holly Plantation Lane
Vehicle count, classification and speed counts were also performed on the eight ramps at the US 52/US 78 interchange location in the southern end of the corridor in Charleston County. The data at the interchange are contained in the Traffic Analysis Summary Report, submitted separately.
Existing Conditions Report 113
Total Single Unit Semis Total Single Unit Semis Total Single Unit Semis Two-way 20.5% 18.4% 2.1% 20.4% 18.2% 2.2% 17.0% 16.3% 0.7% Northbound 26.5% 24.1% 2.4% 30.1% 26.6% 3.5% 21.7% 20.9% 0.8% Southbound 14.3% 12.4% 1.9% 13.5% 12.0% 1.5% 11.0% 10.4% 0.6% Daily AM Peak PM Peak Daily AM Peak PM Peak Two-way (85th %) 70-80 70-80 70-80 % < 70 mph 72% 65% 77% Northbound (85th %) 60-70 70-80 60-70 % < 70 mph 85% 81% 89% Southbound (85th %) 70-80 70-80 70-80 % < 70 mph 58% 54% 62% 85th Percentile
(mph)
Speed Range
Vehicle count, classification, and speed counts were performed at the following locations on other major arterials within the study area:
• Rembert C Dennis Boulevard west of Edwards Drive
• US 52 west of Old US 52/Rembert C Dennis Boulevard
• Old US 52 south of Dairy Farm Road
• Old US 52 east of Concrete Lane
• US 52 between the US 78 interchange and Camelot Drive
Table 2-24 summarizes the combined and direction heavy vehicle percentages at these locations. The 85th percentile speeds for mainline traffic at the various locations are as follows:
• Rembert C Dennis Boulevard west of Edwards Drive (between 46 and 50 mph)
• US 52 west of Old US 52/Rembert C Dennis Boulevard (between 51 and 55 mph)
• Old US 52 south of Dairy Farm Road (between 56 and 60 mph)
• Old US 52 east of Concrete Lane (between 56 and 60 mph)
• US 52 between the US 78 interchange and Camelot Drive (between 56 and 60 mph)
Existing Conditions Report 114
The count, classification, and speed data for these locations are contained in the Traffic Analysis Summary Report, to be submitted separately.
Travel Time/Delay
Travel time and delay information throughout the corridor were obtained during the morning and afternoon peak periods on the following days:
Existing Conditions Report 115
Table 2-24: Heavy Vehicle Summary- Multiple Locations
Total Single Unit Semis Total Single Unit Semis Total Single Unit Semis Two-way 9.3% 7.2% 2.1% 11.7% 8.9% 2.8% 5.8% 5.5% 0.3% Eastbound 9.9% 7.6% 2.3% 13.6% 9.8% 3.8% 6.8% 6.5% 0.3% Westbound 8.3% 6.6% 1.7% 9.6% 7.7% 1.9% 4.2% 4.2% 0.0% Total Single Unit Semis Total Single Unit Semis Total Single Unit Semis Two-way 8.4% 6.1% 2.3% 11.3% 8.1% 3.2% 4.9% 3.6% 1.3% Eastbound 6.8% 4.7% 2.1% 8.5% 5.8% 2.7% 3.0% 1.5% 1.5% Westbound 10.1% 7.5% 2.6% 13.7% 10.1% 3.6% 4.9% 3.8% 1.1% Total Single Unit Semis Total Single Unit Semis Total Single Unit Semis Two-way 11.2% 9.2% 2.0% 15.1% 11.8% 3.3% 9.9% 7.9% 2.0% Northbound 12.0% 9.8% 2.2% 16.2% 13.7% 2.5% 9.2% 7.7% 1.5% Southbound 10.8% 8.7% 2.1% 12.1% 10.2% 1.9% 10.4% 7.3% 3.1% Total Single Unit Semis Total Single Unit Semis Total Single Unit Semis Two-way 10.9% 9.8% 1.1% 14.6% 12.4% 2.2% 9.4% 8.7% 0.7% Eastbound 8.3% 7.3% 1.0% 13.6% 11.2% 2.4% 6.8% 6.1% 0.7% Westbound 13.7% 12.5% 1.2% 14.5% 12.7% 1.8% 13.8% 12.9% 0.9% Total Single Unit Semis Total Single Unit Semis Total Single Unit Semis Two-way 12.3% 6.8% 5.5% 13.9% 7.7% 6.2% 11.8% 5.9% 5.9% Northbound 11.9% 6.4% 5.5% 12.9% 6.5% 6.4% 11.8% 6.3% 5.5% Southbound 12.5% 7.2% 5.3% 14.8% 9.8% 5.0% 12.3% 6.0% 6.3% US 52 South of Camelot Drive Daily AM Peak PM Peak Old US 52 South of Dairy Farm Road Daily AM Peak PM Peak Old US 52 East of Concrete Lane Daily AM Peak PM Peak
Daily AM Peak PM Peak US 52 West of Old US 52 Daily AM Peak PM Peak
Rembert C Dennis West of Edward Drive
• Tuesday October 27, 2020
• Wednesday, October 28, 2020
• Wednesday, November 11, 2020
• Thursday, November 12, 2020
• Tuesday, November 17, 2020
Fourteen separate travel time runs were performed in each direction along the entire 18.5-mile long corridor. Eighteen checkpoints were set up in each direction along US 52, dividing the corridor into 17 segments. The length of these segments ranged from 0.10 miles to 3.85 miles.
Northbound US 52
Five travel time runs were performed along northbound US 52 during the morning peak period and nine runs were performed during the afternoon peak period.
During the morning peak period, the average speed to travel the entire corridor in the northbound direction was 40.8 mph. There were several segments where the vehicles stopping and/or dealing with traffic congestion resulted in noticeable reductions in average travel speed. The average speeds in these select locations were approximately 20 to 50% slower than the average:
• Otranto Road to Red Bank Road (19.6 mph)
• Red Bank Road to Liberty Hall Road (32.0 mph)
• Heatley Street to Main Street (30.7 mph)
• Live Oak Drive to Reid Hill Road (21.8 mph)
During the afternoon peak period, the northbound average speed throughout the corridor was 37.8 mph. The average speeds in these select locations were approximately 25 to 60% slower than the average:
• Approaching Otranto Road (14.9 mph)
• Otranto Road to Red Bank Road (28.6 mph)
• Red Bank Road to Liberty Hall Road (16.6 mph)
• Windsor Mill Road to Old Mt Holly Road (25.3 mph)
• Old Mt Holly Road to Old Fort Road (26.8 mph)
• Heatley Street to Main Street (20.1 mph)
• Main Street to Live Oak Drive (24.4 mph)
• Live Oak Drive to Reid Hill Road (27.1 mph)
Locations along US 52 where northbound traffic encountered long delays were:
• Red Bank Road (AM and PM)
• Liberty Hall Road (PM)
• Old Mt Holly Road (PM)
• Old US 52 (PM)
• Reid Hill Road (AM and PM)
Southbound US 52
Ten travel time runs were performed along southbound US 52 during the morning peak period and five runs were performed during the afternoon peak period.
During the morning peak period, the average speed to travel the entire corridor in the southbound direction to traverse the entire corridor was 43.9 mph. There were several segments where the vehicles
Existing Conditions Report 116
stopping and/or dealing with traffic congestion resulted in noticeable reductions in average travel speed. The average speeds in these select locations were approximately 12 to 65% slower than the average:
• Approaching Reid Hill Road (23.2 mph)
• Live Oak Drive to Main Street (29.7 mph)
• Main Street to Heatley Street (26.7 mph)
• Heatley Street to Old US 52 (31.6 mph)
• Old Fort Road to Old Mt Holly Road (38.8 mph)
• Button Hall Road to Liberty Hall Road (14.8 mph)
• Liberty Hall Road to Red Bank Road (24.0 mph)
During the afternoon peak period, the southbound average speed throughout the corridor was 40.7 mph. The average speeds in these select locations were approximately 15 to 75% slower than the average:
• Approaching Reid Hill Road (19.4 mph)
• Reid Hill Road to Live Oak Drive (31.5 mph)
• Live Oak Drive to Main Street (27.6 mph)
• Main Street to Heatley Street (18.8 mph)
• Heatley Street to Old US 52 (29.7 mph)
• Hollywood Drive to Central Avenue (34.7 mph)
• Central Avenue to Button Hall Road (23.7 mph)
• Button Hall Road to Liberty Hall Road (10.5 mph)
• Liberty Hall Road to Red Bank Road (11.6 mph)
Locations along US 52 where southbound traffic encountered long delays were:
• Main Street (PM)
• Heatley Street PM)
• Old Mt Holly Road (AM)
• Liberty Hall Road (PM)
• Red Bank Road (PM)
Summaries of the Travel Time data are located in the Traffic Analysis Summary Report, submitted separately.
At-Grade Railroad Crossings
Where at-grade rail crossings are in close proximity to a signalized intersection, railroad preemption is often included in the signal operation. Railroad preemption is a special traffic operation that, when track equipment detects a train approaching the crossing, interrupts the normal signal operation to transition to a special signal phase to clear traffic from the intersection approach with the rail crossing. Once that phase is completed, the signal under preemption will run modified phasing that serves the other intersection approaches, though some phases, (such as protected left turn phases) that would bring vehicular traffic into conflict with the at-grade crossing will be skipped. Special ‘blank-out’ signs displaying ‘no left turn’ or ‘no right turn’ symbols are often used at intersections incorporating railroad preemption. The intersections along US 52 have exclusive left turn phases to control left turns onto the side street and either “no right turn” blank-out signs or railroad gates across the right turn ramps. The intersection of US 52 at Button Hall Avenue has permissive left turn phasing and a “no left turn” blankout sign in the southbound direction.
Existing Conditions Report 117
The following signal-controlled intersections along US 52 include an eastern approach and incorporate railroad preemption:
• Old Mt Holly Road/Montague Plantation Road
• Windsor Mill Road/Stephanie Drive
• Hollywood Drive
• Button Hall Avenue
• Thomason Boulevard/Liberty Hall Road
• St James Avenue (US 176)/Red Bank Road
The signal at US 52 and Google Driveway is maintained by a contractor for Google for the last six years. This signal is intended to be a temporary signal that will be removed at an appropriate time in the future.
Previous Studies within the Corridor
The US 52 at US 176 Interchange Concept Report, prepared for Berkeley County evaluated existing intersection operational and geometric deficiencies and traffic operations for conceptual design alternatives, including a partial cloverleaf interchange, single point urban interchange, and tight urban diamond interchange. No preferred alternative was identified in the Concept Report.
2.4.4.2 Existing Conditions
Crash Analysis
SCDOT provided crash data from January 1, 2015 to June 30, 2020 (5.5 years) along the US 52 corridor, including the intersecting arterial roadways, interchanges, and frontage roads within Berkeley and Charleston Counties. During this time period, a total of 4,420 crashes occurred within the study limits. The study corridor was broken down into five segments, each approximately 3 to 4 miles in length to cover the full 18-mile corridor:
• Segment 1: From South of Otranto Road to North of Stephanie Drive
• Segment 2: From North of Stephanie Drive to North of Tom Hill Drive
• Segment 3: From North of Tom Hill Drive to South of Gaillard Road
• Segment 4: From South of Gaillard Road to South of Rembert C. Dennis Blvd
• Segment 5: From South of Rembert C. Dennis Blvd to North of Reid Hill Road
Existing Conditions Report 118
Table 2-25 provides a summary of the available crash data for each segment by year, severity, manner of collision, lighting, and roadway surface.
Existing Conditions Report 119
Crash Data Categories Segment 1 Segment 2 Segment 3 Segment 4 Segment 5 Total 2015 473 87 29 18 8 615 2016 439 111 27 10 5 592 2017 449 123 32 21 15 640 2018 556 152 93 68 156 1025 2019 628 153 102 79 152 1114 2020 (Jan-Jun) 239 60 33 35 67 434 Total 2784 686 316 231 403 4420 Inj. 0 - No Injury 2125 508 214 147 289 3283 Inj. 1 - Possible Injury 457 137 67 63 99 823 Inj. 2 - Non-incapacitating Injury 169 36 21 14 10 250 Inj. 3 - Incapacitating Injury 27 5 10 5 4 51 Inj. 4 - Fatality 5 0 4 2 1 12 Unknown 1 0 0 0 0 1 Total 2784 686 316 231 403 4420 Rear End 1514 429 92 92 144 2271 Angle 623 97 83 53 180 1036 Side Swipe 434 70 29 20 45 598 Not a Collision w/ Motor Vehicle 134 78 100 58 18 388 Head On 28 4 8 6 9 55 Backed Into 34 7 3 2 7 53 Pedestrian/Bicycle 13 0 0 0 0 13 Unknown 4 1 1 0 0 6 Total 2784 686 316 231 403 4420 Dawn 74 34 11 10 6 135 Daytime 2079 483 190 154 317 3223 Dusk 68 10 4 11 9 102 Dark 563 159 111 56 71 960 Total 2784 686 316 231 403 4420 Dry 2343 552 271 192 352 3710 Wet 437 132 41 38 50 698 Ice 1 2 4 1 1 9 Snow 2 0 0 0 0 2 Contaminate 1 0 0 0 0 1 Total 2784 686 316 231 403 4420 Crashes by Lighting Crashes by Roadway Surface Crashes by Severity Crashes by Manner of Collision Crashes by Year
Table 2-25: Crash Data Analysis (January 2015-June 2020)
As shown above, the most southern segment of the study corridor (Segment 1) accounts for 63 percent of the crashes within the study area. Additionally, there was a significant spike in crashes between 2017 and 2018, which may be attributed to an increase in traffic, particularly in Segments 3, 4 & 5

There were 12 reported fatalities and 51 confirmed incapacitating injury crashes over the study period. Out of the 63 reported fatalities and incapacitating injury crashes, 31 occurred at or in the immediate vicinity of a signalized intersection. Out of the 12 fatal crashes, 6 were designated as single vehicle crashes (not a collision with another motor vehicle), 3 were angle crashes, and 3 were sideswipes. Additionally, 11 occurred under dry pavement conditions and 1 occurred with wet pavement conditions. The probable causes listed for the 12 fatal crashes include speeding or aggressive driving (6), failure to yield right of way (3), driving under the influence (2), and lying or illegally in roadway (1).
Figure 2-51 depicts the crash data by time of day, with the highest number of crashes occurring during the 7:00-8:00 AM hour and the 5:00-6:00 PM hour, which is in line with the AM and PM rush hours as determined by the turning movement count data.
There are 20 full or half traffic signals along the study corridor. Table 2-26 shows the crashes at or in the immediate vicinity of each signalized intersection by type. A crash was considered an intersection crash based on crash cluster (based on GPS coordinates) and whether the specific crash type could be attributed to congestion caused by the signalized intersection. Crash rates per intersection are based on the following equation, where the average of the AM and PM peak hour Total Entering Vehicles from the collected turning movement count data was assumed to account for 10% of daily traffic:
Existing Conditions Report 120
Figure 2-51: Crashes by Time of Day
������ = ����× 1,000,000 55 ×365 ×������
Where:
ACR = Actual Crash Rate per 1 Million Entering Vehicles
NC = Number of Crashes
TEV = Total Entering Vehicles and 5.5 is the number of years
Table 2-26: Crashes at Signalized Study Intersections by Manner of Collision
The following intersections have a crash rate that exceeds 1.5 crashes per million entering vehicles over the 5.5-year study period and improvements to these locations should be prioritized (in order from highest crash rate to lowest):
1. US 52 at US 176
2. US 52 at Thomason Blvd / Liberty Hall Rd
3. US 52 at Old Mount Holly Rd
4. US 52 at Button Hall Ave
5. US 52 at Stephanie Dr
6. US 52 at Otranto Rd
7. US 52 at Old US 52
8. US 52 at Central Ave
According to FHWA, sites with a collision rate of 1.5 crashes per 1 million entering vehicles should be considered for further safety evaluation. It should be noted that all of the above locations are within Segments 1 and 2 of the study corridor. Table 2-27 shows the crashes by type at the above 8 priority locations as a percentage of the total at each intersection.
Existing Conditions Report 121
Intersection Rear End Angle Side Swipe Single Veh Head On Backed Into Ped/Bike Total Crash Rate US 52 at Otranto Rd 185 56 64 13 8 5 1 332 2.62 US 52 at US 176 393 126 110 26 5 9 3 672 5.81 US 52 at Thomason Blvd 189 77 47 9 2 9 1 334 4.19 US 52 at Button Hall Ave 99 65 19 5 2 1 1 192 2.88 US 52 at Central Ave 98 20 20 5 0 1 1 145 2.06 US 52 at Hollywood Dr 45 12 5 8 0 2 0 72 1.07 US 52 at Stephanie Dr 111 35 14 11 0 6 1 178 2.66 US 52 at Old Mount Holly Rd 205 31 30 12 2 4 0 284 3.81 US 52 at Old US 52 84 17 15 15 0 1 0 132 2.20 US 52 at Google Driveway 13 2 4 1 0 0 0 20 0.40 US 52 at Cypress Gardens Rd 33 29 9 9 3 1 0 84 1.42 Old US 52 at Cypress Gardens Rd 9 13 1 10 2 0 0 35 1.34 US 52 at Gaillard Rd 41 12 3 3 1 0 0 60 1.30 US 52 at RC Dennis Blvd 18 25 5 6 1 0 0 55 1.19 US 52 at Heatley St 5 29 2 0 0 0 0 36 1.14 US 52 at Main St 18 10 2 0 0 2 0 32 0.86 RC Dennis Blvd at Main St Ext 5 2 0 0 1 0 0 8 0.35 RC Dennis Blvd at Stoney Landing Dr 2 1 0 0 1 0 0 4 0.19 US 52 at N Live Oak Dr 20 16 6 0 1 0 0 43 0.80 US 52 at Reid Hill Rd 34 26 11 3 1 1 0 76 1.36 Segment 4 Segment 5 Segment 2 Segment 1 Segment 3
As shown, all locations have majority rear end crashes, which may be attributed to any of the following:
• Significant congestion in this segment of US 52
• The changing functional classification of the roadway from rural principal arterial to urban principal arterial as you head southbound into Charleston County
• The reduction in speed limit in the southbound direction from 60 mph to 45 mph
• Closely spaced driveways
• Inadequate change and clearance intervals at the intersection
• At-grade railroad crossings along the east legs of the intersections
Some possible remedies for the above causes of rear end crashes are:
• Improved signal coordination or added capacity where needed to reduce congestion
• Driveway consolidation or a frontage road
• Speed enforcement along the corridor
• Confirm change and clearance intervals against minimum required values
The second most predominant crash type at the signalized study intersections is angle crashes, which may be attributed to any of the following:
• Exclusive/Permissive or Permissive left turn phasing on the mainline or sidestreet
o US 52 at Otranto Rd operates with Exclusive/Permissive phasing on the sidestreet approaches
o US 52 at Thomason Blvd operates with Exclusive/Permissive phasing on the sidestreet approaches
o US 52 at Button Hall Ave operates with Exclusive/Permissive phasing in the northbound direction and permissive phasing in all other directions
• Red light running
• Intersection geometry
o This item is particularly relevant to the US 52 at US 176 intersection which is very wide and has sweeping turning paths
To reduce angle type crashes, it is recommended that available traffic data be used to perform a left turn warrant analysis to assess if left turn phasing should be altered to provide protected phasing at applicable intersections and if it’s feasible to improve/tighten the geometry of the US 176 intersection
Side swipe crashes are the next most prevalent crash type, particularly at the Otranto Rd, US 176, and Thomason Blvd intersections. Shoulders are not provided along US 52 which may be a contributing factor, as almost all of the side swipe crashes are in the same direction with the majority attributed to
Existing Conditions Report 122
Table 2-27: Crashes at Signalized Study Intersections as a Percent of Total Intersection Crashes
Intersection Rear End Angle Side Swipe Single Veh Head On Backed Into Ped/Bike US 52 at Otranto Rd 56% 17% 19% 4% 2% 2% 0% US 52 at US 176 58% 19% 16% 4% 1% 1% 0% US 52 at Thomason Blvd 57% 23% 14% 3% 1% 3% 0% US 52 at Button Hall Ave 52% 34% 10% 3% 1% 1% 1% US 52 at Central Ave 68% 14% 14% 3% 0% 1% 1% US 52 at Stephanie Dr 62% 20% 8% 6% 0% 3% 1% US 52 at Old Mount Holly Rd 72% 11% 11% 4% 1% 1% 0% US 52 at Old US 52 64% 13% 11% 11% 0% 1% 0% Segment 1 Segment 2
improper lane use change. Widening US 52 to provide for a shoulder may decrease side swipe type crashes along mainline US 52, and improved guide signage and reduced congestion would reduce the number of lane changes approaching the signalized intersections.
Crash History of At-Grade Rail Crossings
Out of the 4,420 reported crashes within the study area during the 5½ year time period, only 1 crash is listed as occurring between a motor vehicle and a railway vehicle. This crash occurred at the US 176 / Red Bank Road intersection in April 2020. The crash occurred at night and resulted in an incapacitating injury. The probable cause of the crash is listed as the motorist disregarding signs and signals. While not included in the crash data provided by SCDOT, there was also a collision between an AMTRAK train and a vehicle on January 9, 2021 at the Red Bank Road crossing. Median reports that the motorist disregarded and drove around the railroad gates.
Development of TransModeler Network
The TransModeler network was created using links taken from the South Carolina state-wide model (SCSWM) in TransCAD. Those links were incorporated into a TransModeler network and were modified with appropriate attributes to create the base microsimulation model network. The existing signal phasing and timings were confirmed based on SCDOT data.
Caliper’s TransModeler was chosen as the software for performing microsimulation modeling of the corridor and its intersections TransModeler is a microscopic behavior-based multi-purpose traffic simulation program that takes into consideration vehicle interactions and driver behavior, as well as the effects of operational impacts arising from downstream and upstream traffic conditions. TransModeler also has the capability to model multiple modes, including freight rail, which is running parallel to US 52 in Goose Creek It also provides for dynamic traffic assignment to assess and analyze traffic based on future conditions, including land use scenarios that could change the origins and destinations of trips throughout the network.
Quality Counts provided turning movement counts and vehicles classification data for the corridor. The morning and afternoon peak hour volumes were manually entered into the network. The morning peak hour volumes were increased by 9 percent to account for COVID-19 impacts.
Evaluation of Existing Conditions
The existing conditions TransModeler analysis was performed for the signalized and unsignalized intersections within the study area. The existing truck percentages for the model were developed utilizing the tube counts with the truck percentages on US 52 at the north and south end of the corridor, along with two locations on Old US 52 and one location on Rembert C Dennis Blvd. Outside of that, the truck percentages from the turning movement counts were utilized.
Intersection Analysis
Capacity analyses for the signalized and unsignalized intersections within the study area were performed for existing conditions. For unsignalized intersections, the intersection operation is represented by the worst approach delay and LOS of all the stop sign controlled approaches to the intersection. For signalized intersections, the intersection operation is represented by the intersection delay and LOS.
The results of the unsignalized and signalized intersection capacity analyses for existing conditions are shown in Table 2-28
Existing Conditions Report 123
LOS D or better are generally considered to be an acceptable LOS for intersections within urbanized or developed areas. LOS C or better are generally considered to be acceptable LOS for intersections in rural areas. At unsignalized intersections, the stop sign controlled approaches to high volume streets may experience high delay and may require additional evaluation to determine if geometric improvements can be made to reduce delay and/or if the installation of a traffic signal may be warranted. In some cases, the analysis may overestimate delay, such as at University Boulevard or at N.A.D. Road for example, where left turning traffic may use the striped median to complete a two-stage left turn rather than requiring waiting until sufficient gaps are available to complete a single-stage left turn.
Existing Conditions
AM Peak Hour
In addition to the overall Level of Service and Delays shown in Table 3-31, TransModeler simulations for the morning peak hour were observed and minor queue spillovers were observed at the following locations:
Existing Conditions Report 124
Table 2-28: Existing Intersection Capacity Analysis Results
LOS Delay LOS Delay US 52 & Reid Hill Rd/Rembert Dennis Blvd B 14.1 C 20.6 US 52 & N Live Oak Dr B 11.0 B 12.0 E Main St/Main St Ext & US 52 B 15.4 B 19.0 US 52 & Heatley/Altman St and AutoZone Driveway A 7.9 B 19.6 US 52/Rembert Dennis Blvd & US 52/Old US 52 B 15.6 B 19.4 Rembert Dennis Blvd & Stoney Landing Rd B 13.3 A 6.4 Rembert Dennis Blvd & Main St Ext/Sterling Oaks Dr A 7.3 A 6.3 US 52 & Gaillard Rd B 16.8 C 21.7 Old US 52 & Gaillard Rd B 10.4 B 13.8 US 52 & Cypress Gardens Rd D 50.4 E 60.2 Old US 52 & Cypress Gardens Rd B 16.4 E 66.8 US 52 & Mt Holly Commerce Park C 15.1 C 16.3 US 52 & Google A 2.1 A 1.9 US 52 & Old US 52 A 4.4 A 5.0 Goose Creek Blvd & Old Mount Holly Rd/Montague Plantation Rd C 30.3 D 41.1 Goose Creek Blvd & Stephanie Dr/Windsor Mill Rd B 11.8 A 8.4 Goose Creek Blvd & Hollywood Dr B 18.6 C 29.3 Goose Creek Blvd & Central Ave A 9.1 C 27.5 Goose Creek Blvd & Button Hall Ave A 3.4 A 9.2 Goose Creek Blvd & Liberty Hall Rd/Thomason Blvd C 33.7 E 75.1 Goose Creek Blvd & Saint James Ave/Red Bank Rd E 61.8 F 87.2 University Blvd & Old University Blvd F 627.8 F 1,061.1 N.A.D. Rd & Goose Creek Rd F 80.6 F 573.4 US 52 & Otranto Rd C 33.9 D 41.2 ### Signalized intersections ### Unsignalized intersections Intersection Name AM PM 2020 Existing
• Eastbound approach of Cypress Gardens Road at US 52
• Northbound left turn lane on N.A.D. Road at Goose Creek Road
• Northbound left turn lane on US 78 at Old University Boulevard
• Westbound left turn lane on Liberty Hall Road at Goose Creek Blvd
• Westbound left turn lane on Old Mount Holly Road at Goose Creek Blvd
PM Peak Hour
In addition to the overall Level of Service and Delays shown in Table 2-30, TransModeler simulations for the afternoon peak hour were observed and minor queue spillovers were observed at the following locations:
• Westbound left turn lane of US 78 at Old University Boulevard
• Northbound left turn lane on Old University Boulevard at US 78
• Northbound left turn lane on N.A.D. Road at Goose Creek Road
• Westbound left turn lane of Otranto Road
• Westbound approach on Liberty Hall Road at Goose Creek Blvd
• Eastbound left turn lane on Liberty Hall Road at Goose Creek Blvd
• Eastbound left turn lane on Central Avenue at Goose Creek Blvd
• Westbound left turn lane on Old Mount Holly Road at Goose Creek Blvd
Traffic Signal Warrant Analysis
Following the project scope of services, traffic signal warrant analyses were performed following the methodology outlined in the Manual on Uniform Traffic Control Devices (MUTCD), 2009 Edition, using existing turning movement counts collected between 6 AM and 7 PM at the following four Tintersections:
• US 52 at S-8-1067 (Tom Hill Road) – entrance to Mt Holly Commerce Park
• Old US 52 at S-8-357 (Gaillard Road)
• US 78 (University Boulevard) at S-10-2532 (Old University Boulevard)
• Goose Creek Road at S-10-2533 (N.A.D. Road)
The MUTCD states that an engineering study shall be conducted to justify the installation of a traffic control signal. The study shall investigate the need for a traffic control signal based on an analysis of applicable traffic signal warrants as listed below:
• Warrant 1
• Warrant 2
• Warrant 3
• Warrant 4
• Warrant 5
• Warrant 6
• Warrant 7
• Warrant 8
• Warrant 9
Eight-Hour Vehicular Volume
Four-Hour Vehicular Volume
Peak Hour
Pedestrian Volume
School Crossing
Coordinated Signal System
Crash Experience
Roadway Network
Intersection near a Grade Crossing
When an intersection is located in a community of less than 10,000 population or the speed on the major street exceeds 40 mph, the minimum volume thresholds required to meet the signal warrants are reduced.
Existing Conditions Report 125
–
–
–
–
–
–
–
–
–
Since the major‐street speed exceeds 40 mph for all four intersections, these volume reductions have been applied.
The MUTCD indicates a traffic control signal should improve the overall operation or safety of the intersection. The MUTCD also indicates engineering judgment is required to determine how right turn movements on the minor street approaches effect the intersection operation and determine if any volume reductions are appropriate when assessing the intersection.
In assessing the traffic signal warrants at the four T-intersections, only the Old US 52 intersection with Gaillard Road did not include a separate right turn lane on the minor street approach. At the US 52 intersection with Tom Hill Road, the eastbound minor street right turn lane is channelized and turn onto an approximately 500 feet long acceleration lane on southbound US 52. In this case, the minor street right turn movements would have minimal conflict with US 52 traffic. For this reason, the right turn volumes from the minor street approach at this intersection were removed from consideration in the warrant analysis. At the other two T-intersections, a single lane widens to provide separate left and right turn lanes on the northbound minor street approaches. The right turn movements are not channelized and do not have an acceleration lane to facilitate turning onto the major street with minimal conflict. These minor street approaches were analyzed as single lane approaches and no reductions were made to the right turn volumes.
Warrant 1 – Eight‐Hour Vehicular Volume
Warrant 1 is composed of three conditions; Condition A – Minimum Vehicular Volume, Condition B –Interruption of Continuous Traffic and the combination of Conditions A and B. The combination of Conditions A and B is intended for application at locations where Condition A is not satisfied, and Condition B is not satisfied. The MUTCD states that the need for a traffic control signal shall be considered if one of the two conditions of the warrant exists for 8 hours of an average day or a combination of conditions 1A and 1B exists.
Warrant 2 – Four‐Hour Vehicular Volume
According to the MUTCD, the conditions of Warrant 2 are to be applied where the volume of intersecting traffic is the principal reason for traffic control signal installation. To satisfy Warrant 2, the hourly vehicular volume of each of four hours in an average day must fall above the applicable curve, as depicted in the charts contained within the MUTCD.
Warrant 3 – Peak Hour
According to the MUTCD, to satisfy Warrant 3 the hourly vehicular volume for one hour of an average day must fall above the applicable curve as depicted in the charts contained within the MUTCD. The MUTCD advised that this warrant “…shall be applied only in unusual cases, such as office complexes, manufacturing plans, industrial complexes, or high‐occupancy vehicle facilities that attract of discharge large numbers of vehicles over a short time.”
Warrant 4 – Pedestrian Volume
Warrant 4 is considered when high volumes of major street traffic result in excessive delay to pedestrians waiting to cross. Pedestrian traffic at the four intersections were negligible and delay to pedestrians crossing the major street was not observed. Therefore, Warrant 4 is not applicable.
Warrant 5 – School Crossing
Existing Conditions Report 126
Warrant 5 is considered when a signal is needed to assist elementary school through high school students to cross the major street. No school crossings are located at the four intersections. Therefore, Warrant 5 is not applicable.
Warrant 6
Coordinated Signal System
Warrant 6 is considered when it is necessary to install traffic signals at unsignalized intersections to maintain vehicle platooning along the major street. Maintaining progressive movement of vehicle platoons in a coordinated signal system is not a factor in considering the installation of a traffic control signal at this intersection. Therefore, Warrant 6 is not applicable.
Warrant 7 – Crash Experience
The MUTCD states that the need for a traffic control signal shall be considered if all three of the following criteria are met for an intersection:
A. Adequate trial of alternatives with satisfactory observance and enforcement
B. Five or more reported crashes, of types susceptible to correction by a traffic control signal, have occurred in a 12‐month period
C. For each of any 8 hours of an average day, the vehicles per hour (vph) given in both of the 80 percentcolumnsofWarrant1,ConditionA,orthevphinbothofthe80percentcolumnsofWarrant 1, Condition B exists on the major‐street and the higher‐volume minor‐street approach
Under Condition A, there are none of the typical alternatives to reduce crash experience, such as advance warning signs or flashing warning beacons, in place at the four intersections. Thus, condition A of Warrant 7 is not satisfied.
Under Condition B, crash reports for the four intersections have been collected from SCDOT for 5.5 years from January 1, 2015 through June 30, 2020. The crashes that occurred at the US 52 at S-8-1067 (Tom Hill Road), Old US 52 at S-8-357 (Gaillard Road), and Goose Creek Road at S-10-2533 (N.A.D. Road) intersections during that time period consisted of angle, rear‐end crashes, single vehicle, and side swipe type crashes. Of these, right angle crashes are the crash type that may be susceptible to correction by a traffic signal. To satisfy Warrant 7, at least five angle crashes have to occur within a year. For every year, that the crash data is provided, the number of right-angle crashes is four or less. Thus, condition B of Warrant 7 is not satisfied at these three locations. For the US 78 (University Boulevard) at S-10-2532 (Old University Boulevard) intersection, there were 13 angle crashes that occurred in 2019 and would be susceptible to correction by a traffic signal. Thus, condition B of Warrant 7 is satisfied at the US 78 (University Boulevard) at S-10-2532 (Old University Boulevard) intersection.
As for condition C, the required volumes of the 80 percent column of Warrant 1 Condition A are met for nine hours at the intersection of US 78 at Old University Boulevard, and are met for eight hours at the intersection of Goose Creek Road and N.A.D. Road. Since eight hours must be satisfied for either Condition A or Condition B, condition C of Warrant 7 is satisfied.
Since all three conditions are not met, Warrant 7 is not satisfied.
Warrant 8 – Roadway Network
Warrant 8 is considered where organizing and concentrating traffic flow might be justified. Since encouraging concentration and organization of traffic flow by installing a traffic control signal at this intersection is not being considered, Warrant 8 is not applicable.
Existing Conditions Report 127
–
Warrant 9 – Intersection near a Grade Crossing
Warrant 9 is considered when none of the previous eight warrants are met but the intersection has an atgrade crossing on an approach controlled by a stop sign or yield sign. None of the four intersections are located where an at-grade crossing is present on one of the approaches. Therefore, Warrant 9 is not applicable.
The results of the warrant analyses at the four intersections are shown in Table 2-29 Summaries of the individual intersection warrant analyses reports are contained in the Traffic Technical Report, submitted separately.
A - Separate right turn lane with acceleration lane; minor street right turn volumes not considered
B - Does not meet warrant volume thresholds for eight or more hours when analyzed as two minor lanes
Guidance in the MUTCD suggests that an approach should be considered two lanes if approximately half of the traffic on the approach turns left and the left-turn lane is of sufficient length to accommodate all left-turn vehicles. On the University Boulevard approach to US 78, the existing volumes are heavier on the left turn movement than the right turn movement, and the left turn storage lane is approximately 250 feet long. During five of the 13 hours counted, the left turn traffic is double the right turn volume; for 11 of the 13 hours, the left turn volume was at least 38 percent higher than the right turn volume. On the N.A.D. Road approach to Goose Creek Road, the existing volumes are substantially heavier on the right turn movement than on the left turn movement, and the left turn storage lane is approximately 170 feet long. During ten of the 13 hours counted, the right turn volume is more than double the left turn volume. An additional warrant analyses was performed considering the minor street approach as two lanes instead of one lane at these intersections. The results of the additional warrant analyses were the same as the analyses with considering one lane minor approaches, except the combination Warrant 1A and 1B no longer met warrants for a minimum of eight hours.
The results of the traffic signal warrant analyses indicate the intersections of US 78 at Old University Boulevard and Goose Creek Road at N.A.D. Road meet Warrant 1B, Combination Warrant 1A & 1B, Warrant 2, and Warrant 3 for more than the minimum required number of hours. These intersections are in close proximity to the US 52/US 78 interchange ramps where installing a signal could disrupt traffic flow to and from the ramps. At the intersection of US 78 and Old University Boulevard, consideration
Existing Conditions Report 128
Table 2-29: Warrant Analysis Summary
Intersection Major Lanes Minor Lanes Major Street Speed Warrant 1A Warrant 1B Warrant 1A & 1B Warrant 2 Warrant 3 US 52 at Tom Hill Road 2 2A 60 No No No No No Old US 52 at Gaillard Road 1 1 55 No No No No No US 78 at Old University Boulevard 3 1 45 No Yes YesB Yes Yes Goose Creek Road at N.A.D. Road 2 1 45 No Yes YesB Yes Yes Intersection Major Lanes Minor Lanes Major Street Speed Warrant 4 Warrant 5 Warrant 6 Warrant 7 Warrant 8 Warrant 9 US 52 at Tom Hill Road 2 2A 60 n/a n/a n/a No n/a n/a Old US 52 at Gaillard Road 1 1 55 n/a n/a n/a No n/a n/a US 78 at Old University Boulevard 3 1 45 n/a n/a n/a No n/a n/a Goose Creek Road at N.A.D. Road 2 1 45 n/a n/a n/a No n/a n/a
and coordination with the Lowcountry Rapid Transit Project needs to occur before any improvements are recommended here.
Additionally, the Goose Creek Road/N.A.D. Road intersection is located within 300 feet of an at-grade railroad crossing on the east leg of Goose Creek Road. Since Goose Creek Road traffic currently has no traffic control through this intersection, the introduction of a signal at this location would create the potential of stopping westbound traffic which could back up onto the railroad crossing. A signal installation at this location would likely require the incorporation of railroad preemption circuitry, as is present at many of the other signalized intersection that are in close proximity to at-grade crossings along US 52.
Foxbank Plantation Access
Stakeholder discussions have raised concerns about traffic movements into and out of the Foxbank Plantation subdivision, generally located in the northwest quadrant of the intersection of US 52 with Cypress Gardens Road. Access is currently provided on US 52 at Foxbank Plantation Boulevard, located approximately 1,750 feet north of Cypress Gardens Road, and Red Leaf Boulevard, located approximately 3,100 feet north of Foxbank Plantation Boulevard. Future access is to be provided via Yorkshire Drive, which is located on Cypress Gardens Road approximately 1,350 feet west of US 52. Neither of the existing access locations are currently controlled by traffic signals.
Foxbank Elementary School is located approximately 1,600 feet west of US 52 on Foxbank Plantation Boulevard. Driveways to the school are located opposite Alderly Drive and Yorkshire Drive, which both connect to the future neighborhood access point at the Cypress Gardens Road intersection with Yorkshire Drive. In additional to providing access to traffic generated by the residential and commercial areas of the neighborhood, school traffic from outside the neighborhood also enter and exit Foxbank Plantation via Foxbank Plantation Boulevard. As development continues within Foxbank Plantation and school enrollment increases within Foxbank Plantation and at other outside neighborhoods, traffic entering and exiting Foxbank Plantation will continue to increase.
Information has been provided about the difficulty experienced by traffic turning left when exiting Foxbank Plantation. Comments received indicate that drivers avoid the delay encountered waiting to turn left by instead turning right, traveling south on US 52 and making a U-turn at adjacent intersections or median crossovers. The actual left turn demand, therefore, is not included in the turning movement count. As a result, traffic signal warrant studies have concluded that a traffic signal is currently not warranted.
US 52 at Reid Hill Road
Stakeholder discussions have also raised concerns about northbound left turn movements from US 52 to Reid Hill Road. Without a left turn traffic signal phase, comments indicated that traffic is turning left at either of the two driveways south of the intersection toward the Walmart parking lot to access Reid Hill Road. Similar to Foxbank Plantation Blvd. above, since left turning traffic at the signalized intersection is reduced due to the diversion, a left turn signal phase is not warranted.
Access Management Opportunities
Comments received from stakeholders indicated concerns about access in the more developed commercial areas of the corridor in Moncks Corner and Goose Creek. These comments indicated that it is difficult to access adjacent properties without having to re-enter US 52. In the developing areas of the corridor in Berkeley County, it appears that access management principles are being applied to allow traffic to travel between adjacent properties without re-entering US 52.
Existing Conditions Report 129
2.4.5 HIGHWAY
2.4.5.1 Existing Conditions
The predominate roadway design standards used to evaluate the US 52 corridor are the American Association of State Highway and Transportation Officials (AASHTO) A Policy on Geometric Design of Highways and Streets (2011 Edition) and SCDOT Roadway Design Manual (RDM) (2021).
The US 52 roadway functional classification is Principal Arterial and alternates between urban in the denser population centers and rural in the less dense segments. Roadway functional classification descriptions can be found in the SCDOT Roadway Design Manual Section 3.4.1, but is generally defined as Arterials, Collectors and Local Roads and streets. Arterials include larger volume roadway networks connecting and traveling through city centers. Collectors are the distribution network of roadways and local roads provide the direct access to adjacent properties off the arterial and collector roadway network. Although the classification urban and rural can have varying typical sections throughout the state, it is relatively consistent within the study area that urban segments are within municipal limits and can have open shoulder and/or curb and gutter with or without sidewalk and rural segments have open shoulder and roadside ditches.
Other major roadways included in the corridor study including Old US 52 and Rembert C. Dennis Boulevard (US 52 Bypass). Old US 52 is a Major Collector classification and Rembert C. Dennis Boulevard is classified as an Urban Major Collector. A summary of the functional classification for the roads in the US 52 Corridor Study can be found in Table 2-30 below. The roadway classification system assists in defining the function and balances travel mobility and access to property. For example, an urban roadway allows for tighter intersection and driveway spacing to increase property access in denser development setting while efficiently and safely moving traffic through the system. These challenges are present in the US 52 corridor study given the proximity of US 52 to the urban regions of North Charleston, Goose Creek and Moncks Corner.
Another factor that varies along the corridor is the posted speed limit. Along US 52 the posted speed varies from 40 to 60 mph. The posted speed is reduced in urban areas and increases as traffic travels into the rural segments of the corridor. Old US 52 and Rembert C. Dennis Blvd have posted speeds varying from 40 to 55 MPH. A summary of posted speeds along the corridor can be found in Table 2-31 below. In section 3.5 of the SCDOT Roadway Design Manual design speed is characterized as 5 miles per hour more than the posted speed. For evaluation of the corridor, a design speed of 5 miles per hour higher than the posted speed was used.
Existing Conditions Report 130
Table 2-30: US 52 Corridor Functional Class Summary
ROADWAY FROM TO FUNCTIONAL CLASS US 52 OTRANTO RD. BUTTON HALL AVE. URBAN PRINCIPAL ARTERIAL US 52 BUTTON HALL AVE. REMBERTC. DENNIS BLVD. RURAL PRINCIPAL ARTERIAL US 52 REMBERTC. DENNIS BLVD. COOPER RIVER URBAN PRINCIPAL ARTERIAL OLD US 52 US 52 JUNIOR RD. URBAN MAJOR COLLECTOR OLD US 52 JUNIOR RD. MOLLY BRANCH STREAM RURAL MAJOR COLLECTOR OLD US 52 MOLLY BRANCH STREAM US 52 URBAN MAJOR COLLECTOR REMBERTC. DENNIS BLVD OLD US 52 REID HILL RD URBAN MAJOR COLLECTOR
2.4.5.2 Typical Sections
The typical section varies along the corridor based on the functional classification of the roadway segment as well as the traffic demands of the roadway segment. One consistency is that travelway widths for all arterial and collector roadways is 12 feet, meeting current roadway design standards and there are currently no shared bike lanes (14’ outside lane widths) or dedicated bike lanes within the study area. The various typical sections are provided in the following Table 2-32.
Existing Conditions Report 131
Table 2-31: US 52 Corridor Posted Speed Summary
ROADWAY FROM TO POSTED SPEED US 52 MIDLAND PARK RD. OTRANTO RD. 45 MPH US 52 OTRANTO RD. BERKELEY COUNTY LINE 50 MPH US 52 BERKELEY COUNTY LINE SEEWEE DR. 45 MPH US 52 SEEWEE DR. WOODLAND LAKES RD. 50 MPH US 52 WOODLAND LAKES RD. PINE GROVE RD 55 MPH US 52 PINE GROVE RD. HOPKINS DR. 60 MPH US 52 HOPKINS DR. OLD US 52 45 MPH US 52 REMBERTC. DENNIS BLVD. COOPER RIVER 40 MPH OLD US 52 US 52 ORION WAY 45 MPH OLD US 52 ORION WAY CYPRESS GARDENS RD. 55 MPH OLD US 52 45 MPH OLD US 52 CYPRESS GARDENS RD. DAIRY FARM RD. 55 MPH OLD US 52 DAIRY FARM RD. US 52 40 MPH REMBERTC. DENNIS BLVD OLD US 52 REID HILL RD 45 MPH THROUGH CYPRESS GARDEN INTERSECTION
Table 2-32: US 52 Typical Section Summary
The following set of illustrations show the general typical sections along the corridor, while recognizing the variations list in Table 2-32 above.

Existing Conditions Report 132
ROADWAYSEGMENT FROM TO TYPICALSECTION MEDIAN WIDTH ROADSIDEELEMENTS RIGHTOFWAYWIDTH US52 OTRANTOROAD US78INTERCHANGE @SOUTHERNRAMPS 6LANE WITHRAISEDMEDIAN 16' 5'SIDEWALKONEASTSIDE 145'-185'TOTALWIDTH US52 US78INTERCHANGE @SOUTHERNRAMPS US78INTERCHANGE @NORTHERNRAMPS 6LANE WITHRAISEDMEDIAN 16' NOSIDEWALK/PATHS 150'-160'TOTALWIDTH US52 US78INTERCHANGE @NORTHERNRAMPS GOOSECREEKBRIDGE 6LANE WITHRAISEDMEDIAN 16' 14'SHAREDUSEPATH ONWESTSIDE 190'TOTALWIDTH US52 GOOSECREEKBRIDGE CAMELOTDRIVE 6LANEWITH TWOWAYLEFTTURNLANE MEDIAN 16' 14'SHAREDUSEPATH ONWESTSIDE 5'SIDEWALKONEASTSIDE 150'-190'TOTALWIDTH US52 CAMELOTDRIVE CAROLINAAVEUNE 6LANEWITH TWOWAYLEFTTURNLANE MEDIAN 16' 5'SIDEWALKONWEST& EASTSIDE 120'-150'TOTALWIDTH US52 CAROLINAAVEUNE BUTTONHALLAVENUE 6LANEWITH TWOWAYLEFTTURNLANE MEDIAN 16' 5'SIDEWALKONWESTSIDE 115'-137.5'TOTALWIDTH US52 BUTTONHALLAVENUE SEEWEEDRIVE 4LANE WITHDEPRESSEDGRASS MEDIAN 36' NOSIDEWALK/PATHS 137.5'TOTALWIDTH US52 SEEWEEDRIVE GOOSECREEK COMMUNITYCENTER 4LANE WITHDEPRESSEDGRASS MEDIAN 36' 10'SHAREDUSEPATHON WESTSIDE 137.5'-175'TOTALWIDTH US52 GOOSECREEK COMMUNITYCENTER REMBERTC.DENNISBLVD./ OLDUS-52 4LANE WITHDEPRESSEDGRASS MEDIAN 36'-60' NOSIDEWALK/PATHS 210'-285'TOTALWIDTH US52& US17A REMBERTC.DENNISBLVD./ OLDUS-52 REMBERTC.DENNISBLVD./ REIDHILLROAD 4LANEWITH TWOWAYLEFTTURNLANE MEDIAN 15' 5'SIDEWALKONWEST& EASTSIDE 75'-85'TOTALWIDTH OLDUS52/ OLDFORTROAD US52 CYPRESSPLANTATIONROAD/ COLONYPOSTLOOP 2LANE WITHNOMEDIAN N/A NOSIDEWALK/PATHS 75'-180'TOTALWIDTH OLDUS52/ OLDFORTROAD CYPRESSPLANTATIONROAD/ COLONYPOSTLOOP CYPRESSGARDENSROAD 2LANEWITH TWOWAYLEFTTURNLANE MEDIAN 15' NOSIDEWALK/PATHS 75'-85'TOTALWIDTH OLDUS52/ OLDFORTROAD CYPRESSGARDENSROAD US52 2LANE WITHNOMEDIAN N/A NOSIDEWALK/PATHS 75'-85'TOTALWIDTH REMBERTC.DENNIS BLVD US-52/OLDUS52 US52&US17A 2LANE WITHNOMEDIAN N/A NOSIDEWALK/PATHS 90'-100'TOTALWIDTH
Figure 2-52: Typical Section US 52 – Otranto Road to US 78 Interchange


Existing Conditions Report 133
Figure 2-53: Typical Section US 52 - Through US 78 Interchange
Figure 2-54: Typical Section US 52 - Goose Creek Bridge to Camelot Drive
As US 52 changes functional classification to Rural Principal Arterial in the vicinity of Button Hall Road, the typical section transitions to a 4-lane section with a depressed grass median. The 4-lane section with the grass median continues from Seewee Drive to Rembert C. Dennis Boulevard with a varying median width of 36’ to 60’. From Seewee Drive to the Goose Creek Community Center there is a 10’ multi-use path west of the US 52 roadway for approximately 1.5 miles.


Existing Conditions Report 134
Figure 2-55: Typical Section US 52 - US 176 / Red Bank Road to Button Hall Avenue
Figure 2-56: Typical Section US 52- Seewee Drive to Goose Creek Community Center
Figure 2-57: Typical Section US 52- Goose Creek Community Center to Rembert C. Dennis Boulevard
At the Rembert C. Dennis and US 52 intersection, US 52 transitions from a Rural Principal Arterial to an Urban Principal Arterial through the Town of Moncks Corner. From this intersection until the end of the study corridor, the US 52 typical section is a 4-lane section with 15’ two-way left turn lane with curb and gutter and 5’ sidewalks on both sides of the roadway.
Old US 52 is a 2-lane section with open shoulders and remains consistent throughout the corridor with the exception of, the approximately 1.0 mile section in the vicinity of new developments such as Strawberry Station and Spring Grove Plantation where a two-way left turn lane is added. This wider section continues through the intersection of Cypress Gardens Road and then drops to a two-lane section to the northern intersection with US-52. Rembert C. Dennis Boulevard bypassing the town of Moncks Corner is a 2-lane section with 2’ paved shoulders for the length of the corridor.


Existing Conditions Report 135
Figure 2-58: Typical Section US 52- In Moncks Corner
Figure 2-59: Typical Section Old US 52 and Rembert C. Dennis Boulevard
2.4.5.3 Geometric Analysis
The study area includes 24 intersections consisting of 20 signalized intersections and 4 unsignalized intersections. Intersection geometry was evaluated for short-term recommendations to improve safety and efficiency.
The addition of various configurations of auxiliary lanes occurs throughout the corridor. The existing conditions of each intersection was evaluated, including a review of sight distances, storage lengths, taper lengths, acceleration distances, and deceleration distances to determine if safety improvements could be implemented along the corridor. The following geometric deficiencies were identified as not meeting the current SCDOT Roadway Design Manual
Several locations along the corridor include intersections with median acceleration lanes from the side street left turns.
Traffic from the side road turns into an acceleration lane and is expected to accelerate and merge with traffic into the left lane of US 52. As shown in Table 2-33, none of these median acceleration lanes meet current design standards to allow for the safe merge into traffic.
VULCAN/SANDERS
Table 2-33: US 52 Corridor Median Acceleration Lane Length Summary
Although all median acceleration lanes fail to meet current design standards, only 2 locations are experiencing a crash problem:
• Central Avenue has experienced 14 crashes that appear to be associated with the median acceleration lane
• Old US 52 has experienced 13 crashes that appear to be associated with the median acceleration lane
Existing Conditions Report 136
TURNING MOVEMENT ENTRANCE SPEED DESIGN SPEED OF ENTERING HIGHWAY CURRENT LENGTH REQUIRED LENGTH CENTRAL AVE LEFT TURN ONTO US 52 15 MPH 50 MPH 450 FEET 660 FEET HOLLYWOOD DRIVE LEFT TURN ONTO US 52 15 MPH 55 MPH 400 FEET 900 FEET CENTURY ALUMINUM FACILITY LEFT TURN ONTO US 52 20 MPH 65 MPH 225 FEET 1310 FEET OLD FORT ROAD (OLD US 52) LEFT TURN ONTO US 52 15 MPH 65 MPH 450 FEET 1350 FEET GOOGLE CONSTRUCTION ENTRANCE LEFT ONTO US 52 20 MPH 65 MPH 550 FEET 1310 FEET
BROTHERS LEFT TURN ONTO US 52 15 MPH 65 MPH 1200 FEET 1350 FEET BERKELEY COUNTY LANDFILL LEFT TURN ONTO US 52 15 MPH 65 MPH 700 FEET 1350 FEET
Additionally, auxiliary lanes should be adequately sized to meet the traffic demands of the area allowing for an adequate number of cars to wait for the turn or store in the turn lane, commonly referred to as storage length. The SCDOT Roadway Design Manual has a minimum right-turn lane storage length of 100 feet and a minimum left-turn lane storage length of 150 feet for urban areas and 200 feet for rural areas. Guidelines for turn lanes can be found in Section 9.5.1 of the SCDOT Roadway Design Manual. In addition to storage length, SCDOT prefers that the auxiliary lanes provide adequate deceleration distance for traffic to safely stop before the queue of turning vehicles. The SCDOT Roadway Design Manual requires taper lengths to be provided for the deceleration of vehicles entering the auxiliary lane. (Minimum taper lengths for auxiliary lanes can be found in Figure 9.5-I of the SCDOT Roadway Design Manual). Intersection conditions within the US 52 corridor were evaluated to see if adequate taper lengths, storage lengths, and in some cases acceleration and deceleration lengths were provided.
In the urban areas of the US 52 corridor where there is a center turn lane, pavement makings can be improved to provide the required deceleration and storage lengths for turning movements. Table 2-34 below outlines turning movements where additional turn lane lengths can be provided by adjusting pavement markings. The table shows the current storage and deceleration length and the recommended minimum storage and deceleration length. Pavement markings should not be extended to conflict with access points to adjacent properties.
Table 2-34: US 52 Pavement Marking Recommendations Summary
INTERSECTION RECOMMENDATION
NORTHBOUND US 52 LEFT TURN TO BUTTON HALL AVENUE
NORTHBOUND US 52 LEFT TURN TO N. LIVE OAK DRIVE
In addition to the conditions of the current auxiliary lanes, the intersections in the corridor were evaluated based on intersection spacing and intersection alignment. The spacing recommendations outlined in the SCDOT Roadway Design manual indicate that urban intersections should be a minimum of 500 feet apart for an urban segment and ¼ mile apart in rural areas. In general, the intersection spacing within the US 52 corridor meets design standards. The spacing between the US 52 and Altman Street intersection and the US 52 and Old US 52 intersection is set at approximately 500 feet, however the lengths for the turning movements on the shared approach of the intersections could cause storage queues to conflict with one another. According to Section 9.2.6.2 of the SCDOT Roadway Design Manual, a perpendicular angle is preferred for intersections, however an angle of 70 degrees is allowable. The intersections of US 52 at Red Bank Road, US 52 at Old US 52, US 52 at North Live Oak Drive, and Old US 52 at Cypress Gardens Road present intersection angles in excess of 70 degrees and can make turning movements for tractorsemitrailers difficult. Due to right of way limitations, realignment of US 52, US 176, and North Live Oak Drive to meet current design standards would not be feasible due to extensive impacts and costs.
Existing Conditions Report 137
OTRANTO ROAD LEFT TURN TO NORTHBOUND US 52 INCREASE STORAGE LENGTH FROM 125 FT TO 150 FT INCREASE TAPER LENGTH FROM 100 FT TO 165 FT EASTBOUND BUTTON HALL AVENUE LEFT TURN TO NORTHBOUND US 52 INCREASE STORAGE LENGTH FROM 120 FT TO 150 FT INCREASE TAPER LENGTH FROM 140 FT TO 165 FT
EASTBOUND
INCREASE TAPER LENGTH FROM 140 FT TO 180 FT
INCREASE TAPER LENGTH FROM 50 FT TO 180 FT
2.4.5.4 Existing Plans Analysis
Using GIS data and past construction plans for the US 52 corridor, STV was able to compile archived drawings for the existing conditions of the roadway. Information from existing construction plans from the year 1940 to the year 1990 were used along with GIS data to confirm existing geometry layout of the US 52 corridor. The widening of US 52 and establishment of the Old US 52 alignment was completed across several projects from the year 1958 to 1973. A summary of the main construction of the roadways in the US 52 corridor can be found in Table 2-35 below.
Other improvements were made along the US 52 corridor through intersection improvement projects. These projects focused on accommodating turning movements and updating the intersections to the condition they are today. During the 1940’s there were construction projects that focused on the US 52 and US 78 Interchange and the US 52 and US 176 intersection. During the 1980s intersection improvements were made along US 52 in Goose Creek at the intersections of Stephanie Drive, Hollywood Drive, and Old Fort Road Lastly, in 1990 an intersection improvement project was constructed at the US 52 and US 176 intersection. Controlled Access Limits were found along US 52 through the US 78 interchange and from Old US 52/ Old Fort Road to Rembert C. Dennis Boulevard.
Existing Conditions Report 138
Table 2-35: Summary of Project History for the US 52 Corridor
PROJECTDESCRIPTION STARTOF PROJECT END OF PROJECT YEAR PROJECTNUMBER ROADWAY ALIGNMENTOF OLD US 52 WITH 2 LANE SECTION US 52 INTERSECTION REMBERTC. DENNIS BLVD. INTERSECTION 1958 FILE NO. 8.346 ROADWAY WIDENINGOF US 52WITH 4LANE SECTION AND GRASS MEDIAN US 176 INTERSECTION PINE GROVE RD. INTERSECTION 1967 FILE NO. 8.408 ROADWAY WIDENINGOF US 52WITH 4LANE SECTION AND GRASS MEDIAN OLD FORTRD. INTERSECTION REMBERTC. DENNIS BLVD. INTERSECTION 1969 FILE NO. 8.431 ROADWAY WIDENINGOF US 52WITH 4LANE SECTION AND TWO-WAY CENTER TURN LANE REMBERTC. DENNIS BLVD. INTERSECTION COOPER RIVER 1973 FILE NO. 8.461
3 Forces and Trends
The forces and trends influencing development and growth and multimodal travel on the US 52 corridor have changed over time and are significantly evolving. At one time US 52 was one of a few “gateway” corridors to the City of Charleston including US 17 and SC 41. To provide more direct regional access to Charleston, I-26 was completed in 1960 and almost overnight conditions changed along US 52 for travel demand and land use and development. Rapid population and employment growth within the BCD region over the last 15 years coupled with growing capacity issues on its major highway and interstate network have once again created rapidly growing travel demand on the US 52 corridor. We have identified several key trends which will influence the future of the corridor and the Steering Committee’s work on the project.
• Life-Work Balance – Based on current projections for population and employment growth according to CHATS Travel Demand Model, population growth will outpace job growth in the corridor 3 residents for every new job, assuming the continuation of existing development pattern will occur This means residents will continue to leave the area for employment and exacerbate long-term regional commuting needs. A collective examination of future land use plans for the corridor as a whole could bring agreement on how to better match jobs-housing needs in the corridor for everyone’s benefit.
• Corridor Safety- The crash analysis indicates that safety is an issue throughout the corridor as 4,420 crashes occurred within the study limits in the 5 ½ years from January 1, 2015 to June 30, 2020. We have begun to isolate and understand some of the causes including congestion, acceleration and deceleration lane needs, intersection geometry, speeds, etc. We have offered several short-term improvement ideas, but the next phase of our work will examine and more comprehensively illustrate design features of the corridor that can improve motorist safety as development occurs and travel demand increases. The Stakeholders and BCDCOG have already given significant thought and energy to planning a connected bicycle, pedestrian and transit framework in the corridor. As the region establishes bicycle and pedestrian infrastructure and increased transit opportunities along the corridor, an added dimension design and traffic control and safety will become increasingly important.
• Travel Mode and Corridor Capacity – The Regional Transit Framework Plan seeks to diversify travel options and reduce reliance on the automobile in the BCD region by creating a wellconnect high-capacity transit network. Current development of the Lowcountry Rapid Transit BRT along the US 78/US 52 (Rivers Avenue) on the southern end of the corridor. This study can examine ways on providing access for those transit dependent and choice riders that would in the north reaches of the corridor to gain access to this new alternative. This is the right time for the Steering Committee to also think about its interest in more robust transit in the corridor overall. As noted, to be effective, overtime land use patterns should be modified slightly to bring more population and employment within easy reach of the corridor to make improved transit feasible. Having insights on preferences in this regard will allow the design team to consider transit factors now that might affect design improvements for the corridor, including preserving right of way for future improvements. In addition, SCDOT has implemented access control along portions of the corridor to improve vehicular safety. There has been a desire from locals to improve interparcel connectivity along the corridor to encourage economic development and local employment growth opportunities.
Existing Conditions Report 139
4 Short Term Recommendations
4.1 Traffic
As indicated above in the Traffic section, there are capacity constraints along US 52 through Goose Creek, at the Cypress Gardens intersections with US 52 and Old US 52 and at the two unsignalized intersections along US 78 in North Charleston. The following are recommended as short-term improvements:
• Old US 52 at Cypress Gardens Road - Adjust the traffic signal timing to improve the PM Level of Service from E to B and reduce the average delay from 66.8 seconds to 16.6 seconds.
• US 52 at Cypress Gardens Road - Add turn lanes on both approaches of Cypress Gardens Road as illustrated in Appendix A, Exhibits 5 & 6. Note that the westbound left turn lane and three lane section extending east to the railroad crossing are anticipated to be permitted and constructed to support proposed development. This improves the existing PM Level of Service from E to B and reduces the average delay from 60.2 seconds to 15.2 seconds.
• US 52 at Liberty Hall Road - Install a northbound and westbound right turn overlap signal phase as illustrated in Appendix A, Exhibit 2. While the Level of Service remains an E, but the average delay is reduced from 75.1 seconds to 69.2 seconds.
o US 52 at US 176/Red Bank Road: Install a 3rd northbound left turn lane
o Prohibit westbound left turns
o Convert the westbound left turn lane to a 2nd through lane
o Install a westbound right turn overlap signal phase
This improves the PM Level of Service from F to E and reduces the average delay from 87.2 seconds to 74.6 seconds. These changes are illustrated in Appendix A, Exhibit 1
• Consider whether the two unsignalized intersections along US 78 should be signalized in light of the following:
o Proximity to the US 52 interchange ramps
o Proximity of NAD Road to the at-grade rail crossing
o Anticipated changes to the Old University Blvd. intersection due to the Lowcountry Rapid Transit project
• Conduct warrant analyses to assess if left turn phasing should be altered to reduce the incidence of left turn crashes.
• Accelerate the Foxbank Plantation connection to Cypress Gardens Road to provide east-to-north left turns the opportunity toturn at a signalized intersection with US 52 Other options mayinclude an origin-destination study to document the actual left turn demand or a median acceleration lane, although that may require the street opposite Foxbank Plantation Blvd. be restricted to rightin/right-out only.
• Conduct an origin-destination study to document the actual northbound left turn demand at US 52 and Reid Hill Road to verify if a left turn traffic signal phase might be warranted. An updated capacityanalysiswouldalsobenecessarytodeterminetheimpact ontrafficoperations andqueuing if a left turn signal phase were installed to accommodate the actual left turn demand.
140 Existing Conditions Report
4.2 Highway
As indicated above in the Highway section, there are several geometric deficiencies along US 52. The following are recommended as short-term improvements:
• Extend the median acceleration lane from Central Avenue to Northbound US 52 to satisfy SCDOTDesigncriteriaandtomitigatethenumberofcrashesoccurringhere. Thisisillustrated in Appendix A, Exhibit 3
• Extend the median acceleration lane from Old US 52 to Southbound US 52 to mitigate the number of crashes occurring here. The extension doesn’t quite meet SCDOT’s Design Criteria in order to end the taper prior to the at-grade rail crossing and median crossover immediately to the south. This extension is illustrated in Appendix A, Exhibit 4
• Extend the existing Storage and/or Taper length at the following 4 intersections as described in Table 2-34 above.
o Otranto Road eastbound left turn to northbound US 52
o Button Hall Avenue eastbound left turn to northbound US 52
o US 52 northbound left turn to Button Hall Avenue
o
o US 52 northbound left turn to N. Live Oak Drive
4.3 Freight
The following short-term improvements are recommended at the existing at-grade rail crossings.
• Gaillard Road (S-357)
o State Agency: Update current inventory form for accurate FRA reporting:
▪ Part III Box 2.D – W10-1 Advance Warning signs are posted;
▪ Part III Box 2.E – W10-5 Low Ground Clearance Signage is posted (crossing surface has low clearance scraping); and
▪ Part IV Box 5 – Crossing surface is “Rubber” (flangeway filler and asphalt).
o StateAgency: Removeandreplaceexistingcrossingpavementmarkings,stopbarsand striping at the crossing surface.
o State Agency: Cut back trees and vegetation in the southeast quadrant crossing sightline.
o Railroad: Remove excess ballast and geotextile at track north approach to the crossing surface.
• Oakley Road (S-50)
o State Agency: Update current inventory form for accurate FRA reporting:
▪ Part III Box 2.D – W10-1 Advance Warning signs are posted;
▪ Part III Box 2.E – W10-5 Low Ground Clearance Signage is posted (crossing surface has low clearance scraping); and
▪ Part IV Box 5 – Crossing surface is “Rubber” (flangeway filler and asphalt).
o StateAgency:Removeandreplaceexistingstopbarpavementmarkingsatthecrossing surface.
o State Agency: Cut back trees and vegetation in the east approach crossing sightlines.
• Cypress Gardens Road (S-9)
o State Agency: Update current inventory form for accurate FRA reporting:
▪ Part III Box 2.D – W10-1 Advance Warning signs are posted;
141 Existing Conditions Report
▪ Part III Box 2.E – W10-5 Low Ground Clearance Signage is posted (crossing surface has low clearance scraping); and
▪ Part IV Box 5 – Crossing surface is “Rubber” (flangeway filler and asphalt).
o State Agency: Repair south end of crossing surface with new rubber flangeway filler or full depth rubber panels to prevent further deterioration. Identify cause of deterioration & clean out drain outlets and ditches if required.
o State Agency: Perform low ground clearance review – if the Low Ground Clearance Signs are necessary; no photo evidence of low – clearance drags or steep grade breaks present.
o State Agency: Install railroad crossing pavement marking at east approach advance warning sign per MUTCD.
• Medway Road (S-667)
o State Agency: Install W10-3 Advance Warning signs and W10-5 Low Ground Clearance signs on US-52 approaches to the crossing at the railroad pavement markings.
o State Agency: Repair west approach pavement to the crossing surface, reinforce the southwest pavement transition with curbing or stone to prevent future deterioration.
• Montague Plantation Boulevard
o State Agency: Install W10-2 Advance Warning signs and W10-5 Low Ground Clearance signs on US-52 approaches to the crossing at the railroad pavement markings. Remove and relocate the east approach W10-1 advance warning sign to the railroad crossing pavement marking to meet MUTCD specifications.
o State Agency: Remove and replace existing railroad crossing pavement markings, stop bars, turn arrow markings and striping at the crossing.
o State Agency: Review current pre-emption and interconnection with adjacent intersection traffic signals. Current Inventory Report indicates no interconnectivity with US-52 intersection. This can work to alleviate traffic queueing over crossing surface.
• Stephanie Drive (S-400)
o State Agency: Install W10-2 Intersection Advance Warning signs and W10-5 Low Ground Clearance signs on US-52 approaches to the crossing at the railroad pavement markings.
o State Agency: Remove and replace existing railroad crossing pavement markings, stop bars, turn arrow markings and striping at the crossing.
• Hollywood Drive (S-281)
o State Agency: Install W10-2 Advance Warning signs and W10-5 Low Ground Clearance signs on US-52 approaches to the crossing at the railroad pavement markings. Remove and relocate the east approach W10-1 advance warning sign to the railroad crossing pavement marking to meet MUTCD specifications.
o StateAgency: Reviewexistingcrossingprofileandevaluateforremoval oflowground clearance issues due to severity of low clearance scraping seen in images from 2016 and new scraps forming. Currently steep pavement transitions are on either side of the crossing surface from last railroad crossing improvement project, this may be alleviated by extending the pavement transition towards the US-52 intersection.
• Liberty Hall Road (S-529)
o State Agency: Update current inventory form (after addressing advance warning signs along US-52) for accurate FRA safety reporting, numerous outdated fields:
• Part III Box 2.D – W10-1 Advance Warning signs are posted (W10-2 sign recommended);
142
Existing Conditions Report
• Part III Box 2.E – W10-5 Low Ground Clearance Signage is posted (crossing surface has low clearance scraping); and
▪ Part IV Box 5 – Crossing surface is “Rubber” (flangeway filler and asphalt).
o State Agency: Install W10-2 Advance Warning signs and W10-5 Low Ground Clearance signs on US-52 approaches to the crossing at the railroad pavement markings. Remove and relocate the east approach W10-1 advance warning sign to the railroad crossing pavement marking to meet MUTCD specifications.
o State Agency: Install missing railroad crossing pavement marking on Liberty Hall Road East Approach to comply with MUTCD.
• Red Bank Road (S-37)
o State Agency: Install additional Advance Warning signs in advance of the crossing on the northbound approaches for South Goose Creek Blvd and Red Bank Road. Relocate the advance warning sign on Redbank Road South approach further in advance at the railroad pavement markings.
o State Agency: Remove and replace existing railroad crossing pavement markings, stop bars, turn arrow markings and striping at the crossing. Install railroad crossing pavement marking in South Goose Creek Blvd turn lane in advance of the crossing.
• Goose Creek Road
o State Agency: Install advance railroad crossing pavement markings in each lane on east approach at advance warning sign. Cut back vegetation obstructing sign, consider resetting sign closer to edge of roadway.
o State Agency: Cut back trees and vegetation in the northeast and northwest quadrant crossing sightline.
o State Agency: Fill in erosion of north edge of east approach, secure guardrail foundations and armor slope to prevent future erosion.
o Railroad: Replace gate arm brackets on each gate mast.
• Button Hall Avenue (S-644)
o State Agency: Update current inventory form (after addressing advance warning signs along US-52) for accurate FRA safety reporting, numerous outdated fields:
▪ Part III Box 2.D – W10-1 Advance Warning signs are posted (W10-2 sign recommended);
▪ Part III Box 2.E – W10-5 Low Ground Clearance Signage is posted (crossing surface has low clearance scraping); and
▪ Part IV Box 5 – Crossing surface is “Rubber” (flangeway filler and asphalt).
o State Agency: Install W10-2 Advance Warning signs and W10-5 Low Ground Clearance signs on US-52 south to the crossing at the railroad pavement marking. Install W10-3 T-intersection advance warning sign on Water Tower Road.
o State Agency: Remove and replace existing railroad crossing pavement markings and stop bars at crossing surface.
o State Agency & Railroad: Review the existing active-warning signal system to verify if is interconnected to the adjacent intersection system
o State Agency: Review low ground clearance issues at the crossing, determine improvements required to alleviate these issues by extending the crossing pavement transitions to the intersection of US-52.
• US 52 (South of Old US 52)
o State Agency: Install additional railroad crossing pavement markings at northbound advance warning signs to meet MUTCD design standard.
Existing Conditions Report
143
4.4 Transit
The following are short term recommendations related to transit.
• Based on land use scenario planning results, identify transit-oriented development nodes for future transit stops.
• Review intersection signalization recommendations to coordinate with transit stop locations. Ensure that intersections are equipped with safe pedestrian crossing infrastructure, including crosswalks and pedestrian signals.
• Coordinate bicycle and pedestrian planning with transit stop locations.
• Determine level of transit services appropriate in the corridor to reflect varying levels of land use development.
144 Existing Conditions Report
5 Vision and Goals
A Vision for US 52
A vibrant mixed-use and multimodal corridor which meets residential, commerce and industry daily travel needs safely, and provides critical connectivity for all modes of travel between Goose Creek and Moncks Corner.
• Plan for regional connectivity within the area by supporting future High-Capacity Transit (HCT) network, including connection to the proposed Lowcountry Rapid Transit (LCRT) between North Charleston and Downtown Charleston currently under development.
• Promote a feasible pedestrian and bicycle friendly environment.
• Develop sustainable growth strategies to support quality of life for the region’s residents.
• Maintain rural nature of Old US 52 Corridor.
5.1 Goals and Objectives
Goals and objectives for the US 52 corridor are intended to be concise and focused on the specific needs of improving long term capacity and safety of the corridor, corridor preservation, as well as provide direction on the appropriate design and implementation of plan recommendations.
5.1.1 LAND USE DEVELOPMENT
Goal: To encourage a development pattern that meets both the needs of the area residents and complements stable development in Goose Creek and Moncks Corner and the rapidly urbanizing Berkeley County.
Objectives:
• Encourage planned residential densities along the corridor including future locations for transit supportive land use
• Minimize occurrences of conflicting land uses; provide adequate buffers to shield residences from incompatible uses.
• Provide a broader range of housing types and prices to meet area needs. Organize existing and new patterns of commercial, office and industrial uses along US 52 in nodes compatible with adjacent uses.
• Recommend local land use policies to implement to support access control along the US 52 Corridor in order to preserve the future vehicular capacity of US 52, while identifying tools to address parcel connectivity along the corridor.
145 Existing Conditions Report
5.1.2 ECONOMIC DEVELOPMENT
Goal: Continue to support economic development and employment growth within the corridor.
Objectives:
• Continue to provide suitable locations for new development and redevelopment for appropriate employment land uses with which to grow Goose Creek and Moncks Corner’s own employment and commercial base.
• Promote the use and construction of technology infrastructure to support economic development efforts.
• Continue to encourage diverse employment opportunities in the corridor, and thus reducing reliance on commuting to Charleston for employment opportunities.
5.1.3 COMMUNITY SERVICES AND FACILITIES
Goal: Improve community facilities and service to residents and business within the corridor
Objectives:
• Continue the strong partnership of the municipalities to the counties in current annexation practices to provide services to the rapidly urbanizing area.
• Maintain and encourage the use of public and quasi-public uses and open spaces and minimize impacts to these uses in the design of future transportation improvements.
5.1.4 ENVIRONMENT
Goal: Protect and enhance the corridors environment and quality, natural assets and physical conditions
Objectives:
• Minimize adverse impacts from transportation actions and from the use of transportation facilities and services in the corridor.
• Protect unique environmental resources, including prime farmlands, numerous wetlands and Goose Creek, which is on the South Carolina 2018 303d list of impaired waterbodies. Several privately-owned protected plantations in the vicinity of the Old US 52 intersection and are part of the Lord Berkeley Conservation Trust.
• Use transportation actions to enhance important environmental features.
• In planning for future transportation improvements in the corridor, consider appropriate methods associated with infrastructure hardening and resiliency from the potential effects of climate change particularly focused on stormwater management.
146 Existing Conditions Report
5.1.5 OVERALL MULTIMODAL TRANSPORTATION
Goal: Balance transportation needs for all users of the corridor.
Objectives:
• While corridor capacity and through travel will be important, US 52 serves as a local access community corridor serving the needs of all nearby residents and businesses. Overall planning for improvements must weigh the tradeoffs in design and function against the two different needs.
• Improve east-west connectivity in the Goose Creek area and look for opportunities to develop alternative parallel north-south connections.
5.1.6 HIGHWAY AND STREET NETWORK
Goal: Improve capacity, access, and especially safety for all users of US 52.
Objectives:
• The US 52 corridor has an unacceptable crash rate and improvement safety for all modes, first by improvements for functional design and second by regulatory controls, will be a priority in corridor design.
• Access management plays a vital role in safety and an access management plan will be developed and implemented on the corridor.
• Consider appropriate ITS improvements which support overall efficiency of movement in the corridor, but give priority to both transit and freight and goods movement within the corridor.
• Identify opportunities for inter-site connectivity of parcels along the corridor.
• Maintain capacity of US 52 as a hurricane evacuation route.
5.1.7 FREIGHT AND GOODS MOVEMENT
Goal: Provide Safe Goods Movement and Freight Operations in the Corridor.
Objectives:
• Improve freight transportation safety throughout the corridor through application of appropriate design standards supporting freight and goods movement.
• In concert with BCDCOG’s Regional Freight Mobility plan currently underway, consider key existing and future good movement patterns through the corridor supporting the interests of the regional as a whole, while accommodating goods movement needs and growth within and proximate to the corridor study area.
• Continue to support the needs of growing existing truck and rail freight reliant businesses in the corridor.
• Consider the long-term implications of neighborhood freight and delivery needs arising out of increased residential shipping from the global pandemic.
147
Conditions Report
Existing
5.1.8 PUBLIC TRANSIT SERVICES
Goal: Improve and expand the Public Transportation options in the corridor.
Objectives:
• Educate the public on the benefits of future transit improvements in preserving regional mobility along the US 52 Corridor.
• Upgrade and improvement bus stops and transit facilities along the corridor to meet current CARTA standards, including improving pedestrian and bicycle connections to existing transit stops and facilities.
• Promote use of the existing underutilized Park and Ride lots along the corridor as well as identifying future park and ride lots to support future Lowcountry Bus Rapid Transit Improvements.
5.1.9 ACTIVE TRANSPORTATION
Goal: Assess, establish, and implement a plan for bicycle and pedestrian access and facilities within the US 52 corridor.
Objectives:
• Ensure a continuous, interconnected system of bike and pedestrian facilities connecting residential and non-residential areas along the corridor.
• Safety is essential, and appropriate design and wayfinding standards should be set and consistently applied.
• Design streets, transit access points, and other public and private developments and facilities with a focus on safe network connections.
148 Existing Conditions Report
Appendix A
Short Term Traffic & Roadway Improvements
149 Existing Conditions Report
EXHIBIT 1


ADJUST PAVEMENT MARKINGS TO


ACCOMDATE A 3RD LEFT TURN LANE


ADD A 3RD NORTHBOUND
LEFT TURN LANE


PROHIBIT THE WESTBOUND LEFT TURN AND


TO A SECOND THROUGH LANE AND ADD CONVERT THE EXISTING LEFT TURN LANE
A WESTBOUND RIGHT TURN OVERLAP PHASE
CENTRAL AVE RED BANK RD TO M A T C H L I N E S E E E X H I B I T 2 1 EXISTING R/W EXISTING R/W EXISTINGR/W PROJECT ID 4020858 US 52 BERKELEY CHARLESTON, SOUTH CAROLINA 29418 SUITE 102 4969 CENTRE POINT DR 4 / 5 / 2 0 2 1 M p K J I : \ P r o j e c t s \ 4 0 2 0 8 5 8 \ 4 0 2 0 8 5 8 0 0 0 1 \ 9 0 C A D M o d e l s a n d S h e e t s \ 0 4 C T T r a n s p o r t a t i o n \ D G N \ 4 0 2 0 8 5 8 U S 5 2 E x h i b i t d g n 3 S.C. DIV. NO. FED. ROAD STATE COUNTY RTE. NO. SHEET NO. CORRIDOR STUDY US 52 0 100 scale feet 50 50 RECOMMENEDED ALTERNATIVE
O N L Y O N L Y O N L Y O N L Y O N L Y O N L Y N TOMONCKSCORNER
TONORTHCHARLESTON
TOALTUS17


CENTRAL AVE RED BANK RD TO M A T C H L I N E S E E E X H I B I T 1 2 EXISTING R/W EXISTING R/W PROJECT ID 4020858 US 52 BERKELEY CHARLESTON, SOUTH CAROLINA 29418 SUITE 102 4969 CENTRE POINT DR 4 / 5 / 2 0 2 1 M p K J I : \ P r o j e c t s \ 4 0 2 0 8 5 8 \ 4 0 2 0 8 5 8 0 0 0 1 \ 9 0 C A D M o d e l s a n d S h e e t s \ 0 4 C T T r a n s p o r t a t i o n \ D G N \ 4 0 2 0 8 5 8 U S 5 2 E x h i b i t d g n 3 S.C. DIV. NO. FED. ROAD STATE COUNTY RTE. NO. SHEET NO. CORRIDOR STUDY US 52 0 100 scale feet 50 50 RECOMMENEDED ALTERNATIVE EXHIBIT 2 N TOGOOSECREEK TOMONCKSCORNER T O U S 1 7 6 J R B L V D T O H E N R Y E B R OWN RIGHT TURN OVERLAP PHASE ADD A NORTHBOUND AND WESTBOUND


CENTRAL AVE RED BANK RD TO 4
EXISTING R/W PROJECT ID 4020858 US 52 BERKELEY CHARLESTON, SOUTH CAROLINA 29418 SUITE 102 4969 CENTRE POINT DR 4 / 5 / 2 0 2 1 M p K J I : \ P r o j e c t s \ 4 0 2 0 8 5 8 \ 4 0 2 0 8 5 8 0 0 0 1 \ 9 0 C A D M o d e l s a n d S h e e t s \ 0 4 C T T r a n s p o r t a t i o n \ D G N \ 4 0 2 0 8 5 8 U S 5 2 E x h i b i t d g n 3 S.C. DIV. NO. FED. ROAD STATE COUNTY RTE. NO. SHEET NO. CORRIDOR STUDY US 52 0 100 scale feet 50 50 RECOMMENEDED ALTERNATIVE EXHIBIT
M E R G E N END MEDIAN ACCELERATION LANE ACCELERATION LANE EXTEND MEDIAN TOMONCKSCORNER TOGOOSECREEK T O U S 1 7 6
EXISTING R/W
3


AND OLD US 52 US 52 AND 6 EXISTING R/W EXISTING R/W PROJECT ID 4020858 US 52 BERKELEY CHARLESTON, SOUTH CAROLINA 29418 SUITE 102 4969 CENTRE POINT DR 4 / 5 / 2 0 2 1 M p K J I : \ P r o j e c t s \ 4 0 2 0 8 5 8 \ 4 0 2 0 8 5 8 0 0 0 1 \ 9 0 C A D M o d e l s a n d S h e e t s \ 0 4 C T T r a n s p o r t a t i o n \ D G N \ 4 0 2 0 8 5 8 U S 5 2 E x h i b i t d g n 3 S.C. DIV. NO. FED. ROAD STATE COUNTY RTE. NO. SHEET NO. CORRIDOR STUDY US 52 0 100 scale feet 50 50 RECOMMENEDED ALTERNATIVE EXHIBIT 4 .37.5' ES PR M E R G E N TOMONCKSCORNER TOGOOSECREEK T O C Y P R U S G A R D E N S R D LANE FROM OLD US 52 EXTEND MEDIAN ACCELERATION END MEDIAN ACCELERATION LANE


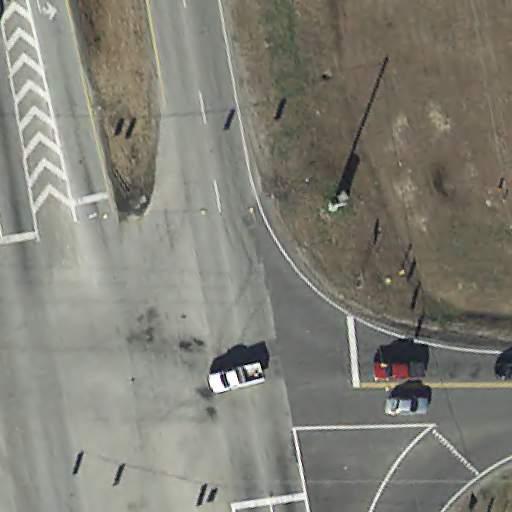


CYPRESS GARDENS RD US 52 AT M A T C H L I N E S E E S H E E T 6 7 EXISTI N G R / W EXISTI N G R / W EXISTI N G R / W EXISTI N G R / W EXISTINGR/W EXISTINGR/W EXISTINGR/W PROJECT ID 4020858 US 52 BERKELEY CHARLESTON, SOUTH CAROLINA 29418 SUITE 102 4969 CENTRE POINT DR 4 / 5 / 2 0 2 1 M p K J I : \ P r o j e c t s \ 4 0 2 0 8 5 8 \ 4 0 2 0 8 5 8 0 0 0 1 \ 9 0 C A D M o d e l s a n d S h e e t s \ 0 4 C T T r a n s p o r t a t i o n \ D G N \ 4 0 2 0 8 5 8 U S 5 2 E x h i b i t d g n 3 S.C. DIV. NO. FED. ROAD STATE COUNTY RTE. NO. SHEET NO. CORRIDOR STUDY US 52 0 100 scale feet 50 50 RECOMMENEDED ALTERNATIVE EXHIBIT
O N L Y O N L Y O N L Y N EB APPROACH TO US 52 CYPRESS GARDENS RD ADD TURN LANES ON EB APPROACH TO US 52 CYPRESS GARDENS RD ADD TURN LANES ON TO US 52 TO ALT US 17 T O MONC K S CORNER T O GOOS E CREEK
5
ADD TURN LANES TO ACCOMODATE
FUTURE DEVELOPMENT ON CYPRESS

GARDENS RD

EXHIBIT 6


BEGIN ROADWORK FOR ADDITION OF


TURN LANES AT CYPRESS GARDENS RD


AND US 52


CYPRESS GARDENS RD US 52 AT 8 M A T C H L I N E S E E E X H I B I T 5 EXISTINGR/W EXISTINGR/W PROJECT ID 4020858 US 52 BERKELEY CHARLESTON, SOUTH CAROLINA 29418 SUITE 102 4969 CENTRE POINT DR 4 / 5 / 2 0 2 1 M p K J I : \ P r o j e c t s \ 4 0 2 0 8 5 8 \ 4 0 2 0 8 5 8 0 0 0 1 \ 9 0 C A D M o d e l s a n d S h e e t s \ 0 4 C T T r a n s p o r t a t i o n \ D G N \ 4 0 2 0 8 5 8 U S 5 2 E x h i b i t d g n 3 S.C. DIV. NO. FED. ROAD STATE COUNTY RTE. NO. SHEET NO. CORRIDOR STUDY US 52 0 100 scale feet 50 50 RECOMMENEDED ALTERNATIVE
O N L Y O N L Y O N L Y N
TO OLD FORT RD TO US 52
Appendix B
157
Short Term At-Grade Rail Crossing Improvements
Gaillard Road (S-357), Moncks Corner, SC

Crossing Information
Current Inventory Report: 09/10/2018;
Grade Crossing Inventory Number: 631964U;
Gaillard Road at-grade crossing, located west of Old US 52 (Figure 1);
Operated by CSX Transportation – Single Track Crossing, No Quiet Zone designation;
Posted for Low Ground Clearance;
Roadway Posted Speed Limit is 45 mph;
Active School Bus Route (14 daily school buses reported); and
There have been no reported accidents since 1991.
DOT Crossi ng ID Crossing Location Train Count Conduct ed Day Trai ns 6am6pm Nigh t Trai ns 6pm6am Switchi ng Trains Max Timetab le Speed (MPH) Typical Speed Range over Crossi ng (MPH) 2013 AAD T Perce nt Truck s CSX Rail Infrastructure 631964 U Gaillard Road 2018 5 12 0 79 60 to 79 Roadway Network 1,17 5 6%
Figure 1 - Gaillard Road Highway-Rail Grade Crossing
Table 1 - U.S. DOT Crossing Inventory Form on Gaillard Road Crossing
Current Conditions Analysis
Crossing Signal Equipment: (Good Condition) Active warning system equipment was recently replaced (within last two years). Signal equipment consists of two signal masts with gates providing two quadrant protection.
Roadway Surface: (Fair Condition) Crossing surface consists of asphalt with rubber flangeway filler at crossing surface. There are several field-side pavement spalls at the edge of the rubber flangeway filler for both rails (Figure 2, Figure 3, and Figure 6). There are low clearance scraping and drag marks present over the crossing surface (Figure 6).
Railroad Crossing Signs: (Good Condition) Crossing is posted with W10-1 Advance Warning and W10-5 Low Ground Clearance signs for (Figure 8). Signs are recently installed, in good condition and clearly visible. I-13 Emergency Notification Signs are clearly visible on each signal mast.
Railroad Crossing Pavement Markings: (Fair Condition) Railroad crossing pavement markings and stop bars are present on both approaches. The markings, as well as line striping, are scaling with moderate deterioration. The markings are visible but are dirty and with the deterioration, night-time reflective deficiencies can occur (Figure 9 and Figure 10).
Drainage: (Fair Condition) Drainage ditches are present along both the tracks and Gaillard Road. Track in the north approach at the crossing surface has excess ballast and geotextile on top of ties and between the rails (Figure 11). This will collect sediment and prematurely wear the ties and rails at the crossing surface.
Track Approach Sightlines: (Fair Condition) This crossing is generally free of obstructions at the crossings. Trees and overgrowth outside the railroad right of way are obstructing the southeast quadrant sightline visibility of approaching trains (Figure 12).
Pedestrian Access and Curbing: (Not Applicable) There is no curbing or pedestrian access present at this crossing. Approaching roadways also do not have sidewalks.
Short Term Recommendations
State Agency: Update current inventory form for accurate FRA reporting:
Part III Box 2.D – W10-1 Advance Warning signs are posted;
Part III Box 2.E – W10-5 Low Ground Clearance Signage is posted (crossing surface has low clearance scraping); and
Part IV Box 5 – Crossing surface is “Rubber” (flangeway filler and asphalt).
State Agency: Remove and replace existing crossing pavement markings, stop bars and striping at the crossing surface.
State Agency: Cut back trees and vegetation in the south east quadrant crossing sightline.
Railroad: Remove excess ballast and geotextile at track north approach to the crossing surface.

 Figure 2 – Gaillard Road Crossing Looking North
Figure 3 – Gaillard Road Crossing Looking South
Figure 2 – Gaillard Road Crossing Looking North
Figure 3 – Gaillard Road Crossing Looking South

 Figure 4 - Gaillard Road Crossing Looking East
Figure 5 - Gaillard Road Crossing Looking West
Figure 4 - Gaillard Road Crossing Looking East
Figure 5 - Gaillard Road Crossing Looking West

 Figure 6 – Gaillard Road Rubber Crossing Surface (Low Clearance Scraps and Pavement Spalls)
Figure 7 – Gaillard Road East Approach Advance Warning Signs
Figure 6 – Gaillard Road Rubber Crossing Surface (Low Clearance Scraps and Pavement Spalls)
Figure 7 – Gaillard Road East Approach Advance Warning Signs

 Figure 8 - Gaillard Road Crossing Pavement Markings
Figure 9 – Gaillard Road East Approach Railroad Crossing Pavement Marking
Figure 8 - Gaillard Road Crossing Pavement Markings
Figure 9 – Gaillard Road East Approach Railroad Crossing Pavement Marking
 Figure 10 – Gaillard Road West Approach Stop Bar Pavement Marking
Figure 11 – Gaillard Road North Approach – Ballast Fouling Track Surface
Figure 10 – Gaillard Road West Approach Stop Bar Pavement Marking
Figure 11 – Gaillard Road North Approach – Ballast Fouling Track Surface
 Figure 12 – Gaillard Road Southeast Quadrant Sightline Obstructed
Oakley Road (S-50), Moncks Corner, SC
Crossing Information
Current Inventory Report: 09/10/2018;
Grade Crossing Inventory Number: 631965B;
Oakley Road Highway Rail Grade Crossing (Figure 1), is located west of the intersection of Oakley Road and Old US-52;

Operated by CSX Transportation – Single Track Crossing, No Quiet Zone designation;
Posted for Low Ground Clearance; and
No accidents reported since 2000.
DOT Crossing ID Crossing Location Train Count Conducted Day Trains 6am6pm Night Trains 6pm6am Switching Trains Max Timetable Speed (MPH) Typical Speed Range over Crossing (MPH) 2013 AADT Percent Trucks CSX Rail Infrastructure 631965B Oakley Road 2018 5 12 0 79 60 to 79 Roadway Network 692 5%
Figure 1 - Oakley Road Highway-Rail Grade Crossing
Table 1 - U.S. DOT Crossing Inventory Form on Oakley Road Crossing
Current Conditions Analysis
Crossing Signal Equipment: (Good Condition) Active warning is present and in good condition. Signal equipment consists of two signal masts with gates providing two quadrant protection.
Roadway Surface: (Good Condition) Crossing surface consists of asphalt with rubber flangeway filler at crossing surface. There are low clearance scraping and drag marks present over the crossing surface (Figure 2).The pavement comes to an immediate hump at the crossing surface (Figure 4 and Figure 5) creating low ground clearance at the crossing.
Railroad Crossing Signs: (Good Condition) Crossing is posted with W10-1 Advance Warning and W10-5 Low Ground Clearance signs (Figure 6). Signs are recently installed, in good condition and clearly visible. I-13 Emergency Notification Signs are clearly visible on each signal mast (Figure 2).
Railroad Crossing Pavement Markings: (Fair Condition) Railroad crossing pavement markings and stop bars are present on both approaches. The railroad crossing markings and striping is in good condition up to the crossing surface (Figure 7). The stop bars at the crossing are in fair condition, scaling with moderate deterioration. The markings are visible but are dirty and with the deterioration, night-time reflective deficiencies can occur (See Figure 8).
Drainage: (Good condition) Drainage ditches are present and clear along the east side of the crossing and tracks. Roadway and track approaches are clear of sand and sediment. (Figure 9).
Track Approach Sightlines: (Poor Condition): East approach sightlines are heavily obstructed by trees and vegetation growing outside the railroad right of way (Figure 10). West approach sightlines are clear of obstructions.
Pedestrian Access and Curbing: (Not Applicable) There is no curbing or pedestrian access present at this crossing. Approaching roadways also do not have sidewalks.
Short Term Recommendations
State Agency: Update current inventory form for accurate FRA reporting:
Part III Box 2.D – W10-1 Advance Warning signs are posted;
Part III Box 2.E – W10-5 Low Ground Clearance Signage is posted (crossing surface has low clearance scraping); and
Part IV Box 5 – Crossing surface is “Rubber” (flangeway filler and asphalt).
State Agency: Remove and replace existing stop bar pavement markings at the crossing surface. State Agency: Cut back trees and vegetation in the east approach crossing sightlines.

 Figure 2 – Oakley Road Crossing Looking North
Figure 3 – Oakley Road Crossing Looking South
Figure 2 – Oakley Road Crossing Looking North
Figure 3 – Oakley Road Crossing Looking South

 Figure 4 – Oakley Road Crossing Looking East
Figure 5 – Oakley Road Looking West
Figure 4 – Oakley Road Crossing Looking East
Figure 5 – Oakley Road Looking West

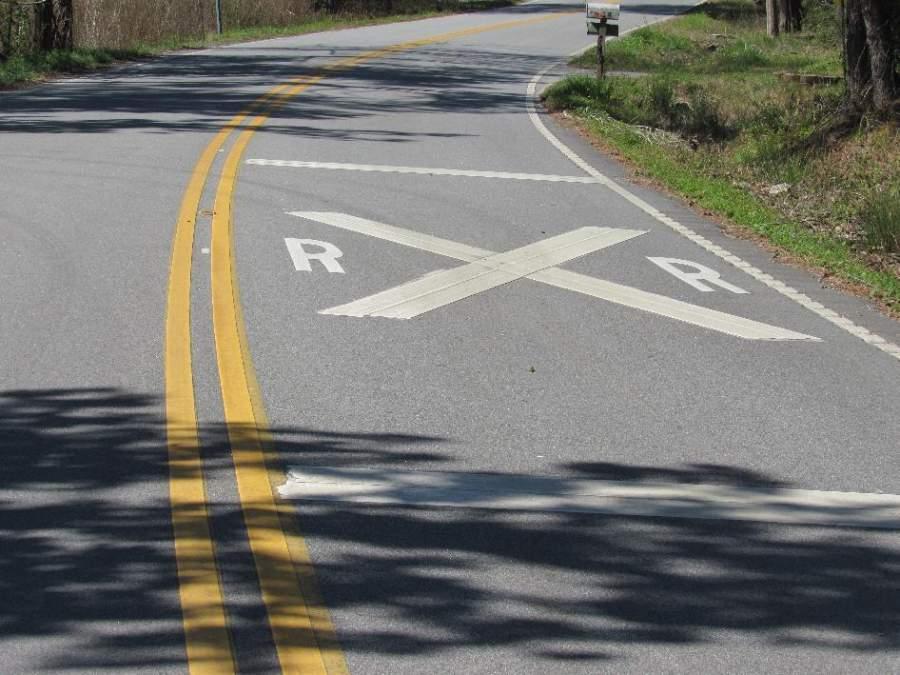 Figure 6 – Oakley Road West Approach Advance Warning Signs
Figure 7 – Oakley Road West Approach Railroad Crossing Pavement Marking
Figure 6 – Oakley Road West Approach Advance Warning Signs
Figure 7 – Oakley Road West Approach Railroad Crossing Pavement Marking

 Figure 8 – Oakley Road East Approach Stop Bar Pavement Marking
Figure 9 – Oakley Road North Track Approach and Pavement Transition Looking East
Figure 8 – Oakley Road East Approach Stop Bar Pavement Marking
Figure 9 – Oakley Road North Track Approach and Pavement Transition Looking East
 Figure 10 – Oakley Road East Approach Sightlines
Cypress Gardens Road (S-9), Mount Holly, SC
Crossing Information
Current Inventory Report: 09/10/2018;
Grade Crossing Inventory Number: 631966H;
Cypress Garden Road at-grade crossing (Figure 1), located east of the intersection of Cypress Garden Road and US-52;

Operated by CSX Transportation, Single Track Crossing with no Quiet Zone designation;
Posted for Low Ground Clearance; and
As of 2015, there has been one accident reported:
o 2019 – Train struck a vehicle that went around gates, vehicle driver injured.
DOT Crossing ID Crossing Location Train Count Conducted Day Trains 6am6pm Night Trains 6pm6am Switching Trains Max Timetable Speed (MPH) Typical Speed Range over Crossing (MPH) 2013 AADT Percent Trucks CSX Rail Infrastructure 631966H Cypress Garden Road 2018 5 12 0 79 60 to 79 Roadway Network 2,338 5%
Figure 1 - Cypress Gardens Road Highway-Rail Grade Crossing
Table 1 – U.S. DOT Crossing Inventory Form on Cypress Garden Road Crossing
Current Conditions Analysis
Crossing Signal Equipment: (Good Condition) Signal equipment consists of two signal masts with gates providing two quadrant protection. East approach gate is protected by guardrail (See Figure 2) and west approach gate is protected by rounded crash barrier (Figure 3).
Roadway Surface: (Poor Condition) Crossing surface consists of asphalt with rubber flangeway filler at crossing surface. The south end of the crossing surface is deteriorating with segment of flangeway filler missing (Figure 6). Spalls are forming across the south edge of the roadway with signs of undermining along the rails. Cracking and pavement slumping is apparent between the rails.
Railroad Crossing Signs: (Good Condition) Crossing is posted with W10-1 Advance Warning and W10-5 Low Ground Clearance signs for (Figure 7). Signs are recently installed, in good condition and clearly visible. Due to posted 55 mph speed limit and blind curve, the east approach advance warning sign is in significant advance of the crossing (Figure 8). I-13 Emergency Notification Signs are clearly visible on each signal mast. Advance Warning Signs are not aligned to railroad pavement markings or spaced per MUTCD criteria.
Railroad Crossing Pavement Markings: (Fair Condition) Railroad crossing pavement markings and stop bars are present on both approaches. The east approach advance warning (far in advance of the crossing) does not have a railroad crossing pavement marking (Figure 8). The railroad crossing pavement marking and stop bar pavement marking are beginning to deteriorate with cracks and light scaling (Figure 10 and Figure 11). Pavement markings are still clearly visible.
Drainage: (Poor Condition) Although drainage swales are present on the east side of the tracks, sediment is building up at the south edge of the crossing surface (Figure 6) with undermining extending further into the crossing surface. Drainage outlets on the east side of the tracks appear overgrown and may be obstructed (Figure 12).
Track Approach Sightlines: (Good Condition) All approach sightlines are clear of trees, vegetation or other obstructions. The east approach is wooded approaching the crossing, however the trees have been cut back to provide sightlines to the crossing surface.
Pedestrian Access and Curbing: (Not Applicable) There is no curbing or pedestrian access present at this crossing. Approaching roadways also do not have sidewalks.
Short Term Recommendations
State Agency: Update current inventory form for accurate FRA safety reporting, numerous outdated fields:
Part III Box 2.D – W10-1 Advance Warning signs are posted;
Part III Box 2.E – W10-5 Low Ground Clearance Signage is posted (crossing surface has low clearance scraping); and
Part IV Box 5 – Crossing surface is “Rubber” (flangeway filler and asphalt).
State Agency: Repair south end of crossing surface with new rubber flangeway filler or full depth rubber panels to prevent further deterioration. Identify cause of deterioration & clean out drain outlets and ditches if required.
State Agency: Perform low ground clearance review – if the Low Ground Clearance Signs are necessary; no photo evidence of low – clearance drags or steep grade breaks present.
State Agency: Install railroad crossing pavement marking at east approach advance warning sign per MUTCD.

 Figure 2 – Cypress Gardens Road North Track Approach
Figure 3 – Cypress Gardens Road South Track Approach
Figure 2 – Cypress Gardens Road North Track Approach
Figure 3 – Cypress Gardens Road South Track Approach

 Figure 4 – Cypress Gardens Road East Approach
Figure 5 – Cypress Gardens Road West Approach
Figure 4 – Cypress Gardens Road East Approach
Figure 5 – Cypress Gardens Road West Approach

 Figure 6 – Cypress Gardens Road South Track Approach Crossing Surface
Figure 7 – Cypress Gardens Road West Approach Advance Warning Sign
Figure 6 – Cypress Gardens Road South Track Approach Crossing Surface
Figure 7 – Cypress Gardens Road West Approach Advance Warning Sign

 Figure 8 – Cypress Gardens Road East Approach Advance Warning
Figure 9 – Cypress Gardens Road West Approach Low Ground Clearance Sign
Figure 8 – Cypress Gardens Road East Approach Advance Warning
Figure 9 – Cypress Gardens Road West Approach Low Ground Clearance Sign

 Figure 10 – Cypress Gardens West Approach Railroad Crossing Pavement Marking
 Figure 11 – Cypress Gardens West Approach Stop Bar Pavement Marking
Figure 12 – Cypress Gardens Southeast Quadrant Drainage Outlet Area
Figure 11 – Cypress Gardens West Approach Stop Bar Pavement Marking
Figure 12 – Cypress Gardens Southeast Quadrant Drainage Outlet Area
Medway Road (S-667), Mount Holly, SC
Crossing Information
Current Inventory Report: 09/10/2018;
Grade Crossing Inventory Number: 631968W;
Medway Road at-grade crossing, located east of the intersection of Medway Road and US-52 (Figure 1);
Operated by CSX Transportation – Two-Track Crossing with no Quiet Zone designation;

Posted for Low Ground Clearance, and
There have been no reported accidents since 1985.
DOT Crossing ID Crossing Location Train Count Conducted Day Train s 6am6pm Night Train s 6pm6am Switching Trains Max Timetable Speed (MPH) Typical Speed Range over Crossing (MPH) 2013 AAD T Percen t Trucks CSX Rail Infrastructure 631968W Medway Rd 2018 5 12 1 49 40 to 70 Roadway Network 1,023 5%
Figure 1 - Medway Road Rail Crossing
Table 1 - FRA Inventory Report on Medway Road Crossing
Current Conditions Analysis
Crossing Signal Equipment: (Good Condition) Signal equipment consists of two signal masts with gates providing two quadrant protection.
Roadway Surface: (Poor Condition) This crossing consists of two tracks, each track has a separate type of crossing surface with the east track as being timber and asphalt; the west track as being rubber and asphalt. Shallow pavement sawcuts were made between the tracks to prevent asphalt heaving, cracking, and to channel surface water off from between the tracks (Figure 4). The west approach pavement is deteriorating with deep spalls and standing water within the roadway at the southwest transition from US-52 (Figure 5). Crossing is posted for low ground clearance, however minimal evidence of low clearance drag marks and scraping.
Railroad Crossing Signs: (Poor Condition) West approach advance warning sign and low ground clearance sign are located immediately at the crossing surface – directly in front of the west approach signal mast, not effectively acting as advance warning to the crossing (Figure 5) W10-1 Advance Warning signs and W10-5 Low Ground Clearance signs are posted at this crossing. The East approach signs are in good condition and effectively located per MUTCD guidelines (Figure 6). The US-52 approaches to Medway Road are missing W10-3 intersection style advance warning signs at the railroad crossing pavement markings (Figure 7). I-13 Emergency Notification Signs are posted on each signal mast and clearly visible from the roadway approaches.
Railroad Crossing Pavement Markings: (Fair Condition) Railroad crossing pavement markings and stop bars are present on both approaches. The markings and stop bars, are scaling with light deterioration (Figure 6 and Figure 7).
Drainage: (Good Condition) No evidence of sediment or standing water within the crossing surface. Trackbed appears well graded for water to flow away from the track surface (Figure 4 and Figure 8).
Track Approach Sightlines: (Good Condition) No obstructions within any of the approach sightlines.
Pedestrian Access and Curbing: (Not Applicable) There is no curbing or pedestrian access present at this crossing. Approaching roadways also do not have sidewalks.
Short Term Recommendations
State Agency: Install W10-3 Advance Warning signs and W10-5 Low Ground Clearance signs on US-52 approaches to the crossing at the railroad pavement markings.
State Agency: Repair west approach pavement to the crossing surface, reinforce the southwest pavement transition with curbing or stone to prevent future deterioration.

 Figure 2 – Medway Road East Approach General View
Figure 3 – Medway Road West Approach General View
Figure 2 – Medway Road East Approach General View
Figure 3 – Medway Road West Approach General View

 Figure 4 - Medway Road North Track
Figure 5 – Medway Road West Approach Pavement Spalls and Advance Warning
Figure 4 - Medway Road North Track
Figure 5 – Medway Road West Approach Pavement Spalls and Advance Warning

 Figure 6 – Medway Road East Approach Advance Warning Signs Looking West
Figure 7 – US 52 North Approach Railroad Crossing Pavement Marking Looking South Approach
Figure 6 – Medway Road East Approach Advance Warning Signs Looking West
Figure 7 – US 52 North Approach Railroad Crossing Pavement Marking Looking South Approach
 Figure 8 – Medway Road South Track Approach
Montague Plantation Boulevard (BOULEVARD), Mount Holly, SC
Crossing Information
Current Inventory Report: 09/10/2018;
Grade Crossing Inventory Number: 631970X;
Montague Plantation Boulevard at-grade crossing, located east of the intersection of Montague Plantation Boulevard and US-52 (Figure 1);
Operated by CSX Transportation – Two-Track Crossing, No Quiet Zone;
Pre-emptive Signalization with adjacent US-52 Intersection;

Posted for Low Ground Clearance; and
As of 2015, there has been one accident reported:
o 2015 - Freight train hit a vehicle that stopped on crossing. No injuries reported.
DOT Crossing ID Crossing Location Train Count Conducted Day Trains 6am6pm Night Trains 6pm6am Switching Trains Max Timetable Speed (MPH) Typical Speed Range over Crossing (MPH) 2013 AADT Percent Trucks CSX Rail Infrastructure 631970X Montague Plantation Boulevard 2018 5 12 1 79 40 to 70 Roadway Network 2,807 5%
Figure 1 - Montague Plantation Boulevard Highway-Rail Grade Crossing
Table 1 –U.S. DOT Inventory Form on Montague Plantation Boulevard Crossing
Current Conditions Analysis
Crossing Signal Equipment: (Fair Condition) Crossing is signalized with cantilever signal masts, two quadrant gates and flashing lights facing all approaches. Active warning has pre-emption with adjacent US-52 intersection signals. While the West approach cantilever signal is partially obscured by the intersection signals, the east approach cantilever and other mast mounted signals are clearly visible from US-52 (Figure 6). East approach along Montague Plantation Boulevard backs up over crossing surface (Figure 13), no queue cutter signal present.
Roadway Surface: (Fair Condition) Crossing Surface consists of rubber flangeway filler and asphalt for both tracks. Shallow sawcut lines are present between the tracks and at the west edge of the crossing plateau to prevent pavement cracking and channel surface water runoff (Figure 7). These sawcut lines and the gaps between the flangeway filler and rails are filled with sand and sediment. Additionally the crossing surface has low ground clearance scraping and drag marks at the west transition from the crossing surface (Figure 7). The west approach is a steep grade to the US-52 Intersection and is posted for low ground clearance (See Figure 8).
Railroad Crossing Signs: (Poor Condition) W10-1 Advance Warning signs and W10-5 Low Ground Clearance signs are posted at this crossing. The east approach advance warning sign is placed far in advance of the railroad pavement marking (Figure 9). West approach advance warning sign and low ground clearance sign are located immediately at the crossing surface – directly in front of the west approach cantilever signal mast, not effectively acting as advance warning to the crossing (Figure 6). The US-52 approaches to Medway Road are missing W10-2 intersection style advance warning signs at the railroad crossing pavement markings (Figure 8). I-13 Emergency Notification Signs are posted on each signal mast and clearly visible from the roadway approaches.
Railroad Crossing Pavement Markings: (Poor Condition) Railroad crossing pavement markings and stop bars are present on each approach (Figure 10). Railroad crossing pavement markings as well as striping and stop bars at the crossing surface are cracked and scaling with moderate to heavy deterioration (Figure 11 and Figure 12). Pavement markings are still visible but reflectivity is significantly deteriorated.
Drainage: (Good Condition) Minor evidence of sediment within the gaps between the flangeway filler and rails; otherwise no other evidence of drainage issues or standing water within the crossing surface. Trackbed appears well graded for water to flow away from the track surface.
Track Approach Sightlines: (Good Condition) No obstructions within any of the approach sightlines.
Pedestrian Access and Curbing: (Not Applicable) There is no curbing or pedestrian access present at this crossing. Approaching roadways also do not have sidewalks.
Short Term Recommendations
State Agency: Install W10-2 Advance Warning signs and W10-5 Low Ground Clearance signs on US-52 approaches to the crossing at the railroad pavement markings. Remove and relocate the east approach W10-1 advance warning sign to the railroad crossing pavement marking to meet MUTCD specifications.
State Agency: Remove and replace existing railroad crossing pavement markings, stop bars, turn arrow markings and striping at the crossing.
State Agency: Review current pre-emption and interconnection with adjacent intersection traffic signals. Current Inventory Report indicates no interconnectivity with US-52 intersection. This can work to alleviate traffic queueing over crossing surface.

 Figure 2 – Montague Plantation Boulevard North Track Approach
Figure 3 - Montague Plantation Boulevard South Track Approach
Figure 2 – Montague Plantation Boulevard North Track Approach
Figure 3 - Montague Plantation Boulevard South Track Approach


6
Figure 4 - Eastbound Tracks on Montague Plantation Boulevard
Figure 5 - Westbound Tracks on Montague Plantation Boulevard
December 2018

 Figure 6 – Montague Plantation Boulevard West Approach Signals
Figure 7 – Montague Plantation Boulevard Crossing Surface Looking North
Figure 6 – Montague Plantation Boulevard West Approach Signals
Figure 7 – Montague Plantation Boulevard Crossing Surface Looking North
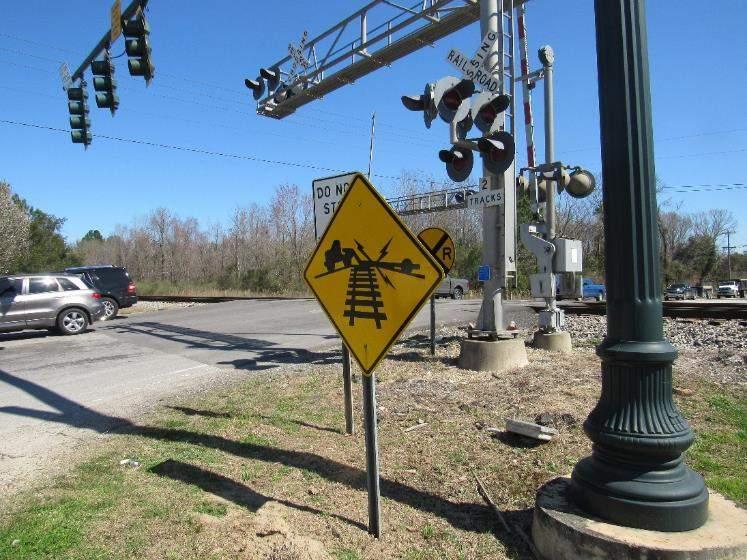
 Figure 8 – Montague Plantation Boulevard West Advance Signs and Approach Gradient
Figure 9 – Montague Plantation Boulevard East Approach Advance Warning Signage
Figure 8 – Montague Plantation Boulevard West Advance Signs and Approach Gradient
Figure 9 – Montague Plantation Boulevard East Approach Advance Warning Signage

 Figure 10 – Montague Plantation Boulevard Pavement Markings
Figure 11 – US-52 North Approach Railroad Crossing Pavement Marking Looking South
Figure 10 – Montague Plantation Boulevard Pavement Markings
Figure 11 – US-52 North Approach Railroad Crossing Pavement Marking Looking South

 Figure 12 – Montague Plantation Boulevard East Approach Railroad Crossing Pavement Marking Looking West
Figure 13 – Montague Plantation Boulevard East Approach Traffic Queueing Looking East
Figure 12 – Montague Plantation Boulevard East Approach Railroad Crossing Pavement Marking Looking West
Figure 13 – Montague Plantation Boulevard East Approach Traffic Queueing Looking East
Windsor Mill Road (S-400) / Stephanie Drive, Mount Holly, SC
Crossing Information
Current Inventory Report: 09/10/2018;
Grade Crossing Inventory Number: 631971E;
Windsor Mill Road/Stephanie Drive at-grade crossing, located east of the intersection of Windsor Mill Road/Stephanie Drive and N Good Creek Blvd (US-52) (Figure 1);

Operated by CSX Transportation – Single Track Crossing, No Quiet Zone designation; and
As of 2015, there have been no accidents reported.
DOT Crossing ID Crossing Location Train Count Conducted Day Trains 6am6pm Night Trains 6pm6am Switching Trains Max Timetable Speed (MPH) Typical Speed Range over Crossing (MPH) 2013 AADT Percent Trucks CSX Rail Infrastructure 631971E Stephanie Drive 2018 5 12 2 79 60 to 79 Roadway Network 5,827 5%
Figure 1 - Windsor Mill Road/Stephanie Drive Highway-Rail Grade Crossing
Figure 2 – U.S. DOT Crossing Inventory Form on Stephanie Drive Crossing
Current Conditions Analysis
Crossing Signal Equipment: (Good Condition) Crossing is signalized with cantilever signal mast with gate on east approach, signal mast with gate on west approach, two quadrant gates and flashing lights facing all approaches. Active warning has pre-emption with adjacent US-52 intersection signals. East approach along Stephanie Drive backs up over crossing surface (Figure 6); no queue cutter signal present.
Roadway Surface: (Good Condition) Crossing Surface consists of rubber flangeway filler and asphalt. The crossing surface has deep low ground clearance scraping and drag marks (Figure 7). The west approach is a steep grade to the US-52 Intersection and is posted for low ground clearance (Figure 8).
Railroad Crossing Signs: (Poor Condition) W10-1 Advance Warning signs and W10-5 Low Ground Clearance signs are posted at this crossing. West approach advance warning sign and low ground clearance sign are located immediately at the crossing surface – directly in front of the west approach cantilever signal mast, not effectively acting as advance warning to the crossing (Figure 8). The US-52 approaches to Stephanie Drive are missing W10-2 intersection style advance warning signs at the railroad crossing pavement markings (Figure 9). East Approach advance warning signs are correctly placed (See Figure 10). I-13 Emergency Notification Signs are posted on each signal mast and clearly visible from the roadway approaches.
Railroad Crossing Pavement Markings: (Poor Condition) Railroad crossing pavement markings and stop bars are present on each approach (Figure 10). Railroad crossing pavement markings as well as striping and stop bars at the crossing surface are cracked and scaling with moderate to heavy deterioration (Figure 9 and Figure 10). Pavement markings are still visible but reflectivity is significantly deteriorated.
Drainage: (Good Condition) No evidence of sediment or standing water within the crossing surface. Trackbed appears well graded for water to flow away from the track surface (Figure 2 and Figure 3).
Track Approach Sightlines: (Good Condition) No obstructions within any of the approach sightlines.
Pedestrian Access and Curbing: (Poor Condition) There is no curbing or pedestrian access present at this crossing. US-52 North Approach has “a crosswalk to nowhere” to provide pedestrian access to Stephanie Drive, however, no sidewalks are currently in place (Figure 11)
Short Term Recommendations
State Agency: Install W10-2 Intersection Advance Warning signs and W10-5 Low Ground Clearance signs on US-52 approaches to the crossing at the railroad pavement markings.
State Agency: Remove and replace existing railroad crossing pavement markings, stop bars, turn arrow markings and striping at the crossing.

 Figure 3 – Stephanie Drive North Track Approach
Figure 4 - Southbound Tracks on Stephanie Drive
Figure 3 – Stephanie Drive North Track Approach
Figure 4 - Southbound Tracks on Stephanie Drive

 Figure 5 –Stephanie Drive East Approach Looking East
Figure 6 -Stephanie Drive West Approach Looking West from East Approach
Figure 5 –Stephanie Drive East Approach Looking East
Figure 6 -Stephanie Drive West Approach Looking West from East Approach
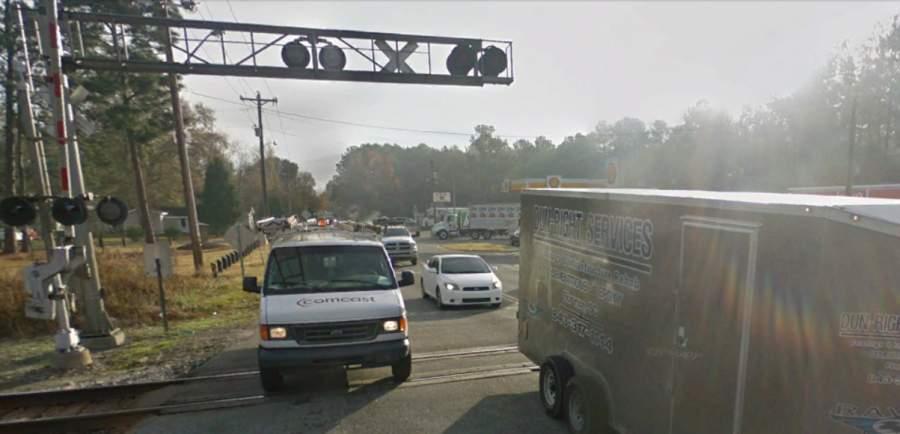
 Figure 7 – Stephanie Drive East Approach Traffic Queueing
Figure 8 – Stephanie Drive Crossing Surface Looking South
Figure 7 – Stephanie Drive East Approach Traffic Queueing
Figure 8 – Stephanie Drive Crossing Surface Looking South

 Figure 9 – Stephanie Drive East Approach Advance Warning Signs
Figure 10 – US-52 North Approach to Stephanie Drive Looking South
Figure 9 – Stephanie Drive East Approach Advance Warning Signs
Figure 10 – US-52 North Approach to Stephanie Drive Looking South

 Figure 11 – Stephanie Drive East Approach Looking West
Figure 12 – US-52 North Approach Crosswalk to Stephanie Drive Looking South
Figure 11 – Stephanie Drive East Approach Looking West
Figure 12 – US-52 North Approach Crosswalk to Stephanie Drive Looking South
Hollywood Drive (S-281), Mount Holly, SC

Crossing Information
Current Inventory Report: 09/10/2018;
Grade Crossing Inventory Number: 631972L;
Hollywood Drive at-grade crossing, located east of the intersection of Medway Road and US-52 (Figure 1);
Operated by CSX Transportation – Single Track Crossing, No Quiet Zone designation;
Posted for low ground clearance; and
No reported accidents reported since 2014 – trespasser struck by train
DOT Crossing ID Crossing Location Train Count Conducted Day Trains 6am6pm Night Trains 6pm6am Switching Trains Max Timetable Speed (MPH) Typical Speed Range over Crossing (MPH) 2013 AADT Percent Trucks CSX Rail Infrastructure 631972L Hollywood Drive 2018 5 12 2 79 60 to 79 Roadway Network 3,371 5%
Figure 1 - Hollywood Drive Rail Crossing
Table 1 - FRA Inventory Report on Hollywood Drive Crossing
Current Conditions Analysis
Crossing Signal Equipment: (Fair Condition) Crossing is signalized with cantilever signal mast on east approach with gate and with signal mast with gate on west approach. Active warning provides two quadrant protection and has pre-emption with adjacent US-52 intersection signals. Westbound traffic along Hollywood Drive backs over the crossing surface with capacity for only one car/small truck clear of the crossing before the intersection signal stop bar (Figure 6 and Figure 7), no queue cutter signal present.
Roadway Surface: (Poor Condition) Crossing Surface consists of rubber flangeway filler and asphalt. The crossing surface has low ground clearance scraping and drag marks due to the steep pavement transition at the crossing (Figure 8). Google earth street view images from 2016 show significant low clearance scraping (Figure 3).
Railroad Crossing Signs: (Poor Condition) W10-1 Advance Warning signs and W10-5 Low Ground Clearance signs are posted at this crossing. The east approach advance warning signs are placed per MUTCD Standard (Figure 9). West approach advance warning sign and low ground clearance sign are located immediately at the crossing surface – directly in front of the west approach signal mast; not effectively acting as advance warning to the crossing (Figure 6 and Figure 10). The US-52 approaches to Hollywood Drive are missing W10-2 intersection style advance warning signs at the railroad crossing pavement markings (Figure 11). I-13 Emergency Notification Signs are posted on each signal mast and clearly visible from the roadway approaches.
Railroad Crossing Pavement Markings: (Fair Condition) Railroad crossing pavement markings and stop bars are present on each approach (Figure 10). Railroad crossing pavement markings as well as striping and stop bars at the crossing surface are cracked and beginning to deteriorate (Figure 7).
Drainage: (Good Condition) No apparent evidence of drainage issues at the crossing. Track surface and trackbed are clear of sediment or standing water. Drainage Ditch on east side of tracks is well graded and clear of debris.
Track Approach Sightlines: (Good Condition) No obstructions within any of the approach sightlines.
Pedestrian Access and Curbing: (Not Applicable) There is no curbing or pedestrian access present at this crossing. Approaching roadways also do not have sidewalks.
Short Term Recommendations
State Agency: Install W10-2 Advance Warning signs and W10-5 Low Ground Clearance signs on US-52 approaches to the crossing at the railroad pavement markings. Remove and relocate the east approach W10-1 advance warning sign to the railroad crossing pavement marking to meet MUTCD specifications.
State Agency: Review existing crossing profile and evaluate for removal of low ground clearance issues due to severity of low clearance scraping seen in images from 2016 and new scraps forming. Currently steep pavement transitions are on either side of the crossing surface from last railroad crossing improvement project, this may be alleviated by extending the pavement transition towards the US-52 intersection.
State Agency: Review US-52 / Hollywood Drive intersection safety concerns – Recent memorial is posted in the US-52 north approach median near the intersection signals (see Figure 11).

 Figure 2 – Hollywood Drive North Track Approach
Figure 3 – Hollywood Drive South Track Approach
Figure 2 – Hollywood Drive North Track Approach
Figure 3 – Hollywood Drive South Track Approach

 Figure 4 – Hollywood Drive East Approach
Figure 5 – Hollywood Drive West Approach
Figure 4 – Hollywood Drive East Approach
Figure 5 – Hollywood Drive West Approach

 Figure 6 – Hollywood Drive Crossing Looking East from US-52
Figure 7 – Hollywood Drive East Approach Looking South
Figure 6 – Hollywood Drive Crossing Looking East from US-52
Figure 7 – Hollywood Drive East Approach Looking South

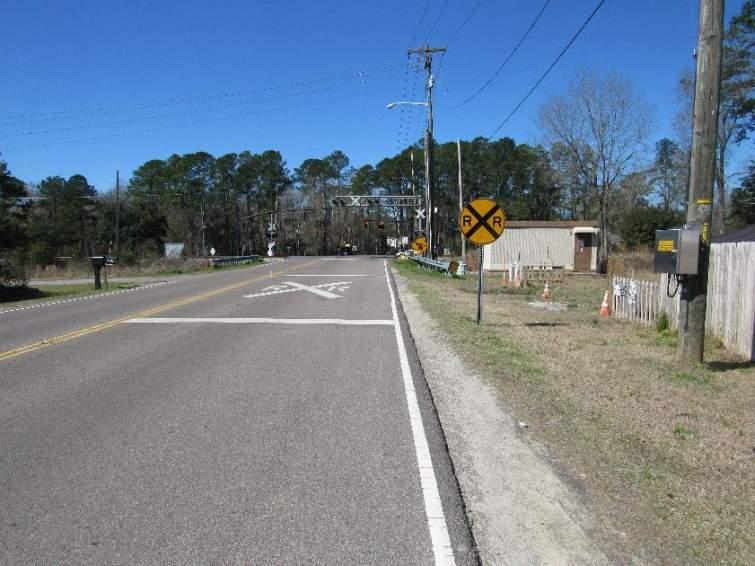 Figure 8 – Hollywood Drive Crossing Surface Looking North
Figure 9 – Hollywood Drive East Approach Looking West
Figure 8 – Hollywood Drive Crossing Surface Looking North
Figure 9 – Hollywood Drive East Approach Looking West
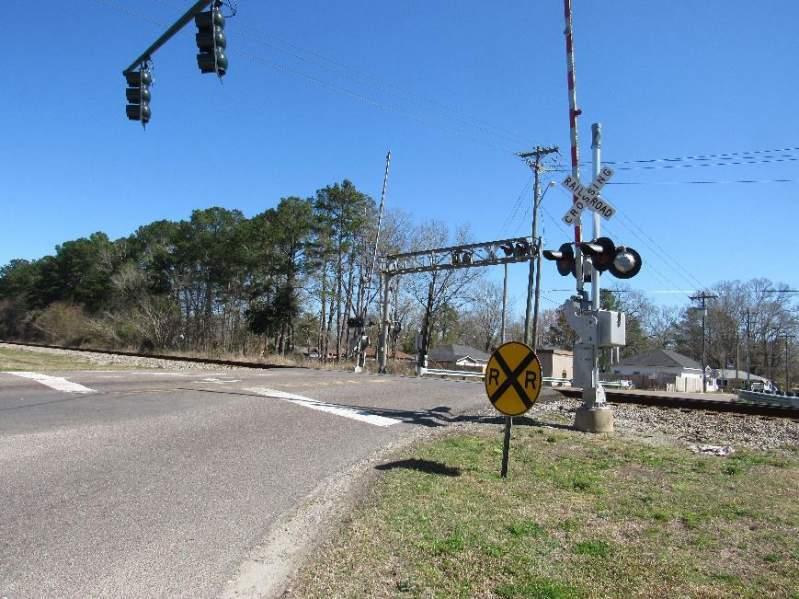
 Figure 10 – Hollywood Drive West Approach Looking East
Figure 11 – US-52 North Approach to Hollywood Drive Looking South
Figure 10 – Hollywood Drive West Approach Looking East
Figure 11 – US-52 North Approach to Hollywood Drive Looking South
Liberty Hall Road (S-529), Goose Creek, SC
Crossing Information
Current Inventory Report: 03/28/2019;
Grade Crossing Inventory Number: 631973T;
Liberty Hall Road at-grade crossing, located east of the intersection of Liberty Hall Road and N Goose Creek Blvd/US-52 (Figure 1);

Operated by CSX Transportation – Single Track Crossing, No Quiet Zone;
Pre-emptive active warning with US-52 intersection;
Posted for Low ground clearance; and
No accidents reported since 2006.
DOT Crossing ID Crossing Location Train Count Conducted Day Trains 6am6pm Night Trains 6pm6am Switching Trains Max Timetable Speed (MPH) Typical Speed Range over Crossing (MPH) 2013 AADT Percent Trucks CSX Rail Infrastructure 631973T Liberty Hall Road 2019 5 12 2 79 60 to 79 Roadway Network 11,548 6%
Figure 1 - Liberty Hall Road Highway-Rail Grade Crossing
Table 1 - FRA Inventory Report on Liberty Hall Road Crossing
Current Conditions Analysis
Crossing Signal Equipment: (Good Condition) Crossing is signalized with cantilever signal masts, two quadrant gates and flashing lights facing all approaches. Active warning has pre-emption with adjacent US-52 intersection signals. While the west approach cantilever signal is partially obscured by the intersection signals, the east approach cantilever and other mast mounted signals are clearly visible from US-52 (Figure 6). Westbound traffic along Liberty Hall Drive potentially backs up over crossing surface, no queue cutter signal present.
Roadway Surface: (Fair Condition) Crossing Surface consists of rubber flangeway filler and asphalt. The crossing surface has low ground clearance scraping and drag marks due to the steep pavement transition at the crossing (Figure 7). The US-52 intersection pavement transitions are deteriorating with standing water, west approach pavement edges are beginning to deteriorate (Figure 8).
Railroad Crossing Signs: (Fair Condition) W10-1 Advance Warning signs and W10-5 Low Ground Clearance signs are posted at this crossing. The east approach advance warning signs are placed far in advance of the crossing with no railroad crossing pavement marking present (Figure 9). West approach advance warning sign and low ground clearance sign are located immediately at the crossing surface –directly in front of the west approach signal mast; not effectively acting as advance warning to the crossing (Figure 6). The US-52 approaches to Liberty Hall Road are missing W10-2 intersection style advance warning signs at the railroad crossing pavement markings; South approach has room for sign t be posted (Figure 10), North Approach median is too restricted for an effective advance warning sign to be placed (Figure 11). I-13 Emergency Notification Signs are posted on each signal mast and clearly visible from the roadway approaches.
Railroad Crossing Pavement Markings: (Poor Condition) Railroad crossing pavement markings and stop bars are present on each approach (Figure 12). East Approach Railroad Crossing Pavement Markings are immediately at the crossing surface instead of placed with the advance warning Sign See Figure 9 and Figure 12). Railroad crossing pavement markings at the crossing are in good condition with little deterioration (Figure 13).
Drainage: (Good Condition) No apparent evidence of drainage issues at the crossing. Track surface and trackbed are clear of sediment or standing water.
Track Approach Sightlines: (Good Condition) No obstructions within any of the approach sightlines.
Pedestrian Access and Curbing: (Poor Condition) No sidewalks or curbing present at the Crossing. Sidewalk is present on the South side of Liberty Hall Road ending at Lumber Lane before the crossing. Pedestrian traffic is present at this crossing, however no protected route across US-52 (Figure 14).
Short Term Recommendations
State Agency: Install W10-2 Advance Warning signs and W10-5 Low Ground Clearance signs on US-52 approaches to the crossing at the railroad pavement markings. Remove and relocate the east approach W10-1 advance warning sign to the railroad crossing pavement marking to meet MUTCD specifications.
State Agency: Install missing railroad crossing pavement marking on Liberty Hall Road East Approach to comply with MUTCD.
State Agency: Update current inventory form (after addressing advance warning signs along US-52) for accurate FRA safety reporting, numerous outdated fields:
Part III Box 2.D – W10-1 Advance Warning signs are posted (W10-2 sign recommended);
Part III Box 2.E – W10-5 Low Ground Clearance Signage is posted (crossing surface has low clearance scraping); and
Part IV Box 5 – Crossing surface is “Rubber” (flangeway filler and asphalt).

 Figure 2 - Northbound Tracks on Liberty Hall Road
Figure 3 - Southbound Tracks on Liberty Hall Road
Figure 2 - Northbound Tracks on Liberty Hall Road
Figure 3 - Southbound Tracks on Liberty Hall Road

 Figure 4 – Liberty Hall East Approach Looking East
Figure 5 – Liberty Hall West Approach Looking West
Figure 4 – Liberty Hall East Approach Looking East
Figure 5 – Liberty Hall West Approach Looking West

 Figure 6 – Liberty Hall Road West Approach Looking East
Figure 7 – Liberty Hall Road Crossing Surface Looking North
Figure 6 – Liberty Hall Road West Approach Looking East
Figure 7 – Liberty Hall Road Crossing Surface Looking North

 Figure 8 – US-52 Intersection Pavement Transitions to Liberty Hall Road Looking South
Figure 9 – Liberty Hall Road East Approach Advance Warning Signs Looking West
Figure 8 – US-52 Intersection Pavement Transitions to Liberty Hall Road Looking South
Figure 9 – Liberty Hall Road East Approach Advance Warning Signs Looking West

 Figure 10 – US-52 South Approach to Liberty Hall Road Crossing Looking North
Figure 11 – US-52 North Approach to Liberty Hall Road Crossing Looking South
Figure 10 – US-52 South Approach to Liberty Hall Road Crossing Looking North
Figure 11 – US-52 North Approach to Liberty Hall Road Crossing Looking South

 Figure 12 – Liberty Hall Road Pavement Markings At Crossing
Figure 13 – Liberty Hall Road East Approach Crossing Pavement Markings
Figure 12 – Liberty Hall Road Pavement Markings At Crossing
Figure 13 – Liberty Hall Road East Approach Crossing Pavement Markings
 Figure 14 – Liberty Hall Road East Approach Looking West
Red Bank Road (S-37), Goose Creek SC
Crossing Information
Current Inventory Report 01/20/20;
Grade Crossing Inventory Number 631974A;
Red Bank Road at-grade crossing, located at the intersection of US 52, just south of Goose Creek Boulevard;
Operated by CSX Transportation – Single Track Crossing, no quiet zone designation; and
As of 2015, there have been four reported accidents (10 reported since 2000):
o 2020 – Train struck vehicle that went around gates, vehicle driver injured;
o 2019 – Train struck and killed pedestrian (deemed suicide);

o 2016 – Train struck vehicle that went around gates, vehicle driver killed;
o 2015 – Train struck vehicle stopped on crossing, no injuries.
DOT Crossing ID Crossing Location Train Count Conducted Day Trains 6am-6pm Night Trains 6pm6am Switching Trains Max Timetable Speed (MPH) Typical Speed Range over Crossing (MPH) 2013 AADT Percent Trucks CSX Rail Infrastructure 631974A Red Bank Road 2020 6 11 2 79 60 to 79 Roadway Network 22,367 12%
Figure 1 - Red Bank Road Rail Crossing
Table 1 - FRA Inventory Report on Red Bank Road Crossing
Current Condition Analysis
Crossing Signal Equipment: (Good Condition) Two quadrant protection and cantilever signal masts for Red Bank Road; gate protection for on-coming traffic protection for the South Goose Creek northbound turn lane. Gates are noticeably long and only located at the edge of roadway. Sidewalks are not protected in remaining quadrants. Grade crossing active warning system is interconnected to the intersection signals with train pre-emption to clear crossing surface and prohibit on-coming traffic in the presence of a train.
Roadway Surface: (Good Condition) Crossing surface consists of concrete gauge panels with flangeway filler outside the rails, notably repaved recently as part of a railroad improvement project for this crossing. Approach pavement appears to be in good condition. Red Bank Rd has narrow medians on each crossing approach that appear to be mountable. Minor pavement spalls present in south side of crossing surface (Figure 7).
Railroad Crossing Signs: (Fair Condition) The Red Bank Road northbound approach (Figure 8) and S Goose Creek Blvd northbound turn lane (Figure 9) both have clear advance warning signs posted immediately at the crossing – not serving as advance warning; there are no advance warning signs present on these approaches or for the Red Bank Road Southbound approach.
Railroad Crossing Pavement Markings: (Poor Condition) Pavement markings are present for all crossing approaches but are cracking and scaling off (Figure 10). Nighttime visibility may be impacted from the deteriorated condition. South Goose Creek Blvd does not have railroad pavement markings in advance of the crossing.
Drainage: (Good Condition) No apparent drainage issues, crossing surface and ballast approaches appear clear from sand or debris. No apparent erosion or undermining in trackbed or edge of pavement. The Red Bank Road South Approach immediately at the crossing
Track Approach Sightlines: (Good Condition) All track sightlines clear of large trees or other obstructions.
Pedestrian Access and Curbing: (Fair Condition) Sidewalk is present on each side of both approaches to the crossing surface. No detectable warning pads are present at any of the sidewalk approaches to the crossing surface. The southeast sidewalk approach appears to be deteriorating and not meeting ADA standards as it appears relatively thin and to have been temporarily paved (Figure 6 and Figure 8). Mountable curbing is present for all approaches; the southeast approach curbing appears to be deteriorating at the crossing surface.
Short Term Recommendations
State Agency: Install additional Advance Warning signs in advance of the crossing on the northbound approaches for South Goose Creek Blvd and Red Bank Road. Relocate the advance warning sign on Redbank Road South approach further in advance at the railroad pavement markings.
State Agency: Remove and replace existing railroad crossing pavement markings, stop bars, turn arrow markings and striping at the crossing. Install railroad crossing pavement marking in South Goose Creek Blvd turn lane in advance of the crossing.

 Figure 2 – Red Bank Road - Looking Northwest
Figure 3 – Red Bank Road Looking Southeast
Figure 2 – Red Bank Road - Looking Northwest
Figure 3 – Red Bank Road Looking Southeast

 Figure 4 – Red Bank Road - Looking North
Figure 5 – Red Bank Road - Looking South
Figure 4 – Red Bank Road - Looking North
Figure 5 – Red Bank Road - Looking South

 Figure 6 – Red Bank Road Crossing Pavement Markings
Figure 7 – Red Bank Road Crossing Surface Looking South
Figure 6 – Red Bank Road Crossing Pavement Markings
Figure 7 – Red Bank Road Crossing Surface Looking South

 Figure 8 – Red Bank Road – South Approach Looking North
Figure 9 – South Goose Creek Blvd Left Turn Over Crossing Looking North
Figure 8 – Red Bank Road – South Approach Looking North
Figure 9 – South Goose Creek Blvd Left Turn Over Crossing Looking North
 Figure 10 – Red Bank Road North Approach Pavement Markings Looking South
Goose Creek Road, Goose Creek, SC
Crossing Information
Current Inventory Report: 03/28/2019;
Grade Crossing Inventory Number: 631975G;
Goose Creek Road at-grade crossing, located east of US52 (Figure 1);

Operated by CSX Transportation – Single Track Crossing, No Quiet Zone; and
No reported accidents since 2002.
DOT Crossing ID Crossing Location Train Count Conducted Day Trains 6am6pm Night Trains 6pm6am Switching Trains Max Timetable Speed (MPH) Typical Speed Range over Crossing (MPH) 2013 AADT Percent Trucks CSX Rail Infrastructure 631975G Goose Greek Road 2019 5 12 2 79 60 to 79 Roadway Network 24,524 10%
Figure 1 - Goose Creek Road Rail Crossing
Table 1 - FRA Inventory Report on Goose Creek Road Crossing
Current Conditions Analysis
Crossing Signal Equipment: (Good Condition) Crossing active warning consists of two quadrant protection and cantilever signal masts for Goose Creek. Gates are noticeably long and only located at the edge of roadway (Figure 5). Both gate arm brackets (holsters) are broken (Figure 6), most likely due from wind forcing on the long gates, and are no longer securing the gate in the upright position (Figure 6).
Roadway Surface: (Good Condition) Crossing surface consists of rubber flangeway filler and asphalt, noticeably repaved recently as part of a railroad improvement project for this crossing. Approach pavement appears to be in good condition. Goose Road has mountable medians in center of roadway on both approaches to the crossing (Figure 5). Yellow paint on medians is faded and peeling.
Railroad Crossing Signs: (Fair Condition) Both approaches to the Goose Creek Road Crossing have advance grade crossing warning signs. The north approach sign is placed within the limits of the railroad crossing pavement marking per MUTCD; the south approach advance warning sign is placed far in advance of the crossing to account for a blind curve towards the crossing (Figure 7). From google earth images last taken in July 2019, this sign appears subject to overgrowth and is obscured (See Figure 8). I13 Emergency Notifications signs are posted on cantilever signal masts and are clearly visible.
Railroad Crossing Pavement Markings: (Fair Condition) Pavement markings are present for both crossing approaches near the crossing surface but are cracking and beginning to scale off with fair to moderate deterioration (Figure 9). No railroad crossing pavement marking present for east approach advance warning sign.
Drainage: (Poor Condition) Crossing surface and track approaches are clear of debris and sediment. Moderate sand build-up and small rock debris present at end of approach medians near crossing surface. The north edge of the east approach at the crossing surface has significant erosion that is now undermining the guard rail at the crossing surface (Figure 10). As of March 2021 this erosion is not yet at the edge of the roadway pavement (edge of shoulder) and has not yet impacted the roadway, however has moved approximately 12” closer that the Google Imaging from July 2019.
Track Approach Sightlines: (Poor Condition) Sightlines along the north edge of roadway are obstructed by trees and dense vegetation. From Google Imaging in July 2019, trees with leaves nearly fully obstruct signal house (Figure 11). The east roadway approach has a blind turn towards the crossing with dense trees and vegetation. South sightlines are clear.
Pedestrian Access and Curbing: (Not Applicable) Except for the medians discussed in the Roadway Surface section above, there is no curbing or pedestrian access present at this crossing. Approaching roadways also do not have sidewalks.
Short Term Recommendations
State Agency: Install advance railroad crossing pavement markings in each lane on east approach at advance warning sign. Cut back vegetation obstructing sign, consider resetting sign closer to edge of roadway.
State Agency: Cut back trees and vegetation in the northeast and northwest quadrant crossing sightline.
State Agency: Fill in erosion of north edge of east approach, secure guardrail foundations and armor slope to prevent future erosion.
Railroad: Replace gate arm brackets on each gate mast.

 Figure 2 –Goose Creek Road Crossing Surface and North Track Approach
Figure 3 - Goose Creek Road Crossing Surface and South Track Approach
Figure 2 –Goose Creek Road Crossing Surface and North Track Approach
Figure 3 - Goose Creek Road Crossing Surface and South Track Approach

 Figure 4 – Goose Creek Road East Approach Looking West
Figure 5 – Goose Creek Road West Approach Looking East
Figure 4 – Goose Creek Road East Approach Looking West
Figure 5 – Goose Creek Road West Approach Looking East

 Figure 6 – Good Creek Road West Approach Gate Arm Looking East (Broken Bracket)
Figure 7 – Goose Creek Road South Approach Advance Warning Sign (March 2021)
Figure 6 – Good Creek Road West Approach Gate Arm Looking East (Broken Bracket)
Figure 7 – Goose Creek Road South Approach Advance Warning Sign (March 2021)

 Figure 8 – Goose Creek Road South Approach Advance Warning Sign (July 2019)
Figure 9 – Goose Creek Road East Approach Looking West
Figure 8 – Goose Creek Road South Approach Advance Warning Sign (July 2019)
Figure 9 – Goose Creek Road East Approach Looking West

 Figure 10 – Goose Creek Road East Approach – North Edge of Pavement Looking West
Figure 11 – Goose Creek Road West Approach Looking North
Figure 10 – Goose Creek Road East Approach – North Edge of Pavement Looking West
Figure 11 – Goose Creek Road West Approach Looking North
Button Hall Avenue, Goose Creek, SC
Crossing Information
Current Inventory Report: 09/10/2018;
Grade Crossing Inventory Number: 640453H;
Button Hall Avenue at-grade crossing, located east of North Goose Creek Boulevard/US 52 (Figure 1);

Posted for low ground clearance; and
No accidents have been reported at this crossing.
DOT Crossing ID Crossing Location Train Count Conducted Day Trains 6am6pm Night Trains 6pm6am Switching Trains Max Timetable Speed (MPH) Typical Speed Range over Crossing (MPH) 2013 AADT Percent Trucks CSX Rail Infrastructure 640453H Button Hall Avenue 2018 5 12 2 79 60 to 79 Roadway Network 671 3%
Figure 1 - Button Hall Avenue Highway-Rail Grade Crossing
Table 1 – U.S. DOT Inventory Form on Button Hall Avanue Crossing
Current Conditions Analysis
Crossing Signal Equipment: (Fair Condition) Crossing is signalized with cantilever signal mast with gate on east approach and signal mast with gate on west approach. Grade Crossing active warning system does not have pre-emption with adjacent US-52 intersection signals.
Roadway Surface: (Poor Condition) From the last inventory report update in 2018, the existing timber and asphalt crossing surface has been revised to rubber flangeway filler and asphalt. This change further raised the crossing surface; with pavement transitions only within the railroad right of way creating steep grade breaks and low clearance issues (Figure 6). Previous imaging from 2012 does not show drag marks or low clearance scraping and crossing had not been previously posted for low clearance. This is a more severe issue than other crossings due to the primary users of this crossing being the Goose Creek City Fire Department Headquarters and the Goose Creek Public Works Department – frequently using longer vehicles with lower clearances. West approach to the crossing surface has a mountable median to the crossing surface (Figure 7).
Railroad Crossing Signs: (Poor Condition) W10-1 Advance warning signs and W10-5 Low Ground Clearance signs are posted immediately at the crossing on the east approach (Figure 7); west approach is missing low ground clearance sign, however has an additional regulatory sign to not stop on crossing surface. The US-52 approaches to Button Hall Avenue are missing W10-2 intersection style advance warning signs at the railroad crossing pavement markings; South approach has room for sign to be posted (Figure 8), north approach median is too restricted for an effective advance warning sign to be placed (Figure 9). The Water Tower Road/ Button Hall Ave southwest approach to the crossing does not have W10-3 T-intersection advance warning signs present (Figure 10). I-13 Emergency Notification Signs are posted on each signal mast and clearly visible from the roadway approaches.
Railroad Crossing Pavement Markings: (Poor Condition) Railroad crossing pavement markings and stop bars are present the Button Hall Avenue west approach and US-52 approaches to the crossing. The Button Hall Avenue west approach pavement marking is heavily deteriorated with most of the pavement marking scaled off (Figure 11); stop bars at the crossing are in similar condition. Pavement markings on the US-52 approaches are in good condition.
Drainage: (Good Condition) No apparent evidence of drainage issues at the crossing. Track surface and trackbed are clear of sediment or standing water.
Track Approach Sightlines: (Good Condition) No obstructions within any of the approach sightlines.
Pedestrian Access and Curbing: (Not applicable) No curbing or pedestrian access present on wither approach to the crossing surface.
Short Term Recommendations
State Agency: Update current inventory form (after addressing advance warning signs along US-52) for accurate FRA safety reporting, numerous outdated fields:
Part III Box 2.D – W10-1 Advance Warning signs are posted (W10-2 sign recommended);
Part III Box 2.E – W10-5 Low Ground Clearance Signage is posted (crossing surface has low clearance scraping); and
Part IV Box 5 – Crossing surface is “Rubber” (flangeway filler and asphalt).
State Agency: Install W10-2 Advance Warning signs and W10-5 Low Ground Clearance signs on US-52 south to the crossing at the railroad pavement marking. Install W10-3 T-intersection advance warning sign on Water Tower Road.
State Agency: Remove and replace existing railroad crossing pavement markings and stop bars at crossing surface.

State Agency & Railroad: Review the existing active-warning signal system to verify if is interconnected to the adjacent intersection system
State Agency: Review low ground clearance issues at the crossing, determine improvements required to alleviate these issues by extending the crossing pavement transitions to the intersection of US-52.
Figure 2 –Button Hall Avenue North Track Approach

 Figure 3 –Button Hall Avenue South Track Approach
Figure 4 – Button Hall Avenue East Approach
Figure 3 –Button Hall Avenue South Track Approach
Figure 4 – Button Hall Avenue East Approach

 Figure 5 -Button Hall Avenue West Approach
Figure 6 –Button Hall Avenue Crossing Surface Looking North
Figure 5 -Button Hall Avenue West Approach
Figure 6 –Button Hall Avenue Crossing Surface Looking North

 Figure 7 –Button Hall Avenue West Approach Looking East
Figure 8 – US-52 South Approach Looking North
Figure 7 –Button Hall Avenue West Approach Looking East
Figure 8 – US-52 South Approach Looking North


 Figure 9 – US-52 North Approach Looking South
Figure 10 –Button Hall Avenue East Approach Looking West Including Water Tower Road
Figure 11 –Button Hall Avenue West Approach Looking East
Figure 9 – US-52 North Approach Looking South
Figure 10 –Button Hall Avenue East Approach Looking West Including Water Tower Road
Figure 11 –Button Hall Avenue West Approach Looking East
US 52 (South of Old US 52), Mount Holly, SC
Crossing Information
Current Inventory Report: 03/27/2018;
Grade Crossing Inventory Number: 640940E;
US 52 at-grade crossing, directly crossing through US 52 (Figure 1);
US-52 is a divided multi-lane highway at this crossing;
Mt Holly Plantation Ln is a private crossing adjacent to US-52 Southbound

Operated by CSX Transportation – Single Track Crossing, No Quiet Zone; and
No reported accidents since 2013.
DOT Crossing ID Crossing Location Train Count Conducted Day Trains 6am6pm Night Trains 6pm6am Switching Trains Max Timetable Speed (MPH) Typical Speed Range over Crossing (MPH) 2013 AADT Percent Trucks CSX Rail Infrastructure 640940E US 52 2018 0 0 2 10 10 to 10 Roadway Network 26,150 10%
Table 1 – U.S. DOT Inventory Form on US 52 Crossing
Figure 1 - US 52 Rail Crossing
Current Conditions Analysis
Crossing Signal Equipment: (Good Condition) US-52 has active warning with each directional roadway approach having two quadrant protection with signal masts with gate arms. Adjacent Mount Holly Plantation Lane (Private Road included in the crossing signal system) has passive warning signage with an interconnected signal for trains to verify active warning on US-52 has been activated and minimum roadway clearance time has been completed prior to train advancing into crossing (Figure 3 and Figure 4).
Roadway Surface: (Fair Condition) US-52 is divided into two separate directional roadways at this crossing. Both crossing surfaces are rubber flangeway filler with asphalt. The west end of northbound roadway crossing has isolated spalls and limited pavement heaving between the rails (Figure 5), similar condition for southbound roadway (Figure 6). Rubber flangeway along rails are filled with sand; edge of road has a moderate accumulation of sand and debris (Figure 5). Crossing is not posted for low ground clearance.
Railroad Crossing Signs: (Good Condition): Both northbound and southbound roadways have advance warning signs posted on each side of the roadway (Figure 10 shows northbound). Signal masts have I-13 emergency notification signs clearly posted for oncoming traffic.
Railroad Crossing Pavement Markings: (Fair Condition) Both approaches have railroad crossing pavement markings in each approach lane and stop bars prior to the crossing surface. Stop bars and pavement markings are in fair condition with cracking and light deterioration (Figure 11 and Figure 12). The northbound pavement markings are not in line with the advanced warning signs and are placed approximately 350’ closer to the crossing.
Drainage: (Good Condition) US-52 is a well graded with drainage swale between tracks. There is a moderate accumulation of sand and debris along edge of roadway and sand within the flangeway filler; however no apparent signs of erosion along edges of pavement or track approaches.
 Figure 2 - US 52 Highway-Rail Grade Crossing connecting to CSX Mainline
Track Approach Sightlines: (Good Condition) No obstructed sightlines for vehicles approaching the crossing surface.

Pedestrian Access and Curbing: (Not Applicable) There is no curbing or pedestrian access present at this crossing. Approaching roadways also do not have sidewalks.
Short Term Recommendations
State Agency: Install additional railroad crossing pavement markings at northbound advance warning signs to meet MUTCD design standard.
Figure 3 – Mount Holly Plantation Lane – Train Facing Interconnected Signal Looking West
Figure 4 – Mount Holly Plantation Lane – Train Facing Interconnected Signal Close Up

 Figure 5 – US-52 Northbound Crossing Surface Looking West
Figure 6 - Eastbound Tracks on US 52
Figure 5 – US-52 Northbound Crossing Surface Looking West
Figure 6 - Eastbound Tracks on US 52

 Figure 7 - Westbound Tracks on US 52
Figure 8 - US-52 Northbound Roadway Looking North
December 2018
Figure 7 - Westbound Tracks on US 52
Figure 8 - US-52 Northbound Roadway Looking North
December 2018

 Figure 9 – US-52 Southbound Roadway Looking South
Figure 10 – US-52 Northbound Advance Warning Signs
December 2018
Figure 9 – US-52 Southbound Roadway Looking South
Figure 10 – US-52 Northbound Advance Warning Signs
December 2018

 Figure 11 – US-52 Northbound Roadway Looking West
Figure 12 – US-52 Northbound Roadway Pavement Markings Looking North
Figure 11 – US-52 Northbound Roadway Looking West
Figure 12 – US-52 Northbound Roadway Pavement Markings Looking North
