

Applied Application model by Using Plugin Insight 360


Faculty of Architecture and Design
- Department of Architecture
Arch : Ameera Amr. Stu : Al Bayan Ahmed Omr. ZUJ University18-5-2021 Al-Bayan Ahmed
Omr
Final Project for plugin insight and green building studio

Two scenarios for the modeling in Revit ,plugin insight, and green building design
-Results from Green building studio


For 2 models = 4 Scenarios

Index
factors form plugin insight
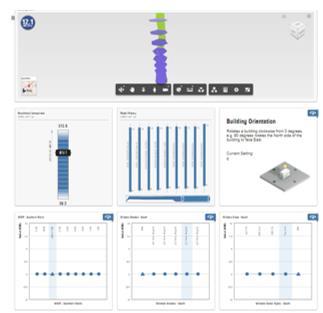
-weather station charts
-Results for two scenarios
-design decision for this modeling
Index A Al-Bayan Ahmed Omr
The Original Model
Testing & Validation Methodology


Testing different scenarios in Insight360. 2
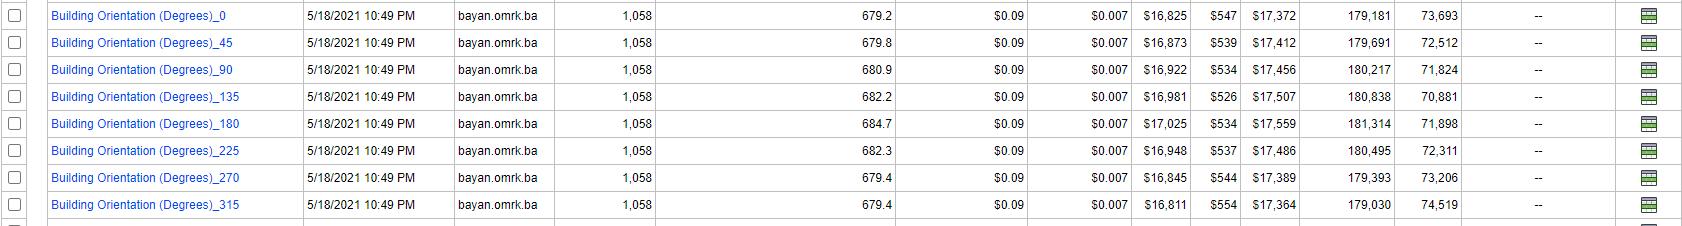
The Model for each angel between 0 to 360 for a 30 degree intervals.

Exported result and comparison chart contains the amount of EUI for each angle.
Comparison chart for each model contains the amount of EUL.
1
3
4
5
Introduction B Al-Bayan Ahmed Omr

Energy Consumption

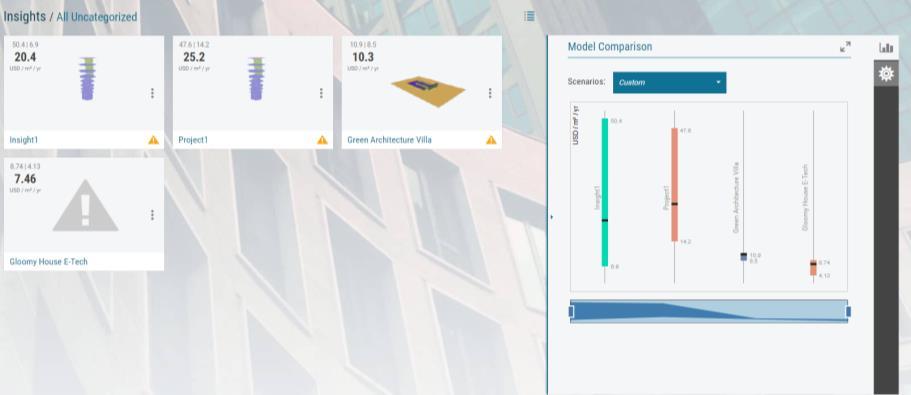
Insight 360 allow to save and compare your design scenarios to track performance spanning the building lifecycle in a consistent and cohesive manner. Share your insights with project stakeholders and access all your outcomes anywhere.
Plugin Interface

1 2
This Methodology has been selected due to achieve best analysis and validation of the Insight 360 software
Models for each angle between 0 to 360 for 30-degree intervals.
4 5
Every model shows: 1- Roof | Wall Construction. 2-Infiltration. 3-Lighting Efficiency.
Every model shows: 1- Operating Schedule. 2- Renewables ( PV Panel Efficiency ).
3
Every model shows :
1-Window wall Ratio
2-Window Shades
3-Window Glass
Introduction B
D Al-Bayan Ahmed Omr
Model 1
Location


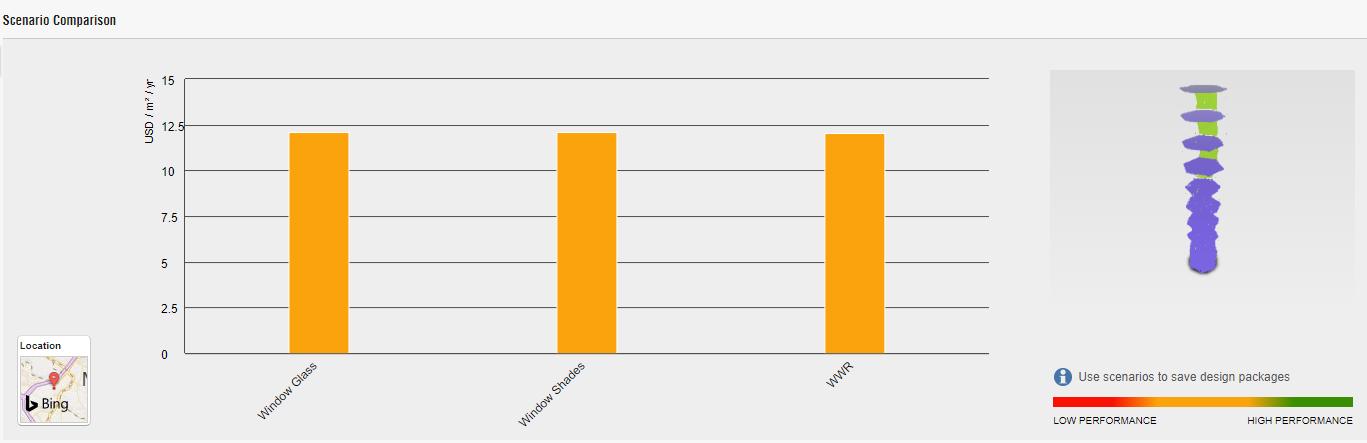

| Amman C Scenario Comparison D
Al-Bayan Ahmed Omr

Short side of building on the South Circulation.

Analytical Model

Best Energy Efficiency for Set 01


Longitudinal side of building on the East Circulation.
Best Energy Efficiency for Set 02


A building located in the Amman, where is the western of Jordan, so it could face East in Order to take maximum advantages of the sun energy to naturally heating.


Longitudinal side of building on the South Circulation.


Short side of building on the East Circulation.


Orientation D
Scenario
Scenario 1
2
Al-Bayan Ahmed Omr

Energy Use Intensity ( EUI )


Energy Use Intensity (EUI) can be defined as the measurement of a building’s annual energy consumption relative to its gross square-footage. EUI is often used to:
1. Express an existing building’s actual, metered energy consumption;
2. Convey the average annual energy use derived from a data set of similar building type and location


Building Operative of a high rise building model in Amman


-Efficient
wall, window, and HVAC equipment
Window Wall Ratio


Its for High-rise Office Buildings in Temperate Climate: Assessing Façade Embodied Energy and Building Operative Energy ( Life Cycle Energy).


Sun Path Analysis

refers to the daily and seasonal arc-like path that the Sun appears to follow across the sky as the Earth rotates and orbits the Sun. The Sun's path affects the length of daytime experienced and amount of daylight received along a certain latitude during a given season.

Key Elements D
Al-Bayan Ahmed Omr
Window Wall Ratio
-EE calculations should be included when considering the choice of façade materials
-WWR deep impact on heating and cooling capacities
-Most of recently built high-rise office buildings in Amman mainly comprise of double- glazed argon filled curtain walls whilst the opaque fabric is mostly constructed of light concrete with typical WWR 95%
Window to wall Ratio ( WWA )


Construction Materials used the External wall

Glazing to wall Ratio ( GWA )


D
Al-Bayan Ahmed Omr
Impacts from Insight Results BEFORE Optimization EUI Value Details


Impacts from Green Building Studio Before Optimization EUI Value Details


Window Wall Ratio D
EUI
731.7 KWh m yr EUI
750.2KWh m yr Cost
12.1 KWh m yr Cost
= 11.7 KWh m yr
Al-Bayan Ahmed Omr
before Optimization =
After Optimization =
before Optimization =
After Optimization
Scenario 1
Impacts from Insight Results AFTAR Optimization EUI Value Details


Impacts from Green Building Studio After Optimization EUI Value Details


Window
D
Wall Ratio
EUI
731.7 KWh m yr EUI
750.2KWh m yr Cost
KWh m yr Cost
KWh m yr
before Optimization =
After Optimization =
before Optimization = 12.1
After Optimization = 11.7
Al-Bayan Ahmed Omr
Scenario 2
Impacts from Insight Results BEFORE Optimization EUI Value Details


Impacts from Green Building Studio Before Optimization EUI Value Details


Window Shades D
EUI
750.2 KWh m yr EUI
718.3KWh m yr Cost
KWh m yr Cost
KWh m yr
before Optimization =
After Optimization =
before Optimization = 12.1
After Optimization = 12.1
Al-Bayan Ahmed Omr
Scenario 1
Impacts from Insight Results AFTAR Optimization EUI Value Details


Impacts from Green Building Studio AFTER Optimization EUI Value Details


Window Shades D EUI before Optimization = 750.2 KWh m yr EUI After Optimization = 718.3KWh m yr Cost before Optimization = 12.1 KWh m yr Cost After Optimization = 11.8 KWh m yr
Al-Bayan Ahmed Omr
Scenario 2
Roof Construction D


Impacts from Green Building Studio Before Optimization EUI Value Details


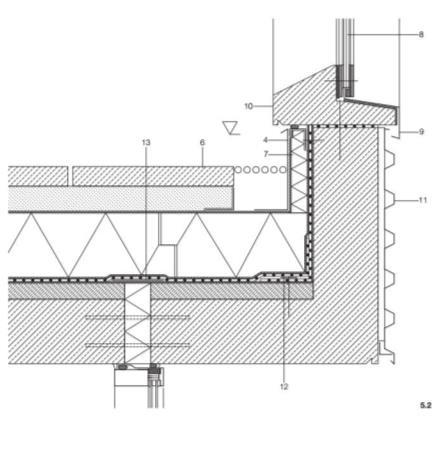


Impacts from Insight Results BEFORE Optimization EUI Value Details EUI before Optimization = 679.5 KWh

EUI After Optimization = KWh m yr Cost before Optimization = 12.1 KWh m yr Cost After Optimization = 11.7 KWh m yr

m yr
Scenario
Scenario
Al-Bayan Ahmed Omr
2
1


Second Solution


Building Orientation: + 210 from N

Window to Wall Ratio:


Northern = 35%


Eastern = 40%

Southern = 90%
Western = 40%
Window Shades:
Building Orientation: + 210 from N
Window to Wall Ratio:

Northern = 20%
Eastern = 60%
Southern = 90%
Western = 30%

Roof Construction: R60
Northern = 25%
Eastern = 50%


Southern = 80%
Western = 30%
Window Shades:
Northern = 20%
Eastern = 55%

Southern = 85%
Western = 45%

Roof Construction: R50
Combined Solutions D Scenario 1 Scenario
First Solution
2
Al-Bayan Ahmed Omr
Validated Results Against Benchmarks


Conclusion D
Al-Bayan Ahmed Omr
Before After

Impacts from Insight Results BEFORE Optimization EUI Value Details


Impacts from Insight Results AFTAR Optimization EUI Value Details


D
Model Model
Model 2
Analytical
Top View
Al-Bayan Ahmed Omr
Impacts from Insight Results BEFORE Optimization EUI Value Details


Impacts from Insight Results AFTER Optimization EUI Value Details

Impacts from Green Building Studio AFTER Optimization EUI Value Details

EUI before Optimization = 1285 KWh m yr
EUI After Optimization = 1265KWh m yr


Cost before Optimization = 305 KWh m yr
Cost After Optimization = 248 KWh m yr

Impacts from Green Building Studio AFTER Optimization EUI Value Details
HVAC D
Scenario
Al-Bayan Ahmed Omr
Scenario 1
2
Impacts from Insight Results BEFORE Optimization EUI Value Details

Impacts from Green Building Studio AFTER Optimization EUI Value Details
Impacts from Insight Results AFTER Optimization EUI Value Details

EUI before Optimization = 1970 KWh m yr
EUI After Optimization = 1939.6KWh m yr

Cost before Optimization = 305 KWh m yr

Cost After Optimization = 247 KWh m yr

Impacts from Green Building Studio AFTER Optimization EUI Value Details

Daylighting &
D
Occupancy Controls
Scenario
Al-Bayan Ahmed Omr
Scenario 1
2
Impacts from Insight Results BEFORE Optimization EUI Value Details

Impacts from Green Building Studio AFTER Optimization EUI Value Details
Impacts from Insight Results AFTER Optimization EUI Value Details

EUI before Optimization = 2107.3KWh m yr
EUI After Optimization = 1909.6 KWh m yr
Cost before Optimization = 12.1 KWh m yr

Cost After Optimization = 11.8 KWh m yr

Impacts from Green Building Studio AFTER Optimization EUI Value Details

Infiltration D
Scenario
Al-Bayan Ahmed Omr
Scenario 1
2

First Solution
Second Solution


HVAC: 305 KWh m yr


HVAC: 248 KWh m yr
Daylighting & Occupancy Controls: 305 KWh m yr

Infiltration: 248 KWh m yr
Daylighting & Occupancy Controls: 247 KWh m yr


Infiltration: 247 KWh m yr
Combined Solutions D Scenario 1 Scenario 2
Al-Bayan Ahmed Omr
Conclusion D
Validated Results Against Benchmarks


Al-Bayan Ahmed Omr


Weather Summery D
Al-Bayan Ahmed Omr


Weather Frequency D Wind Rose D Design Conditions D Al-Bayan Ahmed Omr
design decision D
Selecting the second scenario in each model reduces the total cost of materials, and increases operational energy efficiency at a lower cost.
 Al-Bayan Ahmed Omr


https://gbs.autodesk.co m/GBS/Project


https://jhmrad.com/themost-impressive-porchconstruction-detailsideas-ever-seen-19photos/metal-deck-roofconstruction-details/


https://insight360.auto desk.com/oneenergy

https://fairconditionin g.org/knowledge/passi ve-design/windowshape-and-sizing/


https://www.engprogui des.com/hvac-rule-ofthumb-calculator.html
References HVAC 05 03 WWA GBS 02 Roof Construction 04 01 Insight360
Al-Bayan Ahmed Omr


Thank you Address : Amman | Jordan Contact : - Email : bayan.omrk.ba@gmail.com