
Usage of Antibiotics and Occurrence of Antibiotic Resistance in Switzerland
Swiss Antibiotic Resistance Report 2024
Publishing details
© Federal Office of Public Health FOPH
Published by the Federal Office of Public Health FOPH
Publication date: November 2024
Editors: Kathrin Leventhal, Division of Communicable Diseases, Federal Office of Public Health, Dagmar Heim, Veterinary Medicinal Products and Antibiotics, Federal Food Safety and Veterinary Office, Simon Gottwalt, Division of Communicable Diseases, Federal Office of Public Health
Project coordination: advocacy ag consulting and communication, Basel
Design and layout: bom! communication ag, Basel
Source: SFBL, Distribution of Publications, CH-3003 Bern www.bundespublikationen.admin.ch
Order number: 316.402.24eng
www.star.admin.ch
Please cite this publication as:
Federal Office of Public Health and Federal Food Safety and Veterinary Office. Swiss Antibiotic Resistance Report 2024. Usage of Antibiotics and Occurrence of Antibiotic Resistance in Switzerland. November 2024.
6
6.1
6.7
Infobox 6.1
Infobox 6.2
in
7.1
8.1
9.1
9.2
Infobox 10.1 From
12.1
12.4
carbapenemase-producing
Foreword
Vorwort
Avant-propos
Premessa
1 Foreword
At the time of publication of the last edition of the Swiss Antibiotic Resistance Report (SARR) in 2022, the Covid-19 pandemic was still in the spotlight. With the need for close attention to Covid-19 decreasing over the last two years, today's arising major challenge is to transfer the lessons learned on pandemic preparedness and control into practice for other diseases. This is particularly true for combating antimicrobial resistance (AMR). After the Swiss Strategy on Antimicrobial Resistance (StAR) was approved by the Federal Council in November 2015, we can now look back on an eight-year-long history of successfully developing measures and tools to combat AMR.
Several major milestones have been achieved, including, for example, the monitoring of antibiotic resistance and antibiotic consumption, which are now both well established. The current data from the surveillance system show that the positive trends of recent years are continuing: consumption of antibiotics in Switzerland is further optimised, and resistance levels remain stable for now (see detailed data and analyses in chapters 4–10). But despite the measures already in place, the AMR problem is not yet solved. The Covid-19 pandemic demonstrated the dramatic impact that global environmental and health threats can have on all areas of life when the spread of a pathogen is not easily contained. This underlines the importance that measures against AMR need further strengthening, aligning them even better with the achievement of strategic goals and further optimizing national and international coordination to achieve the highest impact in mitigating the AMR problem (i.e. optimised implementation of stewardship programs promoting prudent antibiotic use and minimum standards for infection control measures).
Furthermore, new scientific insights are available from the National Research Programme ‘Antimicrobial Resistance’ (NFP 72) and other national and international research on AMR. These point to new ways forward for improved and new measures (e.g. the use of digital technologies, such as whole genome sequencing (WGS) and new ideas for novel antibiotics and diagnostic methods). Additionally, various political initiatives call for an in-depth examination and prioritization of different measures.
Martin Reist Federal Food Safety and Veterinary Office
On this basis, in June 2024, the Federal Council launched the One Health Action Plan StAR 2024–2027 outlining a road map of next steps to meet the AMR challenges ahead of us: we must ensure that guidelines and tools currently available for both appropriate antibiotic use and the spread of resistance are up-to-date, user-friendly, widely known and applied in the everyday setting to further secure the positive development of antibiotic use and resistance rates.
Furthermore, we now can take advantage of technological developments over the last number of years and profit from the experience and insights that were gained from their use in research in order to further improve the national monitoring system. As such, the use of WGS in the context of surveillance has emerged as one of the NFP 72’s key recommendations. Today’s national resistance-monitoring-system is largely based on phenotypic data reporting. Integrating genotypic data to address specific ques- tions promises to enrich the monitoring system with a better overall understanding of the emergence and spread of AMR within and between sectors – thus truly shedding light on the one health context of AMR and based on that, developing appropriate counter measures. Initial examples of promising WGS use cases are highlighted in this year’s chapter 12 “One Health spotlight”.
However, the path towards the envisioned one health molecular epidemiology is still long and needs to be approached step-by-step, and these steps must be conceptualized: the specific use cases for WGS need to be defined, the infrastructure for data storage and analysis needs to be developed and secured, the processes and competences of all involved stakeholders, such as (reference) laboratories, data providers and users need to be defined, and the relevant legislation has to be in place. De- spite the long list of tasks ahead of us, we are confident that in two years’ time, in the next edition of the SARR we will already be able to feature the first insights gained from WGS use.
We would like to thank everyone involved in compiling this newest edition of the SARR and we hope that you discover new facts and insights into the current use of antibiotics and resistance rates in Switzerland.
Linda Nartey Federal Office of Public Health
1 Vorwort
Als im Jahr 2022 die letzte Ausgabe des nationalen Berichts zur Lage der Antibiotikaresistenzen in der Schweiz (Swiss Antibiotic Resistance Report, SARR) erschien, stand die Covid-19-Pandemie noch immer im Mittelpunkt des Interesses. Mit dem abnehmenden Fokus auf Covid-19 in den letzten zwei Jahren liegt nun die grosse Herausforderung darin, die Erkenntnisse aus der Pandemievorsorge und -bekämpfung in die Praxis umzusetzen, auch für andere Krankheiten. Dies gilt insbesondere für die Bekämpfung von antimikrobiellen Resistenzen (AMR). Nachdem der Bundesrat im November 2015 die Strategie Antibiotikaresistenzen Schweiz (StAR) verabschiedet hat, können wir nun auf eine achtjährige Geschichte der erfolgreichen Entwicklung von Massnahmen und Instrumenten zur Bekämpfung von AMR zurückblicken.
Es wurden mehrere wichtige Meilensteine erreicht. So ist beispielsweise das Monitoring der Antibiotikaresistenzen wie auch des Antibiotikaverbrauchs inzwischen gut etabliert. Die aktuellen Daten des Überwachungssystems zeigen, dass sich die positiven Trends der letzten Jahre fortsetzen: Der Antibiotikaeinsatz in der Schweiz wird weiter optimiert und die Resistenzwerte bleiben vorerst stabil (siehe detaillierte Daten und Analysen in den Kapiteln 4–10). Doch trotz der bereits getroffenen Massnahmen ist das Problem der AMR noch nicht gelöst. Die Covid-19-Pandemie hat gezeigt, welch dramatische Auswirkungen globale Umwelt- und Gesundheitsbedrohungen auf alle Lebensbereiche haben können, wenn die Ausbreitung eines Erregers nur schwer einzudämmen ist. Dies zeigt, wie wichtig es ist, die Massnahmen gegen AMR weiter zu verstärken und noch besser auf die Erreichung strategischer Ziele auszurichten sowie die nationale und internationale Koordination weiter zu optimieren, um die grösstmögliche Wirkung bei der Eindämmung der AMR-Problematik zu erzielen (d. h. optimierte Umsetzung von Stewardship-Programmen zur Förderung eines umsichtigen Antibiotikaeinsatzes und Mindeststandards für Infektionskontrollmassnahmen).
Darüber hinaus liegen neue wissenschaftliche Erkenntnisse aus dem Nationalen Forschungsprogramm «Antimikrobielle Resistenz» (NFP 72) und anderen nationalen und internationalen Forschungsarbeiten zu AMR vor. Diese zeigen neue Wege für innovative, verbesserte Massnahmen auf (z. B. Einsatz digitaler Technologien wie die Ganzgenomsequenzierung (Whole Genome Sequencing WGS) und Ideen für neuartige Antibiotika und Diagnosemethoden). Zudem wird im Rahmen verschiedener politischer Initiativen eine eingehende Prüfung und Priorisierung der verschiedenen Massnahmen gefordert.
Martin Reist
Bundesamt für Lebensmittelsicherheit und Veterinärwesen.
Auf dieser Grundlage hat der Bundesrat im Juni 2024 den One Health-Aktionsplan StAR 2024–2027 lanciert, der eine Roadmap für die nächsten Schritte zur Bewältigung der anstehenden Herausforderungen im AMR-Bereich enthält: Es muss sichergestellt werden, dass die heute vorhandenen Leitlinien und Instrumente für einen angemessenen Antibiotikaeinsatz wie auch gegen die Ausbreitung von Resistenzen, benutzerfreundlich und allgemein bekannt sind und im Alltag genutzt werden, um die positive Entwicklung des Antibiotikaeinsatzes und der Resistenzraten abzustützen.
Zudem können wir jetzt die technologischen Entwicklungen der letzten Jahre nutzen und von den in der Forschung gewonnenen Erfahrungen und Erkenntnissen profitieren, um das nationale Überwachungssystem weiter zu verbessern. So ist der Einsatz der WGS im Rahmen der Überwachung eine der wichtigsten Empfehlungen aus dem NFP 72. Das heutige nationale Resistenzüberwachungssystem basiert weitgehend auf phänotypischen Daten. Die Einbeziehung genotypischer Daten zur Beantwortung spezifischer Fragen ist ein vielversprechender Ansatz zur Ergänzung des Überwachungssystems, da dies ein besseres Gesamtverständnis der bereichsinternen und bereichsübergreifenden Entstehung und Ausbreitung von AMR ermöglicht. So wird der One Health-Kontext von AMR ausgeleuchtet, und darauf aufbauend lassen sich geeignete Gegenmassnahmen erarbeiten. Erste vielversprechende Beispiele für den Einsatz der WGS werden im diesjährigen Kapitel 12 «One Health-Spotlight» aufgezeigt.
Der Weg zur angestrebten One Health-Molekularepidemiologie ist jedoch noch lang und muss schrittweise angegangen werden, wobei die einzelnen Schritte sorgfältig zu planen sind: Es müssen die spezifischen Anwendungsfälle für WGS definiert, die Infrastruktur für die Datenspeicherung und -analyse entwickelt und gesichert, die Prozesse und Kompetenzen aller beteiligten Akteure – wie (Referenz-)Laboratorien, Datenlieferanten und Nutzende – festgelegt und die einschlägigen Rechtsvorschriften erlassen werden. Trotz der langen Liste von anstehenden Aufgaben sind wir zuversichtlich, dass wir in der nächsten Ausgabe des SARR in zwei Jahren bereits über die ersten Erkenntnisse aus dem Einsatz der WGS berichten können.
Wir danken allen, die an der Erstellung dieser neuesten Ausgabe des SARR mitgewirkt haben, und hoffen, dass die Lektüre Ihnen neue Fakten und Erkenntnisse zum aktuellen Antibiotikaeinsatz und zu den Resistenzraten in der Schweiz bringt.
Linda Nartey Bundesamt für Gesundheit
1 Avant-propos
En 2022, lors de la parution du dernier Swiss Antibiotic Resistance Report (SARR, pour « rapport suisse sur la résistance aux antibiotiques »), la pandémie de COVID-19 monopolisait l’attention. Deux ans plus tard, le COVID-19 ne se trouve plus en point de mire, mais il faut relever l’immense défi qui en découle, à savoir appliquer les enseignements tirés de la préparation et de la lutte contre la pandémie à toutes les maladies. Ce défi concerne particulièrement la résistance aux antimicrobiens (RAM). Dans les huit années qui ont suivi l’adoption de la stratégie Antibiorésistance Suisse (StAR) par le Conseil fédéral en novembre 2015, nous avons réussi à développer de nombreux procédés et outils de lutte efficaces contre la RAM.
Nous avons franchi plusieurs étapes majeures, par exemple en établissant durablement la surveillance de l’utilisation des antibiotiques et de l’antibiorésistance. Les données de surveillance récentes montrent que les tendances positives se poursuivent : la Suisse a optimisé son recours aux antibiotiques, et pour l’heure les niveaux de résistance y sont stables (voir les chap. 4 à 10). Or, malgré les mesures prises, le problème de l’antibiorésistance demeure. La pandémie de COVID-19 a souligné l’énorme impact qu’un agent pathogène difficilement contenu peut avoir sur tous les domaines de la vie lorsqu’il constitue une menace environnementale et sanitaire de portée mondiale. Il est d’autant plus important de continuer à renforcer la lutte contre l’antibiorésistance, en alignant au mieux ses mesures sur les objectifs stratégiques et en optimisant la coordination nationale et internationale. En l’occurrence, il faut notamment améliorer la mise en œuvre de programmes promouvant l’utilisation appropriée des antibiotiques et l’instauration de normes minimales en prévention des infections.
Le Programme national de recherche sur la résistance aux antimicrobiens (PNR 72) et d’autres projets de recherche nationaux et internationaux ont produit quant à eux des connaissances sur la RAM. Ils ont fourni des impulsions pour parfaire les mesures existantes ou en créer de nouvelles, par exemple l’emploi de technologies numériques et de méthodes de diagnostic novatrices (comme le séquençage du génome complet [WGS]) et le déploiement d’approches innovantes pour développer des antibiotiques et diagnostics. En outre, diverses interventions politiques appellent à examiner en profondeur et à hiérarchiser les mesures.
Martin Reist
Office fédéral de la sécurité alimentaire et des affaires vétérinaires
Dans ce contexte, le Conseil fédéral a lancé en juin 2024 le plan d’action One Health StAR 2024–2027, qui pose les prochains jalons dans la lutte contre la RAM : pour parvenir à réaliser nos objectifs en la matière, nous devons veiller à la tenue à jour, à la convivialité, à la large diffusion et à l’application au quotidien des lignes directrices et des outils disponibles pour une utilisation appropriée des antibiotiques et contre la propagation des résistances.
Aujourd’hui, nous pouvons aussi tirer parti des développements technologiques récents et nous fonder sur l’expérience et le savoir issus de la recherche pour perfectionner le système de surveillance national. D’ailleurs, le recours au WGS pour la surveillance de l’antibiorésistance est l’une des principales recommandations formulées par le PNR 72. Le système actuel se base largement sur des données phénotypiques. Les utiliser pour répondre à des questions concrètes débouchera sur une meilleure vue d’ensemble de l’émergence et de la propagation de la RAM dans tous les contextes. Nous pourrons ainsi mieux appréhender les enjeux sanitaires de l’antibiorésistance dans une optique
One Health et développer des mesures adéquates. Le chapitre 12 du SARR 2024 One Health spotlight décrit les premiers exemples d’application prometteuse du WGS.
En dépit de ces progrès, le chemin vers une surveillance One Health fondée sur l’épidémiologie moléculaire reste long et passe par des paliers conceptualisés successifs : il faut définir les cas de figure spécifiques pour le WGS, développer et protéger l’infrastructure servant au stockage et à l’analyse des données, définir les processus et les compétences de toutes les parties prenantes (p. ex. les laboratoires [de référence], les fournisseurs de données et les utilisateurs) et mettre en vigueur les dispositions légales nécessaires. Malgré l’ampleur de la tâche qui nous attend, nous avons confiance en notre capacité à présenter les premiers résultats fondés sur le WGS dans deux ans, lors de la parution du prochain SARR.
Nous remercions toutes les personnes qui ont participé au présent rapport et vous souhaitons une bonne lecture.
Linda Nartey Office fédéral de la santé publique
1 Premessa
Al momento della pubblicazione dell’ultimo Swiss Antibiotic Resistance Report (SARR) nel 2022, la pandemia di COVID-19 era ancora al centro dell’interesse. Negli ultimi due anni, l’attenzione rivolta alla COVID-19 è diminuita e la sfida principale che sta emergendo ora è quella di trasferire nella pratica gli insegnamenti tratti dalla preparazione e dal controllo della pandemia anche per altre malattie. Ciò vale in particolare per la lotta alla resistenza antimicrobica (AMR). Dopo l’approvazione della Strategia svizzera resistenze agli antibiotici (StAR) da parte del Consiglio federale nel novembre 2015, oggi possiamo guardare indietro a un percorso durato otto anni, durante i quali sono stati sviluppati con successo strumenti e misure per combattere l’AMR.
Sono state raggiunte diverse tappe fondamentali, tra cui per esempio il consolidamento del monitoraggio sia della resistenza agli antibiotici sia del consumo di antibiotici. I dati attuali del sistema di monitoraggio dimostrano che le tendenze positive degli anni recenti proseguono: il consumo di antibiotici in Svizzera è stato ulteriormente ottimizzato e i livelli di resistenza per ora restano stabili (v. analisi e dati dettagliati ai cap. 4–10). Tuttavia, nonostante le misure già in atto, il problema dell’AMR non è ancora risolto. La pandemia di COVID-19 ha dimostrato l’impatto drammatico che le minacce ambientali e sanitarie globali possono avere su tutti gli ambiti di vita quando non è possibile contenere facilmente la diffusione di un agente patogeno. Ciò evidenzia quanto sia importante rafforzare ulteriormente le misure contro l’AMR, che devono essere meglio orientate al raggiungimento di obiettivi strategici, e ottimizzare ulteriormente il coordinamento nazionale e internazionale per ottenere la maggiore efficacia possibile in termini di mitigazione del problema dell’AMR (nello specifico, mediante un’implementazione ottimizzata di programmi di stewardship per promuovere un uso prudente degli antibiotici e standard minimi per le misure di controllo delle infezioni).
Inoltre, sono disponibili nuove conoscenze scientifiche grazie al programma nazionale di ricerca «Resistenza antimicrobica» (PNR 72) e ad altri studi nazionali e internazionali sull’AMR, che indicano nuove strade da percorrere verso misure migliorate e inedite (p. es. l’uso di tecnologie digitali come il sequenziamento completo del genoma [whole genome sequencing, WGS], e nuove idee per antibiotici e metodi diagnostici innovativi). In aggiunta, varie iniziative politiche richiedono un esame approfondito e una priorizzazione delle diverse misure.
Martin Reist
Ufficio federale della sicurezza alimentare e di veterinaria
Su questa base, nel giugno 2024 il Consiglio federale ha lanciato il piano d’azione One Health 2024–2027 della StAR, che delinea una road map dei prossimi passi da intraprendere per affrontare le sfide che ci attendono nell’ambito dell’AMR: dobbiamo garantire che le linee guida e gli strumenti attualmente disponibili per un uso appropriato degli antibiotici e contro la diffusione delle resistenze siano aggiornati, facili da usare, ampiamente conosciuti e applicati nel contesto quotidiano per assicurare ulteriormente l’evoluzione positiva dell’uso di antibiotici e dei tassi di resistenza.
Inoltre, ora possiamo sfruttare gli sviluppi tecnologici degli ultimi anni e trarre beneficio dall’esperienza e dalle conoscenze acquisite dal loro utilizzo nella ricerca al fine di migliorare ancora il sistema di monitoraggio nazionale. L’impiego del WGS nell’ambito del monitoraggio è una delle raccomandazioni principali emerse dal PNR 72. L’attuale sistema nazionale di monitoraggio delle resistenze è fondamentalmente basato sui rapporti relativi a dati fenotipici. L’integrazione di dati genotipici allo scopo di affrontare questioni specifiche potrebbe perfezionare il sistema di monitoraggio contribuendo a una migliore visione d’insieme della comparsa e della diffusione dell’AMR all’interno di un settore e tra diversi settori, facendo veramente luce sul contesto One Health dell’AMR e consentendo di sviluppare, su questa base, contromisure appropriate. I primi esempi di casi d’uso promettenti del WGS sono presentati nell’attuale capitolo 12 «One Health spotlight».
Tuttavia, il cammino verso un’epidemiologia molecolare secondo l’approccio One Health è ancora lungo e deve essere affrontato passo per passo. Ogni fase deve essere concettualizzata: vanno definiti i casi d’uso specifici per il WGS, va sviluppata e garantita l’infrastruttura per l’archiviazione e l’analisi dei dati, vanno definiti i processi e le competenze di tutti i portatori di interessi coinvolti, come i laboratori (di riferimento), i fornitori e gli utilizzatori di dati, e deve essere creata la pertinente legislazione. Nonostante il lungo elenco di compiti da svolgere, siamo certi che tra due anni, nella prossima edizione del SARR, saremo già in grado di presentare le prime conoscenze acquisite dall’impiego del WGS.
Ringraziamo tutte le persone che hanno contribuito a redigere la presente edizione del SARR e speriamo che scoprirete nuovi fatti e informazioni utili sull’attuale uso di antibiotici e sui tassi di resistenza in Svizzera.
Linda Nartey
Ufficio federale della sanità pubblica
Summary Zusammenfassung
Résumé
Sintesi
2 Summary
When bacteria become immune or less responsive to antibiotics, this is called antibiotic resistance. Such resistant bacteria can make it more difficult or even impossible to treat infections. To promote the responsible use of antibiotics and to curb the spread of resistant organisms, the Swiss Strategy on Antibiotic Resistance (StAR) was launched in 2015. These efforts have been further bolstered through the new One Health Action Plan 2024–27 StAR. The surveillance of antibiotic use and resistance in humans, livestock, domestic animals and in the environment is a key part of the strategy and action plan. The results of this monitoring and surveillance are summarised every two years in the Swiss Antibiotic Resistance Report.
Development of antibiotic consumption
Every time antibiotics are used, resistant bacteria can develop. It is therefore crucial that these medicines are used as appropriately as possible in humans and animals. It is important that antibiotics are used as much as necessary but as little as possible. It is also key that the right antibiotic is used, in the right dosage and for the right duration. This is why the sale and use of antibiotics is monitored and analysed.
In human medicine, antibiotic use has increased again following the COVID-19 pandemic. In human medicine, total antibiotic consumption (in both medical practices and hospitals) amounted to 10.8 defined daily doses (DDD) per 1,000 inhabitants per day in 2023. Following a significant decline during the COVID-19 pandemic (2021: 8.6 DDD), consumption has therefore returned to a similar level to 2019 (10.6 DDD, +3%). The significant wave of respiratory diseases in the winter/spring of 2023 is likely to have played a part in this. Compared to the rest of Europe, however, Switzerland remains one of the countries with the lowest consumption (consumption in EU countries in 2022: min. 9.1 DDD, max. 33.5 DDD, Ø 19.4 DDD [1]). The goal of Switzerland’s StAR One Health Action Plan is to reduce consumption to 10.2 DDD by 2027.
In terms of critical antibiotics from the Watch group, there has been a 26% decline since 2014 (2014: 4.9 DDD; 2022: 3.4 DDD; 2023: 3.6 DDD). The proportion of the less critical Access antibiotics, which should be prescribed as the first choice, as a share of total consumption increased to 66%. Since 2019, Switzerland has exceeded the World Health Organisation’s target of 60% for Access antibiotics. The Action Plan aims to further improve the proportion to 69%.
In Switzerland, 87% of antibiotics are used in medical practices and 13% in hospitals.
The majority of antibiotics are used in outpatient settings (particularly in medical practices). Consumption per capita
(9.4 DDD) has significantly increased following the COVID pandemic (2021: 7.3 DDD; 2022: 8.7 DDD) but is still relatively low when compared internationally comparison: in the EU, only the Netherlands recorded lower consumption in outpatient settings in 2022 (8.3 DDD). The EU average was 17.0 DDD.
There are marked regional differences in consumption across Switzerland: in German-speaking parts of the country, consumption per inhabitant (at 7.8 DDD) is lower than in the French-speaking and Italian-speaking parts (at 13.1 DDD and 12.4 DDD, respectively). The Action Plan seeks to reduce these regional differences. In 2023, general practitioners prescribed the most antibiotics to treat diseases of the upper respiratory tract (30%) and urinary tract infections (28%). Around 20% of prescriptions involved classes of antibiotics that are not recommended in the national guidance.
Meanwhile, in Swiss hospitals, per-capita consumption at 1.4 DDD in 2023 (2022: also 1.4 DDD) is roughly in line with the EU average (2022: 1.6 DDD). Consumption is therefore slightly lower than before the COVID-19 pandemic (2019: 1.5 DDD). Around a third of hospitalised patients received an antibiotic in 2023.
Antibiotic consumption continues to decline in veterinary medicine
Antibiotics are also used to treat bacterial infections in livestock and domestic animals (a total of 24 tonnes in 2023, with 3% for domestic animals). The total volume of antibiotics sold to veterinarians decreased by a further 14% compared with 2021. Antibiotic consumption has therefore been reduced by 48% since 2014. In particular, the sale of so-called critical antibiotics, which are particularly important in human medicine, has further decreased since 2021: a decline of 76% has been achieved in livestock since 2014, and the sale of antibiotics for domestic animals has decreased by 19% over the last decade. By European comparison, Switzerland’s consumption is relatively low. The goal is to be one of the five best-performing countries in Europe in terms of the sale of critical antibiotics by 2027.
Since 2019, every time a veterinarian in Switzerland prescribes antibiotics, it is recorded in a dedicated information system (IS ABV). Analysis of this data shows that primarily first-line antibiotics are used for all species. This proves that veterinarians in Switzerland are following the treatment guidelines. Cattle are the most likely to be treated with antibiotics compared with other species (cattle: 564 treatments per 1,000 animals; poultry: 76; pigs: 23).
Cattle were given antimicrobials primarily for udder infections (30.3%), pigs for infections of the gastrointestinal tract (53.6%), poultry for young bird disease (85%), goats/ sheep for respiratory diseases (32%), horses/donkeys for
musculoskeletal diseases (34%), and dogs and cats for skin conditions (24.5% and 28.5%, respectively). The distribution of antibiotic use across the various diseases for each species has remained relatively stable over time.
Antibiotics in the environment
Antibiotic pollution in rivers, lakes and groundwater can be reduced by retrofitting sewage treatment plants.
After antibiotics have been ingested by humans and animals, they are partially excreted and can thus end up in wastewater, waterbodies and soil. Antibiotic concentrations decrease from wastewater to river water due to dilution effects. From river water to ground water, the concentrations decrease further as antibiotics are partly degraded or retained during bank filtration or when they pass through the soil.
Conventional sewage treatment plants can only partially remove antibiotics. However, additional treatment steps to eliminate micropollutants can reduce the measured concentrations of antibiotics by a factor of ten. In 2024, around 15% of Swiss wastewater was purified in such treatment steps, and by 2040 that figure is set to be 70%. Measurements conducted in Furtbach (AG/ZH) show that by retrofitting a sewage plant, the concentration of antibiotics is reduced so much that the Environmental Quality Standards are no longer exceeded. Based on current evidence, it is unlikely that the antibiotic concentrations measured in Swiss waterbodies are directly promoting the development of resistance.
Resistance situation
Many microorganisms are naturally present in the environment and on the skin, in the mucosa or in the intestine of humans and animals (e.g for digestion). However, if these bacteria enter the body and multiply excessively, this is referred to as an infection. This happens, for example, if the skin or mucosa are damaged, or in people with immunodeficiency. If the bacteria that cause the infection are resistant to certain antibiotics, it becomes difficult, or even impossible, to treat the infection.
Data on resistance rates in humans and animals has been collected in Switzerland for around 20 years. It is always done for a specific bacterium and class of antibiotic. The most important pathogens and antibiotics show a mixed picture: while antibiotic resistance has significantly increased in some bacteria, it has remained stable or decreased in others. Overall, resistance rates have stabilised in recent years.
Resistance rates have stabilised in human medicine. One of the most important resistant pathogens is S. aureus , which is resistant to methicillin (MRSA). Rates of MRSA have fallen from 10% to 4% since 2005, and have continued to decline slightly in the last few years. The rate of penicillin-resistant S. pneumoniae remains constant at a low level (4%).
Resistance rates to the antibiotic classes fluoroquinolones and cephalosporins in the bacteria E. coli and K. pneumonia have remained relatively stable since 2015 but increased slightly in 2022 and 2023. If resistance to cephalosporins increases, the antibiotic class of carbapenems will have to be used more frequently (see separate section on carbapenem resistance).
Infections caused by the bacterium C. difficile pose a risk in hospital settings. The use of antibiotics can facilitate such infections, as antibiotics damage the gut flora, which allows C. difficile to multiply. A study conducted at the Inselspital in Bern shows that a decline in antibiotic use has also led to a reduction in C. difficile infections.
Based on resistance data, modelling can be used to estimate the disease burden and number of deaths caused by antibiotic resistance. For Switzerland it is estimated that the disease burden is around 85 infections per 100,000 inhabitants and that around 300 people a year die from infections caused by resistant pathogens. [2] Relative to the size of its population, Switzerland is less affected by infections caused by resistant bacteria than France or Italy, but more so than the Netherlands or Scandinavian countries.
Monitoring resistance in animals
Two different monitoring systems are used to track resistance rates in animals. To assess the potential risk to humans, commensal indicator bacteria and zoonotic bacteria are monitored from healthy slaughter animals and meat. Commensal indicator bacteria do not normally cause diseases themselves, but can pass on resistance to other bacteria, including to those that can cause diseases in humans. The monitoring of indicator bacteria, in particular E. coli in slaughter animals and meat, therefore gives a good overview of the development of resistance. Zoonotic bacteria can be transmitted from animals or food to humans. The diseases they cause are called zoonotic diseases or zoonoses.
Resistance has also been monitored since 2019 in pathogenic bacteria for livestock and domestic animals. This data can help guide the choice of antibiotics used to treat infections.
Antibiotic resistance has evolved differently in slaughter animals and meat.
Resistance rates in E. coli bacteria from the intestines of broiler chickens, fattening pigs and slaughter calves evolved differently between 2021 and 2023. Rates of fluoroquinolone-resistant E. coli from broiler chickens decreased to 34%. These resistance rates in fattening pigs and slaughter calves are unchanged at under 10%. Rates of resistance to tetracyclines and sulfonamides are declining in all livestock species. For cephalosporin-resistant E. coli, which is important in human medicine (so-called ESBL/ AmpC-producing E. coli ), and which is often also resistant to other antibiotics (multi drug resistance), resistance rates decreased significantly in broiler chickens (to 4.3% in 2022), stagnated in pigs (at 6.2% in 2023), but increased in slaughter calves (32.7% in 2023).
Since 2020 there has been a further decline in ESBL/AmpC-producing E. coli in retail chicken samples: in chicken of Swiss origin it was present in 4.2% of samples, and in chicken of foreign origin 47.4% in 2022. Detection rates have therefore declined sharply since 2014, both in chicken of Swiss origin (2014: 65.5%) and in chicken of foreign origin (2014: 85.6%).
Retail turkey meat was tested for the first time in 2022. ESBL/AmpC-producing E. coli was detected in 25.7% of the turkey samples of foreign origin, and in none of the turkey samples from Switzerland. In retail pork and beef samples, these values have been very low for years (around 1%). No ESBL/AmpC-producing E. coli was detected in imported beef.
Samples are also tested for methicillin-resistant S. aureus (MRSA). While in 2009 MRSA was detected in only 2% of samples from fattening pigs, the detection rate rose to around 53.6% by 2019 and has since stagnated (2023: 53.5%). This MRSA is known as ‘animal-associated’ MRSA, which means there is only a transmission risk for people who have regular close contact with pigs. MRSA prevalence in slaughter calves has stabilised at a low level (under 10%).
Rates of resistance in Campylobacter from chicken are stable
Infection caused by Campylobacter bacteria (campylobacteriosis) is the most common zoonosis in Switzerland and in other European countries. Campylobacter are frequently transmitted through food, in particular raw chicken, and cause gastroenteritis. A bacterial foodborne infection can be prevented by meticulously following some simple hygiene rules in the kitchen.
Fluoroquinolone-resistant Campylobacter (C. jejuni) was detected in 45.7% of Swiss broiler chickens in 2022, and
the rate has therefore stabilised at a high level since 2018. Rates of resistance to macrolides – a class of antibiotic that can be used to treat severe infections caused by Campylobacter – remained at a low level (under 5%).
Antibiotic resistance has developed differently in diseased livestock and domestic animals.
The spectrum of potentially pathogenic bacteria in livestock and domestic animals is very broad. The resistance situation therefore also varies widely depending on the type of bacteria and species concerned. The rate of resistance to fluoroquinolones in pathogenic E. coli from broiler chickens has decreased to 20%. In general, the tested bacteria from dogs and cats showed a high level of resistance to aminopenicillins. Rates of resistance to other classes of antibiotic are below 20%. Pathogenic bacteria causing udder infections in cows are usually responsive to penicillin (with the exception of S. aureus ).
New methods allow a better understanding of the spread of carbapenem resistance.
Carbapenems are important reserve antibiotics for treating severe infections and should therefore be used as sparingly as possible. Carbapenemase-producing Enterobacterales (CPE) are resistant to carbapenems. These multi-resistant bacteria pose a particular threat to public health, which is why they are subject to a reporting obligation in human medicine. Compared with the countries in the EU, carbapenem resistance in Switzerland is at a low level but is on the rise. For example, rates of resistance in the enterobacterium K. pneumoniae, which is particularly transmitted in hospital settings, exceeded 1% for the first time in 2023. In addition, more carbapenem-resistant K. pneumoniae that are particularly virulent (pathogenic) have been detected in recent years.
Because of the importance of CPE in human medicine, these are also monitored in animals. As before, no cases of CPE have been detected in healthy livestock in Switzerland. However, CPE are increasingly detected in samples from domestic animals. Using whole genome sequencing (WGS), researchers have studied the spread of CPE in veterinary clinics. This showed that an easily transmissible DNA molecule called a plasmid is responsible for the spread of carbapenem resistance between enterobacteria in domestic animals, and that this can also be transmitted to staff at veterinary clinics. There is some concern that these CPEs are also transmitted to livestock and could enter the food chain. To prevent this happening, surveillanceand hygiene measures are also needed in veterinary clinics.
[1] European Centre for Disease Prevention and Control. Antimicrobial consumption in the EU/EEA (ESAC-Net) - Annual Epidemiological Report 2022. Stockholm: ECDC; 2023. https://www.ecdc.europa.eu/sites/ default/files/documents/AER-antimicrobialconsumption.pdf
[2] Gasser et al: Associated deaths and disability-adjusted life-years caused by infections with antibiotic-resistant bacteria in Switzerland, 2010 to 2019, Euro Surveill. 2023;28(20). https://doi.org/10.2807/1560-7917. ES.2023.28.20.2200532
2 Zusammenfassung
Wenn Bakterien unempfindlich oder weniger empfindlich gegenüber Antibiotika werden, spricht man von Antibiotikaresistenz. Solche resistenten Bakterien können die Behandlung von Infektionen erschweren oder sogar unmöglich machen. Deshalb wurde 2015 die Strategie Antibiotikaresistenzen Schweiz (StAR) lanciert, um den verantwortungsvollen Einsatz von Antibiotika zu fördern und die Ausbreitung von Resistenzen zu bremsen. Diese Bemühungen werden mit dem neuen One Health-Aktionsplan StAR 2024–2027 weiter gestärkt. Die Überwachung von Antibiotikaeinsatz und Resistenzen beim Menschen, bei Nutz- und Heimtieren sowie in der Umwelt ist ein wichtiger Teil von Strategie und Aktionsplan. Die Ergebnisse dieser Überwachung werden alle 2 Jahre im «Swiss Antibiotic Resistance Report» zusammengefasst.
Entwicklung des Antibiotikaverbrauchs
Jedes Mal, wenn Antibiotika zum Einsatz kommen, können resistente Bakterien entstehen. Deshalb ist es entscheidend, dass diese Medikamente bei Mensch und Tier möglichst sachgemäss verwendet werden. Es gilt, Antibiotika so viel wie nötig, aber so wenig wie möglich einzusetzen. Wichtig ist auch, dass das richtige Antibiotikum eingesetzt wird, in der richtigen Dosis und für die richtige Dauer. Daher wird der Verkauf und Einsatz von Antibiotika überwacht und analysiert.
In der Humanmedizin ist der Antibiotikaverbrauch nach der Covid-19-Pandemie wieder angestiegen In der Humanmedizin betrug der Gesamtverbrauch an Antibiotika (Praxen und Spitäler) 2023 insgesamt 10,8 DID (definierte Tagesdosen pro 1000 Einwohner und Tag). Damit ist der Verbrauch nach einem deutlichen Rückgang während der Covid-19-Pandemie (2021: 8,6 DID) wieder auf ein ähnliches Niveau wie 2019 (10.6 DID, +3 %) zurückgekehrt. Eine Rolle dürfte hierbei die starke Welle von Atemwegserkrankungen im Winter/Frühjahr 2023 gespielt haben. Im europäischen Vergleich gehört die Schweiz aber weiterhin zu den Ländern mit dem niedrigsten Verbrauch (Verbrauch in den EU-Ländern im Jahr 2022: min. 9,1 DID, max. 33,5 DID, Ø 19,4 DID [1]). Ziel des Schweizer Aktionsplans StAR ist es, den Verbrauch bis 2027 auf 10,2 DID zu senken.
Bei den besonders kritischen Antibiotika der «Watch»Gruppe konnte seit 2014 ein Rückgang um 26 % erreicht werden (2014: 4,9 DID; 2022: 3,4 DID; 2023: 3,6 DID). Entsprechend konnte der Anteil am Gesamtverbrauch der weniger kritischen «Access»-Antibiotika, welche als erste Wahl verschrieben werden sollten, auf 66 % gesteigert werden. Seit 2019 überschreitet die Schweiz damit den Zielwert der Weltgesundheitsorganisation (WHO) von 60 %. Ziel des Aktionsplans ist eine weitere Verbesserung des Anteils auf 69 %.
In der Schweiz wurden 87 % der Antibiotika in Praxen eingesetzt und 13 % in Spitälern
Der Grossteil der Antibiotika wird im ambulanten Bereich eingesetzt (v. a. in Arztpraxen). Der Verbrauch pro Kopf (9,4 DID) ist nach der Covid-Pandemie deutlich gestiegen (2021: 7,3 DID; 2022: 8,7 DID), ist im internationalen Vergleich aber immer noch relativ gering: In der EU wies 2022 nur die Niederlande (8,3 DID) einen niedrigeren Verbrauch im ambulanten Bereich auf. Der Durchschnitt in der EU betrug 17,0 DID.
Es gibt in der Schweiz ausgeprägte regionale Unterschiede beim Verbrauch: In der Deutschschweiz ist der Antibiotikaverbrauch pro Einwohner mit 7,8 DID niedriger als in der französisch- (13,1 DID) und italienischsprachigen (12,4 DID) Schweiz. Ziel des Aktionsplans ist es, diese regionalen Unterschiede zu verringern. Von den Hausärztinnen und Hausärzten wurden 2023 die meisten Antibiotika bei Erkrankungen der oberen Atemwege (30 %) und bei Harnwegsinfekten (28 %) eingesetzt. Bei rund 20 % der Verschreibungen wurden Antibiotikaklassen eingesetzt, die nicht von den nationalen Richtlinien empfohlen werden.
In Schweizer Spitälern entspricht der Pro-Kopf-Verbrauch mit 1,4 DID im 2023 (2022: ebenfalls 1,4 DID) in etwa dem Durchschnitt der EU-Länder (2022: 1,6 DID). Der Verbrauch ist damit etwas geringer als vor der Covid-19-Pandemie (2019: 1,5 DID). Etwa ein Drittel der hospitalisierten Patienten erhielt 2023 ein Antibiotikum.
In der Veterinärmedizin ist der Antibiotikaverbrauch weiter zurückgegangen Antibiotika werden zur Behandlung bakterieller Infektionen von Nutz- und Heimtieren eingesetzt (im 2023 total 24 Tonnen; davon sind 3 % für Heimtiere bestimmt) Die Gesamtmenge verkaufter Antibiotika an Tierärzte sank gegenüber 2021 um weitere 14 %. Damit konnte der Antibiotikaverbrauch seit 2014 um 48 % reduziert werden. Insbesondere ging der Vertrieb von sogenannten kritischen Antibiotika, die für die Humanmedizin besonders wichtig sind, seit 2021 weiter zurück; bei Nutztieren konnte seit 2014 ein Rückgang um 76 % erreicht werden, bei Heimtieren hat der Antibiotikavertrieb in den letzten zehn Jahren um 19 % abgenommen. Im europäischen Vergleich gehört die Schweiz zu den Ländern mit einem relativ niedrigen Verbrauch. Ziel ist, bis 2027 beim Vertrieb kritischer Antibiotika unter den fünf besten Ländern in Europa zu sein.
Seit 2019 werden durch das Informationssystem Antibiotikaverbrauch (IS ABV) alle Antibiotikaverschreibungen von Schweizer Tierärztinnen und Tierärzten erfasst. Die Analyse dieser Daten zeigt, dass bei allen Tierarten hauptsächlich Antibiotika der ersten Wahl eingesetzt werden. Dies belegt, dass Schweizer Tierärztinnen und Tierärzte die Therapieleitfäden berücksichtigen. Rinder werden im Vergleich
mit anderen Tierarten am häufigsten mit Antibiotika behandelt (Rinder: 564 Behandlungen pro 1000 Tiere; Geflügel: 76; Schweine: 23).
Rinder erhielten antimikrobielle Mittel hauptsächlich für Eutererkrankungen (30,3 %), Schweine für Infektionen des Magen-Darm-Trakts (53,6 %), Geflügel für Jungtierkrankheiten (85 %), Ziegen/Schafe für Atemwegserkrankungen (32 %), Pferde/Esel für Krankheiten des Bewegungsapparats (34 %), Hunde und Katzen für Hauterkrankungen (24,5 % bzw. 28,5 %). Die Verteilung des Antibiotikaeinsatzes auf die verschiedenen Erkrankungen ist für die jeweilige Tierart über die Jahre relativ konstant.
Antibiotika in der Umwelt
Die Antibiotikabelastung in Flüssen, Seen und im Grundwasser kann durch ausgebaute Kläranlagen reduziert werden Eingenommene Antibiotika werden von Mensch und Tier zum Teil wieder ausgeschieden und gelangen auf diese Weise in Abwasser, Gewässer und Böden. Die gemessenen Konzentrationen von Antibiotika nehmen dabei vom Abwasser bis hin zum Flusswasser durch Verdünnung ab. Vom Flusswasser zum Grundwasser sinken die Konzentrationen zusätzlich, da Antibiotika während der Uferfiltration oder Bodenpassage teilweise abgebaut oder zurückgehalten werden.
Konventionelle Kläranlagen können Antibiotika nur unvollständig entfernen. Zusätzliche Behandlungsstufen zur Elimination von Mikroverunreinigungen können hingegen die gemessenen Konzentrationen an Antibiotika um das zehnfache reduzieren. Im Jahr 2024 wurden etwa 15 % der Schweizer Abwässer in einer solchen Behandlungsstufe gereinigt, bis 2040 sollen es 70 % sein. Messungen im Furtbach (AG/ZH) zeigen, dass die Konzentration von Antibiotika durch die Aufrüstung einer Kläranlage so weit gesenkt wird, dass der Grenzwert der Umweltqualitätsnormen nicht mehr überschritten wird. Nach heutigem Kenntnisstand ist es unwahrscheinlich, dass die in Schweizer Gewässern gemessenen Antibiotikakonzentrationen die Entwicklung von Resistenzen direkt fördern.
Resistenzsituation
Viele Mikroorganismen finden sich natürlicherweise in der Umwelt sowie auf der Haut, den Schleimhäuten oder im Darm von Mensch und Tier (u. a. zur Verdauung). Dringen diese Bakterien jedoch in den Körper ein und vermehren sich übermässig, spricht man von einer Infektion. Dies passiert z. B. bei geschädigter Haut oder Schleimhaut oder bei Immunschwäche. Sind die Bakterien, die eine Infektion
verursachen, resistent gegen gewisse Antibiotika, wird eine Behandlung erschwert oder gar verunmöglicht.
Seit etwa 20 Jahren werden in der Schweiz bei Mensch und Tier Resistenzraten erhoben. Diese werden dabei immer für ein bestimmtes Bakterium und eine Antibiotikaklasse angegeben. Bei den wichtigsten Erregern und Antibiotika zeigen sich unterschiedliche Entwicklungen: Bei einigen Bakterien hat die Antibiotikaresistenz deutlich zugenommen, während sie bei anderen stabil geblieben oder gesunken ist. Insgesamt zeichnet sich in den letzten Jahren eine Stabilisierung der Resistenzraten ab.
In der Humanmedizin haben sich die Resistenzraten stabilisiert
Zu den wichtigsten resistenten Erregern gehören S. aureus, die gegen Methicillin resistent sind (MRSA). Die Resistenzrate bei MRSA ist seit 2005 von 10 % auf 4 % gesunken und hat auch in den letzten Jahren leicht abgenommen. Die Resistenzrate bei Penicillin-resistenten S. pneumoniae ist konstant auf tiefem Niveau (4 %).
Die Resistenzraten gegenüber den Antibiotikaklassen der Fluorochinolone und Cephalosporine bei den Erregern E. coli und K. pneumoniae sind seit 2015 relativ stabil, 2022 und 2023 allerdings leicht gestiegen. Wenn die Resistenz gegen Cephalosporine zunimmt, muss vermehrt die Antibiotikaklasse der Carbapeneme eingesetzt werden (siehe separater Abschnitt zur Carbapenem-Resistenz).
Infektionen mit dem Bakterium C. difficile stellen in Spitälern eine Gefahr dar. Solche Infektionen werden durch den Einsatz von Antibiotika begünstigt, da Antibiotika die natürliche Darmflora schädigen und sich C. difficile so vermehren kann. Eine Studie am Inselspital in Bern zeigt, dass der rückläufige Antibiotikaeinsatz auch zu einer Verringerung der C. difficile -Infektionen geführt hat.
Basierend auf den Resistenzdaten kann mittels einer Modellrechnung die Krankheitslast und die Anzahl der Todesfälle durch Resistenzen geschätzt werden. Für die Schweiz schätzt man, dass die Krankheitslast bei etwa 85 Infektionen pro 100 000 Einwohnern liegt und jährlich etwa 300 Menschen an Infektionen mit resistenten Erregern sterben [2]. Die Schweiz ist damit im Verhältnis zur Bevölkerungszahl weniger stark von Infektionen durch resistente Bakterien betroffen als Frankreich oder Italien, aber stärker als die Niederlande oder die skandinavischen Länder.
Resistenzüberwachung bei Tieren
Die Überwachung der Resistenzraten bei Tieren erfolgt über zwei unterschiedliche Monitoring-Systeme. Zur Abschätzung des potenziellen Risikos für den Menschen werden kommensale Indikatorbakterien sowie zoonotische Bakterien bei gesunden Schlachttieren und Fleisch über-
wacht. Kommensale Indikatorbakterien verursachen selber normalerweise keine Krankheiten, können aber die Resistenzen an andere Bakterien weitergeben, auch an solche, die beim Menschen Krankheiten verursachen können. Die Überwachung von Indikatorbakterien, insbesondere E. coli bei Schlachttieren und auf Fleisch gibt somit einen guten Überblick der Resistenzentwicklung. Zoonotische Bakterien können von Tieren oder Lebensmitteln auf den Menschen übertragen werden. Die dadurch hervorgerufenen Krankheiten nennt man Zoonosen.
Zudem werden seit 2019 Resistenzen bei krankmachenden Bakterien für Nutz- und Heimtiere überwacht. Diese Daten geben eine Orientierung bei der Wahl der Antibiotika, die zur Behandlung eingesetzt werden.
Bei Schlachttieren und Fleisch entwickeln sich Antibiotikaresistenzen unterschiedlich
Bei E. coli -Bakterien im Darm von Mastpoulets, Mastschweinen und Schlachtkälbern haben sich die Resistenzraten zwischen 2021 und 2023 unterschiedlich entwickelt. Gegenüber Fluorochinolonen zeigt sich bei E. coli von Mastpoulets ein Rückgang der Resistenzraten auf 34 %. Bei Mastschweinen und Mastkälbern sind diese Resistenzraten unverändert bei unter 10 %. Resistenzraten gegenüber Tetrazyklinen und Sulfonamiden sind bei allen Nutztierarten sinkend. Bei den für die Humanmedizin wichtige E. coli mit Cephalosporin-Resistenzen (sogenannte ESBL/ AmpC produzierende E. coli ), die oft auch gegen andere Antibiotika resistent sind (Multiresistenz), sank die Resistenzrate bei Mastpoulets erneut deutlich (auf 4,3 % im Jahr 2022), stagnierte bei Schweinen (6,2 % im Jahr 2023), stieg aber bei Kälbern (32,7 % im Jahr 2023).
Seit 2020 gab es einen weiteren Rückgang von ESBL/ AmpC-produzierenden E. coli bei Pouletfleischproben aus dem Detailhandel. Beim Pouletfleisch schweizerischer Herkunft waren es 4,2 % der Proben bei Pouletfleisch ausländischer Herkunft 47,4 % im Jahr 2022. Damit sind die Nachweisraten seit 2014 stark zurückgegangen, sowohl bei Pouletfleisch schweizerischer Herkunft (2014: 65,5 %) als auch bei solchem ausländischer Herkunft (2014: 85,6 %).
Im 2022 wurde erstmals Trutenfleisch aus dem Detailhandel untersucht. In 25,7 % der ausländischen Trutenfleischproben wurden ESBL/AmpC produzierende E. coli nachgewiesen, keine bei den Trutenfleischproben aus der Schweiz. In Schweine- oder Rindfleisch aus dem Detailhandel sind diese Werte seit Jahren sehr niedrig (etwa 1 %). Bei importiertem Rindfleisch wurden keine ESBL/AmpC produzierenden E. coli nachgewiesen.
Auch auf Methicillin-resistente S. aureus (MRSA) wird untersucht. Während 2009 nur 2 % der Proben von Mastschweinen MRSA aufwiesen, stieg ihre Nachweisrate bis
Zusammenfassung
2019 auf etwa 53,6 % und stagniert seitdem (2023: 53,5 %). Bei diesen MRSA handelt es sich um sogenannte «tierassoziierte» MRSA, ein Übertragungsrisiko besteht nur für Personen mit regelmässigem, engem Kontakt zu Schweinen. Die MRSA-Prävalenz in Mastkälbern ist konstant auf einem niedrigen Niveau (unter 10 %).
Resistenzen bei Campylobacter sind bei Poulet stabil
Die Infektion mit Campylobacter -Bakterien ist die häufigste Zoonose in der Schweiz und anderen europäischen Ländern. Campylobacter wird häufig durch Lebensmittel, insbesondere frisches Pouletfleisch, übertragen und verursacht Magen-Darm-Erkrankungen. Eine Infektion mit bakteriellen Lebensmittelkeimen lässt sich durch die sorgfältige Beachtung einfacher Hygieneregeln in der Küche vermeiden.
Die beim Schweizer Mastpoulet nachgewiesenen Resistenzen gegen Fluorchinolone in Campylobacter (C. jejuni) lagen 2022 in Mastpoulets bei 45,7 % und sind damit seit 2018 auf hohem Niveau stabil. Die Resistenzraten gegen Makrolide (Antibiotikaklasse zur Behandlung schwerer Formen von Campylobacter -Infektionen) bleiben auf einem niedrigen Niveau (unter 5 %).
Bei erkrankten Nutz- und Heimtieren entwickeln sich Antibiotikaresistenzen unterschiedlich Das Spektrum potenziell Krankheit verursachender Bakterien bei Nutz- und Heimtieren ist sehr breit. Damit ist auch die Resistenzsituation je nach Bakterienart und betroffener Tierart sehr unterschiedlich. Für krankmachende E. coli aus Mastpoulet ist ein Rückgang der Resistenzrate gegenüber Fluorochinolonen auf 20 % zu verzeichnen. Generell zeigen die untersuchten Bakterien aus Hunden und Katzen eine hohe Resistenzrate gegenüber Aminopenicillinen. Resistenzraten gegenüber anderen Antibiotikaklassen bewegen sich unter 20 %. Krankmachende Bakterien aus Euterentzündungen bei der Kuh sind in der Regel empfindlich gegenüber Penicillinen (mit Ausnahme von S. aureus ).
Neue Methoden ermöglichen ein besseres Verständnis der Verbreitung der Carbapenem-Resistenzen Carbapeneme sind wichtige Reserveantibiotika für schwere Infektionen und sollten daher möglichst zurückhaltend eingesetzt werden. Carbapenemase-produzierende Enterobakterien (CPE) sind resistent gegen Carbapeneme. Diese multiresistenten Erreger stellen eine besondere Bedrohung für die öffentliche Gesundheit dar, es besteht daher eine Meldepflicht im Humanbereich. Im Vergleich mit den EU-Ländern ist die Resistenz gegen Carbapeneme in der Schweiz auf niedrigem Niveau, steigt aber an. So hat beispielsweise die Resistenzrate beim Enterobakterium K. pneumoniae , welches insbesondere in Spitälern übertragen wird, 2023 zum ersten Mal 1 % überschritten. Zudem werden in den letzten Jahren vermehrt Carbapenem-resis -
tente K. pneumoniae gefunden, die auch besonders virulent (krankmachend) sind.
Aufgrund der Bedeutung von CPE in der Humanmedizin werden diese auch in Tieren überwacht. Bei gesunden Schweizer Nutztieren konnten nach wie vor keine CPE nachgewiesen werden. Allerdings werden vermehrt CPE in Proben von Haustieren identifiziert. Mithilfe von DNA-Sequenzierungen (Whole Genome Sequencing, WGS) haben Forschende die Verbreitung von CPE in Heimtierkliniken untersucht. Es zeigte sich, dass ein leicht übertragbares DNA-Stück, ein sogenanntes Plasmid für die Verbreitung der Carbapenem-Resistenz zwischen Enterobakterien bei den Haustieren verantwortlich ist und dass dieses auch auf das Personal in den Tierkliniken übertragen werden kann. Es besteht deshalb die Befürchtung, dass diese CPE auch auf Nutztiere übertragen werden und in die Lebensmittelkette gelangen könnten. Um dies zu verhindern, braucht es auch in Heimtierkliniken Überwachungs- und Hygienemassnahmen.
[1] European Centre for Disease Prevention and Control. Antimicrobial consumption in the EU/EEA (ESAC-Net) - Annual Epidemiological Report 2022. Stockholm: ECDC; 2023. https://www.ecdc.europa.eu/sites/ default/files/documents/AER-antimicrobialconsumption.pdf
[2] Gasser et al: Associated deaths and disability-adjusted life-years caused by infections with antibiotic-resistant bacteria in Switzerland, 2010 to 2019, Euro Surveill. 2023;28(20). https://doi.org/10.2807/15607917.ES.2023.28.20.2200532
2 Résumé
Lorsque les bactéries deviennent moins sensibles, voire insensibles, aux antibiotiques, nous parlons de résistance aux antibiotiques. Les bactéries résistantes peuvent compliquer le traitement d’infections, voire l’empêcher. C’est pourquoi la Stratégie Antibiorésistance Suisse (StAR), lancée en 2015, vise à promouvoir une utilisation responsable des antibiotiques et à freiner la propagation des résistances. Le nouveau Plan d’action One Health 2024–2027 de la StAR vient renforcer ces efforts. La surveillance des résistances et du recours aux antibiotiques chez l’être humain, les animaux de rente et de compagnie et dans l’environnement est un élément clé de la stratégie et du plan d’action. Les résultats sont publiés tous les deux ans dans le rapport suisse sur la résistance aux antibiotiques, le Swiss Antibiotic Resistance Report (SARR) (disponible en anglais).
Évolution de l’usage des antibiotiques
Chaque fois que l’on prend des antibiotiques, des bactéries résistantes peuvent apparaître. C’est pourquoi il est crucial d’utiliser correctement ces produits chez l’être humain et l’animal. Il faut d’une part y recourir autant que nécessaire, mais aussi peu que possible. D’autre part, il importe d’utiliser le bon produit au dosage adéquat et sur une durée appropriée. De ce fait, la distribution et l’emploi d’antibiotiques font l’objet d’une surveillance et d’analyses.
L’utilisation d’antibiotiques en médecine humaine est repartie à la hausse après la pandémie de COVID-19 En médecine humaine, la consommation globale d’antibiotiques (cabinets médicaux et hôpitaux) s’est élevée à 10,8 doses définies journalières par 1000 habitants et par jour (DID) en 2023. Après un net recul durant la pandémie de COVID-19 (2021 : 8,6 DID), la consommation a donc retrouvé à peu près son niveau de 2019 (10,6 DID, +3 %). La grande vague d’infections des voies respiratoires enregistrée en hiver/printemps 2023 a probablement joué un rôle à cet égard. En comparaison européenne, la Suisse reste toutefois l’un des pays où l’usage d’antibiotiques est le plus faible (pays de l’UE en 2022 : 9,1 DID min., 33,5 DID max. et 19,4 DID Ø [1]). L’objectif du plan d’action One Health de StAR est de réduire la consommation à 10,2 DID d’ici 2027.
Depuis 2014, l’utilisation des antibiotiques particulièrement critiques de la classe Watch a baissé de 26 % (2014 : 4,9 DID ; 2022 : 3,4 DID ; 2023 : 3,6 DID). En conséquence, la part des produits moins critiques de la classe Access, à utiliser en premier recours, a progressé pour atteindre 66 % de la consommation totale. Depuis 2019, la Suisse dépasse ainsi la valeur cible de 60 % fixée par l’Organisation mondiale de la santé (OMS). Le plan d’action a pour objectif d’améliorer encore ce taux en le portant à 69 %.
En Suisse, 87 % des antibiotiques sont utilisés en cabinet contre 13 % en milieu hospitalier
La majeure partie des antibiotiques est utilisée dans le secteur ambulatoire (notamment dans les cabinets médicaux).
La consommation par personne (9,4 DID) a nettement augmenté après la pandémie de COVID-19 (2021 : 7,3 DID ; 2022 : 8,7 DID) quand bien même elle reste plutôt modeste en comparaison internationale. En 2022, au niveau européen, seuls les Pays-Bas ont enregistré un taux inférieur dans le secteur ambulatoire (8,3 DID). La moyenne au sein de l’UE était de 17,0 DID.
La Suisse connaît de grandes disparités régionales en matière de recours aux antibiotiques : il s’élève à 7,8 DID par personne en Suisse alémanique, contre 13,1 DID en Suisse romande et 12,4 DID au Tessin. Le plan d’action vise à réduire de moitié les différences régionales actuelles. En 2023, la plupart des antibiotiques prescrits par les médecins de famille l’ont été pour des affections des voies respiratoires supérieures (30 %) et pour des infections urinaires (28 %). Des antibiotiques non recommandés par les directives nationales ont été utilisés dans environ 20 % des cas.
Dans le secteur hospitalier, l’utilisation d’antibiotiques par habitant était de 1,4 DID en 2023 (inchangée par rapport à 2022), ce qui correspond à peu près à la moyenne des pays européens (2022 : 1,6 DID). Elle est donc légèrement inférieure à la période précédant la pandémie de COVID-19 (2019 : 1,5 DID). Environ un tiers des patients hospitalisés ont reçu un antibiotique en 2023.
Le recours aux antibiotiques continue de reculer en médecine vétérinaire
Les antibiotiques sont aussi utilisés pour traiter les infections bactériennes des animaux de rente et de compagnie (24 tonnes au total en 2023, dont 3 % pour les animaux de compagnie). La quantité totale d’antibiotiques vendus aux vétérinaires a encore diminué de 14 % par rapport à 2021. L’utilisation d’antibiotiques a ainsi baissé de 48 % depuis 2014. En particulier, l’administration d’antibiotiques dits critiques, qui sont particulièrement importants en médecine humaine, a continué de reculer depuis 2021. Depuis 2014, elle a diminué de 76 % chez les animaux de rente et de 19 % chez les animaux de compagnie. En comparaison européenne, la Suisse fait partie des pays affichant une consommation relativement faible. D’ici 2027, elle s’est fixé pour objectif de figurer parmi les cinq meilleurs pays européens en ce qui concerne les antibiotiques critiques.
Depuis 2019, le système d’information sur les antibiotiques en médecine vétérinaire (SI ABV) recense toutes les prescriptions d’antibiotiques dans ce secteur. Les données montrent que les vétérinaires suisses recourent principalement des antibiotiques de premier recours pour toutes les espèces animales, ce qui prouve le respect des directives de
traitement. En comparaison des différentes espèces, les bovins reçoivent le plus de traitements antimicrobiens (564 traitements pour 1000 animaux ; volailles : 76, porcs : 23).
Les bovins ont avant tout été traités pour des maladies de la mamelle (30,3 %), les porcs pour des infections gastro-intestinales (53,6 %), les volailles pour des maladies de jeunesse (85 %), les ovins/caprins pour des maladies respiratoires (32 %), les équidés pour des affections de l’appareil locomoteur (34 %), les chiens et les chats pour des affections dermatologiques (24,5 % et 28,5 % respectivement). Au fil du temps, la répartition du nombre de prescriptions est restée assez constante pour les différentes maladies de chaque espèce animale.
Les antibiotiques dans l’environnement
Il est possible de réduire la pollution antibiotique des cours d’eau, des lacs et des eaux souterraines en modernisant les stations d’épuration
Les humains et les animaux excrètent une partie des antibiotiques consommés, qui se retrouve alors dans les eaux usées, les cours d’eau et les sols. La concentration diminue par dilution lors du passage des eaux usées dans les cours d’eau. Elle diminue encore plus au passage dans les nappes phréatiques, car les berges et le sol éliminent partiellement et filtrent les antibiotiques.
Les stations d’épuration classiques n’éliminent qu’une partie des antibiotiques. Les doter d’une étape de traitement supplémentaire servant à éliminer les micropolluants permet de diviser les concentrations mesurées par dix. En 2024, environ 15 % des eaux usées bénéficiaient de ce type de traitement en Suisse, et il est prévu de porter ce taux à 70 % d’ici 2040. Des mesures réalisées dans le Furtbach (AG/ZH) ont montré que la modernisation d’une station d’épuration a permis de réduire suffisamment la concentration d’antibiotiques pour respecter le seuil des normes de qualité environnementale. Selon l’état actuel des connaissances, il est peu probable que les antibiotiques mesurés dans les eaux suisses favorisent directement le développement de résistances.
Évolution des résistances
De nombreux microorganismes se trouvent naturellement dans l’environnement ainsi que sur la peau, sur les muqueuses ou dans l’intestin. Les êtres humains et les animaux en ont besoin (notamment pour la digestion). Cependant, ces microorganismes peuvent provoquer une infection s’ils pénètrent dans l’organisme et se multiplient excessivement, ce qui arrive surtout lorsque la peau ou les muqueuses sont abimées ou en cas d’immunodéficience.
Si, en plus, les bactéries responsables de l’infection sont résistantes à certains antibiotiques, il devient plus difficile, voire impossible, de traiter l’infection.
En Suisse, les autorités surveillent les taux de résistance chez l’être humain et chez l’animal depuis une vingtaine d’années. Elles les recensent en fonction des bactéries et des classes d’antibiotiques. Les données montrent des tendances différentes chez les principaux agents pathogènes et antibiotiques : alors que l’antibiorésistance de certaines bactéries a considérablement augmenté, elle est restée stable ou a même diminué pour d’autres. Dans l’ensemble, une stabilisation semble se dessiner ces dernières années.
En médecine humaine, le taux d’antibiorésistance s’est stabilisé
Parmi les principaux agents pathogènes résistants figure le Staphylococcus aureus résistant à la méticilline (SARM). Le taux de résistance des SARM est passé de 10 % à 4 % depuis 2005 et a continué de baisser légèrement ces dernières années. Le taux de résistance des S. pneumoniae à la pénicilline est resté stable à un bas niveau (4 %).
Relativement stables depuis 2015, les taux de résistance aux fluoroquinolones et aux céphalosporines chez les bactéries E. coli et Klebsiella pneumoniae ont toutefois légèrement augmenté en 2022 et 2023. Si la résistance aux céphalosporines augmente, il faudra davantage recourir à la classe d’antibiotiques des carbapénèmes (voir le passage consacré à ces produits).
En milieu hospitalier, la bactérie C. difficile représente un danger. L’usage d’antibiotiques, qui endommagent la flore intestinale naturelle, favorise les infections à C. difficile , qui se multiplie plus facilement. Une étude menée à l’Hôpital de l’Île à Berne a montré qu’une réduction du recours aux antibiotiques s’est accompagnée d’une baisse du nombre d’infections à C. difficile
Une modélisation des données d’antibiorésistance permet d’estimer la charge de morbidité et le nombre de décès liés aux résistances. Pour la Suisse, on évalue la charge de morbidité à environ 85 infections pour 100 000 habitants et le nombre de décès dus à des infections causées par des agents pathogènes résistants [2] à 300 chaque année. Proportionnellement à sa population, la Suisse est donc moins touchée par l’antibiorésistance que la France ou l’Italie, mais plus que les Pays-Bas et les pays scandinaves.
Surveillance des résistances chez les animaux
Deux systèmes différents assurent la surveillance de l’antibiorésistance chez les animaux. Afin d’évaluer les risques pour les humains, des bactéries commensales indicatrices et des bactéries zoonotiques font l’objet d’un monitorage chez les animaux de boucherie en bonne santé et dans la
viande. Normalement, ces bactéries ne sont pas pathogènes par elles-mêmes, mais elles peuvent transmettre des résistances à d’autres bactéries, y compris celles susceptibles de provoquer des maladies chez l’être humain. La surveillance des bactéries indicatrices, notamment E. coli, chez les animaux de boucherie et dans la viande est donc un instrument utile pour observer l’évolution des résistances. Les bactéries zoonotiques peuvent pour leur part se transmettre à l’être humain par les animaux ou les aliments. Elles provoquent des maladies infectieuses appelées zoonoses.
En outre, depuis 2019, on surveille les résistances de bactéries pathogènes pour les animaux de rente et de compagnie. Ces données permettent d’orienter le choix des antibiotiques utilisés pour le traitement.
L’antibiorésistance évolue de manière différente chez les animaux de boucherie et dans la viande En ce qui concerne les bactéries E. coli présentes dans l’intestin des poulets et des porcs d’engraissement ainsi que des veaux de boucherie, les taux de résistance ont connu une évolution variable entre 2021 et 2023. On constate une baisse des taux de résistance des E. coli aux fluoroquinolones chez les poulets ; ils sont passés à 34 %, alors qu’ils sont restés stables chez les porcs et les veaux, à moins de 10 %. Les taux de résistance aux tétracyclines et aux sulfamides sont en baisse chez toutes les espèces d’animaux de rente. En ce qui concerne les E. coli productrices de ESBL/ AmpC, qui sont résistantes aux céphalosporines, antibiotiques importants pour la médecine humaine, mais souvent aussi à d’autres antibiotiques (multirésistance), le taux de résistance a de nouveau nettement baissé chez les poulets (à 4,3 % en 2022), tandis qu’il a stagné chez les porcs (6,2 % en 2023) et augmenté chez les veaux (32,7 % en 2023).
Depuis 2020, on observe un nouveau recul de la présence d’E. coli productrices d’ESBL/AmpC dans les échantillons de viande de poulet provenant du commerce de détail. En 2022, ce taux était de 4,2 % dans la viande de poulet d’origine suisse, contre 47,4 % dans le poulet d’origine étrangère. Les taux mis en évidence ont donc fortement diminué depuis 2014, tant dans la viande de poulet d’origine suisse (2014 : 65,5 %) que dans celle provenant de l’étranger (2014 : 85,6 %).
La viande de dinde vendue dans le commerce de détail a fait l’objet d’une première analyse en 2022. Des E. coli productrices d’ESBL/AmpC ont été détectées dans 25,7 % des échantillons de dindes provenant de l’étranger, mais dans aucun des échantillons suisses. Depuis de nombreuses années, ces valeurs sont très faibles dans la viande de porc ou de bœuf vendue au détail (environ 1 %). Aucune E. coli productrice d’ESBL/AmpC n’a été recensée dans la viande de bœuf importée.
Les analyses englobent aussi les SARM. En 2009, seuls 2 % des écouvillons nasaux provenant de porcs d’engraissement étaient porteurs de SARM, mais ce taux a ensuite augmenté, pour atteindre 53,6 % en 2019 et se stabiliser par la suite (53,5 % en 2023). Ces SARM associés aux animaux ne présentent un risque de transmission que pour les personnes en contact étroit et régulier avec des porcs. La prévalence des SARM chez les veaux d’engraissement est stable à un faible niveau (moins de 10 %).
Les résistances de Campylobacter sont stables chez la volaille
La majorité des zoonoses en Suisse et dans d’autres pays européens sont provoquées par les bactéries du genre
Campylobacter. Celles-ci sont souvent transmises par les aliments, notamment la viande de poulet fraîche, et provoquent des troubles gastro-intestinaux. On peut éviter les infections dues aux bactéries dans les denrées alimentaires en respectant des règles d’hygiène simples en cuisine.
Le taux de résistance des Campylobacter (C. jejuni) aux fluoroquinolones recensé chez le poulet d’engraissement d’origine suisse était de 45,7 % en 2022, un niveau élevé mais stable depuis 2018. Le taux de résistance de ces bactéries aux macrolides (antibiotiques utilisés pour traiter les formes graves d’infections à Campylobacter ) reste faible, soit inférieur à 5 %.
Les résistances aux antibiotiques chez les animaux de rente et les animaux de compagnie présentent un tableau contrasté
Le spectre des agents potentiellement pathogènes chez les animaux de rente et de compagnie est très large. Par conséquent, la situation en matière de résistance varie considérablement en fonction des espèces bactériennes et animales concernées. Le taux de résistance aux fluoroquinolones a baissé, passant à 20 % chez les E. coli pathogènes dans les poulets d’engraissement. De manière générale, les bactéries étudiées chez les chiens et les chats présentent un taux de résistance élevé aux aminopénicillines, tandis que la résistance à d’autres antibiotiques est inférieure à 20 %.
Les bactéries pathogènes provenant d’inflammations de la mamelle chez la vache sont généralement sensibles aux pénicillines (à l’exception de Staphylococcus aureus ).
De nouvelles méthodes permettent de mieux comprendre la diffusion des résistances aux carbapénèmes
Les carbapénèmes sont des antibiotiques de dernier recours importants pour le traitement d’infections graves, qui doivent donc être utilisés avec beaucoup de retenue. Les entérobactéries productrices de carbapénèmases (EPC) sont résistantes aux carbapénèmes. Ces agents pathogènes multirésistants constituent une menace particulière pour la santé publique, raison pour laquelle leur déclaration
est obligatoire en médecine humaine. Si la résistance aux carbapénèmes en Suisse est plutôt faible en comparaison européenne, elle tend néanmoins à augmenter. Ainsi, le taux de résistance de l’entérobactérie Klebsiella pneumoniae , qui se transmet notamment en milieu hospitalier, a dépassé pour la première fois la barre de 1 % en 2023. En outre, on a détecté ces dernières années un nombre accru de Klebsiella pneumoniae résistantes aux carbapénèmes, qui sont aussi particulièrement virulentes (pathogènes).
En raison de la menace qu’ils présentent en médecine humaine, les EPC font également l’objet d’une surveillance chez les animaux. À ce jour, aucune EPC n’a été détectée chez les animaux de rente suisses en bonne santé. Toutefois, on détecte de plus en plus d’EPC dans des échantillons d’animaux de compagnie. À l’aide de techniques de séquençage de l’ADN (Whole Genome Sequencing, WGS), des équipes de recherche ont étudié la propagation des EPC dans les cliniques pour animaux de compagnie. Elles ont découvert que le plasmide, un fragment d’ADN facilement transmissible, était responsable de la propagation de la résistance aux carbapénèmes entre les entérobactéries chez les animaux de compagnie, et qu’il peut aussi se transmettre au personnel des cliniques vétérinaires. Dès lors, il est à craindre que les EPC se transmettent également aux animaux de rente et qu’ils entrent ainsi dans la chaîne alimentaire. Pour prévenir une telle évolution, il importe de prendre des mesures de surveillance et d’hygiène dans les cliniques traitant des animaux de compagnie.
[1] Centre européen de prévention et de contrôle des maladies (ECDC). Antimicrobial consumption in the EU/EEA (ESAC-Net) - Annual Epidemiological Report 2022. Stockholm: ECDC; 2023. https://www.ecdc. europa.eu/sites/default/files/documents/AERantimicrobial-consumption.pdf
[2] Gasser et al: Associated deaths and disability-adjusted life-years caused by infections with antibiotic-resistant bacteria in Switzerland, 2010 to 2019, Euro Surveill. 2023;28(20). https://doi.org/10.2807/1560-7917. ES.2023.28.20.2200532
2 Sintesi
Per resistenza agli antibiotici s’intende la riduzione parziale o completa della sensibilità dei batteri all’azione di un antibiotico. La presenza di batteri resistenti può complicare o persino impedire il trattamento delle infezioni. Per questo motivo, nel 2015 è stata avviata la Strategia svizzera contro le resistenze agli antibiotici (StAR) al fine di promuovere un uso responsabile degli antibiotici e frenare la diffusione delle resistenze. Questi sforzi sono ulteriormente rafforzati dal nuovo piano d’azione One Health 2024–2027 della StAR. Il monitoraggio dell’uso di antibiotici e delle resistenze nell’essere umano, negli animali da reddito e da compagnia nonché nell’ambiente è una parte importante della strategia e del piano d’azione. I risultati di tale monitoraggio sono riassunti ogni due anni nel rapporto intitolato Swiss Antibiotic Resistance Report (SARR).
Evoluzione del consumo di antibiotici
Ogni qual volta si impiegano antibiotici possono svilupparsi batteri resistenti, perciò è cruciale che questi medicamenti siano usati nel modo più corretto possibile sia nell’essere umano che negli animali. Gli antibiotici vanno impiegati quando serve e quanto serve. È importante anche utilizzare l’antibiotico giusto nella quantità corretta e per la durata opportuna. Pertanto la vendita e l’uso di antibiotici sono monitorati e analizzati.
Nuovo aumento del consumo di antibiotici nella medicina umana dopo la pandemia di COVID-19
Per quanto riguarda la medicina umana, nel 2023 il consumo complessivo di antibiotici (studi medici e ospedali) è stato di 10,8 dosi definite giornaliere (DDD, Defined Daily Doses) ogni 1000 abitanti al giorno (DID). Dopo una forte contrazione durante la pandemia di COVID-19 (2021: 8,6 DID), il consumo è quindi tornato a un livello simile a quello del 2019 (10,6 DID, +3%). Si ritiene che la forte ondata di malattie delle vie respiratorie nell’inverno/primavera 2023 abbia avuto un ruolo significativo. Nel confronto europeo, la Svizzera resta tra i Paesi che consumano meno antibiotici (consumo nei Paesi UE nel 2022: min. 9,1 DID, max. 33,5 DID, Ø 19,4 DID [1]). L’obiettivo del piano d’azione svizzero della StAR è quello di abbassare il consumo a 10,2 DID entro il 2027.
Per gli antibiotici del gruppo «Watch», considerati altamente critici, dal 2014 si è assistito a un calo del 26% (2014: 4,9 DID; 2022: 3,4 DID; 2023: 3,6 DID). Di conseguenza, la quota degli antibiotici del gruppo «Access», ritenuti meno critici e che dovrebbero essere prescritti come prima scelta, è aumentata al 66% del consumo totale. Dal 2019 la Svizzera supera pertanto il valore target del 60% indicato dall’Organizzazione mondiale della sanità (OMS). L’obiettivo del piano d’azione è un ulteriore incremento della quota al 69%.
Impiego degli antibiotici in Svizzera: tasso dell’87% negli studi medici e del 13% negli ospedali La maggior parte degli antibiotici è impiegata nel settore ambulatoriale (soprattutto negli studi medici). Il consumo pro capite (9,4 DID) è aumentato sensibilmente dopo la pandemia di COVID-19 (2021: 7,3 DID; 2022: 8,7 DID), ma nel confronto internazionale è ancora relativamente basso: nell’UE, nel 2022 solo i Paesi Bassi hanno registrato un consumo inferiore nel settore ambulatoriale (8,3 DID). La media europea si attesta a 17,0 DID.
In Svizzera esistono forti differenze regionali: nella Svizzera tedesca il consumo di antibiotici per abitanti (7,8 DID) è inferiore rispetto alla Svizzera francese (13,1 DID) e alla Svizzera italiana (12,4 DID). L’obiettivo del piano d’azione è di ridurre queste differenze regionali. Nel 2023, i medici di famiglia hanno impiegato la maggioranza degli antibiotici per malattie delle vie respiratorie superiori (30%) e per infezioni delle vie urinarie (28%). Nel 20% circa delle prescrizioni sono state impiegate classi di antibiotici non raccomandate dalle linee guida nazionali.
Negli ospedali svizzeri, il consumo pro capite di 1,4 DID nel 2023 (2022: sempre 1,4 DID) corrisponde all’incirca alla media dei Paesi UE (2022: 1,6 DID) ed è leggermente inferiore rispetto a prima della pandemia di COVID-19 (2019: 1,5 DID). Nel 2023, circa un terzo dei pazienti ospedalizzati ha ricevuto un antibiotico.
Ulteriore calo del consumo di antibiotici nella medicina veterinaria
Gli antibiotici sono impiegati per il trattamento di infezioni batteriche negli animali da reddito e da compagnia (nel 2023 24 tonnellate in totale, di cui il 3% per animali da compagnia). La quantità totale degli antibiotici venduti ai veterinari è diminuita di un ulteriore 14% rispetto al 2021. Il consumo di antibiotici è quindi stato ridotto del 48% dal 2014. Dal 2021 è calata ancora soprattutto la vendita dei cosiddetti antibiotici critici, particolarmente importanti per la medicina umana; per gli animali da reddito, rispetto al 2014 la flessione è del 76%, mentre per gli animali da compagnia, negli ultimi dieci anni la vendita di antibiotici è diminuita del 19%. Nel confronto europeo, la Svizzera è tra i Paesi con un consumo di antibiotici relativamente basso. Per quanto riguarda la vendita di antibiotici critici, l’obiettivo è risultare tra i cinque Paesi migliori in Europa entro il 2027.
Dal 2019, tutte le prescrizioni di antibiotici dei veterinari svizzeri sono registrate nel Sistema d’informazione sugli antibiotici (SI AMV). L’analisi di questi dati indica che per tutte le specie animali si impiegano principalmente antibiotici di prima scelta, il che dimostra che i veterinari svizzeri si attengono alle linee guida terapeutiche. Rispetto alle altre specie animali, i bovini sono trattati più spesso con antibiotici (bovini: 564 trattamenti ogni 1000 animali; pollame: 76; suini: 23).
Ai bovini sono stati somministrati agenti antimicrobici prevalentemente contro le malattie delle mammelle (30,3%), ai suini contro le infezioni gastrointestinali (53,6%), al pollame contro le malattie degli animali giovani (85%), ai caprini e agli ovini contro le malattie delle vie respiratorie (32%), agli equini contro le malattie dell’apparato locomotore (34%), ai cani e ai gatti contro le malattie cutanee (24,5% risp. 28,5%). Nel corso degli anni, la distribuzione dell’uso di antibiotici sulle varie malattie è rimasta relativamente costante per ogni specie.
Antibiotici nell’ambiente
Riduzione della presenza di antibiotici in fiumi, laghi e acque sotterranee grazie al potenziamento degli impianti di depurazione
Gli antibiotici assunti da esseri umani e animali vengono in parte espulsi e finiscono poi nelle acque reflue, nei corsi d’acqua e nel suolo. Le concentrazioni di antibiotici misurate si riducono per diluizione nel passaggio dalle acque reflue ai fiumi e diminuiscono ulteriormente quando raggiungono le acque sotterranee poiché gli antibiotici sono parzialmente degradati o trattenuti dagli argini o dal suolo.
Gli impianti di depurazione convenzionali riescono a eliminare gli antibiotici solo in parte. Ulteriori processi di trattamento delle acque al fine di eliminare le microimpurità possono per contro ridurre di dieci volte le concentrazioni di antibiotici misurate. Nel 2024 è stato sottoposto a uno stadio di trattamento aggiuntivo il 15% delle acque reflue svizzere, ed entro il 2040 la percentuale dovrebbe salire al 70%. Misurazioni nel Furtbach (AG/ZH) evidenziano che il potenziamento di un impianto di depurazione riduce la concentrazione di antibiotici al punto che il valore limite delle norme concernenti la qualità dell’ambiente non viene più superato. Allo stato attuale delle conoscenze, è improbabile che le concentrazioni di antibiotici misurate nelle acque svizzere favoriscano direttamente lo sviluppo di resistenze.
Situazione delle resistenze
Numerosi microrganismi si trovano naturalmente nell’ambiente come pure sulla pelle, sulle mucose o nell’intestino di esseri umani e animali (p. es. per la digestione). Se tuttavia tali batteri si introducono in altre parti nel corpo e si moltiplicano in maniera incontrollata, si parla di infezione. È quanto avviene per esempio in caso di lesioni della pelle o delle mucose o in caso di immunodeficienza. Se i batteri che causano l’infezione sono resistenti a determinati antibiotici, il trattamento diventa complicato o addirittura impossibile.
Da circa 20 anni in Svizzera si rilevano i tassi di resistenza negli esseri umani e negli animali. Tali tassi sono sempre indicati per un determinato batterio e una classe di antibiotici. Per quanto riguarda gli agenti patogeni e gli antibiotici più importanti, emergono tendenze differenti: per alcuni batteri, la resistenza agli antibiotici è aumentata notevolmente, mentre per altri è rimasta invariata o è diminuita. Nel complesso, negli ultimi anni si sta delineando una stabilizzazione dei tassi di resistenza.
Stabilizzazione dei tassi di resistenza nella medicina umana
Tra gli agenti resistenti più importanti vi è lo S. aureus resistente alla meticillina (MRSA), il cui tasso di resistenza è calato dal 10 al 4% dal 2005 ed è diminuito leggermente anche negli ultimi anni. Il tasso di resistenza dello S. pneumoniae resistente alle penicilline si attesta costantemente a un livello basso (4%).
I tassi di resistenza alle classi di antibiotici dei fluorochinoloni e delle cefalosporine negli agenti E. coli e K. pneumoniae sono relativamente stabili dal 2015, tuttavia nel 2022 e nel 2023 sono aumentati leggermente. Se aumenta la resistenza alle cefalosporine, è necessario fare più spesso ricorso alla classe di antibiotici dei carbapenemi (v. cap. separato sulla resistenza ai carbapenemi).
Le infezioni da C. difficile rappresentano un pericolo negli ospedali e sono favorite dall’uso di antibiotici, perché questi danneggiano la flora intestinale naturale consentendo al C. difficile di moltiplicarsi. Uno studio condotto presso l’Inselspital di Berna mostra che la riduzione dell’uso di antibiotici ha portato anche a una diminuzione delle infezioni da C. difficile
Sulla base dei dati relativi alle resistenze, mediante una modellizzazione è possibile stimare il carico di malattia e il numero di decessi dovuti alle stesse. Per la Svizzera si calcola che il carico di malattia sia di 85 infezioni per 100 000 abitanti e che ogni anno circa 300 persone muoiano a causa di infezioni da agenti resistenti [2]. Proporzionalmente alla popolazione, la Svizzera è quindi meno colpita da infezioni causate da batteri resistenti rispetto alla Francia o all’Italia, ma lo è di più rispetto ai Paesi Bassi o ai Paesi scandinavi.
Monitoraggio delle resistenze negli animali
Il monitoraggio dei tassi di resistenza negli animali avviene tramite due diversi sistemi. Per stimare il potenziale rischio per l’essere umano, si monitorano i batteri indicatori commensali nonché i batteri zoonotici negli animali da macello sani e nella carne. Normalmente i batteri indicatori commensali non causano malattie, ma possono trasmettere le resistenze ad altri batteri, compresi quelli che possono provocare malattie nell’essere umano. Il monitoraggio di batteri indicatori, in particolare l’E. coli, negli animali da macello
e nella carne offre pertanto una buona visione d’insieme dell’evoluzione delle resistenze. I batteri zoonotici possono essere trasmessi all’essere umano da animali o da alimenti. Le malattie così provocate sono note come zoonosi.
Inoltre, dal 2019 si monitorano le resistenze di batteri patogeni per gli animali da reddito e da compagnia. Tali dati fungono da orientamento per la scelta degli antibiotici da impiegare per i trattamenti.
Evoluzione diversa delle resistenze agli antibiotici negli animali da macello e nella carne
Per quanto riguarda i batteri E. coli nell’intestino di polli e suini da ingrasso nonché di vitelli da macello, tra il 2021 e il 2023 l’andamento dei tassi di resistenza non è stato uniforme. Nei polli è stata registrata una diminuzione del 34% del tasso di resistenza dell’E. coli ai fluorochinoloni. Nei suini e nei vitelli da ingrasso, tale tasso di resistenza resta invariato al di sotto del 10%. I tassi di resistenza alle tetracicline e ai sulfamidici sono in calo in tutte le specie di animali da reddito. Negli E. coli resistenti alle cefalosporine (importanti per la medicina umana), ovvero i cosiddetti E. coli produttori di ESBL/AmpC, spesso resistenti anche ad altri antibiotici (multiresistenza), il tasso di resistenza è diminuito ancora sensibilmente nei polli (al 4,3% nel 2022) ed è rimasto costante nei suini (6,2% nel 2023), ma è aumentato nei vitelli (32,7% nel 2023).
Dal 2020 vi è stato un ulteriore calo degli E. coli produttori di ESBL/AmpC nei campioni di carne di pollo prelevati dal commercio al dettaglio. Nel 2022, nel caso della carne di pollo di provenienza svizzera tali batteri erano presenti nel 4,2% dei campioni contro il 47,4% nella carne di pollo di provenienza estera. Dal 2014 i tassi di rilevamento sono pertanto diminuiti sensibilmente, sia per la carne di pollo di provenienza svizzera (2014: 65,5%) sia per quella di provenienza estera (2014: 85,6%).
Nel 2022 è stata analizzata per la prima volta la carne di tacchino del commercio al dettaglio. È stata rilevata la presenza di E. coli produttori di ESBL/AmpC nel 25,7% dei campioni di carne di tacchino estera e in nessun campione di carne di tacchino svizzera. Nelle carni suine e bovine in vendita nel commercio al dettaglio, da anni tali valori sono molto contenuti (circa l’1%). Nella carne bovina importata non sono stati riscontrati E. coli produttori di ESBL/AmpC.
Sono stati analizzati anche gli S. aureus resistenti alla meticillina (MRSA). Se nel 2009 solo il 2% dei suini da ingrasso risultava positivo all’MRSA, nel 2019 il tasso di rilevamento era salito al 53,6% circa e da allora è rimasto costante (2023: 53,5%). Si tratta di MRSA associati agli animali, per cui sussiste un rischio di trasmissione solo per le persone a stretto e regolare contatto con suini. Nei vitelli da ingrasso, la prevalenza di MRSA è costantemente bassa (sotto il 10%).
Resistenza dei Campylobacter stabile nel pollame In Svizzera e in altri Paesi europei, l’infezione da Campylobacter è la zoonosi più frequente. Il Campylobacter è spesso trasmesso attraverso gli alimenti, in particolare la carne di pollo fresca, e provoca affezioni gastrointestinali. Per evitare un’infezione da batteri alimentari è sufficiente seguire attentamente alcune semplici norme igieniche in cucina.
Nel 2022, i Campylobacter (C. jejuni) resistenti ai fluorochinoloni rilevati nei polli da ingrasso svizzeri erano pari al 45,7% e sono quindi stabili a un livello elevato dal 2018. È rimasto invece a un livello basso (sotto il 5%) il tasso di resistenza ai macrolidi (classe di antibiotici impiegata per trattare forme gravi di infezioni da Campylobacter ).
Evoluzione diversa delle resistenze agli antibiotici negli animali da reddito e da compagnia malati Vi è una grande varietà di batteri potenzialmente patogeni negli animali da reddito e da compagnia. Pertanto anche la situazione delle resistenze varia molto a seconda della specie di batterio e della specie animale interessata. Per l’E. coli patogeno, nei polli da ingrasso è stato registrato un calo del 20% del tasso di resistenza ai fluorochinoloni. In generale, i batteri esaminati di cani e gatti presentano un elevato tasso di resistenza alle aminopenicilline. I tassi di resistenza ad altre classi di antibiotici si attestano sotto il 20%. I batteri patogeni delle infezioni alle mammelle nelle mucche sono normalmente sensibili alle penicilline (ad eccezione dello S. aureus ).
Nuovi metodi per comprendere meglio la diffusione delle resistenze ai carbapenemi I carbapenemi sono importanti antibiotici di riserva per il trattamento di infezioni gravi e dovrebbero quindi essere impiegati possibilmente con moderazione. Gli enterobatteri produttori di carbapenemasi (CPE) sono resistenti ai carbapenemi. Questi agenti multiresistenti rappresentano una particolare minaccia per la salute pubblica, per cui vige un obbligo di dichiarazione nell’ambito della medicina umana. Rispetto ai Paesi UE, in Svizzera la resistenza ai carbapenemi è a un livello basso, ma è in aumento. Per esempio, nel 2023 il tasso di resistenza dell’enterobatterio K. pneumoniae , trasmesso soprattutto negli ospedali, ha superato per la prima volta l’1%. Inoltre, negli ultimi anni sono stati rilevati più spesso K. pneumoniae resistenti ai carbapenemi che sono anche particolarmente virulenti (patogeni).
Vista l’importanza dei CPE per la medicina umana, questi sono monitorati anche negli animali. Come in passato, negli animali da reddito svizzeri in salute non sono stati riscontrati CPE. Tuttavia, si individuano più spesso CPE nei campioni di animali domestici. Con l’ausilio del sequenziamento del DNA (Whole Genome Sequencing, WGS), i ricercatori hanno analizzato la diffusione dei CPE nelle cliniche veterinarie per animali da compagnia. È emerso che un pezzo di DNA
facilmente trasmissibile, un cosiddetto plasmide, è responsabile della diffusione della resistenza ai carbapenemi tra gli enterobatteri negli animali domestici e che può essere trasmesso anche al personale delle cliniche veterinarie. Si teme perciò che questi CPE possano essere trasmessi anche agli animali da reddito finendo nella catena alimentare. Per impedirlo, servono misure di monitoraggio e di igiene anche nelle cliniche veterinarie per animali da compagnia.
[1] European Centre for Disease Prevention and Control. Antimicrobial consumption in the EU/EEA (ESAC-Net) - Annual Epidemiological Report 2022. Stockholm: ECDC; 2023. https://www.ecdc.europa.eu/sites/ default/files/documents/AER-antimicrobialconsumption.pdf
[2] Gasser et al: Associated deaths and disability-adjusted life-years caused by infections with antibiotic-resistant bacteria in Switzerland, 2010 to 2019, Euro Surveill. 2023;28(20). https://doi.org/10.2807/1560-7917. ES.2023.28.20.2200532
Introduction
3 Introduction
3.1 Surveillance of antibiotic resistance and antibiotic consumption
Antibiotic resistance in human and animal medicine is responsible for increased morbidity and mortality, and generates significant healthcare costs. Alternative treatments necessary due to resistant pathogens may have more serious side effects, and may require longer treatments and hospital stays, with increased risk of suffering and death. Physicians in hospitals must increasingly rely on the socalled last-line antibiotics (e.g. carbapenems). Increasing antibiotic resistance, also to these last-line antibiotics, raises serious concerns. The extent of antibiotic resistance correlates positively with antibiotic use. Thus, surveillance of antibiotic use and resistance in human and veterinary medicine is considered to be the backbone of action plans developed by the different countries in order to determine the extent of the problem and the effectiveness of the measures taken.
For veterinary medicine, two aspects have to be considered. Firstly, antimicrobial resistance in zoonotic and commensal bacteria from food-producing animals, which might spread via food-borne routes to humans. Secondly, antimicrobial resistance in pathogenic bacteria isolated from diseased food-producing and companion animals, which pose similar challenges for veterinarians as they do for clinicians. Antimicrobial agents used in animal and in human medicine in Europe are frequently the same or belong to the same classes, although the route of administration and the administered quantities of antimicrobials differ substantially. Therefore, surveillance of antibiotic use and resistance in veterinary medicine is a crucial part of action plans to combat antimicrobial resistance.
3.2 About ANRESIS
The Swiss Centre for Antibiotic Resistance (ANRESIS; https://www.anresis.ch) was established as part of National Research Programme 49 on antibiotic resistance. After NRP49 ended, financing was further guaranteed by the Swiss Federal Office of Public Health, the Swiss Conference of the Cantonal Ministers of Public Health and the University of Bern. Since 2016, the project has been financed by the Swiss Federal Office of Public Health and the Institute for Infectious Diseases in Bern; it is support-
ed by the Swiss Society of Infectious Diseases (SSI), the Swiss Society for Microbiology (SSM), the National Center for Infection Control (Swissnoso), the Swiss Association of Public Health Administration and Hospital Pharmacists (GSASA), pharmaSuisse and others.
First microbiology laboratories participated in ANRESIS in 2004. The surveillance system expanded continuously over the following years, with 37 microbiology laboratories participating in 2023. Moreover, additional databases were included, such as the bacteremia database (2006), the antibiotic consumption database (2006 for inpatients, 2015 for outpatients) and the Clostridium difficile database (2017). Data collection on antibiotic resistance in pathogenic veterinary isolates within the ANRESIS database was initiated by the Center for Zoonoses, Animal Bacterial Diseases and Antimicrobial Resistance (ZOBA) and ANRESIS in 2014. In 2019, an annual national monitoring program on antimicrobial resistance in pathogens from diseased animals was launched, and data are included in the ANRESIS database. The open data structure in the ANRESIS database allows for further developments.
The advisory board of ANRESIS is composed of specialists from the fields of microbiology, infectious diseases, hospital epidemiology, veterinary medicine and public health.
3.2.1 Monitoring of antibiotic consumption in human medicine
The development of resistance is a natural phenomenon for bacteria but is enhanced by the selective pressure exerted by antibacterial use [1, 2]. Epidemiological studies and mathematical models support a close correlation between the variation in antibiotic consumption and bacterial resistance. Monitoring of antibacterial consumption is thus an important part of a national action plan to limit the spread of bacterial resistance [1, 3].
For hospital and outpatient care, we have used the antibiotic consumption data from IQVIATM , a private drug market investigation company providing an exhaustive dataset of antibacterial consumption (corresponding to sales data (sell-in) from pharmaceutical industries to public pharmacies, self-dispensing physicians and/or hospitals).
Moreover, the consumption of antibiotics in the inpatient setting has been monitored since 2006 by means of a sentinel network of hospital pharmacies. Data from approximately 70 hospitals or hospital sites, distributed across all linguistic regions, are collected annually on a voluntary basis in Switzerland. These acute care hospitals are spread across the entire geographic territory and represent 54% of the total number of acute somatic care hospitals (excluding psychiatric centres, rehabilitation centres, and other specialised clinics) and 78% of all bed-days in this category.
Regarding the outpatient setting, we used the sales dataset from IQVIATM as well as data based on antibiotic prescriptions at the individual level from the representative Swiss Sentinel Surveillance Network (Sentinella, www.sentinella.ch), reported by practitioners from general and internal medicine, as well as paediatricians.
3.2.2 Resistance monitoring in human medicine
ANRESIS collects and analyses anonymous antibiotic resistance data provided by the participating clinical microbiology laboratories. These laboratories are distributed evenly across the geographic territory. They include university laboratories, which mainly represent isolates from tertiary-care hospitals, as well as cantonal and private laboratories, representing data from smaller hospitals and individual medical practices. These laboratories send antimicrobial susceptibility test results (AST) of all routinely performed analyses, including isolates from non-sterile sites. Collected data represent about 90% of all annual hospitalisation days and > 50% of all practitioners in Switzerland. The epidemiological data provided creates a stratification of the resistance results according to the hospital versus outpatient setting, age groups and anatomical location of the infection.
Antibiotic resistance data are continuously available on https://www.anresis.ch and https://guide.anresis.ch. Additionally, the proportions of the following multiresistant bacteria in invasive isolates are reported and updated monthly in the weekly Bulletin by the Swiss Federal Office of Public Health (https://www.bag.admin.ch/bag/de/home/ das-bag/publikationen/periodika/bag-bulletin.html): fluoroquinolone-resistant Escherichia coli, extended-spectrum cephalosporin-resistant (ESCR) E. coli, ESCR Klebsiella pneumoniae, methicillin-resistant Staphylococcus aureus (MRSA), penicillin-resistant Streptococcus pneumoniae and vancomycin-resistant Enterococci. In addition, since the outbreak in 2018/2019, cantonal data on vancomycin-resistance in Enterococci (VRE) are updated monthly on https://www.anresis.ch. Since 2020, data on carbapenemase-producing Enterobacterales (CPE) are provided and updated regularly by ANRESIS in collaboration with the NARA. More detailed data from ANRESIS, along with veterinary data, are published in the current national report every two years.
3.2.3 Resistance monitoring in veterinary medicine
3.2.3.1 Monitoring of resistance in zoonotic and indicator bacteria from healthy animals at slaughterhouses and in meat
The use of antimicrobials in livestock is a subject of public concern, as resistant bacteria can be selected and may reach humans via the food chain. Hence, a system to enable the continuous monitoring of resistance in bacteria isolated from livestock animals, meat and dairy products in Switzerland was introduced in 2006 based on Article 291d of the Epizootic Diseases Ordinance (EzDO; SR 916.401). Since 2014, this antimicrobial resistance monitoring follows the European-wide harmonised program.
The main goals of harmonised European monitoring of antimicrobial resistance in zoonotic and indicator (commensal) bacteria isolated from healthy livestock and meat are to estimate resistance prevalence, to detect trends over years and to produce data for risk assessment all over Europe. This information provides the basis for policy recommendations to combat the spread of antimicrobial resistance and allows the evaluation of the impact of adopted measures to be assessed.
Species examined
Cattle (e.g. calves under one year), pigs and broilers are monitored because of their importance in meat production. Samples of calves and pigs are taken alternately every other year with broilers. Cecum and nasal swab samples are taken by official veterinarians at slaughterhouses. Meat samples of the respective animal species are taken by official inspectors at retail level or at border control posts. In cecum, antimicrobial resistance is analysed for the zoonotic pathogens Campylobacter (C.) jejuni and C. coli, and for the indicator Escherichia (E.) coli. Since 2009, nasal swab samples from fattening pigs and calves have also been included for the detection of methicillin-resistant Staphylococcus aureus (MRSA). In 2014, detection of third-generation cephalosporin-resistant E. coli (ESBL/AmpC-producing E. coli ) in broilers, pigs and calves under one year and meat was established. Since 2015, analyses for the detection of ESBL/ AmpC-producing E. coli and carbapenemase-producing E. coli and Klebsiella spp. follow the European-wide harmonised methods, according to the protocols published by the European Reference Laboratory for Antimicrobial Resistance (EU RL AMR, Lyngby, Denmark). Salmonella isolates available from clinical submissions from various animal species and from the national control program for Salmonella in poultry are also included for antimicrobial resistance testing. Meat samples from poultry, pigs and cattle are tested for ESBL/AmpC-producing E. coli and carbapenemase-producing E. coli and Klebsiella spp.
Sampling
Stratified random samples of slaughtered animals are taken in slaughterhouses. At least 60% of the slaughtered animals of the relevant species must form part of the sample.
Every slaughterhouse taking part in the programme collects a number of samples proportional to the number of animals of the species slaughtered per year. In addition, sampling is spread evenly throughout the year. The number of samples tested should allow:
– estimation of the proportion of resistant isolates within +/– 8% of an actual resistance prevalence of 50%;
– detection of a change of 15% in the proportion of resistant isolates if resistance is widespread (50% resistant isolates);
detection of a rise of 5% in the proportion of resistant isolates if resistance was previously low (0.1% resistant isolates).
Resistance testing needs to be carried out on at least 170 isolates in order to reach this accuracy. The sample size must be adjusted to reflect prevalence in previous years for the relevant animal species in order to obtain this number of isolates. As the prevalence of particular pathogens in some animal species is very low in Switzerland (e.g. Salmonella spp.), it is not always possible to obtain the required number of isolates. 170 isolates are the target for C. jejuni and E. coli in broilers, for C. coli and E. coli in fattening pigs and for E. coli in cattle.
Fresh, chilled meat samples are collected in all Swiss cantons. The number of samples per canton is proportionate to the number of inhabitants. The samples are taken at different retailers, proportionately to their market share throughout the country. Moreover, the sampling plan differentiates between domestically and foreign-produced meat samples, according to the proportion of domestic and imported meat. Fresh, chilled meat samples from border control posts are collected proportionate to the import quantity into Switzerland. Only beef meat is imported in relevant quantities.
Data are transmitted to the database of the European Food Safety Authority (EFSA) and published together with the data from European member states in The European Union summary report on antimicrobial resistance in zoonotic and indicator bacteria from humans, animals and food (https://efsa.europa.eu/en/efsajournal). The data are also presented in a multimedia tool (https://multimedia.efsa. europa.eu/drvs/index.htm) to make it easier to understand.
3.2.3.2 Resistance monitoring in veterinary pathogens
In 2019, an annual monitoring of antimicrobial resistance in veterinary pathogens was initiated by the Federal Food Safety and Veterinary Office (FSVO) and implemented at the Swiss national reference laboratory for antimicrobial resistance (Center for Zoonoses, Animal Bacterial Diseases and Antimicrobial Resistance, ZOBA).
Examined species
The spectrum of isolates is selected according to relevant combinations of pathogens, animal species and diseases. Pathogens from pigs, cattle, hen, horses, dogs and cats are collected.
Sampling
Isolates come from almost all veterinary diagnostic laboratories in Switzerland. The target number of isolates is 50 for less frequently isolated pathogens and 100 isolates for frequently analysed pathogens.
Susceptibility testing is performed at the ZOBA using the broth microdilution method. In contrast to the European harmonised monitoring in healthy livestock, the tested antimicrobials are mainly those approved for veterinary use. Isolates are classified as susceptible or resistant according to the veterinary-specific clinical breakpoints published by the Clinical and Laboratory Standards Institute (CLSI). With the introduction of epidemiological cut-offs (ECOFFs) for veterinary pathogens, these will also be used for the interpretation of minimum inhibitory concentrations. Thanks to monitoring in animal pathogens, an important gap in the monitoring of antimicrobial resistance has been closed, which in the past was only carried out in livestock at slaughterhouses and meat. Data are transmitted to the ANRESIS database, the nationwide system for resistance data for both human and veterinary medicine. They are accessible via the veterinary version of the ANRESIS database, which is an interface for empirical antimicrobial chemotherapy originally developed in 2018 for human medicine. The veterinary edition of the ANRESIS guide was implemented in March 2020. This online tool provides fast and intuitive access to the latest antimicrobial resistance data on Swiss veterinary pathogens and assists veterinarians by offering reliable empirical treatment options (https://guide.anresis. ch/veterinary).
3.3 About IS ABV
The Information System on Antibiotics in Veterinary Medicine (IS ABV) is a system recording antibiotic prescriptions for animals. Veterinarians must register all antibiotic prescriptions and sales for all animal species from October 2019. The database makes it possible to evaluate the intensity of treatment of livestock and companion animals. It also takes into account the different types of production, e. g. piglet rearing or dairy farming. In addition, the collected data enable regional, national and international comparisons of antibiotic consumption and treatment intensity.
Additionally, this system compiles data on sales of antimicrobial agents for veterinary medicine in accordance with Article 36 of the Federal Ordinance on Veterinary Medicines (FOVM; SR 812.212.27). Sales data are used to estimate the consumption of antimicrobial agents in veterinary medicine. Marketing authorisation holders (MAH) annually report the sales of antimicrobial veterinary medicinal products to the Food Safety and Veterinary Office (FSVO), where they are processed and analysed. The data cover 100% of the authorised antimicrobial veterinary medicinal products. The sales data were also transmitted to the
European Medicines Agency (EMA) and published within the framework of the European Surveillance of Veterinary Antimicrobial Consumption Project (sales of veterinary antimicrobial agents in 31 European countries in 2019 and 2020; European Medicines Agency, 2021).
3.4 Guidance for readers
This report is the result of cooperation between the Federal Office of Public Health (FOPH), the Food Safety and Veterinary Office (FSVO), ANRESIS and the Center for Zoonoses, Animal Bacterial Diseases and Antimicrobial Resistance (ZOBA). We are pleased to present the Swiss data on the consumption of antimicrobials and on antimicrobial resistance, both in humans and in animals.
Though these data are presented in a single report, it is important to be aware of the fact that differences between the monitoring systems in terms of collection, interpretation and reporting hamper direct comparisons of the results.
Antibiotic consumption data
Antimicrobial consumption data from humans are reported as defined daily dose (DDD) per 1000 inhabitants and per day, or as DDD per 100 occupied bed-days or as DDD per 100 admissions.
In veterinary medicine, sales data on antimicrobials are used to estimate the consumption of these products. They are reported by weight (kg) of active substance per year, or by weight of active substance per population correction unit (PCU) and per year. A unit of measurement comparable to the DDD in human medicine is not yet available. Antimicrobial consumption data from animals are the data recorded in IS ABV from 2020 to 2023. The indicator used is the total quantity of antibiotics (weight in kg) in absolute values without denominators.
Antibiotic resistance data
The main issues when comparing antimicrobial resistance data originating from humans and animals are the different sampling strategies, the use of different laboratory methods and different interpretative criteria of resistance.
Sampling strategies
Resistance in bacteria from humans is determined in isolates from clinical submissions. For the veterinary sector, isolates from clinical submissions and bacteria from samples taken from healthy food-producing animals and meat within the framework of an active monitoring system are analysed.
Laboratory methods
Susceptibility testing in human isolates is performed in different laboratories using different methods (diffusion and microdilution methods). Animal and meat isolates are
tested at the Swiss national reference laboratory for antimicrobial resistance (Center for Zoonoses, Animal Bacterial Diseases and Antimicrobial Resistance (ZOBA), Institute of Veterinary Bacteriology, Vetsuisse Faculty, University of Bern) using the broth microdilution method.
Criteria of resistance
Human and veterinary clinical isolates are classified as “susceptible”, “susceptible, increased exposure”, or “resistant” by applying clinical breakpoints, as quantitative resistance data are not available for most of the human isolates. This interpretation indicates the likelihood of a therapeutic success with a certain antibiotic and thus helps the attending physician to select the best possible treatment. Clinical breakpoints are defined against a background of clinically relevant data such as dosing, method and route of administration, pharmacokinetics and pharmacodynamics. The use of different clinical breakpoints (e.g. EUCAST vs. CLSI) or changing breakpoints over time may therefore influence the results.
Resistance monitoring in livestock at slaughterhouses and the meat thereof uses epidemiological cut-off values (ECOFFs) to separate wild-type bacterial populations without acquired resistance mechanisms from isolates that have developed reduced susceptibility to a given antimicrobial agent by acquisition of antimicrobial resistance mechanisms. So-called non-wild-type organisms are assumed to exhibit acquired or mutational resistance mechanisms and are referred to as “microbiologically resistant.” ECOFF values allow no statement on the potential therapeutic success of an antimicrobial, but as they are able to indicate acquisition of resistance mechanisms at an early stage, they are used for epidemiological monitoring programs that measure resistance development over time.
Clinical breakpoints and ECOFFs may be the same, but the ECOFF can be lower than the clinical breakpoint.
This means that although the bacteria may be “microbiologically resistant,” the antimicrobial may still be effective at therapeutic level.
In order to improve comparability, as stipulated in the Swiss Strategy on Antibiotic Resistance (StAR), cooperation and coordination between the different monitoring networks must be further strengthened and the systems further refined.
3.5 Authors and contributions
– Silwan Daouk, Platform Waterquality, Swiss Water Association (VSA)
– Olivier Friedli, Swiss Centre for Antibiotic Resistance (ANRESIS), Institute for Infectious Diseases, University of Bern
– Michael Gasser, Swiss Centre for Antibiotic Resistance (ANRESIS), Institute for Infectious Diseases, University of Bern
– Simon Gottwalt, Communicable Diseases Division, Federal Office of Public Health FOPH
– Rebekka Gulde, Platform Process Engineering Micropollutants, Swiss Water Association (VSA)
Dagmar Heim, Veterinary Medicinal Products and One-Health, Federal Food Safety and Veterinary Office
– Andreas Kronenberg, Swiss Centre for Antibiotic Resistance (ANRESIS), Institute for Infectious Diseases, University of Bern
– Anaïs Léger, Veterinary Medicinal Products and One-Health, Federal Food Safety and Veterinary Office – Christa S. McArdell, Department of Environmental Chemistry, Eawag (chapter 11)
– Gudrun Overesch, Division of Centre for Zoonoses, Animal Bacterial Diseases and Antimicrobial Resistance (ZOBA), Institute of Veterinary Bacteriology, University of Bern
Vincent Perreten, Division of Molecular Bacterial Epidemiology and Infectious Diseases, Institute of Veterinary Bacteriology, University of Bern
– Catherine Plüss-Suard, Swiss Centre for Antibiotic Resistance (ANRESIS), Institute for Infectious Diseases, University of Bern
Miriam Reinhardt, Hydrogeological Basis Section, Federal Office for the Environment
– Heinzpeter Schwermer, Veterinary Medicinal Products and One-Health, Federal Food Safety and Veterinary Office
– Saskia Zimmermann-Steffens, Urban Water Management Section, Federal Office for the Environment
Editors
– Kathrin Leventhal, Division of Communicable Diseases, Federal Office of Public Health
– Dagmar Heim, Veterinary Medicinal Products and Antibiotics, Federal Food Safety and Veterinary Office – Simon Gottwalt, Division of Communicable Diseases, Federal Office of Public Health
Acknowledgements
The authors are grateful to all who have provided data for this report. Many thanks to all participants not mentioned by name.
ANRESIS would like to thank all participating microbiology laboratories and hospital pharmacies for their important contribution in providing resistance and antibiotic consumption data.
ZOBA would like to thank all participating veterinary diagnostic laboratories for their important contribution in providing isolates for the national antimicrobial resistance monitoring program in veterinary pathogens.
References
[1] WHO report on surveillance of antibiotic consumption: 2016–2018 early implementation. Geneva: World Health Organisation; 2018. Licence: CC BY-NC-SA 3.0 IGO.
[2] Theuretzbacher U. Global antibacterial resistance: The never-ending story. J Global Antimicrob Resis 2013; 1(2): 63–69
[3] Plüss-Suard C. et al. Hospital antibiotic consumption in Switzerland: comparison of a multicultural country with Europe. J Hosp Inf 2011; 79(2):166–171.
[4] Federal Office for National Economic Supply. Current supply shortages in the medical sector reported in accordance with the Ordinance on the Essential Human Medicines Reporting Office. www.bwl.admin.ch
This is the coulor code that is used in various figures in this report.
Cephalosporins first and second generation
Cephalosporins third and fourth generation
Other cephalosporins and penems
Monobactams
Beta-lactamase-sensitive penicillins
Penicillins with extended spectrum
Beta-lactamase-resistant penicillins
Combination of penicillins, incl. beta-lactamase inhibitor
Carbapenems
Macrolides, lincosamides and streptogramins
Aminoglycosides
Sulfonamides and trimethoprim
Fluoroquinolones
Antimycobacterials
Tetracyclines
Chloramphenicol
Others
Antibacterial consumption in human medicine
4 Antibacterial consumption in human medicine
4.1 Overall consumption
In 2023, total consumption of antibacterials (in hospital and outpatient care combined, ATC code J01) was 10.8 defined daily doses per 1,000 inhabitants per day (DID) using IQVIATM Sales Data (sell-in) from pharmaceutical industries to pharmacies, self-dispensing physicians and hospitals (Figure 4. a). Following a decline in antibacterial consumption during the COVID-19 pandemic, consumption has now returned to pre-pandemic levels; 3% higher than in 2019 (10.6 DID) and 7% higher than in 2022 (10.1 DID). The tenyear trend shows that current consumption remains 2% below 2014 levels (11.1 DID). In 2022, the mean total (hospital and community sector combined) consumption of antibacterials for systemic use (ATC group J01) in the EU/EEA was 19.4 DID (country range: 9.1–33.5) [1].
Antibacterial consumption in the outpatient setting accounted for 86% of total consumption in 2014 and for 87% in 2023. Antibacterial consumption (ATC code J01) was higher in the French- and the Italian-speaking regions (resp.
14.5 and 14.2 DID) than in the German-speaking region (9.3 DID) (Figure 4. b).
Among systemic antibiotics (ATC code J01), the antibiotic family with the highest total consumption in Switzerland in 2023 was penicillins with beta-lactamase inhibitors (including amoxicillin-clavulanic acid, J01CR) (31%, 3.3 DID), followed by the group of macrolides, lincosamides and streptogramins, then penicillins with extended spectrum, and finally tetracyclines (12%, 1.3 DID each). There were continued reductions between 2014 and 2023 in consumption of fluoroquinolones (-45%), 3rd and 4th -generation cephalosporines (-22%) and macrolides (-18%). However, increases occurred in penicillins with extended spectrum (including amoxicillin, J01CA) (+49%), other antibacterials (including nitrofurantoin and fosfomycin, +41%), sulfonamides & trimethoprim (+19%) and penicillins and beta-lactamase inhibitors (without pseudomonal activity, including amoxicillin-clavulanic acid, J01CR02-03) (+14%).
Datasource: IQVIATM Sales Data (Sell-In) from pharmaceutical industries to public pharmacies, self-dispensing physicians and hospitals
Figure 4. a: Total (hospital and outpatient care together) antibiotic consumption expressed in DDD per 1000 inhabitants per day, Switzerland, 2014–2023 (ATC code J01).
Figure 4. b: Total (hospital and outpatient care together) antibiotic consumption expressed in DDD per 1000 inhabitants per day by linguistic region, Switzerland, 2014–2023 (ATC code J01).
German-speaking region
French-speaking region
Outpatient care Hospital care
Italian-speaking region
Datasource: IQVIATM Sales Data (Sell-In) from pharmaceutical industries to public pharmacies, self-dispensing physicians and hospitals
Figure 4. c: Total (hospital and outpatient care together) antibiotic consumption according to the AWaRe categorization of the WHO, Switzerland compared to EU/EEA countries, 2022 (ATC codes A07AA, J01, J04A, P01AB). The WHO recommends a country-level target of at least 60% of total antibiotic consumption being Access group antibiotics (black line).
Datasource: IQVIATM Sales Data (Sell-In) from pharmaceutical industries to public pharmacies, self-dispensing physicians and hospitals for Switzerland and data adapted from [3] for EU/EEA countries
The WHO’s 13th General Programme of Work 2019–2023 includes a country-level target of at least 60% of total antibiotic consumption being Access group antibiotics [2]. For this analysis, ATC codes from the A07AA, J01, J04AB and P01AB groups were included. In Switzerland, the relative proportion of Access group antibiotic consumption accounted for 56% of total consumption (6.4 DID) in 2014 and 66% (7.4 DID) in 2023. In the Watch group, which includes antibiotics particularly critical for the development of resistance, a decrease of 26% has been achieved since 2014 (2014: 4.9 DID; 2022: 3.5 DID; 2023: 3.6 DID). Their proportion of all antibiotic prescriptions was 32% in 2023, falling below the WHO target of 40%. The relative proportion of the Reserve group remained low (0.3–0.4% of total consumption) between 2014 and 2023. Figure 4. c shows the proportions of AWaRe groups in Switzerland and in EU/ EEA countries participating in the ESAC-Net [3].
4.2 Hospital care
4.2.1
Total antibiotic consumption
Among the 44 hospitals participating in the ANRESIS monitoring program in both 2014 and 2023, the number of DDDs of systemic antibiotics (ATC code J01) remained constant. However, this value needs to be adjusted based on hospital activity indicators to ensure comparability among hospitals. During the same period, the number of admissions increased by 6%, while the number of bed-days decreased
by 6%. This indicates that more patients were admitted to hospitals in 2023 compared to 2014, but their average length of stay was shorter.
The total consumption of systemic antibiotics (ATC code J01) in DDD per 100 bed-days across all hospitals participating in the monitoring (see Table 13. a for the number of participating hospitals) remained relatively stable (+1%), from a weighted mean of 53.7 (weighted mean, range: 34.3–69.3) in 2014 to 54.4 (weighted mean, range: 23.3–70.9) in 2023. In contrast, the total consumption in DDD per 100 admissions decreased by 14%. This discrepancy can be attributed to an increasing number of admissions and a decreasing number of bed-days due to shorter hospital stays. In 2023, total antibiotic consumption was lower in the smaller hospitals (50.7 DDD per 100 bed-days) compared to medium (53.6) and large hospitals (59.3) (Figure 4. d).
In 2023, total antibiotic consumption was relatively similar across the three linguistic regions: 56.5 DDD per 100 beddays in the French-speaking region (19 hospitals, including 2 university hospitals), 46.2 in the Italian-speaking region (6 hospitals), and 54.4 in the German-speaking region (50 hospitals, including 2 university hospitals). Between 2014 and 2023, antibiotic consumption increased by 9% in the French-speaking region, by 19% in the Italian-speaking region and decreased by 4% in the German-speaking region.
When antibiotics are classified according to the AWaRe classification, it can be seen in the hospital sector that (see Chapter 13, Materials and methods) 51% of antibiotics (28.6 DDD per 100 bed-days) in 2023 were allocated to the
Figure 4. d: Antibiotic consumption expressed in DDD per 100 bed-days in hospitals contributing to ANRESIS by hospital size in the entire hospital (a) and intensive care unit only (b), 2014–2023 (ATC code J01).
Figure 4. e: Inpatient antibacterial consumption in Switzerland and in linguistic regions compared to EU/EEA countries, epxressed in DDD per 1000 inhabitants per day, 2022.
CzechiaLithuaniaMaltaCroatiaFinlandDenmark ItalyFranceGreecePortugal Italian-speakingregionAustriaIrelandEstonia
EU/EEAcrude population-weightedmeanLatviaSpainBulgariaSloveniaGerman-speakingregionSwitzerlandBelgiumLuxembourgRomania French-speakingregionPolandNorwaySlovakiaIcelandHungaryNetherlands
Datasource: IQVIATM Sales Data (Sell-In) from pharmaceutical industries to hospitals for Switzerland, and data adapted from [3] for EU/EEA countries
Access group, 47% (26.3) to the Watch group and 1% (0.8) to the Reserve group. The proportion of antibiotics within the Access, Watch and Reserve categories of total consumption has remained largely unchanged over the past ten years. The exception is 2020, where the consumption in DDD per 100 bed-days of Watch antibiotics was higher than that of Access antibiotics (data not shown).
Using the IQVIATM dataset and weighting consumption data to the Swiss population, it can be observed that the total consumption of antibacterial agents (ATC code J01) for systemic use has decreased by 8% over the last ten years, reaching 1.4 DID in 2023 (compared to 1.6 DID in 2014, 1.5 in 2019 and 1.4 in 2022) (Figure 4. a). In comparison, the population-weighted mean consumption in 2022 was 1.6 DID (ranging from range 0.75–3.15 DID) in the countries participating in the European Surveillance of Antimicrobial Consumption Network (ESAC-Net) (Figure 4. e) [1].
The indicator given for the hospital sector (known as ECDC/EFSA/EMA secondary indicator assessing prudent use of antibiotics) is the proportion of glycopeptides (ATC group J01XA), third- and fourth-generation cephalosporins (J01DD and J01DE), monobactams (J01DF), carbapenems (J01DH), fluoroquinolones (J01MA), polymyxins (J01XB), piperacillin and enzyme inhibitor (J01CR05), linezolid (J01XX08), tedizolid (J01XX11), and daptomycin (J01XX09) of total hospital consumption of antibacterials for systemic use [1]. Of the total consumption of antibacterials for sys -
temic use in the hospital sector (code ATC J01), the EU/ EEA population weighted proportion of these antibacterials combined was 38% (country range: 18–68%) in 2022 [1]. For the same year, the proportion was 31% in Switzerland.
4.2.2 Consumption by antibiotic class
In the hospitals contributing to ANRESIS surveillance, it can be seen that in 2023, the consumption of penicillins (ATC code J01C) ranked first among the antibiotic classes, accounting for 43% of total consumption. This was followed by the consumption of other beta-lactam antibiotics, including cephalosporins (ATC code J01D). Figure 4. f (page 44) shows the distribution of antibacterial classes and subclasses in 2023.
Table 4. a (page 45) shows the consumption of antibiotic classes expressed in DDD per 100 bed-days in sentinel hospitals from 2014 to 2023. Among J01 antibiotics, the use of 8 of the 24 antibiotic classes decreased between 2014 and 2023 (beta-lactamase-sensitive penicillins, beta-lactamase-resistant penicillins, carbapenems, sulfonamides and trimethoprim, macrolides, aminoglycosides, fluoroquinolones and polymyxins). The most substantial changes between 2014 and 2023 were observed for the cephalosporins – fourth generation (+61%), cephalosporins – first generation (+59%), aminoglycosides (-40%) and fluoroquinolones (-55%).
Figure 4. f: Distribution of the antibiotic consumption per antibiotic class in hospitals contributing to ANRESIS, 2023 (ATC group J01).
Tetracyclines (J01AA)
Penicillins with extended spectrum (J01CA)
Beta-lactamase sensitive penicillins (J01CE)
Beta-lactamase resistant penicillins (J01CF)
Comb. of pen. (with anti-pseudomonal activity, J01CR03-05)
Comb. of pen. (without anti-pseudomonal activity, J01CR02)
1st and 2nd generation cephalosporins (J01DB, DC)
3rd and 4th generation cephalosporins (J01DD, DE)
Monobactams (J01DF)
Carbapenems (J01DH)
Other cephalosporins and penems (J01DI)
Sulfonamides and trimethoprim (J01E)
Macrolides and lincosamides (J01F)
Aminoglycosides (J01G)
Fluoroquinolones (J01MA)
Others (J01B, J01X)
Datasource: Consumption data from sentinel hospitals contributing to ANRESIS
Consumption of all penicillins has remained largely stable in recent years (Figure 4. g (page 46) and Table 4. a). However, the use of penicillins in combination with beta-lactamase inhibitors reached its highest level in the past decade in 2023, with the exception of the Italian-speaking region of Switzerland. In contrast, other penicillin subgroups, such as beta-lactamase-sensitive penicillins and beta-lactamase-resistant penicillins, have shown a slight decrease in consumption over the last ten years.
The use of cephalosporins increased between 2014 and 2023 (Figure 4. g and Table 4. a). This increase applies to cephalosporins of all generations (+59% for the first generation, +15% for the second generation, +32% for the third generation, and +61% for the fourth generation). A comparison of the different language regions shows a comparable trend towards increased consumption of cephalosporins (Figure 4. g). Cephalosporins recently approved by Swissmedic (ceftolozane-tazobactam, ceftaroline, ceftazidime-avibactam) or imported products (cefiderocol) have rarely been used in hospitals contributing to ANRESIS.
The overall consumption of carbapenems in Switzerland has decreased over the past ten years, with a change of
-7% (Table 4. a). In a regional comparison, the German- and French-speaking regions have maintained stable consumption levels in recent years (Figure 4. g). However, in the Italian-speaking region, carbapenem consumption increased, peaking during the COVID-19 pandemic. This was followed by a 23% decrease in the last year.
The consumption of fluoroquinolones has steadily decreased by 55% over the past ten years (Table 4. a). However, this declining trend has slowed down or stabilised in the past years (Figure 4. g).
Macrolide consumption (ATC group J01FA) in Switzerland has decreased by -17% over the past ten years. There are regional variations, with higher consumption in the French-speaking and German-speaking regions, and lower consumption in the Italian-speaking region (Figure 4. g).
Relatively stable consumption was reported for antibiotics active against resistant Gram-positive bacteria (vancomycin, daptomycin, teicoplanin, linezolid). A 12% increase was observed between 2014 and 2023. In recent years, consumption has been highest in the French-speaking region (Figure 4. g).
Table 4. a: Consumption of antibiotic classes expressed in DDD per 100 bed-days in hospitals contributing to ANRESIS, Switzerland (2014–2023).
4.2.3 Total antibiotic consumption in intensive care units of hospitals contributing to ANRESIS
Total consumption of systemic antibiotics (ATC code J01) in adult ICUs has decreased (Figure 4. d). Since 2014, consumption in ICUs has decreased by 11%, from 99.1 DDD per 100 bed-days to 92.8 in 2023. In 2023, total antibiotic consumption was lower in the intensive care units of smallsize hospitals (86.8 DDD per 100 bed-days) as compared to medium-size (90.7) and large-size (99.5) hospitals.
4.3 Outpatient care
4.3.1 Total antibiotic consumption using the IQVIA™ data set
In 2023, the total consumption of antibacterials for systemic use (ATC code J01) was 9.4 DID. Following a decline in antibacterial consumption during the COVID-19 pandemic, consumption has now returned to pre-pandemic levels; 4% higher than in 2019 (9.0 DID), 29% higher than in 2021 (7.3 DID) and 8% higher than in 2022 (8.7 DID). The ten-year trend shows that current consumption remains 1% below 2014 levels (9.5 DID) (Figure 4. a). In comparison, the EU/ EEA mean consumption of antibacterials for systemic use (ATC code J01), as recorded by the countries participating in the ESAC-Net, was 17.0 DID in 2022 (country range: 8.3–31.2) (Figure 4. h) [1].
Figure 4. g: Inpatient consumption of antibiotics expressed in DDD per 100 bed-days in hospitals contributing to ANRESIS by linguistic region, 2014–2023 (see Chapter 4.2.2.).
In 2023, the German-speaking region of Switzerland had a lower antibiotic consumption (7.8 DID) than the Italian-speaking (12.4) and French-speaking regions (13.1) (Figure 4. b). Between 2014 and 2023, the antibiotic consumption in the German-speaking region decreased by 6% (8.3 in 2014), whereas the consumption increased by 5% (11.8) in the Italian-speaking region and by 7% (12.3) in the French-speaking region.
According to the WHO AWaRe classification, the Access group represented 69% of antibiotics (6.7 DID), the Watch group 30% (3.0 DID) and the Reserve group 0.2% (0.02 DID) in the outpatient setting in 2023 (ATC codes A07AA, J01, J04AB, P01AB). The proportion of the Access group increased by 22% and the Watch group decreased by 30% between 2014 and 2023.
4.3.2 Antibiotic consumption in the outpatient setting by antibiotic class and by specific antibiotic, using the IQVIA™ data set
Consumption of penicillins (ATC code J01C) ranked first among antibiotic classes amounted to 44% of the J01 consumption in 2023. It was followed by the consumption of tetracyclines (13%, ATC code J01A), macrolides, lincosamides and streptogramins (13%, ATC code J01F), fluoroquinolones (9%, ATC code J01MA), other antibacterials (7%, ATC code J01X), beta-lactam antibacterials other than penicillins (including cephalosporins, 7%, ATC code J01D)
and sulfonamides and trimethoprim (6%, ATC code J01E). Figure 4. i shows the distribution of antibiotic classes and subclasses in 2023.
The overall consumption of penicillins increased by 23% between 2014 (3.4 DID) and 2023 (4.2 DID). Combinations of penicillins and beta-lactamase inhibitors (J01CR) were the most frequently used group of systemic antibiotics in 2023 (2.8 DID, 30% of total J01 antibiotic consumption) (Table 4. b). They accounted for 69% of total penicillin consumption. The second most frequently used group was penicillins with an extended spectrum (J01CA), namely amoxicillin (1.3 DID, 30% of penicillin consumption and 13% of the J01 antibiotic consumption). At substance level, amoxicillin-clavulanic acid was the most frequently used antibiotic in 2023 (2.8 DID). Its consumption increased by 17% between 2014 and 2023, whereas that of amoxicillin increased by 52% during the same period.
The consumption of cephalosporins (ATC codes J01DB-DE and J01DI) decreased by 20% between 2014 (0.8 DID) and 2023 (0.6 DID). Cefuroxime, cefpodoxime, ceftriaxone and cefaclor represented 86%, 8%, 3% and 3%, respectively of cephalosporin consumption in 2023.
Fluoroquinolone consumption was 0.9 DID in 2023 in Switzerland, accounting for 9% of the total antibiotic consumption in the outpatient setting. The consumption of fluoroquinolones decreased by 45% between 2014 (1.6 DID) and 2023 (0.9 DID). At substance level, ciprofloxacin was the most frequently used fluoroquinolone (71%), followed by
Table 4. b: Consumption of antibiotic classes expressed in DDD per 1000 inhabitants per day in the outpatient setting, Switzerland (2014–2023).
* collected since 2018
levofloxacin (16%), norfloxacin (7%), moxifloxacin (6%) in 2023.
In the macrolide, lincosamides and streptogramin group (ATC code J01F), only macrolides and lincosamides have been used in Switzerland (1.0 and 0.2 DID resp. in 2023). Consumption of macrolides decreased by 22%, whereas that of lincosamides slightly increased (+9%) between 2014 and 2023. Clarithromycin and azithromycin each accounted for 50% of the macrolides in 2023. Clarithromycin and azithromycin accounted for 50% both of the macrolides in 2023. Among the lincosamides, clindamycin consumption was 0.2 DID in 2023 and has remained stable since 2014.
Tetracycline consumption decreased between 2014 and 2023 (1.2 DID, -9%), accounting for 13% of the J01 consumption. Doxycycline was the most frequently used tet-
racycline (84%), followed by limecycline (12%), and minocycline (4%).
Nitrofurantoin and fosfomycin accounted for 6% (0.5 DID) and 1% (0.1 DID), respectively, of the total antibiotic consumption in 2023. They have increased by 52% and 42% respectively since 2014.
The ratio of consumption of broad-spectrum penicillins, 3rd - and 4th -generation cephalosporins, macrolides (except erythromycin) and fluoroquinolones (J01[CR+DC+DD] +[FA-FA01] + [MA]) to the consumption of narrow-spectrum penicillins, 1st-generation cephalosporins and erythromycin (J01[CA+CE+CF+DB+FA01]) is one quality indicator for consumption in the outpatient setting proposed by the ESAC-Net (known as ECDC/EFSA/EMA secondary indicator assessing prudent use of antibiotics) [1]. This ratio (4.1)
Figure 4. h: Total antibacterial consumption in Switzerland and in linguistic regions compared to EU/EEA countries in the outpatient setting, expressed in DDD per 1000 inhabitants per day, 2022.
GreeceRomaniaBulgariaFrancePolandMaltaSpainIreland ItalySlovakiaBelgiumCroatia EU/EEAcrude population-weightedmeanLuxembourgIcelandPortugalLithuaniaNorwayCzechiaLatviaHungaryDenmark French-speaking region Italian-speaking regionSloveniaEstoniaFinlandGermanyAustriaSwitzerlandNetherlands German-speaking region
Datasource: IQVIATM Sales Data (Sell-In) from pharmaceutical industries to hospitals for Switzerland, and data adapted from [3] for EU/EEA countries
Figure 4. i: Distribution of the antibiotic consumption per antibiotic class in the outpatient setting in 2023, Switzerland (ATC group J01).
Tetracyclines (J01AA)
Penicillins with extended spectrum (J01CA)
Beta-lactamase sensitive penicillins (J01CE)
Beta-lactamase resistant penicillins (J01CF)*
Comb. of pen. (with anti-pseudomonal activity, J01CR03-05)*
Comb. of pen. (without anti-pseudomonal activity, J01CR02)
1st and 2nd generation cephalosporins (J01DB, DC)
3rd and 4th generation cephalosporins (J01DD, DE)
Monobactams (J01DF)*
Carbapenems (J01DH)*
Other cephalosporins and penems (J01DI)*
Sulfonamides and trimethoprim (J01E)
Macrolides and lincosamides (J01F)
Aminoglycosides (J01G)*
Fluoroquinolones (J01MA)
Others (J01B, J01X)
Datasource: IQVIATM Sales Data (Sell-In) from pharmaceutical industries to community pharmacies and self-dispensing physicians
*<0.1%
was close to the EU/EEA crude population-weighted mean (4.0), where the ratio ranged from 0.1 to 24.7 in 2022 [1].
4.3.3 Antibiotic use by indication using the Sentinella dataset
A total of 15,790 antibacterial prescriptions were issued by 143 physicians participating in the Sentinella network in 2023 (121 practitioners from internal and general medicine and 22 pediatricians), corresponding to 27.1 antibacterial prescriptions per 1000 consultations. This was higher than in 2021 (21.7) and 2022 (26.0). Figure 4. j shows the use of antibiotic classes per indication as a number of prescriptions per 1000 consultations issued by practitioners from general and internal medicine and paediatricians combined over the period 2018–2023.
The number of antibiotic prescriptions issued by practitioners from internal and general medicine was 25.1 per 1000 consultations in 2023 (21.4 in 2021 and 24.8 in 2022). In 2023, they used the most antibiotics for upper respiratory tract infections (30%) and urinary tract infections (28%). Lower urinary tract infections (UTI) accounted for 25%, skin and soft tissue infections for 14% and pneumonia for 9% (Figure 4. k). Among respiratory tract infections, anti -
bacterials were prescribed most frequently for pneumonia (18%), pharyngitis (18%), sinusitis (17%), acute bronchitis (15%) and otitis media (11%). Fosfomycin (32% of all antibacterials used for lower UTI), trimethoprim-sulfamethoxazole (23%), nitrofurantoin (21%) and fluoroquinolones (16%) were the most frequently prescribed antibacterials for lower urinary tract infections. For skin and soft tissue infections, penicillins and beta-lactamase inhibitor were the most prescribed antibacterial (59%), followed by amoxicillin (12%) and tetracyclines (7%). The antibacterials most frequently prescribed for pneumonia were penicillins and beta-lactamase inhibitors (48%), macrolides (16%) and amoxicillin (15%).
The number of antibiotic prescriptions issued by paediatricians was 36.6 per 1000 consultations in 2023 (23.1 in 2021 and 31.3 in 2022), corresponding to an increase of 17% between 2022 and 2023. Antibacterial prescriptions were prescribed most frequently for otitis media (45%), followed by pharyngitis (27%), skin and soft tissue infections (8%) and pneumonia (5%) (Figure 4. k). Amoxicillin and penicillins and beta-lactamase inhibitors were the most frequently prescribed antibacterials for otitis media infections (70% and 16%, respectively) and pharyngitis (61% and 11%, respectively).
Figure 4. j: Antibiotic classes per indication as a number of prescriptions per 1000 consultations issued by practitioners from general and internal medicine and paediatricians, 2018–2023.
(a) By type of infections
Respiratory, upper Respiratory, lower Gastrointestinal Skin and soft tissue
Aminopenicillin
Comb. of penicillins, incl. beta-lactamase inhibitors
Penicillin
1st and 2nd generation cephalosporins
3rd and 4th generation cephalosporins
Macrolides
Fluoroquinolones
Fosfomycin
Nitrofurantoin
Reserve/Breitband
Tetracyclines
Trimethoprim-sulfamethoxazol
Other
Datasource: prescription orders collected from the Sentinella network
(b) By type of upper respiratory tract infections
of prescriptions per 1,000 consultations
Otitis media Sinusitis Pharyngitis Upper respiratory tract infections, other
Aminopenicillin
Comb. of penicillins, incl. beta-lactamase inhibitors
Penicillin
1st and 2nd generation cephalosporins
3rd and 4th generation cephalosporins
Macrolides
Fluoroquinolones
c) By type of lower respiratory tract infections
Acute bronchitis Chronic Obstructive Pulmonary Disease Pneumonia Number of prescriptions per 1,000 consultations
Aminopenicillin
Comb. of penicillins, incl. beta-lactamase inhibitors
Penicillin
1st and 2nd generation cephalosporins
3rd and 4th generation cephalosporins
Macrolides
Fluoroquinolones
Fosfomycin Nitrofurantoin
Reserve/Breitband
Tetracyclines
Trimethoprim-sulfamethoxazol
Other
Fosfomycin Nitrofurantoin
Reserve/Breitband
Tetracyclines
Trimethoprim-sulfamethoxazol
Other
Figure 4. k: Percentage of antibiotic prescriptions per indication for general practitioners (A) and pediatricians (B), 2023.
A. General practitioners
Lower urinary tract infections
Skin and soft tissue infections
Pneumonia
Pharyngitis
Sinusitis
Upper respiratory tract infections, other
Acute bronchitis
Gastrointestinal infections
Otitis media
Upper urinary tract infections
Other
COPD
Sexually transmitted infections
Datasource: prescription orders collected from the Sentinella network
B. Paediatricians
Otitis media
Pharyngitis
Skin and soft tissue infections
Pneumonia
Upper respiratory tract infections, other
Lower urinary tract infections
Other
Acute bronchitis
Sinusitis
Upper urinary tract infections
Gastrointestinal infections
Datasource: prescription orders collected from the Sentinella network
4.4 Summary
After the COVID-19 pandemic, a rebound in total antibiotic consumption was observed, with an increase of 7% between 2022 and 2023 (10.1 and 10.8 DID, respectively). Compared to other European countries, Switzerland remains one of the countries with the lowest antibiotic consumption. The French- and Italian-speaking regions use more antibiotics than the German-speaking region. Over a 10-year period, changes in consumption were mainly observed for fluoroquinolones (-45%) and for extended-spectrum penicillins (namely amoxicillin) (+49%). The relative share in the Access group was 66% in 2023, reaching the country-level target of at least 60% of total antibiotic consumption.
In the hospital setting, total antibiotic consumption increased from 53.6 to 54.2 DDD per 100 bed-days between 2014 and 2023. Expressed in DDD per 1000 inhabitants per day, the total antibiotic consumption (1.4 in 2023) was lower than the median (1.6) obtained in the ESAC-Net in 2022 [1]. The most commonly used class of antibiotics was the penicillins (ATC code J01C), followed by other beta- lactam antibacterials, including cephalosporins (ATC code J01D) and other antimicrobials (ATC code J01X).
In the outpatient setting, the total consumption of antibiotics for systemic use was 9.4 DID in 2023 and 8.7 DID in 2022, which was low compared to countries participating in the ESAC-Net (17.0 DID, range 8.3–31.2, 2022) [1]. The most commonly used class of antibiotics was the penicillins (ATC code J01C), followed by the tetracyclines (ATC code J01A), the macrolides, lincosamides and streptogramins (ATC code J01F), and the quinolones (ATC code J01M). The German-speaking part of Switzerland presented lower antibiotic consumption than the Italian-speaking and French-speaking parts.
Our methodology has several limitations [1, 5]. The DDD methodology allows comparisons between hospitals or countries but may inaccurately reflect the dosages chosen in some of them, thus limiting the qualitative appraisal of different prescribers’ profiles [6]. Concerning the inpatient setting, a sentinel network such as ANRESIS, which is based on voluntary participation of hospitals in Switzerland, is a surveillance system comprising a non-exhaustive group of hospitals. Nevertheless, the high proportion of all Swiss acute care hospitals included in our surveillance suggests that the data are representative. In this report, we mostly express the antibiotic consumption in DDD per 100 bed-days, rather than per admission for the inpatient setting. The definition of bed-days has been set by the Federal Statistical Office, while the number of admissions is not an official indicator and can be subject to different interpretations among hospitals.
References
[1] European Centre for Disease Prevention and Control. Antimicrobial consumption in the EU/EEA (ESAC-Net) – Annual Epidemiological Report 2022. Stockholm: ECDC; 2023. Available from: https://ecdc.europa.eu/ sites/default/files/documents/AER-antimicrobialconsumption.pdf (accessed 10 June 2024)
[2] Thirteenth General Programme of Work (GPW13): metadata for impact measurement indicators. Geneva: World Health Organisation; 2020.
[3] European Centre for Disease Prevention and Control. Antimicrobial consumption dashboard. Available from: https://www.ecdc.europa.eu/en/antimicrobial-consumption/surveillance-and-disease-data/ database (accessed 10 June 2024).
[4] Federal Office for National Economic Supply. Current supply shortages in the medical sector reported in accordance with the Ordinance on the Essential Human Medicines Reporting Office. Available from: www.bwl.admin.ch (accessed 21 July 2022)
[5] Filippini M, Masiero G, Moschetti K. Socioeconomic determinants of regional differences in outpatient antibiotic consumption: evidence from Switzerland. Health Policy. 2006; 78(1):77–92.
[6] de With K et al. Comparison of Defined versus Recommended versus Prescribed Daily Doses for Measuring Hospital Antibiotic Consumption. Infection 2009; 37(4):349–352.
Antibiotics shortage in Switzerland: a public health issue
E. Martinelli 1
1 Hospital pharmacy department, Spitäler FMI AG
Antibiotics are a major achievement in medical therapy. Our life expectancy has increased significantly thanks to antibiotics. Big steps were taken in the development and mass production of antibiotics were taken during and after the Second World War. This was followed by the development of new classes of antibiotics, including for widespread use, whether for inpatient or outpatient treatment. However, since the beginning of the 2000s, however, hardly any innovative antibiotics with new mechanisms of action have been developed for widespread use. This means that most of the antibiotics used today are off patent. The old “originals” are sold out. Only the brand survives, not the production site.
This situation triggers a special dynamic that can be observed not only with antibiotics, but also in general with other older, off-patent pharmaceutical products: the global market is not based on the therapeutic value of a substance or the value of a dosage form in application, but on market-economic aspects. Costs are optimised. The result is a concentration of production in a few countries, with lower environmental standards and labour costs. It is not the resilience of the supply systems that is rewarded, but the cheapest supplier.
Cost optimisation is not only taking place at buyer level (health insurance companies, hospitals), but also at the level of marketing authorisation holders, who no longer manufacture all or some of their products themselves, but purchase them on the global market. This leads to a concentration in the production of medicines in favor of the cheapest supplier. There is now only one manufacturer for around 1/3 of all substances worldwide. In the intermediate stages of the supply chain, supply and demand determine the price. In situations of scarcity, prices rise at all stages, except – at least in Europe – at the very end of the supply chain with the buyers. This reduces the profit of the market authorisation holder, who decides whether a product remains on the market or not. Such decisions are often not made in Switzerland, but internationally. The ultimate consequence is withdrawal from the market, regardless of whether it is an important product or not.
The situation becomes problematic when the supply in Switzerland depends on a single provider or when one galenic form disappears completely from the market.
Such cases have been observed for antibiotics in recent years. Cotrimoxazole, mostly known under its brand name BACTRIM ®, is a good example, illustrating increasing market concentration: in 2003, there were ten marketing authorisation holders for the 800 mg tablets in Switzerland. Today there are only two left, and only one still offers cotrimoxazole as a syrup for children. In general, the more complicated forms or those that are used less are affected first by market withdrawals, especially the forms for children. First, there is interrupted supply for some medicines, then some suppliers withdraw their market authorisation and finally, the last company quits the market and the medicine is no longer available.
As a result, the number of therapeutic options is reduced and less suitable antibiotics with a broader spectrum have to be used, which in turn promotes the development of resistance. One example is cefpodoxime, which was the appropriate treatment of pyelonephritis in young children, but the last paediatric formulation of cefpodoxime was withdrawn from the Swiss market in 2019.
Figure I shows the number of antibiotic products (ATC Code J01) that were affected by a shortage in Switzerland over the 2016–2023 period. A stockout of a product means a lot of additional work for pharmacists and physicians, who have to find alternatives. But most importantly, it can compromise patient safety.
Now, you can complain that companies' profit margins are too high anyway, but while pharmaceutical companies that develop and produce new, patented drugs often have very high profit margins, this is not the case for generic suppliers. Cross-financing does not take place, because the companies are not the same. The Federal Office for National Economic Supply (FONES) has therefore undertaken a number of actions to improve the supply situation of medicinal products. For example, it has categorised some substances as important for national supply. Consequently, companies must report their stockouts centrally and the Federal Office can take measures (e.g. regulations on restricted use). Some of these products also have requirements for compulsory stockpiling. However, if a product is no longer authorised in Switzerland, compulsory stockpiling is not applicable.
The FONES list only include the substance, not the administration route. However, this information would be important to ensure the continued supply, for example, of paediatric formulations. This shows that more still needs to be done, both here and in other therapeutic fields.
Antibiotics are particularly affected by all these developments. It is in the nature of their use that they have a defined start of therapy and, above all, a defined end. They are not permanent therapeutic agents, and we have an interest in limiting their use to the necessary minimum. Such antibiotic stewardship makes sense from a public health perspective but is at odds with economic considerations. This is not only a problem with newly-developed antibiotics. It also applies to older antibiotics. We need to handle them with care.
Ultimately, the availability of antibiotics is a public health issue that we cannot discuss independently of the development of resistance and antibiotic stewardship measures.
References
[1] Drug shortages in Switzerland, available from: https://drugshortage.ch (accessed 18 June 2024).
[2] Federal Office for National Economic Supply. Report on National Economic Supply 2017–2020. available from: https://www.bwl.admin.ch (accessed 18 June 2024).
Figure I: Antibiotics shortages over the period 2016–2023, as a number of products from ATC Code J01 [1].
How the COVID-19 pandemic affected antibiotic consumption and extended-spectrum cephalosporin resistance
C. Plüss-Suard 1, M. Gasser 1, O. Friedli 1 and A. Kronenberg 1
1 Swiss Centre for Antibiotic Resistance (ANRESIS), Institute for Infectious Diseases, University of Bern, Bern, Switzerland
The COVID-19 pandemic has affected healthcare systems worldwide, significantly influencing various aspects of antibiotic prescriptions and infection control and prevention. The following studies led by the ANRESIS team describe how antibiotic consumption (1,2) and bloodstream infections (BSIs) caused by E. coli and K. pneumoniae with extended-spectrum cephalosporin resistance (ESCR) [3] have developed over the COVID-19 pandemic period in Switzerland.
In the Swiss inpatient setting, the emergence of COVID-19 did not increase the overall consumption of antibiotics. Compared with 2019, the 2020 total (defined daily doses (DDD)/1000 population/day) inpatient antibiotic consumption decreased (-6.5%), while consumption, measured in DDD per 100 bed-days, remained stable (+1.7%), with a slight increase in ICUs (+4.2%) [1]. In contrast, consump
tion of broad-spectrum antibiotics increased more strongly in 2020 (+12.3% overall and 17.3% in ICUs). Examining monthly data from 4 hospitals, antibiotic consumption in the inpatient setting was highest during the first wave of infections (March 2020–April 2020), probably due to the uncertainty of how to treat COVID-19 patients, followed by a decline with the introduction of more specific treatment guidelines (Figure II). Except during the first wave, both the sales and consumption of all antibiotics across hospitals were below the predicted trend of the pre-COVID-19 period. No correlation was observed between total antibiotic consumption and the number of hospitalised COVID-19 patients. However, a significant positive correlation was observed between the consumption of broad-spectrum antibiotics and increasing numbers of COVID-19 patients.
In the outpatient setting, antibiotic consumption decreased during the pandemic period, returning to pre-pandemic levels in the post-pandemic period [2]. Sales data highlighted a significant reduction in antibiotic use during the pandemic (March 2020–March 2022). The reduction was more pronounced in the French- and Italian-speaking regions (Figure III). Likewise, antibiotic prescriptions for upper respiratory tract
Figure II: Analysis of monthly antibiotic consumption for A) all antibiotics for systemic use (ATC code J01) and B) broadspectrum antibiotics only, for the entire hospital and ICUs between 01/2019 and 06/2021. The solid line shows the estimates of the segmented regression model. The dashed line shows a counterfactual scenario in which the COVID-19 pandemic has not occurred. ICU, intensive care unit; 1st w, 1st wave; Int., intermediate periods; 2nd w, 2nd wave.
infections by practitioners from general and internal medicine and paediatricians participating in the Sentinella network decreased by 36.0% and 50.3%, respectively, during the pandemic, and then changed by +10.1% and -2.6% in the post-pandemic period (April 2022–December 2023) compared to the pre-pandemic period (January 2018–February 2020) (relative change of model estimates).
Focusing on antibiotic resistance, another study primarily highlighted how incidences of multidrug-resistant E. coli and K. pneumoniae varied by geographic region before and during the pandemic, as the geographic regions were impacted to varying degrees by the pandemic (3). The ESCR incidence rates of both pathogens studied were higher in the French- and Italian-speaking parts of Switzerland (“Latin region”) throughout the whole study period (2015–2022) and showed a general upward trend in both regions. Notably, a significant reduction in ESCR-E. coli BSI incidence occurred during the pandemic, particularly in the Latin region, which exhibited the highest COVID-19 incidence (Figure 3A). In contrast, ESCR-K. pneumoniae BSI incidence also decreased initially, but then increased more sharply
during the pandemic in both regions, eventually exceeding pre-pandemic levels (Figure IV B). No associations were found between hospital occupancy by COVID-19 patients and ESCR-incidence or resistance rates. In addition, there was no association between these endpoints and the overall hospital occupancy.
In conclusion, the COVID-19 pandemic led to significant changes in behaviour, which influenced antibiotic consumption and antibiotic resistance in Switzerland during the COVID-19 pandemic. Community-level preventive measures and government-imposed restrictions may have played a more significant role in the observed trends of the studied pathogens and antibiotic consumption over time, particularly in the regions most affected by COVID-19. These measures, which reduced travel, movement, and interpersonal contact, likely contributed to a decrease in pathogen transmission. Antibiotic consumption and antibiotic resistance in Switzerland both seem to have returned to pre-pandemic levels rapidly after cessation of pandemic-related population measures.
Figure III: Analysis of monthly antibiotic sales data by linguistic region in DDD per 1000 inhabitants per day over the period 2018–2023.
Pandemic period
Figure IV: ESCR E. coli (A) and K. pneumoniae (B) BSI incidence in the two different linguistic regions of Switzerland and estimates from a quasi-Poisson model (solid lines). The dashed line shows a counterfactual scenario in which the COVID-19 pandemic has not occurred. The phase from the onset of the pandemic is highlighted in grey.
References
[1] Friedli O, Gasser M, Cusini A, Fulchini R, Vuichard-Gysin D, Halder Tobler R, et al. Impact of the COVID-19 pandemic on inpatient antibiotic consumption in Switzerland. Antibiotics. 2022;11(6):792.
[2] Plüss-Suard C, Friedli O, Labutin A, Gasser M, Müller Y and Kronenberg A. Post-pandemic consumption of outpatient antibiotics in Switzerland up to pre-pandemic levels, 2018–2023: An Interrupted Time Series Analysis [Submitted]
[3] Damonti L, Gasser M, Kronenberg A, Buetti N. Epidemiology of bloodstream infections caused by extended-spectrum cephalosporin-resistant Escherichia coli and Klebsiella pneumoniae in Switzerland, 2015–2022: secular trends and association with the COVID-19 pandemic. Journal of Hospital Infection. 2024 [In Press].
Are antibiotic prescriptions by Swiss family physicians and pediatricians in line with national guidelines?
J. Dunaiceva 1,2, N. Boillat Blanco 3, A. Peytremann 1 , C. Plüss-Suard 4, M. Faouzi 5 and Y. Mueller 1,2
1 Unisanté, University Center for Primary Care and Public Health, Department of Family Medicine, University of Lausanne, Lausanne, Switzerland
2 University of Lausanne, Faculty of Biology and Medicine, Lausanne, Switzerland
3 Lausanne University Hospital and University of Lausanne, Infectious Diseases Service, Lausanne, Switzerland
4 Swiss Centre for Antibiotic Resistance (ANRESIS), Institute for Infectious Diseases, University of Bern, Bern, Switzerland
5 Unisanté, University Centre for Primary Care and Public Health, Department of Epidemiology and Health Systems, University of Lausanne, Lausanne, Switzerland –affiliation of the statistician
Contact address
Jelena Dunaiceva
Unisanté, University Center for Primary Care and Public Health Department of Family Medicine, Lausanne, Switzerland
Pré-du-Marché 23, 1011 Lausanne
jelena.dunaiceva@unisante.ch
Background
Starting in 2019, the Swiss Society of Infectious Diseases introduced national guidelines for common infectious diseases to reduce inappropriate antibiotic prescribing [1]. Inappropriate antibiotic prescribing is defined as prescribing antibiotics when not indicated, or prescribing antibiotics that are not recommended by the guidelines [2]. The majority of antibiotics in Switzerland are prescribed in the outpatient sector, making it important to evaluate prescribing patterns among physicians in this setting [3].
Although several years have passed since the implementation of the guidelines, it remains unclear whether physicians adhere to them. This study aims to determine whether the antibiotic prescriptions of Swiss family physicians and paediatricians align with the national guidelines.
Methods
A cross-sectional study using antibiotic prescription reports from the Sentinella surveillance system for the period 2017–2022 was performed, analysing antibiotic prescriptions by clinical indication.
We compiled a list of clinical indications where a comparison between Sentinella data and national guidelines was possible. This was determined by assessing the compatibility of clinical indications, patient age and sex categories. The list included the following indications: pharyngitis, sinusitis, otitis media, chronic obstructive pulmonary disease exacerbation (COPD; only for adult patients), pneumonia, upper urinary tract infection (UTI) and lower UTI, the last two only for adult female patients.
For each indication for which a national guideline was available, we listed the antibiotics mentioned in the guideline and determined a corresponding antibiotic category in the Sentinella data set. Then, antibiotic categories reported in Sentinella were classified as either recommended or not recommended. Recommended antibiotics included firstand second-line treatments (for example, in case of allergy or comorbidity), proposed by national guidelines for a specific indication. The ‘not recommended’ category included antibiotic classes that were not mentioned in the guidelines for the clinical indication in question.
First, we described the age and sex distribution for the prescriptions available in the dataset. Additionally, for the period during which the guidelines were in place, the proportion of non-recommended antibiotic prescriptions was determined both overall and by clinical indication. The distribution of antibiotic categories was also calculated by clinical indication for the same period. Since the guideline recommendations differentiate between adult patients (16 years and older) and paediatric patients (15 years and younger), the results for these populations were presented separately.
The study was deemed to be out of scope of the Human Research Act by the Cantonal Commission on Research Ethics (CER-VD).
Results
From 1st January 2017 to 31st December 2022, 97,589 antibiotic prescriptions were reported to Sentinella by participating physicians. After exclusion of observations with missing patient-level data, entries from physicians who do not report regularly, as well as clinical indications for which the comparison between Sentinella data and SSI guidelines was not feasible, 52,098 observations were included in the analysis.
35,617 observations concerned adult patients, and 16,481 concerned paediatric patients, from a total of 219 physicians. Median [Interquartile range (IQR)] age for adult patients was 57 [37–74] and 5 for pediatric patients [2–7].
79% (n/N=28,063/35,617) of observations for adult patients and 47% (n/N=7,787/16,481) of observations for paediatric patients, respectively, were from female patients. The overall proportion of antibiotic prescriptions that were not recommended was 18% (n/N=3,897/21,384) for adult patients and 19% (n/N=1,794/9,448) for paediatric patients. For adult patients, the indications with the highest proportions of antibiotic prescriptions that were not recommended were sinusitis – 39% (n/N=1,214/3,098), otitis media – 35% (n/N=494/1,414), COPD exacerbation – 33% (n/N=214/645) and pharyngitis – 29% (n/N=677/2,308) (see Figure V). In paediatric patients, proportions of antibiotics that were not recommended were lower than in adult patients in all indications except for pharyngitis – 38% (n/ N=1,052/2,782) (see Figure V). The most common antibiotic categories that were not recommended in adult patients were beta-lactamase inhibitor combination with penicillin in case of pharyngitis – 24% (n/N=556/2,308), and macrolides for sinusitis – 18% (n/N=543/3,098). In paediatric patients, penicillin for pharyngitis was the most common antibiotic category that was not recommended – 19% (n/ N=526/2,782). Moreover, for several indications the proportion of first-line treatments was less than 50%. Indications with the highest proportions of first-line treatments were pharyngitis in adult patients – 56% (n/N=1,288/2,308), and otitis media in paediatric patients – 67% (n=4,131/6,164).
Discussion
This cross-sectional study using routinely collected prescription data from physicians and pediatricians from the Sentinella surveillance network revealed that for several clinical indications there is a high level of non-adherence to guidelines in terms of choice of antibiotics. However, we were unable to determine whether antibiotic prescription was indicated in the first place, as the Sentinella data has not permitted this type of analysis until now
There are several possible reasons that could underlie the observed low levels of adherence to guidelines, such as guidelines not being adapted to the family medicine context, difficulty in accessing the guidelines or usability [4]. This study highlights that the introduction of guidelines does not automatically result in their use by physicians. Educational and motivational interventions are needed to improve the adherence to the guidelines. Moreover, primary care physicians should be implicated in the development of guidelines to make sure that they are adapted for use in the field.
data, 2019–2022.
Level of recommendation
Not recommended
Recommended
Figure V: Proportion of antibiotic prescriptions not recommended by clinical indication, Sentinella
Conclusion
The prescriptions of antibiotics by Swiss family physicians and paediatricians does not align with national guidelines for several clinical indications. Knowledge gained by this analysis could be used by decision makers for targeted antimicrobial stewardship interventions.
Abbreviations: COPD – chronic obstructive pulmonary disease, UTI – urinary tract infection.
Analyses performed for the period during which guidelines were in place. All guidelines were introduced in 2019, with the exception of the guideline for COPD and pneumonia that was introduced in 2020.
References
[1] Guidelines. Swiss Society for Infectious Diseases. Available from: https://ssi.guidelines.ch/ [Accessed 18.12.2023].
[2] Smith DR, Dolk FCK, Pouwels KB, Christie M, Robotham JV, Smieszek T. Defining the appropriateness and inappropriateness of antibiotic prescribing in primary care. Journal of Antimicrobial Chemotherapy. 2018;73(suppl_2):ii11–ii8.
[3] Federal Office of Public Health and Federal Food Safety and Veterinary Office. Swiss Antibiotic Resistance Report 2022. Usage of Antibiotics and Occurrence of Antibiotic Resistance in Switzerland. November 2022.
[4] Sijbom M, Büchner FL, Saadah NH, Numans ME, de Boer MG. Determinants of inappropriate antibiotic prescription in primary care in developed countries with general practitioners as gatekeepers: a systematic review and construction of a framework. BMJ open. 2023;13(5):e065006.
Hospital antibiotic consumption from the Swiss Point Prevalence Survey
W. Zingg 1
1 Clinic for Infectious Diseases and Hospital Epidemiology, University Hospital Zurich
Since 2017, and with the exception of 2020, Swissnoso organises yearly national point prevalence surveys (CH-PPS) on healthcare-associated infections and the use of antimicrobials in Swiss acute care hospitals. The protocol applies the methodology of the European Centre of Disease Prevention and Control [1]. Hospitals collect data on inpatients, hospitalised on any day between April and June.
For antimicrobial use, the following data are collected: agent (fifth level of the ATC classification) [2], route (parenteral, oral, inhalation), indication as judged by the prescriber (treatment of community-, hospital- or long-term care-acquired infection, surgical or medical prophylaxis), diagnosis by anatomical site in treatments, documentation of the reason for antimicrobial prescription in the patient chart, and change of the current antimicrobial regime. In case of
a regime change, additional information on the last change is collected: escalation, de-escalation, change from intravenous to oral, or any other type of change. Prevalence of antimicrobial use is reported as the percentage of patients receiving one or more antimicrobials on the day of survey. Results are stratified into the indication, diagnosis, treatment change, and the WHO AWaRe categories [3].
In 2017, 2022 and 2023, information on antimicrobial use was available from 12,931 [4], 14,257 and 10,263 patients from 96, 108 and 76 acute care hospitals, respectively. On average, 33% (95% CI: 32.2–33.8%), 33.6% (95% CI: 32.8–34.3%) and 32.6% (95% CI: 31.7–33.5%) of the patients received one or more antimicrobials on the day of the survey. An important quality indicator for appropriate antibiotic prescription is regime change during treatment. Once microbiology allows targeted therapy, antibiotic treatment should be de-escalated from broad-spectrum antibiotics to more specific agents and switched from intravenous (IV) to oral application. In contrast, treatment escalation indicates insufficient or delayed use of microbiological
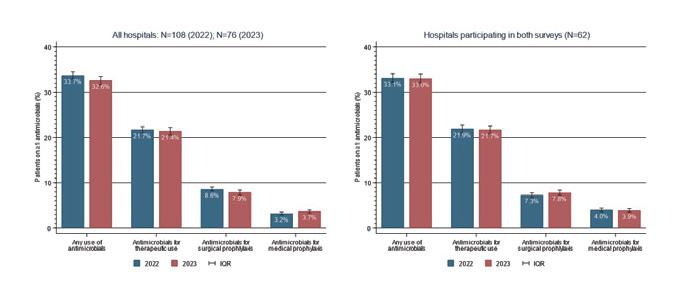
N=108 (2022); N=76 (2023)
Figure VI: indications for antimicrobial use, stratified by year and survey participation.
examination. In 2017, 2022 and 2023, 24.3%, 27.2% and 30.1% of the antimicrobial regimes were changed during treatment. De-escalation decreased from 12.0% in 2017 to 9.8% in 2022, and increased to 11.5% in 2023. Switch from intravenous to oral administration decreased from 9.1% in 2017 to 3.6% and 4.6% in 2022 and 2023. Treatment escalation remained stable with 11.0% in 2017 and 11.3% in both 2022 and 2023. In the European Centre for Disease Prevention and Control point prevalence survey in 2017, treatment de-escalation, a switch from intravenous to oral and escalation were reported for 3.9%, 4.0%, and 10.9% antimicrobial prescriptions, respectively [5]. Together, this concludes a more favourable use of antimicrobials before the COVID-19 pandemic and compared to other European countries. Full results of the Swissnoso Point prevalence surveys on healthcare-associated infections and antimicrobial use in Swiss acute care hospitals 2022 & 2023 are available from: https://www.swissnoso.ch/module/ punktpraevalenz-erhebung-hai/resultate
References
[1] European Centre for Disease Prevention and Control. Point prevalence survey of healthcare-associated infections and antimicrobial use in European acute care hospitals – protocol version 6.1. Stockholm: ECDC; 2022.
[2] www.who.int/tools/atc-ddd-toolkit/atc-classification
[3] www.who.int/publications/i/item/2021-awareclassification
[4] Zingg W, et al. Euro Surveill 2019;24:1900015
[5] Plachouras D, et al. Euro Surveill 2018;23:1800393
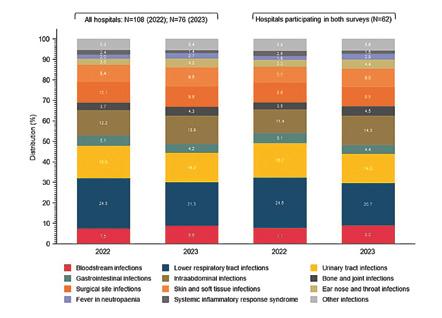
Figure VII: Diagnoses for antimicrobial use, stratified by year and survey participation.
Antimicrobial consumption in veterinary medicine
5 Antimicrobial consumption in veterinary medicine
A) Sales of antimicrobials for use in veterinary medicine
5.1 Sales of antimicrobials for use in all animal species
The sales of antimicrobials continues to decline (Table 5. a).
In 2022, with sales of 24,929 kg, the decline compared to the previous year was 11.8%. The decrease was less pronounced in 2023, with 2.3% (total volume 24,359 kg). Since 2014, the total decline amounts to 48.1% (22,591 kg). The decrease is mainly due to reduced sales of medicated premixes and other orally administered preparations.
Since 2018, the order of the different antibiotic classes has been the same in terms of sales volumes: penicillins are the most sold antibiotics, followed by sulfonamides and tetracyclines. These three classes are often sold as medicated premixes in large packages.
The quantity of sold antibiotics approved only for companion animals comprised 2.9% of the total volume in 2023. Regarding the sales of critically important antibiotic classes (Annex 5, TAMV, RS 812.212.27), the sales of all three active ingredient classes have declined. Macrolides fell by 22.4% between 2021 and 2023. However, there was an increase of 20% from 2022 to 2023. Fluoroquinolones declined steadily and were reduced by 25.3% in 2023 compared to 2021. The sales of third- and fourth-generation cephalosporins decreased by approximately 34% between 2021 and 2023.
Grouped according to the administration route, the order of antimicrobial volumes has remained unchanged compared to previous years (Table 5. b). The largest volumes are products licenced for oral application (2022: 52%, 2023: 54%), followed by parenteral (2022: 33%, 2023: 34%), intramammary (2022: 12%, 2023: 9%), intrauterine (2%) and topical formulations (1%). As in previous years, products authorised for oral use were mainly sold as medicated premixes.
* Lincosamides, imidazoles, nitrofurans, pleuromutilins, polypeptides excluding polymyxins (until 2013), steroidal antibiotics, quinolones (until 2014)
Table 5. a: Sales (kg) of antibiotic classes between 2014 and 2023.
* Tablets, capsules, powders, suspensions, granules
** Ointments, drops, gels
5.2 Sales of antimicrobials for use in livestock
5.2.1 General
The amount of antimicrobials sold for use in livestock includes products approved only for livestock species and products approved for livestock and companion animal species (mixed registrations). This is in accordance with the reporting procedure used by the ESVAC (European Surveillance of Veterinary Antimicrobial Consumption, EMA) project [1]. Since 2014, the amount of sales of products approved for use in livestock has decreased continuously and in total by 49%. Penicillins account for the bulk of active substance, followed by sulfonamides and tetracyclines. Critically important antibiotics were also sold less than in previous years. The sales of macrolides decreased by more than 22% between 2021 and 2023, but with the lowest quantity in 2022 (Table 5. c). Even the sales of long-acting, single-dose injection products followed a downward trend. Decreasing sales of fluoroquinolones and third- and fourth-generation cephalosporins started in 2016. Fluoroquinolones decreased by 21% in 2022 compared to the previous year and 4% in 2023; third- and fourth-generation cephalosporins decreased by 11% in 2022, and by 19% in 2023. Overall, since 2014, critically important antibiotics have decreased by approximately 76%. One of the explanations for this positive development is the revision of the Ordinance on Veterinary Medicinal Products, which
came into effect in April 2016. Since then, macrolides, fluoroquinolones and third- and fourth-generation cephalosporins, summarised in the Ordinance and designated as “critical antimicrobials,” are not allowed to be dispensed on stock for livestock.
For some years now, the goal has been to reduce the use of colistin in veterinary medicine to a very low level, as colistin has become the last resort treatment for life-threatening infections caused by carbapenem-resistant Enterobacteriaceae in human medicine. The sales of colistin have declined by approximately 96% since 2014. Expressed in correlation to the biomass under exposure (population correction unit, PCU), (see Chapter 5.2.2 below), the level in 2023 is 0.04 mg colistin/PCU for Switzerland. This is below the European average and far below the requested reduction of colistin to a level of 1 mg/PCU or lower for European countries.
5.2.2 Antimicrobial sales in relation to the livestock population weight (population correction unit method)
The total amount of sales of antimicrobials depends mainly on the size of the animal population. To compare sales in individual countries and across countries, the ESVAC project has developed a method to express antimicrobial sales correlated to the biomass of the livestock population based on available data sources for European countries [1]. To do so, the quantity of active substances is divided by the sum of the
Table 5. b: Sales (kg) of antimicrobials according to the administration route between 2014 and 2023.
estimated most likely weight at treatment of livestock animals in a given year. This denominator is termed population correction unit (PCU). The PCU is a technical unit of measurement aiming to normalise antibiotic treatments and livestock populations specifically for the comparison between countries. It consists of the number of dairy cows, sheep, sows and horses in the standing population and the number of slaughtered cattle, pigs, lambs, horses, poultry and turkeys in the corresponding year multiplied by the estimated weight in kg at the time of treatment. Imports and exports of live animals are also taken into account. Companion animals and certain livestock species are not taken into account, the number and other data being unknown in most countries.
Figure 5. a shows antimicrobial sales for livestock animals in Switzerland and PCU for 2014 to 2023. In the last ten years, sales of antimicrobials have decreased, while the population biomass has remained roughly constant. The reduction of milligrams active substances per kilogram PCU indicates that the decrease of sales of antimicrobials is not due to a decrease of the livestock population. Thus, it is most likely that the reduction in sales is due to a reduction in the use of antibiotics. The efforts made in Switzerland within the framework of the Swiss Stategy on Antibiotic Resistance (StAR) [3] seem to have a persistent positive effect on the awareness of veterinarians and farmers, promoting prudent use of antimicrobials in Switzerland.
Table 5. c: Sales (kg) of different antibiotic classes licenced for livestock animals between 2014 and 2023.
* Lincosamide, pleuromutilins, quinolones, amphenicols (until 2012)
Figure 5. a: Antimicrobial sales for livestock animals between 2014 and 2023 compared to the population biomass (total PCU) and the sales of active ingredients per PCU
Table 5. d: Sales (kg) of antimicrobials licenced as premixes between 2014 and 2023, according to
* Pleuromutilins, fluoroquinolones, lincosamide (until 2017), aminoglycosides (until 2017), quinolones (until 2014)
5.2.3 Medicated premixes
Medicated premixes accounted for 35% of the total sales in 2022 and 36% in 2023. A steady and above-average decrease in sales of medicated premixes has been observed since 2010 (–80%). Tetracyclines, penicillins, and sulfonamides are the three main classes of active substances contained in premixes (Table 5. d). These products account for the largest share of the decline in antimicrobial sales. Medicated premixes are available in several combinations of one, two or three active substances and are used mainly for fattening calves, pigs and broilers. One supplier of medicated premixes did not renew its marketing authorisations for 2022. As a result, the number of available medicated premixes has fallen sharply (Table 5.d). Likewise, supply bottlenecks for approved medicated premixes have also had a greater impact since then, due to a lack of alternatives.
5.2.4
Antimicrobials authorised for intramammary use
In the last number of years, the sales of products for intramammary use have remained stable, with small fluctuations. The amount has decreased by nearly 53% since 2008. In 2022 and 2023, between 69 and 60% of all antimicrobials licenced for intramammary use were products for the treatment of mastitis during lactation. The sales of products for drying off increased in 2022 (13%), then decreased in 2023 (6%), whereas the sales of products for use during lactation stabilised in 2022 and decreased heavily in 2023 (36%) (Table 5.e and Fig. 5.b). The sharp decline in sales figures in 2023 is at least partly due to the unavailability of some frequently used preparations in 2023. These gaps were filled by direct imports by veterinarians, although these do not appear in the distribution statistics.
Figure 5. b: Sales of antimicrobials (in kg) licenced for intramammary use between 2014 and 2023, separated into dry cow products and products for use during lactation
The ranking by antibiotic classes shows that penicillins predominate, accounting for 84% of all active substances administered into the udder (Table 5. e). Sales of products containing cephalosporins (all generations) for the treatment of mastitis during lactation have increased in the last years (37% since 2014).
5.3 Sales of antimicrobials licenced for companion animals
The quantity of antibiotics approved exclusively for use in companion animals amounts to approximately 3% of the total volume. Since 2014, products licenced for both livestock and companion animals are subsumed to the “livestock” category in accordance with ESVAC project guidelines [2]. This is especially relevant to products for parenteral application, as the majority of these products are licenced for both livestock and companion animals. Consequence, there is an underestimation of the use in companion animals.
The amount of active substance sold for companion animals only was 784 kg in 2022 and 702 kg in 2023; sales have decreased in the last number of years, by 10% in 2022 and 2021. Since 2014, antimicrobial sales for companion animals have decreased by approximately 17%. Penicillins were the most important active substance group, followed by cephalosporins (all generations), imidazole and fluoroquinolones (Table 5. f). The decreasing trend of sales of cephalosporins has continued over the past year (2022: 11%, 2023: 2%). The increase of imidazole use in companion animals is mainly due to new licenced products containing metronidazole, even if a decrease of 16% was identified between 2022 and 2023.
5.4 Discussion
There is a consistent and acute awareness among both veterinarians and farmers regarding the prudent use of antimicrobials. The decrease in the volume of antimicrobials sold for use in veterinary medicine continues. This is mainly due to a fall in the sales of medicated premixes. In addi -
Table 5. e: Sales (kg) of antimicrobials licenced for intramammary use between 2014 and 2023 according to antibiotic class.
Dry cow products
Products for use during lactation
* Lincosamides, macrolides, polymyxins (until 2015)
Table 5. f: Sales (kg) of antibiotic classes licenced for companion animals between 2014 and 2023.
tion, the constant decline in sales of critically important antibiotic classes is encouraging. The reduction of milligram active substance per PCU indicates that the reason for the decrease is most likely a reduced number of treatments. However, the data should be interpreted cautiously as they comprise only sales figures and the weight as an indicator. Relevant information about livestock or companion animals, target species, route of administration (parenteral, oral, topical/external, intrauterine, intramammary) and galenics are solely based on the marketing authorisation (summary of product characteristics). Therefore, in contrast to the section below, this section of the report, based on sales data, does not contain any information regarding actual use at species level; e.g., different dosages for different antibiotic classes and target species are not taken into account and can differ widely. ESVAC has published technical units of measurements to report antimicrobial consumption data in the main livestock species [4]. The DDDvet indicator is broadly in line with the defined daily doses (DDD) used in human medicine. However, many other technical units of measurement to report antimicrobial consumption data in animals are available. Of these, both dose-based and treatment-based units of measurement are suitable for certain tasks.
References
[1] European Medicines Agency, European Surveillance of Veterinary Antimicrobial Consumption, 2022. 'Sales of veterinary antimicrobial agents in 31 European countries in 2022' (EMA/299538/2023).
[2] European Medicines Agency 2016. Updated advice on the use of colistin products in animals within the European Union: development of resistance and possible impact on human and animal health (EMA/231573/2016).
[3] Swiss Confederation 2015. Strategy on antibiotic resistance Switzerland.
[4] European Medicines Agency, European Surveillance of Veterinary Antimicrobial Consumption, 2016. Defined daily doses for animals (DDDvet) and defined course doses for animals (DCDvet) (EMA/224954/2016).
B) Prescriptions of antimicrobials in veterinary medicine
5.5 Introduction
Since October 2019, all prescriptions of antibiotics must be recorded by veterinarians in the information system for antibiotics in veterinary medicine (IS ABV). The analyses in this section are based on the data recorded in IS ABV for the years 2020 to 2023 [1]. In the first reports, the antibiotic quantities, the number of prescriptions and the number of animal treatments were evaluated for livestock and companion animals [1]. Most of our indicators are presented in absolute values, which render comparisons difficult across species. They are meant to be interpreted only as an initial indication. Nonetheless, to deepen our analysis on the usage of antimicrobials in animals, we used an indicator accounting for population variations between species. This allows direct comparison between species even if their representation in the general population varies greatly.
5.6 Antimicrobial usage in livestock
This part of the report presents the analyses of the 2020 to 2023 IS ABV data for livestock. Veterinarians are obligated to register all prescriptions for livestock in IS ABV. In this report, we present the results of our analysis on antimicrobial usage in livestock for the year 2023, with a special focus on cattle, pigs, poultry and small ruminants (i.e. sheep and goats). For livestock, the number of prescriptions is highest for individual therapies (80% in 2023), followed by dispensing on stock (19% in 2023) and group therapies (1% in 2023) (Figure 5. c).
Figure 5. c: Total number of prescriptions per prescription type for livestock in Switzerland (2020–2023).
5. d: Number of animal treatments per 1000 animals for livestock species in Switzerland (2020–2023).
5. e: Distribution of the total antibiotic consumption per antibiotic class and livestock species in Switzerland (2020–2023).
3rd and 4th generation cephalosporins* 1st and 2nd generation cephalosporins
Sulfonamides Penicillins * critical antimicrobials
Figure
Figure
5. f: Percentage of animal treatments per indication for livestock species in Switzerland (2020–2023)
Young animal diseases
Surgery or other interventions
Specific infections
Respiratory and cardiological disorders
Other
Oral infections including teeth and gastrointestinal tract
The distribution of the number of antibiotic treatments per 1000 animals (Figure 5. d) illustrates that cattle are, by far, more often treated with antibiotics than other livestock species. In 2023, cattle received 564 treatments per 1000 animals. In comparison, poultry received 76.3 treatments, small ruminants received 60 treatments and pigs received 23.3 treatments. These figures do not include the treatments carried out with the preparations dispensed on stock.
In accordance with the sales data for 2023, the main prescribed antibiotic class for all livestock species was penicillin (Figure 5. e). Sulfonamides and tetracyclines were the next two often-used classes (Figure 5. e). Critical antibiotics (i.e. fluoroquinolones, macrolides 3rd - and 4th -generation cephalosporines) represent only a small proportion (3.5%) of the antibiotics prescribed in 2023 in all species, with macrolides constituting the largest proportion.
In 2023, the order of highest consumption of antibiotic classes for each species was as follows:
– Cattle were mostly prescribed penicillins (40.8%), tetracyclines (22.3%) and sulfonamides (18.5%). The other antibiotic classes represent less than 20% of all consumption for cattle.
Mastitis and other udder or mammary diseases
Infection of gastrointestinal tract
Fertility and lactation disorders
Disease of the musculoskeletal system
– Pigs were mostly prescribed penicillins (45.6%), tetracyclines (24.6%) and sulfonamides (17.6%). Other antibiotics represented less than 15% of antibiotic consumption for pigs.
– Poultry were mostly prescribed sulfonamides (47.3%) and penicillins (33.8%). Other antibiotic classes were prescribed significantly less often.
– Small ruminants were mainly prescribed sulfonamides (32.4%), penicillins (29.5%) and tetracyclines (20.3%). Aminoglycosides (13.2%) were also frequently prescribed. Other antibiotic classes represented less than 5%.
Antimicrobials are prescribed for different indications, depending on the livestock species (Figure 5. f). Cattle mainly received antimicrobials for mastitis and other udder/mammary diseases (30.3% in 2023), respiratory and cardiological disorders (28.2%) and young animal diseases (18.4%). Pigs received antimicrobials mainly for infections of the gastrointestinal tract (53.6% in 2023). Poultry needed antimicrobials for young animal diseases (85.0% in 2023) and specific poultry infections (13.4%). Small ruminants were prescribed antimicrobials in case of respiratory and cardiological diseases (32.0% in 2023), followed by fertility and lactation disorders (20.3%). This pattern of antibiotic usage remains constant over the years for each species.
Figure
5.7 Antimicrobial usage in companion animals
This part of the report presents the analyses on antimicrobial usage from 2020 to 2023 based on IS ABV data, focusing on dogs, cats and equines. The later include all equines, regardless of whether they are kept as livestock or not.
The main antibiotic classes prescribed in 2023 for companion animals were sulfonamides (50.0%) and penicillins (25.8%). Equines differed from the other two species in the repartition of the total amount of antibiotics (Figure 5. g). For equines, the main consumption concerned sulfonamides, diaminopyrimidine derivatives, and penicillins. In contrast, for cats and dogs, penicillins, cephalosporins and
imidazoles represented the largest share of the antibiotic consumption in 2023. With 1.2%, critical antibiotics represented only a small amount of antibiotics prescribed in all species. The most represented critical antimicrobial was fluoroquinolones.
Main indications for antimicrobial treatments differed between companion animals (Figure 5. h). Equines mainly received antimicrobials to treat diseases of the musculoskeletal system (34.0% in 2023) and after surgeries (7.8%) (Figure 5. h). In 2023, dogs and cats needed antimicrobial treatment for skin diseases (24.5% for dogs, 28.5% for cats), and oral infections and gastrointestinal tract diseases (23.2% for dogs, 16.1% for cats) (Figure 5. h). The pattern of usage of antimicrobial for each species is constant over the years.
Imidazole
Cephalosporins (all generations)
Fluoroquinolones *
Amphenicols
Others
Diaminopyrimidine derivatives
Macrolides *
Aminoglycosides
Tetracyclines
Sulfonamides
Penicillins * critical antimicrobials
Figure 5. g: Distribution of the total antibiotic consumption per antibiotic class and companion animal species in Switzerland (2020–2023).
Figure 5. h: Percentage of animal treatments per indication for companion animals in Switzerland (2020–2023)
Urogenital diseases and reproductive disorders
Surgery or other interventions
Species specific infections
Respiratory and cardiological disorders
Other
Oral infections including teeth and gastrointestinal tract
5.8 Summary
This report presents an overview of the first 4 years of data registered in IS ABV (2020–2023). This comprehensive database is crucial in the analysis of antimicrobial consumption across Switzerland. It provides us with real-world data and allows for a detailed and precise monitoring of antimicrobial usage within the country. The commitment of veterinarians is essential in providing us with data, the quality of which has tremendously improved thanks to the dedication of all actors involved.
For some indicators, population size was taken into account in the analysis of the frequency for each species to receive antimicrobial treatment. Cattle receive antimicrobial treatments more frequently compared to other species. Cattle received antibiotics 7 times more often than poultry, 9 times more often than small ruminants and close to 25 times more often than pigs. However, these figures do not include the treatments carried out with the preparations dispensed on stock.
Mastitis and other udder or mammary diseases
Infection of gastrointestinal tract
Diseases of the skin (including ears)
Disease of the musculoskeletal system
Central nervous and sensory organ diseases
Penicillins, tetracyclines and sulfonamides are the most prescribed antimicrobial classes in livestock overall. In companion animals, penicillins and sulfonamides represent the majority of the prescribed antimicrobial classes. Administration of critical antimicrobials remains low in both livestock and companion animals in Switzerland.
References
[1] Federal Food Safety and Veterinary Office (FSVO) Bericht zum Antibiotikaverbrauch in der Veterinärmedizin (IS ABV-Bericht) – Vertrieb und Verschreibungen von Antibiotika bei Tieren in der Schweiz – 2023.
Resistance in bacteria from human clinical isolates
6 Resistance in bacteria from human clinical isolates
6.1 Escherichia coli
Escherichia coli is the most frequent Gram-negative microorganism causing bacteremia and the most frequent pathogen in humans. It is a coloniser of the intestinal tract and as such the most frequent microorganism causing urinary tract infections. As urinary tract infections are (after respiratory tract infections) the second most frequent infectious disease in ambulatory care, increasing resistance trends directly affect both hospital and ambulatory settings.
In 2023, resistance to fosfomycin and nitrofurantoin, both recommended for the treatment of cystitis, was still very low (Table 6. a). However, resistance to fosfomycin increased slightly but significantly from 1.1% in 2014 to 2.2% in 2023, while nitrofurantoin resistance decreased significantly during this period from 2 to 0.5% (Figure 6. a).
Trimethoprim-sulfamethoxazole remains a first-line option
for lower urinary tract infections (https://ssi.guidelines.ch). Its resistance rate decreased significantly from 28.0% in 2014 to 26.8% in 2023. As E. coli is one of the most important pathogens in the outpatient setting as well, resistance rates of outpatient urinary samples (non-invasive samples) are compared with those of invasive samples (Figure 6. b). These data not only show significantly lower resistance rates in urinary samples for trimethoprim-sulfamethoxazole (20.4% in 2023), but for most of the antibiotics tested (except for carbapenems, nitrofurantoin and fosfomycin). Since resistance testing is usually not performed for uncomplicated lower urinary tract infections, the ANRESIS data still overestimate the resistance rates. In a recent study by A. Plate et al. [1], susceptibility rates to trimethoprim-sulfamethoxazole in uncomplicated lower urinary tract infections were 85.7%.
1 Carbapenems: imipenem, meropenem
2 Fluoroquinolones: ciprofloxacin, norfloxacin, ofloxacin
*West (GE, NE, VD, JU, FR), South (TI), North–East (other cantons) according to linguistic regions. **Trends were modelled with logistic regressions. Arrows represent a significant effect (p < 0.05) of the year on the corresponding outcome (increase, decrease). ***95% confidence intervals (CI) were calculated by the Wilson score method.
Table 6. a: Resistance rates of invasive Escherichia coli isolates in humans in 2023.
6. a: Resistance rates in invasive Escherichia coli isolates in humans between 2014 and 2023.
Aminopenicillins
Amoxicillin-clavulanic acid
Piperacillin-tazobactam
Cephalosporin, 2nd gen.
Cephalosporin, 3rd/4th gen.
Carbapenems
Aminoglycosides
Trimethoprimsulfamethoxazole
Fluoroquinolones
Nitrofurantoin
Fosfomycin
Figure 6. b: Comparison of resistance rates (%) in invasive versus outpatient urinary samples in Escherichia coli isolates in humans for 2023.
Aminopenicillins
Amoxicillin-clavulanic acid
Piperacillin-tazobactam
Cephalosporin 2nd gen.
Cephalosporin 3rd/4th gen.
Carbapenems
Aminoglycosides
Trimethoprim-sulfamethoxazole
Fluoroquinolones
Nitrofurantoin
Fosfomycin
n=5503
n=106410
n=5600
n=114794
n=6113
n=6237
n=6196
n=119823
n=6562
n=1823
n=115855
n=2409
n=98999
n=3995
n=96499
n=6253
n=81945
n=78570
n=79996
Percent of resistant isolates in invasive samples
Percent of resistant isolates in non-invasive urinary samples
n=119463
n=6580
n=104890
n = number of isolates tested with error bars indicating 95% confidence intervals. Fisher Exact Tests were performed to assess for independence: * = p-value <0.05; ** = p-value <0.01.
Figure
Fluoroquinolones should not be used as first-line treatment for lower urinary tract infections, in particular, so as to preserve their efficacy against invasive infections. In invasive samples Fluoroquinolone resistance increased steadily from 10.3% in 2004 to 18.2% in 2014, but then decreased slightly to 16.2% in 2022, increasing again to 19% in 2023. There are different explanations for this temporal decrease, such as i) the integration of resistance data from smaller laboratories within ANRESIS (which tend to have lower resistance rates), ii) the 2020–2022 COVID pandemic, leading to decreasing resistance trends in several countries, and iii) the decrease in quinolone use in Swiss outpatients during the same time period. A similar trend was observed in EU/ EEA states, with a decrease from 26.9 to 21.9% between 2017 and 2021. [2]
As for quinolones, resistance rates in invasive samples to third-/fourth-generation cephalosporins increased steadily from 9.2% in 2014 (0.9% in 2004) to 12.1% in 2023. This in -
crease has also been significant over the last 4 years, while a slight but significant decrease from 15.6% to 13.8% was observed in EU/EEA countries between 2017 and 2021. [2] However, large differences, ranging from 9.6 to 51.6%, were observed between countries located in Europe and nearby geographical areas. [2] As third-generation cephalosporin resistant E. coli lead to a high disease burden [3] , these trends are of special interest.
Significant increases in resistance in invasive isolates over the last 10 years were also observed for β -lactam- β -lactamase-inhibitor-combinations (amoxicillin-clavulanic acid from 21.5 to 28.1%, piperacillin-tazobactam from 4.3 to 8.6%) and aminoglycosides (8.0 to 10.0%). For all antibiotics tested, resistance rates were highest in the western part of Switzerland and mostly lowest in Ticino (Table 6 a.). Multidrug resistance was frequent. However, no clear trend was observed for E. coli isolates resistant to two to five groups of antibiotics over the last ten years (Table 6. b, Figure 6. c).
Table 6. b: Resistance combinations in invasive E. coli isolates in humans 2023. Only isolates tested against all five antibiotic groups (aminopenicillins, third-generation cephalosporins, carbapenems, aminoglycosides, fluoroquinolones) were considered (n=4823/6595[73.1%]).
Fully susceptible
Resistance to one antibiotic group
Resistance to two antibiotic groups
Carbapenem resistance in E. coli is still very rare (0.1% in invasive isolates) and comparable to the EU/EEA population-weighted mean (0.2% in 2021). [2] However, 8/44 (18%) EU/EEA countries and neighbouring countries reported percentages of 1% or above, namely Belarus, Cyprus, Georgia, Greece, Russia, Serbia, Turkey and Ukraine. While there was no significant trend in Switzerland, a slight but significant increase from 0.1% to 0.2% between 2017 and 2021 was observed in EU/EEA countries, and increasing rates of carbapenemase-producing Enterobacterales (CPE) worldwide are alarming. To better understand these trends, knowledge of the genetic mechanisms is needed. The Federal Office of Public Health therefore introduced mandatory reporting of CPE in January 2016, and since 2019 all strains are collected by the National Reference Centre for Emerging Antibiotic Resistance in Fribourg (NARA, www.nara-antibiotic-resistance.ch, see also Infobox 7) for a more in-depth characterisation. A detailed analysis of Swiss CPE data from 2013 to 2018 has been published in Eurosurveillance [4] , and updated data are regularly displayed on the ANRESIS homepage (www.anresis.ch).
In future, colistin, a rather toxic reserve antibiotic belonging to the polymyxin group, may become more important as a “last resort antibiotic” for the treatment of infections caused by carbapenemase producers. Acquired colistin resistance in E. coli is rare in Switzerland, but reports from China, describing a mobile plasmid encoding a colistin resistance gene (mcr types) were worrisome until the use of colistin in animals was banned in China. [5] [6] Some small surveys performed in Switzerland have shown a very rare
Resistance to three antibiotic groups
Resistance to four antibiotic groups
Resistance to five antibiotic groups
spread of mcr producers among human isolates. [7] [8] So far, colistin resistance is not systematically tested in Switzerland, although testing algorithms and adequate testing methods have been published by the NARA.
6.2 Klebsiella pneumoniae
Klebsiella spp. are frequent colonisers of the gastrointestinal tract. Although they may also occur in the outpatient setting, they are more frequently found in the hospital setting, affecting patients with an impaired immune system. The most common sites of infection are the urinary tract and the lung (pneumonia). Unlike E. coli, they are intrinsically resistant to aminopenicillins.
In this report, we present the data on K. pneumoniae, the most frequent species of the genus Klebsiella isolated from human clinical isolates. As species identification is increasingly performed by MALDI-TOF since 2017, a growing number of laboratories report K. variicola separately from K. pneumoniae. Although an ANRESIS study showed that K. variicola tend to be less resistant than K. pneumoniae, [9] in this report (in analogy to international reports), we grouped all K. pneumoniae complex species such as K. pneumoniae, K. quasipneumoniae and K. variicola together.
As for E. coli, increasing resistance to third-/fourth-generation cephalosporins was a main issue between 2004
Figure 6. c: Multiresistance in invasive E. coli isolates in humans between 2014 and 2023 (for details refer to Table 6. b).
(1%) and 2014 (10%). However, during the last ten years, the resistance rate remained stable (9.5% in 2023, Table 6. c, Figure 6. d), which compares favourably with the EU/ EEA average of 34.3% in 2021. A stabilisation of resistance rates was also observed in EU/EEA states between 2017 and 2021. [2] However, significant increases in antibiotic resistance from 2014 to 2023 were observed for other β -lactams (amoxicillin-clavulanic acid from 12.3% to 17%, piperacillin-tazobactam from 6.1% to 14%, 2nd -generation
cephalosporins from 10.9% to 14.5%) and fluoroquinolones (7% to 12%). Following a significant increase over the last 4 years, the carbapene resistance rate in K. pneumoniae was slightly above 1% in 2023 for the first time, which is still significantly below the mean EU/EEA rate of 11.7% in 2021. However, this EU/EEA mean corresponds to values from many different countries, with northern European countries reporting more similar rates to those observed in Switzerland.
1 Carbapenems: imipenem, meropenem
2 Fluoroquinolones: ciprofloxacin, norfloxacin, ofloxacin
*West (GE, NE, VD, JU, FR), South (TI), North–East (other cantons) according to linguistic regions. **Trends were modelled with logistic regressions. Arrows represent a significant effect (p < 0.05) of the year on the corresponding outcome (increase, decrease). ***95% confidence intervals (CI) were calculated by the Wilson score method.
6. d: Resistance rates in invasive Klebsiella pneumoniae isolates in humans 2014–2023.
Amoxicillin-clavulanic acid
Piperacillin-tazobactam
Cephalosporin, 2nd gen.
Cephalosporin, 3rd/4th gen.
Carbapenems
Aminoglycosides
Trimethoprimsulfamethoxazole
Fluoroquinolones
Table 6. c: Resistance rates of invasive Klebsiella pneumoniae isolates in humans in 2023.
Figure
As for E. coli, considerable differences were observed between different Swiss regions (Table 6. c), with higher resistance rates to all antibiotics tested in western Switzerland, except for amoxicillin-clavulanic acid and carbapenems, for which highest resistance rates were observed in southern Switzerland. K. pneumoniae is the species in which CPE has been most frequently detected in the last decade. [10] Regarding the genotype, NDM has become more common
than OXA-48 in the last two years (https://www.anresis.ch/ antibiotic-resistance/resistance-data-human-medicine/ ). Pan-susceptibility decreased from 88% in 2014 to 85% in 2023. Details on co-resistances are depicted in Table 6. d and Figure 6. e.
Table 6. d: Resistance combinations in invasive K. pneumoniae isolates in humans in 2023. Only isolates tested against all four antibiotic groups (third-generation cephalosporins, carbapenems, aminoglycosides, fluoroquinolones) were considered (n= 1427/1596 [89.4%]).
Figure 6. e: Multiresistance in invasive K. pneumoniae isolates in humans from 2014–2023 (for details refer to Table 6. d).
6.3 Pseudomonas aeruginosa
Pseudomonas aeruginosa is a non-fermentative Gram-negative rod and the most important human pathogen in this group of bacteria. P. aeruginosa is one of the leading causes of nosocomial respiratory tract infections and is also found in hospital-acquired urinary tract, wound and bloodstream infections. It is a significant pathogen, especially in burn unit and ICU patients. Mucoid strains frequently infect cystic fibrosis patients and are very difficult to eradicate. The most common community-acquired infections caused by P. aeruginosa in immunocompetent hosts are external otitis (swimmer's ear) and sinusitis.
P. aeruginosa is intrinsically resistant to amoxicillin, amoxicillin-clavulanic acid, first- and second-generation cephalosporins, cefixime, cefpodoxime, ceftriaxone, ertapenem, trimethoprim-sulfamethoxazole as well as tetracyclines, including tigecycline. Quinolones are among the rare orally given antibiotics which retain activity against P. aeruginosa. In Switzerland, resistance rates in 2023 were highest for aminoglycosides (15.5%), followed by piperacillin-tazobactam (11.4%). Resistance rates below 10% were observed for carbapenems, ceftazidime / cefepime and ciprofloxacin. Swiss regional data and trends are shown in Table 6. e and Figure 6. f, data on co-resistance in Table 6. f and Figure 6. g. Increasing resistance rates from 2014 to 2023 were ob -
6. e: Resistance rates of invasive Pseudomonas aeruginosa isolates in humans 2023.
1 Carbapenems: imipenem, meropenem
2 Fluoroquinolones: ciprofloxacin, norfloxacin, ofloxacin
*West (GE, NE, VD, JU, FR), South (TI), North–East (other cantons) according to linguistic regions. **Trends were modelled with logistic regressions. Arrows represent a significant effect (p < 0.05) of the year on the corresponding outcome (increase, decrease). ***95% confidence intervals (CI) were calculated by the Wilson score method.
Figure 6. f: Resistance rates in invasive Pseudomonas aeruginosa isolates in humans 2014–2023.
Piperacillin-tazobactam
Ceftazidime
Cefepime
Carbapenems
Aminoglycosides
Ciprofloxacin
Table
Table 6. f: Resistance combinations in invasive P. aeruginosa isolates in humans in 2023. Only isolates tested against all five antibiotics or antibiotic groups (piperacillin-tazobactam, cefepime, carbapenems, aminoglycosides, ciprofloxacin) were considered (n= 659/805 [81.9%]).
Figure 6. g: Multiresistance in invasive Pseudomonas aeruginosa isolates in humans between 2014 and 2023 (for details refer to Table 6. f).
served for aminoglycosides (8.6% to 15.5%), whereas no significant changes were observed for the other antibiotics (Table 6. e and Figure 6. f.). With regard to pan-susceptibility, a considerable reduction from 74% to 67% was observed during this time period. (Figure 6. g.). Regional differences in aminoglycoside resistance could also be explained, at least in part, by different testing algorithms. (As cross-resistance between different aminoglycosides is variable within P. aeruginosa [11], results depend on the individual substances tested.) In addition, we suspect a “dilution” effect in the data presented in this report, as data from additional smaller hospitals (which tend to have lower resistance rates) have continuously been included over the last decade.
When correcting for this effect, we indeed observed significantly increasing resistance trends from 2010 to 2022 for cefepime, ceftazidime, ciprofloxacin and piperacillin-tazobactam, but not for carbapenems, aminoglycosides, or multidrug-resistant P. aeruginosa. [12] For most antibiotics, the increase observed in this study was most dominant from 2010 to 2014, thus before the period analysed in this report. In addition, this study describes a significant increase in the annual incidence of P. aeruginosa blood stream infections (BSI) in Switzerland, from 5.5 BSIs per 100,000 inhabitants in 2010 to 7.6 BSIs per 100,000 inhabitants in 2022.
Comparison with European resistance data is difficult, as there is wide variation between different European countries, but EU/EEA population-weighted mean resistance rates decreased for most antibiotics between 2017 and 2021. [2]
6.4 Acinetobacter spp.
Acinetobacter spp. are Gram-negative, strictly aerobic coccobacilli. These opportunistic pathogens have an increased capacity to survive for prolonged periods in the hospital environment, can also be found in soil and water, and are intrinsically resistant to many antibiotic agents. Acinetobacter spp. can roughly be divided into two groups: the Acinetobacter calcoaceticus – Acinetobacter baumannii (ACB) complex and the non-ACB group, including a large number of environmental species with low pathogenicity. Due to the difficulty of correct identification at species level, hereinafter only resistance trends at genus level are analysed, in accordance with the EARS-Net and CAESAR European resistance networks.
Acinetobacter spp. infections are an important cause of hospital-acquired infections in immunocompromised patients. They can cause respiratory, urinary and wound infections, and septicemia. Risk factors for multidrug-resistant Acinetobacter spp. are severe underlying diseases and prolonged hospital stays, especially in ICUs during antibiotic administration and/or mechanical ventilation.
In general, resistance rates between 13% and 18% were observed for all antibiotics analysed (Table 6. g). In 2023, pan-susceptibility was noted in 81.4% of the isolates (Table 6. h, Figure 6. i). Interestingly, resistance rates were lower in 2018 and 2019, but then increased again, reaching the levels of previous years. The long-term trend was only statistically significant for carbapenems, where resistance rates rose from 5.6 to 13% (Table 6. g and Figure 6. h). In contrast to most other bacteria, resistance rates were highest in north-eastern Switzerland for all antibiotics tested.
1 Carbapenems: imipenem, meropenem *West (GE, NE, VD, JU, FR), South (TI), North–East (other cantons) according to linguistic regions. **Trends were modelled with logistic regressions. Arrows represent a significant effect (p < 0.05) of the year on the corresponding outcome (increase, decrease). ***95% confidence intervals (CI) were calculated by the Wilson score method.
Table 6. g: Resistance rates of invasive Acinetobacter spp. isolates in humans for 2023.
Figure 6. h: Resistance rates of invasive Acinetobacter spp. isolates in humans between 2014 and 2023.
Carbapenems
Aminoglycosides
Trimethoprimsulfamethoxazole
Ciprofloxacin
Table 6. h: Resistance combinations in invasive Acinetobacter spp. isolates in humans in 2023. Only isolates tested against all three antibiotic groups (aminoglycosides, ciprofloxacin and carbapenems) were considered (n= 97/118 [82.2%]).
i: Multiresistance in invasive Acinetobacter spp. isolates in humans between 2014 and 2023 (for details refer to Table 6.h).
Figure 6.
Resistance rates in Switzerland were much lower than the EU/EEA population-weighted means in 2021 (carbapenems 40%, fluoroquinolones 43%, aminoglycosides 40%).
Increasing trends in resistance to carbapenems and aminoglycosides were observed in the EU/EEA states from 2017 to 2021. [2]
6.5 Streptococcus pneumoniae
Streptococcus pneumoniae is a common cause of upper respiratory tract infections such as sinusitis and otitis media but is also a common pathogen found in invasive pneumonia, bloodstream infections and meningitis. Since 2002, all invasive S. pneumoniae isolates are sent by the clinical microbiology laboratories to the National Reference Centre for invasive S. pneumoniae, located in the Institute for Infectious Diseases at the University of Bern. Serotyping (i.e. determining the impact of vaccinations on serotype distribution) and antimicrobial resistance testing are performed for all isolates. The isolates results are then sent to ANRESIS. However, only the data provided by the primary laboratories are analysed in this report. These data may differ slightly from those of the National Reference Centre for invasive S. pneumoniae. Penicillin-susceptible isolates (PSSP) were considered to be ceftriaxone-susceptible even if not tested.
In 2023, 5.1% of all isolates were penicillin-resistant (penicillin-non-susceptible S. pneumoniae , PNSP; Table 6. i). The average resistance rate for EU/EEA countries in 2021 was 16.3%. PNSP rates in individual EU/EEA countries ranged from 3.6% to 35.7% in 2021. [2] However, an exact comparison of Switzerland with other countries is difficult, as different breakpoints were used.
Nevertheless, resistance rates appear to be substantially higher in France (32%) than in Italy (10%) and Germany (7.8%). [2] These differences were mirrored within Switzerland, with slightly higher PNSP rates in the French-speaking region (Table 6. i). Ceftriaxone resistance was below 1%. At 7.6%, the erythromycin resistance rate was slightly higher than the penicillin resistance rate, again with higher resistance rates in western Switzerland. Resistance against levofloxacin was 0.5% in Switzerland in 2023. As shown in Figure 6. j, resistance rates for erythromycin were significantly higher in PNSPs than in PSSPs.
Over the past decade, significant decreases in antibiotic resistance in S. pneumoniae have been observed for trimethoprim-sulfamethoxazole, erythromycin and levofloxacin (Table 6. i, Figure 6. k). These trends may at least in part be attributed to a vaccine-related decrease of the intrinsically more resistant serotypes. [13]
*West (GE, NE, VD, JU, FR), South (TI), North–East (other cantons) according to linguistic regions. **Trends were modelled with logistic regressions. Arrows represent a significant effect (p < 0.05) of the year on the corresponding outcome (increase, decrease). ***95% confidence intervals (CI) were calculated by the Wilson score method.
Table 6. i: Resistance rates of invasive Streptococcus pneumoniae isolates in humans in 2023.
Figure 6. j: Resistance rates (%) in invasive PSSP (penicillin-susceptible isolates) and PNSP (penicillin non-susceptible isolates) in humans in 2023.
Trimethoprim-sulfamethoxazole
Erythromycin
n = number of isolates tested with error bars indicating 95% confidence intervals. Fisher Exact Tests were performed to assess for independence: * = p-value <0.05; ** = p-value <0.01.
6. k: Resistance rates of invasive Streptococcus pneumoniae isolates in humans between 2014 and 2023.
Penicillin
Ceftriaxone
Trimethoprimsulfamethoxazole
Erythromycin
Levofloxacin
Penicillin
Ceftriaxone
Figure
6.6 Enterococci
Enterococci are part of the normal gastrointestinal flora present in humans and animals. As such, they are often considered commensals with low pathogenicity. However, they can also cause serious infections, particularly in the hospital setting, such as urinary tract infections, bacteremia, endocarditis, and intra-abdominal infections in critically ill patients and immunocompromised hosts. The vast majority of enterococcal infections are caused by Enterococcus faecalis and E. faecium.
While E. faecalis isolates remain susceptible to most antibiotics, including aminopenicillins, E. faecium isolates, mainly detected in the nosocomial setting, are usually resistant to aminopenicillins (75% in 2023). In addition, E. faecium shows higher resistance rates to aminoglycosides than E. faecalis (Table 6. j). Aminoglycoside resistance has slightly, but significantly, decreased in E. faecalis over the last decade and still is relatively low compared to the EU/EEA population weighed average (i.e. gentamicin high-level resistance, HLR, in E. faecalis of 11.1% in Switzerland versus 29.0% in the EU/EEA in 2021 [2]).
In contrast to the United States, vancomycin resistance in E. faecium was still rare in Switzerland (2.2% in 2023) and far below the EU/EEA average of 17.2% in 2021. [2] However, large differences exist between EU/EEA states. Importantly, a significant increase in vancomycin-resistant E. faecium has been observed in Switzerland over the last ten years (Table 6. j, Figure 6. l), mainly due to a regional/ national outbreak associated with the spread of the ST796 clone. [14] [15]
In early 2024, the emergence of the new vancomycinresistant E. faecium (VREfm) strain ST612, associated with potential reduced susceptibility to daptomycin, was documented in various parts of Switzerland and was followed by an alert issued by the Swissnoso National Centre for Infection Control and the NARA in February 2024. A first analysis revealed that 13 / 82 (15.9%) VREfm strains isolated in February and March 2024 belonged to ST612. These 13 isolates originated from 7 cantons (BL, BS, JU, LU, SO, VS, ZH), and all had a MIC value of 4 mg/L for daptomycin (susceptible). [16] In a retrospective evaluation, a total of 117 ST612 VREfm strains have been detected since 2019. They can be grouped in five genetically highly-related clusters. Temporo-spatial and genomic analysis showed that intra-hospital transmission was highly likely and that even inter-institutional transmissions were probable. Epidemiological data, available for 86 cases, showed that a total of 10 patients (11.6%) suffered from one or more VRE infections, and that one patient probably died due to this infection. [17]
These highly dynamic processes underline the importance of continuous surveillance of VRE in Switzerland. While ANRESIS publishes cantonal VRE data on its website on a monthly basis, more in-depth genetic analyses are required to understand the transmission dynamics. Besides stringent screening policies, rapid diagnosis and adequate treatment, contact tracing and the mandatory reporting of VRE clusters (> 3 cases), it is proposed to continuously sequence newly detected VRE isolates. [14]
Table 6. j: Resistance rates of invasive Enterococcus faecalis and Enterococcus faecium isolates in humans in 2023.
1 HLAR = high level aminoglycoside resistance
*West (GE, NE, VD, JU, FR), South (TI), North–East (other cantons) according to linguistic regions. **Trends were modelled with logistic regressions. Arrows represent a significant effect (p < 0.05) of the year on the corresponding outcome (increase, decrease). ***95% confidence intervals (CI) were calculated by the Wilson score method.
6. l: Resistance rates of invasive Enterococcus faecalis and Enterococcus faecium isolates in humans between 2014 and 2023.
E. faecalis
Aminopenicillins (solid blue)
E. faecalis
Gentamicin HLAR (solid green)
E. faecalis
Vancomycin (solid grey)
E. faecium
Aminopenicillins (dashed blue)
E. faecium
Gentamicin HLAR (dashed green)
E. faecium
Vancomycin (dashed grey)
6.7
Staphylococcus aureus
Staphylococcus aureus are among the most important microorganisms in clinical microbiology. Besides bloodstream infections, S. aureus frequently causes soft-tissue infections, osteomyelitis, joint infections and, more rarely, endocarditis and pneumonia. As observed in many European countries [18], S. aureus bacteremias are also increasing in Switzerland. A recent study by ANRESIS reported an increase from 1240 cases in 2011 to 2260 cases in 2021 (+83%), mainly due to methicillin-susceptible S. aureus (MSSA). [19] However, methicillin-resistant S. aureus (MRSA) remains a major cause of antimicrobial-resistant infections worldwide. While these infections were initially typically hospital-acquired, they have now spread widely into the community.
There are different methods to detect MRSA, and the screening methods have changed over time. Methicillin/oxacillin resistance in Staphylococcus aureus can be detected either phenotypically by MIC determination, disc diffusion tests or latex agglutination to detect PBP2a, or genotypically, using mecA/mecC gene detection. Due to poor correlation with the presence of mecA (the gold standard for detecting methicillin resistance), oxacillin disc testing to detect S. aureus methicillin/oxacillin resistance is discouraged by EUCAST and CLSI guidelines. In contrast, cefoxitin susceptibility is a very sensitive and specific marker of mecA/ mecC -mediated methicillin resistance and is the drug of choice for disc diffusion testing. S. aureus with cefoxitin MIC values >4 mg/L are methicillin-resistant, mostly due to the presence of the mecA gene.
In the ANRESIS database, MRSA is defined as resistance to at least one of the following antibiotics: methicillin, oxacillin, flucloxacillin or cefoxitin. Results of confirmatory tests, such as the PBP2a agglutination test or the direct detection of the mecA gene, are typically not forwarded to ANRESIS. MRSA are resistant to all beta-lactam antibiotics, including combinations with beta-lactam inhibitors (e.g. amoxicillin-clavulanic acid).
In 2023, the MRSA rate in Switzerland was 4.2%, with higher rates in southern Switzerland (10.2%), followed by western Switzerland (5.6%, Table 6. k). This compares well with the EU/EAA average of 15.8% in 2021. [2] Co-resistance in MRSA is frequent and significantly higher than in MSSA for all antibiotics except vancomycin, linezolid, daptomycin and rifampicin (Figure 6. m).
Staphylococcus aureus also remains an important pathogen in the ambulatory setting, where it is the most common cause of wound infections and abscesses. A comparison of the resistance rates of invasive samples with outpatient non-invasive samples from wounds and abscesses is shown in Figure 6. n. As shown by Olearo et al. [20], MRSA rates, and similarly resistance rates to most other antibiotics, are nowadays significantly higher in the ambulatory skin infection setting (12.7%) than in bacteremia (4.1%, Figure 6. n). While hospital MRSA rates have been decreasing for several years, community MRSA (cMRSA) infections are increasing. [16] In addition, they often harbor the Panton-Valentine-Leucocidin (PVL) toxin, favoring abscess formation. Importantly, wound infections and even skin abscesses can usually be treated with surgery alone, and do not need antibiotic therapy.
Figure
Table 6. k: Resistance rates of invasive Staphylococcus aureus isolates in humans in 2023.
*West (GE, NE, VD, JU, FR), South (TI), North–East (other cantons) according to linguistic regions. **Trends were modelled with logistic regressions. Arrows represent a significant effect (p < 0.05) of the year on the corresponding outcome (increase, decrease). ***95% confidence intervals (CI) were calculated by the Wilson score method.
The development of resistances in invasive samples over the last ten years is shown in Figure 6. o. In the last decade (2014–2023), a significant decrease in invasive MRSA rates, from 5.8% to 4.2%, was observed (Table 6. k). A decrease in the MRSA percentage between 2017 and 2021, from 18.4% to 15.8%, was also described in the population-weighted mean of EU/EEA countries. [2] In contrast,
resistance rates of invasive S. aureus in Switzerland have significantly increased for macrolides and clindamycin over the last ten years, and even more explicitly over the last four years (Figure 6. o, Table 6. k). A slight but significant increase in the resistance rate was also observed for trimethoprim-sulfamethoxazole, but at 1.3%, resistance still remained low in 2023.
Figure 6. m: Resistance rates (%) of invasive MRSA (methicillin-resistant Staphylococcus aureus ) and MSSA (methicillinsusceptible Staphylococcus aureus ) isolates in humans 2023.
Penicillin MRSA
Aminoglycosides
Trimethoprim-sulfamethoxazole
Tetracycline
Macrolides
Clindamycin
Vancomycin
Ciprofloxacin
Fusidic acid
Linezolid Rifampicin
Daptomycin
n=65 n=1492
n=2436 n=106
n=2267 n=98
n=2278 n=100
n=1923 n=85 n=2415 n=105
n=2429 n=106
n=1980 n=98
n=1942 n=91
n=1954 n=89 n=1073 n=49
n=2331 n=105
n=1035 n=62
n = number of isolates tested with error bars indicating 95% confidence intervals. Fisher Exact Tests were performed to assess for independence: * = p-value <0.05; ** = p-value <0.01.
Figure 6. n: Comparison of resistance rates (%) in invasive versus outpatient wound/abscess samples in Staphylococcus aureus in humans in 2023.
Penicillin MRSA
Aminoglycosides
Trimethoprim-sulfamethoxazole
Tetracycline
Macrolides
Clindamycin
Vancomycin
Ciprofloxacin
Fusidic acid
Linezolid Rifampicin
Daptomycin
n=1640 n=666 n=2469
n=2103 n=1120 n=1124 n=786 n=2518
n=2630 n=2614 n=1043 n=1142
n=2176
n=2456 n=1081
n=2125 n=1023 n=949
n=2138 n=879
n=1115 n=374 n=2530 n=1041 n=1201 n=556
Percent of resistant isolates in invasive samples
Percent of resistant isolates in non-invasive samples
n = number of isolates tested with error bars indicating 95% confidence intervals. Fisher Exact Tests were performed to assess for independence: * = p-value <0.05; ** = p-value <0.01.
Figure 6. o: Resistance rates of invasive Staphylococcus aureus isolates in humans between 2014 and 2023.
Aminoglycosides
Trimethoprimsulfamethoxazole
Tetracycline
Macrolides
Clindamycin
Vancomycin
Ciprofloxacin
Fusidic acid
Linezolid
Rifampicin
References
[1] Plate A, Kronenberg A, Risch M, et al. Active surveillance of antibiotic resistance patterns in urinary tract infections in primary care in Switzerland. Infection. 2019;47(6):1027–1035. doi:10.1007/s15010-01901361-y.
[2] WHO Regional Office for Europe/European Centre for Disease Prevention and Control. Antimicrobial resistance surveillance in Europe 2022–2020 data. Copenhagen: WHO Regional Office for Europe; 2022.
[3] Gasser M, Cassini A, Lo Fo Wong D, Gelormini M, Nahrgang SA, Zingg W, Kronenberg A. Associated deaths and disability-adjusted life-years caused by infections with antibiotic-resistant bacteria in Switzerland, 2010 to 2019- Euro Surveill. 2023;28(20):pii=2200532. https://doi.org/10.2807/1560-7917
[4] Ramette A, Gasser M, Nordmann P, Zbinden R, Schrenzel J, Perisa D, Kronenberg A. Temporal and regional incidence of carbapenemase-producing Enterobacterales, Switzerland, 2013 to 2018. Euro Surveill. 2021;26(15): pii=1900760.
[5] Liu YY, Wang Y, Walsh TR, et al. Emergence of plasmid-mediated colistin resistance mechanism MCR-1 in animals and human beings in China: a microbiological and molecular biological study. Lancet Infect Dis. 2016;16(2):161-168. doi:10.1016/S14733099(15)00424-7.
[6] Yang Wang, Chunyan Xu, Rong Zhang, Yiqiang Chen, Yingbo Shen, Fupin Hu et al. Changes in colistin resistance and mcr-1 abundance in Escherichia coli of animal and human origins following the ban of colistin-positive additives in China: an epidemiological comparative study. Lancet Infect Dis 2020; 20: 1161–71. https://doi.org/10.1016/ S1473-3099(20)30149-3
[7] Liassine N, Assouvie L, Descombes MC, Tendon VD, Kieffer N, Poirel L, Nordmann P. Very low prevalence of MCR-1/MCR-2 plasmid-mediated colistin resistance in urinary tract Enterobacteriaceae in Switzerland. Int J Infect Dis. 2016 Oct;51:4-5. doi: 10.1016/j. ijid.2016.08.008. Epub 2016 Aug 17. PMID: 27544715.
[8] Nordmann P, Lienhard R, Kieffer N, Clerc O, Poirel L. Plasmid-Mediated Colistin-Resistant Escherichia coli in Bacteremia in Switzerland. Clin Infect Dis. 2016 May 15;62(10):1322-3. doi: 10.1093/cid/ciw124. Epub 2016 Mar 1. PMID: 26936673.
[9] Voellmy I, Kronenberg A and the Swiss Centre for Antibiotic Resistance (ANRESIS). Significantly higher antibiotic susceptibility and invasiveness in Klebsiella variicola than Klebsiella pneumoniae suggest species identification provides valuable information to clinicians. ECCMID (European Congress of Clinical Microbiology and Infectious Diseases), online, 2021 and submitted to Euro Surveill. 2022.
[10] https://www.anresis.ch/antibiotic-resistance/ resistance-data-human-medicine/#CPE (last access 13.6.2024)
[11] Friedli O, Völlmy I, Schrenzel J, Harbarth S, Kronenberg A and Swiss Centre for Antibiotic Resistance ANRESIS. Retrospective data analysis for definition of multidrug resistance in gram-negative bacteria –a consensus proposal. Swiss Med Wkly. 2022 Jul 11;152:w30195. doi: 10.4414/smw.2022.w30195. PMID: 35816628.
[12] Renggli L*, Burri A*, Ehrhard S, Gasser M, Kronenberg A. and the Swiss Centre for Antibiotic Resistance. Incidence and resistance rates of Pseudomonas aeruginosa bloodstream infections in Switzerland: a nationwide surveillance study (2010–2022). Submitted. (*contributed equally)
[13] Hauser C, Kronenberg A, Allemann A, Mühlemann K, Hilty M. Serotype/serogroup-specific antibiotic non-susceptibility of invasive and non-invasive Streptococcus pneumoniae, Switzerland, 2004 to 2014. Euro Surveill. 2016;21(21):10.2807/1560-917. ES.2016.21.21.30239. doi:10.2807/1560-7917.
[14] Buetti N, Wassilew N, Rion V, et al. Emergence of vancomycin-resistant enterococci in Switzerland: a nation-wide survey. Antimicrob Resist Infect Control. 2019;8:16. Published 2019 Jan 17. doi:10.1186/s13756019-0466-x.
[15] Wassilew N, Seth-Smith HM, Rolli E, et al. Outbreak of vancomycin-resistant Enterococcus faecium clone ST796, Switzerland, December 2017 to April 2018 [published correction appears in Euro Surveill. 2018 Jul;23(30):]. Euro Surveill. 2018;23(29):1800351. doi:10.2807/1560-7917.ES.2018.23.29.1800351.
[16] NARA report 3.5.2024. Interregional dissemination of vancomycin-resistant Enterococcus faecium (VREfm) vanA ST612 in Switzerland. https://www.unifr.ch/med/nara/fr/assets/public/files/ warnings/NARA_daptomycin_VRE_03052024.pdf (accessed 7.6.2024)
[17] Swissnoso National Center for Infection Control, Bern, 31.5.2024. Update regarding the emergence and rapid interregional dissemination of vancomycinresistant Enterococcus faecium (VRE) vanA ST612 in Switzerland.
[18] Gagliotti C, Högberg LD, Billström H, Eckmanns T, Giske CG, Heuer OE, Jarlier V, Kahlmeter G, Lo Fo Wong D, Monen J, Murchan S, Simonsen GS, Šubelj M, Andrašević AT, Żabicka D, Žemličková H, Monnet DL; EARS-Net study group participants. Staphylococcus aureus bloodstream infections: diverging trends of meticillin-resistant and meticillin-susceptible isolates, EU/EEA, 2005 to 2018. Euro Surveill. 2021 Nov;26(46):2002094. doi: 10.2807/1560-7917. ES.2021.26.46.2002094. PMID: 34794536; PMCID: PMC8603406.
[19] Renggli L, Gasser M, Buetti N, Kronenberg A. and the Swiss Centre for Antibiotic Resistance. Increase in methicillin-susceptible Staphylococcus aureus bloodstream infections in Switzerland: a nationwide surveillance study (2008–2021). Infection (2023). https://doi.org/10.1007/s15010-023-01980-6
[20] Olearo F, Albrich WC, Vernaz N, Harbarth S, Kronenberg A; Swiss Centre For Antibiotic Resistance ANRESIS. Staphylococcus aureus and methicillin resistance in Switzerland: regional differences and trends from 2004 to 2014. Swiss Med Wkly. 2016;146:w14339. Published 2016 Sep 15. doi:10.4414/smw.2016.14339.
Prevalence of antimicrobial resistance in human Campylobacter spp. and Salmonella spp. in Switzerland
F. Jung 1, D. Vogt 2 , R. Stephan 3, A. Kronenberg 4 , A. Egli 1,2 ; and the Swiss Antibiotic Resistance Centre ANRESIS.
1 Institute of Medical Microbiology, University of Zurich, Zurich, Switzerland
2 Department of Clinical Research, University Hospital Basel, Basel, Switzerland
3 Institute for Food Safety and Hygiene, National Reference Laboratory for Enteropathogens and Listeria monocytogenes, Vetsuisse Faculty, University of Zurich, Zurich, Switzerland
4 Swiss Antibiotic Resistance Centre ANRESIS, Institute for Infectious Diseases, University of Bern, Bern, Switzerland
Correspondence
Prof. Adrian Egli, MD PhD Institute of Medical Microbiology Gloriastrasse 28/30 8006 Zurich
Email: aegli@imm.uzh.ch
Background
Foodborne infections are common worldwide and in Switzerland. They can be caused by different pathogens including viruses, bacteria and parasites. The most important bacterial pathogens causing foodborne infection include Campylobacter spp. and Salmonella spp., that can progress, in rare cases, to serious complications such as sepsis. In Switzerland, around 7,000–8,000 infections with Campylobacter spp. and 1,200–1,500 infections with Salmonella spp. are reported annually. The number of non-reported cases is likely higher. Over the years, both pathogens have become increasingly resistant to antibiotics. [1] [2]
While most intestinal bacterial infections are self-limiting, severe cases may require antimicrobial therapy. The increase in antimicrobial resistance (AMR) may complicate diagnostics and treatment, emphasising the need for surveillance and antibiotic stewardship. Identifying sources of infection is crucial. The “One Health” approach focuses on the link between human, animal and environmental health and is crucial in fighting AMR in foodborne infections. [3]
The Swiss ANRESIS platform offers detailed data on AMR, providing a scientific data basis for the discussion and development of public health strategies. In this study, we aim to analyse the time trends of AMR in Campylobacter spp. and Salmonella spp. infections from human samples in Switzerland.
Methods
Study design. For this retrospective analysis, AMR data for Campylobacter spp. and Salmonella spp. from January 2007 to December 2022 were extracted from the ANRESIS database. ANRESIS continuously collects routine resistance data from human medical microbiology laboratories all over Switzerland, and covered 90% of all hospital days in 2022. The samples were classified into sterile (e.g. blood, cerebrospinal fluid) or non-sterile sites (e.g. stool, skin). We determined the percentage of AMR in Campylobacter jejuni and C. coli as well as typhoid and non-typhoidal Salmonella spp. Resistance tests were performed at laboratories according to established local practices. During the study period, most laboratories changed from CSLI to EUCAST-based interpretation. We performed descriptive statistical analyses. No primary hypotheses were tested. The results are presented as estimated effect sizes with variance and precision measures. P-values are given for the formulation of new hypotheses. The term “statistically significant” is avoided. All analyses were performed with R version 4.3.1. The study was approved by the Ethics Committee of Northwestern and Central Switzerland (BASEC No. Ref 2018-00728 and 2020-00033).
Results
Campylobacter spp.: C. jejuni dominates, with 80% of all Campylobacter isolates. During the study period, the Campylobacter jejuni cases increased from 50% to around 90% within all Campylobacter cases. In C. jejuni isolates, we observed an increase in resistance rates for ciprofloxacin, from 38% (95% CI [35, 41]) in 2007 to 81% (95% CI [79, 83]) in 2022. We also noted a sharp increase in resistance rates for doxycycline and tetracycline between 2012 and 2014. Resistance to macrolides remained very low (Figure VIII).
C. coli accounts for 7% of all Campylobacter isolates in 2022 and generally showed higher levels of resistance than C. jejuni, particularly for ciprofloxacin, clarithromycin and erythromycin. Resistance to tetracycline and doxycycline increased from 2007 to 2017 and then decreased slightly. The amount of data for C. coli is limited and must be cautiously interpreted.
Salmonella spp.: S. enterica is the predominant species of Salmonella spp. isolates. Other species occurred only sporadically (0.2%). S. enterica is divided into two groups, the much rarer typhoid Salmonella (serovars Typhi and Paratyphi) accounting for about 5% of all S. enterica isolates, and non-typhoidal Salmonella , of which serovars Enteritidis (32%) and Typhimurium (15%) are the most prevalent. Samples originate mainly from the gastrointestinal tract,
blood and the urogenital system, with slightly higher resistance rates in samples from non-sterile sites.
Although antibiotic therapy is usually not required in healthy individuals, it is recommended in elderly patients and patients under immunosuppression or endovascular diseases. [4] Ciprofloxacin, azithromycin and ceftriaxone are recommended as first-line antibiotics. [4] Typhoidal Salmonella exhibited slightly higher overall resistance rates and were more often invasive. However, samples were scarce, and results must be cautiously interpreted. In general, we observed high resistance rates to gentamicin (70%, 95% CI [69, 72]) and amoxicillin (7%, 95% CI [6, 8]). Ceftriaxone remains highly effective (1%, 95%CI [1, 1]). The sharp decline in macrolide resistance observed in 2018 is likely an artefact, as isolates were rarely tested before 2018, which probably led to a selection bias. Macrolides (azithromycin/ clarithromycin/erythromycin) show a low overall resistance rate in 2022 (7%, 95%CI [5, 9]) (Figure IX).
Discussion
Foodborne pathogens remain an important source of infection, and continuous monitoring of local resistance is important to understand epidemiological trends and to adapt treatment recommendations if necessary. ANRESIS provides a large continuous dataset suitable for this analysis. Since the introduction of MALDI-TOF mass spectrometry, more infections can be determined to the species levels, which has an impact on the ANRESIS data quality. We sometimes observed very rapid changes in AMR percentages, which are likely due to changes in the AMR interpretation guidelines.
The increasing resistance trend for Campylobacter spp. against ciprofloxacin, which is close to 80% resistance nowadays (also described in chapter 7 in this report), probably should be taken into account in the next revision of the treatment guidelines for infectious gastroenteritis. Of course, foodborne diseases are the hallmark of One Health
VIII: AMR trends for Campylobacter jejuni. Antibiotic resistance (% of resistant samples) according to year. Error bars indicate 95% confidence intervals.
Figure
Figure IX: AMR trends for non-typhoidal Salmonella. Antibiotic resistance (% of resistant samples) according to year. Error bars indicate 95% confidence intervals.
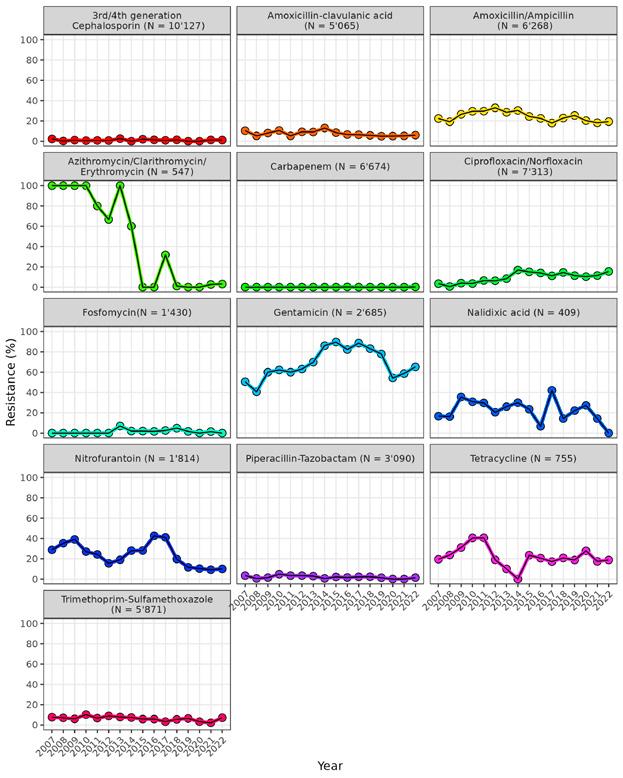
issues, and data from veterinary medicine need to be considered as well. As depicted in chapter 7 of this report, Campylobacter jejuni in broilers in 2022 also showed much higher resistance rates against ciprofloxacin (45.7%) and none against erythromycin (0%). Also, international data should be considered, as food is commonly transferred across borders.
Although ciprofloxacin resistance in Salmonella is increasing steadily to 20%, susceptibility against all antibiotics recommended as first-line therapy generally remains good. However, the low number of tests for Salmonella regarding the first-line antibiotic azithromycin is striking. Over the entire period tested, only 547 tests were carried out for one of three macrolides (azithromycin, clarithromycin, erythromycin), and increased monitoring should be recommended. From a surveillance perspective, it would be important for the future to also determine/monitor AMR genes and/or resistance mechanisms as well as the spread of resistant clones (e.g., CIP-resistant S. Kentucky ST 198).
References
[1] Bless, P. J., Muela Ribera, J., Schmutz, C., Zeller, A. & Mausezahl, D. Acute Gastroenteritis and Campylobacteriosis in Swiss Primary Care: The Viewpoint of General Practitioners. PLoS One 11, e0161650 (2016). https://doi.org/10.1371/journal.pone.0161650
[2] Barrett, J. & Fhogartaigh, C. N. Bacterial gastroenteritis. Medicine 45, 683-689 (2017). https://doi.org/ https://doi.org/10.1016/j.mpmed.2017.08.002
[3] Mulchandani, R., Zhao, C., Tiseo, K., Pires, J. & Van Boeckel, T. P. Predictive Mapping of Antimicrobial Resistance for Escherichia coli, Salmonella , and Campylobacter in Food-Producing Animals, Europe, 2000–2021. Emerg Infect Dis 30, 96-104 (2024). https://doi.org/10.3201/eid3001.221450
[4] Diseases, S. S. o. I. (Swiss Society of Infectious Diseases, 2024).
Correlation of antimicrobial consumption with Clostridioides difficile incidence in a tertiary care hospital
N. Wassilew 1, A. Zehnder 2 , A. Atkinson 1,3 , A. Kronenberg 2 and J. Marschall 1,3
1 Department of Infectious Diseases and Hospital Epidemiology, Bern University Hospital, University of Bern, Bern, Switzerland
2 Institute for Infectious Diseases, University of Bern, Bern, Switzerland
3 Division of Infectious Diseases, Washington University School of Medicine, St. Louis, MO, US
Clostridioides difficile (C. diff.), a spore forming Gram-positive anaerobic bacillus, is the most common cause of nosocomial (=hospital-acquired) diarrhea. The clinical spectrum of Clostridioides difficile infection (CDI) ranges from asymptomatic colonisation to uncomplicated diarrhea and on to life-threatening pseudomembranous colitis, and is associated with increased morbidity, mortality and healthcare costs [1], [2]. To improve the surveillance of C. diff. infections within Switzerland, the Swiss Antibiotic Resistance Centre ANRESIS, in collaboration with Swissnoso, introduced a C. diff. database in 2016. The University Hospital of Bern was the first healthcare organisation to send their C. diff. data to ANRESIS, which led to the unique opportunity to analyse the well-known association of CDI with antibiotic exposure on a more detailed level within a single institution. The ex-
pectation was to extract concrete learning points for this specific institution, allowing us to develop more targeted interventions to combat these infections.
In a retrospective observational correlation study, the authors analysed ANRESIS data on CDI and antibiotic prescriptions delivered by the University Hospital of Bern over 14 years (1 January 2008 to 31 December 2021). Only first and new infections, defined as CDI episodes according to the Centers for Disease Control and Prevention (CDC), were included in the study [3]. The most frequently prescribed antibiotic groups were analysed individually. Antibiotic consumption data were reported in defined daily doses (DDD) according to the WHO’s definition [4]. A mixed effects logistic regression model was fitted with each department, as a random effect to determine CDI incidence as a function of year, and adjusted for antibiotic consumption.
In total, 1827 episodes of 2492 Clostridioides difficile positive samples were considered for analysis. Incidence varied between 5.0 (2021) and 9.8 (2009) episodes/10,000 patient-days. A decreasing trend could be observed from 2008 to 2021, in line with a slight decrease in antibiotic consumption (Figure X). The correlation between total antimicrobial usage and incidence of CDI proved to be significant in both univariable and multivariable analysis. Accord -
Figure X: Clostridioides difficile incidence trajectory per 10,000 person-days, 2008–2021 (left hand axis), and antibiotic consumption in total DDD/100 person-days (right hand axis, blue bars, individual departments summed up); yearly incidence shown as circles with error bars for 95% confidence intervals; line of best fit shown in blue (solid), with 95% confidence interval shaded.
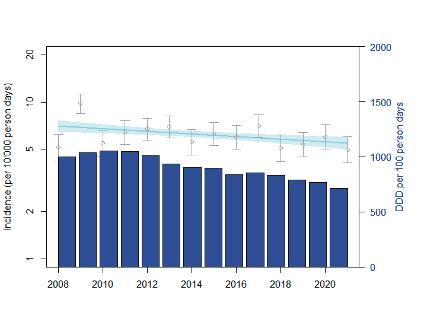
ingly, adjusting for antibiotic consumption, CDI incidence no longer decreased but significantly increased during the observation period in this hospital (p=0.01). This probably can be explained by the increasing complexity of hospitalised patients over time.
Looking at individual departments, the authors found a substantial variability in terms of C. difficile incidence. However, plotting the CDI incidence of each department against their average yearly antibiotic consumption, no significant trend was found, probably due to the high variability between the departments (Figure XI). Considering selected antibiotics and antibiotic groups only, a marginal trend, suggesting correlation with CDI, was observed for the use of carbapenems (p=0.01), ceftriaxone (p=0.08), cefepime (p=0.01), macrolides (p=0.01), and piperacillin/tazobactam (p=0.07). This corresponds well to observations from other studies.
These findings serve as a reminder that the larger the volume of antibiotics consumption is in a given hospital, the greater the risk of C. difficile infections, and that certain antibiotics (or antibiotic groups) may confer a greater risk in this regard than others. It is important for healthcare providers to be aware of the risks of antibiotic use and to use antibiotics judiciously to minimise the risk of CDI and other adverse outcomes. Implementing surveillance programs of
both antimicrobial consumption and CDI incidence could prepare the ground for antimicrobial stewardship interventions aimed at reducing antibiotic consumption and, subsequently, CDI incidence. Basing these interventions on the data specific to an individual hospital may improve the acceptance of the measures suggested.
References
[1] Singh H, Nugent Z, Walkty A, Yu BN, Lix LM, Targownik LE, Bernstein CN, Witt J. 2019. Direct cost of health care for individuals with community associated Clostridium difficile infections: A population-based cohort study. PLoS One 14:e0224609
[2] Heimann SM, Vehreschild JJ, Cornely OA, Wisplinghoff H, Hallek M, Goldbrunner R, Bottiger BW, Goeser T, Holscher A, Baldus S, Muller F, Jazmati N, Wingen S, Franke B, Vehreschild MJ. 2015. Economic burden of Clostridium difficile associated diarrhoea: a costof-illness study from a German tertiary care hospital. Infection 43:707-14
[3] Anonymous. Centers for Disease Control and Prevention. https://www.cdc.gov/hai/eip/cdiff-tracking.html. Accessed 01/13/2024
[4] https://www.whocc.no/ddd/definition_and_general_considera/#Definition WDagcIzSVu. 2019
Figure XI: Overall Clostridioides difficile incidence plotted against weighted median yearly antibiotic consumption per department 100 person-days, considering all study antibiotics (2008–2021); size of bubble is proportional to the number of person-days; weighted line of best fit shown in light-blue, dashed.
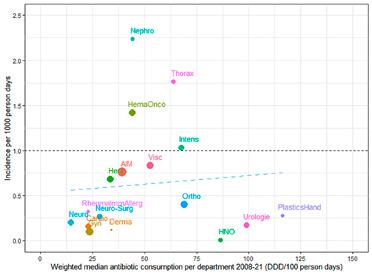
Ongoing emergence of antibiotic resistances in Switzerland
P. Nordmann 1, L. Poirel 2
1,2 Swiss National Reference Center for Emerging Antibiotic Resistance (NARA), University of Fribourg, Fribourg; Medical and Molecular Microbiology, Faculty of Science and Medicine, University of Fribourg, Fribourg, Switzerland; INSERM European Unit and European Institute for Emerging Antibiotic Resistance, University of Fribourg, Fribourg; patrice.nordmann@unifr.ch
The National Reference Center for Emerging Antibiotic Resistance (NARA) was established in 2017 and is tasked with the detection and molecular surveillance of the most important antibiotic resistance threats. In 2024, the spread of carbapenemase producers in Gram-negatives was still dominating the scene of emerging resistance mechanisms in Switzerland. Carbapenemases are broad-spectrum enzymes that hydrolyze virtually all ß-lactams, including the broad-spectrum carbapenems (imipenem, meropenem, ertapenem). They belong to different protein classes (Ambler class A, e.g. KPC; class B, e.g. NDM, IMP, VIM; and class D, e.g. OXA-48 and derivatives) and are identified in Enterobacterales, Pseudomonas aeruginosa and Acinetobacter baumannii. Although the resistance mechanisms to one of the last-resort and recently developed therapeutic option, namely the ceftazidime-avibactam combinations, are dominated by the acquisition of specific KPC variants, we have shown that specific extended-spectrum ß-lactamases (ESBLs) such as VEB-25 may also confer resistance to this combination. Among the NDM producers, we are currently and increasingly identifying strains producing the NDM-5 carbapenemase associated with other ß-lactam-resistance mechanisms. In combination, these confer resistance to the newly-developed antibiotic combination aztreonam-avibactam, an interesting therapeutic option that will soon be launched on the Swiss market to treat infections caused by NDM producers. These NDM-5 producers, mostly identified in Escherichia coli, are a source of concern, since many strains are acquired in the community. These strains are possibly emerging from Southeast Asia (Sadek et al., 2022). We have also identified a peculiar NDM variant, namely NDM-35, that confers some cross-resistance or reduced susceptibility to cefiderocol, the latest cephalosporin launched on the market. This further suggests that NDM producers also constitute a potential reservoir of cefiderocol-resistant isolates that might be further selected upon selective pressure.
Among the other carbapenemase types, OXA-48 derivatives are continuously identified, conferring low-level resistance to carbapenems, but remaining the most important
group of carbapenemases identified in Switzerland (Findlay et al., 2022). Spread of the corresponding genes is currently associated with a successful plasmid (IncX) in addition to the commonly-identified epidemic IncL-type, bearing the blaOXA-48 gene. These findings emphasise that both successful plasmids and successful strains may be sources of outbreaks. We have also evidenced the spread of the OXA-48 encoding gene among Enterobacter hormaechi strains shared between companion animals and humans (Dona et al., 2023). This may be the result of a spread of these strains from humans to animals. As already observed a few years ago, E. coli isolates producing the OXA-244 carbapenemase (OXA-48 variant) are regularly identified in Switzerland. For OXA-244 producers, susceptibility to carbapenems may vary, depending on the carbapenem molecule. Indeed, OXA-244 possesses a weaker carbapenemase activity than OXA-48, partly due to a weak expression of the corresponding gene, frequently present as a single copy only in the chromosome of the corresponding producers. This may lead to a hidden spread of this carbapenemase trait, in particular among community-acquired E. coli strains.
Another emerging resistance trait corresponds to the acquisition of 16S rRNA methylases (RMTases), encoding high-level resistance to all aminoglycosides, including amikacin, gentamicin, tobramycin and kanamycin (Figure XII). These enzymes methylate the target of aminoglycosides, namely 16S rRNA. The corresponding genes are most often located on plasmids and have been identified in many different Gram-negative bacteria. By performing a retrospective analysis focusing on carbapenem- and aminoglycoside-resistant clinical isolates recovered in Switzerland during a 3.5-year period between January 2017 and June 2020 (Fournier et al., 2022), we have shown an increasing trend of RMTase producers among carbapenemase producers, going from 7.5% to 10.7%, 11.2% and 13% between 2017 and 2020. Among isolates recovered in Switzerland, this rate was at 18% during the 2022–2023 period. This observation is not yet clearly understood. One possible explanation is molecular-based: a frequent association of carbapenemase- and RMTase encoding genes on same plasmids may lead to frequent co-selections.
Emergence of hypervirulent K. pneumoniae (hvKp) isolates expressing carbapenemases constitutes one of the most concerning current issues in relation with emerging antibiotic resistance. Since their original discovery in 1986 in Taiwan, they are increasingly causing invasive infections worldwide. These strains are mainly associated with community-acquired infections, affecting healthy patients
and in particular causing liver abscesses, septicemia, endophthalmitis or meningitidis. An increasing occurrence of K. pneumoniae isolates combining multidrug resistance (MDR) and hypervirulence (hv) (namely the so-called MDRhvKp, also called convergent clones) is being observed. These strains have the potential of causing difficult-to-treat infections in healthy adults, with an increased capacity for mortality. It is therefore crucial to track their dissemination, in order to prevent further spread. After the identification of the first case in Switzerland, we have performed a study to investigate the occurrence of carbapenemase-producing hvKp isolates in Switzerland and to determine their genetic profile. A total of 279 MDR carbapenemase-producing K. pneumoniae , recovered between 2017 and 2020 at the NARA from different samples (1.5% from urine, 6.1% from respiratory tract, 3.9% from wounds, 3.6% from blood culture and 6.5% from other biological sites) and from patients hospitalised all over Switzerland (10 cantons included) were investigated. We determined that 9.0% of K. pneumoniae harboured a virulence genotype. These isolates produced either KPC, NDM, or OXA-48 carbapenemases and many
of the identified clonal backgrounds, such as ST23-K1, ST395-K2, and ST147-K20 or ST147-K64, have been previously reported. All the isolates defined as hypervirulent K. pneumoniae strains (4.7%) possessed the aerobactin and the yersiniabactin gene clusters. The ST23-K1s, the only isolates presenting the colibactin cluster, achieved higher virulence scores. This study highlights the occurrence and circulation of worrisome MDR-hypervirulent and MDR non-hypervirulent K. pneumoniae isolates in Switzerland. Our findings highlight the need for active surveillance networks to track and monitor the spread of such successful hybrid clones, which represent a public health threat worldwide (Hallal Ferreira Raro et al., 2023). Similar observations have been made in neighbouring European countries, with an alert being issued at the European Centre for Disease Prevention and Control level. Detection of these strains will primarily rely on surveillance of uncommon clinical cases with infections caused by K. pneumoniae, since there is not a strict correlation between the presence of virulence genes and the severity of clinical cases.
Figure XII: K. pneumoniae producing the carbapenemase NDM-1, the extended-spectrum ß-lactamases (ESBL) CTX-M-15, and the ArmA 16S rRNA methylase.
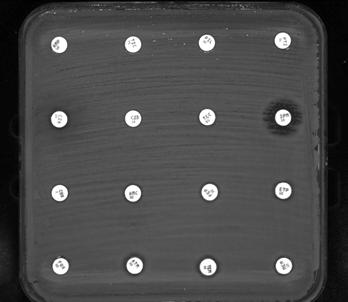
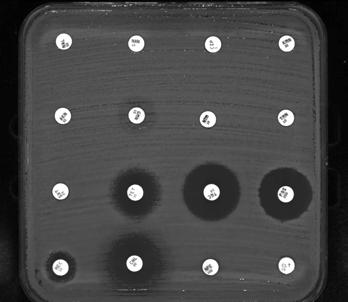
AM, Ampicillin; TIC, Ticarcillin; PRL, Piperacillin; TPZ, Piperacillin/Tazobactam; CZA, Ceftazidime/Avibactam; CAZ, Ceftazidime; TIM, Ticarcillin/Clavulanate; IPM, Imipenem; CTX, Cefotaxime; AMC, Amoxicillin/ Clavulanate; FEP, Cefepime; ETP, Ertapenem; FOX, Cefoxitin; ATM, Aztreonam; TEM, Temocillin; MEM, Meropenem NA, Nalidixic acid; NOR, Norfloxacin; CIP, Ciprofloxacin; KAN, Kanamycin; AK, Amikacin; CN, Gentamicin; NET, Netilmicin; TOB, Tobramycin; SXT, Trimethoprim/Sulfamethoxazole; TET, Tetracycline; TGC, Tigecycline; FF, Fosfomycin; MEC, Mecillinam; C, Chloramphenicol; F, Nitrofurantoin; TZC, Ceftolozane/Tazobactam
Resistance in bacteria from human clinical isolates
NARA 2828
Demande
Germe
Libellé
Klebsiella pneumoniae
Dona V, Nordmann P, Kittl S, Schuller S, Bouvier S, Poirel L, Endimiani A, Perreten V. Emergence of OXA-48-producing Enterobacter hormaechi in a Swiss companion animal clinic and their genetic relationship to clinical human isolates. J Antimicrob Chemother 2023;78:2950-2960. –
Findlay J, Poirel L, Bouvier M, Gaia V, Nordmann P. Resistance to ceftazidime-avibactam in a KPC-2-producing Klebsiella pneumoniae caused by the extended-spectrum ß-lactamase VEB-25. Eur J Clin Microbiol Infect Dis 2023;42:639-644.
– Fournier C, Poirel L, Despont S, Kessler J, Nordmann P. Increasing trends of association of 16S rRNA methylases and carbapenemases in Enterobacterales clinical isolates from Switzerland, 2017–2020. Microorganisms 2022;10:615-618.
– Hallal Ferreira Raro O, Nordmann P, Dominguez Pino M, Findlay J, Poirel L. Emergence of carbapenemase-producing hypervirulent Klebsiella pneumoniae in Switzerland. Antimicrob Agents Chemother 2023;67:e0142422.
– Sadek M, Ruppé E, Habib A, Zahra R, Poirel L, Nordmann P. International circulation of aztreonam/ avibactam resistant NDM-5 producing Escherichia coli isolates; successful epidemic clones. J Glob Antimicrob Resist 2021;27:326-328.
Resistance in zoonotic bacteria from livestock, meat and humans
7 Resistance in zoonotic bacteria from livestock, meat and humans
Zoonoses are diseases that are transmissible from animals to humans and vice versa. Infection can be acquired by contaminated food or through direct or indirect contact with infected animals. In humans, the severity of these diseases can vary from mild clinical symptoms to life-threatening conditions. Given the risk of compromising the effectiveness of antibiotic treatments of infections in humans, it is of special importance to monitor antimicrobial resistance in zoonotic bacteria isolated from animals.
7.1 Campylobacter spp.
Campylobacter (C.) jejuni and C. coli are responsible for human campylobacteriosis, the most prevalent food-borne zoonosis in Europe. In 2022, excluding data from the United Kingdom, more than 135,000 cases were reported [1]. In Switzerland, the healthcare costs for human campylobacteriosis have been valued at approx. 29 to 45 million euro per year [2]. In humans, campylobacteriosis causes bloody
diarrhea with dysentery syndrome, including cramps, fever and pain. In contrast to the situation in humans, C. jejuni and C. coli are found as commensals in the intestine of broilers, C. jejuni in the intestine of cattle, and C. coli in the intestine of pigs.
Antibiotic treatment is not crucial in mild cases of human campylobacteriosis, but such treatment may be necessary if the clinical course becomes life threatening. Treatment with antibiotics may include macrolides, such as erythromycin or azithromycin. Fluoroquinolones, such as ciprofloxacin, were also recommended in the past, but resistance rates of C. jejuni and C. coli against these antibiotic classes are very high in both humans and animals.
Fresh raw poultry meat is highly contaminated with Campylobacter spp. [3]. Hence, incorrect handling of raw poultry meat and the consumption of undercooked contaminated poultry meat are the main causes of human campylobacteriosis [1]. Source attribution studies from Switzerland identified chicken as the main source for human campylobacteriosis (71% of all human cases were attributed to chicken,
Figure 7. a: Trends in ciprofloxacin, erythromycin, gentamicin and tetracycline resistance in Campylobacter coli from broiler between 2014 and 2022 (N = total number of tested isolates; values for 2015, 2017, 2019 and 2021 interpolated [n/a]).
19% to cattle, 9% to dogs and 1% to pigs) [4, 5]. Hence, monitoring of antimicrobial resistance (AMR) of these pathogens is of great importance for human public health.
7.1.1 Campylobacter spp. in broilers
In 2022, a random sample of 800 Swiss broiler flocks was examined at slaughter, using pooled cecal samples (10 pooled samples per flock). C. jejuni was identified in 232 samples (29.0%) and C. coli in 62 samples (7.8%).
Very high levels of ciprofloxacin (fluoroquinolones) resistance were detected in C. coli (59.7%) (Figure 7. a). Moreover, a high level of tetracycline (tetracyclines) resistance (37.1%) was still found in C. coli, but with a decreasing trend compared to 2020 (Figure 7. a). Low to minimal levels of resistance in C. coli were detected in erythromycin (macrolides) and gentamicin (aminoglycosides) (Figure 7. a). In 2022, ertapenem (carbapenems) and chloramphenicol (phenicols) were tested for the first time. No resistance was detected against chloramphenicol (phenicols) (Figure 7. a), but 10 C. coli (37.1%) showed a minimum inhibito -
ry concentration >0.5 mg/L, which is defined as resistant, although currently no epidemiological cutoff is available. Only 19.4% of C. coli displayed no resistance to any antimicrobial substance tested (Figure 7. b). The vast majority (40.3%) of the isolates were resistant to just one antibiotic class (Figure 7. b), mainly to tetracycline (tetracyclines) and ciprofloxacin (fluoroquinolones).
High levels of ciprofloxacin (fluoroquinolones) resistance (45.7%) as well as to tetracycline (tetracyclines) (27.2%) were detected in C. jejuni (Figure 7. d). No resistance to erythromycin (macrolides), gentamicin (aminoglycosides) and to the newly introduced antibiotics chloramphenicol (phenicols) and ertapenem (carbapenems) was detected (Figure 7. d). Nearly half of the C. jejuni isolates (47.0%) showed no resistance to the antibiotic classes tested (Figure 7. c).
Overall, C. coli isolates showed a marked increase in antimicrobial resistance to ciprofloxacin (fluoroquinolones) from 2018 to 2022, whereas resistance rates in C. jejuni isolates remained stable (Figure 7. a, Figure 7. d).
Fully susceptible
Non-susceptible to one antibiotic group
Non-susceptible to two antibiotic groups
Non-susceptible to three antibiotic groups
Non-susceptible to four antibiotic groups
Fully susceptible
Non-susceptible to one antibiotic group
Non-susceptible to two antibiotic groups
Non-susceptible to three antibiotic groups
Non-susceptible to four antibiotic groups
2022 (n=62)
Figure 7. b: Resistance pattern in Campylobacter coli from broiler 2022.
2022 (n=232)
Figure 7. c: Resistance pattern in Campylobacter jejuni from broiler 2022.
Figure 7. d: Trends in ciprofloxacin, erythromycin, gentamicin and tetracycline resistance in Campylobacter jejuni from broiler between 2014 and 2022 (N = total number of tested isolates; values for 2015, 2017, 2019 and 2021 interpolated [n/a]).
C. jejuni in broiler
7.1.2 Campylobacter spp. in
fattening pigs
In 2023, a random sample of 308 fattening pigs was investigated at slaughter, using single cecal samples per slaughter batch. C. coli was isolated from 241 samples (80.0%).
In fattening pigs, continuously high levels of antimicrobial resistance were identified for tetracycline (tetracyclines) (58.5%) and ciprofloxacin (fluoroquinolones) (58.9%) with a slight decreasing trend for the former and a slight increasing trend for the latter (Figure 7. g). In contrast, very low resistance to erythromycin (macrolides) (1.2%) and gentamicin (aminoglycosides) (0.4%) was detected. No resistance to ertapenem (carbapenems) or chloramphenicol (phenicols) was detected. There are no significant changes in resistance rates compared to 2021.
In fattening pigs, only 14.9% of C. coli isolates were fully susceptible to all antibiotic classes tested (Figure 7. h). Most isolates were resistant to one antibiotic (antibiotic class) (tetracycline (tetracyclines) or ciprofloxacin (fluoroquinolones)), which corresponds to a prevalence of 51.0% (Figure 7. h). One third (33.2%) of the isolates were resistant to two antibiotics (antibiotic classes) (tetracycline (tetracyclines) and ciprofloxacin (fluoroquinolones)) (Figure 7. h).
7.1.3 Campylobacter spp. in slaughter calves
In 2023, a random sample of 306 calves was investigated at slaughter, using single cecal samples per slaughter batch. C. jejuni was isolated from 154 samples (50.3%). Moreover, eight C. coli were isolated (2.6%).
In slaughter calves, the highest level of antimicrobial resistance was identified for ciprofloxacin (fluoroquinolones) (55.2%) and tetracycline (tetracyclines) (35.7%) (Figure 7. i). In contrast, very low resistance levels to erythromycin (macrolides) (0.7%) and ertapenem (carbapenems) (0.7%) were detected, and no resistance to chloramphenicol (phenicols) and gentamicin (aminoglycosides) was shown (Figure 7. i).
Out of the 154 isolates, 36.4% were fully susceptible to all antibiotic classes tested (Figure 7. e). Another third (36.4%) were resistant to one antibiotic (antibiotic class) (tetracycline (tetracyclines) and ciprofloxacin (fluoroquinolones)) (Figure 7. e). 26.6% of the isolates were resistant to two antibiotics (antibiotic classes) (tetracycline (tetracyclines) and ciprofloxacin (fluoroquinolones)) (Figure 7. e).
7.1.4 Campylobacter spp. in humans
A total of 7,254 laboratory-confirmed cases of human campylobacteriosis were reported in 2023 (81.9 per 100,000 inhabitants). In ANRESIS, resistance data were available for 3,601 isolates (49.6%): 3,220 were identified as C. jejuni (89.4%) and 381 as C. coli (10.6%). Resistance data for 2023 are shown in Table 7. a, trends in Figure 7. f. Overall, resistance rates were higher in C. coli, and higher for
fluoroquinolones (76.9% for C. coli vs. 64.9% for C. jejuni ) than for macrolides (12.1% for C. coli vs. 1% for C. jejuni ). Fluoroquinolone resistance has increased significantly during the last four years for both species. For C. jejuni, an increasing trend has even been observed over the last 10 years. In contrast, a slight but significant decrease in macrolide resistance from 13.7% in 2014 to 12.1% in 2023 was observed for C. coli, while macrolide resistance in C. jejuni was below 1.5% during the whole period.
2023 (n=154)
Fully susceptible
Non-susceptible to one antibiotic group
Non-susceptible to two antibiotic groups
Non-susceptible to three antibiotic groups
Non-susceptible to four antibiotic groups
7. f: Trends in resistance to fluoroquinolones and macrolides in Campylobacter coli and Campylobacter jejuni from human clinical isolates in Switzerland between 2014 and 2023.
spp.
coli Macrolides
jejuni Macrolides
coli Quinolones
jejuni Quinolones
Figure 7. e: Resistance pattern in Campylobacter jejuni from slaughter calves 2023.
Campylobacter
Figure
7.1.5 Summary and Discussion
Regarding the resistance pattern of C. coli in broilers, we had observed several changes in the resistance rates to most of the antibiotics in previous years. These changes are most likely due to the small numbers of isolates monitored, by which single results have a great impact on the overall resistance rates. For 2020 and 2022, approximately 60 isolates were available, which resulted in more comparable data. A steady increase in resistance rates to ciprofloxacin (fluoroquinolones) is obvious. In contrast, resistance rates to tetracycline (tetracyclines) decreased. For
erythromycin (macrolides), gentamicin (aminoglycosides) and chloramphenicol (phenicols), only a few isolates exhibited microbiological resistance. The implications of the 10 isolates exhibiting elevated minimum inhibitory concentrations against ertapenem (carbapenems) are currently under investigation in an ongoing European research project (see details below).
Concerning the resistance level of C. jejuni in broilers, the resistance levels are more or less stable over time. After a moderate peak in 2016, the resistance rates did not change significantly for the antibiotics tested. High resistance rates
1Macrolides: Erythromycin, Clarithromycin, Azithromycin; 2Fluoroquinolones: Ciprofloxacin, Nofloxacin, Ofloxacin
*West (GE, NE, VD, JU, FR), South (TI), North–East (other cantons) according to linguistic regions. **Trends were modelled with logistic regressions. Arrows represent a significant effect (p < 0.05) of the year on the corresponding outcome (increase, decrease). ***95% confidence intervals (CI) were calculated by the Wilson score method.
g: Trends in chloramphenicol, ciprofloxacin, ertapenem, erythromycin, gentamicin and tetracycline resistance in Campylobacter coli from fattening pigs between 2014 and 2023 (N= total number of tested isolates; values for 2014, 2016, 2018, 2020 and 2022 are interpolated [n/a]).
Figure 7.
Table 7. a: Resistance rates in C. coli and C. jejuni from human clinical isolates in 2023.
Campylobacter coli
Campylobacter jejuni
2023
to ciprofloxacin (fluoroquinolones) are of utmost importance, followed by high resistance rates to tetracycline (tetracyclines). Resistances to erythromycin (macrolides) were last detected in 2018 (3.6%).
In the case of C. coli from fattening pigs, the resistance rates are relatively stable, with very high resistance rates against tetracycline (tetracyclines) and ciprofloxacin (fluoroquinolones). Since 2021, there seems to be a slight increase in the resistance rate to ciprofloxacin (fluoroquinolones), whereas the resistance rate to tetracycline (tetracyclines) seems to be undergoing a slight decrease. A study conducted in Switzerland showed that a total amount of 610 kg of antimicrobials or 894,688 DCDCH (defined course doses for Switzerland) were used in the entire Swiss pig production in 2017. Penicillins, sulfonamides and tetracyclines were the most frequently used antimicrobial classes, while fluoroquinolones accounted for less than 1% [6]. Hartmann and collaborators found that fluoroquinolones are rarely used in the fattening period, but frequently used in sows (18.6%) and suckling pigs (29.0%) [7]. Resistance rates to macrolides decreased over time to a low level of 1.2% in 2023.
C. jejuni from slaughter calves was added to the monitoring program in 2021. Resistance data from 2021 and 2023 showed nearly the same general trends as for broilers and pigs: a very high resistance level to ciprofloxacin (fluoroquinolones) and a high level of resistance to tetracycline (tetracyclines), the latter with a decreasing trend. Moreover, resistance rates to erythromycin (macrolides) are very low (0.7%). Lastly, very few isolates exhibited elevated minimum inhibitory concentrations against ertapenem (carbapenems).
In humans, C. coli and C. jejuni isolates showed very high resistance rates to fluoroquinolones with an increasing trend. Moreover, resistance rates to macrolides in C. coli are moderate (12.1%), with a decreasing trend over the last 10 years.
Resistance in bacteria isolated from humans has been associated with resistance in bacteria from food-producing
Fully susceptible
Non-susceptible to one antibiotic group
Non-susceptible to two antibiotic groups
Non-susceptible to three antibiotic groups
Non-susceptible to four antibiotic groups
animals and with antimicrobial consumption in both humans and animals. The fourth joint inter-agency JIACRA report by the three EU agencies ECDC, EFSA and EMA provides data from the respective networks regarding antimicrobial consumption and resistance in isolates from humans and animals. This report demonstrates a statistically significant association between resistance to fluoroquinolones, macrolides and tetracyclines in Campylobacter spp. isolates from animals and humans in the EU (ECDC, EFSA and EMA, 2024). This finding is biologically plausible, as Campylobacter in meat products is still a major source of food-borne infections in humans [8]. As the use of fluoroquinolones is no longer advised for the treatment of human campylobacteriosis, even low levels of resistance to other critically important antimicrobials (e.g., macrolides) are a cause for concern in public health.
Overall, our findings concerning antimicrobial resistance in Campylobacter spp. from livestock are in line with reports from other European countries, although individual trends in some countries can differ [9]. Combined resistance to both ciprofloxacin (fluoroquinolones) and erythromycin (macrolides), which are considered critically important antimicrobials for the treatment of campylobacteriosis, was generally rare to low in C. jejuni from food-producing animals in European member states and Switzerland. In contrast to Switzerland, combined resistance was high in C. coli from cattle under 1 year of age (32.7%) in European member states. This finding may be a cause for public health concern on the European level.
Ertapenem (carbapenems) was newly included in the program for C. jejuni/coli in 2021, as there are indications of carbapenem-resistant Campylobacter spp. in human medicine. Isolates showing resistance to ertapenem (carbapenems) in Campylobacter spp. of slaughter calves in 2021 were the first finding of carbapenem-resistance in farm animals in Switzerland. In 2022, 10 C. coli isolates from broilers (37.1%) were showing a minimum inhibitory concentration > 0.5 mg/L. Resistance to ertapenem (carbapenems) is of high public concern, as carbapenems are recommended antimicrobials for treatment in severe invasive
(n=241)
Figure 7. h: Resistance pattern in Campylobacter coli from fattening pigs 2023.
Figure 7. i: Trends in chloramphenicol, ciprofloxacin, ertapenem, erythromycin, gentamicin and tetracycline resistance in Campylobacter jejuni from slaughter calves 2021 and 2023 (N= total number of tested isolates; values for 2022 are interpolated [n/a]).
2023 (N=154)
Erythromycin Gentamicin Tetracycline 2021 (N=143) 2022 (n/a)
Campylobacter infections in humans. However, findings on ertapenem (carbapenems) resistance in livestock should be interpreted with caution, as the epidemiological cutoff for ertapenem used by EFSA is still under discussion (0.5 mg/L) and a validated threshold for resistance to ertapenem (carbapenems) has not yet been established by the European Committee on Antimicrobial Susceptibility Testing (EUCAST).
Carbapenems are recognised as critically important antimicrobials (CIA) and have not been authorised for use in farm animals in Europe. The reasons for carbapenemase-producing bacteria occurring among farm animals are not known. A comparison with prevalence data from other European countries and previous years will be the task of the future. The unexpected level of ertapenem (carbapenems) resistance reported in Campylobacter from food-producing animals in 2021 and 2022, as well as the ECOFF chosen for interpretation of ertapenem (carbapenems) resistance in C. jejuni and C. coli will be further investigated in 2024 in the CarbaCamp project, a collaboration between EFSA, ECDC, EUCAST and the European Reference Laboratory for Antimicrobial Resistance (EURL-AR) [9]. This project will address several points regarding ertapenem (carbapenems) resistance in Campylobacter, including assessing (1) if the present ECOFF for interpretation is set correctly; (2) if ertapenem is the best carbapenem to be included in the antimicrobial test panel; (3) the effect of using different recommended test media; (4) if there are differences in the wild-type resistance distribution between Campylobacter
species and animal populations; (5) if there are emerging clones with ertapenem resistance; and lastly (6) if a resistance mechanism responsible for the observed results can be identified. The ZOBA is participating in this project.
7.2 Salmonella spp.
Salmonella (S.) spp. is the second most important zoonotic bacterial pathogen in Switzerland and the EU [1, 3]. Salmonellosis cases in humans have to be reported to public health authorities (ordinance of the FOPH on laboratory reports), whereas the notification of resistance profiles is not mandatory. In 2022, 1,843 human cases of salmonellosis were reported in Switzerland.
Animals can either be carriers of Salmonella spp. without showing any clinical signs or they can be diseased by Salmonella spp. Poultry often shows no signs of infection. In contrast, in cattle, Salmonella infection can cause fever, diarrhea and abortion. Fever and diarrhea are less common in pigs. Transmission of Salmonella spp. from animals to humans usually occurs through contaminated food. A wide variety of foodstuffs of animal (e.g. eggs, fresh meat) and plant origin (e.g. salads, spices, seeds) can be contaminated with Salmonella spp. Nowadays, especially highly processed “ready-to-eat” food can be contaminated with Salmonella spp. and other zoonotic bacteria (e.g. Listeria
Ciprofloxacin
monocytogenes ). In special cases (e.g. reptiles), Salmonella spp. can also be transmitted through direct contact with infected animals. Salmonellosis cases in livestock must be reported (ordinance of the FSVO on epizootic diseases). In poultry an active eradication program is in place.
Reported cases of salmonellosis in animals are very rare in Switzerland, with 114 reported cases in 2022 [3]. Moreover, the overall prevalence of Salmonella spp. in Swiss livestock is low (<2% in poultry, fattening pigs) compared to other European countries [1]. In Switzerland, out of 2,389 poultry meat samples (carcasses and meat), six (0.3%) were Salmonella spp. positive in 2022.
In Europe, S. Enteritidis and S. Typhimurium and the monophasic variant of S. Typhimurium are the most common serovars in human infections [1]. S. Enteritidis cases are associated with the consumption of broiler meat and contaminated eggs, whereas S. Typhimurium cases are associated with the consumption of contaminated broiler, pork, beef and turkey meat. The monophasic variant of S. Typhimurium is associated with all of the above sources. Due to the very low prevalence of Salmonella spp. in Swiss livestock,
the monitoring of antibiotic resistance is based solely on isolates from clinical cases or rare positive findings as part of the eradication program. Therefore, data do not allow reliable statistical analysis and resistance rates, and trends need to be discussed with caution, as these isolates are not a random sample and differ from year to year.
7.2.1 Salmonella spp. in animals
For hens, antimicrobial resistance data for 53 Salmonella spp., including 12 S. Typhimurium, two S. Typhimurium (monophasic variant) and 16 S. Enteritidis, were available in 2022. The vast majority of Salmonella spp. isolated from hen were fully susceptible to all tested antimicrobial classes, and an increasing trend towards complete susceptibility is noted (2020: 69.1%, 2022: 92.5%, Figure 7. j). Three Salmonella spp. showed resistance to diaminopyrimidine derivatives or penicillins, sulfonamides and tetracyclines (Table 7. b). One S. Typhimurium expressed resistance to polymyxins.
For turkey, seven S. Albany and two S. Senftenberg were analysed in 2022. Seven Salmonella spp. from turkey
Table 7. b: Non-susceptibility combinations in Salmonella spp. from hens in 2022.
Ampicillin; Sulfonamides: Sulfamethoxazole; Tetracyclines: Tetracycline, Tigecycline; Diaminopyrimidine derivatives: Trimethoprim; Amphenicols: Chloramphenicol
Table 7. c: Non-susceptibility combinations in Salmonella spp. from turkey in 2022.
Penicillins: Ampicillin; Sulfonamides: Sulfamethoxazole; Tetracyclines: Tetracycline, Tigecycline; Diaminopyrimidine derivatives: Trimethoprim; Amphenicols: Chloramphenicol
showed complete susceptibility, one isolate was resistant to fluoroquinolones, another isolate was resistant to fluoroquinolones and sulfonamides (Table 7. c).
For cattle, antimicrobial resistance data for 30 Salmonella spp., including 15 S. Typhimurium, seven S. Typhimurium (monophasic variant) and five S. Enteritidis, were available in 2023. Overall, the majority of Salmonella spp. isolated from cattle were fully susceptible to all tested antimicrobial classes (2021: 71.7%, 2023: 63.3%), although to a lower extent than in 2021 (Figure 7. k). One S. Typhimurium was resistant to polymyxins (Table 7.d). Six isolates showed combined resistance to penicillins, sulfonamides and tetracyclines (Table 7.d).
7.2.2 Salmonella spp. in humans
Human salmonellosis usually does not require antimicrobial treatment. However, in some patients, Salmonella infection can cause serious illness and sepsis. In these cases, effective antimicrobials are essential for treatment and can be life-saving. The treatment of choice for Salmonella infections is fluoroquinolones for adults and third-generation cephalosporins for children.
In ANRESIS, information on antimicrobial resistance was available only for a minority of the 1,870 cases observed in 2023 in Switzerland (incidence 21.1 per 100,000 inhabitants). Resistance rates are only available for aminopenicil -
Table 7. d: Non-susceptibility combinations in Salmonella spp. from cattle in 2023.
Penicillins: Ampicillin; Sulfonamides: Sulfamethoxazole; Tetracyclines: Tetracycline, Tigecycline; Diaminopyrimidine derivatives: Trimethoprim; Amphenicols: Chloramphenicol
1Macrolides: Erythromycin, Clarithromycin, Azithromycin; 2Fluoroquinolones: Ciprofloxacin, Nofloxacin, Ofloxacin *West (GE, NE, VD, JU, FR), South (TI), North–East (other cantons) according to linguistic regions. **Trends were modelled with logistic regressions. Arrows represent a significant effect (p < 0.05) of the year on the corresponding outcome (increase, decrease). ***95% confidence intervals (CI) were calculated by the Wilson score method.
Table 7. e: Resistance rates in Salmonella from human clinical isolates in 2023. Salmonella
2022 (n=53)
7. j: Resistance pattern in Salmonella spp. from hen for 2020 and 2022.
2020 (n=81)
2023
Fully susceptible
Non-susceptible to one antibiotic group
Non-susceptible to two antibiotic groups
Non-susceptible to three antibiotic groups
Non-susceptible to four antibiotic groups
for 2021 and 2023.
Fully susceptible
Non-susceptible to one antibiotic group
Non-susceptible to two antibiotic groups
Non-susceptible to three antibiotic groups
Non-susceptible to four antibiotic groups
Figure 7. l: Trends in resistance to aminopenicillins. ceftriaxone, fluoroquinolones and trimethoprim-sulfamethoxazole in non-typhoidal Salmonella (serovars Typhimurium and Enteritidis combined) from human clinical isolates in Switzerland between 2014 and 2023.
Figure
Figure 7. k: Resistance pattern in Salmonella spp. from cattle
lins, ceftriaxone, trimethoprim-sulfamethoxazole and fluoroquinolones (Table 7. e). Serovar typing in human medicine is only performed for a minority of all isolates. Although this information is interesting for epidemiologic purposes, in contrast to susceptibility testing results, it is irrelevant for treatment decisions. As in veterinary medicine, S. Typhimurium and S. Enteritidis are the most frequent serovars specified, and they differ in their antimicrobial resistance profiles (Table 7. e). From 2014 to 2023, resistance rates decreased significantly for aminopenicillins (from 34% to 11.8%, Figure 7. l) and trimethoprim-sulfamethoxazole (from 5.9% to 2.8%, Figure 7. l), while significantly increasing resistance trends were observed for fluoroquinolones (from 10.6% to 19.4% in 2023, Figure 7. l), which requires special consideration, as quinolones still are recommended as the first-line antibiotic therapy in adults, if antibiotic therapy is deemed necessary at all.
7.2.3 Summary and Discussion
Thanks to long-term control programs, the prevalence of Salmonella spp. in food-producing animals in Switzerland is very low. Accordingly, only a few, non-representative Salmonella spp. isolates from livestock are available, either from clinical cases or from healthy poultry through the national Salmonella spp. eradication programs. Hence, rates of resistance and their long-term trends should be interpreted with caution.
Overall, Salmonella spp. from poultry and cattle showed consistently very high to high rates of full susceptibility to the antimicrobials tested. When a resistance occurred, this was mostly due to first-line antibiotics, such as penicillins, sulfonamides and tetracyclines. Resistance to polymyxins was detected in only two cases.
Fluoroquinolones and third-generation cephalosporins are critically important antimicrobials for the treatment of human salmonellosis. Importantly, neither ESBL/AmpC- nor carbapenemase-producing Salmonella spp. isolates were found in poultry or cattle. Resistance to fluoroquinolones was found in two Salmonella spp. from turkey.
Monitoring data on antimicrobial resistance in Salmonella spp. from Switzerland are not directly comparable with other monitoring data from Europe, as the latter do not include isolates from clinical cases. Nevertheless, on the European level, the proportion of complete susceptibility in Salmonella spp. isolates from broilers and calves at slaughter ranges from 35.4% to 55.7%, and is thereby much lower than the proportion in Swiss clinical isolates from hens and cattle [9]. In contrast to Switzerland, multidrug resistance (MDR) in European member states was observed at high levels in Salmonella spp. recovered from broilers and turkeys in 2022 (43.6% and 39.4%, respectively), and from fattening pigs (39.1%) and cattle under 1 year of age (30.4%) in 2021. Salmonella spp. isolates from laying hens showed a markedly lower MDR level (7.5%) in European member states.
Colistin is an antimicrobial substance belonging to the polymyxin class. Because of its effectiveness against carbapenemase-producing Gram-negative bacteria, it is nowadays considered a highest priority antimicrobial for the treatment of serious human infections [9]. Salmonella spp. could develop chromosomal-linked colistin resistance, which targets diverse regulatory systems involved in lipopolysaccharide (LPS) building. Moreover, Salmonella spp. of different origins (humans, animals, food) carrying plasmid-mediated colistin resistance conferred by mcr genes have been detected in various serovars of Salmonella spp. [10]. Group D Salmonella enterica serovars differ in their susceptibility to colistin and are frequently intrinsically resistant (MIC > 2 μg/ml) [11]. Microbiological resistance to colistin was detected in two out of 83 Salmonella spp. isolates (2.4%) from poultry and cattle in 2022 and 2023, respectively.
References
[1] EFSA and ECDC (European Food Safety Authority and European Centre for Disease Prevention and Control), (2023). The European Union One Health 2022 Zoonoses Report. EFSA Journal, 21(12), e8442. https://doi.org/10.2903/j.efsa.2023.8442
[2] Schmutz C, Mäusezahl D, Bless PJ, Hatz C, Schwenkglenks M, & Urbinello D. (2017). Estimating healthcare costs of acute gastroenteritis and human campylobacteriosis in Switzerland. Epidemiology and infection, 145(4), 627–641.
[3] Federal Food Safety and Veterinary Office (FSVO), 2023. Bericht zur Überwachung von Zoonosen und lebensmittelbedingten Krankheitsausbrüchen – Daten 2022. Bern 2023; 50pp, in German.
[4] Kittl S, Korczak BM, Niederer L, Baumgartner A, Buettner S, Overesch G, & Kuhnert P. (2013). Comparison of genotypes and antibiotic resistances of Campylobacter jejuni and Campylobacter coli on chicken retail meat and at slaughter. Applied and environmental microbiology, 79(12), 3875–3878. https://doi.org/10.1128/AEM.00493-13.
[5] Kittl S, Heckel G, Korczak BM, & Kuhnert P. (2013). Source attribution of human Campylobacter isolates by MLST and fla-typing and association of genotypes with quinolone resistance. PloS one, 8(11).
[6] Kümmerlen D, Echtermann T, von Gerlach F, Müntener CR, Sidler X. Untersuchung des Antibiotikaverbrauchs in 598 Schweinebeständen in der Schweiz im Jahr 2017 [Analyses of antimicrobial usage in 598 pig farms in Switzerland in 2017]. Schweiz Arch Tierheilkd. 2019;161(12):809-820. doi:10.17236/sat00237.
[7] Hartmann S, Riklin A, Müntener C, Schüpbach-Regula G, Nathues C, Sidler X. Antibiotikaeinsatz in Schweizer Ferkelerzeugungs- und Mastbetrieben [Use of antibiotics in Swiss piglet production and fattening farms]. Schweiz Arch Tierheilkd. 2019;161(12):797–808. doi:10.17236/sat00236.
[8] Antimicrobial consumption and resistance in bacteria from humans and food-producing animals Fourth joint inter-agency report on integrated analysis of antimicrobial agent consumption and occurrence of antimicrobial resistance in bacteria from humans and food-producing animals in the EU/EEA JIACRA IV –2019−2021 (2024). EFSA Journal2024; 22, e8589 // doi.org/10.2903/j.efsa.2024.8589
[9] EFSA (European Food Safety Authority) & ECDC (European Centre for Disease Prevention and Control). (2024). The European Union summary report on antimicrobial resistance in zoonotic and indicator bacteria from humans, animals and food in 2021–2022. EFSA Journal, 22, e8583 //doi.org/10.2903/j.efsa.2024.8583
[10] Lima T, Domingues S, Da Silva GJ. Plasmid-mediated colistin resistance in Salmonella enterica: A Review. Microorganisms. 2019;7(2):55. Published 2019, Feb 19. doi:10.3390/microorganisms7020055.
[11] Ricci V, Zhang D, Teale C, Piddock LJV. The O-Antigen Epitope Governs Susceptibility to Colistin in Salmonella enterica. mBio. 2020, Jan 28;11(1):e0283119. doi: 10.1128/mBio.02831-19. PMID: 31992619; PMCID: PMC6989106.
SPSP: A surveillance and research platform for swiss pathogen molecular data
A. Neves 1, D. Walther 1, V. Barbie 1,*, R. Beaugrand 2 ,*, C. Bertelli 3,*, D. S. Blanc 4,*, G. Bouchet 1,*, D. Clignez 2 ,*, S. Cordey 5,*, G. Greub 3,*, M. Heusghem 2 , M. Huber 6,*, L. Kaiser 5,*,P. Keller 7,*, A. Kralova 2 , A. Kronenberg 8,*, S. L. Leib 8,*, K. Leuzinger 9,*, V. Lazarevic 10,*, J. Molina 2 ,*, V. Perreten 11,*, A. Ramette 8,*, A. R. Gonçalves Cabecinhas 5,*, P. Rogalla 12 ,*, T. Roloff 12 ,*, J. Schrenzel 10,*, H. M B Seth-Smith 12 ,*, R. Stephan 13,*, D. Terumalai 1,* and A. Egli 12
1 SIB Swiss Institute of Bioinformatics, Geneva, Switzerland
2 SIB Swiss Institute of Bioinformatics, Lausanne, Switzerland
3 Clinical Microbiology, University Hospital Lausanne, Lausanne, Switzerland
4 Infection Prevention and Control Unit, Infectious Diseases Service, Lausanne University Hospital and University of Lausanne, Lausanne, Switzerland
5 Laboratory of Virology, Geneva University Hospitals, Geneva, Switzerland
6 Institute of Medical Virology, University of Zurich, Zurich, Switzerland
7 Clinical Microbiology, University Hospital Basel, Basel, Switzerland
8 Institute for Infectious Diseases (IFIK), University of Bern, Bern, Switzerland
9 Clinical Virology, University Hospital Basel, Basel, Switzerland
10 Genomic Research Laboratory, University of Geneva, Geneva, Switzerland
11 Institute of Veterinary Bacteriology, Vetsuisse Faculty, University of Bern, Bern, Switzerland
12 Institute of Medical Microbiology, University of Zurich, Zurich, Switzerland
13 Institute for Food Safety and Hygiene, Vetsuisse Faculty, University of Zurich, Zurich, Switzerland
* Authors listed in alphabetical order.
Genomic sequencing plays a crucial role in monitoring antimicrobial resistance, allowing for the precise identification of resistance genes and tracking the spread of resistant strains. By leveraging platforms such as the Swiss Pathogen Surveillance Platform (SPSP), clinicians, public health authorities and researchers can access high-quality genomic data, enhancing the ability to respond to and manage antimicrobial resistance effectively.
SPSP is a One Health data platform for pathogen molecular data and associated clinical/epidemiological metadata,
serving surveillance and research [1,2]. Founded in 2018 as part of the National Research Programme 72 focusing on antimicrobial resistance, it is co-led by the clinical (human and veterinary) microbiology and virology laboratories of all Swiss University centres (Basel, Bern, Geneva, Lausanne, Zurich) and the SIB Swiss Institute of Bioinformatics. SPSP also benefits from diverse partners and scientific/advisory boards, ensuring community-driven platform developments (https://spsp.ch/organization/) (Figure XIII).
Through its collaborations with the Federal Office of Public Health (FOPH) and the Federal Food Safety and Veterinary Office (FSVO), SPSP is becoming a key infrastructure serving surveillance programs and outbreak monitoring. Since 2021, SPSP has centralised the SARS-CoV-2 genomic sequences from the national surveillance program led by the Swiss National Reference Centre for Emerging Viral Diseases and the FOPH [3]. Structured data are quality-controlled and annotated with a common bioinformatics pipeline, before being automatically shared with the FOPH to provide information regarding circulating variants. In 2023, SPSP received the mandate to extend the platform to influenza and the respiratory syncytial virus, in collaboration with the National Influenza Reference Center. Within a joint subsidy from the FOPH and FSVO, SPSP is now being extended to bacterial species in a One Health context, to support the monitoring of outbreaks and antimicrobial resistance across the human, veterinary, food and environmental compartments. These developments are carried out in close collaboration with experts from national reference centres, who provide input on the required data, analyses and visualizations to ensure high impact. SPSP is also collaborating with ANRESIS (www.anresis.ch), the Swiss Centre for Antibiotic Resistance, to support mutual interoperability and data linking.
SPSP is hosted and developed at SIB. The implemented bacterial genomic pipeline is IMMense, created at the Institute of Medical Microbiology of the University of Zurich. Currently, SPSP manages genomic and MALDI-TOF data, together with metadata describing the pathogen, data provider and sequencing procedures. In accordance with its ethical approval (2019–01291), SPSP also hosts sensitive data such as isolate-associated identifiers and epidemiological information. This enables data linking with additional datasets e.g. for surveillance by the FOPH as regulated by the Epidemics Act, or for research with an ethical approval according to the Human Research Act. To comply with the IT security requirements from federal authorities and best practices for handling personal data, SPSP is hosted on the Swiss BioMedIT infrastructure. Encrypted data can
only be accessed using institutional VPNs and two-factor authentication. Data access is controlled at metadata level, ensuring that, by default, users only see their own data and non-sensitive data submitted by others.
SPSP has also established a Consortium Agreement and Data Transfer and Use Agreement. New partners can access SPSP for a specific project by signing an agreement ensuring consistent data protection and security framework. The Executive Board also meets actively, ensuring smooth onboarding of new projects as well as rapid, community-driven decisions. Once a year, the Annual Meeting gathers the Advisory and Scientific Boards to broadly discuss progress and provide input.
SPSP aims to support researchers with controlled access to high-quality clinical data. The Consortium Agreement also emphasises the need to support Open Science principles where possible. This translates into timely open data sharing of genomic data and of limited de-identified contextual metadata to international archives such as the European Nucleotide Archive (https://www.ebi.ac.uk/ena/browser/home).
Since 2021, Switzerland has been the third largest worldwide contributor of open SARS-CoV-2 raw sequencing data. Open data is however not sufficient to ensure that data are findable, accessible, interoperable and reusable (FAIR principles [4]). To address this pressing need for both research and surveillance, SPSP has undertaken several actions: (i) the Public Portal (https://public.spsp.sib.swiss/) allows unregistered users to discover the SPSP data catalog prior to requesting access to the data; (ii) data access is well regulated within the SPSP ethical and legal framework; (iii) ontologies (SNOMED CT, NCBI Taxonomy, GENEPIO) and controlled vocabularies are implemented in SPSP to foster interoperability in alignment with international standards; (iv) data are described with high quality contextual metadata; (v) bioinformatics workflows rely on containers and workflow managers to ensure provenance tracking and reproducibility (to be expanded). As part of the Swiss
Personalised Health Network National Data Stream “IICU”, bacterial isolates from patients in intensive care units are sequenced and analysed for antimicrobial drug resistance.
SPSP is envisioned to become a cornerstone infrastructure of Switzerland to support federal authorities in One Health genomic data management. Furthermore, SPSP is also actively involved in European and global projects aiming to connect similar data platforms across regions and ensure common standards, best practices and optimised interoperability, to support preparedness and response at both national and global levels.
References
[1] Neves A, Walther D, Martin-Campos T, Barbie V, Bertelli C, Blanc D, et al. The Swiss Pathogen Surveillance Platform – towards a nation-wide One Health data exchange platform for bacterial, viral and fungal genomics and associated metadata. Microb Genom. 2023;9. doi:10.1099/mgen.0.001001
[2] Egli A, Blanc DS, Greub G, Keller PM, Lazarevic V, Lebrand A, et al. Improving the quality and workflow of bacterial genome sequencing and analysis: paving the way for a Switzerland-wide molecular epidemiological surveillance platform. Swiss Med Wkly. 2018;148: w14693–w14693.
[3] Wegner F, Cabrera-Gil B, Tanguy A, Beckmann C, Beerenwinkel N, Bertelli C, et al. How much should we sequence? An analysis of the Swiss SARSCoV-2 surveillance effort. Microbiol Spectr. 2024;12: e0362823.
[4] Wilkinson MD, Dumontier M, Aalbersberg IJ, Appleton G, Axton M, Baak A, et al. The FAIR Guiding Principles for scientific data management and stewardship. Scientific Data. 2016;3: 1–9.
Figure XIII: SPSP consortium.
Resistance in indicator bacteria in livestock animals from samples at slaughter
8 Resistance in indicator bacteria in livestock animals from samples at slaughter
Antimicrobial resistance among commensal bacteria from the intestinal flora of healthy food-producing animals, e.g. Escherichia (E.) coli, can be used as an “indicator” for factors such as the selective pressure from use of antimicrobial agents in these populations. These bacteria constitute a reservoir of potentially transferable resistance genes that can spread horizontally to other bacteria, including zoonotic bacteria [1]. Monitoring antimicrobial resistance in these bacteria provides information about the types of resistance present in intestinal bacteria of food-producing animals. This information can then potentially be of relevance in studying antimicrobial resistance in bacteria present in humans. Therefore, such monitoring is relevant to both public and animal health. It also serves as a valuable early-warn -
ing system to help identify emerging types of resistance in livestock populations and to monitor their potential spread.
With the emergence of multidrug-resistant bacteria in the last decades in human and veterinary medicine, monitoring was expanded to ESBL/AmpC-producing and carbapenemase-producing E. coli and, since 2020, to carbapenemase-producing Klebsiella spp.
Because of its importance in humane medicine, methicillin-resistant Staphylococcus aureus (MRSA), a commensal bacterium that can be found in the soft tissues of healthy animals, is included in the antimicrobial resistance monitoring for pigs and calves.
Figure 8. a: Trends in antibiotic resistance in indicator Escherichia coli from broiler between 2012 and 2022 (N = total number of tested isolates, values for 2015 , 2017, 2019 and 2021 interpolated [n/a]between 2014 and 2022 (N = total number of tested isolates; values for 2015, 2017, 2019 and 2021 interpolated [n/a]).
Fully susceptible
Non-susceptible to three antibiotic groups
Non-susceptible to one antibiotic group
Non-susceptible to four antibiotic groups
8.1 Indicator Escherichia coli
8.1.1 Indicator Escherichia coli in broilers
In 2022, a random sample of 240 broiler flocks was examined at slaughter for the occurrence of antimicrobial resistance patterns in indicator E. coli using cecal samples (10 pooled cecal samples per flock). Indicator E. coli (n = 229) were isolated using the direct detection method. The highest levels of antimicrobial resistance were detected for ciprofloxacin (fluoroquinolones) (34.1%), sulfamethoxazole (sulfonamides) (16.2%), ampicillin (penicillins) (14.8%), trimethoprim (diaminopyrimidine derivatives) (10%) and tetracycline (tetracycline (tetracyclines)) (8.7%) (Figure 8. a). Low to very low resistance rates were detected for gentamicin (aminoglycosides) (1.7%) and chloramphenicol (phenicols) (0.4%). No resistance was detected for amikacin (aminoglycosides), azithromycin (macrolides), colistin (polymyxins), tigecycline (glycylcyclines) and meropenem (carbapenems) (Figure 8. a). One isolate turned out to be an ESBL/AmpC producer. Since 2018, a downward trend in antimicrobial resistance to ciprofloxacin (fluoroquinolones), ampicillin (penicillins), tetracycline (tetracycline (tetracyclines)) and trimethoprim (diaminopyrimidine derivatives) has been observed (Figure 8. a).
Overall, 51.1% of all indicator E. coli showed no resistance to any antimicrobial substance tested and another seventy-four isolates (32.3%) were resistant to just one antibiotic (antibiotic class), mainly to ciprofloxacin (fluoroquinolones) (Figure 8. b, Table 8. a). The one ESBL/AmpC producer isolate showed resistance to seven antimicrobial classes (Table 8. a).
Non-susceptible to two antibiotic groups
Non-susceptible to more than four antibiotic groups
8.1.2 Indicator Escherichia coli in fattening pigs
In 2023, a random sample of 202 fattening pigs was examined at slaughter for the occurrence of antimicrobial resistance patterns in indicator E. coli using cecal samples. Indicator E. coli were isolated from 201 samples using the direct detection method. The highest levels of antimicrobial resistance were detected for sulfamethoxazole (sulfonamides) (27.4%), ampicillin (penicillins) (17.4%), tetracycline (tetracyclines) (15.9%) and trimethoprim (diaminopyrimidine derivatives) (13.9%) (Figure 8. c). Resistance rates to ciprofloxacin (fluoroquinolones) (4.5%), chloramphenicol (phenicols) (4.5%) and gentamicin (aminoglycosides) (1.5%) were low (Figure 8. c). One isolate turned out to be resistant to azithromycin (macrolides) (0.5%) (Figure 8. c). Neither ESBL/AmpC producers nor resistance to amikacin (aminoglycosides), colistin (polymyxins), tigecycline (glycylcyclines) and meropenem (carbapenems) were detected.
The resistance pattern has not changed significantly since 2019, with the exception of tetracycline (tetracyclines), where a sharp decrease was recorded since 2021 (Figure 8. c).
Overall, 57.2% of all E. coli displayed no resistance to any antimicrobial substance tested (Figure 8. d, Table 8. b). Another 41 isolates (20.4%) were resistant to just one antibiotic (antibiotic class), mainly to sulfamethoxazole (sulfonamides) or tetracycline (tetracyclines) (Figure 8. d, Table 8. b).
2020 (n=229)
Figure 8. b: Resistance pattern in indicator Escherichia coli from broiler, 2022.
Table 8. a: Non-susceptibility combinations in indicator Escherichia coli in broilers in 2022.
3 rd generation cephalosporins – 4th generation cephalosporins – Amphenicols – Diaminopyrimidine derivatives – Penicillins – Sulfonamides
Penicillins: Ampicillin; 3rd gen. Cephalosporins: Cefotaxime, Ceftazidime; 4th gen. Cephalosporins: Cefepime; Cephamycin: Cefoxitin; Sulfonamides: Sulfomethoxazole; Aminoglycosides: Gentamicin; Fluoroquinolones: Ciprofloxacin, Nalidixic acid; Tetracyclines: Tetracycline, Tigecycline; Macrolides: Azithromycin; Diaminopyrimidine derivatives: Trimethoprim; polymyxins: colistin; Amphenicols: Chloramphenicol
8.1.3 Indicator Escherichia coli in slaughter calves
In 2023, a random sample of 197 calves was examined at slaughter for the occurrence of antimicrobial resistance patterns in indicator E. coli using cecal samples. Indicator E. coli were isolated from 190 samples using the direct detection method. The highest levels of antimicrobial resistance were detected for tetracycline (tetracyclines) (26.8%), sulfamethoxazole (sulfonamides) (26.3%), and ampicillin (penicillins) (23.7%) (Figure 8. e). Low resistance
rates were found for chloramphenicol (phenicols) (9.5%), trimethoprim (diaminopyrimidine derivatives) (6.8%), ciprofloxacin (fluoroquinolones) (2.6%) and gentamicin (aminoglycosides) (2.1%) (Figure 8. e). Six isolates turned out to be ESBL/AmpC producers. Two of these showed resistance to azithromycin (macrolides). No resistance was detected for amikacin (aminoglycosides), colistin (polymyxins), tigecycline (glycylcyclines) and meropenem (carbapenems).
Table 8. b: Non-susceptibility combinations in indicator Escherichia coli in fattening pigs in 2023.
Penicillins: Ampicillin; 3rd gen. Cephalosporins: Cefotaxime, Ceftazidime; 4th gen. Cephalosporins: Cefepime; Cephamycin: Cefoxitin; Sulfonamides: Sulfomethoxazole; Aminoglycosides: Gentamicin; Fluoroquinolones: Ciprofloxacin, Nalidixic acid; Tetracyclines: Tetracycline, Tigecycline; Macrolides: Azithromycin; Diaminopyrimidine derivatives: Trimethoprim; polymyxins: colistin; Amphenicols: Chloramphenicol
Compared to 2019, antimicrobial resistance rates for sulfamethoxazole (sulfonamides), tetracycline (tetracyclines) and ampicillin (penicillins) are stable at a high level, and for ciprofloxacin (fluoroquinolones) stable at a low level (Figure 8. e). For trimethoprim (diaminopyrimidine derivatives) and gentamicin (aminoglycosides), a strong decrease has been observed since 2022 and 2021 respectively, whereas resistance rates for chloramphenicol (phenicols) increased (Figure 8. e).
Overall, 66.3% of all E. coli exhibited no resistance to any antimicrobial substance tested (Figure 8. f, Table 8.
8. c: Trends in antibiotic resistance in indicator Escherichia coli from fattening pigs between 2014 and 2023 (N = total number of tested isolates, values for 2014, 2016, 2018, 2020 and 2022 interpolated [n/a]).
% resistant E. coli in fattening pigs
Chloramphenicol Ciprofloxacin
Sulfamethoxazole Tetracycline
Colistin Gentamicin Trimethoprim
Fully susceptible
Non-susceptible to three antibiotic groups
Non-susceptible to one antibiotic group
Non-susceptible to four antibiotic groups
c). Another 14 isolates (7.4%) were resistant to just one antibiotic (antibiotic class), mainly to ampicillin (penicillins) or sulfamethoxazole (sulfonamides) (Table 8. c). Twenty-two isolates (11.6%) showed resistance to three antibiotic classes (Table 8. c). The six ESBL/AmpC producers showed multidrug resistance to more than seven antimicrobial classes (Table 8. c).
Non-susceptible to two antibiotic groups
Non-susceptible to more than four antibiotic groups
8.1.4 Discussion
Resistance rates of commensal E. coli from broilers in Switzerland in 2022 showed an ongoing decreasing trend for ciprofloxacin (fluoroquinolones), ampicillin (penicillins) and tetracycline (tetracyclines) (Figure 8. a). Nevertheless, resistance rates against critically important ciprofloxacin
Ampicillin
Nalidixic acid
Figure
2023 (n=201)
Figure 8. d: Resistance pattern in indicator Escherichia coli from fattening pigs, 2023.
Table 8. c: Non-susceptibility combinations in indicator Escherichia coli in slaughter calves in 2023.
rd generation cephalosporins – 4th generation cephalosporins – Amphenicols – Cephamycin –Diaminopyrimidine derivatives – Fluoroquinolones – Macrolides – Penicillins – Sulfonamides
Penicillins: Ampicillin; 3rd gen. Cephalosporins: Cefotaxime, Ceftazidime; 4th gen. Cephalosporins: Cefepime; Cephamycin: Cefoxitin; Sulfonamides: Sulfomethoxazole; Aminoglycosides: Gentamicin; Fluoroquinolones: Ciprofloxacin, Nalidixic acid; Tetracyclines: Tetracycline, Tigecycline; Macrolides: Azithromycin; Diaminopyrimidine derivatives: Trimethoprim; polymyxins: colistin; Amphenicols: Chloramphenicol
(fluoroquinolones) are still on a high level (34.1%). The proportion of fully susceptible isolates increased from 44.2% in 2020 to 51.1% in 2022.
A significant decrease in resistance against ciprofloxacin (fluoroquinolones), ampicillin (penicillins) and tetracycline (tetracyclines) was also reported by many European member states, such as France, Ireland, Italy, Portugal and the Netherlands. On the median European
resistance
8. e: Trends in antibiotic resistance in indicator Escherichia coli from slaughter calves between 2014 and 2023 (N=total number of tested isolates, values for 2014, 2016, 2018, 2020 and 2022 interpolated [n/a]).
% resistant E. coli in calves
Sulfamethoxazole Tetracycline
Fully susceptible
Non-susceptible to three antibiotic groups
Non-susceptible to one antibiotic group
Non-susceptible to four antibiotic groups
rates to these antimicrobials have decreased over time [1]. Interestingly, northern European countries such as Finland, Denmark, Norway, Iceland and Sweden consistently reported low level resistances to these antimicrobials from 2014 onward [1]. As broiler production is highly concen -
Non-susceptible to two antibiotic groups
Non-susceptible to more than four antibiotic groups
trated internationally, with just a few suppliers of chicken for all of Europe, these global trends argue for changes in antimicrobial use by the companies at the top of the broiler production pyramid [2].
Ampicillin Chloramphenicol Ciprofloxacin
Nalidixic acid Colistin Gentamicin Trimethoprim
Figure
2023 (n=190)
Figure 8. f: Resistance pattern in indicator Escherichia coli from slaughter calves, 2023.
8. d:
3 rd generation cephalosporins – 4th generation cephalosporins – Aminoglycosides –Amphenicols – Diaminopyrimidine derivatives – Penicillins – Sulfonamides – Tetracyclines
Penicillins: Ampicillin; 3 rd gen. Cephalosporins: Cefotaxime, Ceftazidime; 4th gen. Cephalosporins: Cefepime; Cephamycin: Cefoxitin; Sulfonamides: Sulfomethoxazole; Aminoglycosides: Gentamicin; Fluoroquinolones: Ciprofloxacin, Nalidixic acid; Tetracyclines: Tetracycline, Tigecycline; Macrolides: Azithromycin; Diaminopyrimidine derivatives: Trimethoprim; polymyxins: colistin; Amphenicols: Chloramphenicol
In contrast, trends in resistance levels of E. coli from fattening pigs did not change significantly between 2021 and 2023 for ampicillin (penicillins) and sulfamethoxazole (sulfonamides), with levels remaining high. This is also true at European level [1]. Compared to European countries, the overall level of resistance in Switzerland is lower than in most European countries and more comparable to resistance levels reported in Denmark, Finland and Sweden. For tetracycline (tetracyclines), the resistance rate in Swiss fattening pigs decreased significantly, as also observed in Bulgaria, Czechia, France and Germany. Levels of resistance against critically important fluoroquinolone resistances are consistently low in Switzerland as well as at the median European level (<10%).
Slaughter calf data at European level are sparse, but overall, a steady state of resistance rates has been was observed at European level over the last number of years [1]. In contrast to most European countries, Sweden and Norway reported consistently very low resistance levels for ampicillin (penicillins), tetracycline (tetracyclines) and ciprofloxacin (fluoroquinolones). Switzerland reported high levels of resistance to ampicillin (penicillins) and tetracycline (tetracyclines), but a decreasing trend has been observed since
2013. For ciprofloxacin (fluoroquinolones), the resistance is stable at a low level in Switzerland, the Netherlands, Germany and Spain, as well as at the European level.
The frequent occurrence of resistance to ampicillin (penicillins), sulfamethoxazole (sulfonamides), trimethoprim (diaminopyrimidine derivatives) and tetracycline (tetracyclines) in indicator commensal E. coli isolates from animal origins likely reflects the widespread past and present use of these antimicrobials in food-producing animals in European countries as well as in Switzerland. These substances, together with ciprofloxacin (fluoroquinolones), frequently occur as a core component of multi-drug resistance patterns in E. coli from broilers. This likely reflects the fact that the genes conferring resistance to these substances are often linked on mobile genetic elements, resulting in co-selection for ciprofloxacin (fluoroquinolones) in broilers. Notably, Jacoby et al. (2014) reported that E. coli exhibited resistance to ciprofloxacin (fluoroquinolones) but not to nalidixic acid (quinolones), generally indicating the presence of transmissible genes mediating quinolone resistance [3]. This resistance pattern is seen in indicator E. coli in turkeys and calves in European countries, but not in indicator E. coli from broilers.
Figure 8. g: Prevalence of ESBL/AmpC-producing Escherichia coli from broilers between 2014 and 2022 (N = total number of tested isolates, values for 2015, 2017, 2019 and 2021 interpolated [n/a].
% ESBL/AmpC-producing E. coli in broiler
Year
ESBL/AmpC E. coli
In Switzerland, no colistin (polymyxins) resistant indicator E. coli were detected. Considering all reporting countries, the median colistin (polymyxins) resistance was rare in all livestock categories [1]. Statistically significant decreasing trends in the level of colistin (polymyxins) resistance were reported among isolates from specific animal categories by some European countries. This is in line with the fact that sales of polymyxins (e.g. colistin (polymyxins)) for use in animals has decreased by over 40% between 2017 and 2022 in Europe [4].
Resistance to azithromycin (macrolides) was rare, very low or low in all three livestock categories, both in Switzerland and in European countries. Azithromycin, which is an azalide, a subclass of macrolide antimicrobials, is not used in animals. The selective pressure exerted by the use of other related macrolides in food-producing animals may have favoured the emergence of azithromycin (macrolides) resistance.
In general, the key outcome indicator of complete susceptibility accounting for differences in the relative size of food producing animal populations for indicator E. coli varied widely between countries, ranging from <20% to >80% [1]. Lower values were generally observed in countries in Eastern and Southern Europe, and the highest values were found in the northern countries [1]. The resistance situation, both in Switzerland and at European level, has generally improved. This trend has been particularly pronounced
in broilers. It is, however, important to note that in some countries, a favourable situation has already developed over time, and major improvements cannot be expected. Efforts to maintain and even further improve the situation should, however, also be made in these countries.
8.2 ESBL/AmpC-producing Escherichia coli
Since the beginning of the 21st century, extended-spectrum b-lactamase (ESBL) and plasmid-mediated AmpC beta-lactamase (pAmpC) producers have emerged in Gram-negative bacteria, particularly in Enterobacterales such as E. coli [5]. Treating infections with these multidrug resistant bacteria is challenging for clinicians and, in the past, has led to the use of last-resort antimicrobials such as carbapenems [6]. Travelling to regions such as India, Asia or Africa was shown to be a risk factor for the colonisation of tourists with ESBL/AmpC-producing E. coli [7–8]. From the One Health perspective, there have been food safety concerns about whether food-producing animals can act as reservoirs for ESBL/AmpC-producing E. coli, which may then reach consumers via contaminated meat. Therefore, analyses on the prevalence of ESBL/AmpC-producing E. coli in cecal samples from broilers, pigs and calves were
introduced into the European harmonised antimicrobial resistance monitoring program in 2014 [1].
Activity of beta-lactamases enables bacteria to inactivate beta-lactam antimicrobials by breaking their beta-lactam ring. A broad variety of responsible genes has been detected [9]. As a rule, extended spectrum beta-lactamase (ESBL) producing bacteria are resistant to third- and fourth-generation cephalosporins and monobactams, but susceptible to beta-lactamase inhibitors. In contrast, plasmid-mediated AmpC beta-lactamase-producing bacteria are resistant to third-generation cephalosporins, including beta-lactamase inhibitors such as clavulanic acid and cephamycins. However, they do not usually mediate resistance to fourth-generation cephalosporins. Nevertheless, various mixed resistance patterns have now been described. Both, ESBL and AmpC are produced by intestinal bacteria.
8.2.1 ESBL/AmpC-producing Escherichia coli in broilers
In 2022, a random sample of 510 broiler flocks was investigated at slaughter for the occurrence of ESBL/AmpC-producing E. coli using cecal samples (ten pooled cecal samples per flock). By applying the European harmonised method, 22 presumptive ESBL/AmpC-producing E. coli were isolated. This corresponds to a flock prevalence of
4.3% (Figure 8. g). Compared to 2020, the prevalence of ESBL/AmpC-producing E. coli once more decreased significantly in the Swiss broiler population (Figure 8. g).
Details on multidrug resistance patterns are shown in Table 8. d. Nine isolates (40.9%) showed resistance to five antibiotic classes (Table 8. d). One isolate each showed resistance to six or eight antibiotic classes, respectively (Table 8. d). Besides resistance to third- and fourth-generation cephalosporins, ESBL/AmpC-producing E. coli very often showed additional resistances to other antibiotic classes. Most often, resistances to fluoroquinolones and sulfonamides were detected (Table 8. d). Additional resistances to diaminopyrimidine derivatives, tetracyclines, aminoglycosides and phenicols were exhibited by fewer isolates (Table 8. d).
No resistance against amikacin (aminoglycosides), azithromycin (macrolides), colistin (polymyxins), temocillin (penicillins), tigecycline (glycylcyclines) and carbapenems (meropenem, imipenem, ertapenem) was observed.
Twelve isolates (54.5%) were resistant to a fourth-generation cephalosporin (e.g. cefepime), which serves as an indicator for the presence of ESBL producers. On the other hand, 59.1% of the isolates were resistant to cefoxitin, which is an indicator for AmpC producers.
Figure 8. h: Prevalence of ESBL/AmpC producing Escherichia coli from fattening pigs between 2014 and 2023 (N = total number of tested isolates, values for 2014, 2016, 2018, 2020 and 2022 interpolated [n/a].
% ESBL/AmpC-producing E. coli in fattening pigs
E. coli
Table 8. e: Non-susceptibility combinations in ESBL/AmpC producing Escherichia coli in fattening pigs in 2023. Resistance patterns
3
3
3 rd generation cephalosporins – 4th generation cephalosporins – Penicillins – Sulfonamides
3 rd generation cephalosporins – Cephamycin – Diaminopyrimidine derivatives – Penicillins –Sulfonamides – Tetracyclines
3 rd generation cephalosporins – 4th generation cephalosporins – Aminoglycosides –Fluoroquinolones – Penicillins – Tetracyclines
3 rd generation cephalosporins – 4th generation cephalosporins – Amphenicols – Penicillins –Sulfonamides – Tetracyclines
3 rd generation cephalosporins – 4th generation cephalosporins – Diaminopyrimidine derivatives –Penicillins – Sulfonamides – Tetracyclines
of resistances: 7
3 rd generation cephalosporins – 4th generation cephalosporins – Cephamycin –Diaminopyrimidine derivatives – Penicillins – Sulfonamides – Tetracyclines
3 rd generation cephalosporins – Cephamycin – Diaminopyrimidine derivatives – Fluoroquinolones –Penicillins – Sulfonamides – Tetracyclines
3 rd generation cephalosporins – 4th generation cephalosporins – Amphenicols –Diaminopyrimidine derivatives – Penicillins – Sulfonamides – Tetracyclines
3 rd generation cephalosporins – 4th generation cephalosporins – Diaminopyrimidine derivatives –
3 rd generation cephalosporins – 4th generation cephalosporins – Diaminopyrimidine derivatives –Fluoroquinolones – Penicillins – Sulfonamides – Tetracyclines
resistances: 9
3 rd generation cephalosporins – 4th generation cephalosporins – Aminoglycosides – Amphenicols –Diaminopyrimidine
of resistances: 10
3 rd generation cephalosporins – 4th generation cephalosporins – Amphenicols – Cephamycin –Diaminopyrimidine derivatives – Fluoroquinolones – Macrolides – Penicillins – Sulfonamides –Tetracyclines
Penicillins: Ampicillin; 3rd gen. Cephalosporins: Cefotaxime, Ceftazidime; 4th gen. Cephalosporins: Cefepime; Cephamycin: Cefoxitin; Sulfonamides: Sulfomethoxazole; Aminoglycosides: Gentamicin; Fluoroquinolones: Ciprofloxacin, Nalidixic acid; Tetracyclines: Tetracycline, Tigecycline; Macrolides: Azithromycin; Diaminopyrimidine derivatives: Trimethoprim; polymyxins: colistin; Amphenicols: Chloramphenicol
8.2.2 ESBL/AmpC-producing Escherichia coli in fattening pigs
In 2023, a random sample of 308 fattening pigs was investigated at slaughter for the occurrence of ESBL/AmpC-producing E. coli using cecal samples. By applying the European harmonised method, 19 isolates of presumptive ESBL/ AmpC-producing E. coli were isolated. This corresponds to a herd prevalence of 6.2% (Figure 8. h). Compared to 2021, the prevalence of ESBL/AmpC-producing E. coli is stable at a low level in the Swiss fattening pig population.
Details on multidrug resistance patterns are shown in Table 8. e.: Five isolates (26.3%) showed resistance to seven antibiotic classes. One isolate each showed resistance to nine or ten antibiotic classes, respectively. Besides resistance to third- and fourth-generation cephalosporins, ESBL/ AmpC-producing E. coli very often showed additional resistances to other antibiotic classes. Most often, resistance to sulfonamides, tetracyclines and diaminopyrimidine derivatives were seen. Less frequently, resistances to fluoroquinolones and phenicols were detected. Resistance to aminoglycosides was rarely exhibited. One isolate showed resistance to azithromycin (macrolides).
Figure 8. i: Prevalence of ESBL/AmpC producing Escherichia coli from slaughter calves between 2014 and 2023 (N = total number of tested isolates, values for 2014, 2016, 2018, 2020 and 2022 interpolated [n/a].
% ESBL/AmpC E. coli in slaughter calves
Year
ESBL/AmpC E. coli
No resistance against amikacin (aminoglycosides), colistin (polymyxins), temocillin (penicillins), tigecycline (glycylcyclines) and carbapenems (meropenem, imipenem, ertapenem) was observed.
Fourteen isolates (73.7%) were resistant to a fourth-generation cephalosporin (e.g., cefepime), which serves as an indicator for the presence of ESBL producers. On the other hand, seven isolates (36.8%) were resistant to cefoxitin, which is an indicator for AmpC producers.
8.2.3 ESBL/AmpC-producing Escherichia coli in slaughter calves
In 2023, a random sample of 306 slaughter calves was investigated for the occurrence of ESBL/AmpC-producing E. coli using cecal samples. By applying the European harmonised method, 100 isolates of presumptive ESBL/AmpC-producing E. coli were collected. This corresponds to a herd prevalence of 32.7% (Figure 8. i). Compared to 2021, the prevalence of ESBL/AmpC-producing E. coli again increased to the level found in 2019 (32.9%).
Details on multidrug resistance patterns are shown in Table 8. f.: Twenty-four isolates (24.0%) showed resistance to six antibiotic classes and 17 isolates (17.0%) to eight antibiotic classes (Table 8. f). Nine isolates showed resistance to nine antibiotic classes (9.0%), and 10 isolates (10.0%)
to ten antibiotic classes. Besides resistance to third- and fourth-generation cephalosporins, ESBL/AmpC-producing E. coli very often showed additional resistances to other antibiotic classes. Most often resistance to sulfonamides, tetracyclines, fluoroquinolones, phenicols and trimethoprim diaminopyrimidine derivatives. Less frequently, resistance to aminoglycosides was detected. Resistance to macrolides were rarely seen. One isolate was resistant to temocillin (penicillins).
No resistance against amikacin (aminoglycosides), colistin (polymyxins), tigecycline (glycylcyclines) and carbapenems (meropenem, imipenem, ertapenem) was observed.
Sixteen isolates (60.0%) were resistant to a fourth-generation cephalosporin (e.g. cefepime), which serves as an indicator for the presence of ESBL producers. On the other hand, 48 isolates (48.0%) were resistant to cefoxitin, which is an indicator for AmpC producers.
Table 8. f: Non-susceptibility combinations in ESBL/AmpC producing Escherichia coli in slaughter calves in 2023.
3 rd generation cephalosporins – Cephamycin – Penicillins
3
rd generation cephalosporins – 4th generation cephalosporins – Fluoroquinolones – Penicillins
3 rd generation cephalosporins – 3 rd generation cephalosporins – 4th generation cephalosporins –Penicillins – Tetracyclines
3 rd generation cephalosporins – 4th generation cephalosporins – Fluoroquinolones – Penicillins
3 rd generation cephalosporins – Amphenicols – Cephamycin – Penicillins – Sulfonamides
3 rd generation cephalosporins – Amphenicols – Penicillins – Sulfonamides – Tetracyclines
3 rd generation cephalosporins – Cephamycin – Diaminopyrimidine derivatives – Penicillins –Sulfonamides
3 rd generation cephalosporins – Cephamycin – Penicillins – Penicillins – Sulfonamides –
3 rd generation cephalosporins – Cephamycin – Penicillins – Sulfonamides – Tetracyclines
3 rd generation cephalosporins – Diaminopyrimidine derivatives – Penicillins – Sulfonamides –Tetracyclines
3 rd generation cephalosporins – 4th generation cephalosporins – Aminoglycosides – Penicillins –Sulfonamides
3 rd generation cephalosporins – 3 rd generation cephalosporins – 4th generation cephalosporins –Fluoroquinolones – Penicillins – Tetracyclines
3 rd generation cephalosporins – 4th generation cephalosporins – Penicillins – Sulfonamides –Tetracyclines
Number of resistances: 6
3 rd generation cephalosporins – 4th generation cephalosporins – Cephamycin –Diaminopyrimidine derivatives – Penicillins – Tetracyclines
3 rd generation cephalosporins – Amphenicols – Cephamycin – Fluoroquinolones – Penicillins –Tetracyclines
3 rd generation cephalosporins – Amphenicols – Cephamycin – Penicillins – Sulfonamides –Tetracyclines
3 rd generation cephalosporins – Cephamycin – Fluoroquinolones – Fluoroquinolones – Penicillins –Sulfonamides – Tetracyclines
3 rd generation cephalosporins – Aminoglycosides – Amphenicols – Diaminopyrimidine derivatives –
3 rd generation cephalosporins – 4th generation cephalosporins – Aminoglycosides –Diaminopyrimidine derivatives – Fluoroquinolones – Penicillins
3 rd generation cephalosporins – 4th generation cephalosporins – Aminoglycosides – Penicillins –Sulfonamides – Tetracyclines
3 rd generation cephalosporins – 4th generation cephalosporins – Amphenicols – Penicillins –
3 rd generation cephalosporins – 4th generation cephalosporins – Fluoroquinolones – Penicillins –Sulfonamides – Tetracyclines
3 rd generation cephalosporins – 4th generation cephalosporins – Fluoroquinolones – Penicillins –Sulfonamides – Tetracyclines
Number of resistances: 7
3 rd generation cephalosporins – 4th generation cephalosporins – Aminoglycosides – Cephamycin –Penicillins – Sulfonamides – Tetracyclines
3 rd generation cephalosporins – 4th generation cephalosporins – Aminoglycosides – Amphenicols –
3 rd generation cephalosporins – 4th generation cephalosporins – Aminoglycosides –Diaminopyrimidine derivatives – Fluoroquinolones – Penicillins – Sulfonamides
3 rd generation cephalosporins – 4th generation cephalosporins – Aminoglycosides –
3 rd generation cephalosporins – 4th generation cephalosporins – Amphenicols –Diaminopyrimidine derivatives – Penicillins – Sulfonamides – Tetracyclines
Amphenicols
3 rd generation cephalosporins – 4th generation cephalosporins – Amphenicols – Fluoroquinolones –
3 rd generation cephalosporins – 4th generation cephalosporins – Diaminopyrimidine derivatives –
3 rd generation cephalosporins – 4th generation cephalosporins – Aminoglycosides – Amphenicols –
3 rd generation cephalosporins – Aminoglycosides – Amphenicols – Cephamycin –
3 rd generation cephalosporins – Amphenicols – Cephamycin – Diaminopyrimidine derivatives –Fluoroquinolones – Penicillins – Sulfonamides –
3 rd generation cephalosporins – 4th generation cephalosporins – Aminoglycosides – Amphenicols –Diaminopyrimidine
3 rd generation cephalosporins – 3 rd generation cephalosporins – 4th generation cephalosporins – Amphenicols – Diaminopyrimidine derivatives – Fluoroquinolones – Fluoroquinolones –Penicillins – Sulfonamides – Tetracyclines
3 rd generation cephalosporins – 4th generation cephalosporins – Amphenicols –Diaminopyrimidine
of resistances: 9
3 rd generation cephalosporins – Aminoglycosides – Amphenicols – Cephamycin –Diaminopyrimidine derivatives – Fluoroquinolones – Penicillins – Sulfonamides – Tetracyclines
3 rd generation cephalosporins – 4th generation cephalosporins – Aminoglycosides – Amphenicols –Diaminopyrimidine derivatives – Fluoroquinolones – Penicillins – Sulfonamides – Tetracyclines
3 rd generation cephalosporins – 3 rd generation cephalosporins – 4th generation cephalosporins –Aminoglycosides – Amphenicols – Diaminopyrimidine derivatives – Fluoroquinolones –Penicillins – Sulfonamides – Tetracyclines
3 rd generation cephalosporins – 4th generation cephalosporins – Amphenicols – Cephamycin –Diaminopyrimidine derivatives – Fluoroquinolones – Penicillins – Sulfonamides
3 rd generation cephalosporins – 4th generation cephalosporins – Amphenicols – Cephamycin –Diaminopyrimidine derivatives – Fluoroquinolones – Macrolides – Penicillins – Sulfonamides
3 rd generation cephalosporins – 4th generation cephalosporins – Amphenicols – Diaminopyrimidine derivatives – Fluoroquinolones – Macrolides – Penicillins – Sulfonamides – Tetracyclines
3 rd generation cephalosporins – 4th generation cephalosporins – Aminoglycosides –Amphenicols – Cephamycin – Diaminopyrimidine derivatives – Fluoroquinolones – Penicillins –Sulfonamides – Tetracyclines
3 rd generation cephalosporins – 4th generation cephalosporins – Amphenicols – Cephamycin –Diaminopyrimidine derivatives – Fluoroquinolones – Macrolides – Penicillins – Sulfonamides –Tetracyclines
Penicillins: Ampicillin; 3rd gen. Cephalosporins: Cefotaxime, Ceftazidime; 4th gen. Cephalosporins: Cefepime; Cephamycin: Cefoxitin; Sulfonamides: Sulfomethoxazole; Aminoglycosides: Gentamicin; Fluoroquinolones: Ciprofloxacin, Nalidixic acid; Tetracyclines: Tetracycline, Tigecycline; Macrolides: Azithromycin; Diaminopyrimidine derivatives: Trimethoprim; polymyxins: colistin; Amphenicols: Chloramphenicol
8.2.4
The prevalence of ESBL/AmpC-producing E. coli in Switzerland again decreased significantly for broilers (2022: 4.3%), was stable for fattening pigs (2023: 6.2%) and increased for slaughter calves (2021: 32.9%).
Broilers have turned out to be the livestock species with the highest prevalence of ESBL/AmpC-producing E. coli in Europe and Switzerland in the past [1]. Since 2016, a decreasing trend in the prevalence of ESBL/AmpC-producing E. coli in broilers can be observed and is still ongoing as the new data from 2022 have shown. These decreasing trends are statistically significant in most European countries, including Switzerland [1]. Nowadays, broilers are the livestock species with the lowest prevalence of ESBL/ AmpC-producing E. coli in Swiss livestock. In general, the use of antimicrobials is low in broiler production, which has raised the question for the reason for high detection rates of ESBL/AmpC-producing E. coli, especially in this globally organised livestock sector. Therefore, it has been discussed whether the high detection rates are due to transfer from a higher level in the broiler production pyramid, as had previously been proposed for other types of antibiotic-resistant E. coli [10]. More recently, it has been shown that ESBL/AmpC-producing E. coli are introduced into parent hatcheries via imported colonised day-old breeding stock and subsequently spread vertically and longitudinally in broiler production [11–12]. Nowadays, the strong decrease of ESBL/AmpC-producing E. coli in local broiler production all over Europe is most likely attributable to the production and selling of ESBL/AmpC-producing E. coli -free day-old breeding stock. Although knowledge regarding the exact measures taken by the international breeding companies is lacking, one can hypothesise that a prophylactic use of modern cephalosporins in breeding companies has been stopped in the last few years [11].
Following a significant decrease in the prevalence of ESBL/ AmpC-producing E. coli in fattening pigs from 2015 to 2021, no further decrease was observed in 2023, with a stable low prevalence of 6.2%. In most European countries, the prevalence of ESBL/AmpC-producing E. coli is higher, the European median prevalence being around 40% in fattening pigs, underlining the favourable situation for Switzerland. In a longitudinal Swiss study, Moor et al. (2021) showed that carriage duration is normally short within the individual pigs and that the risk of recolonisation and clonal spread of ESC-R-Ec might be reduced by applying appropriate hygiene strategies. Interestingly, pig farming practices, like all-in-all-out systems, as opposed to antimicrobial usage, were associated with reduced risk of ESBL/ AmpC-producing E. coli at farm level [13].
The trend in prevalence of ESBL/AmpC-producing E. coli for slaughter calves is different to that of broilers and fattening pigs. Nowadays, slaughter calves in Switzerland show the highest prevalence of ESBL/AmpC-producing E. coli, on a high level of 32.9%. Between 2015 and 2021, a decreas -
ing trend was observed, which seems to have stopped in 2023. In this context, it is not surprising that in the course of detecting indicator E. coli, six ESBL/AmpC-producing E. coli were detected. Although the European prevalence for calves is even higher (>40%), the situation needs to be monitored closely. It was shown that the prevalence of ESBL/AmpC-producing E. coli decreased between the beginning and the end of the fattening period [14]. This needs to be considered in the European monitoring system when interpreting the ESBL/AmpC-producing E. coli prevalence is measured at the end of the fattening period. Moreover, it was shown that 51 ESBL/AmpC-producing E. coli exhibited resistance to ciprofloxacin (fluoroquinolones), whereas only 24 isolates showed resistance to nalidixic acid (quinolones), which indicates the presence of transmissible genes for quinolone resistance [3]. Seven ESBL/AmpC-producing E. coli showed additional resistance to azithromycin (macrolides) (7%), which is otherwise rare in European livestock.
The overall decreasing trends in the prevalence of ESBL/ AmpC-producing E. coli in Swiss livestock may, among other factors, be related to the generally reduced use of antibiotics in veterinary medicine in Switzerland (for more information see Chapter 4). Based on the above-mentioned results, the potential risk for direct or indirect transfer of ESBL/AmpC-producing bacteria or genes from animals to humans seems to be very low in recent years.
Resistance genes of ESBL/AmpC-producing E. coli display a large heterogeneity [9]. Hence, knowledge of different genes and their location within the genome is needed to understand possible epidemiological links between the different sectors (food-producing animals, raw meat and humans). Therefore, in 2021 whole genome sequencing (WGS) was introduced as an alternative method to the phenotypic testing of E. coli isolates in the European monitoring (EU decision 2020/1729). The harmonised protocols developed by the European reference laboratory for antimicrobial resistance (Denmark) have been followed when using the WGS technique, to ensure data comparability between countries. In 2022, six member states and one non-member state (Czechia, Germany, Finland, Italy, the Netherlands, Sweden and Norway) reported WGS results. Countries providing WGS data reported several different genes responsible for the ESBL/AmpC resistance [1]. WGS is not yet implemented into the Swiss antimicrobial resistance monitoring system. Nevertheless, a study by Aebi et al. (2023) revealed that ESBL/AmpC-producing E. coli isolated from Swiss slaughter calves and fattening pigs were genetically highly diverse [15]. For further reading see Chapter 12 in this report.
8.3 Carbapenemase-producing Escherichia coli
Carbapenems are last-resort antibiotics used to treat complicated infections in humans. The use of carbapenems in animals has been prohibited in the EU since 2022 (European Commission, 2022). No products have been approved for animals, but off-licence use for companion animals was previously possible according to the ‘cascade’ principle [1].
In 2022, 510 pooled cecal samples from broiler flocks were analysed for the presence of carbapenemase-producing E. coli using the European harmonised method (Table 8. g). In 2023, the same method was applied to 308 cecal samples from fattening pigs at slaughter and 306 cecal samples from slaughter calves. As in the previous years, none of the samples tested positive for carbapenemase-producing E. coli or Klebsiella spp. (included in the monitoring program as of 2020).
In the European harmonised monitoring program, among the 47,874 samples included in the specific monitoring for ESBL-/AmpC -producing E. coli and the 39,993 samples included in the specific monitoring for carbapenemase-producing E. coli in 2021 and 2022, 39 carbapenemase-producing E. coli were detected. The reported numbers of carbapenemase-producing E. coli are still low. However, an increasing number of isolates has been observed compared with previous years [1]. The occurrence of carbapenemase-producing E. coli in food-producing animals underlines the critical importance of having monitoring programs specifically designed to detect these isolates, even when present in only in small numbers. Amplification of these multi-drug bacteria in high-intensity animal production systems may result in food-producing animals becoming an additional source for human acquisition of such bacteria, which is highly unwanted [16].
For more information see Chapter 13.
Table 8. g: Number of carbapenem-resistant Escherichia coli (since 2015) and Klebsiella spp. (since 2020) in cecal samples from livestock, 2015–2023.
8.4 Methicillin-resistant Staphylococcus aureus (MRSA)
Staphylococcus (S.) aureus is a commensal bacterium found on skin and soft tissues in approximately one third of healthy humans. It is also part of the normal flora in a wide variety of animals. Infections with S. aureus can occur when skin or tissues are damaged [17]. Beta-lactamase-resistant modified semi-synthetic penicillin such as methicillin was introduced in 1959 for human medicine. However, one year later, the first methicillin-resistant S. aureus (MRSA) appeared [18]. In the following decades that followed, MRSA emerged as a major cause of healthcare-associated infections, although its occurrence was restricted to hospitals and other healthcare facilities (“hospital-acquired (HA) MRSA”). In the 1990s, an increasing incidence of hospital-independent human MRSA infections was observed [19]. These so-called “community-acquired MRSA” had been reported by many countries worldwide. With the emergence of MRSA in animals, MRSA gained a One Health dimension [20]. Numerous studies have shown that pigs in particular can be heavily colonised by MRSA. These “livestock-associated MRSA” can be associated with infections not only in animals but also in humans, especially in those with regular and close contact with pigs (e.g. farmers, slaughterhouse workers or veterinarians) [21–22].
8.4.1 MRSA in fattening pigs
In 2023, a random sample of 310 fattening pigs was investigated at slaughter for the occurrence of MRSA using nasal swab samples. By applying a one-step enrichment method, 166 MRSA were isolated. This corresponds to a herd prevalence of 53.5% (Figure 8. j). Thereby, the prevalence of MRSA in Swiss fattening pigs has been stable at a very high level of approx. 50% since 2019 (Figure 8. j).
Details on multidrug resistance patterns are shown in Table 8 h. Fourty-four isolates (26.5%) showed resistance to five antibiotic classes (Table 8. h). Twenty-three isolates showed resistance to nine antibiotic classes (13.9%) and two isolates to ten antibiotic classes, respectively (Table 8. h). Besides resistance to beta-lactam antibiotics, MRSA very often displayed additional resistances to other antibiotic classes. Most often resistance to tetracyclines, lincosamides, diaminopyrimidine derivatives, fluoroquinolones, pleuromutilins and streptogramins (Table 8. h). Less frequently, MRSA showed additional resistance to aminoglycosides, macrolides and phenicols (Table 8. h). One isolate was resistant to mupirocin.
No resistance to rifampicin, vancomycin or linezolid was detected. All MRSA belonged to the livestock-associated clonal complex 398.
Figure 8. j: Prevalence of MRSA from fattening pigs between 2014 and 2023 (N = total number of tested isolates, values for 2014, 2016, 2018, 2020 and 2022 interpolated [n/a].
% Methicillin-resistant S. aureus in fattening pigs
8.4.2 MRSA in slaughter calves
In 2023, a random sample of 307 slaughter calves was investigated for the occurrence of MRSA using nasal swab samples. By applying a one-step enrichment method, 11 MRSA were isolated. This corresponds to a herd prevalence of 3.6% (Figure 8. k). Compared to 2023, the prevalence of MRSA decreased slightly. Since 2014, the prevalence remains stable at a low level <10% (Figure 8. k).
Details on multidrug resistance patterns are shown in Table 8. i. Three isolates (27.3%) showed resistance to eight antibiotic classes (Table 8. i). Besides resistance to beta-lactam antibiotics, MRSA very often showed additional resistance to other antibiotic classes. Most often, resistance was to tetracyclines, macrolides, lincosamides and aminoglycosides (Table 8. I). Less frequently, bovine MRSA showed additional resistance to fluoroquinolones and diaminopyrimidine derivatives (Table 8. i). Rarely, resistance to streptogramins and pleuromutilins was detected (Table 8. i.).
No isolate showed resistance to rifampicin, vancomycin, linezolid or mupirocin. All MRSA except one isolate belonged to the livestock-associated clonal complex 398.
8.4.3 Discussion
In Switzerland, the prevalence of MRSA in fattening pigs at slaughter has increased continuously and significantly since the first analyses in 2009. In 2016, Bangerter et al. [23] conducted comprehensive studies of the individu -
al colonisation dynamics of MRSA throughout the Swiss pig production chain. It was shown that almost all pigs from an MRSA-positive herd changed their MRSA status several times, which implies that pigs are colonised transiently rather than permanently. Humans in close contact with livestock are at higher risk of being carriers of livestock-associated MRSA [22]. Although MRSA colonisation in healthy humans does not usually induce disease, MRSA introduced into hospitals may cause infections that are almost impossible to treat. Nowadays, the overall detection rate of MRSA diagnosed in the context of severe infections in hospitalised humans (septicemia) in Switzerland is decreasing, suggesting a minor risk of transmission of MRSA from persons at risk in hospitals.
As MRSA monitoring is not mandatory or harmonised within the European monitoring program, the availability of comparable data over time is still limited. This is due to a scarce number of countries reporting data on MRSA from different animal populations and food matrices. Switzerland is one of the few countries which continuously reports data and presents the results at EFSA and the European reference laboratory for AMR. In 2020, the EU commission decided to perform a baseline study on MRSA in 2025. The purpose of this monitoring is to estimate the MRSA prevalence in the European population of fattening pigs. The target population is represented by healthy fattening pigs sampled at slaughter. Details on the sampling design and testing requirements can be found in Decision (EU) 2023/1017. Switzerland will not participate in this baseline study, as the added value of this study is very limited due to the monitoring that has already been implemented.
Figure 8. k: Prevalence of MRSA from slaughter calves between 2014 and 2023 (N = total number of tested isolates, values for 2014, 2016, 2018, 2020 and 2022 interpolated [n/a].
% Methicillin-resistant S. aureus in slaughter calves Year
Table 8. h: Non-susceptibility combinations in MRSA in fattening pigs in 2023.
– Penicillins – Tetracyclines
Aminoglycosides – Cephamycin – Penicillins – Tetracyclines
– Cephamycin – Penicillins – Tetracyclines
– Diaminopyrimidine derivatives – Penicillins – Tetracyclines
– Fluoroquinolones – Penicillins – Tetracyclines
– Penicillins – Streptogramin – Tetracyclines
– Amphenicols – Cephamycin – Penicillins – Tetracyclines
– Cephamycin
Diaminopyrimidine derivatives – Fluoroquinolones – Penicillins – Tetracyclines
– Fluoroquinolones – Penicillins – Streptogramin – Tetracyclines
– Cephamycin – Penicillins – Pleuromutilins – Streptogramin – Tetracyclines
– Amphenicols – Cephamycin – Fluoroquinolones – Penicillins – Tetracyclines
Amphenicols – Cephamycin – Fluoroquinolones – Mupirocin (pseudomonic acid) – Penicillins –Tetracyclines
Cephamycin – Diaminopyrimidine derivatives – Fluoroquinolones – Lincosamides – Penicillins –Tetracyclines
Cephamycin – Diaminopyrimidine derivatives – Lincosamides – Penicillins – Pleuromutilins –Streptogramin
Cephamycin – Diaminopyrimidine derivatives – Macrolides – Penicillins – Pleuromutilins –
– Cephamycin – Fluoroquinolones – Lincosamides – Macrolides – Penicillins –Tetracyclines
Cephamycin – Diaminopyrimidine derivatives – Lincosamides – Penicillins – Pleuromutilins –Streptogramin –
– Cephamycin – Diaminopyrimidine derivatives – Lincosamides – Penicillins –Pleuromutilins – Streptogramin – Tetracyclines
Cephamycin – Diaminopyrimidine derivatives – Lincosamides – Macrolides – Penicillins –Pleuromutilins – Streptogramin – Tetracyclines
Number of resistances: 9
Aminoglycosides – Amphenicols – Cephamycin – Fluoroquinolones – Lincosamides –Penicillins
Aminoglycosides – Cephamycin – Diaminopyrimidine derivatives – Fluoroquinolones –Lincosamides – Penicillins – Pleuromutilins – Streptogramin – Tetracyclines
Aminoglycosides – Cephamycin – Diaminopyrimidine derivatives – Fluoroquinolones –Lincosamides – Penicillins
Penicillins: Penicillin; Cephamycin: Cefoxitin; Sulfonamides: Sulfamethoxazole; Aminoglycosides: Gentamicin, Kanamycin, Streptomycin; Fluoroquinolones: Ciprofloxacin; Tetracyclines: Tetracycline; Macrolides: Erythromycin; Diaminopyrimidine derivatives: Trimethoprim; Pleuromutilins: Tiamulin; Amphenicols: Chloramphenicol; Lincosamides: Clindamycin; Streptogramin: Quino-/Dalfopristin; Steroid antibiotics: Fusidic acid
Table 8. i: Non-susceptibility combinations in MRSA in slaughter calves in 2023.
Penicillins: Penicillin; Cephamycin: Cefoxitin; Sulfonamides: Sulfamethoxazole; Aminoglycosides: Gentamicin, Kanamycin, Streptomycin; Fluoroquinolones: Ciprofloxacin; Tetracyclines: Tetracycline; Macrolides: Erythromycin; Diaminopyrimidine derivatives: Trimethoprim; Pleuromutilins: Tiamulin; Amphenicols: Chloramphenicol; Lincosamides: Clindamycin; Streptogramin: Quino-/Dalfopristin; Steroid antibiotics: Fusidic acid
[1] EFSA (European Food Safety Authority) & ECDC (European Centre for Disease Prevention and Control). (2024). The European Union summary report on antimicrobial resistance in zoonotic and indicator bacteria from humans, animals and food in 2021–2022. EFSA Journal, 22, e8583 //doi.org/10.2903/j.efsa.2024.8583
[2] Dame-Korevaar A, Fischer EAJ, van der Goot J, Stegeman A, Mevius D. Transmission routes of ESBL/pAmpC-producing bacteria in the broiler production pyramid, a literature review. Prev Vet Med. 2019;162:136-150. doi:10.1016/j.prevetmed.2018.12.002.
[3] Jacoby G.A., Strahilevitz J., Hooper D.C. 2014. Plasmid-Mediated Quinolone Resistance. Microbiol Spectr 2:10.1128/microbiolspec.plas-0006-2013. https://doi.org/10.1128/microbiolspec.plas-0006-2013
[4] EMA (European Medicines Agency). (2023). Surveillance of Veterinary Antimicrobial Consumption, 2022. Sales of veterinary antimicrobial agents in 31 European countries in 2022. EMA/299538/2023. 13th ESVAC Report. European Medicines Agency. https:// www.ema.europa.eu/en/documents/report/sales-veterinary-antimicrobial-agents-31-european-countries-2022-trends-2010-2022-thirteenth-esvac_en.pdf
[5] Kronenberg A, Hilty M, Endimiani A, Muhlemann K. Temporal trends of extended-spectrum cephalosporin-resistant Escherichia coli and Klebsiella pneumoniae isolates in in- and outpatients in Switzerland, 2004 to 2011. Euro Surveill. 2013 May 23;18(21):20484. PMID: 23725981.
[6] Van Boeckel TP, Gandra S, Ashok A, Caudron Q, Grenfell BT, Levin SA, Laxminarayan R. Global antibiotic consumption 2000 to 2010: an analysis of national pharmaceutical sales data. Lancet Infect Dis. 2014 Aug;14(8):742-750. doi: 10.1016/S14733099(14)70780-7. Epub 2014 Jul 9. Erratum in: Lancet Infect Dis. 2017 Sep;17(9):897. PMID: 25022435.
[7] Kuenzli E, Jaeger VK, Frei R, Neumayr A, DeCrom S, Haller S, Blum J, Widmer AF, Furrer H, Battegay M, Endimiani A, Hatz C. High colonisation rates of extended-spectrum β -lactamase (ESBL)-producing Escherichia coli in Swiss travellers to South Asia – a prospective observational multicentre cohort study looking at epidemiology, microbiology and risk factors. BMC Infect Dis. 2014 Oct 1;14:528. doi: 10.1186/1471-2334-14-528. PMID: 25270732; PMCID: PMC4262238.
[8] Arcilla MS, van Hattem JM, Haverkate MR, Bootsma MCJ, van Genderen PJJ, Goorhuis A, Grobusch MP, Lashof AMO, Molhoek N, Schultsz C, Stobberingh EE, Verbrugh HA, de Jong MD, Melles DC, Penders J. Import and spread of extended-spectrum-lactamase-producing Enterobacteriaceae by international travellers (COMBAT study): a prospective, multicentre cohort study. Lancet Infect Dis. 2017 Jan;17(1):78-85. doi: 10.1016/S1473-3099(16)30319-X. Epub 2016 Oct 14. PMID: 27751772.
[9] Bush K, Bradford PA. Epidemiology of beta-lactamase-producing pathogens. Clinical Microbiology Reviews Feb 2020, 33 (2) e00047-19.
[10] Bortolaia V, Bisgaard M, Bojesen AM. Distribution and possible transmission of ampicillin- and nalidixic acid-resistant Escherichia coli within the broiler industry. Vet Microbiol. 2010 May 19;142(3-4):379-86. doi: 10.1016/j.vetmic.2009.10.024. Epub 2009 Nov 6. PMID: 19945232.
[11] Nilsson O, Börjesson S, Landén A, Greko C, Bengtsson B. Decreased detection of ESBL- or pAmpC-producing Escherichia coli in broiler breeders imported into Sweden. Acta Vet Scand. 2020 Jun 22;62(1):33. doi: 10.1186/s13028-020-00532-4. PMID: 32571370; PMCID: PMC7310155.
[12] Apostolakos I, Mughini-Gras L, Fasolato L, Piccirillo A. Assessing the occurrence and transfer dynamics of ESBL/pAmpC-producing Escherichia coli across the broiler production pyramid. PLoS One. 2019 May 17;14(5):e0217174. doi: 10.1371/journal.pone.0217174. PMID: 31100096; PMCID: PMC6524947.
[13] Moor J, Aebi S, Rickli S, Mostacci N, Overesch G, Oppliger A, Hilty M. Dynamics of extended-spectrum cephalosporin-resistant Escherichia coli in pig farms: A longitudinal study. Int J Antimicrob Agents. 2021 Sep;58(3):106382. doi: 10.1016/j. ijantimicag.2021.106382. Epub 2021 Jun 21. PMID: 34157404.
[14] Gay E, Bour M, Cazeau G, et al. Antimicrobial usages and antimicrobial resistance in commensal Escherichia coli from veal calves in France: evolution during the fattening process. Front Microbiol. 2019;10:792. Published 2019 Apr 12. doi:10.3389/fmicb.2019.00792.
[15] Aebi CB, Fernandez JE, Kittl S, Tresch ML, Perreten V, Overesch G. Characterisation of third-generation cephalosporin-resistant Escherichia coli from slaughter calves and fattening pigs: A pilot study for monitoring antimicrobial resistance by whole genome sequencing in Switzerland. Schweiz Arch Tierheilkd. 2023 Jun;165(6):372-384. English. doi: 10.17236/ sat00396. PMID: 37255244.
[16] Carfora, V., Diaconu, E. L., Ianzano, A., Di Matteo, P., Amoruso, R., Dell'Aira, E., Sorbara, L., Bottoni, F., Guarneri, F., Campana, L., Franco, A., Alba, P., & Battisti, A. (2022). The hazard of carbapenemase (OXA-181)-producing Escherichia coli spreading in pig and veal calf holdings in Italy in the genomics era: Risk of spill over and spill back between humans and animals. Frontiers in Microbiology, 13, 1016895. https://doi.org/10.3389/fmicb.2022.1016895
[17] Marques SA, Abbade LPF. Severe bacterial skin infections. An Bras Dermatol. 2020;95(4):407–417. doi:10.1016/j.abd.2020.04.003.
[18] Jevons et al. 1963 Methicillin resistance in staphylococci. Lancet. 1, 904–907.
[19] Köck et al. 2010. Methicillin-resistant Staphylococcus aureus (MRSA): burden of disease and control challenges in Europe. Euro Surveill. 15, 19688.
[20] Wulf et al. 2008. MRSA in livestock animals – an epidemic waiting to happen? Clin. Microbiol. Infect. 14, 519–521 Infect. Dis. 13, 255–258.
[21] Lassok et al. From pig to pork: methicillin-resistant Staphylococcus aureus in the pork production chain. J Food Prot. 2013 Jun;76(6):1095–108.
[22] Kittl S, Brodard I, Heim D, Andina-Pfister P, Overesch G. Methicillin-resistant Staphylococcus aureus strains in Swiss pigs and their relation to isolates from farmers and veterinarians. Appl Environ Microbiol. 2020;86(5):e01865-19.
[23] Bangerter PD, Sidler, X, Perreten, V, Overesch, G., 2016: Longitudinal study on the colonisation and transmission of methicillin-resistant Staphylococcus aureus in fattening pig farms. Veterinary Microbiology 183(2016): 125–134.
Colistin-resistant Escherichia coli in Swiss livestock
C. Fleury 1, V. Perreten 2 and G. Overesch 1
1 Center for Zoonoses, Animal Bacterial Diseases and Antimicrobial Resistance
2 Division of Molecular Bacterial Epidemiology and Infectious Diseases, Institute of Veterinary Bacteriology, University of Bern, Switzerland
The number of cases of infections with multidrug-resistant enterobacteria in humans has been increasing in Switzerland and worldwide [1, 2]. The increase of infections with pathogens that are resistant to critically important and last-resort antibiotics, such as carbapenems, makes the need for additional treatment options even more urgent. The antibiotic colistin (polymyxin E), which has mainly been used locally or as an aerosol for inhalation in patients with cystic fibrosis or Pseudomonas colonisation for a long time, has become one of the last-resort options in human medicine [3]. Colistin has long been approved in veterinary medicine and was extensively used in Europe, in particular for infections of the gastrointestinal tract in livestock. The publication of a novel plasmid-mediated colistin resistance gene (mcr -1) in early 2016 marked a turning point for veterinary medicine [5]. The discovery of mcr -mediated colistin resistance (as of 2024, the gene variants mcr -1 to mcr -10 have been described) in humans and animals made it clear that colistin resistance genes can be transferred from one bacterial species to another, representing a risk if transferred to human pathogens. In the wake of the renewed use of colistin in human medicine, the worsening antibiotic resistance situation worldwide and findings on colistin resistance transmission, the World Health Organisation (WHO) listed this antibiotic as a critically important antimicrobial, a category that also includes carbapenems [4]. In 2019, the European medical agency (EMA) placed colistin in Category B, i.e. antibiotics to be used only for clinical infections in the absence of an alternative, clinically effective antibiotic in a lower category [6]. As a consequence, sales of colistin for use in animals has decreased by over 40% between 2017 and 2022 in Europe [7]. Nevertheless, in Switzerland, colistin is still in use for several indications and animal species [8].
Therefore, a study determining the prevalence of colistin-resistant Escherichia (E.) coli in cecal samples collected in 2019 and 2020 from Swiss broilers (n=612), fattening pigs (n=306), and cattle <1 year (n=298) at slaughter was conducted within the framework of the Swiss national antimicrobial resistance monitoring program. Cultural isolation was performed using a two-step method including a selective enrichment and consecutive plating on a selective agar plate. Using this method, colistin-resistant E. coli could be
detected, regardless of their molecular mechanisms (chromosomal or plasmid). Suspicious colonies were sub-cultured on sheep blood agar and colistin resistance was confirmed phenotypically by broth microdilution according to EUCAST guidelines [9]. Colistin-resistant E. coli were then sequenced by Illumina technology for detection of mcr genes.
Five samples from broilers were positive for colistin-resistant E. coli, resulting in a herd prevalence of 0.8% (95% CI 0.3–1.9%). For cattle younger than 1 year, eight samples turned out to be positive, representing a prevalence of 2.7% (95% CI 1.2–5.2%). Ten samples from fattening pigs were positive, representing the highest prevalence of 3.3% (95% CI 1.6–5.9%). Out of 23 colistin-resistant E. coli, mcr-genes were detected in only in one strain from broilers, one strain from cattle, and in two strains from fattening pigs.
Our results are in line with findings of the European harmonised monitoring program on antimicrobial resistance. Resistance to colistin was uncommon among indicator E. coli isolates recovered from food-producing animals in 2021 and 2022 [10]. However, moderate to high levels of resistance to colistin (>10 isolates) were reported in either broiler or laying hen flocks in some member states (e.g. Bulgaria, Poland, Cyprus, Czechia and the Netherlands).
The results of this study indicate that the long-term use of colistin in Swiss livestock has not yet led to an increased prevalence of colistin-resistant E. coli. Therefore, Swiss livestock have so far been negligible as a reservoir for plasmid-mediated colistin resistance.
References
[1] European Centre for Disease Prevention and Control (ECDC). Surveillance Atlas of Infectious Diseases. http://atlas.ecdc.europa.eu/public/index.aspx
[2] Murray CJL, Ikuta KS, Sharara F, Swetschinski L, Robles Aguilar G, Gray A, Han C, Bisignano C, Rao P, Wool E, Johnson SC, Browne AJ, Chipeta MG, Fell F, Hackett S, Haines-Woodhouse G, Kashef Hamadani BH, Kumaran EAP, McManigal B, Agarwal R, Akech S, Albertson S, Amuasi J, Andrews J, Aravkin A, Ashley E, Bailey F, Baker S, Basnyat B, Bekker A, Bender R, Bethou A, Bielicki J, Boonkasidecha S, Bukosia J, Carvalheiro C, Castañeda-Orjuela C, Chansamouth V, Chaurasia S, Chiurchiù S, Chowdhury F, Cook AJ, Cooper B, Cressey TR, Criollo-Mora E, Cunningham M, Darboe S, Day NPJ, Luca M de, Dokova K, Dramowski A, Dunachie SJ, Eckmanns T, Eibach D, Emami A, Feasey N, Fisher-Pearson N, Forrest K, Garrett D, Gastmeier P, Giref AZ, Greer RC, Gupta V, Haller S, Haselbeck A, Hay SI, Holm M, Hopkins S, Iregbu KC, Jacobs J, Jarovsky D, Javanmardi F, Khorana M, Kissoon N, Kobeissi E, Kostyanev T, Krapp F, Krumkamp R, Kumar A, Kyu HH, Lim C, Limmathurotsakul D, Loftus MJ, Lunn M, Ma J, Mturi N, Munera-Huertas T, Musicha P, MussiPinhata MM, Nakamura T, Nanavati R, Nangia S, Newton P, Ngoun C, Novotney A, Nwakanma D, Obiero CW, Olivas-Martinez A, Olliaro P, Ooko E, Ortiz-Brizuela E, Peleg AY, Perrone C, Plakkal N, Ponce-de-Leon A, Raad M, Ramdin T, Riddell A, Roberts T, Robotham JV, Roca A, Rudd KE, Russell N, Schnall J, Scott JAG, Shivamallappa M, SifuentesOsornio J, Steenkeste N, Stewardson AJ, Stoeva T, Tasak N, Thaiprakong A, Thwaites G, Turner C, Turner P, van Doorn HR, Velaphi S, Vongpradith A, Vu H, Walsh T, Waner S, Wangrangsimakul T, Wozniak T, Zheng P, Sartorius B, Lopez AD, Stergachis A, Moore C, Dolecek C, Naghavi M. Global burden of bacterial antimicrobial resistance in 2019: a systematic analysis. The Lancet 2022.
[3] Arbeitsgemeinschaft der Wissenschaftlichen Medizinischen Fachgesellschaften e.V. (AWMF) e.V. (Hrsg. 2017). Lungenerkrankung bei Mukoviszidose, Modul 2: Diagnostik und Therapie bei der chronischen Infektion mit Pseudomonas aeruginosa . S3-Leitlinie, 2017.
[4] Critically important antimicrobials for human medicine. 6th revision 2018 World Health Organisation, Geneva, Switzerland 2019.
[5] Liu Y-Y, Wang Y, Walsh TR, Yi L-X, Zhang R, Spencer J, Doi Y, Tian G-B, Dong B, Huang X, Yu L-F, Gu D, Ren H, Chen X, Lv L, He D, Zhou H, Liang Z, Liu J-H, Shen J. Emergence of plasmid-mediated colistin resistance mechanism MCR-1 in animals and human beings in China: a microbiological and molecular biological study. The Lancet Infectious Diseases 2016; 16: 161–168
[6] Rhouma M, Madec JY, Laxminarayan R. Colistin: from the shadows to a One Health approach for addressing antimicrobial resistance. Int J Antimicrob Agents. 2023 Feb;61(2):106713. doi: 10.1016/j. ijantimicag.2023.106713. Epub 2023 Jan 11. PMID: 36640846.
[7] EMA (European Medicines Agency). (2023). Surveillance of Veterinary Antimicrobial Consumption, 2022. Sales of veterinary antimicrobial agents in 31 European countries in 2022. EMA/299538/2023. 13th ESVAC Report. European Medicines Agency. https:// www.ema.europa.eu/en/documents/report/ sales-veterinary-antimicrobial-agents-31-european-countries-2022-trends-2010-2022-thirteenth-esvac_en.pdf
[8] https://www.vetpharm.uzh.ch/
[9] https://www.eucast.org/
[10] EFSA (European Food Safety Authority) & ECDC (European Centre for Disease Prevention and Control). (2024). The European Union summary report on antimicrobial resistance in zoonotic and indicator bacteria from humans, animals and food in 2021–2022. EFSA Journal, 22, e8583 //doi.org/10.2903/j.efsa.2024.8583
Resistance in indicator bacteria from meat
9 Resistance in indicator bacteria from meat
Antimicrobial resistance in indicator bacteria isolated from the intestinal tract of healthy livestock is monitored in order to provide information about the prevalence and types of resistance present. During the slaughter process, carcasses may be contaminated with these bacteria, which may then reach the consumers by way of fresh meat and products thereof. Hence, monitoring of multidrug-resistant bacteria in fresh meat of broilers, cattle and pigs helps to assess the risk of transmission to humans via handling and consumption of fresh meat. This transmission route is also relevant for zoonotic bacteria such as Campylobacter spp.
9.1 ESBL/AmpC-producing Escherichia coli
9.1.1 ESBL/AmpC-producing Escherichia coli in chicken meat taken at retail
In 2022, 307 samples of chicken meat (212 samples of Swiss origin and 95 of foreign origin) were investigated for the presence of ESBL/AmpC-producing E. coli. By applying a selective enrichment method, nine samples of Swiss origin were positive, which corresponds to a prevalence of 4.2% (Figure 9. a). Regarding foreign meat, 45 out of 95 samples were positive (47.4%) (Table 9. a).
Details on multidrug resistance patterns are shown in Table 9. b. Fifteen isolates (27.8%) showed resistance to six antibiotic classes (Table 9. b). One isolate showed resistance to nine antibiotic classes (Table 9. b). Besides resistance
This chapter includes antimicrobial resistance rates of ESBL/AmpC-producing E. coli and carbapenemase-producing E. coli and Klebsiella spp. in chicken and turkey meat taken at retail in 2022, and in pork and beef meat taken at retail in 2023. Moreover, according to the new EU decision 2020/1729, beef meat imported from third countries taken at border control posts in 2023 was analysed and the results presented for the first time in this report. Samples were gathered at the two Swiss border control posts in Zurich and Geneva, based on their individual import volume in 2021.
to third- and fourth-generation cephalosporins, ESBL/AmpC-producing E. coli very often showed additional resistance to other antibiotic classes. Most often, resistance to fluoroquinolones, sulfonamides and tetracyclines were detected (Table 9. b). Additional resistance to diaminopyrimidine derivatives was exhibited by several isolates, whereas resistances to aminoglycosides and phenicols were rarely seen (Table 9. b). One isolate was resistant to azithromycin (macrolides). Microbiological resistance to colistin (polymyxins), tigecycline (glycylcyclines), meropenem and imipenem (carbapenems) was not detected.
The prevalence of ESBL/AmpC-producing E. coli in chicken meat has again decreased since 2022, both in domestically produced chicken meat and meat from abroad (Figure 9. a). In 2016, 41.9% of Swiss chicken meat was found to be positive for ESBL/AmpC-producing E. coli, whereas 64.9% of chicken meat produced abroad was positive. Since 2016, the prevalence of ESBL/AmpC-producing E. coli has drastically declined in Swiss chicken meat, reaching 4.2% in
Table 9. a: Number of ESBL/AmpC producing Escherichia coli positive samples of chicken meat by origin in 2022.
Figure 9. a: Trends in prevalence of ESBL/AmpC producing Escherichia coli in chicken meat between 2014 and 2022 (N= total number of tested isolates; values for 2015, 2017, 2019 and 2021 interpolated [n/a]).
2022 (Figure 9. a). The prevalence of ESBL/AmpC-producing E. coli in foreign meat follows a similar trend, however, it remains much higher than in Swiss chicken meat, at 47.4% in 2022 (Figure 9. a).
9.1.2
ESBL/AmpC-producing Escherichia coli in turkey meat taken at retail
In 2022, samples of turkey meat were taken at retail for the first time. A total of 139 samples were taken, 38 from Swiss turkey meat and 101 samples from abroad (Table 9. c). By applying a selective enrichment method, no samples of Swiss origin were positive (0.0%), whereas from foreign meat 26 out of 101 samples were positive (25.7%) (Table 9. c).
Details on multidrug resistance patterns are shown in Table 9. d. Fourteen isolates (53.8%) showed resistance to seven antibiotic classes (Table 9. d). Two isolates showed resistance to nine antibiotic classes (Table 9. d). Besides resistance to third- and fourth-generation cephalosporins, ESBL/AmpC-producing E. coli very often showed additional resistances to other antibiotic classes. Most often, resistances to fluoroquinolones, sulfonamides and tetracyclines were detected (Table 9. d). One isolate was resistant to azithromycin (macrolides). Microbiological resistance to colistin (polymyxins), tigecycline (glycylcyclines), meropenem and imipenem (carbapenems) was not detected.
9.1.3 ESBL/AmpC-producing Escherichia coli in pork meat taken at retail
In 2023, 309 samples of Swiss pork meat were investigated at retail for the presence of ESBL/AmpC-producing E. coli. Using a selective enrichment method, three samples were found to be positive, which corresponds to a prevalence of 1.0% (Table 9. e). Thus, the prevalence of ESBL/AmpC-producing E. coli in Swiss pork remains stable at a very low level (≤1%), with sporadic detection of positive samples.
9.1.4 ESBL/AmpC-producing Escherichia coli in beef meat taken at retail
In 2023, 308 samples of beef meat (269 domestically produced and 39 from abroad) were investigated for the presence of ESBL/AmpC-producing E. coli. Using a selective enrichment method, two samples from Swiss meat were found to be positive (0.7%), whereas no samples from abroad were found to be positive (Table 9. f). As in pork meat, the prevalence of ESBL/AmpC-producing E. coli in beef meat remains stable on a very low level (< 1%), with sporadic detection of positive samples.
Table 9. b: Non-susceptibility combinations of ESBL/AmpC producing Escherichia coli in chicken meat, 2022.
3 rd generation cephalosporins-Cephamycin-Penicillins
3
3 rd generation cephalosporins-Cephamycin-Fluoroquinolones-Penicillins
3
3 rd generation cephalosporins-4th generation cephalosporins-Cephamycin-Fluoroquinolones-Penicillins
3 rd generation cephalosporins-4th generation cephalosporins-Aminoglycosides-Penicillins-Tetracyclines
3 rd generation cephalosporins-4th generation cephalosporins-Fluoroquinolones-Penicillins-Sulfonamides
3 rd generation cephalosporins-4th generation cephalosporins-Fluoroquinolones-Penicillins-Tetracyclines
3 rd generation cephalosporins-4th generation cephalosporins-Fluoroquinolones-Penicillins-Tetracyclines
3 rd generation cephalosporins-4th generation cephalosporins-Penicillins-Sulfonamides-Tetracyclines
3 rd generation cephalosporins-4th generation cephalosporins-AminoglycosidesAmphenicols-Fluoroquinolones-Penicillins
3 rd generation cephalosporins-4th generation cephalosporins-Diaminopyrimidine derivatives-Fluoroquinolones-Penicillins-Sulfonamides
3 rd generation cephalosporins-4th generation cephalosporins-Diaminopyrimidine derivativesPenicillins-Sulfonamides-Tetracyclines
3 rd generation cephalosporins-4th generation cephalosporins-Fluoroquinolones-PenicillinsSulfonamides-Tetracyclines
3 rd generation cephalosporins-Cephamycin-Diaminopyrimidine derivatives-Fluoroquinolones-Macrolides-Penicillins-Sulfonamides
3 rd generation cephalosporins-4th generation cephalosporins-Amphenicols-Diaminopyrimidine derivatives-Penicillins-Sulfonamides-Tetracyclines
3 rd generation cephalosporins-4th generation cephalosporins-Diaminopyrimidine derivativesFluoroquinolones-Penicillins-Sulfonamides-Tetracyclines
3 rd generation cephalosporins-4th generation cephalosporins-Diaminopyrimidine derivativesFluoroquinolones-Penicillins-Sulfonamides-Tetracyclines
3 rd generation cephalosporins-4th generation cephalosporins-Diaminopyrimidine derivativesFluoroquinolones-Penicillins-Sulfonamides-Tetracyclines
Number of resistances: 9
3 rd generation cephalosporins-4th generation cephalosporins-Amphenicols-CephamycinDiaminopyrimidine derivatives-Fluoroquinolones-Penicillins-Sulfonamides-Tetracyclines
Penicillins: Penicillin; Cephamycin: Cefoxitin; Sulfonamides: Sulfamethoxazole; Aminoglycosides: Gentamicin, Kanamycin, Streptomycin; Fluoroquinolones: Ciprofloxacin; Tetracyclines: Tetracycline; Macrolides: Erythromycin; Diaminopyrimidine derivatives: Trimethoprim; Pleuromutilins: Tiamulin; Amphenicols: Chloramphenicol; Lincosamides: Clindamycin; Streptogramin: Quino-/Dalfopristin; Steroid antibiotics: Fusidic acid
Table 9. c:
9.1.5 Indicator Escherichia coli and ESBL/AmpC-producing Escherichia coli in beef meat taken at border control posts
In 2023, fresh, chilled beef meat imported from third countries taken at border control posts was analysed for the first time. A total of 24 indicator E. coli were isolated from 58 meat samples. The vast majority of the isolates showed no resistance to the antimicrobials tested (n=19; 79.2%) (Table 9. g). Using a selective enrichment method, no ESBL/AmpC-producing E. coli was found (0.0%) (Table 9. h).
9.2 Carbapenemaseproducing Escherichia coli and Klebsiella spp. in meat
In 2022, 307 chicken meat samples and 139 turkey meat samples were collected from retailers. In 2023, 309 pork meat and 308 beef meat samples from retailers as well as 58 beef meat samples from border control posts were collected and analysed for the presence of carbapenemase-producing E. coli and Klebsiella spp. using a selective enrichment method. As in prior years, none of the meat samples tested positive for carbapenemase-producing E. coli and Klebsiella spp. (Tab. 9. i).
9.3 Discussion
9.3.1 ESBL/AmpC-producing Escherichia coli in meat
Compared to previous years, the prevalence of ESBL/ AmpC-producing E. coli in Swiss poultry meat in 2022 has continued to strongly decrease (2014: 65.5%; 2016: 41.9%, 2018: 21.1%, 2020: 10.2%, 2022: 4.2%). In foreign chicken meat, the decreasing trend in the prevalence of ESBL/AmpC-producing E. coli is less pronounced and is to
date still much higher than in Swiss meat (2014: 85.6%; 2016: 64.9%, 2018: 63.1%, 2020: 61.8%, 2022: 47.4%). The prevalence of ESBL/AmpC-producing E. coli in poultry meat is directly linked to its prevalence in broilers. A significant decrease in the prevalence of ESBL/AmpC-producing E. coli was also observed for Swiss broilers between 2016 and 2022, with a prevalence of 4.3% in 2022 (Chapter 8). One explanation for this decrease is probably the discontinuation of the off-label use of extended-spectrum cephalosporins in poultry [3]. Comparable decreasing trends in the same time period in other European countries suggest that measures that have been taken by the poultry industries on supranational levels were efficient [1, 2, 3].
Because of the promising trend in the detection rate of ESBL/AmpC-producing E. coli in Swiss chicken meat, the former risk ranking of ESBL/AmpC-producing E. coli regarding exposure of humans and hazard characterisation via poultry meat should be re-evaluated [4]. However, due to the still unsolved contamination problem with Campylobacter spp. (Chapter 7), the poultry industry must further optimise its hygiene processes, and for consumers, adequate kitchen hygiene and proper cooking of raw chicken meat remain essential.
The very low prevalence of ESBL/AmpC-producing E. coli in pork and beef meat (≤1%) compared to the moderate prevalence in fattening pigs (6.2%) and the high prevalence in slaughter calves (32.7%) can be attributed to the different hygiene measures during slaughter, as opposed to broiler slaughter where hygiene measures at slaughter are less effective in elimination of contaminants. The prevalence of presumptive ESBL-and/or AmpC-producing E. coli in meat at retail varied markedly between European member states. It ranged from 0% (Cyprus, Finland and Sweden) to 18.8% (Slovakia) in pig meat, and from 0% (Cyprus and Finland) to 30.7% (Hungary) for cattle meat at retail [1].
Resistance genes of ESBL/AmpC-producing E. coli display a large heterogeneity [5]. Hence, knowledge of different genes and their location within the genome is needed to understand possible epidemiological links between the different sectors (food-producing animals, raw meat and humans). Therefore, in 2021, whole genome sequencing (WGS) was introduced as an alternative method to the phenotypic testing of E. coli isolates in European monitoring (EU decision 2020/1729). The harmonised protocols devel -
Table 9. d: Non-susceptibility combinations of ESBL/AmpC producing Escherichia coli in turkey meat, 2022.
3 rd generation cephalosporins-Cephamycin-Penicillins-Sulfonamides
3 rd
cephalosporins-4th generation cephalosporins-Fluoroquinolones-PenicillinsSulfonamides
3 rd generation cephalosporins-4th generation cephalosporins-Fluoroquinolones-PenicillinsTetracyclines
3 rd generation cephalosporins-Cephamycin-Fluoroquinolones-Penicillins-SulfonamidesTetracyclines
3 rd generation cephalosporins-4th generation cephalosporins-Amphenicols-PenicillinsSulfonamides-Tetracyclines
3v generation cephalosporins-4th generation cephalosporins-Fluoroquinolones-PenicillinsSulfonamides-Tetracyclines
of resistances: 7
3 rd generation cephalosporins-Amphenicols-Cephamycin-Diaminopyrimidine derivativesPenicillins-Sulfonamides-Tetracyclines
3 rd generation cephalosporins-4th generation cephalosporins-Amphenicols-Diaminopyrimidine derivatives-Fluoroquinolones-Penicillins-Sulfonamides
3 rd generation cephalosporins-4th generation cephalosporins-Amphenicols-Diaminopyrimidine derivatives-Penicillins-Sulfonamides-Tetracyclines
3 rd generation cephalosporins-4th generation cephalosporins-Amphenicols-FluoroquinolonesPenicillins-Sulfonamides-Tetracyclines
3 rd generation cephalosporins-4th generation cephalosporins-Diaminopyrimidine derivativesFluoroquinolones-Penicillins-Sulfonamides-Tetracyclines
3 rd generation cephalosporins-4th generation cephalosporins-Diaminopyrimidine derivativesFluoroquinolones-Penicillins-Sulfonamides-Tetracyclines
3 rd generation cephalosporins-4th generation cephalosporins-Amphenicols-Diaminopyrimidine derivatives-Fluoroquinolones-Penicillins-Sulfonamides-Tetracyclines
3 rd generation cephalosporins-4th generation cephalosporins-Amphenicols-CephamycinDiaminopyrimidine derivatives-Fluoroquinolones-Penicillins-Sulfonamides-Tetracyclines
3 rd generation cephalosporins-4th generation cephalosporins-Amphenicols-Diaminopyrimidine derivatives-Fluoroquinolones-Macrolides-Penicillins-Sulfonamides-Tetracyclines
Penicillins: Penicillin; Cephamycin: Cefoxitin; Sulfonamides: Sulfamethoxazole; Aminoglycosides: Gentamicin, Kanamycin, Streptomycin; Fluoroquinolones: Ciprofloxacin; Tetracyclines: Tetracycline; Macrolides: Erythromycin; Diaminopyrimidine derivatives: Trimethoprim; Pleuromutilins: Tiamulin; Amphenicols: Chloramphenicol; Lincosamides: Clindamycin; Streptogramin: Quino-/Dalfopristin; Steroid antibiotics: Fusidic acid
oped by the European reference laboratory for antimicrobial resistance (Denmark) have been followed when using the WGS technique, to ensure data comparability between countries. In 2022, six member states and one non-member state (Czechia, Germany, Finland, Italy, the Netherlands, Sweden and Norway) reported WGS results. Countries providing WGS data reported several different genes responsible for the ESBL/AmpC-resistance [1]. A study by Dorado-Garcia et al. (2018) had already found distinguishable ESBL/AmpC-producing E. coli transmission cycles in different hosts. A close epidemiological linkage of ESBL/AmpC genes and plasmid replicon types between livestock farms and humans in general could not be shown [6].
9.3.2 Carbapenemase-producing Escherichia coli and Klebsiella spp. in meat
Carbapenems are the most recently developed beta-lactams available on the market and are reserved for treatment of serious infections with multidrug-resistant bacteria in human medicine [7, 8]. Worldwide, infections with carbapenemase-producing bacteria are the most critical complication in human medicine. Carbapenems are not licenced for treatment of food-producing animals. No carbapenem-resistant E. coli and Klebsiella spp. could be detected in fresh meat samples until 2023. These results are generally in accordance with the results of European Resistance Patterns
Table 9. e: Number of ESBL/AmpC producing Escherichia coli positive samples of Swiss pork meat taken at retail in 2015, 2017, 2019, 2021 and 2023.
Table 9. f: Number of ESBL/AmpC producing Escherichia coli positive samples of beef meat taken at retail by origin in 2023.
Table 9. g: Non-susceptibility combinations in indicator Escherichia coli from beef meat taken at border control posts in 2023.
Penicillins: Penicillin; Cephamycin: Cefoxitin; Sulfonamides: Sulfamethoxazole; Aminoglycosides: Gentamicin, Kanamycin, Streptomycin; Fluoroquinolones: Ciprofloxacin; Tetracyclines: Tetracycline; Macrolides: Erythromycin; Diaminopyrimidine derivatives: Trimethoprim; Pleuromutilins: Tiamulin; Amphenicols: Chloramphenicol; Lincosamides: Clindamycin; Streptogramin: Quino-/Dalfopristin; Steroid antibiotics: Fusidic acid
antimicrobial monitoring. In 2022 and 2023, more than 20,000 meat samples were investigated for the presence of carbapenem-resistant E. coli, and only very few samples tested positive. However, an increasing number of isolates has been observed in 2022 and 2023, as compared with previous years. Interestingly, the occurrence of carbapenemase-producing E. coli is higher in pork and beef meat products than in poultry meat products [1]. For further reading, see Chapter 12 in this report.
Table 9. h: Number of ESBL/AmpC producing Escherichia coli positive samples of beef meat taken at border control posts by origin in 2023.
Table 9. i: Number of carbapenem-resistant Escherichia coli (since 2015) and Klebsiella spp. (since 2020) in meat, 2015–2023.
References
[1] EFSA (European Food Safety Authority) & ECDC (European Centre for Disease Prevention and Control). (2024). The European Union summary report on antimicrobial resistance in zoonotic and indicator bacteria from humans, animals and food in 2021–2022. EFSA Journal, 22, e8583. ttps://doi. org/10.2903/j.efsa.2024.8583
[2] Randall LP, Horton RH, Chanter JI, Lemma F, Evans SJ. A decline in the occurrence of extended-spectrum beta-lactamase-producing Escherichia coli in retail chicken meat in the UK between 2013 and 2018 [published online ahead of print, 2020 May 4]. J Appl Microbiol. 2020;10.1111/jam.14687.
[3] Nilsson O, Börjesson S, Landén A, Greko C, Bengtsson B. Decreased detection of ESBL- or pAmpC-producing Escherichia coli in broiler breeders imported into Sweden. Acta Vet Scand. 2020 Jun 22;62(1):33. doi: 10.1186/s13028-020-00532-4. PMID: 32571370; PMCID: PMC7310155.
[4] Collineau L, Carmo LP, Endimiani A, et al. Risk ranking of antimicrobial-resistant hazards found in meat in Switzerland. Risk Anal. 2018;38(5):1070–1084.
[5] Bush K, Bradford PA. Epidemiology of beta-lactamase-producing pathogens. Clin Microbiol Rev. 2020;33(2):e00047-19. Published 2020 Feb 26. doi:10.1128/CMR.00047-19.
[6] Dorado-García A, Smid JH, van Pelt W, et al. Molecular relatedness of ESBL/AmpC-producing Escherichia coli from humans, animals, food and the environment: a pooled analysis. J Antimicrob Chemother. 2018;73(2):339-347.
[7] Elshamy AA, Aboshanab KM. A review on bacterial resistance to carbapenems: epidemiology, detection and treatment options. Future Sci OA. 2020;6(3):FSO438. Published 2020 Jan 27.
[8] Nordmann P, Poirel L. Epidemiology and diagnostics of carbapenem resistance in Gram-negative bacteria. Clin Infect Dis. 2019;69(Suppl 7):S521-S528. doi:10.1093/cid/ciz824.
Resistance in animal pathogens from animal clinical isolates
10 Resistance in animal pathogens from animal clinical isolates
Monitoring of antimicrobial resistance for relevant pathogens from diseased livestock and companion animals is important for veterinarians. It enables them to make appropriate therapeutic antimicrobial choices, which they often cannot base on an antibiogram prior to the first treatment. Moreover, these data fill another important gap regarding monitoring of antimicrobial resistance from the One Health perspective. International organisations have focused on these topics, and there are efforts and ongoing projects to establish a European harmonised monitoring system in this context as well [1, 2]. The establishment of the European Veterinarian Committee on Antimicrobial Susceptibility Testing (VetCAST) in 2015 also proves the importance of this topic. VetCAST is a subcommittee of the European committee on antimicrobial susceptibility testing (EUCAST) and deals with all aspects of antimicrobial susceptibility testing of veterinary bacterial pathogens [3].
In 2019, an annual monitoring of antimicrobial resistance in veterinary pathogens was initiated by the Federal Food Safety and Veterinary Office (FSVO) and implemented at the Swiss national reference laboratory for antimicrobial resist-
ance (ZOBA). The 2022/2023 sampling plans include pathogen/animal and indication combinations which are of relevance to veterinary medicine (Table 14. e, Table 14. f).
Minimum inhibitory concentration (MIC) data were interpreted according to the current clinical breakpoints (CBPs) issued by the Clinical and Laboratory Standards Institute (CLSI). “Intermediate” and “resistant” categories were added, up to “non-susceptibility” proportions. If no clinical breakpoints were available, current epidemiological cutoffs (ECOFFs) were used if appropriate (www.mic.eucast. org). ECOFFs distinguish between wild type and non-wild type MIC distributions of bacteria. Bacterial strains are considered “microbiologically resistant” if their MIC value is above the highest MIC value observed in the wild-type population. For clarity, the term “non-susceptibility” is also used for “microbiologically resistant”. If neither a CBP nor an ECOFF is available, MIC90 values were calculated. The MIC90 value represents the MIC value at which ≥90% of the strains within a test population are inhibited; the 90th percentile.
Figure 10. a: Trends in antimicrobial non-susceptibility in Escherichia coli from diseased hens between 2019 and 2023 (N=total number of tested isolates).
% resistant E. coli in diseased hen
Ampicillin
Enrofloxacin
Colistin
Gentamicin
TrimethoprimSulfamethoxazole
Tetracycline
Cefalothin
The results presented here are an excerpt of selected pathogens and antimicrobials. For complete datasets, see the homepage of the Swiss Centre for Antimicrobial Resistance (ANRESIS), which is a nationwide surveillance system for resistance data on both human and veterinary medicine (www.anresis.ch).
10.1 Mastitis pathogens
Together with fertility problems, mastitis is the most common disease in dairy cows. It leads to considerable economic losses, due to premature culling, milk loss and increased labour costs. It is one of the most common indications for the use of antimicrobials in dairy cattle. Therefore, monitoring of antimicrobial resistance in frequently detected mastitis pathogens is of great importance for veterinarians. Isolates independent of the clinical presentation (e.g. subclinical, acute, chronic) were included in the program.
10.1.1 Coagulase-negative staphylococci
Coagulase-negative staphylococci (CoNS) comprise a broad variety of different staphylococci species. They are among the minor mastitis pathogens and usually cause subclinical and chronic mastitis. Although the grouping of different coagulase-negative staphylococci species is clinically useful, it can lead to problems when interpreting MIC data. In recent years, many MIC distributions and new ECOFFs have become available on the EUCAST website (www.mic.eucast.org). It seems that staphylococci species might differ in their MIC distribution patterns to antimicrobials. Therefore, calculated non-susceptibility rates based on currently used CoNS CBPs might also be influenced by the spectrum of specific CoNS submitted for analysis.
As most staphylococci are penicillinase producers, non-susceptibility rates against penicillin (penicillins) are high (2022: 21.8%; 2023: 43.2%; Table 10. a). In contrast, only few isolates exhibited non-susceptibility to gentamicin (aminoglycosides), resulting in low non-susceptibility rates (2022: 3.0%; 2023: 1.2%; Table 10. a). Non-susceptibility rates to erythromycin (macrolides) were also low, but on a higher level (2022: 5.9%; 2023: 7.4%; Table 10. a). All tested CoNS were susceptible to marbofloxacin (fluoroquinolones). In 2022, two out of 101 CoNS, one S. fleuretti and one S. epidermidis , were confirmed to be methicillin resistant (2.0%). In 2023, one S. epidermidis out of 81 CoNS was confirmed to be methicillin resistant (1.2%).
10.1.2 Streptococcus dysgalactiae
Streptococcus dysgalactiae is a major mastitis pathogen, causing clinical to subclinical chronic mastitis. In 2022, Streptococcus dysgalactiae was included in the monitoring program for the first time.
Non-susceptibility to penicillin (penicillins) was rarely detected, resulting in low non-susceptibility rates in 2022 (0%) and 2023 (2.4%) (Table 10. b) For erythromycin (macrolides) also, low non-susceptibility rates were detected, but with an increasing trend from 2022 (3.7%) to 2023 (10.7%) (Table 10. b). Pirlimycin (lincosamides) non-susceptibility rates were 0% in 2022 and 4.8% in 2023 (Table 10. b). For marbofloxacin (fluoroquinolones), one isolate turned out to be non-susceptible in 2022 and in 2023 (1.2%; Table 10. b). One isolate in 2023 was non-susceptible to ceftiofur (3rd generation cephalosporins; Table 10. b).
10.1.3 Trueperella pyogenes
Trueperella pyogenes is the causative agent of the socalled “summer mastitis”. Trueperella pyogenes is often transmitted by flies into small skin wounds on the udder or via the inadequately closed teat canal. Antimicrobial treatment should only be considered in fresh cases, in which no solidification or abscessing of the quarter has taken place.
In 2022, Trueperella pyogenes was included in the monitoring program for the first time. For interpretation of MIC data, only outdated CBPs for susceptibility against penicillin (penicillins), erythromycin (macrolides) and trimethoprim-sulfamethoxazole (folate pathway inhibitor) issued by CLSI in 2017, are currently available. As ECOFFs are not yet defined, these CBPs should be used with caution.
The non-susceptibility rate against penicillin is low (3.5%), which supports the use of penicillin as first-line option (Table 10. c).
10.2 Pathogenic Escherichia coli from poultry
Escherichia (E.) coli in hens can cause localised or systemic infections. Colibacillosis is caused by the avian pathogen E. coli (APEC). It manifests in diverse ways, including acute fatal septicemia, subacute pericarditis, airsacculitis, salpingitis, peritonitis, and cellulitis. It is one of the most common economically important bacterial diseases in poultry worldwide. Results on molecular characterisation of strains regarding possible identification of avian pathogenic E. coli (APEC) were not available.
Trends in antimicrobial non-susceptibility are shown in Figure 10. a. From 2019 (50.5%) to 2023 (19.8%), a strong decrease of non-susceptibility rates to enrofloxacin (fluoroquinolones) was detected. Similarly, a decreasing trend of non-susceptibility from 2019 to 2023 for tetracycline (tetracyclines) was observed, although weaker and on a generally lower level (2019: 20.8%; 2023: 12.9%). Non-susceptibility rates to ampicillin (aminopenicillins) (2023: 19.8%) and
Table 10. a: Non-susceptibility rates of coagulase-negative staphylococci in bovine mastitis for 2022 and 2023.
Table 10. b: Non-susceptibility rates of Streptococcus dysgalactiae from bovine mastitis for 2022 and 2023.
Table 10. c: Non-susceptibility rates of Trueperella pyogenes from bovine mastitis for 2022 and 2023.
Trueperella pyogenes
trimethoprim-sulfamethoxazole (folate pathway inhibitors) (2023: 9.9%) have been stable over time at moderate levels. In contrast, an increase in non-susceptibility rates was observed for gentamicin (aminoglycosides) from 2019 (0%) to 2023 (5.9%). Resistance to colistin (polymyxins) was detected only sporadically in 2019 and 2020. The same is true for resistance to cefalothin (1st generation cephalosporins), which occurred once in 2020. No ESBL/AmpC producers were identified.
10.3 Pathogens from companion animals
In small veterinary practices, highest priority critically important antibiotic classes for human medicine such as fluoroquinolones (e.g. enrofloxacin, marbofloxacin and pradofloxacin) and 3rd and 4th generation cephalosporins (e.g. cefovecin and, limited to some countries, cefpodoxime) are frequently used [5]. Monitoring the antibiotic resistance situation in pets is therefore of particular importance, not only for the veterinarians treating them, but also from a One Health perspective.
10.3.1 Staphylococcus pseudintermedius from canine skin infections
Staphylococcus (S.) pseudintermedius is an opportunistic pathogen, normally found as a commensal on skin and mucosa of dogs. On the other hand, S. pseudintermedius is recognised as the leading cause of skin, ear, and postoperative bacterial infections in dogs [5]. S. pseudintermedius has gained more importance in veterinary as well as in human medicine in recent years, due to the emergence of methicillin-resistant S. pseudintermedius (MRSP) [6]. Colonisation and/or infection may therefore not only be a concern for veterinarians treating the infected animals, but also represent a risk for companion animal owners [7].
Trends in antimicrobial non-susceptibility are shown in Figure 10. b. At first glance, no continuous trends appear to be identifiable. This is mainly due to the low number of isolates submitted in the early years of the program (2019–2021: <50 isolates). Since 2022, the number of isolates submitted has increased, which is why the results for 2022 and 2023 in particular are commented on.
The non-susceptibility rates to ampicillin (aminopenicillins) remain very high in 2023 (57.3%; Figure 10. b.), despite a decreasing trend since 2022 (65.1%, Figure 10. b.). On the other hand, the non-susceptibility rates to ampicillin/
Figure 10. b: Trends in antimicrobial non-susceptibility in Staphylococcus pseudintermedius from diseased dogs between 2019 and 2023 (N=total number of tested isolates)
% resistant S. pseudintermedius in diseased dogs
Ampicillin
AmpicillinClavulanic acid
Enrofloxacin
Cefovecin
Gentamicin
Tetracycline
Erythromycin
clavulanic acid (penicillins with beta-lactamase inhibitors) were very low in 2023 (1.1%; Figure 10. b.) and have been decreasing since 2021 (9.3%, Figure 10. b.). It will be interesting to see whether the decline of non-susceptibility rates for both antibiotics in recent years will be a continuing trend in the future. The non-susceptibility rates to erythromycin (macrolides) (2023: 18%, Figure 10. b.) are also high to moderate, albeit at a lower level and also with a decreasing trend from 2022 to 2023 (2022: 30.2, Figure 10. b.). From 2019 (23.8%) to 2023 (23.6%), the non-susceptibility rates to tetracycline (tetracyclines) were stable over time at high levels. The non-susceptibility rates to gentamicin (aminoglycosides) and to enrofloxacin (fluoroquinolones) appear to have stabilised at low levels from 2022 to 2023 (7.9%, Figure 10. b.). The occurrence of isolates that were not susceptible to cefovecin (3rd generation cephalosporins) in previous years is worrying, but in 2023 the rate of non-susceptibility was low (2.2%, Figure 10. b.). Six isolates in 2022 and two isolates in 2023 were confirmed as methicillin-resistant S. pseudintermedius (MRSP).
10.3.2 Escherichia coli from canine and feline urogenital tract infections
Escherichia (E.) coli is an important cause of opportunistic infections in veterinary medicine. As in human medicine, especially infection of the urogenital tract with E. coli occurs frequently [9]. Antimicrobial treatment is in many cases the therapy of choice [8].
The trends in non-susceptibility to antimicrobials for E. coli in dogs are shown in Figure 10. c, and for E. coli in cats in Figure 10. d. As with S. pseudintermedius isolates, the results from 2019 and 2020 are affected by the low number of isolates submitted (<50). Since 2021, the number of isolates submitted has strongly increased, which is why the results for 2021, 2022 and 2023 in particular are commented on.
E. coli from canine urogenital tract infections (UTI) showed high non-susceptibility rates to ampicillin (aminopenicillins) (2023: 23.5%, Figure 10. c), but low non-susceptibility rates to amoxicillin/clavulanic acid (penicillins with beta-lactamase inhibitors) (2023: 8.8%, Figure 10. c). Low rates of non-susceptibility were also found for enrofloxacin (fluoroquinolones) (2023: 9.8%), with a decreasing trend since 2021 (Figure 10. c). For tetracycline (tetracyclines) and trimethoprim-sulfamethoxazole (folate pathway inhibitor), moderate to low non-susceptibility rates were detected, with a slight increase since 2021 (Figure 10. c). In 2022, six out of 120 isolates and in 2023, six out of 106 canine E. coli isolates were confirmed as ESBL/AmpC producers, resulting in non-susceptibility rates to cefovecin (3rd generation cephalosporins) of 5.0% and 5.9%, respectively (Figure 10. c). The non-susceptibility rates to chloramphenicol (phenicols) (2023: 2.0%) and gentamicin (aminoglycosides) (2023: 0%) is low (Figure 10. c). All isolates were susceptible to colistin (polymyxins) and imipenem (carbapenems).
Ampicillin
AmpicillinClavulanic acid
Enrofloxacin
Cefovecin
Gentamicin
TrimethoprimSulfamethoxazole
Tetracycline
Chloramphenicol
% resistant E. coli from canine UTI
Figure 10. c: Trends in antimicrobial non-susceptibility in Escherichia coli from canine urogenital tract infections between 2019 and 2023 (N=total number of tested isolates).
E. coli from feline urogenital tract infections (UTI) showed high non-susceptibility rates to ampicillin (aminopenicillins) (2023: 28.8%), with a strong upward trend since 2021 (8.4%; Figure 10. d). The non-susceptibility rates to amoxicillin/clavulanic acid (penicillins with beta-lactamase inhibitors) (2023: 10.6%) are lower, but also with a strong upward trend since 2021 (2.1%; Figure 10. d). Low rates of non-susceptibility to trimethoprim-sulfamethoxazole (folate pathway inhibitor) (2023: 8.7%), with an increasing trend since 2021, were observed. For enrofloxacin (fluoroquinolones), tetracycline (tetracyclines) and chloramphenicol (phenicols), stable low non-susceptibility rates were found over the years. Non-susceptibility to gentamicin (aminoglycosides) occurred rarely. In 2022, seven out of 109 isolates and in 2023, five out of 104 feline E. coli isolates were confirmed to be ESBL/AmpC producers, resulting in non-susceptibility rates to cefovecin (3rd generation cephalosporins) of 6.4% and 4.8%, respectively (Figure 10. d).
10.4 Discussion
With the inclusion of CoNS, Streptococcus dysgalactiae and Trueperella pyogenes in the monitoring program in 2022 and 2023, the spectrum of important mastitis pathogens was completed. For CoNS, penicillin plus aminoglycosides is recommended as the first-line therapy [4]. The low non-susceptibility rates to gentamicin (aminoglycosides)
detected support these recommendations. Methicillin-resistance was detected sporadically.
For Streptococcus dysgalactiae infection, penicillin (penicillins) or cephalexin (1st generation cephalosporins) are recommended as the first-line therapy. Amoxicillin (clavulanic acid) (penicillins with beta-lactamase inhibitor) should be used as a second-line antibiotic [4]. In critical cases, macrolides may be used. The overall low non-susceptibility rates support the further use of these antimicrobials, although the increasing trend of erythromycin (macrolides) should be observed critically. For Trueperella pyogenes infection, penicillin is the antibiotic of choice for treatment [4]. The adherence to the recommended antibiotic treatment is supported by the low non-susceptibility rates to penicillin (penicillins).
For pathogenic E. coli in hens, the strong decline from 2019 to 2023 in non-susceptibility rates against the critically important antibiotic enrofloxacin (fluoroquinolones) is an important finding in the One Health framework. Considering that aminopenicillins are recommended as first-line antibiotics in poultry, the consistently moderate non-susceptibility rates over the years are of importance and efforts should be made to potentially decrease these in the future. For trimethoprim-sulfamethoxazole combinations (folate pathway inhibitor), the low level of non-susceptibility rates has remained stable over time as well and should be maintained in the future. The observed decline of non-susceptibility rates to tetracycline (tetracyclines) is encouraging. Al -
Ampicillin
AmpicillinClavulanic acid
Enrofloxacin
Cefovecin
Gentamicin
TrimethoprimSulfamethoxazole
Tetracycline
Chloramphenicol
% resistant E. coli from feline UTI
Figure 10. d: Trends in antimicrobial non-susceptibility in Escherichia coli from feline urogenital tract infections between 2019 and 2023 (N=total number of tested isolates).
though the resistance rate to the critical important colistin (polymyxins) is very low (0%), this antibiotic should only be used in selected cases.
Due to the low number of S. pseudintermedius isolates submitted from 2019 to 2021, a mixed picture has emerged, with no clear emerging trends of non-susceptibility rates over the years. The non-susceptibility rate to ampicillin (aminopenicillins) is high, but against amoxicillin/clavulanic acid (penicillins with beta-lactamase inhibitors), the non-susceptibility rates are low and support the treatment recommendations [8]. In complicated cases, fluoroquinolones can be taken into consideration as second-line options, as the non-susceptibility rates are low (Enrofloxacin 2023: 7.9%).
Treatment with 3rd generation cephalosporins should be avoided, as these are reserve antibiotics. The detection of methicillin-resistant S. pseudintermedius emphasises the importance of restricting the use of this class of antibiotics. Because of the moderate non-susceptibility rates, especially against first-line antibiotics and always in previously treated cases that do not respond to therapy, treatment of S. pseudintermedius infections should be based on results of an antibiogram.
Overall, from 2021 to 2023, no significant changes in non-susceptibility patterns to antibiotics in canine E. coli from UTIs could be observed. Except ampicillin (aminopenicillins), non-susceptibility rates are around 10% or lower. The non-susceptibility rate of E. coli from UTIs in dogs for first-line antibiotics such as ampicillin is still high, at 21% in 2021, but there does not appear to be a strong increasing trend over time. Moderate to low rates of non-susceptibility to second-line antibiotics such as combinations of ampicillin/clavulanic acid (penicillins and beta-lactamase inhibitors), as well as to sulfamethoxazole/trimethoprim (folate pathway inhibitors), have been found. Therefore, these antibiotics can still be recommended. Fortunately, a decline in non-susceptibility to enrofloxacin (fluoroquinolones) between 2021 and 2023 has been observed. Until 2023, no imipenem (carbapenems) non-susceptible E. coli were detected among the submitted isolates.
Except for ampicillin (aminopenicillins) and ampicillin/clavulanic acid, the pattern of non-susceptibility to antibiotics in E. coli from UTI in cats did not change significantly between 2021 and 2023. For ampicillin (aminopenicillins), a strong increase from 8.4% in 2021 to 28.8% in 2023 was
* Number of isolates (n)
Table 10. d: Antimicrobial resistance monitoring programm in veterinary pathogens 2024–2028.
observed. In addition, for ampicillin/clavulanic acid, a strong increase in non-susceptibility was observed, but at a lower level (2021:2.1%; 2023: 10.6%). These trends have to be carefully monitored in the future, as they might influence treatment recommendations. In this context, it is important to mention that the detection rates of ESBL/AmpC producers among E. coli from UTI in cats increased from 1.1% in 2021 to 4.8% in 2023. Currently, treatment recommendations for feline E. coli from UTI with aminopenicillins and cefalexin (1st generation cephalosporins) as antibiotics of first choice are under critical observation. Second-line antibiotics such as ampicillin/clavulanic acid (penicillins and beta-lactamase inhibitors) and sulfamethoxazole/trimethoprim (folate pathway inhibitors) could be recommended. The situation with third-line antibiotics such as enrofloxacin (fluoroquinolones) is favourable.
The detection rates of ESBL/AmpC producers among E. coli from UTI in dogs (2023: 5.9%) and cats (2023: 4.8%) in the submitted isolates are low. In contrast, Zogg et al. (2018) detected a much higher prevalence of ESBL/AmpC producers (20.8%) among Enterobacterales isolated from Swiss clinical canine and feline cases [10]. This difference is most probably due to the different isolate population analysed in this study compared to the monitoring program. Zogg et al. analysed isolates recruited from admission to a university veterinary clinic. In hospitals, the selective pressure on bacteria due to increased antibiotic use is higher than in veterinary practices, from which most of the samples are recruited for the monitoring program. High resistance rates against ampicillin, but only sporadic detection of multidrug-resistant ESBL/AmpC E. coli were also described in a comparable European study of canine and feline E. coli isolated from UTI [11]. In addition, the first detections of imipenem-resistant E. coli in 2019 and 2021 indicate that these highly difficult-to-treat multi-resistant bacteria have also arrived in the small animal sector.
10.5 Outlook
In the evaluation period of the monitoring program 2019 to 2023, various pathogen/animal and indication combinations were included in order to evaluate in which cases at least 50, with an ideal target of 100 isolates, can be achieved. The number of diagnostic samples gathered for pigs, horses and small ruminants is generally low. Hence making it difficult to assemble a desirable data set size. Based on these experiences, we have adapted the monitoring program for the years 2024–2028 with the goal to include a pathogen/animal and indication combination for which a sufficient number of isolates per year can be collected suitable for analysis. (Table 10. d). This program will provide more reliable data on antimicrobial resistance, including trends over time.
Further adjustments focusing on the use of the interpretative criteria should be considered for the future (for further information see Infobox 10). For example, it is to be expected that species-specific ECOFFs rather than CoNS ECOFFs will be defined in the future. Therefore, it might be necessary to collect only the most prevalent specific coagulase-negative staphylococci species isolated from bovine mastitis (e.g. S. xylosus , S. chromogenes or Mammaliicoccus (formerly Staphylococcus ) sciuri ).
References
[1] Mader R; EU-JAMRAI, Bourély C, Amat JP, Broens EM, Busani L, Callens B, Crespo-Robledo P, Damborg P, Filippitzi ME, Fitzgerald W, Grönthal T, Haenni M, Heuvelink A, van Hout J, Kaspar H, Muñoz Madero C, Norström M, Pedersen K, Pokludova L, Dal Pozzo F, Slowey R, Urdahl AM, Vatopoulos A, Zafeiridis C, Madec JY. Defining the scope of the European Antimicrobial Resistance Surveillance network in Veterinary medicine (EARS-Vet): a bottom-up and One Health approach. J Antimicrob Chemother. 2022 Feb 23;77(3):816-826. doi: 10.1093/jac/dkab462. PMID: 35022739; PMCID: PMC8864999.
[2] Lagrange J, Amat JP, Ballesteros C, Damborg P, Grönthal T, Haenni M, Jouy E, Kaspar H, Kenny K, Klein B, Lupo A, Madec JY, Salomonsen CM, Müller E, Madero CM, Nilsson O, Norström M, Nykäsenoja S, Overesch G, Pedersen K, Pohjanvirta T, Slowey R, Justo CT, Urdahl AM, Zafeiridis C, Zini E, Cazeau G, Jarrige N, Collineau L. Pilot testing the EARS-Vet surveillance network for antibiotic resistance in bacterial pathogens from animals in the EU/EEA. Front Microbiol. 2023 May 22;14:1188423. doi: 10.3389/ fmicb.2023.1188423. PMID: 37283921; PMCID: PMC10239921.
[3] https://www.eucast.org/ast_of_veterinary_pathogens
[4] Umsichtiger Einsatz von Antibiotika bei Rindern, Schweinen, kleinen Wiederkäuern und Neuweltkameliden. Therapie-Leitfaden für Tierärztinnen und Tierärzte, Version März 2022. www.blv.admin.ch
[5] Moodley et al. 2014 Antimicrobial resistance in methicillin-susceptible and methicillin-resistant Staphylococcus pseudintermedius of canine origin: literature review from 1980 to 2013. Vet Microbiol. 2014 Jul 16;171(3–4):337–341.
[6] Phumthanakorn N, Schwendener S, Donà V, Chanchaithong P, Perreten V, Prapasarakul N. Genomic insights into methicillin-resistant Staphylococcus pseudintermedius isolates from dogs and humans of the same sequence types reveals diversity in prophages and pathogenicity islands. PLoS One. 2021 Jul 22;16(7):e0254382. doi: 10.1371/ journal.pone.0254382. PMID: 34292970; PMCID: PMC8297860.
[7] Stegmann et al. 2010 Human infection associated with methicillin-resistant Staphylococcus pseudintermedius ST71. J Antimicrob Chemother. 2010 Sep;65(9):2047–2048.
[8] Umsichtiger Einsatz von Antibiotika bei Hunden und Katzen. Therapie-Leitfaden für Tierärztinnen und Tierärzte, Version Dezember 2023. www.blv.admin.ch
[9] LeCuyver et al. 2018 Population structure and antimicrobial resistance of canine uropathogenic Escherichia coli. J Clin Microbiol. 2018 Jul 11.
[10] Zogg AL, Simmen S, Zurfluh K, Stephan R, Schmitt SN, Nüesch-Inderbinen M. High Prevalence of extended-spectrum beta-lactamase producing Enterobacteriaceae among clinical isolates from cats and dogs admitted to a veterinary hospital in Switzerland. Front Vet Sci. 2018;5:62. Published 2018 Mar 27. doi:10.3389/fvets.2018.00062.
[11] Moyaert et al. 2017 Antimicrobial susceptibility monitoring of bacterial pathogens isolated from urinary tract infections in dogs and cats across Europe: ComPath Results. Microb Drug Resist. 2017 Apr;23(3):391–403.
From clinical breakpoints to epidemiological cut-offs for the monitoring of antimicrobial resistance in veterinary pathogens
G. Overesch 1
1 Institute of Veterinary Bacteriology, University of Bern, Switzerland
For combating antimicrobial resistance (AMR) in the future, one key element will be a One Health surveillance approach, as stated in the European Union (EU) One Health Action Plan against AMR [1]. In the human sector, the European Centre for Disease Prevention and Control (ECDC) coordinates the European Antimicrobial Resistance Surveillance Network (EARS-Net), which monitors AMR in bacteria isolated from invasive infections in blood and cerebrospinal fluid in hospitalised patients [2]. In the animal and food sector, the European Food Safety Authority (EFSA) coordinates a mandatory active monitoring of AMR in Salmonella and Campylobacter, indicator Escherichia coli and extended-spectrum cephalosporin-resistant and carbapenemase-producing Escherichia coli from healthy food-producing animals (cattle, poultry, pigs) at slaughter and meat thereof, according to Directive 2003/99/EC) and Decision 2020/1729/EU. In contrast, harmonised European surveillance programs have so far lacked AMR data on pathogens from diseased animals, which is essential for antimicrobial stewardship initiatives, such as treatment guidelines to ensure optimal treatment of animal infections, and to guide policy makers in regulating the use of antibiotics in veterinary medicine. As part of the EU Joint Action on AMR and Healthcare Associated Infections (EU-JAMRAI), an initiative was launched in 2017 to build the European Antimicrobial Resistance Surveillance network in veterinary medicine (EARS-Vet) [3]. In a pilot study, nine EU/EEA countries shared available data on AMR of several veterinary pathogens for the period between 2016 and 2020. This provided a proof-of-concept of what EARS-Vet can achieve, and formed a basis to improve future data collection and analysis [4]. Laboratory techniques and standards used by EARS-Vet partners were highly diverse, with a mix of microdilution and disk diffusion techniques, as well as the use of interpretative criteria according to the European committee on antimicrobial susceptibilty testing (EUCAST) or to the clinical and laboratory standard institute (CLSI) or to national guidelines.
In general, epidemiological cut-off (ECOFF) values or clincial breakpoints (CBPs) are available for interpretation of raw data. ECOFFs were introduced by EUCAST as one basic parameter for the determination of clincial breakpoints. For a given microbial species and antimicrobial agent combination, the ECOFF is the highest minimum inhibitory concentration (MIC) for organisms devoid of phenotypically
detectable, acquired resistance mechanisms (= wild-type population). The ECOFF is an inherent, stable property of a particular bacterial species that is not influenced by other parameters and does not change over time. It is the most sensitive instrument for early detection of upcoming AMR. Therefore, ECOFFs are used in the mandatory active monitoring of AMR in zoonotic and indicator bacteria as an interpretative criteria, to detect trends in antibiotic resistance over time. In contrast, clincial breakpoints (CBPs) are determined by taking into account the ECOFF, the pharmacokinetic/pharmacodynamic breakpoint and the clinical cutoff, when available [6]. As several factors, such as dosage regimens or clincial cut-offs, may change over time, CBPs are updated regulary by EUCAST, CLSI or national authorities. CBPs are widely used by diagnostic laboratories for antimicrobial susceptibility testing (AST), in order to classify pathogens as susceptible or resistant to antimicrobials, thus ensuring the selection of the most appropriate antibiotic for treatment by the veterinarian.
In the past, there was a large gap in ECOFF values for veterinary pathogens and antimicrobials. However, already in the EARS-Vet study, the data was successfully analysed with the ECOFFs available at the time. In the meantime, numerous new ECOFFs have been published through projects, such as the COST Action CA18217 – European Network for Optimisation of Veterinary Antimicrobial Treatment (ENOVAT) [7]. Therefore, ECOFFs should be used instead of CBPs as interpretative criteria in the national AMR monitoring program of animal pathogens to ensure early detection of emerging AMR mechanisms and reliable recording of AMR trends in the future.
References
[1] European Commission (2017). A European One Health action plan against antimicrobial resistance (AMR). Available at: https://health.ec.europa.eu/system/ files/2020-01/amr_2017_action-plan_0.pdf
[2] European Centre for Disease Prevention and Control and World Health Organisation. (2022). Antimicrobial resistance surveillance in Europe: 2022: 2020 data. LU: Publications Office Available at: https://data. europa.eu/doi/10.2900/112339
[3] Mader, R., Damborg, P., Amat, J.-P., Bengtsson, B., Bourély, C., Broens, E. M., et al. (2021). Building the European antimicrobial resistance surveillance network in veterinary medicine (EARS-vet). Eur. Secur. 26:2001359. doi: 10.2807/1560-7917. ES.2021.26.4.2001359
[4] Lagrange J, Amat JP, Ballesteros C, Damborg P, Grönthal T, Haenni M, Jouy E, Kaspar H, Kenny K, Klein B, Lupo A, Madec JY, Salomonsen CM, Müller E, Madero CM, Nilsson O, Norström M, Nykäsenoja S, Overesch G, Pedersen K, Pohjanvirta T, Slowey R, Justo CT, Urdahl AM, Zafeiridis C, Zini E, Cazeau G, Jarrige N, Collineau L. Pilot testing the EARS-Vet surveillance network for antibiotic resistance in bacterial pathogens from animals in the EU/EEA. Front Microbiol. 2023 May 22;14:1188423. doi: 10.3389/ fmicb.2023.1188423. PMID: 37283921; PMCID: PMC10239921.
[5] European Committee on Antimicrobial Susceptibility Testing. MIC distributions and epidemiological cut-off value (ECOFF) setting, EUCAST SOP 10.2, 2021. http://www.eucast.org.
[6] Toutain, P.-L., A. Bousquet-Mélou, P. Damborg, A. A. Ferran, D. Mevius, L. Pelligand, K. T. Veldman and P. Lees (2017). “En Route towards European Clinical Breakpoints for Veterinary Antimicrobial Susceptibility Testing: A Position Paper Explaining the VetCAST Approach.” Frontiers in Microbiology 8(2344)
[7] https://enovat.eu/about/
Antibiotics and antimicrobial resistance in the water cycle
11 Antibiotics and antimicrobial resistance in the water cycle
11.1 Sources of antibiotics to the environment
Antibiotics are consumed in high quantities in human and veterinary medicine. Approximately 44,000 kg were sold in human medicine in Switzerland in 2023 and 24,000 kg in veterinary medicine. Consumption of antibiotics in human medicine stay stable as compared to 2014 (see chapter 4), while it halves in veterinary medicine (see chapter 5). After intake, humans and animals excrete antibiotics partly unchanged, so that they end up in wastewater or soils via application of manure. Beside these routes, manufacturing and formulating industries can also be a source of antibiotics to the aquatic environment [1,2].
Conventional wastewater treatment plants (WWTPs) only partly remove polar organic micropollutants such as antibiotics, and therefore release them into receiving waters. Consequently, WWTPs have been identified as a major source of antibiotics in the aquatic environment [3]. Since 2016, selected WWTPs in Switzerland are being upgraded with an additional treatment step for the elimination of micropollutants from municipal wastewater. This specific treatment (e.g. with ozone or activated carbon) eliminates a large spectrum of micropollutants to varying extents. Most antibiotics are very well eliminated (>80%). The upgrade of the WWTPs must be completed by 2040 at the latest. At this time, approximately 70% of all Swiss municipal wastewaters should be treated to eliminate micropollutants, leading to a strong reduction of the load of antibiotics being released from WWTPs to the aquatic environment.
The aim of upgrading the WWTPs is to protect flora and fauna as well as the quality of drinking water resources. This is important since rivers infiltrate into groundwater, the main source of drinking water in Switzerland. Micropollutants such as antibiotics can be removed during riverbank filtration by sorption to particles or biological degradation. However, certain mobile and persistent antibiotics are not removed during riverbank filtration and thus reach groundwater. In addition, manure application to soils may lead to a contamination of groundwater with antibiotics used in veterinary medicine by direct leaching from soils into groundwater. In Switzerland, the spreading of sewage sludge in agriculture has been banned since 2006.
11.2 Antibiotics in municipal wastewater, surface water and groundwater
Table 11. a, b and c provides an overview of the available data for 19 antibiotics and five metabolites analysed in municipal wastewater, surface water and groundwater between 2018 and 2022. The number of analysed samples varies significantly for each substance.
In municipal wastewater, all 13 analysed substances are detected (Table 11. a). While ciprofloxacin, clarithromycin, clindamycin, levofloxacin, metronidazole, norfloxacin, sulfamethoxazole and trimethoprim are frequently detected (>75%), azithromycin, erythromycin and sulfamethazine are only occasionally detected (<25%). Low detection frequency of erythromycin and azithromycin can be explained by either their instability in aqueous solution [4] or the relative high limits of quantification for these two compounds. Sulfamethazine is only authorised in veterinary medicine; this could explain its lower detection frequency in wastewater. Sulfapyridine is reported with a medium detection frequency of approximately 50% in wastewater. It is also detected in surface water, although it is no longer authorised in human or veterinary usages in Switzerland. Its presence in wastewater and surface water is probably due to the metabolization of the anti-inflammatory drug sulfasalazine, used in human medicine for the treatment of ulcerative colitis and rheumatoid arthritis [5,6].
The conventional biological treatment degrades the antibiotics to different degrees – from poor (20%–50%) to very good (80–100%) removal (Table 11). Clindamycin concentrations increase during biological treatment, presumably due to a reformation from a transformation product [7,8].
Additional treatment steps for the elimination of micropollutants, mainly ozonation and/or activated carbon treatment, remove the antibiotics well (50-80% removal) or very well (80-100% removal). The only exception to this is sulfamethoxazole in activated carbon treatment. While ozonation also removes sulfamethoxazole very well (80-100%), activated carbon only achieves poor removal (20-50%). Consequently, effluent concentrations of WWTPs equipped with such advanced treatment are significantly lower than effluent concentrations of conventional WWTPs (see Figure 11. a).
Table 11. a: Antibiotics in municipal wastewater effluents in Switzerland from 2018 to 2022. Concentration range and median values are shown: First quartile (Q25, value under which 25% of data points are found), median (Q50, value under which 50% of data points are found) and third quartile (Q75, value under which 75% of data points are found). Removal in biological and advanced treatment (ozonation or activated carbon treatment) are classified as poor = 20-50%; good = 50-80%; very good = 80-100%.
LOQ: limit of quantification. * not enough data (<10) to perform distribution statistics “not analysed/not applicable”
1 Sum of erythromycin and dehydrated erythromycin 2 Sum of ofloxacin and its optical S-(-) isomer levofloxacin
Table 11. b: Antibiotics in surface water in Switzerland from 2018 to 2022. Concentration range and median values are shown: First quartile (Q25, value under which 25% of data points are found), median (Q50, value under which 50% of data points are found) and third quartile (Q75, value under which 75% of data points are found).
LOQ: limit of quantification.
1 Sum of erythromycin and dehydrated erythromycin 2 Sum of ofloxacin and its optical S-(-) isomer levofloxacin * not enough data (<10) to perform distribution statistics “not analysed/not applicable”
Table 11. c: Antibiotics in groundwater in Switzerland from 2018 to 2022. Concentration range and median values are shown: First quartile (Q25, value under which 25% of data points are found), median (Q50, value under which 50% of data points are found) and third quartile (Q75, value under which 75% of data points are found). LOQ: limit of quantification.
* not enough data (<10) to perform distribution statistics “not analysed/not applicable”
1 Sum of erythromycin and dehydrated erythromycin
2 Sum of ofloxacin and its optical S-(-) isomer levofloxacin
In surface water at the monitoring sites of the National Surface Water Monitoring NAWA, the most frequently detected antibiotic is sulfamethoxazole, followed by its acetyl-metabolite (Table 11. b). Also, sulfapyridine, clarithromycin, trimethoprim, clindamycin, and sulfamethazine are regularly detected (>10%). Other antibiotics such as azithromycin, ofloxacin, metronidazole, erythromycin or ciprofloxacin are rarely detected. The four antibiotics roxithromycin, amoxicillin, sulfadiazine and sulfadimethoxine are analysed but never detected. Concentrations range from the limit of quantification (LOQ) (in the range of 0.001 µg/L) up to 1 µg/L, with median concentrations of the detected antibiotics between 0.001 µg/l (sulfathiazole) and 0.03 µg/l (clindamycin). This is about one order of magnitude lower than in wastewater.
The concentrations of clarithromycin, clindamycin, sulfamethoxazole, sulfapyridine, and trimethoprim decrease from WWTP influents to WWTP effluents and, finally,
to surface water (Figure 11. a). In the effluent of WWTPs equipped with an advanced treatment step to abate micropollutants (ozonation or activated carbon treatment), the concentrations of these five antibiotics are generally one order of magnitude lower than after a conventional biological treatment. The concentrations in surface water are 2-30 times lower than in conventionally treated wastewater. This is due to dilution with pristine river water. Clindamycin occurs in only slightly lower concentrations in surface water than in wastewater effluent (Figure 11. a). This can be explained by additional input into surface water by the veterinary usage of this compound and/or the reformation from transformation products (as mentioned above).
Environmental Quality Standards (EQS) are used to assess the environmental risk of a substance. If the concentration in surface water exceeds the EQS value, risks of adverse effects for aquatic organisms cannot be excluded. However,
Figure 11. a: Antibiotics (2018–2022) in the wastewater influent to WWTPs (-In), effluent of conventional WWTPs (-Out), effluent of WWTPs equipped to abate micropollutants (-Out MP) and surface water (SW). Boxes represent 50% of the concentrations and the white line their median value. The number of detections (n > limit of quantification, LOQ) are indicated above.
Figure 11. b: Clarithromycin concentrations in two watercourses from 2018 to 2022: Furtbach (ZH, left) and Landgrabe (SH, right). The red line indicates EQS value of 0.12 µg/L fixed in the Water Protection Ordinance (WPO, Annex 2). The arrow in Figure 11. b (left) indicates the implementation of an additional ozone treatment in one WWTP in the Furtbach catchment. Two-week composite samples were taken from 2018 to 2022 without interruption. Missing concentrations indicate concentrations below the limit of quantification of 0.02 µg/L (Furtbach) or 0.03/0.04 µg/L (Landgrabe).
EQS values are designed to protect aquatic organisms from potential ecotoxicological effect of antibiotics and not to prevent the selection for antimicrobial resistance (AMR) (see Infobox 11 for more details). Of the 19 antibiotics measured in surface water, 8 have available EQS values, two of which are listed as numerical requirements in Appendix 2 of the Water Protection Ordinance (WPO): azithromycin (0.019 µg/L) and clarithromycin (0.12 µg/L). Four antibiotics exceed their EQS values in surface water. Azithromycin and clarithromycin exceed their EQS- (WPO) values 153 and 19 times, respectively. Erythromycin and sulfamethoxazole exceed their EQS values three and two times, respectively.
Figure 11. b shows the concentration of clarithromycin in two rivers that are analysed throughout the year with two-week composite samples. In both rivers, the treated wastewater accounts for more than 50% of the total discharge of the rivers at base flow. Clarithromycin exceeded its numerical requirements (WPO, Annex 2) several times in the rivers Furtbach and Landgrabe. Since 2021, one of the wastewater treatment plants discharging into the Furtbach operates with ozonation (Arrow, Figure 11. b, left). Consequently, the concentrations of clarithromycin decreased and exceedances of the WPO requirements were no longer observed. In the catchment of the Landgrabe (Figure 11. b, right), the upgrade with an additional treatment step for the elimination of micropollutants is planned for the only WWTP discharging into this watershed.
In groundwater, antibiotics are detected less frequently and in lower concentrations than in wastewater or surface water (Table 11. c ). The main source of human antibiotics in groundwater is the infiltration of surface water. Degradation and sorption to soil particles during riverbank filtration reduce the antibiotic load significantly. Manure may also be a source of antibiotics in groundwater. However, antibiotics exclusively used as veterinary pharmaceuticals are rarely detected in groundwater.
Sulfamethoxazole is the antibiotic detected most frequently at the monitoring sites of the National Groundwater Monitoring NAQUA [9] (Table 11. c). It was found at approximately 10% of all monitoring sites. Sulfamethoxazole is mostly detected at sites near adjacent rivers containing more than 5% of domestic wastewater discharge, such as the Birs, Glatt or Thur.
11.3 Conclusions
Antibiotics are present in treated municipal wastewater, surface water and groundwater. Their concentrations decrease from wastewater to surface water due to dilution, and further decrease to groundwater due to degradation and sorption during riverbank filtration or soil passage. Some antibiotics exceed their Environmental Quality Stand -
ards (EQS) values in surface water, indicating possible negative effects on aquatic organisms.
Based on current knowledge, it is unlikely that the antibiotic concentrations measured in Swiss surface water directly promote the development of antibiotic resistance (see Infobox 11.1). Nevertheless, AMR indicator genes and AMR bacteria are present in wastewater (see Infobox 11.2), surface water and sediments [10,11,12]. Although many open questions remain, emissions of antibiotics and AMR bacteria to the environment should be minimised based on the precautionary principle.
Since 2016, Switzerland has been upgrading selected WWTPs to eliminate micropollutants such as antibiotics from wastewater. In 2024, more than 20 WWTPs already treat approximately 15% of Switzerland’s wastewater with an advanced treatment step to abate micropollutants. The very good removal rate for most antibiotics at these upgraded WWTPs is clearly visible in the effluent concentrations (see Table 11. a and Figure 11. a) and impacts surface water. After the upgrade of a WWTP, the concentrations in the receiving river decrease (see Figure 11. b, left). Until 2040, approximately 70% of all Swiss wastewaters will be treated with an advanced treatment; this should lead to a significant reduction of the emission of antibiotics from WWTPs to the environment.
The monitoring of antibiotics in the water samples remains crucial in order to assess the possible effects of antibiotics on human and animal health, as well as to improve the understanding of antibiotic resistance selection. The decreasing trend of antibiotic concentrations, as already seen in some rivers, should continue in the coming years in both surface and groundwater.
References
[1] Anliker S., M. Loos, R. Comte, M. Ruff, K. Fenner and H. Singer (2020). Assessing Emissions from Pharmaceutical Manufacturing Based on Temporal High-Resolution Mass Spectrometry Data. Environmental Science & Technology 54 (7), 4110-4120
[2] Bosshard J., F. Eugster, R. Gulde and H. Singer (2024). Abwasser aus der Formulierung von Arzneimitteln. Wirkstoffeinträge in Schweizer Gewässer. Aqua & Gas, 3: 50-57.
[3] Haenni, M., C. Dagot, O. Chesneau, D. Bibbal, J. Labanowski, M. Vialette, D. Bouchard, F. Martin-Laurent, L. Calsat, S. Nazaret, F. Petit, A.-M. Pourcher, A. Togola, M. Bachelot, E. Topp and D. Hocquet (2022). “Environmental contamination in a high-income country (France) by antibiotics, antibiotic-resistant bacteria, and antibiotic resistance genes: Status and possible causes.” Environment International 159: 107047.
[4] Saita, M. G., D. Aleo, B. Melilli, S. Mangiafico, M. Cro, C. Sanfilippo, A. Patti (2015). “pH-Dependent stability of azithromycin in aqueous solution and structure identification of two new degradation products”. Journal of Pharmaceutical and Biomedical Analysis 158: 47-53
[5] Choi J, Patel P, Fenando A. Sulfasalazine. [Updated 2024 Mar 21]. In: StatPearls [Internet]. Treasure Island (FL): StatPearls Publishing; 2024 Jan-. Available from: https://www.ncbi.nlm.nih.gov/books/NBK557809/
[6] Göbel A., A. Thomsen, C. S. McArdell, A. Joss and W. Giger. Occurrence and Sorption Behavior of Sulfonamides, Macrolides, and Trimethoprim in Activated Sludge Treatment. Environmental Science & Technology 2005 39 (11), 3981-3989
[7] Kovalova, L., H. Siegrist, H. Singer, A. Wittmer and C. S. McArdell (2012). “Hospital Wastewater Treatment by Membrane Bioreactor: Performance and Efficiency for Organic Micropollutant Elimination.” Environmental Science & Technology 46(3): 1536-1545.
[8] Marx, C., N. Günther, S. Schubert, R. Oertel, M. Ahnert, P. Krebs and V. Kuehn (2015). “Mass flow of antibiotics in a wastewater treatment plant focusing on removal variations due to operational parameters.” Science of The Total Environment 538: 779-788.
[9] FOEN. Federal Office for the Environment (2024b). Pharmaceuticals in groundwater. www.bafu.admin. ch/bafu/en/home/topics/water/info-specialists/stateof-waterbodies/state-of-groundwater/groundwaterquality/pharmaceuticals-in-groundwater.html
[10] Lyautey, E., C. Bonnineau, P. Billard, J.-L. Loizeau, E. Naffrechoux, A. Tlili, E. Topp, B. J. D. Ferrari and S. Pesce (2021). “Diversity, Functions and Antibiotic Resistance of Sediment Microbial Communities From Lake Geneva Are Driven by the Spatial Distribution of Anthropogenic Contamination.” Frontiers in Microbiology 12.
[11] Lee, J., K. Beck and H. Bürgmann (2022). “Wastewater bypass is a major temporary point-source of antibiotic resistance genes and multi-resistance risk factors in a Swiss river.” Water Research 208 : 117827.
[12] Czekalski N, Berthold T, Caucci S, Egli A, Bürgmann H. (2012). “Increased levels of multiresistant bacteria and resistance genes after wastewater treatment and their dissemination into Lake Geneva, Switzerland”. Frontiers in Microbiology 22;3:106.
Environmental risk assessment of antibiotics: predicted no-effect
concentrations for resistance selection in the aquatic environment
G. Ferrari 1
1
Swiss Centre for Applied Ecotoxicology
To assess the risk that chemicals pose to the environment, Predicted No-Effect Concentrations (PNEC) are used. If environmental concentrations lie below the PNEC, we do not expect a risk of adverse effects. PNECs are used to assess water quality and they are called Environmental Quality Standards (EQS) if derived according to the EU Technical Guidance Document on EQS [1] and used for retrospective assessment of surface water bodies. In Switzerland, EQSs for some substances are set as legal thresholds in the Water Protection Ordinance (see Chapter 11).
The protection objective of environmental risk assessment is the health of organisms living in the environment. In the case of antimicrobials, however, it is not only the health of organisms that is of concern, but also the potential adverse effects on human health. Indeed, high concentrations of antimicrobial substances in the environment can lead to the selection of pre-existing or the emergence of new antimicrobial resistances in environmental bacteria. Selection of pre-existing resistances leads to a greater abundance of antimicrobial-resistant bacteria, and the potential for infection with such bacteria rises. The emergence and subsequent appearance of new types of antimicrobial resistance carries the risk that these resistances will spread to human pathogens and, in the event of infection, increase the likelihood of treatment failure due to resistance. While emergence events can potentially have serious consequences for the antimicrobial resistance landscape in humans, it is exceptionally difficult to quantify the risk of such events because of their probabilistic nature. Quantifying the relationship between antimicrobial concentrations and selection pressure, however, is much more palpable. PNECs derived for this purpose will be indicated as PNECres (res for resistance selection).
Minimum Inhibitory Concentrations (MIC) – the concentration of a specific antimicrobial at which bacterial growth is inhibited – can be conceptualized as the upper limit of a concentration at which selection occurs. At antibiotic concentrations below the MIC, the growth of bacteria sensitive to antibiotic treatment is slowed, whereas bacteria resistant to antibiotic treatment will continue to thrive, thus creating conditions in which a selection for the survival of resistant bacteria occurs. The lowest concentration at which we expect a selection for resistance in the bacterial population is called the Minimum Selective Concentration (MSC).
MSCs can be experimentally measured with methods such as competition experiments with isogenic bacteria. The downsides of experimental approaches include the high amount of time, effort, and expertise required, as well as conclusions being limited to the bacterial species tested. One approach to estimating MSCs beyond a single species relies on the experimentally tested relationship between MIC and MSC – it uses the available MIC to estimate the MSC. For this purpose, databases containing the MIC of numerous antibiotics and different bacterial species, such as the EUCAST (European Committee on Antimicrobial Susceptibility Testing) database, are used. From the MIC distributions, the 1% percentile is chosen to account for the precautionary principle, and a factor is applied to estimate the MSC from this concentration. This method, developed by Bengtsson-Palme and Larsson [2], is currently the most widely used methodology for deriving PNECres in the aquatic environment. Limitations include the fact that derivation is possible only for antibiotics for which extensive MICs are available. Since the EUCAST database is designed for use in human medicine, and it is difficult to find corresponding MIC data for antibiotics used in veterinary medicine, the derivation of PNEC res for such antibiotics with the Bengtsson-Palme and Larsson method [2] is challenging.
Swiss surface water concentrations of antibiotics compared to Environmental Quality Standards (EQS) and Predicted No-Effect Concentrations for resistance selection (PNEC res)
For four antibiotics, surface water concentrations measured from 2018 to 2022 lie above their respective EQS, indicating a possible risk for adverse effects on aquatic organisms (Figure XIV). However, the extent to which EQSs are exceeded varies widely. EQS exceedances for clarithromycin, erythromycin and sulfamethoxazole lie within a factor of 1 to 1.5. For azithromycin, however, this factor lies between 1 and more than 50, indicating a higher risk for aquatic organisms. If we compare the EQS with the PNECres, we find that for all substances except trimethoprim, EQSs are lower than PNEC res (Figure XIV). In these cases, we can assume that EQS values are protective not only for adverse effects on aquatic life, but also against the selection for antimicrobial resistance.
For four of the five antibiotics for which PNEC res are available (clarithromycin, erythromycin, sulfamethoxazole, and trimethoprim), environmental concentrations do not exceed these values (Figure XIV). Azithromycin is the only substance for which the PNEC res is exceeded in the measurement period 2018–2022, albeit only in a low number
of samples. However, no exceedances occurred in 2022 (data not shown). Hence, we can assume that there is currently no risk of antimicrobial resistance selection in Swiss surface water.
No PNEC res is available for sulfamethazine. This is because it is only used in veterinary medicine, and the database used to derive PNEC res is for antibiotics used in human medicine. A new derivation of PNEC res was not possible, since corresponding MIC data could not be found. Although the
sulfamethoxazole metabolite acetyl-sulfamethoxazole was the second most frequently detected antibiotic in surface water after its mother substance, neither a PNECres nor an EQS value is available for it. For the former, this is because the human medicine database used to derive PNEC res only offers data on the antibiotics, and not their metabolites, since it is intended for clinical use. An EQS derivation was not possible due to a lack of ecotoxicological data. The insufficient data availability makes risk assessment of antibiotic metabolites challenging.
Figure XIV: Environmental Quality Standards (EQS) and Predicted No-Effect Concentrations for resistance selection (PNECres) compared to environmental concentrations of the antibiotics azithromycin, clarithromycin, erythromycin, sulfamethazine, sulfamethoxazole and trimethoprim measured in Swiss surface water between 2018 and 2022.
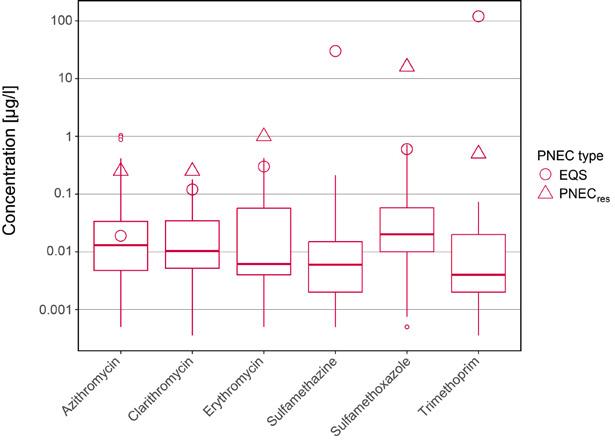
Applications and outlook
Selection of antimicrobial resistance is mostly a concern in places where high concentrations of antibiotics can occur, for example in hospital wastewaters or in pharmaceutical manufacturing wastewaters. To tackle the issue of wastewater management in pharmaceutical manufacturing, the World Health Organisation produced a draft guidance [3], and the AMR industry alliance also published a guidance document, the Antibiotic Manufacturing Standard [4]. Both guidance documents suggest concentrations of antimicrobials in receiving surface water should remain below both EQS and PNEC res values to ensure no adverse effects on aquatic life, and no selection for antimicrobial resistance. If no PNEC res is available for a substance, a default value of 50 ng/l is suggested, based on a statistical evaluation of available PNEC res data [3,4].
In the derivation of EQS, the antibiotic resistance selection risk is currently not considered in the methodology. However, it has been considered both for EQS derived by the Swiss Centre for Applied Ecotoxicology [5] and the University of Stockholm, and in new proposals for EQS of antibiotics under the Water Framework Directive of the European Union. Currently, considerations of PNECres need to happen on a case-by-case basis, with expert judgment complementing traditional methodology. Given that EQSs are part of ordinances in many European countries, comparability and transparency in the derivation are of great importance. Therefore, a revision of the guidance, including methodology for PNECres, would be an important next step.
The multifaceted problem of antimicrobial resistance poses challenges that go beyond what traditional environmental risk assessment encompasses. New perspectives in substance-based risk assessment are essential to tackle the challenge of antimicrobial resistance. This further highlights the importance of the environment in the cycle of antimicrobial resistance under a One Health approach.
References
[1] European Commission (2018). Technical Guidance for Deriving Environmental Quality Standards Environment, Guidance Document No. 27, Updated version 2018, Document endorsed by EU Water Directors at their meeting in Sofia on 11-12 June 2018.
[2] Bengtsson-Palme, J., Larsson, D. G. J. (2016): “Concentrations of antibiotics predicted to select for resistant bacteria: Proposed limits for environmental regulation”. Environment International 86: 140–149.
[3] World Health Organisation (2023). “Guidance on waste and wastewater management in pharmaceutical manufacturing with emphasis on antibiotic production (Draft for public consultation)”. https://cdn. who.int/media/docs/default-source/wash-documents/ burden-of-disease/guidance-on-waste-and-wastewater-management-in-pharma-manufact-pub-consult20240110ecd72653-d3c5-4dcb-a044-d455d6e4c27a. pdf?sfvrsn=e35f97c9_5
[4] AMR industry alliance (2023). “Minimizing risk of developing antibiotic resistance and aquatic ecotoxicity in the environment resulting from the manufacturing of human antibiotics”. https://www.amrindustryalliance.org/wp-content/uploads/2022/06/AMRIA_Antibiotic-Manufacturing-Standard_June2022.pdf
[5] Ferrari, G., Junghans, M., Korkaric, M., & Werner, I. (2019): “Antibiotikaresistenzbildung in der Umwelt. Herleitung von UQK für Antibiotika unter Berücksichtigung von Resistenzbildung”. Aqua & Gas 99(6): 52-58.
Monitoring ESBL-Escherichia coli in Swiss wastewater: insights into population carriage
S. Conforti 1,2,3, A. Holschneider 1 , É. Sylvestre 1,4 and T. R. Julian 1,5,6
1 Eawag, Swiss Federal Institute of Aquatic Science and Technology, Dübendorf CH-8600, Switzerland
2 Department of Biosystems Science and Engineering, ETH Zürich, 4051 Basel, Switzerland
3 Swiss Institute of Bioinformatics (SIB), Switzerland
4 Sanitary Engineering, Delft University of Technology, Stevinweg 1, 2628CN Delft, the Netherlands
5 Swiss Tropical and Public Health Institute, 4051 Basel, Switzerland
6 University of Basel, 4055 Basel, Switzerland
Wastewater-based surveillance of infectious diseases has emerged as a powerful tool in public health surveillance, driven in part by successes monitoring SARS-CoV-2 during the pandemic and its subsequent extension to other pathogens, including Influenza A, Influenza B, and Respiratory Syncytial Virus [1]. Wastewater provides insights into disease dynamics circulating in communities and is independent from clinical-based surveillance programs [1]. Our understanding of the epidemiology of antibiotic-resistant bacteria, specifically, is based on estimates predominantly obtained in hospital settings. Such clinical surveillance of antimicrobial resistance (AMR) primarily screens hospital patients. It provides insights only into the subset of the population that visits clinics, and is only reported by a subset of health practitioners [2]. To obtain insights into AMR epidemiology outside of clinics, research programs are investigating the extent to which wastewater analysis can help to track AMR in communities and hospitals [3]. This wastewater-derived data aims to supplement traditional clinical surveillance, to provide insights into community AMR dynamics, and potentially to help inform efficacy of intervention programs, such as antibiotic stewardship campaigns.
Within the scope of Swiss National Science Foundation and Federal Office of Public Health projects, we have aimed to use wastewater analysis to monitor the percentage of Escherichia coli isolates producing extended-spectrum β -lactamase (ESBL- E. coli ) across Switzerland (Figure XV). Since November 2021, we have conducted fortnightly monitoring of ESBL-E. coli in influent wastewater from six wastewater treatment plants (WWTPs) in Switzerland: Altenrhein, Werdhölzli-Zürich, Sensetal-Laupen, Chur, Lugano and Aïre-Genève. Together, these catchments serve approximately 14% of the Swiss population. We have collected and analysed a total of 670 wastewater samples. To enumerate total E. coli, wastewater samples were serially diluted 100-fold with sterile 0.9% NaCl, and 100 µL were
plated on CHROMagar Orientation chromogenic media. To enumerate ESBL- E. coli, 100 µL of undiluted wastewater samples were plated on CHROMagar ESBL chromogenic media. Samples were plated in single replicates until 8 February 2022, and in duplicates thereafter. Plates were incubated at 37°C for 24 hours. Colony concentrations were determined by counting the dark pink to reddish colonies on CHROMagar Orientation for total E. coli and CHROMagar ESBL for ESBL- E. coli
Wastewater-based estimates of the ESBL- E. coli percentage may serve as proxies for ESBL- E. coli carriage rates within the population. Between November 2021 and November 2022, our analysis revealed a population-weighted mean percentage of ESBL- E. coli of 1.9% (95% confidence interval: 1.8–2%) across all sites and weeks [4]. This value is in the lower range of comparable European data, in which other studies of wastewater have observed ranges from 1.6% in Greece to 4.4% in Germany. In Switzerland, concentrations of ESBL- E. coli varied across WWTPs and over time, with higher values observed in WWTPs serving larger populations such as Zurich, Geneva, and Lugano. One potential explanation for this finding is that wastewater treatment plants in larger cities treat wastewater from more densely populated catchment areas. Higher population densities may contribute to increased transmission and therefore higher proportions of ESBL- E. coli in wastewater. Additionally, both Geneva and Zurich have international airports and numerous hospitals and clinics, which may also favor the spread of resistant bacterial strains. We observed seasonal variation in the percentage of ESBL- E. coli across all locations. The cause of this variation is unclear. Recent precipitation (24-96 hours prior) showed no significant association with ESBL- E. coli levels, while temperature occasionally had a moderate impact (P < 0.05, correlation coefficients around 0.40), but only in some locations. Temporal and spatial differences were observed, indicating shifts in community carriage.
We have developed a mechanistic model to describe the relationship between wastewater and population carriage of ESBL- E. coli. In this model, the proportion of ESBL- E. coli in the wastewater reflects both the Swiss population’s ESBL- E. coli carriage prevalence (number of people with ESBL- E. coli in the gut) and the proportion of ESBL- E. coli out of total E. coli in the gut amongst Swiss carriers. Unfortunately, we do not yet have data available on these two factors for Switzerland. Across all of Europe, 6% of people are estimated to be carriers of ESBL- E. coli. If this is true for Switzerland, then our wastewater data suggests that 32% of all E. coli in the gut of Swiss carriers are ESBL- E.
Figure XV: Temporal trends in the percentage of Escherichia coli resistant to beta-lactam antibiotics over total E. coli across various wastewater treatment plants in Switzerland (November 2021–April 2024). The map in the centre displays the locations of the seven wastewater treatment plants (WWTPs) analysed: ARA Chur, ARA Altenrhein, ARA Werdhölzli Zürich, IDA CDA Lugano, STEP d'Aïre Genève, and ARA Sensetal Laupen. The graphs surrounding the map show the temporal trends in the percentage of E. coli resistant to beta-lactam antibiotics at each respective WWTP. Each graph plots the percentage of resistant E. coli isolates (y-axis) over time (x-axis), with individual data points represented by black dots. The smoothed trend lines indicate the overall direction of resistance trends, with shaded areas representing confidence intervals. The population served by each WWTP (in thousands) is indicated in the lower right corner of each graph.
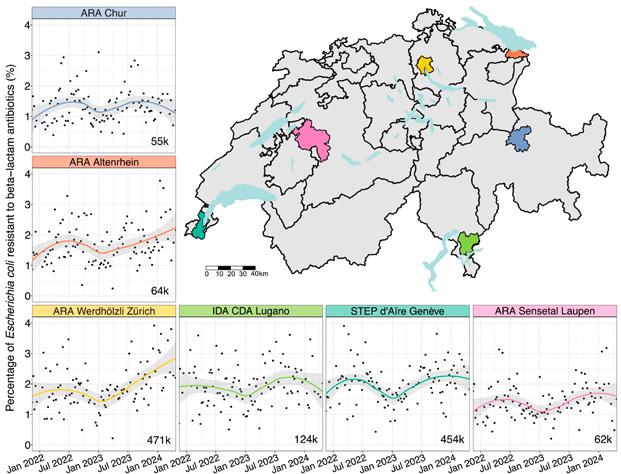
coli. However, this estimate exceeds an estimate from Bangladesh (the only country with data available so far), in which ESBL- E. coli are 19.3% of total E. coli. If we instead assume the Bangladeshi data is accurate for Switzerland, the wastewater data would imply that ESBL- E. coli carriage prevalence in Switzerland ranges between 9.2% and 10.5%, exceeding the European estimate. This discrepancy highlights the complexity of directly correlating wastewater data with community carriage rates and highlights the benefits of collecting additional data on ESBL- E. coli in the guts of the Swiss population.
Overall, our study demonstrates that wastewater-based surveillance of culturable ESBL- E. coli offers insights into AMR trends in Switzerland. The findings support the potential of using wastewater data as a proxy for estimating community carriage rates of ESBL- E. coli. We aim to expand our research by comparing wastewater data from the six WWTPs with clinical data on antimicrobial resistance from both the veterinary and the human sectors, as well as with antibiotic consumption patterns in Switzerland. This comprehensive approach will enhance our understanding of AMR dynamics and may inform targeted public health interventions. Establishing a long-term, nationally coordinated wastewater monitoring protocol could enhance our ability to track and respond to AMR trends in Switzerland. By integrating wastewater surveillance with traditional clinical surveillance, we can achieve a completer and more accurate picture of AMR prevalence, ultimately improving public health strategies and outcomes.
Further details on the study are available in [4]. This work was funded through the Swiss National Science Foundation grant (192763) to Timothy R. Julian (Eawag), and by the Swiss Federal Office of Public Health through a grant to Timothy R. Julian and Christoph Ort (Eawag).
References
[1] Parkins MD, Lee BE, Acosta N, Bautista M, Hubert CRJ, Hrudey SE, Frankowski K, Pang XL. 2024. Wastewater-based surveillance as a tool for public health action: SARS-CoV-2 and beyond. Clin Microbiol Rev 37.
[2] World Health Organisation. 2022. Global Antimicrobial Resistance and Use Surveillance System (GLASS) Report 2022. https://www.who.int/publications/book-orders.
[3] Chau KK, Barker L, Budgell EP, Vihta KD, Sims N, Kasprzyk-Hordern B, Harriss E, Crook DW, Read DS, Walker AS, Stoesser N. 2022. Systematic review of wastewater surveillance of antimicrobial resistance in human populations. Environ Int 162:107171.
[4] Conforti S, Holschneider A, Sylvestre É, Julian TR, Mcmahon K. 2024. Monitoring ESBL-Escherichia coli in Swiss wastewater between November 2021 and November 2022: insights into population carriage https://doi.org/10.1128/msphere.00760-23.
Whole-genome-sequencing of cephalosporinase- and carbapenemase-producing Enterobacterales from animals and humans: a baseline for a One Health molecular epidemiology
12 Whole-genome-sequencing
of cephalosporinase- and carbapenemase-producing Enterobacterales
from animals and humans: a baseline for a One Health molecular epidemiology
Vincent Perreten 1 and Gudrun Overesch 2
1 Division of Molecular Bacterial Epidemiology and Infectious Diseases, 2 Center for Zoonoses, Animal Bacterial Diseases and Antimicrobial Resistance, Institute of Veterinary Bacteriology, University of Bern, Switzerland.
12.1 Cephalosporins and carbapenems: critically important antimicrobials
Cephalosporins are β -lactam antimicrobials used for the treatment of several different types of bacterial infections in both humans and animals. Their use has resulted in the development of resistance in Enterobacterales , with the acquisition of plasmid-mediated AmpC (pAmpC) and extended spectrum beta-lactamase (ESBL) genes. As a result of increasing resistance to cephalosporins and multidrug-resistance in Enterobacterales , the use of last resort beta-lactam antibiotics called carbapenems has become inevitable in human medicine. Although not approved for animal use, carbapenems may be used in companion animals in Switzerland to treat infections refractory to any other standard antimicrobial used in veterinary medicine (Ordinance on Veterinary Medicinal Products, SR 812.212.27, Art. 6).
12.2 Cephalosporinaseand carbapenemaseproducing Enterobacterales in livestock and companion animals
The long-term Swiss national monitoring of antibiotic resistance in livestock and meat records both the prevalence and the different development trends of occurrence of third-generation cephalosporin-resistant Escherichia coli (3GC-R- Ec ) [1]. Since 2016, the prevalence in poultry and poultry meat has continuously decreased. Similarly, a decrease has been recorded in fattening pigs, although the prevalence in pigs has never reached the high prevalence level observed in poultry. In contrast, no downward trend has yet been observed in Swiss calves under one year, which is the animal species with the highest 3GC-R- Ec prevalence in 2023. Importantly, 3GC-R- Ec were only detected sporadically in pork and beef (see chapters 8 and 9 in this report). However, poultry, calves and pigs as well as poultry meat remain a reservoir of 3GC-R- Ec
In the monitoring program, resistance data are obtained from phenotypic tests, which are determined by the measurement of the minimum inhibitory concentration of antibiotics. This only allows a presumptive differentiation between ESBL and pAmpC and does not identify the underlying molecular mechanisms. To gain a better understanding of the molecular mechanisms of resistance in 3GC-R- Ec isolates, whole-genome-sequencing (WGS) was performed for further phylogenetic analysis and detection of resistance genes and plasmids.
Carbapenemase-producing Enterobacterales (CPE) have so far not been found in livestock and meat in Switzerland. However, they have been observed in companion animals. In February 2018, an E. coli carrying the carbapenemase NDM-5 gene was isolated from a wound infection of a dog in a veterinary hospital [2]. During the summer of 2018, a major outbreak of a carbapenemase OXA-181-producing E. coli occurred in another veterinary clinic, where one quarter of the hospitalised companion animals acquired this pathogen during their stay at the clinic [3]. Over the same period,
Figure 12. a: Detection and potential dissemination routes of plasmid-mediated OXA-48 carbapemenase containing Enterobacterales in different human, animal and environmental settings. Blue arrows indicate that transfer of CPE has been demontrated; orange arrows indicate highly possible routes of transmission; red arrows indicate future possible transmission route of CPE. Illustration was created by V.P. and adapted for publication by the publisher.
one employee of each clinic was found to be colonised with the same E. coli as the one detected in the hospitalised animals [4]. Nevertheless, CPEs were not detected among owners of CPE-positive animals [5]. During the same period, OXA-48-producing Klebsiella pneumoniae, E. coli and Enterobacter hormaechei also emerged in infection sites of hospitalised companion animals in Switzerland [6, 7].
12.3 A One Health study approach: Genetic relatedness between bacteria
of animal and human origin
3GC-R- Ec have been suspected to be transmitted to humans during meal preparation, thus posing the risk that their resistance plasmids are acquired by human pathogens [8]. The emergence of CPE in veterinary settings raised the question whether these strains are related to the strains causing infections in humans in Switzerland. However, systematic WGS-based analyses have not yet been performed on a representative and large collection of Swiss strains from humans and animals that would enable comparative genetic analysis. This will allow better understanding of the effective role of animals as reservoirs and potential vectors of 3GC-R- Ec and CPE and their plasmids. WGS comparative analysis was used to determine the degree of relatedness and genetic characteristics of CPE and 3GC-R- Ec isolates from animals and of human origin. 3GC-R- Ec isolates from humans were obtained through a long-established collaboration with the Institute for Infectious Diseases (IFIK),
University of Bern (Prof. Dr. Andrea Endimiani), and human CPE strains were made available for comparative genomic analysis by the National Reference Centre for Emerging Antibiotic Resistance (NARA), University of Fribourg (Prof. Dr. Patrice Nordmann), to which human clinical CPE isolates from Switzerland are sent for biochemical and molecular analysis and then archived.
12.3.1 Third-generation cephalosporinresistant Escherichia coli from poultry and humans
A comparative genomic analysis of 297 3GC-R- Ec strains from Swiss poultry and domestic and foreign poultry meat and of 107 clinical and non-clinical strains from humans was performed. The aim was to determine the degree of relatedness of the strains and their 3GC-resistance-containing elements between the animal and human settings in Switzerland. 3GC-R- Ec from poultry and humans were not phylogenetically related. The closest related strains differed by more than 100 loci, indicating non-recent spillover. The predominant 3GC-R genes were bla CMY-2 (n=113) and bla CTX-M-1 (n=104) among poultry strains, and bla CTX-M-15 (n=59), bla CTX-M-27 (n=16) and bla CTX-M-14 (n=10) among human isolates. A comparative analysis of circularized WGS assemblies revealed that the bla CMY-2 and bla CTX-M-1 genes from poultry E. coli were mostly carried by plasmids belonging to two major plasmid groups. Similar plasmids containing the same 3GC-resistance genes were only found sporadically in human isolates. Likewise, plasmids of human origin containing bla CTX-M-15 were only detected once in poultry E. coli. Overall, this study provides an insight into the genetic background of the 3GC resistance in different E. coli from poultry and of human origin. It has revealed that
strains from poultry and humans are generally not related, suggesting that spillover events may be rare. Only a few genetically unrelated strains harbored similar 3GC-R plasmids, indicating that plasmid transfer may occur between human and poultry E. coli strains.
12.3.2 Third-generation cephalosporinresistant Escherichia coli from cattle and pigs
A comparative genomic analysis of 70 3GC-R- Ec strains from Swiss slaughter calves and 17 3GC-R- Ec strains from Swiss fattening pigs was performed. It was shown that the antimicrobial resistance results obtained by phenotypic measurement and those obtained by the detection of corresponding underlying molecular mechanisms by WGS were in high agreement (99%). Resistance to 3GC was mainly associated with the presence of bla CTX-M-15 (n=28) in E. coli from calves and bla CTX-M-1 (n=7) in E. coli from pigs, and mutations in the ampC-promoter (g.-42 C>T) in E. coli from both animal species (calves n=21; pigs n=5). Phylogenetic analysis based on multi locus sequence types (MLST) and core genome MLST (cgMLST) revealed that 3GC-R- Ec isolated from Swiss slaughter calves and fattening pigs were genetically diverse [9].
12.3.3 Carbapenemase-producing Enterobacterales
in companion animals and humans
Emergence of OXA-48-producing K. pneumoniae, E. coli and Enterobacter hormaechei in veterinary clinics raised the question of their origin and of their potential to further disseminate among other animals, the environment and humans. WGS-based comparative analysis of the E. coli from animals and humans revealed that the strains of both origins were highly diverse. This indicates that the spread between origins was not associated with a direct exchange of strains, but rather the introduction and transmission of plasmids. The E. coli contained a highly conserved hyperepidemic plasmid carrying the carbapenemase gene bla OXA-48, which underlines the potential of such plasmids to disseminate in both human and veterinary settings. Furthermore, this plasmid is known to have the ability to easily cross between bacterial species and was also detected in human and animal K. pneumoniae and E. hormaechei [7, 10]. A closer analysis of E. hormaechei revealed genetic diversity among strains from humans and animals, except for the presence of a specific clone of ST114, which was also present in humans and established in a companion animal clinic. Core-gene SNP analysis confirmed the clonality of the animal ST114 (0 to 10 SNPs), and their close relatedness to human ST114 strains (80-120 SNPs). In addition to resistance to carbapenems, E. hormaechei was also resistant to several different classes of antimicrobials, making resulting infections difficult to treat [7].
12.3.4 The role of plasmids
Dissemination of 3GC resistance in E. coli from poultry is mainly due to two major plasmid types, which have the potential to be transmitted to E. coli causing infections in humans (see above). Especially alarming is the presence of a highly transferrable IncL type plasmid containing the carbapenemase gene bla OXA-48 in different Enterobacterales from companion animals. This plasmid can be maintained and further selected by non-carbapenem beta-lactams, since the OXA-48 carbapenemase also hydrolyses penicillins very efficiently. This OXA-48 plasmid is now disseminating in companion animal clinics, where it was detected in Enterobacterales from animal infection sites, clinical environments, and veterinarians [4, 6, 7]. The presence of such a plasmid in the veterinary setting is of major concern, and it may only be a matter of time before it also disseminates in Enterobacterales from horses and from livestock and meat (Figure 12. 1). This is already the case in some EU countries (see below). Surveillance, hygiene measures and infection monitoring need to be implemented in veterinary clinics to limit the establishment and spread of CPE among other multidrug-resistant bacteria and to avoid the dissemination of bacteria carrying transferrable carbapenemase plasmids.
12.4 The situation of carbapenemase-producing Enterobacterales in food producing animals in
the EU
Specific monitoring of carbapenemase-producing E. coli in livestock and meat using a European-wide harmonised selective media for carbapenemase-producers, in accordance with the protocol developed by the European reference laboratory for antimicrobial resistance, was made mandatory in the European Union starting in 2021 (EU decision 2020/1729). In Switzerland, these analyses have been part of the monitoring program since 2015 on a voluntary basis and were expanded to Klebsiella spp. So far, no carbapenemase-producing E. coli and Klebsiella spp. have been detected in Swiss livestock and meat samples (Tables 8. g and 9. i). On the other hand, carbapenemase-producing E. coli have already sporadically been detected in several European countries [11]. Although the reported number of carbapenemase-producing E. coli is still low in livestock, compared to previous years, an increasing number of isolates has been observed. Therefore in 2024, a self-task mandate of the EFSA BIOHAZ Panel was launched to evaluate the current status of occurrence and spread of CPE in the food chain in the EU/EFTA. Within the framework of this project, an in-depth WGS-based investigation of CPE in livestock and meat should be undertaken. The project starts in 2024 and runs for three years. Switzerland is not
Whole-genome-sequencing of cephalosporinase- and carbapenemase-producing Enterobacterales from animals and humans
eligible for this project by the European Commission and will irremediably miss an opportunity to better cope with a possible emergence of CPE in the food chain.
12.5 The importance of WGS and research for surveillance of resistance
WGS is nowadays the technology of choice to rapidly characterise and compare bacterial strains from different settings. WGS technology routines are needed for outbreak investigations and for the characterisation of new emerging pathogens as well as early prediction of new resistance genes. For this, coupling WGS analysis with phenotypic methods is imperative. Furthermore, WGS allows the detection and localisation of the antimicrobial resistance genes on mobile genetic elements such as plasmids. For instance, carbapenemase genes are located on highly transferrable plasmids. As the study above has illustrated, they may easily be acquired by host-adapted strains and further colonise and disseminate among the Enterobacterales of the normal flora of animals and humans. Resistance monitoring has entered a new era, in which tracking dissemination of plasmids may be a new challenge for One Health molecular epidemiology. In order to efficiently incorporate novel methods and discoveries from research into national reference laboratories with minimal time-lag, monitoring programs need to be supported by accompanying One Health-oriented research projects using advanced WGS technologies. Interactions between research and monitoring will enable the early detection of novel resistance genes and emerging pathogens and help to better face emergence and rapid dissemination of multidrug-resistant bacteria in all sectors.
Funding
This study was financed by grant no. 1.21.07 of the Federal Food Safety and Veterinary Office FSVO “Whole-genome-sequencing of cephalosporinase- and carbapenemase-producing Enterobacteriaceae from animals: a baseline for a One-Health molecular epidemiology” and by internal funds of the Institute of Veterinary Bacteriology, University of Bern.
References
[1] Federal Office of Public Health and Federal Food Safety and Veterinary Office. Swiss Antibiotic Resistance Report 2022. Usage of Antibiotics and Occurrence of Antibiotic Resistance in Switzerland. November 2022.
[2] Peterhans S, Stevens MJA, Nüesch-Inderbinen M, Schmitt S, Stephan R, Zurfluh K. First report of a
bla NDM-5 -harbouring Escherichia coli ST167 isolated from a wound infection in a dog in Switzerland. J Glob Antimicrob Resist. 2018 Dec;15:226-227.
[3] Nigg A, Brilhante M, Dazio V, Clément M, Collaud A, Gobeli Brawand S, Willi B, Endimiani A, Schuller S, Perreten V. Shedding of OXA-181 carbapenemase-producing Escherichia coli from companion animals after hospitalisation in Switzerland: an outbreak in 2018. Euro Surveill. 2019 Sep;24(39):1900071.
[4] Endimiani A, Brilhante M, Bernasconi OJ, Perreten V, Schmidt JS, Dazio V, Nigg A, Gobeli Brawand S, Kuster SP, Schuller S, Willi B. Employees of Swiss veterinary clinics colonised with epidemic clones of carbapenemase-producing Escherichia coli. J Antimicrob Chemother. 2020 Mar 1;75(3):766-768.
[5] Dazio V, Nigg A, Schmidt JS, Brilhante M, Campos-Madueno EI, Mauri N, Kuster SP, Brawand SG, Willi B, Endimiani A, Perreten V, Schuller S. Duration of carriage of multidrug-resistant bacteria in dogs and cats in veterinary care and co-carriage with their owners. One Health. 2021 Aug 31;13:100322.
[6] Brilhante M, Gobeli Brawand S, Endimiani A, Rohrbach H, Kittl S, Willi B, Schuller S, Perreten V. Two high-risk clones of carbapenemase-producing Klebsiella pneumoniae that cause infections in pets and are present in the environment of a veterinary referral hospital. J Antimicrob Chemother. 2021 Apr 13;76(5):1140-1149.
[7] Donà V, Nordmann P, Kittl S, Schuller S, Bouvier M, Poirel L, Endimiani A, Perreten V. Emergence of OXA-48-producing Enterobacter hormaechei in a Swiss companion animal clinic and their genetic relationship to clinical human isolates. J Antimicrob Chemother. 2023 Dec 1;78(12):2950-2960.
[8] Seiffert SN, Carattoli A, Schwendener S, Collaud A, Endimiani A, Perreten V. Plasmids carrying bla CMY-2/4 in Escherichia coli from poultry, poultry meat, and humans belong to a novel IncK subgroup designated IncK2. Front Microbiol. 2017 Mar 15;8:407.
[9] Aebi CB, Fernandez JE, Kittl S, Tresch ML, Perreten V, Overesch G. Characterisation of third-generation cephalosporin-resistant Escherichia coli from slaughter calves and fattening pigs: A pilot study for monitoring antimicrobial resistance by whole genome sequencing in Switzerland. Schweiz Arch Tierheilkd. 2023 Jun;165(6):372-384.
[10] Campos-Madueno EI, Moser AI, Jost G, Maffioli C, Bodmer T, Perreten V, Endimiani A. Carbapenemase-producing Klebsiella pneumoniae strains in Switzerland: human and non-human settings may share high-risk clones. J Glob Antimicrob Resist. 2022 Mar;28:206-215.
[11] EFSA (European Food Safety Authority) & ECDC (European Centre for Disease Prevention and Control). (2024). The European Union summary report on antimicrobial resistance in zoonotic and indicator bacteria from humans, animals and food in 2021–2022. EFSA Journal, 22, e8583. ttps://doi.org/10.2903/j. efsa.2024.8583
Comparison of antibiotic consumption in humans and animals for 2023
D. Heim 1, A. Léger 1, C. Plüss-Suard 2 and
G. Schüpbach-Regula 3
1 Federal Food Safety and Veterinary Office (FSVO), Liebefeld, Bern, Switzerland
2 Swiss Centre for Antibiotic Resistance (ANRESIS), Institute for Infectious Diseases, University of Bern, Bern, Switzerland
3 Veterinary Public Health Institute, Vetsuisse, University of Bern, Liebefeld, Bern, Switzerland
In the SARR report 2018, an analysis comparing human and veterinary data on antibiotic use was presented for the first time in Switzerland (1). The antibiotic usage data for livestock and humans were transformed into mg of active ingredient per kg of body mass (mg/BM), based on the method used in the JIACRA-report for EU/EEA-countries (1), to allow a better comparison between the two consumption metrics. The mg/biomass in humans was calculated using an average body weight of 62.5 kg. The mg/biomass for food-producing animals was calculated using the number of live and slaughtered livestock multiplied by the estimated weight at the time of treatment. The 2023 data on antibiotic use have been analysed following the same methodology.
The population-weighted total consumption in 2023 in Switzerland was 78.8 mg/kg of biomass in humans, and 30.3 mg/kg of biomass in food-producing animals; therefore, livestock presented a smaller antibiotic consumption per biomass than humans.
The results can be compared to European values via the JIACRA-report (2). Among EU/EEA countries in 2021, the population-weighted mean consumption was 125.0 mg/ kg of biomass in humans (range 44.3–160.1 mg/kg; median 108.9 mg/kg); in food-producing animals, the population-weighted mean consumption was 92.6 mg/kg (range 2.5–296.5 mg/kg; median 50.0 mg/kg). The Swiss data for human and livestock are significantly below the median of EU countries. Of note, overall antibiotic consumption in humans was considerably lower during the Covid-19 pandemic, and amounted to 61.4 mg/kg in Switzerland in 2021.
However, caution should be used when comparing the antibiotic consumption in the veterinary and human sectors. The amount of active ingredient per body mass is a technical indicator that does not take account of differences between humans and animal species in dosing regimens and formulations used. Calculation of the biomass denominator differs between humans and animals, especially in
the accuracy with which it can be estimated. These limitations should be borne in mind when comparing human and animal consumptions of antimicrobials expressed as mg/kg estimated biomass.
As antibiotic therapies vary considerably in mg, defined daily doses (DDD) are usually used when analyzing human consumption data, and the number of treatments or treatment days when analyzing animal data. The corresponding numbers are analysed in chapters 4 and 5 of this report.
References
[1] Federal Office of Public Health and Federal Food Safety and Veterinary Office. Swiss Antibiotic Resistance Report 2018. Usage of Antibiotics and Occurrence of Antibiotic Resistance in Bacteria from Humans and Animals in Switzerland. November 2018. FOPH publication number: 2018-OEG-87
[2] ECDC, EFSA and EMA (European Centre for Disease Prevention and Control, European Food Safety Authority and European Medicines Agency), (2024). Antimicrobial consumption and resistance in bacteria from humans and food-producing animals. EFSA Journal, 22(2), e8589. https://doi.org/10.2903/j. efsa.2024.8589
Figure XVI: Comparison of population biomass-corrected consumption of antimicrobials (milligram per kilogram estimated biomass) in humans and food-producing animals in 2023.
Materials
and methods
13 Materials and methods
13.1 Data on antibacterial consumption in human medicine
13.1.1 The Anatomical Therapeutic Chemical ATC classification system and defined daily doses (DDD)
Data were collected regarding antibacterials for systemic consumption (code J01 of the ATC classification), antibiotics for treatment of tuberculosis (ATC code J04AB) and agents against amoebiasis and other protozoal diseases (ATC code P01AB) [1]. Since 2016, we have also collected data on antimycobacterials (ATC code J04) and since 2018, we have collected data on intestinal anti-infectives (ATC code A07AA, including vancomycin oral and fidaxomicin). Antibiotic consumption (in grams or millions of international units) was converted into defined daily doses (DDD) using the 2024 release of the DDD by the World Health Organisation Collaborating Centre for Drug Statistics Methodology (see Annex I). Of note, DDD values for some of the most frequently used antibacterials (e.g., amoxicillin, amoxicillin-clavulanic acid, meropenem, ciprofloxacin, colistin) were submitted to upward adjustment in 2019 by the WHO Collaborating Centre for Drug Statistics Methodology [2].
13.1.2 Data source in the inpatient and outpatient setting
2014–2023 data were collected on behalf of the Swiss Federal Office of Public Health through the IQVIA™ database, which provides pharmaceutical sales data. This exhaustive dataset covered the antibiotics sold to pharmacies and dispensing physicians and hospitals (IQVIA™ channel: APO/ SD, SPI), including acute care hospitals, as well as rehabilitation, geriatric, and psychiatric clinics, and some nursing homes. As IQVIA™ follows the EphMRA classification, we accordingly collected antibacterial use data from the J01 (systemic antibiotics), D10B (minocycline, doxycycline oral, lymecycline), G01A1 (metronidazole oral, ornidazole oral), G04A1 (fosfomycin), G04A9 (nitrofurantoin), and J08 (metronidazole parenteral) classes [3]. This allowed us to measure antibiotic consumption at the national level and by linguistic region (German-speaking (including Liechtenstein), French-speaking and Italian-speaking parts of Switzerland). IQVIA™ cannot separate Liechtenstein from Switzerland in the dataset, but as the population of Liechtenstein ac -
Table 13. a: Number of hospitals and intensive care units contributing to ANRESIS, 2014–2023.
counts for 0.4% of the Swiss population, the values for Switzerland are not expected to be significantly affected.
For the calculation of the consumption in DDD per 1000 inhabitants per day, the permanent resident population of Switzerland on 31 December of the corresponding year was used [4]. Of note, the population used for the year 2023 is a provisional number (published in April) and is subject to change once the definitive number is released. This may lead to slight changes in results between reports.
13.1.3 Additional data source for the hospital setting
The network of voluntary acute care hospitals participating in the surveillance system ANRESIS set up in 2004 is mainly composed of somatic public hospitals and some private clinics. We excluded data from ambulatory, rehabilitation as well as long-term care geriatric and long-term care psychiatric units of these hospitals and specialised clinics, since their activity might bias the results. To assess the representativeness of the data-contributing network, we used the number of hospitals, number of beds (activity type A), and number of bed-days (without days of discharge) from general acute care hospitals (typology K111–K123 from FOPH) [5]. Data were collected from the entire hospitals, and separately from the adult intensive care units (ICU) when available. In this report, we describe the antibiotic consumption for the period 2014 to 2023. 54 hospital sites participated in 2014 and 75 in 2023, of which 47 were small-size (<200 beds), 22 medium-size (200–500 beds) and 6 large-size hospitals (>500 beds, which includes four Swiss university hospitals) (Table 13. a). Representativeness was calculated using the figures available on 13 July 2024: data relating to the number of beds and bed-days were available for the year 2022 [5]. In 2022, the hospital network represented 54% of the total number of acute somatic care hospitals and 78% of all bed-days in this category in Switzerland.
In 2023, 48 hospital sites (37 in 2014) also provided data on adult ICUs (21 small-size, 21 medium-size and 6 largesize hospitals), representing 66% of the hospitals equipped with ICU beds in Switzerland.
When interpreting the hospital data from ANRESIS, structural and patient characteristics can vary greatly, depending on the size or typology of a hospital. New participating hospitals may provide retrospective data, which may slightly change the values included in previous Swiss Antibiotic Resistance Reports. In the regional comparisons, it should be noted that there is no university hospital in Italian-speaking Switzerland.
The measurement units were DDD per 100 bed-days and DDD per 100 admissions [1]. The quantity of J01 group antibiotics was the denominator when measuring relative consumption.
The major difference between datasets is that the network of sentinel hospitals only includes acute care hospitals, whereas the IQVIA™ dataset is not restricted to acute care, also including data from rehabilitation, geriatric, and psychiatric clinics, as well as some nursing homes. Administrative data collected from the sentinel network allow us to use the number of bed-days and admission as denominators.
13.1.4 Additional data source for the outpatient setting
We analysed all antibacterial prescriptions reported from practitioners from general and internal medicine and pediatricians between 2018 and 2023 using the representative Swiss Sentinel Surveillance Network “Sentinella” [6]. Sentinella is a joint project between general practitioners, the Federal Office of Public Health and the university institutes for family medicine. As a sentinel reporting system, it is used to monitor frequent, non-reportable communicable diseases such as influenza in Switzerland. Participants from all over Switzerland report cases of illness anonymously to the FOPH. The distribution of physicians by age, sex, specialty and region is compared annually with the national medical statistics (FMH) using the methodology of Gnädinger et al [7]. Even if it is a voluntary system that is likely to select physicians with a particular interest in infectious diseases, it is considered fairly representative of the Swiss population of primary care physicians.
The data from 121 practitioners from general and internal medicine contributed to Sentinella were included for 2023 (n = 130 in 2019, n = 136 in 2020, n = 129 in 2021, n = 124 in 2022). The number of contributing paediatricians was 22 in 2023 (n = 21 in 2019, n = 23 in 2020, n = 25 in 2021, n = 25 in 2022).
The Sentinella database allowed us to calculate the frequency of use per indication expressed in numbers of prescriptions per 1000 consultations.
In Switzerland, principally all antibacterials are dispensed with a prescription. The Federal Act on Medicinal Products and Medical Devices mentions that medicinal products subject to prescription may be dispensed without a prescription when the pharmacist has direct contact with the person concerned and the dispensing is recorded, and if the medicines and indications are designated by the Federal Council [8]. The dispensing of antibacterials for patients with simple urinary tract infections (e.g. fosfomycin) by pharmacists may therefore be allowed in justified exceptional cases and is therefore missing in the Sentinella dataset.
13.1.5 Categorisation of antibiotics in the Access, Watch and Reserve groups
The WHO Expert Committee on Selection and Use of Essential Medicines recommends the categorization of antibiotics into the following categories: Access, Watch and Reserve (AWaRe) [9]:
–
The Access group contains first- and second-choice antibiotics for empirical treatment of common infections.
– The Watch group contains antibiotic classes with higher potential for selecting and promoting the spread of resistance. Antibiotics of this group should be limited to a small number of syndromes and patient groups. They must be targets of stewardship programs and monitoring.
– The Reserve group contains antibiotic classes that are of crucial importance for the treatment of multidrug-resistant organisms. They should be used as lastresort treatment, when all other alternatives have failed. They must be targets of stewardship programs and monitoring.
See Annex I for the list of antibiotics and their corresponding AWaRe group. Substances not assigned to an AWaRe category (e.g. benzathine phenoxymethylpenicillin) are classified as “Unclassified”.
References
[1] WHO Collaborating Centre for Drug Statistics Methodology, Guidelines for ATC classification and DDD assignment, 2024. Oslo, 2024. Available from: https://atcddd.fhi.no/atc_ddd_index_and_guidelines/ guidelines/ (accessed until 10 June 2024)
[2] WHO Collaborating Centre for Drug Statistics Methodology, ATC classification index with DDDs, 2024. Oslo, Norway 2024. Available from: https://atcddd. fhi.no/atc_ddd_index_and_guidelines/atc_ddd_index/ (accessed until 10 June 2024)
[3] European Pharmaceutical Market Research Association (EphMRA), Comparison of WHO ATC Classification with EphMRA/Intellus Anatomical Classification – updated for 2024. Available from: https://www.ephmra.org/anatomical-classification (accessed 10 June 2024)
[4] Federal Statistical Office, Effectif et évolution. Available from: https://www.bfs.admin.ch/bfs/fr/home/ statistiques/population/effectif-evolution.html [French, German, Italian] (accessed 10 June 2024)
[5] Federal Office of Public Health, Chiffres-clés des hôpitaux suisses, 2022. Available from: www.bag.admin.ch/cchs [French, German, Italian] (accessed 10 June 2024)
[6] Système de surveillance Sentinella. Available from: www.sentinella.ch [French, German] (accessed until 10 June 2024)
[7] Gnädinger M., Herzog L., Ceschi A. et al. Chronic conditions and multimorbidity in a primary care population: a study in the Swiss Sentinel Surveillance Network (Sentinella). Int. J. Public Health. 2018; 63(9): 1017-1026.
[8] Fedlex, Federal Act on Medicinal Products and Medical Devices (Therapeutic Products Act, TPA). Available from: https://www.fedlex.admin.ch/eli/cc/2001/422/en (accessed 10 June 2024)
[9] WHO AWaRe (access, watch, reserve) classification of antibiotics for evaluation and monitoring of use, 2023. IN: The selection and use of essential medicines 2023: Executive summary of the report of the 24th WHO Expert Committee on the Selection and Use of Essential Medicines, 24-28 April 2023. Geneva: World Health Organisation; 2023 (WHO/MHP/ HPS/EML/2023.04). Licence: CC BY-NC-SA 3.0 IGO.
13.2 Antimicrobial consumption in veterinary medicine
The information system for antibiotics in veterinary medicine (IS ABV) was set up in 2019 to collect sales and prescription data of antibiotics for animals in Switzerland. For sales data, all marketing authorisation holders deliver their data at least annually to the database. Concerning prescriptions, the notifications to IS ABV became mandatory in Switzerland in early 2019 for production animals, followed by companion animals in October 2019. Veterinarians must register all their prescriptions of antimicrobials to animals in the database, with detailed information about the animal (e.g. average weight, batch number, production type), the diagnosis, the prescription (e.g. preparation name, doses, dates, and treatment duration), and the farmer’s identification (for production animals only). Veterinarians can register four different types of prescriptions: individual animals (only possibility for companion animals), oral group therapies, non-oral group therapies, and delivery on stock. IS ABV is an integrated part of the StAR strategy and provides a wide range of actions and incentives at the veterinarian, farmer and owner levels to improve the use of antibiotics in Switzerland. IS ABV is constantly updated and improved in order to widen the potential impact of the database.
13.2.1 Sales of antimicrobials in veterinary medicine
The list of veterinary products which had or were granted marketing authorisation during the years under review in this report has been entered and maintained manually in the information system for antibiotics in veterinary medicine (IS ABV). Marketing authorisation holders regularly submit sales figures for their products to IS ABV. Products authorised for export only are excluded. They cannot be used in Switzerland and do not contribute to the development of resistance in Switzerland.
In IS ABV, the entry of each product consists of a unique identification number, the brand name, the ATCvet code, information on the authorised method of application and the target animal species. Pharmaceutical premixes are indicated separately. The entry additionally includes the number of sold “basic units” (e.g. vials [incl. volume], tablets, injectors, tubes or pouches/bags [incl. weight]).
Total volumes were then calculated by repeatedly multiplying the volume of active substance in each basic unit by the number of basic units sold. The volume of active substance contained in each product and each basic unit is recorded. In the case of antimicrobials declared in International Units, conversion factors according to the template of the European Surveillance of Veterinary Antimicrobial Consumption Project (ESVAC) of the European Medicines Agency [2] were used. Each marketing authorisation holder checked and approved their converted data, summarised by preparation and year. Finally, the data was assessed by Swissmedic before publication.
The routes of administration were selected to reflect those referred to in similar reports in other countries (France, ANSES, and United Kingdom, VMD): oral, parenteral, intramammary and topical/external. Another distinction possible is between “livestock,” “companion animals” and “mixed”, defined according to the marketing authorisations.
References
[1] WHO Collaborating Centre for Drug Statistics Methodology, Guidelines for ATCvet classification 2015. Oslo, 2014, http://www.whocc.no/atcvet
[2] European Medicines Agency, European Surveillance of Veterinary Antimicrobial Consumption, sales of veterinary antimicrobial agents in 31 European countries in 2019 and 2020; European Medicines Agency, 2021.
13.2.2 Prescriptions of antimicrobials in veterinary medicine
For veterinary practitioners, obligatory reporting of antibiotic prescriptions in the IS ABV database is possible via the practice software or a web-based IS ABV application. For reports of oral group therapies, the use of the webbased IS ABV application is mandatory. For veterinarians, reporting via the practice software has the advantage that the prescriptions only have to be recorded once in the veterinary practice or clinic. For the evaluation, however, this means that two reporting channels have to be taken into account, which is also a possible source of errors. Most veterinarians and veterinary clinics use the practice software reporting channel.
Furthermore, it was found that it is absolutely necessary for the reporting veterinarians to be able to check their prescription reports stored on the IS ABV server. Since May 2021, practices have been receiving regular feedback on the data they submit. Data quality is continuously updated via monthly feedback to veterinarians and continuous access for farmers to their consumption. Only veterinarians can update their own data on the IS ABV software. Since the implementation of this feedback, a reduction in the frequency of errors has been observed.
Ultimately, the responsibility for correct reporting to IS ABV lies with the veterinarian. IS ABV is constantly being improved to make the correct reporting of prescriptions as easy as possible.
A data-cleaning process was implemented in three steps that allowed the identification and subsequent exclusion of outliers. The first and second exclusion criteria are based on the median of the given amount per day and animal per antimicrobial class, preparation and group of production. Prescriptions with a given amount per day and animal above 15 times the median and/or the 99% percentile were excluded. Finally, all prescriptions were manually reviewed using a four eyes principle to exclude, if needed, evident errors in the database. Only penicillins, tetracyclines and sulfonamides were affected by the cleaning process. In total, 5118 prescriptions (0.3% of all prescriptions in 2023) were excluded for the analyses on the quantities of active substances.
13.3 Data on antibiotic resistance in human medicine
13.3.1 Data collection and resistance testing
ANRESIS (www.anresis.ch) collects and analyses anonymous antibiotic resistance data provided on a regular basis (weekly or monthly) by 37 Swiss clinical microbiology laboratories, distributed all over Switzerland. All laboratories providing data for this report are approved by Swissmedic and are enrolled in at least one external quality control program. Most laboratories use semi-automated systems, generally based on EUCAST guidelines. However, there are no mandatory Swiss guidelines for antibiotic resistance testing, and individual laboratories are free to use other guidelines than EUCAST. Resistance data are validated by the primary laboratories only, and not by ANRESIS.
In 2019, EUCAST changed the interpretation of the susceptibility category “I” from “intermediate” to “susceptible, increased dose,” and suggested reporting this category together with susceptible (“S”). In addition, breakpoints for several difficult-to-treat microorganisms have changed in a way that there is no susceptible category left at all. Due to these changes, ANRESIS decided to adapt its reporting as well, and now thoroughly reports percentages of resistant isolates (R). Changing breakpoints over time may affect the proportion of resistant isolates. This is always an important issue in S. pneumoniae, for which, in addition to changing breakpoints, different breakpoints are used for different types of infections.
13.3.2 Data processing
In contrast to most other surveillance systems, ANRESIS collects all antimicrobial resistance results from routine clinical diagnosis, i.e. the data set is restricted neither to invasive isolates nor to a predefined set of microorganisms. Nevertheless, all main analyses in this report were performed on isolates from blood cultures or cerebrospinal fluid only, to allow comparison with international data. For Salmonella spp. and Campylobacter spp., isolates from all materials (e.g., stool) were analysed. Additionally, for E. coli and S. aureus , data from outpatients (ambulatory physicians or hospital outpatient departments) for one analysis were included and labelled accordingly. Screening results and antibiotic resistance test results analysed by a reference laboratory are labelled specifically and are not included in this report. Isolates from foreign countries were excluded. Doubles were defined as identical microorganisms from the same patient during the same calendar year (i.e. only the first isolate per patient and calendar year was analysed). As patient identifiers are specific for individual laboratories only, it was not possible to exclude doubles if isolates from the same patient originated from different laboratories.
For this analysis, interpreted, qualitative data (SIR) from all samples as defined above were extracted from the ANRESIS database using the KNIME Analytics Platform. An isolate was considered resistant (R) to an antimicrobial agent when tested and interpreted as resistant in accordance with
Table 13. b: Antimicrobial resistance monitoring in livestock, 2022.
the breakpoint used by the local laboratory. An isolate was considered resistant to an antibiotic group if it was tested resistant to at least one antibiotic of this group. Multiresistance was analysed in accordance with the EARS-Net methodology, to allow comparability with European data. In most cases, quantitative resistance data were not provided by the laboratories and therefore could not be used in this report, although such data would be beneficial for the comparison of resistance testing results from different origins.
13.3.3 Statistical analyses
The Wilson score method was used for the calculation of the 95% confidence interval of proportions of resistant isolates. Independence between two factors (e.g. co-resistance in MRSA/MSSA or PNSP/PSSP, comparison of resistance rates in invasive and outpatient samples) was analysed by means of the Fisher Exact Test. Logistic regression was used for the analysis of trends. A p-value < 0.05 of the likelihood ratio test (G2) measuring the goodness of fit of the model and a p-value < 0.05 of a z-test for the predictor variable “time” (i.e. the years) were considered as significant and are represented by arrows. Statistical analyses were performed using R, version 4.1.2.
Table 13. c: Antimicrobial resistance monitoring in livestock, 2023.
13.4 Antimicrobial susceptibility testing of veterinary isolates and data analyses
13.4.1 Sampling of livestock at slaughterhouse and meat thereof
Stratified random samples were taken in 2022 and 2023 (Table 13. b and Table 13. c). Sampling was spread evenly throughout each year, based on a sampling plan established for meat inspections. Samples were collected at the two largest poultry slaughterhouses as well as at the four largest pig and five largest cattle slaughterhouses. Every slaughterhouse taking part in the program collected a number of samples proportional to the number of animals of the species slaughtered per year. This procedure ensured that at least 60% of all slaughtered animals belonging to the species in question were part of the sample. In 2022, samples were taken from 800 broiler flocks. Random cecum samples were taken from 10 broilers per flock and one pig or calf per slaughter batch. In 2023, 308 cecum samples and 310 nasal swab samples were collected from fattening pigs, and 306 cecum samples and 307 nasal swab samples from calves. Samples were sent to the national reference laboratory for antimicrobial resistance ZOBA, Vetsuisse Faculty, University of Bern, for further analyses.
For Salmonella , monitoring at slaughter is not feasible due to the very low prevalence of Salmonella spp. in Swiss livestock. Therefore, Salmonella isolates sent to ZOBA in 2022 and 2023 in connection with its function as a reference laboratory for Salmonella spp. at the primary production level were included in the monitoring (Table 13. b and Table 13. c). Most of these isolates were isolated from clinical material. For hens and turkeys, a small number of isolates derived from samples taken as part of the national Salmonella monitoring program in accordance with the articles 257 and 258 of the Epizootic Diseases Ordinance of 27 June 1995 (EzDO; SR 916.401).
In accordance with the European legislation, meat samples (min. 50 g) were taken from fresh, chilled, packed and untreated meat sold at the retail level. Samples were collected in all Swiss cantons throughout the year. The applied sampling scheme considered each canton’s population density and the market shares of the retailers. Moreover, the proportion of imported and domestically produced meat within each meat category was included in the sampling plan.
In 2022, 307 chicken meat samples (212 samples of Swiss origin and 95 of foreign origin) and, for the first time, 139 turkey meat samples (38 samples of Swiss origin and 101 of foreign origin) were taken at retail level. In 2023, 309 pork (all Swiss origin) and 308 beef samples (269 samples of Swiss origin, 39 samples of foreign origin) were collected (Table 13. b, Table 13. c).
In accordance with European legislation, in 2023, 59 fresh, chilled and untreated beef meat samples were taken at border control posts for the first time. The applied sampling scheme considered the import shares of the two border control posts for import of beef meat per third country.
13.4.2 Processing of samples from livestock at slaughterhouse and meat
Cecal samples from fattening pigs, calves and broilers were tested for Campylobacter spp. and indicator E. coli using direct detection methods. For Campylobacter spp. in broilers, modified charcoal cefoperazone deoxycholate agar (mCCDA) and Butzler agar were used. For Campylobacter spp. in pigs and calves, modified charcoal cefoperazone deoxycholate agar (mCCDA) was used. Indicator E. coli were isolated for all animal species and meat samples from border control posts using MacConkey agar. After appropriate incubation, suspicious colonies were transferred onto non-selective sheep blood agar plates. Identification of suspicious colonies was carried out by the direct transfer method, using matrix-assisted laser desorption/ionization time-of-flight mass spectroscopy (MALDI TOF MS) (Biotyper 3.0, Bruker Daltonics, Bremen, Germany) following the manufacturer’s recommendations.
Since 2019, MRSA have been isolated using the one-step enrichment method, following recommendations by the European reference laboratory for antimicrobial resistance (EURL, National Food Institute, Lyngby, Denmark). Confirmation of S. aureus was carried out by MALDI TOF MS (Biotyper 3.0, Bruker Daltonics, Bremen, Germany). The methicillin resistance gene mecA identification and determination of the clonal complex (CC) CC398 were carried out by multiplex real-time PCR, as previously published [1].
Since 2015, detection of ESBL/AmpC-producing E. coli and carbapenemase-producing E. coli and Klebsiella spp. has been carried out on cecal and meat samples according to the protocol of the European reference laboratory for antimicrobial resistance (EURL, The National Food Institute, Lyngby, Denmark). Samples were pre-enriched in a non-selective broth. After incubation, one loop of broth was plated onto MacConkey agar with 1 µg/ml cefotaxime. For carbapenemase-producing E. coli and Klebsiella spp., two different selective agar plates were used (CARBA agar plates and OXA-48 agar plates, BioMérieux Inc., Marcy l’Étoile, France). After appropriate incubation, suspicious colonies were transferred onto non-selective sheep blood agar plates. Suspected E. coli and Klebsiella spp. colonies
Table 13. d: Epidemiological cutoff values (ECOFFs) used for the interpretation of MIC data derived from isolates in samples from healthy animals at slaughterhouse and meat thereof (including Salmonella spp. from clinical samples).
/ Clavulanic acid
were identified by MALDI TOF MS (Biotyper 3.0, Bruker Daltonics, Bremen, Germany). Confirmation of ESBL/AmpC-producing E. coli and carbapenemase production was carried out phenotypically by MIC determination on EUVSEC2 plates (Trek Diagnostics Systems, Thermo Fisher, Scientific, UK) and the Carba blue test [2], respectively.
13.4.3 Antimicrobial susceptibility testing and data processing
Isolates were cryo-conserved in specific media at -80°C until susceptibility testing was performed. The minimal inhibitory concentration (MIC) of the antimicrobials was determined by broth microdilution in cation-adjusted Müller-Hinton with (for Campylobacter spp.) or without lysed horse blood, using Sensititre susceptibility plates (Trek Diagnostics Systems, Thermo Fisher, Scientific, UK) according to CLSI guidelines [3]. The MIC was defined as the lowest antimicrobial concentration at which no visible bacterial growth occurred.
The European Union recommends that antimicrobial resistance be monitored by the assessment of MIC values based on epidemiological cut-off (ECOFF) values. The ECOFF distinguishes between wild type and non-wild type MIC distributions of bacteria. Bacterial strains are considered microbiologically resistant if their MIC value is above the highest MIC value observed in the wild-type population of the bacteria (WT). ECOFFs are set and published by the Eu -
ropean Committee on Antimicrobial Susceptibility Testing (EUCAST). Interpretation of MICs followed the ECOFFs laid down in the European decision 2020/1729/EU (Table 13. d).
Microbiological resistance prevalence rates were described using the following terminology:
Minimal: <0.1 %
Very low: 0.1% to 1 %
Low: >1 % to 10 %
Moderate: >10 % to 20 %
High: >20 % to 50 %
Very high: >50 % to 70 %
Extremely high: >70 %
All data were transmitted to the database of the Federal Food Safety and Veterinary Office (FSVO) and further sent to the European Food Safety Agency (EFSA). All results are included in the annual European Union summary reports on antimicrobial resistance in zoonotic and indicator bacteria from humans, animals and food, published by the European Food Safety Authority and the European Centre for Disease Prevention and Control.
13.4.4 Collection of isolates from diseased animals
In 2019, an annual monitoring of antimicrobial resistance in veterinary pathogens was initiated by the Federal Food Safety and Veterinary Office (FSVO) and implemented at
Table 13. e: Antimicrobial resistance monitoring in veterinary pathogens, 2022.
the Swiss national reference laboratory for antimicrobial resistance: ZOBA. The sampling plans of 2022 and 2023 include pathogen/animal and indication combinations which are of relevance in veterinary medicine (Table 13. e, Table 13. f). All strains were isolated from clinical submissions of diseased animals by Swiss veterinary laboratories (university, cantonal, private) across Switzerland and sent to ZOBA.
13.4.5 Antimicrobial susceptibility testing and data processing
At ZOBA, re-identification of the bacterial species was performed by MALDI TOF MS (Biotyper 3.0, Bruker Daltonics, Bremen, Germany).
Isolates were cryo-conserved in specific media at -80°C until susceptibility testing was performed. The minimal inhibitory concentration (MIC) of the antimicrobials was determined by broth microdilution in cation-adjusted Müller-Hinton with (for fastidious bacteria) or without lysed horse blood, using customised Sensititre susceptibility plates (Trek Diagnostics Systems, Thermo Fisher Scientific, UK) according to CLSI guidelines [3]. The MIC was defined as the lowest antimicrobial concentration at which no visible bacterial growth occurred.
Isolates were classified as susceptible or resistant according to current clinical breakpoints published by the Clinical and Laboratory Standards Institute [3]. The clinical break-
point (CBP) relates primarily to the extent to which the pathogen may respond to treatment, by taking into account aspects of pharmacodynamics and pharmacokinetics as well as specific features of the host and the targeted organ. If no clinical breakpoints were available, current ECOFFs were used if appropriate (www.mic.eucast.org). When neither CBP nor ECOFF was available, MIC90 was calculated.
Minimal inhibitory concentrations are transmitted to the database of the Swiss Centre for Antimicrobial Resistance (ANRESIS), which is a nationwide system for resistance data for both human and veterinary medicine (www.anresis.ch)
References
[1] Stegger M et al. Rapid PCR detection of Staphylococcus aureus clonal complex 398 by targeting the restriction-modification system carrying sau1-hsdS1. J Clin Microbiol, Febr. 2011, p. 732–734.
[2] Poirel L, Nordmann P. Rapidec Carba NP test for rapid detection of carbapenemase producers. J Clin Microbiol. 2015;53(9):3003–3008.
[3] CLSI. Performance standards for antimicrobial disk and dilution susceptibility tests for bacteria isolated from animals. CLSI supplement VET01S. Wayne, PA: Clinical and Laboratory Standards Institute
Table 13. f: Antimicrobial resistance monitoring in veterinary pathogens, 2023.
13.5 Monitoring of antibiotics in wastewater, surface water and groundwater
In wastewater, 13 antibiotics and one metabolite were measured from 2018 to 2022 in the influent and effluent of WWTPs in monitoring campaigns by i) the WWTP performance surveillance that is required after an upgrade [1], ii) the cantons FR, NE, SG, SH, VD, VS and ZH [2,3] or iii) Eawag, the Swiss Federal Institute of Aquatic Science and Technology [4,5]. Samples (24h-, 48h- or 168h-composite samples) were collected at 139 municipal WWTPs, of which 15 were equipped with an additional treatment step for the elimination of micropollutants. The removal of the different antibiotics presented in Table 11. a (Chapter 11.2), for both biological and advanced wastewater treatments, was summarised in a recent study [6].
Surface waters are regularly analysed within the National Surface Water Quality Monitoring NAWA, which is operated by the Federal Office for the Environment (FOEN) and the cantonal authorities. Since 2018, NAWA monitors micropollutants, including selected antibiotics (azithromycin, clarithromycin, erythromycin, sulfamethazine, sulfamethoxazole, trimethoprim). In 2022, additional antibiotics, such as clindamycin, were included in the NAWA monitoring. Data for 18 antibiotics and four metabolites are available for 50 different monitoring sites for the years 2018 to 2022. The monitoring sites are mainly located on the Swiss Plateau and cover different land use types and sources of micropollutants. Refrigerated 2-week composite samples are collected continuously throughout the year.
Groundwater has been monitored for antibiotics by National Groundwater Monitoring NAQUA since 2013. NAQUA is operated by the FOEN in close collaboration with the cantonal authorities [7]. It comprises approximately 550 groundwater monitoring sites, representing different typical hydrogeological settings and anthropogenic pressures. 135 of these NAQUA monitoring sites are located close to rivers and are more or less impacted by infiltrating river water. The most important groundwater contaminants, including the sulfonamide antibiotic sulfamethoxazole, are monitored on a long-term basis at the national scale. At each monitoring site, one to four grab samples are analysed every year.
References
[1] Wunderlin P., R. Gulde, J. Bosshard (2024). MV aus dem häuslichen Abwasser entfernen. Erkenntnisse aus sieben Jahren Überprüfung des Reinigungseffekts. Aqua & Gas, 1: 46-53.
[2] Kovalova L., O. Jäggi, C. Götz, P. Dell’Ava, D. Rensch, R. Gulde and E. Durisch-Kaiser (2021). Mikroverunreinigungen. Messkampagne zu Belastungen aus Industrie und Gewerbe. Kanton Zürich. Baudirektion. Amt für Abfall, Wasser, Energie und Luft (AWEL).
[3] Direction générale de l’environnement (DGE) (2021). Micropolluants dans les stations d’épuration vaudoises. Direction de l’environnement industriel, urbain et rural (DIREV), Division protection des eaux (DGEPRE), Section épuration urbaine. Canton de Vaud.
[4] Anliker S., M. Loos, R. Comte, M. Ruff, K. Fenner and H. Singer (2020). Assessing Emissions from Pharmaceutical Manufacturing Based on Temporal High-Resolution Mass Spectrometry Data. Environmental Science & Technology 54 (7), 4110-4120
[5] Bosshard J., F. Eugster, R. Gulde and H. Singer (2024). Abwasser aus der Formulierung von Arzneimitteln. Wirkstoffeinträge in Schweizer Gewässer. Aqua & Gas, 3: 50-57.
[6] Luong, K. N. T., E. Anthamatten, C.S. McArdell, (2024) “Removal of Micropollutants in Wastewater Treated with Powdered Activated Carbon”. In preparation.
[7] FOEN. Federal Office for the Environment (2024a). NAQUA National Groundwater Monitoring. https://www.bafu.admin.ch/bafu/en/home/topics/water/info-specialists/state-of-waterbodies/ state-of-groundwater/naqua-national-groundwater-monitoring.html
Abbreviations
14 Abbreviations
ACB Acinetobacter calcoaceticusAcinetobacter baumannii complex
AFSSA French Food Safety Agency
AGISAR Advisory Group on Integrated Surveillance of Antimicrobial Resistance
AMR Antimicrobial resistance
AMC Antimicrobial consumption
AmpC AmpC-beta-lactamase
ANRESIS Swiss Centre for Antibiotic Resistance
ARB Antibiotic-resistant bacteria
ARG Antibiotic resistance gene
AST Antimicrobial susceptibility testing
ATC Anatomical Therapeutic Chemical
AWARE Access, Watch and Reserve antibiotic categories as defined by the WHO Expert Committee on Selection and Use of Essential Medicines
CAESAR Central Asian and Eastern European Surveillance on Antimicrobial Resistance
CC Clonal complex
CI Confidence interval
CLSI Clinical & Laboratory Standards Institute
CPE Carbapenemase-producing Enterobacterales
CSF Cerebrospinal fluid
CTX Cefotaxime
DCDvet Defined course doses for animals
DD Disc diffusion
DDD Defined daily dose
DDDvet Defined daily dose for animals
DID Defined daily dose per 1,000 inhabitants and per day
EARSS European Antimicrobial Resistance Surveillance System
ECCMID European Congress of Clinical Microbiology and Infectious Diseases
ECDC European Centre for Disease Prevention and Control
ECOFF Epidemiological cut-off value
EEA European Economic Area
EFSA European Food Safety Authority
EMA European Medicines Agency
EphMRA European Pharmaceutical Market Research Association
ESAC-Net European Surveillance of Antimicrobial Consumption Network
ESBL Extended-spectrum beta-lactamase
ESCR Extended-spectrum cephalosporin resistance
ESVAC European Surveillance of Veterinary Antimicrobial Consumption
EU European Union
EUCAST European Committee on Antimicrobial Susceptibility Testing
EzDO Epizootic Diseases Ordinance
FAO Food and Agriculture Organisation
FOAG Federal Office for Agriculture
FOEN Federal Office for the Environment
FOPH Federal Office of Public Health
FSVO Federal Food Safety and Veterinary Office
GP General practitioner
GSASA Swiss Association of Public Health Administration and Hospital Pharmacists
HLR High-level resistance
ICU Intensive care unit
ISO International Organisation for Standardization
IS ABV Information System for Antibiotic in Veterinary Medicine
LA-MRSA Livestock-associated MRSA
LMA Potassium-aluminum sulfate
LOD Limit of detection
LOQ Limit of quantification
LPS Lipopolysaccharide
MALDI TOF MS Matrix-assisted laser desorption/ ionization time-of-flight mass spectroscopy
mCCDA Modified charcoal cefoperazone deoxycholate agar
mcr Plasmid-mediated colistin resistance
MDR Multidrug resistant
MIC Minimal inhibitory concentration
MIC90 Minimal inhibitory concentration required to inhibit the growth of 90% of the isolates tested
MLST Multilocus sequence typing
MRSA Methicillin-resistant Staphylococcus aureus
MRSP Methicillin-resistant Staphylococcus pseudintermedius
MSM Men who have sex with men
MSSA Methicillin-susceptible Staphylococcus aureus
NAQUA National Groundwater Monitoring
NARA National Reference Centre for the Early Detection and Monitoring of Antibiotic Resistance
NAWA National Surface Water Quality Monitoring Network
NRP National research programme
PAC Powdered activated carbon
PBP Penicillin-binding protein
PCU Population correction unit
PCR Polymerase chain reaction
PNSP Penicillin-non-susceptible Streptococcus pneumoniae
PSSP Penicillin-susceptible Streptococcus pneumoniae
PVL Panton-Valentine Leukocidin
SFSO Swiss Federal Statistical Office
SIB Swiss Institute of Bioinformatics
SIR Susceptible – Susceptible, increased exposure – Resistant
SNF Swiss National Science Foundation
SNP Single-nucleotide polymorphism
spp. Species
SSI Swiss Society of Infectious Diseases
SSM Swiss Society for Microbiology
StAR Swiss Strategy on Antibiotic Resistance
SVGW Swiss association of the gas and water industry
URTI Upper respiratory tract infection
UTI Urinary tract infection
VetCAST EUCAST Veterinary Subcommittee on Antimicrobial Susceptibility Testing
VMD Veterinary Medicines Directorate Center for Zoonoses, Animal Bacterial Diseases and Antimicrobial Resistance
VRE Vancomycin-resistant enterococci
WGS Whole genome sequencing
WHO World Health Organisation
WOAH World Organisation for Animal Health
WWTP Wastewater treatment plant
ZOBA Center for Zoonoses, Animal Bacterial Diseases and Antimicrobial Resistance
Rifampicin-isoniazid
Rifampicin-isoniazid-pyrazinamide
Rifampicin-isoniazid-pyrazinamideethambutol
Index of figures, tables and infoboxes
16 Index Figures
40 Figure 4. a: Total (hospital and outpatient care together) antibiotic consumption expressed in DDD per 1000 inhabitants per day, Switzerland, 2014–2023 (ATC code J01).
41 Figure 4. b: Total (hospital and outpatient care together) antibiotic consumption expressed in DDD per 1000 inhabitants per day by linguistic region, Switzerland, 2014–2023 (ATC code J01).
41 Figure 4. c: Total (hospital and outpatient care together) antibiotic consumption according to the AWaRe categorization of the WHO, Switzerland compared to EU/EEA countries, 2022 (ATC codes A07AA, J01, J04A, P01AB). The WHO recommends a country-level target of at least 60% of total antibiotic consumption being Access group antibiotics (black line).
42 Figure 4. d: Antibiotic consumption expressed in DDD per 100 bed-days in hospitals contributing to ANRESIS by hospital size in the entire hospital (a) and intensive care unit only (b), 2014–2023 (ATC code J01).
43 Figure 4. e: Inpatient antibacterial consumption in Switzerland and in linguistic regions compared to EU/EEA countries, epxressed in DDD per 1000 inhabitants per day, 2022.
44 Figure 4. f: Distribution of the antibiotic consumption per antibiotic class in hospitals contributing to ANRESIS, 2023 (ATC group J01).
46 Figure 4. g: Inpatient consumption of antibiotics expressed in DDD per 100 bed-days in hospitals contributing to ANRESIS by linguistic region, 2014–2023 (see Chapter 4.2.2.).
49 Figure 4. h: Total antibacterial consumption in Switzerland and in linguistic regions compared to EU/EEA countries in the outpatient setting, expressed in DDD per 1000 inhabitants per day, 2022.
49 Figure 4. i: Distribution of the antibiotic consumption per antibiotic class in the outpatient setting in 2023, Switzerland (ATC group J01).
50 Figure 4. j: Antibiotic classes per indication as a number of prescriptions per 1000 consultations issued by practitioners from general and internal medicine and paediatricians, 2018–2023.
52 Figure 4. k: Percentage of antibiotic prescriptions per indication for general practitioners (A) and pediatricians (B), 2023.
68 Figure 5. a: Antimicrobial sales for livestock animals between 2014 and 2023 compared to the population biomass (total PCU) and the sales of active ingredients per PCU.
69 Figure 5. b: Sales of antimicrobials (in kg) licenced for intramammary use between 2014 and 2023, separated into dry cow products and products for use during lactation.
72 Figure 5. c: Total number of prescriptions per prescription type for livestock in Switzerland (2020–2023).
73 Figure 5. d: Number of animal treatments per 1000 animals for livestock species in Switzerland (2020–2023).
73 Figure 5. e: Distribution of the total antibiotic consumption per antibiotic class and livestock species in Switzerland (2020–2023).
74 Figure 5. f: Percentage of animal treatments per indication for livestock species in Switzerland (2020–2023).
75 Figure 5. g: Distribution of the total antibiotic consumption per antibiotic class and companion animal species in Switzerland (2020–2023).
76 Figure 5. h: Percentage of animal treatments per indication for companion animals in Switzerland (2020–2023).
81 Figure 6. a: Resistance rates in invasive Escherichia coli isolates in humans between 2014 and 2023.
81 Figure 6. b: Comparison of resistance rates (%) in invasive versus outpatient urinary samples in Escherichia coli isolates in humans for 2023.
83 Figure 6. c: Multiresistance in invasive E. coli isolates in humans between 2014 and 2023 (for details refer to Table 6. b).
84 Figure 6. d: Resistance rates in invasive Klebsiella pneumoniae isolates in humans 2014–2023.
85 Figure 6. e: Multiresistance in invasive K. pneumoniae isolates in humans from 2014–2023 (for details refer to Table 6. d).
86 Figure 6. f: Resistance rates in invasive Pseudomonas aeruginosa isolates in humans 2014–2023.
87 Figure 6. g: Multiresistance in invasive Pseudomonas aeruginosa isolates in humans between 2014 and 2023 (for details refer to Table 6. f).
89 Figure 6. h: Resistance rates of invasive Acinetobacter spp. isolates in humans between 2014 and 2023.
89 Figure 6. i: Multiresistance in invasive Acinetobacter spp. isolates in humans between 2014 and 2023 (for details refer to Table 6.h).
91 Figure 6. j: Resistance rates (%) in invasive PSSP (penicillin-susceptible isolates) and PNSP (penicillin non-susceptible isolates) in humans in 2023.
91 Figure 6. k: Resistance rates of invasive Streptococcus pneumoniae isolates in humans between 2014 and 2023.
93 Figure 6. l: Resistance rates of invasive Enterococcus faecalis and Enterococcus faecium isolates in humans between 2014 and 2023.
95 Figure 6. m: Resistance rates (%) of invasive MRSA (methicillin-resistant Staphylococcus aureus ) and MSSA (methicillin-susceptible Staphylococcus aureus) isolates in humans 2023.
95 Figure 6. n: Comparison of resistance rates (%) in invasive versus outpatient wound/abscess samples in Staphylococcus aureus in humans in 2023.
96 Figure 6. o: Resistance rates of invasive Staphylococcus aureus isolates in humans between 2014 and 2023.
110 Figure 7. a: Trends in ciprofloxacin, erythromycin, gentamicin and tetracycline resistance in Campylobacter coli from broiler between 2014 and 2022 (N = total number of tested isolates; values for 2015, 2017, 2019 and 2021 interpolated [n/a]).
111 Figure 7. b: Resistance pattern in Campylobacter coli from broiler 2022.
111 Figure 7. c: Resistance pattern in Campylobacter jejuni from broiler 2022.
112 Figure 7. d: Trends in ciprofloxacin, erythromycin, gentamicin and tetracycline resistance in Campylobacter jejuni from broiler between 2014 and 2022 (N = total number of tested isolates; values for 2015, 2017, 2019 and 2021 interpolated [n/a]).
113 Figure 7. e: Resistance pattern in Campylobacter jejuni from slaughter calves 2023.
113 Figure 7. f: Trends in resistance to fluoroquinolones and macrolides in Campylobacter coli and Campylobacter jejuni from human clinical isolates in Switzerland between 2014 and 2023.
114 Figure 7. g: Trends in chloramphenicol, ciprofloxacin, ertapenem, erythromycin, gentamicin and tetracycline resistance in Campylobacter coli from fattening pigs between 2014 and 2023 (N= total number of tested isolates; values for 2014, 2016, 2018, 2020 and 2022 are interpolated [n/a]).
115 Figure 7. h: Resistance pattern in Campylobacter coli from fattening pigs 2023.
116 Figure 7. i: Trends in chloramphenicol, ciprofloxacin, ertapenem, erythromycin, gentamicin and tetracycline resistance in Campylobacter jejuni from slaughter calves 2021 and 2023 (N= total number of tested isolates; values for 2022 are interpolated [n/a]).
119 Figure 7. j: Resistance pattern in Salmonella spp. from hen for 2020 and 2022.
119 Figure 7. k: Resistance pattern in Salmonella spp. from cattle for 2021 and 2023.
119 Figure 7. l: Trends in resistance to aminopenicillins. ceftriaxone, fluoroquinolones and trimethoprim-sulfamethoxazole in non-typhoidal Salmonella (serovars Typhimurium and Enteritidis combined) from human clinical isolates in Switzerland between 2014 and 2023.
126 Figure 8. a: Trends in antibiotic resistance in indicator Escherichia coli from broiler between 2012 and 2022 (N = total number of tested isolates, values for 2015 , 2017, 2019 and 2021 interpolated [n/a]between 2014 and 2022 (N = total number of tested isolates; values for 2015, 2017, 2019 and 2021 interpolated [n/a]).
127 Figure 8. b: Resistance pattern in indicator Escherichia coli from broiler, 2022.
130 Figure 8. c: Trends in antibiotic resistance in indicator Escherichia coli from fattening pigs between 2014 and 2023 (N = total number of tested isolates, values for 2014, 2016, 2018, 2020 and 2022 interpolated [n/a]).
130 Figure 8. d: Resistance pattern in indicator Escherichia coli from fattening pigs, 2023.
132 Figure 8. e: Trends in antibiotic resistance in indicator Escherichia coli from slaughter calves between 2014 and 2023 (N=total number of tested isolates, values for 2014, 2016, 2018, 2020 and 2022 interpolated [n/a]).
132 Figure 8. f: Resistance pattern in indicator Escherichia coli from slaughter calves, 2023.
134 Figure 8. g: Prevalence of ESBL/AmpC-producing Escherichia coli from broilers between 2014 and 2022 (N = total number of tested isolates, values for 2015, 2017, 2019 and 2021 interpolated [n/a].
135 Figure 8. h: Prevalence of ESBL/AmpC producing Escherichia coli from fattening pigs between 2014 and 2023 (N = total number of tested isolates, values for 2014, 2016, 2018, 2020 and 2022 interpolated [n/a].
137 Figure 8. i: Prevalence of ESBL/AmpC producing Escherichia coli from slaughter calves between 2014 and 2023 (N = total number of tested isolates, values for 2014, 2016, 2018, 2020 and 2022 interpolated [n/a].
142 Figure 8. j: Prevalence of MRSA from fattening pigs between 2014 and 2023 (N = total number of tested isolates, values for 2014, 2016, 2018, 2020 and 2022 interpolated [n/a].
143 Figure 8. k: Prevalence of MRSA from slaughter calves between 2014 and 2023 (N = total number of tested isolates, values for 2014, 2016, 2018, 2020 and 2022 interpolated [n/a].
153 Figure 9. a: Trends in prevalence of ESBL/AmpC producing Escherichia coli in chicken meat between 2014 and 2022 (N= total number of tested isolates; values for 2015, 2017, 2019 and 2021 interpolated [n/a]).
162 Figure 10. a: Trends in antimicrobial non-susceptibility in Escherichia coli from diseased hens between 2019 and 2023 (N=total number of tested isolates).
165 Figure 10. b: Trends in antimicrobial non-susceptibility in Staphylococcus pseudintermedius from diseased dogs between 2019 and 2023 (N=total number of tested isolates).
166 Figure 10. c: Trends in antimicrobial non-susceptibility in Escherichia coli from canine urogenital tract infections between 2019 and 2023 (N=total number of tested isolates).
167 Figure 10. d: Trends in antimicrobial non-susceptibility in Escherichia coli from feline urogenital tract infections between 2019 and 2023 (N=total number of tested isolates).
180 Figure 11. a: Antibiotics (2018–2022) in the wastewater influent to WWTPs (-In), effluent of conventional WWTPs (-Out), effluent of WWTPs equipped to abate micropollutants (-Out MP) and surface water (SW). Boxes represent 50% of the concentrations and the white line their median value. The number of detections (n > limit of quantification, LOQ) are indicated above.
181 Figure 11. b: Clarithromycin concentrations in two watercourses from 2018 to 2022: Furtbach (ZH, left) and Landgrabe (SH, right). The red line indicates EQS value of 0.12 µg/L fixed in the Water Protection Ordinance (WPO, Annex 2). The arrow in Figure 11. b (left) indicates the implementation of an additional ozone treatment in one WWTP in the Furtbach catchment. Two-week composite samples were taken from 2018 to 2022 without interruption. Missing concentrations indicate concentrations below the limit of quantification of 0.02 µg/L (Furtbach) or 0.03/0.04 µg/L (Landgrabe).
193 Figure 12. a: Detection and potential dissemination routes of plasmid-mediated OXA-48 carbapemenase containing Enterobacterales in different human, animal and environmental settings. Blue arrows indicate that transfer of CPE has been demontrated; orange arrows indicate highly possible routes of transmission; red arrows indicate future possible transmission route of CPE. Illustration was created by V.P. and adapted for publication by the publisher.
45 Table 4. a: Consumption of antibiotic classes expressed in DDD per 100 bed-days in hospitals contributing to ANRESIS, Switzerland (2014–2023).
48 Table 4. b: Consumption of antibiotic classes expressed in DDD per 1000 inhabitants per day in the outpatient setting, Switzerland (2014–2023).
66 Table 5. a: Sales (kg) of antibiotic classes between 2014 and 2023.
67 Table 5. b: Sales (kg) of antimicrobials according to the administration route between 2014 and 2023.
68 Table 5. c: Sales (kg) of different antibiotic classes licenced for livestock animals between 2014 and 2023.
69 Table 5. d: Sales (kg) of antimicrobials licenced as premixes between 2014 and 2023, according to antibiotic classes.
70 Table 5. e: Sales (kg) of antimicrobials licenced for intramammary use between 2014 and 2023 according to antibiotic class.
70 Table 5. f: Sales (kg) of antibiotic classes licenced for companion animals between 2014 and 2023.
80 Table 6. a: Resistance rates of invasive Escherichia coli isolates in humans in 2023.
82 Table 6. b: Resistance combinations in invasive E. coli isolates in humans 2023. Only isolates tested against all five antibiotic groups (aminopenicillins, third-generation cephalosporins, carbapenems, aminoglycosides, fluoroquinolones) were considered (n=4823/6595[73.1%]).
84 Table 6. c: Resistance rates of invasive Klebsiella pneumoniae isolates in humans in 2023.
85 Table 6. d: Resistance combinations in invasive K. pneumoniae isolates in humans in 2023. Only isolates tested against all four antibiotic groups (third-generation cephalosporins, carbapenems, aminoglycosides, fluoroquinolones) were considered (n= 1427/1596 [89.4%]).
86 Table 6. e: Resistance rates of invasive Pseudomonas aeruginosa isolates in humans 2023.
87 Table 6. f: Resistance combinations in invasive P. aeruginosa isolates in humans in 2023. Only isolates tested against all five antibiotics or antibiotic groups (piperacillin-tazobactam, cefepime, carbapenems, aminoglycosides, ciprofloxacin) were considered (n= 659/805 [81.9%]).
88 Table 6. g: Resistance rates of invasive Acinetobacter spp. isolates in humans for 2023.
89 Table 6. h: Resistance combinations in invasive Acinetobacter spp. isolates in humans in 2023. Only isolates tested against all three antibiotic groups (aminoglycosides, ciprofloxacin and carbapenems) were considered (n= 97/118 [82.2%]).
90 Table 6. i: Resistance rates of invasive Streptococcus pneumoniae isolates in humans in 2023.
92 Table 6. j: Resistance rates of invasive Enterococcus faecalis and Enterococcus faecium isolates in humans in 2023.
94 Table 6. k: Resistance rates of invasive Staphylococcus aureus isolates in humans in 2023.
114 Table 7. a: Resistance rates in C. coli and C. jejuni from human clinical isolates in 2023.
117 Table 7. b: Non-susceptibility combinations in Salmonella spp. from hens in 2022.
117 Table 7. c: Non-susceptibility combinations in Salmonella spp. from turkey in 2022.
118 Table 7. d: Non-susceptibility combinations in Salmonella spp. from cattle in 2023.
118 Table 7. e: Resistance rates in Salmonella from human clinical isolates in 2023.
128 Table 8. a: Non-susceptibility combinations in indicator Escherichia coli in broilers in 2022.
129 Table 8. b: Non-susceptibility combinations in indicator Escherichia coli in fattening pigs in 2023.
131 Table 8. c: Non-susceptibility combinations in indicator Escherichia coli in slaughter calves in 2023.
133 Table 8. d: Non-susceptibility combinations in ESBL/AmpC producing Escherichia coli in broilers in 2022.
136 Table 8. e: Non-susceptibility combinations in ESBL/AmpC producing Escherichia coli in fattening pigs in 2023.
138 Table 8. f: Non-susceptibility combinations in ESBL/AmpC producing Escherichia coli in slaughter calves in 2023.
141 Table 8. g: Number of carbapenem-resistant Escherichia coli (since 2015) and Klebsiella spp. (since 2020) in cecal samples from livestock, 2015–2023.
144 Table 8. h: Non-susceptibility combinations in MRSA in fattening pigs in 2023.
145 Table 8. i: Non-susceptibility combinations in MRSA in slaughter calves in 2023.
152 Table 9. a: Number of ESBL/AmpC producing Escherichia coli positive samples of chicken meat by origin in 2022.
154 Table 9. b: Non-susceptibility combinations of ESBL/AmpC producing Escherichia coli in chicken meat, 2022.
155 Table 9. c: Number of ESBL/AmpC producing Escherichia coli positive samples of turkey meat by origin in 2022.
156 Table 9. d: Non-susceptibility combinations of ESBL/AmpC producing Escherichia coli in turkey meat, 2022.
157 Table 9. e: Number of ESBL/AmpC producing Escherichia coli positive samples of Swiss pork meat taken at retail in 2015, 2017, 2019, 2021 and 2023.
157 Table 9. f: Number of ESBL/AmpC producing Escherichia coli positive samples of beef meat taken at retail by origin in 2023.
157 Table 9. g: Non-susceptibility combinations in indicator Escherichia coli from beef meat taken at border control posts in 2023.
158 Table 9. h: Number of ESBL/AmpC producing Escherichia coli positive samples of beef meat taken at border control posts by origin in 2023.
158 Table 9. i: Number of carbapenem-resistant Escherichia coli (since 2015) and Klebsiella spp. (since 2020) in meat, 2015–2023.
164 Table 10. a: Non-susceptibility rates of coagulase-negative staphylococci in bovine mastitis for 2022 and 2023.
164 Table 10. b: Non-susceptibility rates of Streptococcus dysgalactiae from bovine mastitis for 2022 and 2023.
164 Table 10. c: Non-susceptibility rates of Trueperella pyogenes from bovine mastitis for 2022 and 2023.
168 Table 10. d: Antimicrobial resistance monitoring programm in veterinary pathogens 2024–2028.
177 Table 11. a: Antibiotics in municipal wastewater effluents in Switzerland from 2018 to 2022. Concentration range and median values are shown: First quartile (Q25, value under which 25% of data points are found), median (Q50, value under which 50% of data points are found) and third quartile (Q75, value under which 75% of data points are found). Removal in biological and advanced treatment (ozonation or activated carbon treatment) are classified as poor = 20-50%; good = 50-80%; very good = 80-100%. LOQ: limit of quantification.
178 Table 11. b: Antibiotics in surface water in Switzerland from 2018 to 2022. Concentration range and median values are shown: First quartile (Q25, value under which 25% of data points are found), median (Q50, value under which 50% of data points are found) and third quartile (Q75, value under which 75% of data points are found). LOQ: limit of quantification.
179 Table 11. c: Antibiotics in groundwater in Switzerland from 2018 to 2022. Concentration range and median values are shown: First quartile (Q25, value under which 25% of data points are found), median (Q50, value under which 50% of data points are found) and third quartile (Q75, value under which 75% of data points are found). LOQ: limit of quantification.
200 Table 13. a: Number of hospitals and intensive care units contributing to ANRESIS, 2014–2023.
204 Table 13. b: Antimicrobial resistance monitoring in livestock, 2022.
205 Table 13. c: Antimicrobial resistance monitoring in livestock, 2023.
207 Table 13. d: Epidemiological cutoff values (ECOFFs) used for the interpretation of MIC data derived from isolates in samples from healthy animals at slaughterhouse and meat thereof (including Salmonella spp. from clinical samples).
208 Table 13. e: Antimicrobial resistance monitoring in veterinary pathogens, 2022.
209 Table 13. f: Antimicrobial resistance monitoring in veterinary pathogens, 2023.
Infoboxes
55 Figure I: Antibiotics shortages over the period 2016–2023, as a number of products from ATC Code J01 [1].
56 Figure II: Analysis of monthly antibiotic consumption for A) all antibiotics for systemic use (ATC code J01) and B) broad-spectrum antibiotics only, for the entire hospital and ICUs between 01/2019 and 06/2021. The solid line shows the estimates of the segmented regression model. The dashed line shows a counterfactual scenario in which the COVID-19 pandemic has not occurred. ICU, intensive care unit; 1st w, 1st wave; Int., intermediate periods; 2nd w, 2nd wave.
57 Figure III: Analysis of monthly antibiotic sales data by linguistic region in DDD per 1000 inhabitants per day over the period 2018–2023.
58 Figure IV: ESCR E. coli (A) and K. pneumoniae (B) BSI incidence in the two different linguistic regions of Switzerland and estimates from a quasi-Poisson model (solid lines). The dashed line shows a counterfactual scenario in which the COVID-19 pandemic has not occurred. The phase from the onset of the pandemic is highlighted in grey.
60 Figure V: Proportion of antibiotic prescriptions not recommended by clinical indication, Sentinella data, 2019–2022.
62 Figure VI: indications for antimicrobial use, stratified by year and survey participation.
63 Figure VII: Diagnoses for antimicrobial use, stratified by year and survey participation.
99 Figure VIII: AMR trends for Campylobacter jejuni. Antibiotic resistance (% of resistant samples) according to year. Error bars indicate 95% confidence intervals.
100 Figure IX: AMR trends for non-typhoidal Salmonella. Antibiotic resistance (% of resistant samples) according to year. Error bars indicate 95% confidence intervals.
102 Figure X: Clostridioides difficile incidence trajectory per 10,000 person-days, 2008–2021 (left hand axis), and antibiotic consumption in total DDD/100 person-days (right hand axis, blue bars, individual departments summed up); yearly incidence shown as circles with error bars for 95% confidence intervals; line of best fit shown in blue (solid), with 95% confidence interval shaded.
103 Figure XI: Overall Clostridioides difficile incidence plotted against weighted median yearly antibiotic consumption per department 100 person-days, considering all study antibiotics (2008–2021); size of bubble is proportional to the number of person-days; weighted line of best fit shown in light-blue, dashed.
105 Figure XII: K. pneumoniae producing the carbapenemase NDM-1, the extended-spectrum ß-lactamases (ESBL) CTX-M-15, and the ArmA 16S rRNA methylase.
123 Figure XIII: SPSP consortium.
184 Figure XIV: Environmental Quality Standards (EQS) and Predicted No-Effect Concentrations for resistance selection (PNECres) compared to environmental concentrations of the antibiotics azithromycin, clarithromycin, erythromycin, sulfamethazine, sulfamethoxazole and trimethoprim measured in Swiss surface water between 2018 and 2022.
187 Figure XV: Temporal trends in the percentage of Escherichia coli resistant to beta-lactam antibiotics over total E. coli across various wastewater treatment plants in Switzerland (November 2021–April 2024). The map in the centre displays the locations of the seven wastewater treatment plants (WWTPs) analysed: ARA Chur, ARA Altenrhein, ARA Werdhölzli Zürich, IDA CDA Lugano, STEP d'Aïre Genève, and ARA Sensetal Laupen. The graphs surrounding the map show the temporal trends in the percentage of E. coli resistant to beta-lactam antibiotics at each respective WWTP. Each graph plots the percentage of resistant E. coli isolates (y-axis) over time (x-axis), with individual data points represented by black dots. The smoothed trend lines indicate the overall direction of resistance trends, with shaded areas representing confidence intervals. The population served by each WWTP (in thousands) is indicated in the lower right corner of each graph.
197 Figure XVI: Comparison of population biomass-corrected consumption of antimicrobials (milligram per kilogram estimated biomass) in humans and food-producing animals in 2023.