Q4-2023
Manhattan, NY Sales
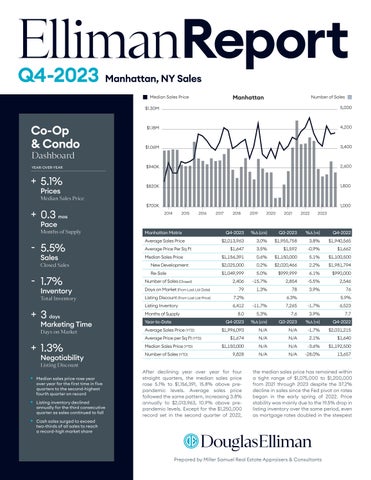
• Median sales price rose year over year for the first time in five quarters to the second-highest fourth quarter on record
• Listing inventory declined annually for the third consecutive quarter as sales continued to fall
• Cash sales surged to exceed two-thirds of all sales to reach a record-high market share
After declining year over year for four straight quarters, the median sales price rose 5.1% to $1,156,391, 15.8% above prepandemic levels. Average sales price followed the same pattern, increasing 3.8% annually to $2,013,963, 10.9% above prepandemic levels. Except for the $1,250,000 record set in the second quarter of 2022,
the median sales price has remained within a tight range of $1,075,000 to $1,200,000 from 2021 through 2023 despite the 37.2% decline in sales since the Fed pivot on rates began in the early spring of 2022. Price stability was mainly due to the 19.5% drop in listing inventory over the same period, even as mortgage rates doubled in the steepest
Co-Op & Condo 5.1% Prices Median Sales Price 0.3 mos Pace Months of Supply 5.5% Sales Closed Sales 1.7% Inventory Total Inventory 3 days Marketing Time Days on Market 1.3% Negotiability Listing Discount
+ ++ + Dashboard YEAR-OVER-YEAR
Report
Prepared by Miller Samuel Real Estate Appraisers & Consultants $700K $820K $940K $1.06M $1.18M $1.30M 2023 2022 2021 2020 2019 2018 2017 2016 2015 2014 1,000 1,800 2,600 3,400 4,200 5,000 0 5 10 15 20 25 0% 8% 16% 24% 32% 40% 2023 2022 2021 2020 2019 2018 2017 2016 2015 2014 0 6 12 18 24 30 $10M+ $5M-$9.99M $3M-$4.99M $2M-$2.99M 1.5M-$1.99M $1M-$1.49M $500K-$999K <$500K 7.4 Month Rate, 10-Year Average Manha an Number of Sales Median Sales Price Manha an % Market Sold Above Last List Price Months of Supply Condo Co-Op Months of Supply Manha an Number of Sales Median Sales Price Manha an Co-Op Manhattan Matrix Q4-2023 %∆ (qtr) Q3-2023 %∆ (yr) Q4-2022 Average Sales Price $2,013,963 3.0% $1,955,758 3.8% $1,940,565 Average Price Per Sq Ft $1,647 3.5% $1,592 -0.9% $1,662 Median Sales Price $1,156,391 0.6% $1,150,000 5.1% $1,100,500 New Development $2,025,000 0.2% $2,020,466 2.2% $1,981,794 Re-Sale $1,049,999 5.0% $999,999 6.1% $990,000 Number of Sales (Closed) 2,406 -15.7% 2,854 -5.5% 2,546 Days on Market (From Last List Date) 79 1.3% 78 3.9% 76 Listing Discount (From Last List Price) 7.2% 6.3% 5.9% Listing Inventory 6,412 -11.7% 7,265 -1.7% 6,523 Months of Supply 8.0 5.3% 7.6 3.9% 7.7 Year-to-Date Q4-2023 %∆ (qtr) Q3-2023 %∆ (yr) Q4-2022 Average Sales Price (YTD) $1,996,093 N/A N/A -1.7% $2,031,215 Average Price per Sq Ft (YTD) $1,674 N/A N/A 2.1% $1,640 Median Sales Price (YTD) $1,150,000 N/A N/A -3.6% $1,192,500 Number of Sales (YTD) 9,828 N/A N/A -28.0% 13,657
ascent in four decades. Mortgage rates began to decline in the middle of the fourth quarter as the Fed paused. Rising mortgage rates had kept listing inventory from entering the market as homeowners were reluctant to enter the market and lose their low rates. Listing inventory declined annually over the past three quarters due to the impact of unusually low mortgage rates during the pandemic era. There were 6,412 listings at the end of the fourth quarter, down 1.7% year over year and 3.5% below the pre-pandemic level. The pace of the market, as measured by months of supply, the number of months to sell all listing inventory at the current sales rate, was eight months, 3.9% slower than last year and similar to the 8.4-month quarterly average for the past twenty years. With the reduction in listing inventory and sales, the bidding war market share was 5.9%, down from 7.5% in the same period last year. When a bidding war occurred, the amount of premium paid averaged 3.2%. Sellers priced slightly more accurately when entering the market, with 60% requiring at least one price cut compared to 64.2% in the same period last year. The average of all price cuts was $200,626, nearly double last year’s quarter. The market share of cash sales surged to 67.9%, a new record, mainly due to the surge in mortgage rates. Based on the number of sales, cash sales surged 17.6% year over year, while mortgagebased sales fell 32.5%. The average monthly maintenance for a co-op sale was $2,835, a new record, or $2.52 per square foot, up 12% annually. The entry threshold for the luxury market, the beginning of the top ten percent, began at $4,009,000, up 1.5% from last year. The luxury median price was $6,125,000, 4.9% higher than the year-ago quarter and 27.6% higher than the pre-pandemic level. In contrast, the market-wide median sales price was 15.8% above pre-pandemic levels, demonstrating that luxury prices have risen nearly double the overall market rate since the end of 2019. Luxury inventory fell 4.2% year over year to 1,398 and was down 22.9% from the prepandemic level, indicating the greater strength of the recent high-end market. The average condo common charge plus real estate tax total was $4,295, or $3.15 per square foot, up 7.9% annually. The median sales price of a coop was $860,218, the third highest on record, up 9.6% year over year. The median sales price of a condo was $1,657,155, up 0.6% annually. The market share of new development sales that closed in the quarter was 12.3%, down from 15.9% in the prior year’s quarter and just below the 13.5% average for the decade. The median sales price of new development sales was $2,025,000, up 2.2% year over year. New development sales dropped 26.5% annually, mainly because of the spike in mortgage rates and the 16% decline in listing inventory, as the pandemic-era boom already sold off the excess supply.
Re-Sales
• All price trend indicators rose annually for the third consecutive quarter as average sales price reached a new high
• While overall sales slipped year over year, sales at or above the $5 million threshold surged
• The market share of bidding wars slipped from the same period last year
This sub-category analyzes all co-op & condo re-sales available. The data is also contained within the co-op & condo markets presented. The Elliman Report • Quarterly Survey of Manhattan, NY Sales elliman.com/marketreports 2023 2022 2021 2020 2019 2018 2017 2016 2015 2014 500 900 1,300 1,700 2,100 2,500 $600K $660K $720K $780K $840K $900K 2023 2022 2021 2020 2019 2018 2017 2016 2015 2014 700 1,100 1,500 1,900 2,300 $1.05M $1.30M $1.55M $1.80M $2.05M 0 5 10 15 20 25 0% 8% 16% 24% 32% 40% 2023 2022 2021 2020 2019 2018 2017 2016 2015 2014 0 6 12 18 24 30 $10M+ $5M-$9.99M $3M-$4.99M $2M-$2.99M 1.5M-$1.99M $1M-$1.49M $500K-$999K <$500K 7.4 Month Rate, 10-Year Average Manha an % Market Sold Above Last List Price Months of Supply Condo Co-Op Months of Supply Manha an Number of Sales Median Sales Price Manha an Co-Op Number of Sales Median Sales Price Manha an Condo 2023 2022 2021 2020 2019 2018 2017 2016 2015 2014 500 900 1,300 1,700 2,100 2,500 $600K $660K $720K $780K $840K $900K 2023 2022 2021 2020 2019 2018 2017 2016 2015 2014 700 1,100 1,500 1,900 2,300 $1.05M $1.30M $1.55M $1.80M $2.05M 0 5 10 15 20 25 0% 8% 16% 24% 32% 40% 2023 2022 2021 2020 2019 2018 2017 2016 2015 2014 0 6 12 18 24 30 $10M+ $5M-$9.99M $3M-$4.99M $2M-$2.99M 1.5M-$1.99M $1M-$1.49M $500K-$999K <$500K 7.4 Month Rate, 10-Year Average Manha an % Market Sold Above Last List Price Months of Supply Condo Co-Op Months of Supply Manha an Number of Sales Median Sales Price Manha an Co-Op Number of Sales Median Sales Price Manha an Condo Re-Sales Matrix Q4-2023 %∆ (qtr) Q3-2023 %∆ (yr) Q4-2022 Average Sales Price $1,922,773 11.7% $1,722,096 12.7% $1,705,413 Average Price per Sq Ft $1,581 10.2% $1,435 5.6% $1,497 Median Sales Price $1,049,999 5.0% $999,999 6.1% $990,000 Number of Sales (Closed) 2,109 -11.1% 2,372 -1.5% 2,142 Days on Market (From Last List Date) 78 4.0% 75 4.0% 75 Listing Discount (From Last List Price) 7.3% 6.1% 6.0% Listing Inventory 5,407 -11.8% 6,128 1.5% 5,326 Months of Supply 7.7 -1.3% 7.8 2.7% 7.5 Sales Share of Overall Market 87.7% 83.1% 84.1%
Q4-2023
4+
Co-Op
• Median sales price rose year over for the second time to the third-highest level on record
• Sales increased annually for the first time in six quarters
• Listing inventory declined year over year for the ninth time in ten quarters
Condo
• Median sales price edged higher year over year for the first time in five quarters
• Sales declined year over year for the sixth straight quarter
• Listing inventory declined year over year for the second time in four quarters
The Elliman Report • Quarterly Survey of Manhattan, NY Sales elliman.com/marketreports 500 900 1,300 1,700 2,100 2,500 $600K $660K $720K $780K $840K $900K 2023 2022 2021 2020 2019 2018 2017 2016 2015 2014 300 700 1,100 1,500 1,900 2,300 $800K $1.05M $1.30M $1.55M $1.80M $2.05M 2023 2022 2021 2020 2019 2018 2017 2016 2015 2014 100 180 260 340 420 500 $3.50M $4.25M $5.00M $5.75M $6.50M $7.25M 2023 2022 2021 2020 2019 2018 2017 2016 2015 2014 10% 15% 20% 25% $2,200 $2,800 $3,400 $4,000 0 6 $10M+ $5M-$9.99M $3M-$4.99M $2M-$2.99M 1.5M-$1.99M $1M-$1.49M $500K-$999K <$500K Number of Sales Median Sales Price Manha an Co-Op Number of Sales Median Sales Price Manha an Condo Number of Sales Median Sales Price Manha an Luxury Manha an New Development Average Price Per SF Market Share 500 900 1,300 1,700 2,100 2,500 $600K $660K $720K $780K $840K $900K 2023 2022 2021 2020 2019 2018 2017 2016 2015 2014 300 700 1,100 1,500 1,900 2,300 $800K $1.05M $1.30M $1.55M $1.80M $2.05M 2023 2022 2021 2020 2019 2018 2017 2016 2015 2014 0 0% 2023 2022 2021 2020 2019 2018 2017 2016 2015 2014 100 180 260 340 420 500 $3.50M $4.25M $5.00M $5.75M $6.50M $7.25M 2023 2022 2021 2020 2019 2018 2017 2016 2015 2014 0 6 12 18 24 30 $10M+ $5M-$9.99M $3M-$4.99M $2M-$2.99M 1.5M-$1.99M $1M-$1.49M $500K-$999K <$500K 7.4 Month Rate, 10-Year Average Condo Co-Op Months of Supply Manha an Number of Sales Median Sales Price Manha an Co-Op Number of Sales Median Sales Price Manha an Condo Number of Sales Median Sales Price Manha an Luxury Co-Op Matrix Q4-2023 %∆ (qtr) Q3-2023 %∆ (yr) Q4-2022 Average Sales Price $1,375,834 1.0% $1,361,843 8.2% $1,271,380 Average Price per Sq Ft $1,222 0.3% $1,218 -0.2% $1,225 Median Sales Price $860,218 -1.7% $875,000 9.6% $784,547 Number of Sales (Closed) 1,417 -10.4% 1,581 1.8% 1,392 Days on Market (From Last List Date) 78 2.6% 76 5.4% 74 Listing Discount (From Last List Price) 7.0% 6.2% 5.7% Listing Inventory 3,103 -11.7% 3,516 -2.1% 3,170 Months of Supply 6.6 -1.5% 6.7 -2.9% 6.8 Condo Matrix Q4-2023 %∆ (qtr) Q3-2023 %∆ (yr) Q4-2022 Average Sales Price $2,928,249 8.7% $2,693,369 6.6% $2,747,762 Average Price per Sq Ft $2,150 9.1% $1,971 3.7% $2,074 Median Sales Price $1,657,155 2.9% $1,610,000 0.6% $1,647,500 Number of Sales (Closed) 989 -22.3% 1,273 -14.3% 1,154 Days on Market (From Last List Date) 82 2.5% 80 5.1% 78 Listing Discount (From Last List Price) 7.3% 6.3% 6.1% Listing Inventory 3,309 -11.7% 3,749 -1.3% 3,353 Months of Supply 10.0 13.6% 8.8 14.9% 8.7
Co-op Mix Sales Share Median Sales Price Studio 17.0% $425,000 1-Bedroom 37.7% $725,000 2-Bedroom 28.4% $1,266,250 3-Bedroom 12.6% $2,285,000
Bedroom 4.4% $4,900,000 Condo Mix Sales Share Median Sales Price Studio 11.1% $650,000 1-Bedroom 32.8% $1,100,000 2-Bedroom 35.5% $2,150,000 3-Bedroom 14.1% $4,315,000 4+ Bedroom 6.6% $8,200,000
Q4-2023
• Luxury median sales price increased annually for the third time and remained significantly above pre-pandemic levels
• Luxury listing inventory fell annually for the third consecutive quarter
• Luxury entry threshold expanded year over year for the third consecutive quarter
• New development listing inventory declined year over year for the fourth consecutive quarter
• Market share of new development sales fell below the quarterly average for the decade
• New development sales declined year over year for the sixth time as excess supply was sold off during the pandemic
Questions or comments? Email report author Jonathan Miller at jmiller@millersamuel.com
Methodology: millersamuel.com/research-reports/methodology
Douglas Elliman Real Estate 575 Madison Avenue, New York, NY 10022 212.891.7000 • elliman.com Miller Samuel Real Estate Appraisers & Consultants 21 West 38th Street, New York, NY 10018 212.768.8100 • millersamuel.com © 2024 DOUGLAS ELLIMAN REAL ESTATE AND MILLER SAMUEL REAL ESTATE APPRAISERS & CONSULTANTS. ALL WORLDWIDE RIGHTS RESERVED. ALL MATERIAL PRESENTED HEREIN IS INTENDED FOR INFORMATION PURPOSES ONLY. WHILE, THIS INFORMATION IS BELIEVED TO BE CORRECT, IT IS REPRESENTED SUBJECT TO ERRORS, OMISSIONS, CHANGES OR WITHDRAWAL WITHOUT NOTICE. ALL PROPERTY INFORMATION, INCLUDING, BUT NOT LIMITED TO SQUARE FOOTAGE, ROOM COUNT, NUMBER OF BEDROOMS AND THE SCHOOL DISTRICT IN PROPERTY LISTINGS SHOULD BE VERIFIED BY YOUR OWN ATTORNEY, ARCHITECT OR ZONING EXPERT. IF YOUR PROPERTY IS CURRENTLY LISTED WITH ANOTHER REAL ESTATE BROKER, PLEASE DISREGARD THIS OFFER. IT IS NOT OUR INTENTION TO SOLICIT THE OFFERINGS OF OTHER REAL ESTATE BROKERS. WE COOPERATE WITH THEM FULLY. EQUAL HOUSING OPPORTUNITY. New Development Mix Sales Share YoY% Sales Change < $1M 16.5% -43.7% $1M - $3M 54.2% -20.3% > $3M 29.3% -24.3% Luxury Matrix (Top 10% of Sales) Q4-2023 %∆ (qtr) Q3-2023 %∆ (yr) Q4-2022 Average Sales Price $8,646,741 12.1% $7,715,385 7.3% $8,058,356 Average Price per Sq Ft $2,832 9.3% $2,590 -2.6% $2,909 Median Sales Price $6,125,000 2.1% $6,000,000 4.9% $5,837,500 Number of Sales (Closed) 241 -16.3% 288 -5.9% 256 Days on Market (From Last List Date) 108 -0.9% 109 8.0% 100 Listing Discount (From Last List Price) 10.4% 8.3% 7.2% Listing Inventory 1,398 -6.0% 1,488 -4.2% 1,459 Months of Supply 17.4 12.3% 15.5 1.8% 17.1 Entry Price Threshold $4,009,000 0.2% $4,000,000 1.5% $3,950,000 New Development Matrix Q4-2023 %∆ (qtr) Q3-2023 %∆ (yr) Q4-2022 Average Sales Price $2,661,505 -14.3% $3,105,646 -16.5% $3,187,337 Average Price per Sq Ft $2,096 -7.5% $2,267 -13.2% $2,415 Median Sales Price $2,025,000 0.2% $2,020,466 2.2% $1,981,794 Number of Sales (Closed) 297 -38.4% 482 -26.5% 404 Days on Market (From Last List Date) 98 -10.9% 110 11.4% 88 Listing Discount (From Last List Price) 5.1% 7.6% 5.3% Listing Inventory 1,005 -11.6% 1,137 -16.0% 1,197 Months of Supply 10.2 43.7% 7.1 14.6% 8.9 Sales Share of Overall Market 12.3% 16.9% 15.9% The Elliman Report • Quarterly Survey of Manhattan, NY Sales elliman.com/marketreports Luxury New Development 300 $800K 2023 2022 2021 2020 2019 2018 2017 2016 2015 2014 100 180 260 340 420 500 $3.50M $4.25M $5.00M $5.75M $6.50M $7.25M 2023 2022 2021 2020 2019 2018 2017 2016 2015 2014 0% 5% 10% 15% 20% 25% $1,000 $1,600 $2,200 $2,800 $3,400 $4,000 2023 2022 2021 2020 2019 2018 2017 2016 2015 2014 Number of Sales Median Sales Price Manha an Luxury Manha an New Development Average Price Per SF Market Share 300 700 1,100 1,500 1,900 $800K $1.05M $1.30M $1.55M $1.80M 2023 2022 2021 2020 2019 2018 2017 2016 2015 2014 100 180 260 340 420 500 $3.50M $4.25M $5.00M $5.75M $6.50M $7.25M 2023 2022 2021 2020 2019 2018 2017 2016 2015 2014 0% 5% 10% 15% 20% 25% $1,000 $1,600 $2,200 $2,800 $3,400 $4,000 2023 2022 2021 2020 2019 2018 2017 2016 2015 2014 Number of Sales Median Sales Price Manha an Luxury Manha an New Development Average Price Per SF Market Share Luxury Mix Sales Share Median Sales Price Co-ops 58.9% $4,190,000 Condos 41.1% $12,522,939 New Dev. 24.1% $5,049,500 Re-Sales 75.9% $5,995,000
Q4-2023