


National Entrepreneurship Assessment For The United States Of America
Global Entrepreneurship Monitor 2022-2023 United States Report
© 2023 All rights of this publication are reserved and therefore this publication cannot be reproduced in its totality, or in part, recorded or transmitted by any information retrieval system in any way, by any means mechanical, photochemical, electronic, magnetic, electro-optical, digital, photocopying or otherwise, without written permission of the authors.
Global Entrepreneurship Monitor 2022-2023
United States Report
©2022 Donna J. Kelley, Jeffrey Shay, Mahdi Majbouri, Candida G. Brush, Andrew C. Corbett, Caroline Daniels
Babson Park, MA
Acknowledgments 5 List of Figures and Tables 6 Foreword 9 Executive Summary .................................................................................................. 10 Introduction: The United States Economy in 2020....................................................... 14 CHAPTER 1: Business Phases .............................................................. 24 CHAPTER 2: Impact Characteristics 32 CHAPTER 3: Societal Attitudes and Self-Perceptions About Entrepreneurship 40 CHAPTER 4: Gender in Entrepreneurship 46 CHAPTER 5: Race and Ethnicity 60 CHAPTER 6: Social and Environmental Sustainability 66 Conclusions .................................................................................. 78 About the Authors ........................................................................... 80 2022 National Experts Survey (NES) ....................................................... 82 Contents
Acknowledgments
The authors are especially grateful to the following people who have contributed their time and support to make this report possible:
» Stephen Spinelli Jr., MBA’92, PhD, President of Babson College
» Kerry Salerno, Chief Marketing Officer, Babson College
» Francis Ma, Content Strategy, Babson College
» Sarah Coppinger, Marketing Strategy, Babson College
» Cheryl Robock, Creative Management, Babson College
» Marissa Langdon, Art Direction and Design, Babson College
» Cathleen Cahill, Art Direction and Design, Babson College
» Matt Mayerchak, Production Design
» Martha Lanning, Research Associate and Editor, Babson College
» Smaiyra Million, Executive Director, Arthur M. Blank Center for Entrepreneurship
» Clare Currie, Program Manager, Arthur M. Blank Center for Entrepreneurship
» Aileen Ionescu-Somers, GEM Executive Director
» Kevin Anselmo, GEM Marketing Director
» The GEM Global Data Team
» GERA Board
» José Ernesto Amorós (Chair)
» Ana Fernandez Laviada
» Ehud Menipaz
» Jeffrey Shay
» Anna Tarnawa
» Niels Bosma (Non Voting Member)
This report would not be possible without the Consortium of GEM National Teams who participated in the 2022 GEM Global survey: Argentina, Austria, Brazil, Canada, Chile, China (PRC), Colombia, Croatia, Cyprus, Egypt, France, Germany, Greece, Guatemala, Hungary, India, Indonesia, Iran, Israel, Italy, Japan, Latvia, Lithuania, Luxembourg, Mexico, Morocco, Netherlands, Norway, Oman, Panama, Poland, Puerto Rico, Qatar, Republic of Korea, Romania, Saudi Arabia, Serbia, Slovak Republic, Slovenia, South Africa, Spain, Sweden, Switzerland, Taiwan, Togo, Tunisia, United Arab Emirates, United Kingdom, United States, Uruguay, Venezuela.
Unless otherwise noted, GEM data were used in the preparation of this report. The interpretation and use are the sole responsibility of the authors.
» Donna J. Kelley
» Jeffrey Shay
» Mahdi Majbouri
» Candida G. Brush
» Andrew C. Corbett
Figure 1: Percentage Change in Real GDP from the Preceding Quarter (Seasonally Adjusted Annual Rates) 17 Figure 2: National Unemployment Rate in Percent, Seasonally Adjusted 17 Figure 3: Total Non-Farm Private Employment 18 Figure 4: Unemployment Rates By State, 2021 Annual Averages 18 Figure 5: The Great Resignation, Voluntary Quit Rate as a Share of Total Employment 19 Figure 6: Inflation Rates as Year-on-Year Change of CPI, PCEPI, and Core PCEPI 20 Figure 7: Inflation Rates (Year-on-Year Change of CPI, PCEPI, and Core PCEPI) 21 Figure 8: GEM Entrepreneurship Indicators 23 Figure 9: Total Entrepreneurial Activity, Established Business Ownership, and Business Closure Activity Among U.S. Adults (age 18-64), 2013-2021 26 Figure 10: Total Entrepreneurial Activity and Established Business Ownership in 21 High-Income Economies (GDP per Capita over $40,000 USD), 2022 27 Figure 11: Entrepreneurial Intentions and Total Entrepreneurial Activity in 21 High-Income Economies (GDP per Capita over $40,000 USD), 2022 28 Figure 12: Motivations for Total Entrepreneurial Activity in 21 High-Income Economies (GDP per Capita over $40,000 USD), 2022 29 Figure 13: Total Entrepreneurial Activity Rates Among Adults (ages 18-34 and 35-64) in 21 High-Income Economies (GDP per Capita over $40,000 USD), 2022 30 Figure 14: Industry Breakdown for Total Entrepreneurial Activity in the United States, 2020-2022 34 Figure 15: Percentage of Total Entrepreneurial Activity and Established Business Ownership Participating in Mediumand High-Technology Sectors in 21 High-Income Economies (GDP per Capita over $40,000 USD), 2022 35 Figure 16: Breakdown of TEA by Newness of Product or Service to Customers, 2022 36 Figure 17: Breakdown of TEA by Newness of Technologies or Procedures Used for Product or Service, 2019-2022 ............................. 36 Figure 18: New Job Creation Expectations for Total Entrepreneurial Activity and Established Business Ownership in the United States, 2018-2022 37 Figure 19: Percentage of TEA Projecting One to Five New Jobs and Over Six New Jobs in the Next Five Years in 21 High-Income Economies (GDP per Capita over $40,000 USD), 2022 38
List of Figures and Tables
Figure 20: Percentage of Total Entrepreneurial Activity with International Revenue Among 21 High-Income Economies (GDP per Capita over $40,000 USD), 2022 38 Figure 21: Societal Attitudes About Entrepreneurship in the U.S. Adult Population, 2016-2022 43 Figure 22: Percentage of the Adult Population who Believe it is Easy to Start a Business in 21 High-Income Economies (GDP per Capita over $40,000 USD), 2022 43 Figure 23: Percentage of the U.S. Adult Population who Know an Entrepreneur Personally, 2013-2021 44 Figure 24: Opportunity Perceptions, Capability Perceptions, and Fear of Failure in the U.S. Adult Population, 2013-2022 44 Figure 25: Societal Attitudes by Gender in the U.S. Adult Population, 2022 48 Figure 26: Entrepreneurial Affiliations by Gender in the U.S. Adult Population, 2013-2022 48 Figure 27: Entrepreneurial Self-Perceptions by Gender in the U.S. Adult Population, 2013-2022 51 Figure 28: Entrepreneurial Intentions, Total Entrepreneurial Activity, Established Business Ownership, and Business Closure by Gender in the U.S. Adult Population, 2013-2022 52, 53 Figure 29: Total Entrepreneurial Activity by Gender in 21 High-Income Economies (GDP per Capita over $40,000 USD), 2022 54 Figure 30: Established Business Ownership (EBO) by Gender in 21 High-Income Economies (GDP per Capita over $40,000 USD), 2022 54 Figure 31: Motivations for Total Entrepreneurial Activity by Gender in the United States, 2022 55 Figure 32: Industry Sector Participation for Total Entrepreneurial Activity by Gender in the U.S. Adult Population, 2022 56 Figure 33: Job Creation Expectations for Total Entrepreneurial Activity by Gender in the U.S. Adult Population, 2022 57 Figure 34: Market Scope for Total Entrepreneurial Activity by Gender in the U.S. Adult Population, 2022 58 Figure 35: Innovation for Total Entrepreneurial Activity by Gender in the U.S. Adult Population, 2022 58 Figure 36: Use of Technologies for Total Entrepreneurial Activity by Gender in the U.S. Adult Population, 2022 ................................ 59 Figure 37: Societal Attitudes by Race and Ethnicity in the U.S. Adult Population, 2022 62 Figure 38: Entrepreneurial Affiliations and Self-Perceptions by Race and Ethnicity in the U.S. Adult Population, 2022 63 Figure 39: Entrepreneurial Intentions, Total Entrepreneurial Activity, Established Business Ownership, and Business Closure Activity by Race and Ethnicity in the U.S. Adult Population, 2022 64
Figure 40: Motivations for Total Entrepreneurial Activity by Race and Ethnicity in the United States, 2022 65 Figure 41: Percentage of U.S. Entrepreneurs and Established Business Owners who Prioritize Social and Environmental Impact of Business Above Profitability or Growth, by Gender, 2022 69 Figure 42: Percentage of U.S. Entrepreneurs and Established Business Owners who Prioritize Social and Environmental Impact of Business Above Profitability or Growth, by Age, 2022 70 Figure 43: Percentage of Innovative versus Non-Innovative U.S. Entrepreneurs and Established Business Owners who Prioritize Social and Environmental Impact of Business Above Profitability or Growth, 2022 71 Figure 44: Percentage of U.S. Entrepreneurs and Established Business Owners who Have Taken Steps to Minimize Environmental Impact, by Gender, 2022 71 Figure 45: Percentage of U.S. Entrepreneurs and Established Business Owners who Have Taken Steps to Minimize Environmental Impact, by Age, 2022 72 Figure 46: Percentage of Innovative versus Non-Innovative U.S. Entrepreneurs and Established Business Owners who Have Taken Steps to Minimize Environmental Impact, 2022 72 Figure 47: En-Roads Climate Simulator 74 Figure 48: Percentage of U.S. Entrepreneurs and Established Business Owners who Have Taken Steps to Maximize Social Impact, by Gender, 2022 74 Figure 49: Percentage of U.S. Entrepreneurs and Established Business Owners who Have Taken Steps to Minimize Environmental Impact, by Age, 2022 76 Figure 50: Percentage of Innovative versus Non-Innovative U.S. Entrepreneurs and Established Business Owners who Have Taken Steps to Minimize Environmental Impact, 2022 76
Foreword
Entrepreneurship has always been about more than bringing a business from ideation to reality. At its core, it’s about creating innovative and scalable solutions to challenges big and small. I’m confident that this notion is more prevalent than ever after reading the 2022–2023 United States Report by the Global Entrepreneurship Monitor (GEM).
This year’s survey results clearly frame how entrepreneurs are leading in sectors where societies need them most. In a world where global supply chain disruptions have resulted in depleted inventories and unprecedented backlogs, entrepreneurs have answered the call by finding manufacturing solutions. Since the onset of the COVID-19 pandemic, the manufacturing and logistics industry has seen a staggering 64% increase in total early-stage entrepreneurial activity (TEA) across the United States. This rapid-response entrepreneurship signals continued evolution and elevation of entrepreneurial behavior.
The report shows, too, that entrepreneurs are impacting change far beyond the supply chain. Today’s entrepreneurs are increasingly mindful of the many ways they can have a positive social and environmental impact. And they’re not just thinking of that responsibility, they’re prioritizing it—more than two-thirds of entrepreneurs today are putting business impact above growth and profitability. I speculate that farsighted perspective will yield more durable, higher-value business models.
Entrepreneurship can mean many things to many people. What remains central to the mindset is the ability to foster new ideas and methods to keep pace with market demands and societal needs. Since 2020, twice as many entrepreneurs have embraced new technologies to build products and scale services. Generative AI already has shown that it has the potential to impact nearly all businesses and industries. Opinions on whether that impact will be positive or negative will vary depending on how leaders adopt the everexpanding technology. And make no question, AI is here to stay. Entrepreneurs eagerly embrace new technologies.
We live in an era when entrepreneurship and new business ventures are reaching record-breaking levels. Underscored throughout the report is a promising trajectory of an increasingly diverse population of entrepreneurs. Survey data show new positive trends in diversity of gender, ethnicity, and background—all encouraging signs for the future of entrepreneurship. Yet there is still work to be done to further close the gap across race and gender. Empowering new entrepreneurs from under-represented groups will be important to the success of entrepreneurial thought leadership.
As a college president and lifelong entrepreneur, I’m thrilled by the degree to which young entrepreneurs are taking the lead. It’s a major reason for my optimism for the future of entrepreneurial leadership at Babson College and beyond. The next generation of entrepreneurs understands the complex needs of our global society and are poised to innovate in yet-to-be-imagined ways. It’s our responsibility to support them—and learn from them—along the way.
I’m hopeful for what the next generation of entrepreneurs will create and accomplish. After reading this year’s report, I trust you will be, too.
Stephen Spinelli Jr., MBA’92, PhD President, Babson College

The 2022-2023 GEM global survey represents the 24th year academic research teams worldwide have conducted a study to assess entrepreneurship rates and other stages of the business process, characteristics of entrepreneurs and their businesses, and societal attitudes, affiliations, and self-perceptions around entrepreneurship in each participating economy. Over 120 economies have joined the GEM research at various times during the past 24 years. The United States team based at Babson College has been a constant contributor, participating every year since GEM founding in 1999.
Entrepreneurs play a key role in the growth of an economy. They introduce new products and services that improve people’s lives, create jobs, and provide a broad range of social and economic benefits to their community, their nation, and the world. Entrepreneurship provides alternative career choices when there are few good job options. It offers an opportunity for individuals to pursue their passions and develop solutions to problems facing society as they embark on journeys that bring in co-founders, employees, financiers, value-chain partners, advisors, and other stakeholders.
The 2022-2023 GEM survey was administered in the United States during summer 2022 after the shutdowns and restrictions Americans faced in 2020 and 2021 due to the pandemic. The survey results reveal progress in entrepreneurship. Key findings include the following:
Business Phases
• A NEW HIGH POINT IN THE RATE OF ENTREPRENEURSHIP IN THE UNITED STATES. Among working-age adults, 19% were in the process of starting a business or running a business less than 42 months old. Following a continuous upward trend from 2015, total entrepreneurial activity (TEA) rates dropped in 2020, the first year of the COVID-19 pandemic. The upward trajectory continued in 2021 and again in 2022. Among the 21 high-income economies with GDP per Capita of $40,000 or more that participated in the GEM 2022 survey, the United States showed the third highest TEA rate.
• HIGH BUT STAGNANT ESTABLISHED BUSINESS RATES AND A CONTINUING HIGH NUMBER OF BUSINESS CLOSURES. The United States also showed the third highest rate (9.2%) for established business ownership (EBO) among the 21 high-income economies. Longitudinally, however, this indicator seemed to stall after hitting a high point in 2019. At the same time, business closures exhibited a more than three-fourths increase from 2019 (2.9%) to 2022 (5.2%).
• A RELATIVELY CONSTANT LEVEL OF ENTREPRENEURIAL INTENTIONS OVER TIME, LOWER RATES THAN TEA. In the United States, 13.6% of working-age adults expressed entrepreneurial intentions. This number has remained relatively constant over time, fluctuating one or two percentage points in either direction.
• HIGH MOTIVES TO GENERATE WEALTH/INCOME BUT ALSO AN INCREASE IN NECESSITY. Most entrepreneurs in the United States were motivated by the prospect of generating great wealth or high income (71%). However, there was a nearly one-third rise in necessity motives from 2021 (46%) to 2022 (54.5%).
• YOUTH DRIVING ENTREPRENEURSHIP. In the United States, adults in the 18-34 age group had twice, or nearly twice, the rate of entrepreneurship as those in the 35-64 age group (27% versus 14.5%).
A NEW HIGH POINT IN THE RATE OF ENTREPRENEURSHIP IN THE UNITED STATES.
AMONG WORKING-AGE ADULTS, 19% WERE IN THE PROCESS OF STARTING A BUSINESS OR RUNNING A BUSINESS LESS THAN 42 MONTHS OLD.
Executive Summary GEM 2022-2023 United States Report 10
Impact Characteristics
• SHIFT FROM SERVICES TO MANUFACTURING. The distribution of entrepreneurship across industries was relatively similar in 2020 and 2021. In 2022, industry distribution shifted away from finance, real estate, and business services (30% in 2020 to 16% in 2022) toward manufacturing and logistics (12% in 2020 to 19% in 2022), with a small but notable increase in information and communication technologies (4.6% in 2020 to 6.8% in 2022).
• HIGH ENTREPRENEURSHIP RATES, BUT PROPORTIONATELY LOW TECHNOLOGY PARTICIPATION. The United States showed high entrepreneurship rates, with 12% of respondents competing in medium- and high-technology industries. In absolute terms, this translates to many technology entrepreneurs; but on a percentage basis, the United States ranked in the lowest one-third of the 21 highincome economies.
• INNOVATION AND USE OF TECHNOLOGY ON THE RISE. In 2022, 40% of entrepreneurs were introducing something new to the market, representing nearly
double the percentage reported in 2020. Additionally, nearly 40% of entrepreneurs were using new technology and procedures to build their product or service, also close to double the 2020 number.
• DECLINE IN JOB CREATION PROSPECTS AMONG ENTREPRENEURS. In 2022, 31% of existing business owners expected to create jobs in the next five years, consistent with results from 2021. Among entrepreneurs, this indicator, although higher than for existing business owners, dropped from 60% in 2021 to 54% in 2022.
• LOW INTERNATIONAL MARKET REACH. Not surprising, given the advantage of being a large market, the United States held among the lowest expectations for international sales in the high-income economies, with 26% of respondents anticipating 25% or more of their revenue to come from customers outside their own country.
Societal Attitudes, Affiliations, and Self-Perceptions About Entrepreneurship
• CONTINUED HIGH (POSITIVE) ATTITUDES ABOUT ENTREPRENEURSHIP BUT LOWER (LESS POSITIVE) PERCEPTIONS ABOUT THE EASE OF STARTING A BUSINESS. Three societal attitudes tracked by GEM showed high levels and virtually no change from 2021: entrepreneurship as a desirable career choice (76%), status and respect for successful entrepreneurs (80%), and media attention about successful new businesses (76%). On the other hand, fewer people believed it was easier to start a business in 2022 than in 2021 (66% versus 77%).
• ENTREPRENEURS IN ONE’S NETWORK. Although entrepreneurial affiliations dropped slightly to 56% in 2022, compared to a high of 61% reached in 2019 and 2020, this indicator continued at a high level, suggesting that more than half of Americans knew an entrepreneur personally.
• FEELING CONFIDENT ABOUT ONE’S CAPABILITIES BUT SEEING FEW OPPORTUNITIES. Capability perceptions experienced a significant increase in 2019, remaining at a high level through 2022 (67%). But despite feeling that they possessed the requisite knowledge and skills for starting a business, few respondents saw opportunities in 2022, dropping to 46% from 63% in 2021. In addition, fear of failure posed a constraint for 43% of those seeing opportunities, the same as in 2021.
Executive Summary GEM 2022-2023 United States Report 11
BUT DESPITE FEELING THAT THEY POSSESSED THE REQUISITE KNOWLEDGE AND SKILLS FOR STARTING A BUSINESS, FEWER RESPONDENTS SAW OPPORTUNITIES IN 2022, DROPPING TO 46% FROM 63% IN 2021.
Gender in Entrepreneurship
• A GOOD CAREER CHOICE FOR WOMEN. Women perceived entrepreneurship as a good career choice, and at a slightly higher rate than men (78% versus 74%). The genders were nearly equal in attitudes about status and media attention for entrepreneurship, but women were slightly less likely than men to believe it was easy to start a business (64% versus 68%).
• AFFILIATIONS WITH ENTREPRENEURS. The majority of women in the U.S. population reported knowing at least one entrepreneur (53% versus 58% for men). Although both genders showed slight declines from 2021, this indicator has exhibited high levels since 2019, with the gender difference remaining quite small.
• GENDER GAP IN CAPABILITIES. The majority of women (60%) believed they had entrepreneurial capabilities, although about one-fifth fewer women than men (73%). Opportunity perceptions dropped one-fourth in 2022 for women from the prior year (to 45%), with men showing an even steeper decline (to 47%), narrowing the gender gap. High fear of failure continued for both genders (45% for women, 41% for men).
• HIGH ENTREPRENEURSHIP RATES WITH A LOW GENDER GAP. TEA rates for both men and women were the highest seen in GEM history (18% for women, 20% for men). The United States reported the second highest women’s entrepreneurship rates and the third lowest gender gap among the 21 high-income economies participating in GEM in 2022. Gender gaps remained for entrepreneurial intentions (12% for women versus 16% for men) and established business ownership (10.5% for women versus 8% for men). Business closure rates were nearly equal and overall quite small (5% for both).
• LESS WEALTH, MORE NECESSITY MOTIVATING WOMEN. Motivation to build great wealth or income drove 78% of men entrepreneurs but only 63% of women. However, the necessity motive, to earn a living due to scarcity of jobs, increased by over one-fourth for women while increasing a smaller amount for men (58% versus 51%).
• SHIFTS IN INDUSTRY. Nearly 18% of women were starting a business in Manufacturing versus 9% for men. Women reported participation in the Wholesale and Retail sector at 33%. Their participation in Health, Education, Government, and Social Services at 21% rose dramatically in 2022. Conversely, women reported declining participation in Finance and Real Estate (6.3%) and also Information, Communication, and Technology (3.6%).
• MODERATE JOB CREATION PROJECTIONS. In 2022, 46% of both women and men entrepreneurs expected no new jobs or job loss. Women were more likely than men to anticipate adding one to five jobs (34% versus 24% for men), but men were more likely to expect adding more than six jobs (30% versus 20% for women).
• NATIONAL MARKET SCOPE. Women entrepreneurs were highly likely to start ventures serving the national market (40% versus 33% for men). Fewer were serving international markets (24% versus 28% for men).
• INNOVATIVE ENTREPRENEURS. More than half of women and men entrepreneurs were not offering products or services new to the market. However, 12% of women entrepreneurs (versus 9% of men entrepreneurs) said they were introducing products or services new to the world, with 28% (versus 32% of men) indicating newness at a local or national level. Nearly one-third of women entrepreneurs and less than half of men entrepreneurs were using new technology to provide their products or services.
Executive Summary GEM 2022-2023 United States Report 12
THE UNITED STATES REPORTED THE SECOND HIGHEST WOMEN’S ENTREPRENEURSHIP RATES AND THE THIRD LOWEST GENDER GAP AMONG THE 21 HIGH-INCOME ECONOMIES PARTICIPATING IN GEM IN 2022.
Race and Ethnicity
• HIGH LEVELS OF ATTITUDES ABOUT ENTREPRENEURSHIP WITH SOME VARIATION AMONG THE THREE RACIAL/ETHNIC GROUPS. Compared to White people, Black people and Hispanic people held a more positive view of entrepreneurship as a career (74%, 85%, 85% respectively) and how entrepreneurs were represented in the media (74%, 84%, 81%). On the other hand, all three groups were highly likely to believe that entrepreneurs had high status (80%, 79%, 84%) with the Hispanic population thinking a little more positively on this indicator, as well as showing higher perceptions about the ease of starting a business (64%, 69%, 76%).
• DISTINCT DIFFERENCES IN SELF-PERCEPTIONS AND AFFILIATIONS WITH ENTREPRENEURS. White people were much less likely than Black or Hispanic people to know an entrepreneur personally (50%, 68%, 66%) or to perceive entrepreneurial opportunities around them (40%, 65%, 59%). However, among those who saw opportunities, there was high fear of failure in all three groups (44%, 39%, 38%). Black people showed higher confidence in their ability to start a business (73%), compared to White (67%) and Hispanic (61%) people.
Social and Environmental Sustainability
• PRIORITIZING THE ENVIRONMENT AND SOCIAL IMPACT. Over two-thirds of entrepreneurs (69%) and half of established business owners (50%) stated that they prioritized social and environmental impact of their businesses above profitability or growth. Among entrepreneurs, women (72%), those in the 18-34 age group (73%), and those introducing innovations (79%) were more likely to state this priority.
• TAKING ACTION FOR THE ENVIRONMENT. Over half (55%) of both entrepreneurs and established business owners stated they had taken steps to minimize negative environmental impact. Again for entrepreneurs, women (56%), the 18-34 age group (62%), and innovators (70%) were more likely to take such actions.
• HIGH ENTREPRENEURSHIP RATES AMONG BLACK PEOPLE, INCREASING AMONG HISPANIC PEOPLE. Black people had high intentions to start businesses (24%) and showed high TEA rates (35%). Hispanic people were slightly less likely than Black people to have intentions (19%), and they exhibited lower TEA rates (27%); but the latter indicator increased by 60% from 2021 (17%). The White population reported lower intentions (9.3%) and lower TEA (15%).
• A PERSISTENT IMBALANCE BETWEEN TEA AND ESTABLISHED BUSINESS OWNERSHIP IN BOTH THE BLACK AND HISPANIC POPULATIONS. White people were more likely to be running established businesses (9.8%) than Black (6.5%) or Hispanic (7.3%) people.
• HIGH-INCOME MOTIVES. Hispanic entrepreneurs were highly likely to state they were motivated to generate wealth/high income (90%), but also that they were motivated by necessity to earn a living because jobs were scarce (67%). Black entrepreneurs were also more likely to identify both of these motives (83% and 64%) than White entrepreneurs (60% and 49%).
• STEPS TOWARD A BETTER SOCIETY. With regard to steps that maximize social impact, 55% of entrepreneurs and 43% of established business owners took such action in 2022. Once again, women (60%), those age 18-34 (63%), and innovators (70%) were most likely to indicate these actions.
OVER HALF (55%) OF BOTH
Executive Summary GEM 2022-2023 United States Report 13
ENTREPRENEURS AND ESTABLISHED BUSINESS OWNERS STATED THEY HAD TAKEN STEPS TO MINIMIZE NEGATIVE ENVIRONMENTAL IMPACT.
BUSINESS PHASES
THE UNITED STATES ECONOMY IN 2021-2022
BUSINESS PHASES PHASES BUSINESS BUSINESS PHASES PHASES BUSINESS BUSINESS PHASES PHASES BUSINESS BUSINESS PHASES PHASES BUSINESS
intro
PHASES BUSINESS
BUSINESS PHASES
PHASES BUSINESS
BUSINESS PHASES
PHASES BUSINESS
BUSINESS PHASES
PHASES BUSINESS
BUSINESS PHASES
PHASES BUSINESS
PHASES BUSINESS
PHASES BUSINESS BUSINESS PHASES BUSINESS PHASES BUSINESS
The Global Entrepreneurship Monitor Adult Population Survey (GEM APS) is conducted in May and June of every year in the United States and other participating economies. Entrepreneurial activity, intentions, and outcomes in a given period could have been affected by conditions of the economy during the year prior to data collection, as well as during the year of data collection.
Entrepreneurial intentions could also be affected by expectations about the future of the economy at the time of data collection. Hence, this section will review the state of the U.S. economy in the year prior to data collection and beyond (that is, from the second half of 2021 to the end of 2022) and discuss the economic outlook that entrepreneurs and business owners held at the time of data collection.
The U.S. economy in late 2021 and early 2022 displayed a full recovery from the COVID-19 pandemic, but this was hampered by global supply chain disruptions, a rise in energy prices due to the war in Ukraine, rising inflation, and the prospect of a recession. These key developments affected entrepreneurs, potential entrepreneurs, and established business owners and shaped the results outlined in this report.
The COVID-19 pandemic was the most important economic issue in 2021. The year started with a rapid surge in the number of COVID-19 cases in the United States, which peaked at over 250,000 cases a day, about four times as large as the previous peak in July 2020. By February, the number of cases had declined rapidly to a new low level and then dropped further by May 2021. By June 1, 2021, 53% of the U.S. population had been fully or partially vaccinated. By December 31 that year, 73% of the population had been fully or partially vaccinated.
The first and second quarters of 2021 saw progress toward a better future. The last two quarters of the year revealed surprises, however. In July 2021, a new variant, Delta, started spreading nationally. Although its impact was smaller than the surge in January, it forewarned that the pandemic was not over, even though many had been vaccinated. As Delta subsided, the Omicron variant, significantly more contagious, became dominant in late November and dwarfed all previous upticks by January 2022. Nevertheless, the trajectory of the virus began to wane, and almost everything gradually returned to normal (the pre-pandemic conditions) in 2022.
Thanks to strong consumer demand and the decline in COVID-19 cases, the U.S. economy rose in the first half of 2021 with growth rates larger than any seen between 2003 and 2020. The growth rates in three out of four quarters of 2021 were 6.3% and 7%. Overall, the U.S. economy grew by 5.8% in 2021, enough to surpass its pre-pandemic projected trajectory (Figure 1).
The strong economic growth in late 2020 and 2021 was the direct result of at least four major factors: 1) the federal government fiscal policy of stimulus and relief packages, 2) the Federal Reserve monetary policy response to the pandemic, 3) the introduction of COVID-19 vaccines and their global rollout, and 4) the resilience and dynamism of the U.S. economy.
The high growth in 2021 reached its limit in the first half of 2022, and the U.S. economy declined by 1.6% and 0.6% in the first two quarters of 2022. This was mostly due to the decline in business inventories (partially due to global supply chain disruptions), the end of most pandemic stimulus packages, and the trade deficit. The pandemic led to the shutdown of supply chains across the world, which created a backlog in orders and depletion of inventories. Moreover, enforcement in China of a zero-COVID policy by the Chinese government led to frequent shutdowns of cities and industries, disrupting the global supply chain.
Other U.S. economic indicators in the first two quarters of 2022, however, showed a strong economy that was not recessionary. The unemployment rate continuously declined from 4% to about 3.6% in this period (Figure 2). There was also job growth and robust demand for workers in the same period. Total non-farm payrolls added 3.3 million jobs, about 471,000 per month (Figure 3). This growth surpassed pre-pandemic levels throughout 2022. Moreover, growth in wages and profits in the first and second quarters of 2022 was 0.8% and 0.1%. Hence, the National Bureau of Economic Research (NBER), the expert organization that declared the start and end of recessionary periods, did not consider this period a recession.
GEM 2022-2023 United States Report 16 Introduction
Source of data: U.S. Bureau of Economic Analysis, Real Gross Domestic Product (A191RL1Q225SBEA), retrieved from FRED, Federal Reserve Bank of St. Louis; https://fred.stlouisfed.org/series/A191RL1Q225SBEA, June 12, 2023.
Source of data: U.S. Bureau of Labor Statistics, Unemployment Rate (UNRATE), retrieved from FRED, Federal Reserve Bank of St. Louis; https://fred.stlouisfed.org/series/UNRATE, June 12, 2023.
Note: The gray box shows the recession period. Each tick mark on the horizontal axis shows the beginning of the year.
40 30 20 10 0 -10 -20 -30 -40 2015 I II III IV 2016 I II III IV 2017 I II III IV 2018 I II III IV 2019 I II III IV 2020 I II III IV 2021 I II III IV 2022 I II III IV
Figure 1: Percentage Change in Real GDP from the Preceding Quarter (Seasonally Adjusted Annual Rates)
2015 2016 2017 2018 2019 2020 2022 2021 16 14 12 10 8 6 4 2 0 Unemployment Recession
Period
Figure 2: National Unemployment Rate in Percent, Seasonally Adjusted
GEM 2022-2023 United States Report 17 Introduction
Source of data: Automatic Data Processing, Inc., Total Non-Farm Private Payroll Employment (ADPWNUSNERSA), retrieved from FRED, Federal Reserve Bank of St. Louis; https://fred.stlouisfed.org/series/ADPWNUSNERSA, June 12, 2023. Note: The gray box shows the recession period. Each tick mark on the horizontal axis shows the beginning of the year.
(U.S. Rate = 3.6 percent)
Source: U.S. Department of Labor, Bureau of Labor Statistics; http://www.bls.gov/lau/maps/aastrate.gif, June 12, 2023.
5.0% or higher
4.5% to 4.9%
4.0% to 4.4%
3.5% to 3.9%
3.0% to 3.4%
2.5% to 2.9%
2.4% or lower
2015 2016 2017 2018 2019 2020 2022 2021 128 126 124 122 120 118 116 114 112 110 Unemployment Recession Period IN MILLIONS
Figure 3: Total Non-Farm Private Employment
Figure 4: Unemployment Rates by State, 2022 Annual Averages
GEM 2022-2023 United States Report 18 Introduction
The hot labor market became particularly challenging for entrepreneurs and business owners, and it raised wages and prices in the economy. Hiring became significantly more difficult during 2021 and 2022. By early 2022, there were two open positions available for every unemployed person. In addition, employers were losing employees in a phenomenon called the Great Resignation, which sprang up nationwide as a voluntary departure of employees from the workplace in large numbers. The Great Resignation, as shown in Figure 5, started in early 2021 and peaked in early 2022. The tight labor market raised wages and increased sign-up bonuses substantially, leading to greater aggregate demand. Coupled with the large savings households had accumulated during the pandemic, and the pandemic-related stimulus packages, the hot labor market contributed to the rise in general prices throughout the economy, in other words, to inflation.
After the first quarter of 2021, inflation rose from 1.7% in February to 4.2% in April, calculated based on the year-on-year change in the Consumer Price Index (CPI) for all goods, increasing for the first time since 2008. Inflation continued to increase thereafter at unprecedented rates, initially considered transitory by monetary policy authorities. Some evidence corroborated this belief. For example, supply chain disruptions caused by a number of factors, including the COVID-19 pandemic, the war in Ukraine, extreme weather events, and bottlenecks at western ports of the United States, led to higher prices for goods and services, as well as shortages of some products. In addition, the war in Ukraine raised energy prices, which in turn pushed up inflation. Many observers believed that these developments were temporary and their impact on prices would not be permanent.
2015 2016 2017 2018 2019 2020 2022 2021 3.5 3.0 2.5 2.0 1.5 1.0 0.5 0.0 Unemployment
Recession Period
Figure 5: The Great Resignation, Voluntary Quit Rate as a Share of Total Employment
Source of data: U.S. Bureau of Labor Statistics, Quits: Total Non-Farm (JTSQUR), retrieved from FRED, Federal Reserve Bank of St. Louis; https://fred.stlouisfed.org/series/JTSQUR, June 12, 2023.
Note: The gray box shows the recession period. Each tick mark on the horizontal axis shows the beginning of the year.
GEM 2022-2023 United States Report 19 Introduction
Figure 6: Inflation Rates as Year-on-Year Change of CPI, PCEPI, and Core PCEPI
Source of data: Author calculation from CPI, PCEPI, and Core PCEPI data.
Note: CPI, Organization for Economic Co-operation and Development; Consumer Price Index, Total All Items for the United States (CPALTT01USM657N), retrieved from FRED, Federal Reserve Bank of St. Louis; https://fred.stlouisfed.org/series/ CPALTT01USM657N, June 12, 2023.
PCEPI, U.S. Bureau of Economic Analysis; Personal Consumption Expenditures, Chain-type Price Index (PCEPI), retrieved from FRED, Federal Reserve Bank of St. Louis; https://fred.stlouisfed.org/series/PCEPI, June 12, 2023.
Core PCEPI, U.S. Bureau of Economic Analysis, Personal Consumption Expenditures Excluding Food and Energy (Chain-Type Price Index) (PCEPILFE), retrieved from FRED, Federal Reserve Bank of St. Louis; https://fred.stlouisfed.org/series/PCEPILFE, June 12, 2023.
By December 2021, however, the year-on-year CPI inflation rose to 7% (Figure 6), proving more stubborn than transitory. The trend continued until CPI-based inflation reached 9.1% in June 2022. Other more robust measures of inflation kept rising in this period as well: calculated based on the Personal Consumption Expenditure Price Index (PCEPI) and PCEPI excluding food and energy (Core PCEPI).
PCEPI was considered a better measure of prices for several reasons. First, it covered a broader set of goods and services: goods and services purchased by governments, firms, and non-profit institutions on behalf of consumers (such as health insurance), which CPI did not include. Second, PCEPI allowed weights to be updated regularly and more frequently, and it adapted more quickly to changes in consumption patterns. Third, PCEPI allowed accounting for substitution in consumption. When prices rise, households shift consumption from more expensive goods to less expensive ones. This means the effective price a consumer observes can be lower than if
they were consuming the same basket of goods and services as before. PCEPI accounted for this shift in consumption more than did CPI.1 The preferred measure of inflation, from the Federal Reserve perspective, is the year-on-year change in PCEPI that excludes expenditure on food and energy (Core PCEPI). This is because food and energy prices tend to be volatile. Excluding food and energy, the change in prices shows the underlying inflation in the economy rather than one that is affected by volatile prices of energy and food.
The pandemic-related stimulus packages, the large savings households accumulated during the pandemic, and the strong labor markets (low unemployment rates coupled with rising wages) kept aggregate demand high and led to continuous rise in prices. As depicted in Figure 6, all three measures of inflation rose in the 2021-2022 period. The CPI and PCEPI inflation measures reached their peak in June 2022 at 9.1% and 7%, respectively. Core PCEPI, however, peaked in
1 There are other benefits to PCEPI as well, which are more technical or less important than those mentioned here.
2015 2016 2017 2018 2019 2020 2022 2021 10.0% 8.0% 6.0% 4.0% 2.0% 0.0% –2.0% Core PCEPI PCEPI CPI Recession Period
GEM 2022-2023 United States Report 20 Introduction
February 2022, at 5.4%, and stabilized relatively by the middle of 2022 at around 5%.
These trends and the strong labor markets made clear to the Federal Reserve that inflation was more permanent than had been thought, and serious action was needed to bring it down. Therefore, starting in March 2022, the Federal Reserve raised interest rates continuously from near zero levels (0.08%) to 4.10% by the end of 2022 (Figure 7). This rapid interest rate hike succeeded in decreasing CPI-based inflation. Although higher interest rates stopped the rise in the (core) PCEPI-based inflation rate, they only decreased it modestly by the end of 2022. Nevertheless, the Federal Reserve clearly and frequently communicated it would raise interest rates until inflation was under control.2 In addition, it had been more successful than other central banks in taming inflation.
The substantial interest rate increase fueled recession fears throughout the second half of 2022. In the past, recessions had rarely been avoided after the Federal
Reserve raised interest rates to control inflation. The fear of a likely recession was significant for the period May-June of 2022 when the GEM Adult Population Survey (APS) was collected. Another concern was the possibility that inflation could become permanent, a threat to business activity and economic growth. The difficulty hiring and the Great Resignation added anxiety for employers, entrepreneurs, and business owners. Nevertheless, strong consumer spending, tight labor markets, and the fact that households were buffered by savings amassed during the pandemic provided hope. Prospects for the economy remained uncertain.
However, developments in late 2022 reduced fears of a serious recession. Consumer spending and labor markets remained strong, and economic activity continued to increase in the second half of 2022 (as depicted in Figure 1). The U.S. economy beat expectations and showed yet again its resilience and vigor.
2 The Federal Reserve continued to increase rates through April 2023 (the last data point available when this report was written). Rates for the CPI, PCEPI, and core PCEPI inflation declined to 5%, 4.4%, and 4.6%, respectively.
2015 2016 2017 2018 2019 2020 2022 2021 4.5 4.0 3.5 3.0 2.5 2.0 1.5 1.0 0.5 0.0
Unemployment
Recession Period
Figure 7: Inflation Rates (Year-on-Year Change of CPI, PCEPI, and Core PCEPI)
Source of data: Board of Governors of the Federal Reserve System (U.S.), Federal Funds Effective Rate (FEDFUNDS), retrieved from FRED, Federal Reserve Bank of St. Louis; https://fred.stlouisfed.org/series/FEDFUNDS, June 12, 2023. Note: The gray box shows the recession period. Each tick mark on the horizontal axis shows the beginning of the year.
GEM 2022-2023 United States Report 21 Introduction
GEM, co-founded by Babson College Professor William Bygrave and London Business School Professor
Michael Hay, is a consortium of national teams, primarily associated with top academic institutions, which conduct survey-based research on global entrepreneurship. The United States team is based at Babson College, which has supported the team with funding, academic researchers, and operational management since GEM’s first survey in 1999. Additionally, Babson College has been a generous sponsor of GEM Global.
Each summer since 1999, GEM has conducted random, representative surveys of at least 2,000 adults in each participating economy. This produces primary data on rates of entrepreneurship across multiple phases of the process, detailing the demographics, motivations, and ambitions of entrepreneurs, as well as characteristics of their businesses, such as the level of innovativeness and industry participation. Additionally, GEM uncovers a range of insights on the attitudes, selfperceptions, and affiliations in the adult population.
Figure 8 illustrates key GEM indicators. Total entrepreneurial activity (TEA) represents the proportion of the working-age adult population actively engaged in starting or running a new business. It is the sum of the “nascent” entrepreneurship rate (those who have not yet paid salaries for three months), and the “new”
business ownership rate (those who have paid wages for more than three months but less than three and a half years, minus any double-counting where entrepreneurs are engaged in both). Individuals who are running a business and have paid wages for three and a half years or more are categorized as established business owners. GEM also collects data on those who in the prior year closed a business or left a business that continued operations.
The GEM 2021-2022 United States Report describes survey results from the GEM 2022, conducted during the summer months. Chapter 1 covers TEA rates and other phases of business activity, as well as age profiles and entrepreneurial motives. Chapter 2 details the industries entrepreneurs and established business owners compete in, as well as levels of employment, market scope, and innovation. Chapter 3 assesses societal attitudes, affiliations, and self-perceptions about entrepreneurship in the U.S. adult population. Chapters 4 and 5 examine GEM indicators by gender and race/ethnicity, respectively. Finally, a special topic on social and environmental sustainability is the focus of Chapter 6. A key objective of this research is to advance understanding about entrepreneurship and help both the public and private sectors develop policies, programs, and initiatives that promote and support entrepreneurs.
Saranga Pagadala - Founder, RealMe In
Saranga Pagadala has worked on many start-ups, which led him to realize that the next generation has a completely different way of consuming information. Therefore, he built RealMe In, to bridge the gap between residential real estate agents and the next generation of home buyers.

GEM 2022-2023 United States Report 22 Introduction
POTENTIAL ENTREPRENEUR: opportunities, knowledge and skills
TOTAL EARLY-STAGE ENTREPRENEURIAL ACTIVITY (TEA)
NASCENT ENTREPRENEUR: involved in setting up a business
EXITING THE BUSINESS
OWNER-MANAGER OF A NEW BUSINESS (up to 3.5 years old)
OWNER-MANAGER OF AN ESTABLISHED BUSINESS (more than 3.5 years old)
CONCEPTION FIRM BIRTH PERSISTANCE
EARLY-STAGE ENTREPRENEURSHIP PROFILE
INDIVIDUAL ATTRIBUTES
• Gender
• Age
• Motivation IMPACT
• Business Growth
• Innovation
Source: Global Entrepreneurship Monitor 2022/2023 Global Report
• Market Scope
• Industry
Jevon Howell - Founder, ShopHowell
Jevon Howell delivers high-quality, e-commerce education and a comprehensive suite of tailored services to help grow brands through his consulting agency, ShopHowell. Jevon says that challenges and successes help his company make e-commerce accessible and easy for all.
 Figure 8: GEM Entrepreneurship Indicators
GEM 2022-2023 United States Report 23 Introduction
BUSINESS PHASES
PHASES BUSINESS
BUSINESS PHASES PHASES BUSINESS
BUSINESS PHASES
BUSINESS PHASES PHASES BUSINESS
BUSINESS PHASES PHASES BUSINESS
BUSINESS PHASES 01
BUSINESS PHASES
PHASES BUSINESS
BUSINESS PHASES
PHASES BUSINESS
BUSINESS PHASES
Jess Lynch - Founder, Wishroute

Jess Lynch’s brother was diagnosed with T1 diabetes, and her family experience helped her unique methodology when she founded Wishroute. Wishroute is a nextgeneration, customer engagement platform that increases customer retention and success for wellness companies through proactive, text-message coaching. Wishroute was acquired in 2023, and Jess now enjoys helping other founders by sharing her experience.
PHASES BUSINESS
BUSINESS PHASES
PHASES BUSINESS
PHASES BUSINESS
CHAPTER 1: Business Phases
Total Entrepreneurial Activity, Established Business Ownership, and Business Closure
Entrepreneurship rates rose in 2022 to the highest level reported in the United States since the start of the Global Entrepreneurship Monitor survey in 1999. Among workingage adults in this country, 19% were in the process of starting or running a business less than 42 months old.
Figure 9 shows the longitudinal pattern of TEA rates in the United States over 10 years. This indicator shows a continuous upward trend since 2015, with a slight drop in 2020, the first year of the COVID-19 pandemic, followed by a return to the upward trajectory.
TEA includes those in the nascent phase (in operation for less than three months) plus those in the new business phase (in operation from three to 42 months). The rise in TEA in 2022 was mostly due to an increase in new business activity, which exhibited a more than 60% increase over results reported two years prior (from 5% in 2020 to 8% in 2022), suggesting an increase in those committing to entrepreneurship beyond the start-up phase.
Figure 9 also shows longitudinal results for established business activity and business closure. Established business ownership hit a high point in 2019 but seemed to stall after that. At the same time, business closures
increased in 2020 and remained high thereafter, exhibiting a more than three-fourths increase from 2019 to 2022. Perhaps it could be the case that established business ownership will be revived in future years by the emergence of new businesses to replace those that did not last.
An examination of the balance between TEA and established business ownership can indicate the extent people are willing to venture into starting a business versus the extent people are running mature businesses. In some societies, start-up activity occurs for various reasons—many opportunities, a need for one to create their own job, societal acceptance or acclaim for entrepreneurship, and other motives, some of which will be covered in the next section. In other societies, these conditions in reverse may deter potential entrepreneurs. At the same time, these same conditions may also influence an individual’s ability to sustain their business beyond the start-up phase, along with other factors such as the ability to secure necessary financial and human resources over time, the regulatory environment, or industry dynamics like the nature of competition and value-chain activities.
2013 2014 2015 2016 2017 2018 2019 2020 2022 2021 25% 20% 15% 10% 5% 0% TEA EBO Closing a Business 19.2% 9.2% 5.2%
Figure 9: Total Entrepreneurial Activity, Established Business Ownership, and Business Closure Activity Among U.S. Adults (age 18-64), 2013-2021
GEM 2022-2023 United States Report 26
Source of data: Global Entrepreneurship Monitor, United States, 2013-2022.
With a slice-in-time view of this relationship, possible lagged effects must be kept in mind: for example, a surge in entrepreneurial activity may not reflect in established business ownership (or closures) for several years. In most cases, however, the ratio of start-up to established business activity in the United States is relatively constant over time, with some fluctuations.
Figure 10 shows TEA and established business ownership rates in 21 high-income economies that participated in the GEM 2022 survey. The United States has the third highest TEA rate in this group. Entrepreneurship levels are nearly twice the established business ownership levels, which could lead to questions about whether there is too much entrepreneurial activity and not enough maturity. However, the United States also has the third highest established business ownership rate in this group, suggesting both indicators are relatively high.
As Figure 10 reveals, the economies with the lowest entrepreneurship rates generally have nearly equal established business ownership rates, while those with the highest TEA rates have much lower relative established
business ownership levels. Could this reveal divergent approaches in different economies? For example, there may be cautious entry with conditions that enable continuity in some economies, versus many start-up attempts based on a notion that not all will be sustained, the latter perhaps characterizing the United States.
Interestingly, if one averages the EBO rates of the lowest one-third TEA economies, versus the highest one-third, the average is about the same (around 7%). Although a rough calculation, it may simply suggest different, but not necessarily good versus bad, approaches. What may be more important is knowing what compels many to start in the high TEA group and how the failures are treated. For example, is there an embrace of entrepreneurial experimentation and initiative, and are failures considered a learning experience where one can easily transition to alternative career opportunities or apply that learning to the next venture?
30 25 20 15 10 5 0
Netherlands Lithuania United
United
Saudi
United
EBO
Spain Japan Norway Austria Luxembourg Switzerland Slovenia Cyprus Israel Germany Sweden France Qatar Republic of Korea
Kingdom Canada
States
Arabia
Arab
TEA
Figure 10: Total Entrepreneurial Activity and Established Business Ownership in 21 High-Income Economies (GDP per Capita over $40,000 USD), 2022
GEM 2022-2023 United States Report 27 CHAPTER 1: Business Phases
Source of data: Global Entrepreneurship Monitor, 2022.
Entrepreneurial Intentions
Whether one can sustain a business they started is a key question for those concerned about entrepreneurship and its impact on society. Another important indicator measured in GEM is the pool of prospective entrepreneurs in an economy: those intending to start a business in the future. Entrepreneurial intentions, as measured in GEM, represents the percentage of people who intend to start a business in the next three years. In the United States, 13.6% of working-age adults expressed these intentions. This number seems to be relatively constant over time, fluctuating one or two percentage points in either direction around the 2022 number.
Entrepreneurial Motivations
Most entrepreneurs in the United States are motivated by the prospect of generating great wealth or a high income, with about an equal number wanting to make a difference in the world. The latter will be discussed more fully in Chapter 6. The United States is among those countries displaying high wealth motivation, but fewer in the United States are entering entrepreneurship out of necessity due to job scarcity (Figure 12). However, there was nearly a one-third rise in necessity motives from
As Figure 11 illustrates, fewer people in the United States intended to start a business than actually started. Many of the country’s high-income peer economies, on the other hand, show higher intentions than actual start-up activity. Higher intentions may mean a big pool of potential entrepreneurs and interest in entrepreneurship in a society, but perhaps with less support or incentive to act on these intentions. For the United States, lower intentions may mean that some people bypass, or spend little time in, the intentions stage, instead acting on their ambitions. In the end, it is perhaps more important to recognize that many people are in fact starting businesses in the United States.
2021 (46%) to 2022 (54.5%). Perhaps job insecurity experienced during the pandemic and the nature of the job market as unemployment eased led many to venture into entrepreneurship as a viable career choice.
Although fewer entrepreneurs had family-related motives in 2022 (36.5% versus 41.5% in 2021), it is nonetheless notable that this is still a relatively important motivator in the United States, as Figure 12 indicates.
50 45 40 35 30 25 20 15 10 5 0 Japan Austria Norway Germany Spain Switzerland United Kingdom Israel United States Sweden Luxembourg Canada Lithuania Slovenia France Netherlands Cyprus Republic of Korea Saudi Arabia Qatar United Arab Emirates TEA Intentions
Figure 11: Entrepreneurial Intentions and Total Entrepreneurial Activity in 21 High-Income Economies (GDP per Capita over $40,000 USD), 2022
GEM 2022-2023 United States Report 28 CHAPTER 1: Business Phases
Source of data: Global Entrepreneurship Monitor, United States, 2013-2022.
“To build great wealth or very high income”
“To earn a living because jobs are scarce”
“To continue a family tradition”
Source of data: Global Entrepreneurship Monitor, United States, 2013-2022.
100 90 80 70 60 50 40 30 20 10 0 Switzerland Austria Spain Japan France Netherlands Norway Lithuania Germany Luxembourg Sweden Slovenia United Kingdom Canada United Arab Emirates United States Israel Cyprus Republic of Korea Qatar Saudi Arabia 100 90 80 70 60 50 40 30 20 10 0 Sweden Republic of Korea Norway Japan Netherlands France Austria Luxembourg Switzerland Germany Israel United States Slovenia Canada Qatar Cyprus United Kingdom United Arab Emirates Lithuania Spain Saudi Arabia 100 90 80 70 60 50 40 30 20 10 0 Republic of Korea Switzerland Sweden Israel United Kingdom Austria Spain France Norway Lithuania Netherlands Cyprus Japan Slovenia Qatar Germany United Arab Emirates United States Luxembourg Canada Saudi Arabia
Figure 12: Motivations for Total Entrepreneurial Activity in 21 High-Income Economies (GDP per Capita over $40,000 USD), 2022
GEM 2022-2023 United States Report 29 CHAPTER 1: Business Phases
Figure 13: Total Entrepreneurial Activity Rates Among Adults (ages 18-34 and 35-64) in 21 High-Income Economies (GDP per Capita over $40,000 USD), 2022
Source of data: Global Entrepreneurship Monitor, 2022.
Age Profile of Entrepreneurship
In many economies, high rates of entrepreneurship are driven by the ambitions of young people, and this seems to be the case in the United States. As Figure 13 illustrates, with the exception of two Middle Eastern countries (United Arab Emirates and Saudi Arabia), the economies with high rates of entrepreneurship overall
exhibit more activity among those in early careers (age 18-34) than those in middle or late careers. In many of these economies, this younger age group has twice, or nearly twice, the rate of entrepreneurship as those in the older category, as was the case in the United States (27% versus 14.5%).
Carina Taylor - Founder, Mattoon Soap Co.
Carina Taylor is the CEO and founder of Mattoon Soap Co. and has turned her decade-long quest to alleviate her unique skin issues into a thriving venture. Discovering goat milk as a powerful remedy against persistent itching and hives, she developed a skincare line to help those suffering from dry skin, psoriasis, and eczema.

30 25 20 15 10 5 0 Norway Spain Japan Luxembourg Switzerland Austria Israel Qatar Republic of Korea France Sweden Cyprus Slovenia Germany United Kingdom Netherlands Lithuania Saudi Arabia Canada United Arab Emirates United States Percent of 35-64 Percent of 18-34
GEM 2022-2023 United States Report 30 CHAPTER 1: Business Phases
THE UNITED STATES REPORTED THE THIRD HIGHEST TEA RATE AMONG 21 HIGH-INCOME ECONOMIES.
AND ALSO THE THIRD HIGHEST ESTABLISHED BUSINESS OWNERSHIP RATE.
Summary
Entrepreneurship rates rose in 2022 to the highest level reported in the United States since the start of the Global Entrepreneurship Monitor survey in 1999, continuing an upward trend after a slight drop in 2020, the first year of the COVID-19 pandemic. In comparison among the 21 high-income economies that participated in the GEM 2022 survey, the United States reported the third highest TEA rate and also the third highest established business ownership rate. The United States is among those countries displaying high wealth/income motives. Although fewer stated they started a business out of necessity, this represents a nearly one-third rise from the prior year.
Renaud Megard - CEO, Nameplates For Industry
Renaud Megard decided to purchase a printing job shop and convert it to a global leader in printed graphic solutions. The company serves the biotech, aerospace, military, food and beverage, and telecommunication industries. Through acquisitions, the company has focused on organic growth and increased revenues by 600% over the last seven years.

GEM 2022-2023 United States Report 31 CHAPTER 1: Business Phases
IMPACT CHARACTERISTICS
CHARACTERISTICS
IMPACT CHARACTERISTICS
IMPACT CHARACTERISTICS
CHARACTERISTICS
IMPACT CHARACTERISTICS
CHARACTERISTICS
IMPACT CHARACTERISTICS
02
CHARACTERISTICS
IMPACT
CHARACTERISTICS
CHARACTERISTICS IMPACT
CHARACTERISTICS IMPACT CHARACTERISTICS
CHARACTERISTICS IMPACT
CHARACTERISTICS IMPACT CHARACTERISTICS
CHARACTERISTICS IMPACT
CHARACTERISTICS IMPACT CHARACTERISTICS
With his partner Chris West, Curtis Johnson started Wall Street Connection because they wanted all people to have access to opportunities in finance. Curtis and Chris are committed to closing the opportunity gap and providing lifelong networks through tailored mentorship, educational workshops, and investment competitions. They are breaking down barriers and working to empower and uplift the communities they serve.

CHARACTERISTICS IMPACT
CHARACTERISTICS IMPACT CHARACTERISTICS
CHARACTERISTICS IMPACT
Curtis Johnson - Co-Founder, Wall Street Connection
CHAPTER 2: Impact Characteristics
Information and Communication Technologies
Finance, Real Estate, Business Services
Health, Education, Government, Social and Consumer Services
Wholesale, Retail, Hospitality Manufacturing, Logistics Agriculture, Extractive, Construction
Industry Sector Participation
Global trends, technological innovation, and changes in consumer tastes are classic and typical factors that affect an individual’s decision to choose one industry over another when pursuing an entrepreneurial opportunity. Taken together, the decisions of individual entrepreneurs to enter one industry over another offer a snapshot of the types of opportunities currently being explored. The snapshot gives a preview of the near-term future of business activity and provides hints about the future evolution of industries. This constant variability makes tracking Total Entrepreneurial Activity across industry sectors a critical datapoint to watch in order to understand what entrepreneurs are doing today and where and how industries may evolve in the future.
As a technologically advanced, high-income economy, the United States has seen entrepreneurs put greater emphasis on knowledge-intensive industries and service-based sectors in the past few decades. However, as with many aspects of the United States and other global economies, the aftermath of the pandemic shows a recovery and an evolution that altered any expected straight-line growth by sector. The strong, entrepreneurial culture of the United States tends to emphasize industries like information technology, finance, and fin-tech, where start-up activity
relies on technology and creativity as drivers. Other trends and drivers appear to have a positive effect on retail and hospitality as consumers return to pre-pandemic routines. On the other hand, as more Americans experience the opportunity to work from home, and as some urban cores hollow out with deleterious effects on real estate, these trends have begun to impact business services and retail.
Figure 14 shows TEA rates for the United States across industry sectors for the years 2020 through 2022, representing the broad sectors where entrepreneurs have been starting businesses. A rebound from the pandemic seems apparent in the Wholesale, Retail, and Hospitality sectors which together show a 23% increase over the three-year period. Even greater growth can be seen in Manufacturing and Logistics which exhibits a 64% increase from 2020. And although relatively few entrepreneurs start businesses in information and communication technologies, the numbers in 2022 nonetheless showed a 46% increase from 2020. Conversely, Finance, Real Estate, and Business Services saw a 48% decline from 2020, with entrepreneurs starting these businesses in much lower numbers.
4.6% 29.6% 21.6% 22.4% 11.7% 10.2% 2020 4.5% 28.1% 21.2% 26.1% 12.2% 8.0% 2021 6.8% 15.5% 20.3% 27.5% 19.2% 10.8% 2022
Figure 14: Industry Breakdown for Total Entrepreneurial Activity in the United States, 2020-2022
GEM 2022-2023 United States Report 34
Source of data: Global Entrepreneurship Monitor, United States, 2020-2022.
Technology
Technology is often the tool propelling new business activity in the United States. Many entrepreneurs, however, are not just using technology to enable business activities but are also at the forefront of technology, developing ventures in highand medium-technology industries. In 2022, 12% of total entrepreneurial activity in the United States came from high-technology industries (examples are pharmaceuticals, medical, telecommunications, computers, and aircraft) and medium-technology (examples are chemicals, machinery, vehicles, transportation, architecture, and other technical activities).
As Figure 15 illustrates, with respect to the other high-income countries, the United States ranks only in the lowest third for entrepreneurs attempting to build
technology-based businesses. For one of the most technologically advanced countries in the world, these numbers may seem low. However, it is worth noting that this is just a percentage of the relatively high overall numbers of individuals starting ventures within the country. All economies with higher percentages of technology participation in Figure 15 have lower entrepreneurship rates than the United States. So in absolute terms, the United States has a high number of technology entrepreneurs. Still, among entrepreneurs and established business owners, only 12% participate in medium- or high-technology sectors. Compared to other high-income economies, the United States is mixed at best: keeping company with countries one would expect like Norway and Canada, but trailing most others.
25 20 15 10 5 0 Saudi Arabia Germany United Arab Emirates Norway Qatar Luxembourg United States Canada Cyprus Lithuania United Kingdom Netherlands Austria Republic of Korea Israel Japan Sweden France Switzerland Spain Slovenia EBO TEA
Figure 15: Percentage of Total Entrepreneurial Activity and Established Business Ownership Participating in Medium- and High-Technology Sectors in 21 High-Income Economies (GDP per Capita over $40,000 USD), 2022
GEM 2022-2023 United States Report 35
2: Impact Characteristics
Source of data: Global Entrepreneurship Monitor, 2022.
CHAPTER
Innovation and Use of Technologies in Commercialization
New ideas serve little purpose until they are commercialized or put to use, and entrepreneurs in the United States appear to be developing novel products and services in growing numbers. In 2022, 40% of TEA in the United States was being undertaken by entrepreneurs
bringing something new to market (Figure 16). This represents nearly double the percentage reported in 2020. It is interesting to note the scale of these innovations, as nearly a quarter of TEA focused on delivering a product or service either new to the country or new to the world. New
Source of data: Global Entrepreneurship Monitor, United States, 2019-2022.
Source of data: Global Entrepreneurship Monitor, United States, 2019-2022.
New to the world
New to people in your country
New to people in the area where you live
No, not a new product or service Don’t Know
to the world
New to people in your country
Don’t Know 8% 16% 5% 70% 1% 8% 11% 2% 79% 10% 12% 6% 70% 3% 10% 18% 12% 59% 2019 2020 2021 2022
New to people in the area where you live No, not a new product or service
Figure 16: Breakdown of TEA by Newness of Product or Service to Customers, 2022
6% 15% 5% 72% 2% 6% 11% 4% 79% 7% 10% 6% 75% 2% 12% 18% 10% 61% 2019 2020 2021 2022
Figure 17: Breakdown of TEA by Newness of Technologies or Procedures Used for Product or Service, 2019-2022
GEM 2022-2023 United States Report 36
CHAPTER 2: Impact Characteristics
Figure 18: New Job Creation Expectations for Total Entrepreneurial Activity and Established Business Ownership in the United States, 2018-2022
In addition to new-to-the-world products, entrepreneurs in the United States use new technology in developing and delivering their new products and services. Figure 17 shows that nearly 40% of entrepreneurs use new
Job Creation and Job Growth
Following the pandemic and the “Great Resignation,” job creation and unemployment figures continue to be difficult to understand fully. These metrics are critical for policy makers and other leaders to consider and vet carefully because entrepreneurs and business owners create jobs for others; they are key players who help grow local, regional, and national economies.
As Figure 18 illustrates, the expected rate of job creation for existing business owners is essentially the same over the two years 2021 and 2022. Under close inspection, important distinctions come to light. In both years, approximately 30% of established business owners expected to create new jobs in the next five years. However, in 2021, 11% of established business owners expected to create six or more jobs, while in 2022, 18% of established business owners indicated this expectation. Perhaps more important is what the bottom of Figure 18 reveals. In 2021, 13% of existing
technology and procedures to build their products or services. And once again, this number is close to double the use of new technology in 2020.
business owners expected their business to lose jobs over the next five years, but in 2022 just under 2% of these owners predicted job loss.
Entrepreneurs tend to be optimistic and often signal optimism via their expectation of how many employees they might need in the future. Entrepreneurs with elevated expectations for job creation are signaling confidence that they are developing a business that meets a clear need. These growth-oriented entrepreneurs are also indicating that they can recruit, hire, and develop others to help them successfully grow their venture.
Figure 18 shows greater job creation expectations among entrepreneurs than among established business owners. Over the past few years, the percentage of existing business owners expecting to create jobs hovered around 30%. Among entrepreneurs, this percentage exceeded 60% until 2021, then dropped
2018 6+ new jobs 1–5 new jobs No new jobs Less than zero new jobs (jobs loss) 31.8% 40.0% 26.6% 1.7% 2019 32.5% 32.6% 31.9% 3.0% 2020 27.5% 39.4% 32.5% 0.6% 2021 28.1% 35.4% 32.5% 4.0% 2022 25.1% 28.8% 44.2% 1.8%
2018 6+ new jobs 1–5 new jobs No new jobs Less than zero new jobs (jobs loss) 2019 2020 2021 2022 17.7% 13.4% 67.0% 1.9% 9.5% 19.4% 59.3% 11.8% 13.1% 20.6% 53.6% 12.6% 16.4% 17.9% 61.8% 3.9% 10.7% 19.5% 56.6% 13.3%
Source of data: Global Entrepreneurship Monitor, United States, 2019-2022.
TEA EBO GEM 2022-2023 United States Report 37 CHAPTER 2:
Characteristics
Impact
CHAPTER 2: Impact Characteristics
Figure 19: Percentage of TEA Projecting One to Five New Jobs and Over Six New Jobs in the Next Five Years in 21 High-Income Economies (GDP per Capita over $40,000 USD), 2022
Source of data: Global Entrepreneurship Monitor, 2022.
Figure 20: Percentage of Total Entrepreneurial Activity with International Revenue Among 21 High-Income Economies (GDP per Capita over $40,000 USD), 2022
Source of data: Global Entrepreneurship Monitor, 2022.
60% 50% 40% 30% 20% 10% 0% Saudi Arabia Republic of Korea Japan Israel United Kingdom Qatar United States Germany Spain Canada Sweden Switzerland Norway France Austria Lithuania Netherlands Cyprus United Arab Emirates Luxembourg Slovenia
100% 90% 80% 70% 60% 50% 40% 30% 20% 10% 0% Germany Israel Sweden Austria Japan Spain Canada Switzerland Netherlands United States United Kingdom Lithuania France Slovenia Norway Luxembourg Qatar Cyprus Saudi Arabia Republic of Korea United Arab Emirates Percent TEA 1-5 Percent TEA 6+
GEM 2022-2023 United States Report 38
to 54% in 2022, suggesting less optimism perhaps due to difficulties faced during the pandemic. The percentage of entrepreneurs projecting no jobs or job loss was over one-fourth higher in 2022 than in 2021, with established business owners reporting little change in this indicator. Whatever the cause, entrepreneurs ratchetted down expectations of job growth during post-pandemic years. It may be the case that entrepreneurs were opting for selfemployment, with little intention of becoming employers. Technology and flexible work location may have contributed to such trends.
International Scope
Since the United States is one of the largest single-state economies in the world, entrepreneurs have the advantage of not needing to grow internationally as they begin their venture. With over 330 million people, this massive market size affords early-stage entrepreneurs and established business owners the luxury to grow their businesses in a large, relatively homogenous, and familiar market. Without having to be concerned about currency exchange, importing and exporting, and a need to sell beyond national borders, entrepreneurs in the United States can keep administrative and other processes simple and efficient. However, this built-in, large-market advantage reduces both the need and
Summary
Job creation confidence by entrepreneurs in the United States was mid-level compared to other high-income economies. As Figure 19 depicts, the United States aligned with the Netherlands and the United Kingdom, in that about half of all entrepreneurs expected to create jobs over the next five years. With regard to expectations to create six or more jobs, the United States reported a level similar to France, Lithuania, Norway, and Saudi Arabia.
interest to develop international sales, compared to markets in other high-income economies.
Figure 20 shows the percentage of entrepreneurs running a new business who anticipate 25% or more of their revenue to come from customers outside their own country. For the 21 high-income economies, the United States has among the lowest international sales expectations. At 26%, entrepreneurs in the United States have approximately the same expectations for international sales as entrepreneurs in the United Kingdom, Qatar, and Germany. This percentage trails expectations of entrepreneurs in most high-income economies.
Entrepreneurs in the United States start businesses in a diversity of industries with strong participation in services. Few operate technology businesses, but many use technology in developing and delivering their products and services. Innovation levels returned to those of 2019 but remained below the 2021 average level of high-income economies participating in GEM. Survey results showed that a large number of established business owners employed only themselves or a few other persons, and that many projected job loss or no new jobs in the next five years. However, entrepreneurs expressed optimism about future job creation. A majority of entrepreneurs expected to sell primarily within the U.S. market versus internationally.
Dylan Zajac - Founder, Computers 4 People
Dylan Zajac was just 15 years old when he created the non-profit Computers 4 People to help alleviate the environmental impact of e-waste and bridge the digital divide. Through their efforts, the company has collected, refurbished, and donated over 1,800 computers, helping many to access jobs, education, and telehealth.

GEM 2022-2023 United States Report 39 CHAPTER 2: Impact Characteristics
SOCIETAL ATTITUDES, AND SELF-PERCEPTIONS
ENTREPRENEURSHIP
SOCIETAL ATTITUDES, AFFILIATIONS, AND SELF-PERCEPTIONS ABOUT ENTREPRENEURSHIP
ATTITUDES, AFFILIATIONS, SELF-PERCEPTIONS
ENTREPRENEURSHIP
ATTITUDES, AFFILIATIONS, SELF-PERCEPTIONS
ENTREPRENEURSHIP 03
ATTITUDES, AFFILIATIONS, SELF-PERCEPTIONS ABOUT ENTREPRENEURSHIP SOCIETAL AFFILIATIONS, AND SELF-PERCEPTIONS ABOUT ENTREPRENEURSHIP SOCIETAL AFFILIATIONS, AND SELF-PERCEPTIONS ABOUT ENTREPRENEURSHIP SOCIETAL
PetPax Co aims to improve the life of pet’s by providing high-quality, reliable, and innovative pet supplements, beginning with canine-specific formulations. The company excels in branding and positioning, enabling them to stand out in the competitive market for dog products and supplements.
 Anthony Gatti and Nathan RuffFounders, PetPax Co.
ABOUT STARTING A NEW BUSINESS AS A DESIRABLE CAREER CHOICE remained
Societal Attitudes
The economic uncertainty driven by the pandemic tapered off as the economy showed signs of recovery. High inflation and the Federal Reserve’s commitment to curb inflation by tightening the money supply brought new economic uncertainty. However, three indicators of societal attitudes toward entrepreneurship showed no change or very slight change in 2022, as Figure 21 illustrates. Attitudes about starting a new business as a desirable career choice remained at the record high level set in 2021.
Perceptions of status and respect for successful entrepreneurs remained at the high level shown in 2018 (Figure 21). In addition, perceptions of the frequency of media and internet stories about successful entrepreneurs stayed relatively the same as the previous year. Together, these perceptions may have remained high amidst economic uncertainty because
society views entrepreneurs as having greater flexibility and control than large corporations in adapting to changing conditions.
Respondent perceptions about the ease of starting a business exhibited a significant change from the previous year: 66% of adults believed it was easy to start a business in 2022, a 14% drop from 2021. This percentage placed the United States in the middle among high-income economies, as Figure 22 shows. Nonetheless, two-thirds of Americans believed it easy to start a business. Combined with the three indicators above, this signals positive overall societal attitudes about entrepreneurship in the United States.
Jake Ross - Founder, Build You
Jake Ross is passionate about empowering small businesses to thrive and build vibrant communities through strategic marketing and public relations initiatives. He founded Build You, a full-service marketing and PR agency to work as a trusted partner to small and medium-sized businesses.

GEM 2022-2023 United States Report 42 CHAPTER 3: Societal Attitudes, Affiliations, and Self-Perceptions About Entrepreneurship
ATTITUDES
at the record high level set in 2021.
CHAPTER 3: Societal Attitudes, Affiliations, and Self-Perceptions About Entrepreneurship
Figure 21: Societal Attitudes About Entrepreneurship in the U.S. Adult Population, 2016-2022
Source of data: Global Entrepreneurship Monitor, United States, 2016-2022.
Figure 22: Percentage of the Adult Population who Believe it is Easy to Start a Business in 21 High-Income Economies (GDP per Capita over $40,000 USD), 2022
Source of data: Global Entrepreneurship Monitor, 2022.
2016 2017 2018 2019 2020 2022 2021 85% 80% 75% 70% 65% 60% 55% 50% Good Career High Status Media Attention 80% 76% 76%
100 90 80 70 60 50 40 30 20 10 0 Israel Japan Spain Germany Lithuania Republic of Korea Cyprus Austria France Canada Luxembourg United States United Kingdom Switzerland Qatar Slovenia United Arab Emirates Sweden Norway Netherlands Saudi Arabia
GEM 2022-2023 United States Report 43
CHAPTER 3: Societal Attitudes, Affiliations, and Self-Perceptions About Entrepreneurship
Source of data: Global Entrepreneurship Monitor, United States, 2013-2022.
2013 2014 2015 2016 2017 2018 2019 2020 2022 2021 70% 60% 50% 40% 30% 20% 10% 0% 56%
Figure 23: Percentage of the U.S. Adult Population who Know an Entrepreneur Personally, 2013-2021
2013 2014 2015 2016 2017 2018 2019 2020 2022 2021 80% 70% 60% 50% 40% 30% 20% 10% 0% 46% 67% 43% Perceived Opportunity Skills Fear of Failure
Source of data: Global Entrepreneurship Monitor, United States, 2013-2022.
Figure 24: Opportunity Perceptions, Capability Perceptions, and Fear of Failure in the U.S. Adult Population, 2013-2022
GEM 2022-2023 United States Report 44
CHAPTER 3: Societal Attitudes, Affiliations, and Self-Perceptions About Entrepreneurship
Affiliations and Self-Perceptions
Personal relationships with entrepreneurs increased significantly in 2019 and stayed high thereafter, although edging down slightly in 2022 (Figure 23). Even though people had fewer in-person interactions during the COVID19 restrictions of 2020 and 2021, they still acknowledged these personal relationships. This increase in affiliations could be due to higher entrepreneurship levels, but also to the ease with which communication occurred through popular applications like Zoom, allowing connections to be made and maintained online.
Like entrepreneurial affiliations, capability perceptions experienced a significant increase in 2019, remaining high through 2022, when two-thirds of U.S. respondents believed they possessed the requisite knowledge and skills to start a business (Figure 24). The United States ranked third highest among the 21 high-income economies for this indicator, behind Saudi Arabia and the United Arab Emirates. The high rank of the United States may reflect confidence, as well as capabilities developed through experience, higher education, non-school programs, and the abundance of training and information on the internet.
Summary
Perceived opportunities for starting a business declined by 27% in 2022, among the lowest levels reported by the United States over the prior 10 years. The decline may have been partly due to the U.S. inflation rate reaching the highest level in 40 years, coupled with ongoing fears of recession. The United States ranked fourteenth in 2022 on this indicator among the 21 high-income economies, with Saudi Arabia, Qatar, and Sweden perceiving the highest level of opportunities.
The decline in perceived opportunities for starting a business (above) and the 14% decline in perceptions about the ease of starting a business suggest hesitancy about the environment for starting a business. Given these declines and the uncertain economic climate, fear of failure remained high among those seeing opportunities, remaining at the levels reached in 2020 and 2021. However, risk aversion is not unusual among developed economies. The United States was about in the middle of the high-income group in a rank order of this measure, with a result similar to economies like Qatar and Israel.
U.S. survey respondents continued to hold positive perceptions of entrepreneurship as a career choice and of the status and media attention entrepreneurs receive. They expressed strong confidence that they possessed the requisite knowledge and skills to start a business. These results indicate a population supported, poised, and prepared to start a new business. However, U.S. respondents in 2022 exhibited lower perceptions about the ease of starting a business, a steep decline in perceived opportunities, and a continuing high fear of failure, indicating caution about the environment for entrepreneurship in the general adult population.
Alice Stone - Founder, Sipify®
Alice Stone loves hot coffee but hates how it stains her teeth. Sipping with straws prevents teeth staining, but regular straws in hot drinks can scald. Sipify® provides a straw that delivers a hot sip that does not scald.

GEM 2022-2023 United States Report 45
GENDER IN ENTREPRENEURSHIPGENDER
ENTREPRENEURSHIP
GENDER IN ENTREPRENEURSHIP
GENDER IN ENTREPRENEURSHIP
ENTREPRENEURSHIP
GENDER IN ENTREPRENEURSHIP
ENTREPRENEURSHIP
GENDER IN ENTREPRENEURSHIP
GENDER IN ENTREPRENEURSHIP 04
ENTREPRENEURSHIP
ENTREPRENEURSHIP GENDER IN ENTREPRENEURSHIP
ENTREPRENEURSHIP GENDER
ENTREPRENEURSHIP GENDER IN ENTREPRENEURSHIP
ENTREPRENEURSHIP GENDER
Dr. Cheryl Shao - Founder, Sympal
ENTREPRENEURSHIP GENDER IN ENTREPRENEURSHIP
Dr. Cheryl Shao is a dentist, founder, and CEO at Sympal, a company that provides an orthodontic clear alignment system. Their patented design treats the cause of crooked teeth, rather than just the symptoms. Sympal takes into consideration the face, airway, and temporomandibular joint (TMJ).

ENTREPRENEURSHIP GENDER
ENTREPRENEURSHIP GENDER IN
ENTREPRENEURSHIPGENDER
ENTREPRENEURSHIP
ENTREPRENEURSHIP
CHAPTER 4: Gender in Entrepreneurship
2013 2014 2015 2016 2017 2018 2019 2020 2022 2021 70% 60% 50% 40% 30% 20% 10% 0% Male Female 58% 53%
Figure 26: Entrepreneurial Affiliations by Gender in the U.S. Adult Population, 2013-2022
CAREER CHOICE 73.9 77.9 79.8 79.9 75.6 77.0 67.5 63.9 STATUS AND RESPECT MEDIA ATTENTION EASY TO START 85% 80% 75% 70% 65% 60% 55% 50% Female Male
Source of data: Global Entrepreneurship Monitor, United States, 2013-2022.
Figure 25: Societal Attitudes by Gender in the U.S. Adult Population, 2022
GEM 202-2023 United States Report 48
Source of data: Global Entrepreneurship Monitor, United States, 2022.
Societal Attitudes
The 2022 GEM survey marked two years after the onset of the COVID-19 pandemic. Results began to show signs of improvement for women entrepreneurs in their attitudes, start-up rates, innovations, and growth. There were positive signs the gender gap was narrowing in terms of attitudes. Since 2016, women’s perceptions of entrepreneurship as a good career choice rose from 64% to 78% in 2022. Consistent with the 2021 results, women in 2022 perceived
CHAPTER 4: Gender in Entrepreneurship
entrepreneurship as a good career choice at a slightly higher rate than men (Figure 25).
As in prior years, women and men both perceived that entrepreneurs were accorded high status and respect. Similarly, women believed that entrepreneurs were portrayed positively in the media. However, men were more likely to believe it was easy to start a business, although the gender gap for this indicator had narrowed since 2019. Overall, the gender gap had closed somewhat on attitudes toward entrepreneurship.
Jacky Lamenzo Sinha - Founder, Lemon House Publishing
Jacky Lamenzo Sinha is the founder of Lemon House Publishing. After writing her first children’s book in 2019, she developed a curriculum to teach kids the process of becoming an author. As stated on the company website, Lemon House Publishing strives to help young writers build confidence by guiding them through the process of writing and publishing their own books.

GEM 2022-2023 United States Report 49
SINCE 2016, WOMEN’S PERCEPTIONS OF ENTREPRENEURSHIP AS A GOOD CAREER CHOICE ROSE FROM 64% to 78%
Affiliations and Self-Perceptions
The majority of women survey respondents stated they knew at least one entrepreneur, a slight decline from 2021, with men continuing a gradual decline since 2019. However, both genders have reported high levels on this indicator since 2019, with the gender difference remaining quite small (Figure 26).
Opportunity perceptions by women exhibited a onefourth drop in 2022 from the prior year, with men showing an even steeper decline. Historically, women have lagged men in opportunity perceptions, but in 2022 the gender gap was the smallest it has ever been. However, perceptions for both men and women matched the lowest rates over time, most recently during the pandemic in 2020.
A key factor influencing the decision to start a venture is whether one believes they have the capabilities to start a business. Believing one can identify an opportunity, build a team, acquire resources, and
launch a venture are directly related to the likelihood of start-up. Capability perceptions increased for both genders in 2019 and held relatively steady through 2022, as Figure 27 illustrates. A fairly consistent gender gap appeared in this indicator, where women are about one-fifth less likely than men to state they have the ability to start a business. Still, results showed that the majority of women (60%) believed they had entrepreneurial capabilities.
Historically, women have always expressed a greater fear of failure, but after near parity in 2021, the gender gap grew slightly in 2022, with women more likely than men to express fear of failure. While this indicator has remained within 10 percentage points for most of GEM’s history, a rate of 45% for this indicator matches the high point reached during the pandemic.
60% ENTREPRENEURIAL CAPABILITIES
Chloe Samaha - Founder, BOND
Chloe Samaha developed BOND to address the issues of workplace isolation and lack of collaboration. The BOND platform utilizes gamification to build strong communities and foster team collaboration.

OF WOMEN BELIEVED THEY HAD
GEM 202-2023 United States Report 50 CHAPTER 4: Gender in Entrepreneurship
Opportunity Perceptions
CHAPTER 4: Gender in Entrepreneurship
Capability Perceptions
80% 70% 60% 50% 40% 30% 20% 10% 0% Men Women 47% 45% 2013 2014 2015 2016 2017 2018 2019 2020 2022 2021 80% 70% 60% 50% 40% 30% 20% 10% 0% Men Women 73% 60% 2013 2014 2015 2016 2017 2018 2019 2020 2022 2021 50% 40% 30% 20% 10% 0% Men Women 45% 41% 2013 2014 2015 2016 2017 2018 2019 2020 2022 2021 Source of data: Global Entrepreneurship Monitor, United States, 2013-2022. Fear of Failure
Figure 27: Entrepreneurial Self-Perceptions by Gender in the U.S. Adult Population, 2013-2022
GEM 2022-2023 United States Report 51
Business Phases
Entrepreneurial intentions are widely believed to be a precursor to entrepreneurial activity. An examination of intentions over the past 10 years shows a fairly stable trend for both men and women with a few small spikes, for men in 2017 and for women in 2021 (Figure 28). Intentions for men remained stable after 2019 at about 15%, while for women, the rate has varied between 10% and 12% for the past 10 years. After near parity in 2021, the gender gap returned in 2022, with women over one-fourth less likely than men to have entrepreneurial intentions.
25% 20% 15% 10% 5% 0% Men Women 15.7% 11.6% 2013 2014 2015 2016 2017 2018 2019 2020 2022 2021
25% 20% 15% 10% 5% 0% Men Women 20.3% 18.1% 2013 2014 2015 2016 2017 2018 2019 2020 2022 2021 TEA Intentions GEM 202-2023 United States Report 52
Figure 28: Entrepreneurial Intentions, Total Entrepreneurial Activity, Established Business Ownership, and Business Closure by Gender in the U.S. Adult Population, 2013-2022
CHAPTER 4: Gender in Entrepreneurship
Established Business Activity
CHAPTER 4: Gender in Entrepreneurship
Business Closure*
Source of data: Global Entrepreneurship Monitor, United States, 2013-2022. *Data available from 2014 for Business Closure.
The TEA rate for women entrepreneurs continued positive after 2020 with 2022 showing a one-third increase. Also in 2022, the gender gap of around 10% matched the gap exhibited in 2019. TEA rates for both men and women were the highest seen in GEM history.
Rates of established business ownership remained steady from 2021 with women running one-fourth lower than men on this indicator. Yet business closure rates for women rose in 2022, with only a nominal rise for men. However, the rates for men and women were nearly equal and overall quite small in 2022 (Figure 28).
25% 20% 15% 10% 5% 0% Men Women 7.9% 10.5% 2013 2014 2015 2016 2017 2018 2019 2020 2022 2021 10% 9% 8% 7% 6% 5% 4% 3% 2% 1% 0% Men Women 5.1% 5.4% 2014 2015 2016 2017 2018 2019 2020 2022 2021
GEM 2022-2023 United States Report 53
CHAPTER 4: Gender in Entrepreneurship
30 25 20 15 10 5 0 Japan Norway Cyprus Luxembourg Slovenia Spain Austria Switzerland Israel Sweden Germany France Republic of Korea Lithuania Netherlands United Kingdom Qatar Canada Saudi Arabia United States United Arab Emirates
MALE
FEMALE
Figure 29: Total Entrepreneurial Activity by Gender in 21 High-Income Economies (GDP per Capita over $40,000 USD), 2022
30 25 20 15 10 5 0 Qatar France Germany United Arab Emirates Sweden Norway Luxembourg Israel Cyprus Japan United Kingdom Netherlands Canada Lithuania Austria Slovenia Spain United States Switzerland Saudi Arabia Republic of Korea
Source of data: Global Entrepreneurship Monitor, 2022.
MALE
FEMALE
Figure 30: Established Business Ownership (EBO) by Gender in 21 High-Income Economies (GDP per Capita over $40,000 USD), 2022
GEM 202-2023 United States Report 54
Source of data: Global Entrepreneurship Monitor, 2022.
Compared to the other high-income economies, the United States reported one of the highest TEA rates for both men and women, over 18% for both genders (Figure 29). Only Spain and Qatar notched equal TEA rates for men and women. The United States exhibited the third lowest gender gap among the 21 high-income economies in terms of the percentage difference among men and women. Only the UAE showed rates for women’s entrepreneurship greater than those of the United States. This combination of comparatively high rates and low gender gap is one that has not been seen for several years.
Entrepreneurial Motivations
Motivations for starting a new business shifted in 2022. Women and men entrepreneurs expressed a similar desire to make a difference in the world, with little change from 2021 (Figure 31). Survey results showed that men continued to be motivated by a drive to build great wealth or income, while this motivation dropped for women. Similarly, the motivation to continue a family tradition dropped by over one-third for women while this same indicator rose for men.
The rates for established business ownership in highincome economies tell a slightly different story from the rates for entrepreneurship. Israel, Saudi Arabia, and Switzerland reported parity for men and women. The United States, Spain, and Canada reported a gender gap of one-fourth or less (Figure 30). Along with the United States, three other countries showed a rate of 8% or more for female established business ownership: Switzerland, Saudi Arabia, and the Republic of Korea.
The motive that increased for both genders in 2022 was necessity to earn a living due to scarcity of jobs. This motive was at parity in 2021, when 46% of men and women entrepreneurs cited necessity to earn a living. In 2022, this indicator increased by over onefourth for women while increasing a smaller amount for men.
68.4 70.4 77.9 62.9 42.1 30.3 51.3 57.9
TO MAKE A DIFFERENCE IN THE WORLD
TO BUILD GREATH WEALTH OR A VERY HIGH INCOME TO CONTINUE A FAMILY TRADITION
90% 80% 70% 60% 50% 40% 30% 20% 10% 0%
Male
TO EARN A LIVING BECAUSE JOBS ARE SCARCE
Female
Figure 31: Motivations for Total Entrepreneurial Activity by Gender in the United States, 2022
Source of data: Global Entrepreneurship Monitor, United States, 2022.
GEM 2022-2023 United States Report 55 CHAPTER 4:
Entrepreneurship
Gender in
CHAPTER 4: Gender in Entrepreneurship
Source of data: Global Entrepreneurship Monitor, United States, 2022.
Industry Sector
Industry sector participation revealed dramatic changes after 2021 and longitudinally over time. Women were as likely as men to launch manufacturing and transportation businesses in 2022. This represented increases for both genders from the prior year, but more so for women, advancing from 6.2% in 2021 to 19% in 2022. Further analysis of this sector showed nearly 18% of women starting in manufacturing and slightly more than 1% in transportation, while for men approximately 9% for each of these sectors. Thus, women entrepreneurs were starting manufacturing businesses at twice the rate of men entrepreneurs.
Women’s participation in the Wholesale and Retail sector, and in Health, Education, Government and Social Services, rose dramatically in 2022. The year 2022 marked the highest percentages participating in these sectors over the prior six years. Together with
manufacturing and transportation, these three sectors accounted for 73% of women’s entrepreneurship activity, but only 55% for men (Figure 32).
Other sectors also showed significant change. Women’s participation in finance and real estate dropped by 30% from 2021. Men showed a smaller decline of 22% in this sector. Both men and women were less likely than in previous years to participate in professional and administrative services; for women, the rate of participation in this sector was 21.3% in 2020, three times the 2022 level. Men’s participation in the information, communication, and technology sector more than tripled over the 2021 level of 3.1%, while the rate for women decreased by 28%.
9.2% Female Male 22.6% 32.7% 19.3% 19.1% 7.4% 14.0% 3.7% 13.2% 8.7% 6.3% 6.8% 9.7% 3.6% 2.7% 21.3% Agriculture and Mining Manufacturing and Transportation Wholesale/Retail Information and Communication Technology Personal/Consumer Services Finance/Real Estate Professional and Administrative
Health, Education, Government and Social
Services
Services
Figure 32: Industry Sector Participation for Total Entrepreneurial Activity by Gender in the U.S. Adult Population, 2022
GEM 202-2023 United States Report 56
Job Growth Expectations
Post-pandemic expectations for job growth over the next five years altered for both men and women. Expectation of job loss for both men and women dropped to under 2% (Figure 33), about half the level reported in 2021. However, in 2021, 27% of men entrepreneurs and 39% of women entrepreneurs did not expect to create new jobs; and these numbers rose to nearly equal levels for both genders. As Figure 33 illustrates, women were more likely than men to anticipate adding one to five jobs, but men were more likely to expect adding more than six jobs. For established business owners, the patterns were similar in that a tiny percentage of men and women, less than 3%, expected job losses; but the percentage of those expecting not to add new jobs rose by about one-fifth for both genders. The number of women and men established business owners expecting to add one to five employees declined by about one third from 2021. Men established business owners expected to add six or more employees at twice the level of women, but women showed a large increase from the 6% reported in 2021.
CHAPTER 4: Gender in Entrepreneurship
Luis Martin Vinas is launching Develop US, a company dedicated to assisting individuals and businesses in the United States with their IT needs. He is prioritizing transparency, time efficiency, and open communication to deliver the best possible service to his clients.

TEA Male 6+ new jobs 1–5 new jobs No new jobs Less than zero new jobs (job loss) 30% 24% 44% 1.8% TEA Female 20% 34% 45% 1.9% EBO Male 23% 11% 65% 1.2% EBO Female 11% 16% 70% 2.9%
Figure 33: Job Creation Expectations for Total Entrepreneurial Activity by Gender in the U.S. Adult Population, 2022
Source of data: Global Entrepreneurship Monitor, United States, 2022.
Luis Martin Vinas - Founder, Develop US
GEM 2022-2023 United States Report 57
CHAPTER 4: Gender in Entrepreneurship
Market Scope
The market scope of male and female entrepreneurs was similar but with marginal differences. Men were more likely to operate businesses with a local market scope than
women, and women were more likely to run businesses with a national market scope (Figure 34). Finally, men were more likely to operate businesses internationally.
International market scope National market scope Local market scope only Male 28.2% 32.8% 35.7% Female 24.4% 39.9% 30.0%
Figure 34: Market Scope for Total Entrepreneurial Activity by Gender in the U.S. Adult Population, 2022
Male 16% 9% 16% 58% Female 12% 8% 20% 61%
to the world
country
Source of data: Global Entrepreneurship Monitor, United States, 2022.
New
New to people in your
New to people in the area where you live
service
No, not a new product or
Figure 35: Innovation for Total Entrepreneurial Activity by Gender in the U.S. Adult Population, 2022
Source of data: Global Entrepreneurship Monitor, United States, 2022.
GEM 202-2023 United States Report 58
Innovation and the Use of New Technology
With regard to innovation of products/services among men and women entrepreneurs, there are slight differences by gender, although approximately 60% of all entrepreneurs do not consider their product or service to be new. However, women are more likely than men to believe their product or service is new to the people in the area where they live; and women are also more likely than men to believe their product or service is new to the world. Men are twice as
Summary
likely as women to believe their product or service is new to the people in their country (Figure 35). Similarly, the majority of women and men entrepreneurs do not perceive as new the technologies they use to produce or deliver their product or service. However, men are more likely than women to perceive their use of technologies as new across all levels (Figure 36).
Overall, the picture of women’s entrepreneurship in the United States for 2022 is quite positive. Although the United States has not yet reached gender parity, trends are moving in a positive direction. Survey results for 2022 suggest a softening of some attitudes among women, in terms of knowing an entrepreneur and opportunity perceptions. Additionally, fear of failure remains somewhat high. However, women’s beliefs in their capabilities for starting a business are the highest ever for women in the United States. TEA rates are close to gender parity, with the United States exhibiting among the highest rates for women in the high-income group of economies participating in GEM in 2022.
Perhaps the most interesting findings can be seen in the significant shifts in industry participation. It is possible that businesses started in 2022 by women and men may be due to new economic realities and work-life changes caused by the pandemic. For example, the increase in retail businesses for women could be linked to improved e-commerce and digital technologies, which facilitate product and service sales and transactions. Moreover, given the increase in necessity motives among women, those who needed a job because they could not find other sources of employment may have found it easy to launch a retail business, given this sector’s historically low entry barriers. Such dramatic changes in industry sector in one year are unusual for the U.S. economy.
Male 11% 13% 21% 54% Female 11% 8% 14% 68% New to the world New to people in your country New to people in the area where you live No, not a new product or service
Figure 36: Use of Technologies for Total Entrepreneurial Activity by Gender in the U.S. Adult Population, 2022
Source of data: Global Entrepreneurship Monitor, United States, 2022.
GEM 2022-2023 United States Report 59 CHAPTER
4: Gender in Entrepreneurship
RACE AND ETHNICITY
ETHNICITY RACE AND ETHNICITY RACE
RACE AND ETHNICITY
RACE AND ETHNICITY
ETHNICITY RACE AND ETHNICITY RACE
RACE AND ETHNICITY
ETHNICITY RACE AND ETHNICITY RACE 05
ETHNICITY RACE AND AND ETHNICITY RACE
RACE AND ETHNICITY
ETHNICITY RACE AND AND ETHNICITY RACE
Damian Felchlin and Aakash ShahFounders, High Time Foods
RACE AND ETHNICITY
Aakash Shah and Damian Felchlin founded High Time Foods with the mission to empower chefs around the world by providing nutritious, shelf-stable, cuisine-agnostic, plant-based, meat alternatives that are versatile and affordable.
ETHNICITY RACE AND AND ETHNICITY RACE
RACE AND ETHNICITY
Societal Attitudes About Entrepreneurship
The United States exhibits high (positive) attitudes about entrepreneurship, with some differences among racial and ethnic lines, as this chapter reveals. Although the GEM survey collects data on many racial/ethnic categories, only three provided sufficient numbers to draw reliable conclusions.
Differences in attitudes about entrepreneurship among societal groups can be influenced by many factors. For example, people often weigh entrepreneurship against other job alternatives; and if these alternatives are more available or attractive to some groups than others, this could lead to differences in the appeal of entrepreneurship among these groups. Moreover, if one has good job options, in order to forgo these opportunities one would need to start a business with higher potential but likely more challenges, compared to someone who had fewer options. This may result in lower attitudes about entrepreneurship.
In addition, people identify with those like themselves, so they may be influenced by those they see around them and in the media, judging whether they could do something similar. Perceptions about the ease of starting a business, for example, may be influenced by one’s own confidence or the encouragement of those around them, perhaps including role models, advisors, financiers, supportive family and friends, and even co-founders. Differential perceptions about the extent to which barriers exist can also
affect attitudes. How barriers and other factors vary across societal groups may impact perceptions of entrepreneurship.
Figure 37 shows that all three groups examined hold positive attitudes about entrepreneurship. Black people and Hispanic people have a more positive view of entrepreneurship as a career than do White people. All three groups are highly likely to believe that entrepreneurs have high status, with perhaps the Hispanic population thinking a little more positively on this indicator.
White people are comparatively less likely than Black or Hispanic people to think that entrepreneurs are represented positively in the media, and this is consistent with GEM survey results of the prior year. This is interesting given that many of the most visible entrepreneurs in the U.S. media are White, for example Jeff Bezos, Elon Musk, and Mark Zuckerberg. Of course, there is certainly negative press about these entrepreneurs, so although they are visible, the media also show their dark side.
The Hispanic population has a higher perception than the other two groups about the ease of getting started. This indicator increased from the 2021 survey, when 68% of Hispanic people felt it was easy to start a business, compared to minimal variations from year to year in perceptions by the other two groups.
73.9 84.5 85.4 GOOD CAREER* 80.0 79.0 83.8 HIGH STATUS** 74.4 83.5 80.9 MEDIA^ 64.0 68.5 76.1 EAST OF START^^ 90% 85% 80% 75% 70% 65% 60% 55% 50%
Black Hispanic White
Figure 37: Societal Attitudes by Race and Ethnicity in the U.S. Adult Population, 2022
GEM 2022-2023 United States Report 62
Source of data: Global Entrepreneurship Monitor, United States, 2022.
CHAPTER 5: Race and Ethnicity
Entrepreneurial Affiliations and Self-Perception
The attitudes reviewed above differed across the three groups in terms of how people see entrepreneurship in society. Greater differentiation exists in self-perceptions and actual affiliations with entrepreneurs (Figure 38). These signal most closely one’s personal inspiration and impressions about starting a business.
White people were much less likely than Black or Hispanic people to know an entrepreneur personally. Taken together with the lower results on media attention, the results suggest that White people see less positive visibility and have less interaction with entrepreneurs. In comparison, around two-thirds of both Black and Hispanic people know entrepreneurs personally. These affiliations provide close role models and supporters, as well as a variety of potential stakeholders for those venturing into entrepreneurship.
White people are less likely than Black or Hispanic people to perceive entrepreneurial opportunities around them, and this indicator is at a level more than onethird lower than in 2021 (61%). This indicator also
decreased among Black people but remained relatively high. However, among those who see opportunities, there is high fear of failure, especially in the White population. This indicator can be influenced by one’s belief about the risks and consequences of failing, as well as the missed opportunities one would choose not to pursue in order to take on this risk.
For the Hispanic population especially, notwithstanding their positive attitudes, affiliations, and opportunity perceptions, this group of survey respondents expressed lower perceptions about their capabilities for entrepreneurship, although this measure increased by 10% over the 2021 results (56%). Compared to White and Hispanic survey respondents, Black people indicated higher confidence in their ability to start a business, and their response was identical to the number for the prior year. Despite indications that entrepreneurship may be less attractive or less visible among the White population, capability perceptions in this group remain high and are increasing.
50.0 68.3 65.9 KNOW ENTREPRENEURS 39.9 65.0 58.7 PERCEIVED OPPORTUNITY 67.2 73.2 61.4 SKILLS 43.8 39.3 38.1 FEAR OF FAILURE 80% 70% 60% 50% 40% 30% 20% 10% 0%
Black Hispanic White
Figure 38: Entrepreneurial Affiliations and Self-Perceptions by Race and Ethnicity in the U.S. Adult Population, 2022
GEM 2022-2023 United States Report 63 CHAPTER 5: Race and Ethnicity
Source of data: Global Entrepreneurship Monitor, United States, 2022.
CHAPTER 5: Race and Ethnicity
Intentions, Total Entrepreneurial Activity, Established Business Ownership, and Business Closure
It is logical to assume that positive attitudes, affiliations, and perceptions about entrepreneurship are critical drivers of this activity in a society. However, it is important to assess entrepreneurial intentions and activity in order to understand actual entrepreneurial behaviors and actions.
As Figure 39 indicates, Black people have high intentions to start businesses, and they are taking action to do so, with over one-third of survey respondents in the early stages of starting a business. Hispanic people are slightly less likely than Black people to have intentions, and they exhibit lower TEA rates. However, their TEA indicator increased by 60% from 2021 (17%), perhaps consistent with the rise in confidence about their abilities and their increasingly positive beliefs about the ease of starting a business.
In contrast, the White population reports lower intentions and lower TEA. Black people are over two and a half times as likely to have entrepreneurial intentions and two and a fourth times as likely to be starting businesses. However, White people are more likely to be running established
businesses, which may lead to questions about the long-term sustainability of entrepreneurship and how it differs relative to entrepreneurial activity among racial and ethnic lines. A time-lag effect may be present, where changes in entrepreneurship are reflected in established business activity a few years down the line. However, a persistent imbalance has been visible between TEA and established business ownership in both the Black and Hispanic populations for several years. An encouraging sign, established business activity in 2022 rose 44% among the Hispanic group compared to survey results in 2021.
Closure activity tracks TEA to some extent. Although often thought to be a negative indicator, closure numbers can demonstrate that high rates of entrepreneurship must be accompanied by some degree of acceptance that not all ventures work out. As Figure 39 illustrates, there are about three to five times as many entrepreneurs starting a venture as there are closures that occurred during the previous year.
9.3 24.4 19.0 INTENTIONS 15.3 34.8 26.9 TEA 9.8 6.5 7.0 EBO 4.0 7.0 5.7 BUSINESS CLOSURE 40% 35% 30% 25% 20% 15% 10% 5% 0%
Black Hispanic White
Figure 39: Entrepreneurial Intentions, Total Entrepreneurial Activity, Established Business Ownership, and Business Closure Activity by Race and Ethnicity in the U.S. Adult Population, 2022
GEM 2022-2023 United States Report 64
Source of data: Global Entrepreneurship Monitor, United States, 2022.
Entrepreneurial Motivations
About two-thirds of entrepreneurs are motivated to make a difference in the world, and there is not much difference among racial and ethnic categories for this indicator (Figure 40). On the contrary, the two income motivations vary markedly by race and ethnicity. Hispanic entrepreneurs are one and a half times as likely as White entrepreneurs to state they are motivated to generate wealth/high income, and they are over one and a third times as likely to be motivated by necessity, choosing entrepreneurship to earn a living because jobs are scarce. Black entrepreneurs are also more likely than White entrepreneurs to identify both of these motives.
Summary
CHAPTER 5: Race and Ethnicity
The survey results on necessity motives correspond to differences in unemployment in 2022. The U.S. unemployment rates among those age 20 and over in the first quarter of 2022 were 3.4% for the White population, 6.4% for the Black population, and 4.7% for the Hispanic population.3 It may be surmised that entrepreneurship is perceived as providing a job when opportunities for work are scarce, and also as a way to generate better income than the job alternatives available.
Societal attitudes showed differences among the racial and ethnic groups, but overall generally high levels on these indicators. Greater differences could be seen in affiliations and self-perceptions, where White people were less likely than Black or Hispanic people to know an entrepreneur personally or to perceive entrepreneurial opportunities around them, although exhibiting higher capability perceptions.
Black people reported the highest rates for intentions and entrepreneurship, and White people reported the lowest rates on these indicators. However, White people were more likely to be running established businesses. Black and Hispanic entrepreneurs were more likely than White entrepreneurs to state they were motivated by the prospect of generating wealth/high income and by necessity.
TO
DIFFERENCE
THE WORLD 68.3 64.0 68.0 60.0 82.6 89.9 26.3 47.0 41.7 48.8 63.9 66.6
MAKE A
IN
TO BUILD GREAT WEALTH OR A VERY HIGH INCOME TO CONTINUE A FAMILY TRADITION
100% 90% 80% 70% 60% 50% 40% 30% 20% 10% 0%
TO EARN A LIVING BECAUSE JOBS ARE SCARCE
Black Hispanic White
Figure 40: Motivations for Total Entrepreneurial Activity by Race and Ethnicity in the United States, 2022
Source of data: Global Entrepreneurship Monitor, United States, 2022.
GEM 2022-2023 United States Report 65
3 U.S. Bureau of Labor Statistics, https://www.bls.gov/web/empsit/cpsee_e16.htm, accessed June 12, 2023.
SOCIAL AND ENVIRONMENTAL
SUSTAINABILITY SOCIAL ENVIRONMENTAL AND ENVIRONMENTAL
SOCIAL AND ENVIRONMENTAL SUSTAINABILITY
SOCIAL AND ENVIRONMENTAL SUSTAINABILITY SOCIAL ENVIRONMENTAL AND ENVIRONMENTAL
SOCIAL AND ENVIRONMENTAL 06
SOCIAL AND SUSTAINABILITY ENVIRONMENTAL SUSTAINABILITY
Mike Salguero - Founder, ButcherBox

ButcherBox delivers 100% grass-fed beef, free-range organic chicken, humanely raised pork, and wild-caught seafood. Mike says that during periods of economic hardship, companies often deprioritize social and environmental responsibility. At ButcherBox, this work continues to be a priority.
ENVIRONMENTAL SOCIAL AND SUSTAINABILITY
ENVIRONMENTAL
SUSTAINABILITY
ENVIRONMENTAL
ENVIRONMENTAL
CHAPTER 6: Social and Environmental Sustainability
Challenges in the United States and worldwide included the COVID-19 pandemic, political and economic unrest, changing climate conditions, and continuing depletion of natural resources without regard to regeneration. These forces can influence the focus entrepreneurs and established business owners place on social and environmental sustainability in 2022. Overall, entrepreneurs and established business owners who try to meet these challenges seek new strategies to address and integrate social and environmental sustainability activities into their business models. For some, this means increasing efforts with business partners throughout supply chains, or seeking and implementing new ways to measure and manage data relating to social innovation and climate change. Such efforts take time to design and implement, moving toward renewable infrastructures and sustainable practices that are equitable. Time is of the essence.
Challenges to social and environmental sustainability increased in 2022. Commitments to the Paris Agreement of 2015 included a goal to limit world temperature rise to 1.5° Celsius. 4 The year 2022 marked the sixth warmest surface temperature of the earth based on NOAA data, 5 meaning that the increase in global temperature had put the world on track to reach the 1.5° Celsius limit sometime in the 2030s with disastrous temperature levels by or before 2100. Already in 2022, it had become apparent that altered weather patterns and environmental disruptions were forcing change to how people lived. These conditions led Secretary-General of the United Nations António Guterres to caution, “We must rise higher to rescue the Sustainable Development Goals and stay true to our promise of a world of peace, dignity, and prosperity on a healthy planet.” 6
Social and Environmental Sustainability and the Role of Entrepreneurs
Challenges the world was facing and entrepreneurs were addressing pointed to the need for new data, as well as data coordination across boundaries. A key improvement was sharing data from United Nations National Statistical Offices to meet country and crosscountry needs.7 Data sharing allowed companies to collaborate within and across industry lines on best practices for measuring and managing social and environmental efforts. For example, the fashion industry had increased data sharing to align with initiatives of the United Nations Fashion Compact. 8 Kering, a Frenchbased multi-national and leading fashion company, was including social and environmental costs and benefits in their environmental P&L9 in an attempt to bring social and economic values to financial statements. 10 It is likely
that entrepreneurs building new products, services, and processes could, more readily than older established businesses, integrate social and environmental impact in new financial and production management processes.
Chapter 1 reported on entrepreneurial motivations that included generating high income, earning a living because of job scarcity, and continuing a family tradition. An additional motivator assessed in the GEM survey centers on making a difference in the world. While making a difference may simply mean doing something big, it may also mean doing something good, effecting change. In the United States, 69% of entrepreneurs identified this as a key motivator, the highest level reported among the 21 high-income economies participating in GEM in 2022.
4 https://www.ipcc.ch/sr15/faq/faq-chapter-1/, accessed June 8, 2023.
5 https://www.climate.gov/news-features/understanding-climate/climate-change-global-temperature#:~:text=The%20roughly%202%2Ddegree%20 Fahrenheit,significant%20increase%20in%20accumulated%20heat, accessed June 8, 2023.
6 https://unstats.un.org/sdgs/report/2022/, accessed June 8, 2023.
7 https://unstats.un.org/sdgs/report/2022/The-Sustainable-Development-Goals-Report-2022, page 4, accessed June 3, 2023.
8 https://unfashionalliance.org/members/unglobalcompact/, accessed June 13, 2023.
9 https://www.kering.co/en/sustainability/measuring-our-impact/our-ep-l/, accessed June 13, 2023.
10 Pavione, Enrica, Roberta Pezzetti, and Matteo Dall’Ava. “Emerging Competitive Strategies in the Global Luxury Industry in the Perspective of Sustainable Development: The Case of Kering Group.” Management Dynamics in the Knowledge Economy 4.2 (2016): 241-61, accessed June 13, 2023.
GEM 2022-2023 United States Report 68
CHAPTER 6: Social and Environmental Sustainability
Prioritizing Social and Environmental Impact
Over two-thirds of entrepreneurs (69%) stated that they prioritized social and environmental impact of their businesses above profitability or growth, similar to 2021 (68%), showing a consistent commitment to impact. In this regard, established business owners decreased slightly from over one half (54%) in 2021 to half (50%) in 2022.
Women entrepreneurs focused on this impact slightly more than male entrepreneurs (Figure 41). Of the established business owners, men led the way slightly over women, yet both showed a 10% decline from 2021 results, perhaps due to concerns over other factors such as supply chain difficulties and looming economic recession.
Alison Hurley - Founder, Just Add Flights
Alison Hurley has been to all seven continents before the age of 30. She loves traveling but dislikes how time-consuming and stressful it is to plan and book a vacation. She started Just Add Flights, a platform using AI to plan and book travel more easily.

MALE 65.4 65.8 71.6 72.3 57.9 51.9 52.0 47.0 FEMALE TEA EBO MALE FEMALE 80% 70% 60% 50% 40% 30% 20% 10% 0% 2022 2021
Figure 41: Percentage of U.S. Entrepreneurs and Established Business Owners who Prioritize Social and Environmental Impact of Business Above Profitability or Growth, by Gender, 2022
Source of data: Global Entrepreneurship Monitor, United States, 2021-2022.
GEM 2022-2023 United States Report 69
CHAPTER 6: Social and Environmental Sustainability
Younger entrepreneurs led in their attention to social and environmental impact, increasing from 2021, whereas older entrepreneurs, 35 to 64 years of age, declined slightly (Figure 42). In established businesses, the younger group nearly doubled in their concern for future social and environmental goals. Conversely, older established business owners declined by over one-third, possibly due to concern over uncertainty in their business environments.
Interestingly, both entrepreneurs and established business owners with innovations (introducing products new to
customers) expressed greater priority for social and environmental impact than those not introducing innovations (Figure 43). In the design process for new products and services, social and environmental impact is growing as a primary design principle, reinforcing a key objective to bring about meaningful change. These results support the notion that entrepreneurial decisions for the future are increasingly being made to integrate environmental and social values into strategic action.
Nicole Finkielsztein - Co-Founder, Lou Adventures
Nicole Finkielsztein is a third generation entrepreneur who co-founded Lou Adventures with her brother, Alex. When COVID-19 began in 2020, they recognized its impact on primary education. They developed an interactive educational platform that uses gamification to engage kids in building reading and literacy skills.
18-34 66.8 73.4 69.4 63.8 39.4 75.3 59.0 38.5 35-64 TEA EBO 18-34 35-64 80% 70% 60% 50% 40% 30% 20% 10% 0% 2022 2021
Figure 42: Percentage of U.S. Entrepreneurs and Established Business Owners who Prioritize Social and Environmental Impact of Business Above Profitability or Growth, by Age, 2022
Source of data: Global Entrepreneurship Monitor, United States, 2021-2022.
GEM 2022-2023 United States Report 70
Source of data: Global Entrepreneurship Monitor, United States, 2021-2022.
CHAPTER 6: Social and Environmental Sustainability
Source of data: Global Entrepreneurship Monitor, United States, 2021-2022.
NOT A NEW PRODUCT 67.3 64.4 73.2 79.3 54.7 42.5 61.8 69.4 NEW PRODUCT TEA EBO NOT A NEW PRODUCT NEW PRODUCT 90% 80% 70% 60% 50% 40% 30% 20% 10% 0% 2022 2021
Figure 43: Percentage of Innovative versus Non-Innovative U.S. Entrepreneurs and Established Business Owners who Prioritize Social and Environmental Impact of Business Above Profitability or Growth, 2022
MALE 53.8 54.4 43.0 55.6 52.0 50.9 43.9 60.6 FEMALE TEA EBO MALE FEMALE 70% 60% 50% 40% 30% 20% 10% 0% 2022 2021
Figure 44: Percentage of U.S. Entrepreneurs and Established Business Owners who Have Taken Steps to Minimize Environmental Impact, by Gender, 2022
GEM 2022-2023 United States Report 71
CHAPTER 6: Social and Environmental Sustainability
Source of data: Global Entrepreneurship Monitor, United States, 2021-2022.
Source of data: Global Entrepreneurship Monitor, United States, 2021-2022.
18-34 54.3 62.3 45.0 47.1 62.9 78.7 45.1 45.2 35-64 TEA EBO 18-34 35-64 90% 80% 70% 60% 50% 40% 30% 20% 10% 0% 2022 2021
Figure 45: Percentage of U.S. Entrepreneurs and Established Business Owners who Have Taken Steps to Minimize Environmental Impact, by Age, 2022
NOT A NEW PRODUCT 46.7 45.7 52.7 69.8 45.9 46.0 65.9 78.7 NEW PRODUCT TEA EBO NOT A NEW PRODUCT NEW PRODUCT 90% 80% 70% 60% 50% 40% 30% 20% 10% 0% 2022 2021
Figure 46: Percentage of Innovative versus Non-Innovative U.S. Entrepreneurs and Established Business Owners who Have Taken Steps to Minimize Environmental Impact, 2022
GEM 2022-2023 United States Report 72
GEN Z and YOUNGER MILLENNIALS INCREASED THE PACE OF CHANGE IN CREATING BUSINESSES MINDFUL OF THE ENVIRONMENT.
Steps to Minimize Environmental Impact
Entrepreneurs and established business owners who stated that they prioritize social and environmental impact indicate awareness about how their businesses can affect their communities and the planet. However, those who take actual steps to minimize harm to the environment and/or maximize social impact are signaling a greater level of commitment to sustainability. Steps to help the environment may include energy-saving measures, reducing carbon emissions, introducing more efficient machinery, taking care of solid waste generated, and using recyclable materials as well as environmentally sound means of transportation. The percentages for entrepreneurs and established business owners who have taken steps to minimize negative environmental impact were the same for both, increasing from 49% in 2021 to 55% in 2022.
While the results for male entrepreneurs stayed the same as the previous year, female entrepreneurs increased their minimization of environmental impact by nearly 30% (Figure 44). For established business owners, the results were similar, with about half of men reporting these actions in both years while results for women rose to 61%.
Younger entrepreneurs and established business owners led once again with actions for the environment. Gen Z and younger millennials increased the pace of change in creating businesses mindful of the environment. For entrepreneurs, those aged 18-34 were one-third more likely than the 35-64 age group to take action for the environment, increasing this commitment from 2021. This indicator increased only marginally for older entrepreneurs (Figure 45). Similarly, younger established business owners were nearly three-fourths more likely than the older group to have acted to minimize environmental impact, increasing this commitment substantially from 2021, while the percentage for established business owners stayed the same.
Survey results showed that entrepreneurs introducing new products and services took more steps for sustainability than others, at one and a half times the rate of those not offering innovations, and at nearly one and three-fourths the rate of established business owners. Both innovative entrepreneurs and established business owners have exhibited substantial increases in this indicator since 2012, although no change was reported among those in either phase who were not introducing new products or services (Figure 46).
GEM 2022-2023 United States Report 73 CHAPTER 6: Social and Environmental Sustainability
CHAPTER 6: Social and Environmental Sustainability
Source of data: https://www.climateinteractive.org/world-climate-simulation/.
Source of data: Global Entrepreneurship Monitor, United States, 2021-2022.
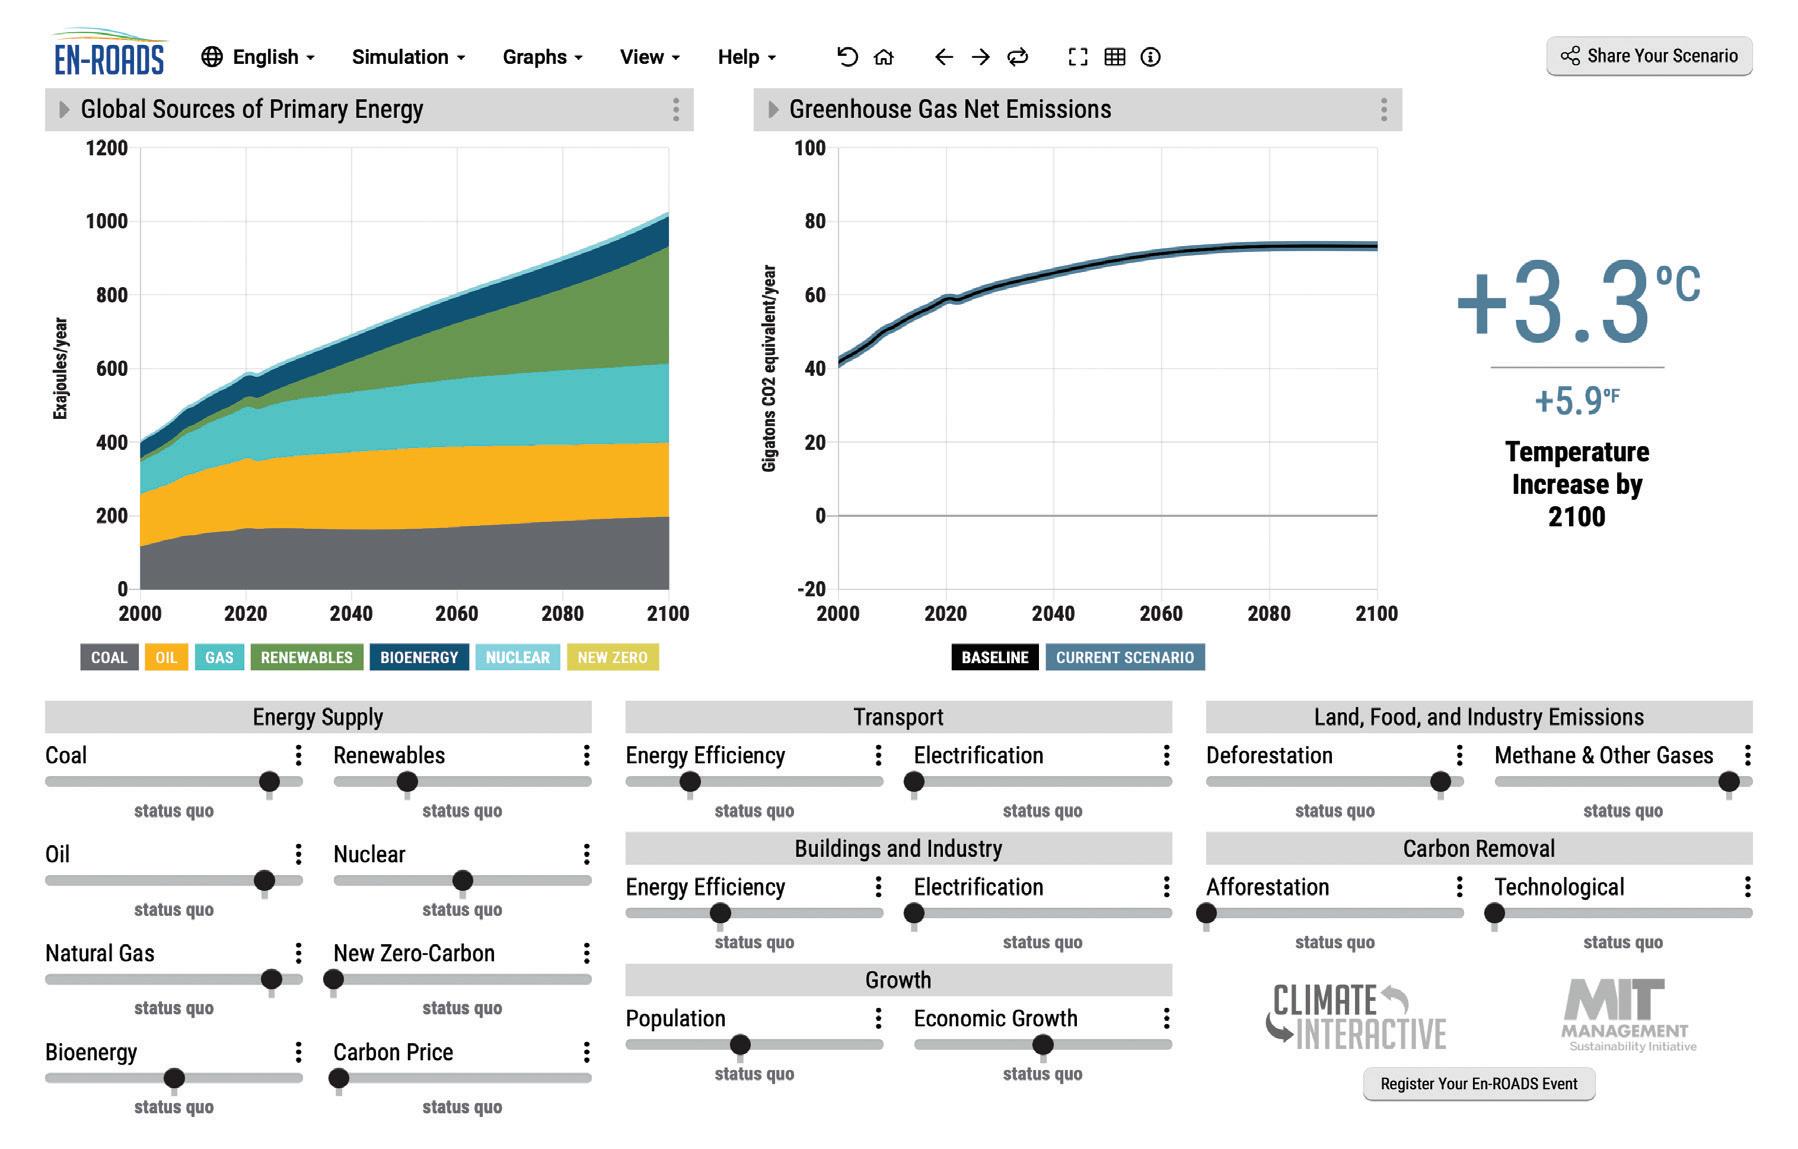
48% 51% 41% 38% 36% 50% 53% 60% TEA: Male TEA: Female EBO: Female EBO: Male 70% 60% 50% 40% 30% 20% 10% 0% 2022 2021
Figure 48: Percentage of U.S. Entrepreneurs and Established Business Owners who Have Taken Steps to Maximize Social Impact, by Gender, 2022
Figure 47: En-Roads Climate Simulator
GEM 2022-2023 United States Report 74
Climate Interactive and MIT Sloan have collaborated to build a climate simulator tool, En-Roads, that is freely available to all. It is designed to help entrepreneurs and established businesses understand the connections between actions and outcomes as they impact the climate and the environmental (Figure 47). By moving the sliders in the categories of energy supply, transport, buildings and industry, growth, land, food, industry emissions, and carbon removal, entrepreneurs and
FROM 2021
innovators can see how their decisions and actions impact the environment. The United Nations uses En-Roads with the World Climate Simulation, a roleplaying game to enable delegates to understand the impact of commitments their countries make to climate change. The En-Roads Simulator is an example of the tools entrepreneurs and innovators can use to test scenarios for action and understand their impact on the environment.
Steps to Maximize the Social Impact of Businesses
Entrepreneurs and established business owners have taken steps to maximize the social impact of their businesses, increasing from 50% in 2021 to 55% in 2022 for entrepreneurs, and from 39% in 2021 to 43% in 2022 for established business owners. Survey results indicate that entrepreneurs are likely to say they took steps to address both environmental and social impact, but established business owners are more likely to say they took action on the environment than that they took action for social impact.
ensuring a diverse workforce; prioritizing companies and/ or suppliers that take action to respect human rights when buying a product or service; fighting against any form of child or slave labor; and investing in, or providing other support for, social projects or organizations.
In terms of gender, women entrepreneurs showed a high level of social-minded actions, and this increased by 13% from 2021, with men showing lower levels and only a slight change from 2021. Female established business owners showed a 40% increase in 2022 from 2021, while male entrepreneurs declined on this indicator, opening a gap where women established business owners were one-third more likely to be taking socially impactful actions (Figure 48). 11
Examples of socially-minded efforts may include: creating employment for young unemployed persons and other underserved segments of the labor market; incorporating social enterprises into the supply chain;
11,12
June 13, 2023.
materials can be accessed here:
June 13, 2023.
https://en-roads.climateinteractive.org/scenario.html?v=23.6.0, accessed
12 The World Climate Simulator
https://www.climateinteractive.org/world-climate-simulation/,
GEM 2022-2023 United States Report 75
6: Social and Environmental Sustainability
40% Female established business owners showed a increase in taking steps to maximize social impact in 2022
CHAPTER
CHAPTER 6: Social and Environmental Sustainability
Age once again matters, with younger entrepreneurs ahead of the older age groups, and little change from 2021. Established business owners made huge strides in the younger category with a one-third increase in those taking social actions, resulting in twice the rate of the older group (Figure 49).
In terms of innovation, entrepreneurs with new products and services were designing these with greater social impact in mind than previously, at one and a half times the rate of those who were not introducing
something new. The difference was even more marked for established business owners, with those identifying as innovative being twice as active toward social benefit as those not identified as innovative (Figure 50). Additionally in 2022, both entrepreneurs with innovations and established business owners with innovations showed significant increases over the prior year, while those without innovations reported little change or a slight decline.
NOT A NEW PRODUCT 46.7 45.7 52.7 69.8 45.9 46.0 65.9 78.7 NEW PRODUCT TEA EBO NOT A NEW PRODUCT NEW PRODUCT 90% 80% 70% 60% 50% 40% 30% 20% 10% 0% 2022 2021
Figure 49: Percentage of U.S. Entrepreneurs and Established Business Owners who Have Taken Steps to Minimize Environmental Impact, by Age, 2022
NOT A NEW PRODUCT 45.9 46.0 60.1 70.0 36.6 33.8 55.5 67.4 NEW PRODUCT TEA EBO NOT A NEW PRODUCT NEW PRODUCT 80% 70% 60% 50% 40% 30% 20% 10% 0% 2022 2021
Source of data: Global Entrepreneurship Monitor, United States, 2021-2022.
Figure 50: Percentage of Innovative versus Non-Innovative U.S. Entrepreneurs and Established Business Owners who Have Taken Steps to Minimize Environmental Impact, 2022
GEM 2022-2023 United States Report 76
Source of data: Global Entrepreneurship Monitor, United States, 2021-2022.
CHAPTER 6: Social and Environmental Sustainability
Summary
This analysis shows that entrepreneurs and established business owners are not only thinking but acting with regard for the environment and social impact. This is particularly the case among women, those in early careers, and those with innovative products or services.
As entrepreneurs look to the future, values are shifting and business processes are changing with greater focus on social and environmental sustainability. New technologies enhance data integration, link actions to outcomes, improve awareness, and support collaboration. These new tools help entrepreneurs and established business owners increase social and environmental sustainability.
Social and environmental organizations such as the Ellen MacArthur Foundation, Global Fashion Summit, United Nations Global Compact, and MIT Climate Pathways Project are integrating thought and action methods to enhance understanding and capabilities to measure and manage impact. Challenges loom large, but entrepreneurs and educators are developing action to reduce global warming and regenerate resources. The challenges for social and environmental sustainability are ongoing, yet these threats are inspiring entrepreneurs to change the world in beneficial ways.
Haha Zixu - Founder, Bejewel
Bejewel is a global platform linking independent designers, jewelry-savvy customers, and sustainable manufacturers.The company offers unique designs at affordable prices. Bejewel prioritizes sustainability with recycled metals and lab-grown diamonds and gemstones.

GEM 2022-2023 United States Report 77
As entrepreneurs look to the future, VALUES ARE SHIFTING AND BUSINESS PROCESSES ARE CHANGING WITH GREATER FOCUS ON SOCIAL AND ENVIRONMENTAL SUSTAINABILITY.
SIONS CONCLUSIONS
CLUSIONS CONCLUSIONS CONCLUSIONS CONCLU SIONS CONCLUSIONS
CONCLUSIONS
CLUSIONS CONCLUSIONS CONCLUSIONS CONCLU SIONS CONCLUSIONS CLUSIONS CONCLUSIONS
CONCLUSIONS CONCLU
Conclusions
As the United States reaches a new high in entrepreneurship rates—the highest since the start of GEM in 1999—it is useful to reflect on the opportunity entrepreneurship presents to the American people and on the significance of entrepreneurs for the U.S. economy and society. Entrepreneurship provides an avenue for people to create their own jobs, perhaps opportunities to generate more income and wealth than the best job alternative available to them. At the same time, when few good alternatives exist, people can turn to entrepreneurship, perhaps temporarily during circumstances where one loses a job or in economic downturns like that experienced with the COVID-19 pandemic. Entrepreneurship can also be a permanent solution to take control of one’s career.
The 2022 GEM survey results show these opportunities are strong in the United States.
Of course, entrepreneurship provides value, not just for entrepreneurs, but for all who depend on them: employees, family members, financial backers, suppliers, customers, and many other stakeholders. While not all entrepreneurs create jobs, it is important to note that their value extends to these stakeholders. Still, the results show that many entrepreneurs do create jobs; but for those who are not creating jobs, perhaps due to preference or particular constraints, it is essential to consider the value they extend outside their internal organization. The upbeat attitudes conveyed throughout the GEM data reveal how entrepreneurs are inspired by positive perceptions and support from those they need for their business to function.
This GEM report provides an in-depth look at gender differences, revealing the extent women participate in entrepreneurship and the significant contribution they make in the United States. The report also covers the role of racial and ethnic differences in entrepreneurship, how
CONCLUCONCLUSIONS CONCONCLUSIONS CONCLUCONCLUSIONS CONCONCLUSIONS CONCLUCONCLUSIONS CONCONCLUSIONS
non-White entrepreneurs add value to society and the economy. When entrepreneurship is accessible to all, the United States gains as much as the entrepreneurs.
Entrepreneurship needs to be available to all people, and the benefits of creative effort embraced in all forms. For example, selfemployment, or small-scale operations that provide communities with essential services or operate as part of a greater value network play important roles in society. Collectively, these add to substantial employment and widespread impact across the United States. Additionally, a healthy economy requires entrepreneurs who can build high-growth businesses that generate jobs, creative types who commercialize innovations that improve people’s wellbeing, as well as reach out globally in a way that maintains the country’s competitiveness. GEM results on job creation prospects, participation in technology industries, innovation, and international market reach are critical indicators to track.
With all the environmental and social problems the world faces, it is important for entrepreneurs to act responsibly, to provide solutions, to counter harm to the environment, and respect and lift up people. This requires thinking and acting. Entrepreneurs can lead the way by modelling responsibility for the environment and people.
A key driver of this report is the inspiration to provide meticulously collected and analyzed data that shed light on the prevalence and nature of entrepreneurship in the United States, to inform all who support entrepreneurship: government, educators, researchers, entrepreneurs, entrepreneurship stakeholders, and institutions. The goals of this report are to advance understanding and guide decisionmaking and actions, to enable the United States to thrive on the impact of entrepreneurs.
About the Authors
Donna Kelley, PhD, is Professor of Entrepreneurship, Chair of the Entrepreneurship Division, and the Frederic C. Hamilton Chair of Free Enterprise at Babson College. A frequent presenter on the topic of global entrepreneurship, Prof. Kelley has spoken at the United Nations, the U.S. State Department, the World Bank, the U.S. Census Bureau, the Republic of Korea’s SMBA, the National Governors Association and for many other executive, policy and academic audiences around the world. She served on the Board of Directors for the Global Entrepreneurship Monitor (GEM) from 2007 through 2021, and is co-leader of the GEM United States team. Prof. Kelley has co-authored over 35 GEM reports on global entrepreneurship, women’s entrepreneurship, family entrepreneurship, entrepreneurship education and training, high impact entrepreneurship, and entrepreneurship in the United States, the Republic of Korea, Saudi Arabia, and Africa.
Jeffrey Shay, PhD, Professor of Entrepreneurship and Executive Director for Academic Operations for the Arthur M. Blank School for Entrepreneurial Leadership at Babson College, serves on the Board of Directors for the Global Entrepreneurship Monitor (GEM) and is co-leader of the GEM United States team. Prof. Shay has held endowed positions at Washington and Lee University and the University of Montana and has taught entrepreneurship courses at other leading institutions such as the London School of Economics, Peking University, and Cornell University. Focused on the intersection between international business, strategy, and entrepreneurship, his research has been published in premier journals and recognized through his receiving the Western Academy of Management (WAM) Ascendant Scholar Award, the WAM Joan G. Dahl President’s Award, and the North American Case Research Fellowship Award. Prof. Shay has taught executive education for global organizations and provided case method training for academic institutions around the world.

Candida G. Brush, PhD, is Franklin W. Olin Chair of Entrepreneurship at Babson College, and a visiting professor at Nord University, Bodø, Norway, and Dublin City University, Dublin, Ireland. She has authored more than 160 publications in entrepreneurship, including 12 books, and is one of the most highly cited researchers in the field. She is a founder of the Diana International Research Project, has co-authored reports for the OECD and the Goldman Sachs Foundation, and has presented her work at the World Economic Forum in Davos and the U.S. Department of Commerce. Brush holds a doctorate from Boston University and an honorary PhD from Jonkoping University. She is a senior editor for Entrepreneurship Theory and Practice and serves on four other editorial review boards.


Andrew C. Corbett, PhD, is Paul T. Babson Distinguished Professor of Entrepreneurial Studies and Faculty Director of the Butler Institute for Free Enterprise Through Entrepreneurship at Babson College. He is Visiting Adjunct Professor of Entrepreneurship at Nord University in Bodø, Norway. Prof. Corbett is an editor for the Journal of Business Venturing and former General Editor of the Journal of Management Studies. A recent study in the Journal of Small Business Management cited him as one of the Top 25 Entrepreneurship Researchers in the world. His research on entrepreneurship has been published in leading scholarly journals and various media outlets across the globe.

Mahdi Majbouri, PhD, is Associate Professor of Economics at Babson College. He received his PhD from the University of Southern California in 2010, after which he started his career at Babson College. He has a BS in Mechanical Engineering and an MBA from Sharif University of Technology. He is also a Research Fellow at the Institute for Labor Economics (IZA) in Bonn, Germany and a Research Fellow at the Economic Research Forum in Cairo, Egypt. Economics of entrepreneurship and labor economics in developing countries are his main areas of research. His past work covers topics in finance, real estate economics, and microeconomic theory. His work has been published in Feminist Economics, Applied Economics, Energy Policy, Journal of Real Estate Finance and Economics, Science of the Total Environment, and Quarterly Review of Economics and Finance. He is also the faculty director for the Master of Science in Business Analytics program at Babson College and the treasurer for the Middle East Economic Association.

Caroline Daniels, MBA, PhD, is Associate Professor of Practice at Babson College and founder and lead faculty of the Fashion Entrepreneurial Initiative. Dr. Daniels teaches courses in Strategy & Analytics, Future Trends, Entrepreneurship, and the Fashion Industry. She has a BLS in Literature from Boston University, an MBA from the Massachusetts Institute of Technology Sloan School, and a PhD from the London Business School. She has authored 2 books on globalization and information technology, several articles on transformation in business, chapters on entrepreneurship for educational texts, business cases, and many strategy and country reports for the Economist Intelligence Unit. She has received the International Association of Management Consulting Firms Award for Literary Excellence and speaks at conferences. Her action research focuses on business model transformation, fashion, entrepreneurship, technology, environment, and climate change.

2022 National Expert Survey (NES)
The GEM USA report relies primarily on data from over 2,000 respondents to the Adult Population Survey (APS). The research team is also informed by a select group of participants who respond to the National Expert Survey (NES). Experts can include entrepreneurs, individuals in roles supporting entrepreneurship (e.g., lawyers, consultants, accountants, professors), government officials, infrastructure experts, investors, lenders, educators, researchers, journalists and professionals from many other areas whose work impacts or is impacted by entrepreneurial activity. These experts provide contextual insights on various facets that compose the entrepreneurial climate in a particular country (e.g., finance, government policies and programs, education and training, R&D transfer, commercial and physical infrastructure, internal market openness, and social and cultural norms). The GEM USA team would like to recognize the following individuals who served as experts for our 2022-2023 report:
» John Altman, Professor, Miami University
» Matt Bartini, CEO/Founder, Mayor Clothing
» Craig Benson, Former Governor, New Hampshire
» Karl Brewer, Founder, Cervecero Invstments
» Tim Brooks, Managing Director, World Wide Technology
» C. Leroy Cavazos – Reyna, Vice President of Government and International Affairs, U.S. Hispanic Chamber of Commerce
» Les Charm, Partner, Leslie Charm Associates
» Warren Cross, Jr., CEO/President, Cross Services Group, Inc.
» Brianna Dimas, Vice President of Programs and Communications, U.S. Hispanic Chamber of Commerce
» Geoffrey Duke, Chief Executive Officer/Founder, Mpay
» Edward Elliot, Chief Executive Officer, Copado
» Ray Garcia, Global Growth Advisory, Buoyant Capital
» Paul Gladen, Associate Vice President, University of Montana
» Mike Glauser, Executive Director, Utah State University
» Armen Hadjinian, Professor, Milwaukee Area Technical College
» Jim Hind, Chief Executive Officer/Founder, Clean Textile Technology
» Cliff Holekamp, Partner, Cultivation Capital
» Jack Huffard, Co-founder, Tenable Security
» Elizabeth Isele, Chief Executive Officer/Founder, Global Institute for Experienced Entrepreneurship
» Steven J. Gordon, Co-founder, Shooter’s Touch, LLC
» Elad Katav, CEO & Founder, Cupixel
» Jerome Katz, Professor, St.Louis University
» Shirley Kelly, Representative, Alaska, U.S. Economic Development Administration
» Stephen L. Watson, Principal, Watson Investments
» Jesse Lakes, Chief Executive Officer/Founder, Genius Link
» Jonas LaRance, Web Systems Engineer, Alps Insurance
» Thomas Layton, Senior Manager of Operational Readiness, United Illuminating Company
» John (Jack) Manning, President, Manning Personnel Group
» Demetrios Manthous, Client Experience Manager, Cyndx
» Michael Mark, Member, Walnut Venture Associates
» Edward Marram, Entrepreneur in Residence, Babson College
» Renaud Megard, President & CFO, NFI Corp
» Wally Meyer, Associate Professor, University of Kansas
» Doug Miller, Associate Professor, Utah State University
» Sanjay Mishra, Associate Professor, University of Kansas
» Dillon Myers, Co-founder, OneClick.chat
» Michael Pearlmutter, Executive Director, Cerebral Palsy Alliance Research Foundation
» Eric Pelnik, Head of Growth, Commonstock
» Peter Pizzo, Chief Financial Officer, ControlRad
» Jason Rae, Vice President, Affiliate Relations, National LGBT Chamber of Commerce
» Michael Shuman, Adjunct Professor, Bard College Business School
» Mark Sowinski, Vice President, Morgan Stanley
» Shelby Stephens, Founder and CEO, GrowthMatch
» Brandon Stoddard, Director, Weber State University
» John Stump, Managing Partner, Weller Advisory Ventures
» Tom Swenson, Founder and Owner, Bank of Montana
» Lex Tarumianz, Co-founder, Blank Slate
» Randi Thompson, State Director, Nevada, National Federation of Independent Business (NFIB)
LEARN MORE AT BABSON.EDU/GEM


BRNDREP4-2795
