1
POPULATION
Y UM A , A Z
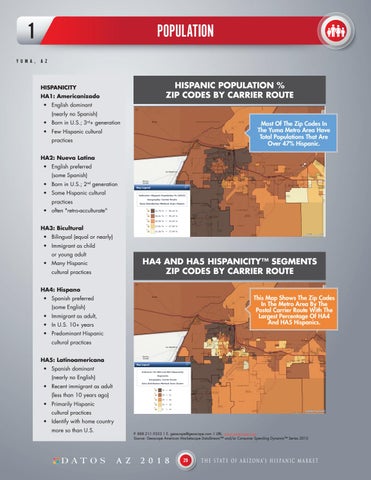
HISPANIC POPULATION % ZIP CODES BY CARRIER ROUTE
HISPANICITY HA1: Americanizado • English dominant (nearly no Spanish) • Born in U.S.; 3rd+ generation
Most Of The Zip Codes In The Yuma Metro Area Have Total Populations That Are Over 47% Hispanic.
• Few Hispanic cultural practices HA2: Nueva Latina • English preferred (some Spanish) • Born in U.S.; 2nd generation • Some Hispanic cultural practices • often "retro-acculturate" HA3: Bicultural • Bilingual (equal or nearly) • Immigrant as child or young adult
HA4 AND HA5 HISPANICITY™ SEGMENTS ZIP CODES BY CARRIER ROUTE
• Many Hispanic cultural practices HA4: Hispano
This Map Shows The Zip Codes In The Metro Area By The Postal Carrier Route With The Largest Percentage Of HA4 And HA5 Hispanics.
• Spanish preferred (some English) • Immigrant as adult, • In U.S. 10+ years • Predominant Hispanic cultural practices HA5: Latinoamericana • Spanish dominant (nearly no English) • Recent immigrant as adult (less than 10 years ago) • Primarily Hispanic cultural practices • Identify with home country more so than U.S.
DATO S
P. 888.211.9353 | E. geoscape@geoscape.com | URL. www.geoscape.com Source: Geoscape American Marketscape DataStream™ and/or Consumer Spending Dynamix™ Series 2015
A Z
2 0 1 8
29
T H E S T AT E O F A R I Z O N A’ S H I S P A N I C M A R K E T