

TITLE SPONSOR

TITLE SPONSOR
Using a strong, diverse supplier base not only assists SRP in providing reliable, affordable and sustainable water and power to our customers but also supports economic stability and job growth in our communities. In fiscal year 2024, SRP spent $288 million on goods and services from 764 small, local and diverse suppliers, helping support 2,874 jobs. Our shared business success bolsters the communities we serve, allowing us all to flourish together.
Learn more by downloading SRP’s Supplier Diversity Economic Impact Report at srp.net/supplierdiversity


On behalf of SRP, welcome to the Arizona Hispanic Chamber of Commerce’s 2025 DATOS:TheStateofArizona’sHispanicMarket.
Since the first report nearly three decades ago, DATOS has become a much anticipated and highly regarded resource. It is the premier annual evaluation of Arizona’s Hispanic market and its extraordinary economic power. In addition, the report offers valuable insight into the potential challenges and opportunities that may be ahead. More than simply a look at numbers, DATOS takes a holistic approach to evaluating the Hispanic market, and the community in general, by also examining critical aspects of public health.
This year, the report looks at economic freedom and community prosperity, focusing on the conditions that allow individuals and communities to build lasting success. Prosperity grows when people have access to quality education, good jobs, safe neighborhoods, and tools to build wealth.
DATOS highlights the key factors that influence economic mobility and long-term community strength—like affordable housing, workforce participation, small business growth, and access to capital, including potential obstacles.
By identifying and addressing barriers, Arizona can build an economy where hard work leads to real opportunity and where every community has a chance to thrive.
SRP greatly values our relationship with the Arizona Hispanic Chamber of Commerce, and we are proud to continue our support of DATOS. While our mission is to deliver reliable, affordable and sustainable water and power, we recognize a broader responsibility—to champion opportunities that foster success and prosperity for all Arizonans. We also believe that we are strongest when we work together and leverage Arizona’s incredible diversity and wonderful culture.
Thank you for your participation and your support of DATOS.

STEVEN LOPEZ
DATOS Honorary Chair
Senior Director Supply Chain and Flight Services
Salt River Project (SRP)


Welcome to the 29 th Annual DATOS: The State of Arizona’s Hispanic. Every year we focus on one of the Elements of a Healthy Community (See illustration on p.9). This year, we turn our focus to Social Justice in Arizona and across the country. This topic has challenged every generation in America and today is no different. Immigration and workforce have been inextricably at the center of this topic.
Last year, the Arizona Hispanic Chamber of Commerce (AZHCC) released a policy brief suggesting thoughtful, common-sense actions to move us toward a functioning system of immigration. This work was in response to the poorly designed Proposition 314 — a legislatively referred proposal that has since become law. Prop 314 was an emotional and angry reaction to large border surges that frustrated border communities, empowered human smugglers and put hundreds of thousands of immigrants in danger. And while Prop 314 temporary filled the policy void created by a lack of national leadership, it does not solve the underlying problem . Indeed, no state action can substitute for the necessary reforms needed from our national leaders.
In light of the ongoing problem of finding workers ; a national focus on arresting immigrants complying with due process — rather than actual criminals; raiding businesses critical to state and local economies ; and forcing compliant hardworking applicants to unnecessarily wait decades to finalize citizenship; we reshare our recommendations as part of the annual DATOS Release .
Why does this all matter to the Arizona Hispanic Chamber of Commerce? Because a vibrant economy depends on robust job growth
With America facing lower birth rates , as well as the retirement of Baby Boomer and Gen X workers , it is time to remember the role immigration has played in the story of America. How a thoughtful healthy immigration policy supports not only a strong economy, but also those retirees that helped build this country.
While political will is a barrier to giving America an immigration toolkit, DATOS provides a data-driven roadmap to guide those willing to seek practical solutions . The literature supports a comprehensive approach to immigration that protects the border, grows the economy, limits the influence of smugglers , and reduces dangerous crossing between ports .
At a minimum, an updated system of immigration management should include:
• Investments in immigration courts for timely adjudication and to manage border surges.
• Adjust caps on legal immigration using methods that reflect current conditions and workforce needs.
• Consistently and fairly utilize options to allow workers entry, as well as permission to stay, particularly for high demand industries , those critical to regional economies , and others with clear talent gaps .
• Prioritize reunification with family and eliminate “got-ya” provisions that force petitioners to start over.
• End decades of waiting for trained and degreed workers following all the rules and raised in America.
Global migration requires a thoughtful respons e; not just a show of force without clear policies, or enforcement agents rounding up law-abiding individuals at immigration court hearings when they are participating in the constitutional due process afforded to all.
Collectively, these changes could allow legitimate claims to be processed faster, create incentives to wait , and reduce incentives for crossing between ports of entry
Indeed, historical evidence, as well as recent events, highlight the need to modernize Customs & Border Patrol (CBP) as well as Immigration & Customs Enforcement (ICE) Modernized and funded strategies to encourage legal crossings and timely adjudicate cases could not only improve legal crossing at ports of entry, but help meet the workforce needs of America’s economy
My greatest hope is that these pages will provide the responsible, reliable, and relevant information to all stakeholders for better decision-making and improved policy in all matters.
Sincerely,

• Transparent and accessible tools that allow a variety of petitioners to state their claim and engage in a clear process with a timely ruling.
DR. MÓNICA S. VILLALOBOS President & CEO, AZ
Hispanic Chamber of Commerce
Editor-in-Chief, DATOS:
The State of Arizona's Hispanic Market
(LISTED IN ALPHABETICAL ORDER BY COMPANY/ORGANIZATION)
ANDREA WHITSETT
ASU MORRISON INSTITUTE FOR PUBLIC POLICY
DR. BERT VALENCIA
THUNDERBIRD SCHOOL OF MANAGEMENT
DR. FRANCISCO
LARA- VALENCIA
ASU SCHOOL OF TRANSBORDER STUDIES
DR. LOUI OLIVAS
ARIZONA STATE UNIVERSITY
DR. MARIA R. CHAVIRA
THE ROMAN CATHOLIC DIOCESE OF PHOENIX
FRANCISCO AVALOS LYFT
GABRIEL JARAMILLO
VITALYST HEALTH FOUNDATION
JAIME BOYD
UNIVISION ARIZONA
JAIME HINOJOS
VANTAGE WEST CREDIT UNION
JAMES MONTOYA
CITY OF PHOENIX
JOSEPH GARCIA
CHICANOS POR LA CAUSA (CPLC)
KRISTEN STEPHENSON
GREATER PHOENIX ECONOMIC COUNCIL
LUIS CORDOVA ROUNDS CONSULTING
MYRNA CARDENAS
EDUCATION FORWARD ARIZONA
SILVIA SOLIS GARZA
AZ REPUBLIC MEDIA
STEPHANIE APOSTOL WESTGROUP RESEARCH
STEVEN LOPEZ
SALT RIVER PROJECT (SRP)
SUSANA MARTINEZ
CITY OF PEORIA
TARA JACKSON
AZ TOWN HALL
DR. MÓNICA S. VILLALOBOS
EDITOR-IN-CHIEF
GUILLERMO
GAMEZ-CORDOVA
DATOS ASSOCIATE EDITOR
CARMEN G. MARTÍNEZ
CREATIVE DIRECTOR
SONARY AMACHREE
STAFF WRITER/COPY EDITOR
KAZANDRA ZELAYA
DIGITAL DASHBOARDS
DR. LOUI OLIVAS
SANDY FERNIZA
GEMA DUARTE-LUNA
RHONDA CARRILLO
In DATOS 2025, the terms Hispanic, LatinX and Latino are used synonymously, as are Native American and American Indian and African American and Black. White, non-Hispanic is sometimes referred to as non-Hispanic white. Hispanics may be of any race.
The information presented here was selected from standard secondary sources. However, data changes quickly and is not always collected annually. Data often offers a static picture of an ever-changing situation. The numbers calculated for any statistic depend on the definitions and assumptions used to produce them.


The Book of Lists enables business professionals to look at the overall picture of their local area and industry, enabling them to identify the threats and opportunities facing their business and develop strategic plans to create a competitive advantage. Top executives rely on it all year long and call on advertisers appearing in the Book. of subscribers agree that advertisers in the Book of Lists are thought of as leaders in their industries 75% of subscribers have bought products/services from companies that advertise in the Book of Lists 65% of subscribers says the Book of Lists helps determine a short list of companies to use or do business with 73%


POPULATION
ECONOMIC OPPORTUNITY
EDUCATIONAL OPPORTUNITY
AFFORDABLE QUALITY HOUSING
QUALITY AFFORDABLE FOOD
ENVIRONMENTAL QUALITY
ACCESS TO CARE
• PLEASE NOTE THAT THIS IS A SEARCHABLE PDF AND BY CLICKING CTL-F ON A PC OR COMMAND-F ON A MAC, A SEARCH BOX WILL APPEAR TO LOCATE ANY WORD OR PHRASE. 6 7 8 1 5 2 3 4 9 11 13 10 12
• THIS IS A COMPREHENSIVE COMPILATION OF SECONDARY RESEARCH MADE AVAILABLE TO THE AZHCC FROM VARIOUS SOURCES. IT IS EITHER PUBLIC INFORMATION OR USED WITH PERMISSION FROM THOSE SOURCES.
TRANSPORTATION OPTIONS
PARKS AND RECREATION
COMMUNITY DESIGN
SOCIAL/CULTURAL COHESION
SOCIAL JUSTICE
OPCIONES DE TRANSPORTE
JUSTICIA SOCIAL
COHESIÓN SOCIAL / CULTURAL

ACCESO A LA ATENCIÓN DE SALUD
VIVIENDA DE CALIDAD A PRECIOS ACCESIBLES
RESI L I E NCIA
ELEMENTOS DE UNA COMUNIDAD SALUDABLE
PARQUES Y RECREACIÓN
DISEÑO DE COMUNIDADES SALUDABLES
ALIMENTOS DE CALIDAD A PRECIOS ACCESIBLES
OPORTUNIDADES ECONÓMICAS SEGURIDAD COMUNITARIA
OPORTUNIDADES EDUCATIVAS
CALIDAD DEL MEDIO AMBIENTE
Given how often data ends up challenging conventional wisdom, it’s almost funny how surprising an accumulation of facts and framing can be. This has held true with Hispanics and DATOS and it similarly applies to health.
Conventional thinking holds that health is the product of health care, subject to the influence of genes and personal choice. But the data tell a different story. The consensus finding of the World Health Organization (WHO) is that health care represents only about 10-20 percent of overall health. The science of epigenetics is clarifying that genetic profiles actually do not predetermine our individual fates. Meanwhile, public health officials worldwide agree that the choices we make are predicated by the choices we have.
In other words, health goes beyond health care. Health is everywhere — shaped by the contexts in which we live, work, learn and play. Many of health’s data experts assert that the strongest predictor of health and well-being is not your genetic code, but rather your zip code. In fact, conditions in neighborhoods separated by just a 10-20 minute drive in Phoenix have the capacity to affect life expectancy by up to 10-14 years. Phoenix is not an anomaly. Cities all over the U.S. share similar profiles.
These facts are not just attention-getting, they are also perception-shifting and empowering. They tell us that we have new options to improve health and well-being. We can call upon partnership with sectors like food, housing or transportation. We can delve into the health impacts of education and economic opportunity. We can extend ourselves toward impacting the visceral effect that social factors like isolation or toxic stress have on health. We can study how all of these factors are rooted by the cross-cutting issues of equity and resilience. We can use that knowledge to collaborate and integrate efforts among and across sectors. In so doing, we can be more powerful, more effective and more impactful in improving community health and well-being.
We are humbled to be partnered with the Arizona Hispanic Chamber of Commerce in order to more thoroughly understand what this approach can mean for the well-being of Hispanics. Part of the DATOS mission is to align perceptions of Arizona Hispanics with a data-based reality. Vitalyst’s Live Well Arizona goal is to realign perceptions with the facts as well — and to capitalize on that new understanding with cross-sector investments of time, talent and treasure that can propel Arizona to a more equitable, healthier future.
When it comes to honoring the Hispanic community’s unique assets and strengths within this new health paradigm, we couldn’t be more grateful to partner with DATOS.
Here’s to a future of working together to improve community health and well-being for us all.
The Elements of a Healthy Community wheel was designed and produced by Vitalyst Health Foundation in collaboration with community partners. The elements are inspired by the work of the World Health Organization and the Centers for Disease Control and Prevention.
To learn more, please visit VitalystHealth.org

1. Hispanics make up nearly 20% of the U.S. population and 31.6% of Arizona’s population.
Source: U.S. Census Bureau, ACS 1-Year Estimates, Table DP05 (2023)
2. Maricopa County is one of the Top 5 U.S. counties in numeric population growth (2023–2024).
Source: U.S. Census Bureau
3. Mexico remains the country of origin for the majority of the U.S. Hispanic population (58.3% nationwide, 86.1% in Arizona).
Source: U.S. Census Bureau
4. Hispanics are significantly younger, with a median age of 27.7 years — about 15 years younger than the rest of Arizona’s population.
Source: U.S. Census Bureau
5. Hispanics in the U.S. have a median age more than 10 years younger than the White population (28.9 vs. 40.4 in 2023).
Source: U.S. Census Bureau
6. Arizona’s Hispanic population is concentrated in specific counties — Santa Cruz (82.7%), Yuma (64.4%), and Pima (36.1%) are above the state average of 31.6%.
Source: U.S. Census Bureau
7. Almost 150 people move from California to Arizona every day, making CA the top source of inbound migration to the state.
Source: U.S. Census Bureau
8. Hispanics lead in U.S. labor force participation at 66.9%, higher than Whites (63.1%) and Blacks (65.0%).
Source: U.S. Bureau of Labor Statistics
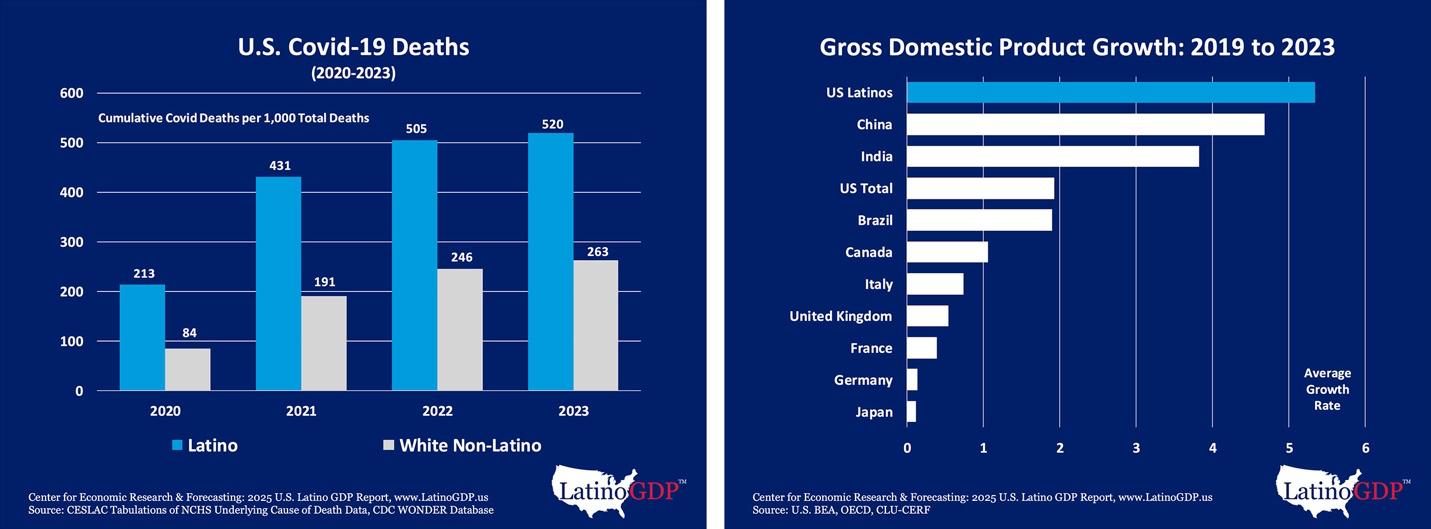
9. U.S. Latino GDP reached $3.6 trillion in 2024, growing 4.6% annually—making it the world’s 5th largest economy and projected to surpass Japan and Germany by 2027.
Source: Latino Donor Collaborative, 2024 U.S. GDP Report
10. Hispanics face slightly higher unemployment (4.6%) compared to the overall U.S. average (3.6%).
Source: U.S. Bureau of Labor Statistics
11. Immigrant households in the U.S. contribute over $650 billion in taxes and nearly $2 trillion in purchasing power annually.
Source: American Immigration Council
12. Only 1 in 5 Latino-owned businesses receive funding, compared to 40% of White-owned businesses, despite Latino businesses experiencing faster growth rates.
Source: Stanford Graduate School of Business, 2024 State of Latino Entrepreneurship
13. One-third of U.S. Hispanics are chronically absent from school, one of the highest rates among racial/ethnic groups.
Source: U.S. Department of Education
14. Arizona is among the Top 5 states with the highest chronic absenteeism rates in 2022–23 (41%).
Source: U.S. Department of Education
15. Nearly half (48%) of Arizona’s K–12 students are Hispanic, making them the largest ethnic group in schools.
Source: Arizona Department of Education
16. Arizona teachers earn 13% less than the U.S. national average; $62,714 vs. $72,030 (2023–24).
Source: National Education Association
17. High school graduation rates for Hispanics (77.6%) remain lower than for Whites (87.4%) and Asians (92.4%) in Arizona.
Source: Arizona Department of Education
18. Nearly one-third of federal crimes sentenced in the U.S. are immigration violations (30% in FY 2024).
Source: United States Sentencing Commission
19. Hispanics accounted for the largest share of federal sentencings in 2024 (49.8%).
Source: United States Sentencing Commission
20. Hispanics made up nearly all (93.9%) of federal immigration sentencings in FY 2024.
Source: United States Sentencing Commission
21. Hispanic and Black households had the highest food insecurity rates in 2023 (22% and 23% respectively).
Source: USDA, Household Food Security in the United States in 2023
22. Hispanics face the highest ACA ineligibility due to immigration status among the uninsured under age 65.
Source: KFF, Health Coverage by Race and Ethnicity
23. Hispanics make up the largest share of Arizona’s incarcerated population (39.2%).
Source: Arizona Department of Corrections
24. U.S. homelessness reached a new high in 2024 with 767,856 people, the highest level recorded since 2010.
Source: Harvard Joint Center for Housing Studies
25. Arizona is among the Top 10 states for homelessness in 2023–2024.
Source: Harvard Joint Center for Housing Studies
26. In 2022, Hispanic homeownership in Arizona surpassed renting for the first time.
Source: U.S. Census Bureau
27. Childcare costs in 2022 could equal or exceed a year of rent, with full-day care averaging $15,600 annually compared to median rent of $15,215.
Source: U.S. Department of Labor Blog

1 10 100 1,000 10,000 100,000 1,000,000 10,000,000 100,000,000 1,000,000,000 10,000,000,000 100,000,000,000
1,000,000,000,000


• Nearly 20% of the U.S. Population is Hispanic
• Older, 3rd Generation Lead Immigrant Growth
• Mexico and Central America Continue to Lead Growth in Undocumented Population
• Maricopa County is the Third Highest in the U.S. for Growth
• Pinal County is Among the Top 10 in U.S. for Growth Percentage
• U.S. Population is Aging Faster Than Birth Rate
• U.S. Hispanics are Over a Decade Younger Than the White Population
• Nearly 3 in 10 of U.S. Hispanics are Under 18
• In Two Decades, Prime Working Age Immigrants Went From 1 in 5 to 1 in 3
• U.S. Foreign-Born Population is Projected to Grow by 3% by 2060
• Women are Having Less Children Than a Decade Ago
• American Indians and Hispanics Continue to Have Among The Highest Birth Rates
• Mexico is the Country of Origin for the Majority of the U.S. Hispanic Population
• Arizona's Immigrant Population has Decreased While Increasing in the U.S.
• One Third of Arizona Counties Have a Higher Percentage of Hispanic Residents than the State Average
• Counties Closer to the Border Have the Highest Population of Hispanics
• AZ Hispanics are 15 Years Younger Than the Rest of the Population
• Over 170 People Move to AZ Every Day From Within the U.S.
• Almost 150 People Move From CA to AZ Every Day
• Arizona Loses 146 Residents Every Day to Other States
The Population chapter (Chapter 1) includes comparisons from the U.S. Census Bureau’s 2013 American Community Survey (ACS) 1-year estimates, 2022 American Community Survey (ACS) 1-year estimates and 2022 American Community Survey (ACS) 5-year estimates. Outcomes derived from these comparisons should be acknowledged with caution as each U.S. Census Bureau product has a different methodology. More information about comparing estimates can be found here


We’re proud to support the Arizona Hispanic Chamber of Commerce and its invaluable work for our community.
Here for it. Are you?

scan to sign up for our La Voz newsletter
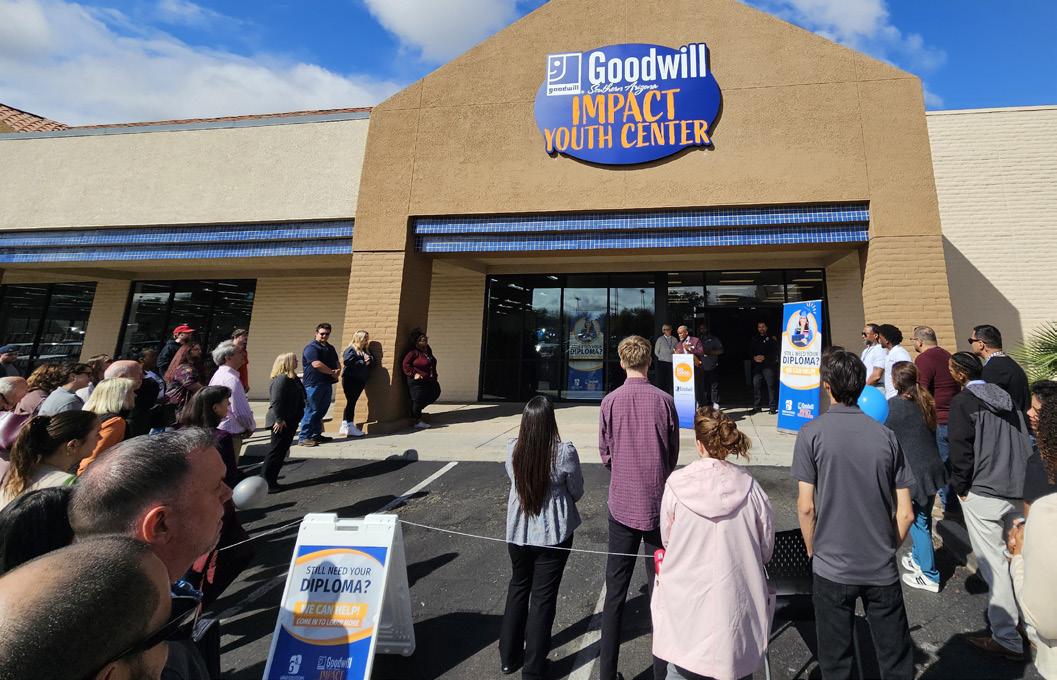
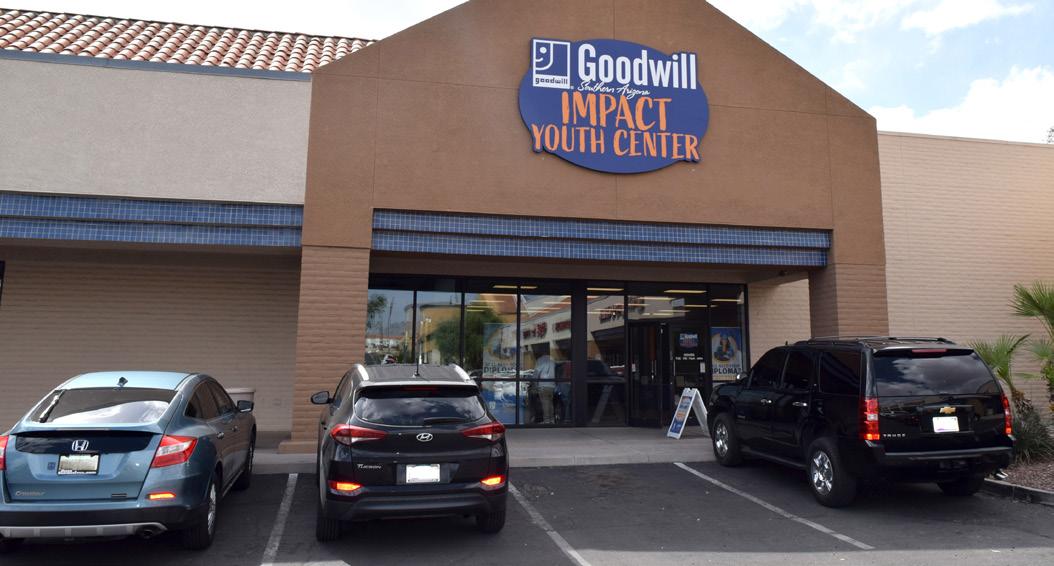
The Impact of Goodwill Youth Reengagement Centers
EXCERPT
At Keys to Change, We Hold This Truth: Housing Is Not Just A Basic Need BY RICHARD CREWS
The Demographic Outlook: 2025 to 2055
In This Report, by the Congressional Budget Office, the CBO Projects That the Population will Grow to 372 Million by 2055.
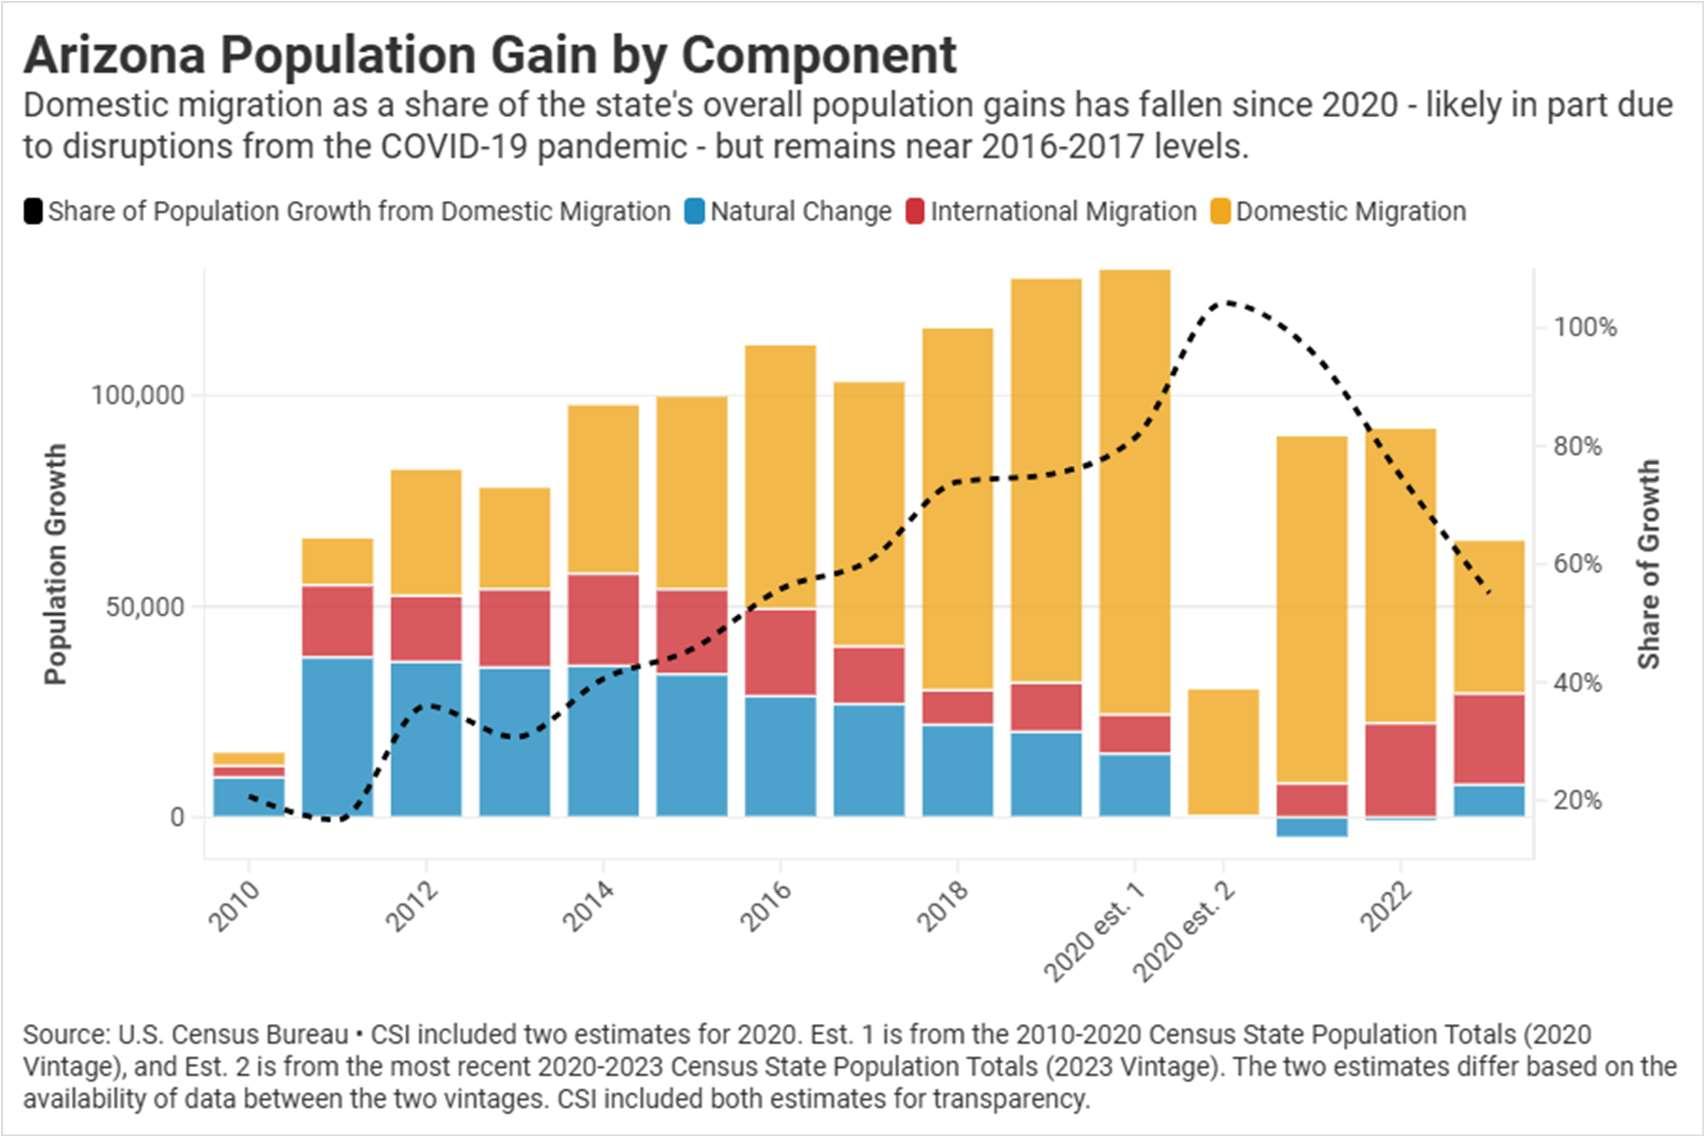
2023 Domestic Migration Data Migration Slowdown: Arizona Captures a Large Share of a Shrinking Pie
Despite Arizona Ranking Top Five in Net Domestic Migration in 2023, the Report by the Common Sense Institute, Finds That Domestic Migration Rates Have Fallen Since 2022.
POPULATION By Ethnicity (2023)
19.4% 80.6% HISPANIC NON-HISPANIC Nearly 20% of the U.S. Population is Hispanic
OVERVIEW: The document provides detailed statistics on the Hispanic population in the U.S. and Arizona, including demographics and trends.
Source: U.S Census Bureau, American Community Survey 1-Year Estimates, Table DP05 (2023) data.census.gov/table/ACSDP1Y2023.DP05
POPULATION CHANGE IN THE U.S. By Age Group & Immigrant Generation (2000–2023)
3rd
(2010, 2023)
Pinal County is Among the Top 10 in U.S. for Growth Percentage
In Two Decades, Prime Working Age Immigrants Went From 1 in 5 to 1 in 3
Age Group, 2000 & 2023
Mexico is the Country of Origin for the Majority of the U.S. Hispanic Population
NOTE: "Other Hispanic or Latino" includes those of Spanish descent including Spaniards, Spanish, or Spanish Americans. *Total percentage may result in more than 100% due to rounding
Source: U.S. Census Bureau, American Community Survey 1-Year Estimates, Table B03001 (2023) data.census.gov/table/ACSDT1Y2023.B03001 AZ/U.S. HISPANIC
By
AZ/U.S. IMMIGRANT POPULATION AND SHARE OF TOTAL POPULATION (1990, 2000, 2010, 2019, 2023) Arizona's Immigrant Population has Decreased While Increasing in the U.S.
UNITED S TATES ARIZON A
(2023)
AZ Hispanics are 15 Years Younger Than the Rest of the Population
Source:
+126,008 +106,592 +68,667 +62,533
21,152 19,900 12,378 10,675 8,361


Source: DATOS Interactive — Population Dashboard
South
Source: DATOS Interactive — Population Dashboard
Arizona Net Migration Rank (2022) 4
Arizona In Migration Rank (2022) 7
Arizona Out Migration Rank (2022) 15
Net Migration Count (2022) 78K
Arizona In Migration Count (2022) 283K
Arizona Out Migration Count (2022) 205K
Areas with the Highest Net Migration Count (2022)
Areas with the Highest In Migration Count (2022)
Areas with the Highest Out Migration Count (2022)
Univision Arizona is the preeminent leader in entertaining the Spanish-speaking world, with a powerhouse portfolio of media brands unlike any other in the U.S. media landscape.


BY LANCE MEEKS
Goodwill of Southern Arizona has a total of eighteen thrift stores, two outlet stores and six attended donation centers, but many may not know that there are fourteen workforce programs, seven adult programs and seven youth programs. The mission of Goodwill of Southern Arizona is to provide jobs and training that equip individuals with the skills needed to achieve independence and long-term success, guided by a vision in which all people have the opportunity to reach their potential and contribute to their community. Goodwill’s Youth Reengagement Centers provide youth and young adults ages 12 to 24 who are not engaged in school or work with academic support, employment readiness training, career exploration, job placement assistance, mentorship programming and life skills development. There are four Youth Reengagement Centers within the Tucson community — Goodwill Metro Youth Center, Goodwill REC Youth Center, Goodwill Opportunity Youth Center and the Goodwill Impact Youth Center. The expansion from one to four centers was done with the support of United Way of Southern Arizona. Our approach to reengagement provides staff with training in trauma-informed care and motivational interviewing- which helps staff connect quickly with participants. Unlike many organizations, our Goodwill team is comprised of adult staff members, and youth ages 18–24 with lived experiences of homelessness, justice involvement or education/ employment challenges. By having trained adults with lived experiences, youth receive consistent support as they navigate life circumstances. Community stakeholders identified issues around transportation from different parts of the community, lack of services and resources for youth in certain zip codes, and the increase of referrals to juvenile court that focused on vulnerable youth groups in certain zip codes. Of course, none of these youth reengagement centers could operate without various funding

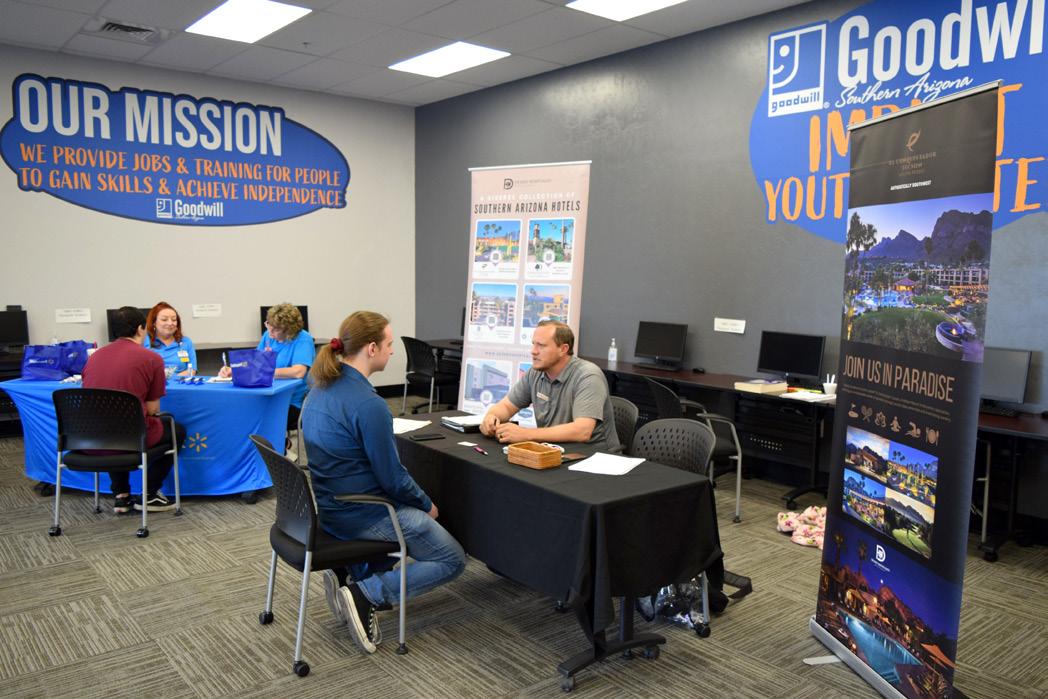
sources and the revenue that comes from the thrift stores. 90 cents of every dollar is spent on our mission – providing jobs and training for people to gain skills and achieve independence.
Youth disconnection from school and the workforce remain a significant challenge in Tucson, where an estimated 18,137 young people ages 16–24—approximately 12.5% of this age group— are considered “opportunity youth” (Cradle to Career, 2021).
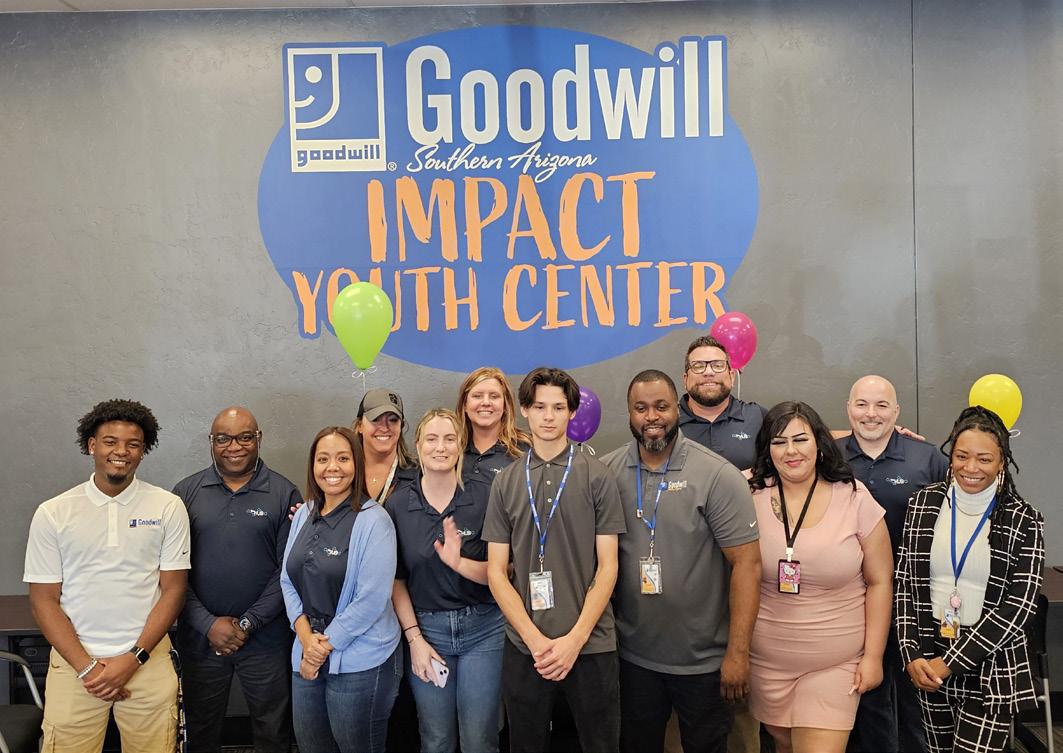
Goodwill’s Youth Reengagement Centers are actively addressing this crisis, reconnecting over 2,100 young people each year. The four Youth Reengagement Centers provide safe spaces for youth to connect with trusted adult staff members, community partner agencies and access to pathways to other Goodwill programs such Youth Employment, Reentry and Community Violence Intervention programming. This past fiscal year, 28 youth obtained their GED, and 29 youth completed their high school diploma with the support of reengagement center staff. These reengagement centers are also utilized as points of connections for community partner organizations to engage with youth to share about their resources and services. Bank of America partners with Goodwill to host
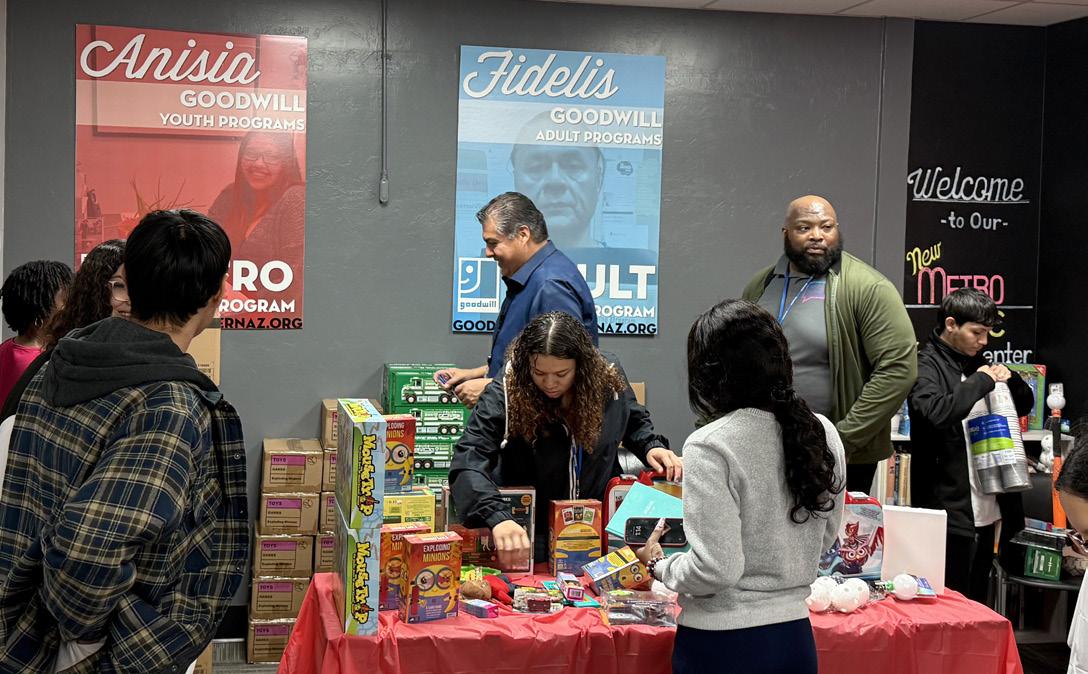
financial literacy workshops called Better Money Habits to youth at each youth reengagement center. The Better Money Habits workshops focus on financial skills such as budgeting & banking basics, savings, financial safety, building healthy credit and mobile banking. By partnering with various agencies, youth have access to positive mentorship, transferable work experiences, nutrition education, housing assessment opportunities and health services all within the youth reengagement centers.
Goodwill is a community-focused, community-supported organization, so please remember that when you consider donating or shopping at one of our thrift store locations. There are also opportunities for community members to volunteer to support our workforce programs. Please check out our website.
Lance Meeks is the vice president of community engagement for Goodwill of Southern Arizona. Over 11,000 individuals were served throughworkforce programs 2024–2025
GOODWILL Southern AZ
GoodwillSouthernAZ.org
1940 E Silverlake Rd #405 Tucson, AZ 85713
520.623.5174
• IG: goodwillsouthernaz
• FB: GoodwillSouthernAZ
• X: goodwillsouthaz
• LI: Goodwill Industries of Southern Arizona
This article will provide insight on the impact and benefits that Youth Reengagement Centers have on the Tucson community. Many out-of-school youth want to return to school, but are uncertain how to do so and are fearful, so this is where Goodwill’s Youth Reengagement Centers can provide opportunities for youth to find alternative pathways to education and resources. It’s truly amazing to see what youth can accomplish with a variety of options.
BY RICHARD CREWS
At Keys to Change, we hold this truth: housing is not just a basic need — it is a matter of social justice. Everyone deserves a stable place to live. When systems consistently fail to deliver that, it is more than a policy flaw, it is a moral and structural injustice. Housing and the denial of housing must be understood as social justice issues.
If we believe that, then the sharp and disproportionate rise in homelessness among Latino communities in Arizona is a measure of how far we still have to go.
Between 2019 and 2024, the number of Latinos experiencing homelessness in Maricopa County more than doubled, increasing by 113%. In 2019, Latinos made up 18% of the total homeless population. By 2024, that figure had jumped to 27%. Compare that
to a 42% increase in overall homelessness countywide during the same period, and the inequity becomes undeniable.
This crisis is not the result of individual failures or poor decisions. It is the result of systems that are successfully failing communities of color.
Too often, public narratives reduce homelessness to addiction or mental illness, simplistic explanations that let policymakers and institutions off the hook. I’m often asked what causes homelessness. My answer is simple: bad policy.
When someone can’t access shelter because shelter isn’t treated as a right, that’s bad policy.
When someone has to wait until they’re considered “chronically homeless” to qualify for supportive housing, that’s bad policy.
2019 to 2024,
Increased by 113% (From 1,199 to 2,548). The Proportion of the Overall Pit Count Identifying as Latino Grew From 18.% to 27% Over Five Years. The Pit Total Count Rose by 43% in the Same Period (From 6,614 to 9,435)
And if I was sane but stressed when I became homeless, is it not reasonable that I might lose my sanity and begin self-medicating just to survive, especially if the cost of the medication I need to regulate far exceeds what I can pay for it?
The systems that govern housing, healthcare, employment and criminal justice have never been neutral. For Latino Arizonans, these systems have long been shaped by exclusion, disinvestment and structural racism. That legacy shows up not just in homelessness, but in educational gaps, economic instability, criminal justice and community divestment.
This rise in homelessness must be part of the larger conversation about how these systems continue to fail the Hispanic community.
Dr. Martin Luther King stated, true compassion is more than flinging a coin at a beggar, it comes to see that an edifice that produces beggars needs restructuring.
We have to shift from charity to systems change work.
At Keys to Change, we believe in the power of collaboration to drive real solutions. And we know that no single organization holds the whole answer. That’s why we use an approach rooted in Puzzle Piece Problem-Solving.
Too often, leaders come to the table with a pre-determined solution, assuming they already know what’s best, before listening, before learning, before partnering. But the reality is: no one sees the full picture. We each hold a piece.
We invite everyone — clients, community advocates, service providers, policymakers, businesses, academia, philanthropy, faith-based institutions, public health leaders and more, to bring their piece to the table. Not to dominate the solution, but to cocreate it. We must stop forcing “fixes” that create more problems. Instead, we ask: How does my piece fit? Or even more critically: How do we reshape our piece to fit into the actual solution that works?
AT KEYS TO CHANGE, WE HOLD THIS TRUTH: HOUSING IS NOT JUST A BASIC NEED
Our goal isn’t just to move people off the streets, it’s to change the conditions that made the street the only option.
We cannot do it alone. That’s why we are calling on Arizona’s business, civic and philanthropic leaders to act. If these barriers remain unchallenged, the future of Arizona will remain unjust and unequal, and homelessness will continue to rise at an astronomical rate.
To everyone reading this article, I ask: What is your piece?
Not just your buy-in, but your partnership. We don’t need people
to place their puzzle piece and walk away. We need people willing to stay at the table and help us keep asking: How do we work together to truly end homelessness, so that it is brief, rare, and non-reoccurring?
We are in an urgent moment. The pillars of our social systems are cracking under the weight of economic pressure and policy gaps. Unaddressed homelessness leads to increased strain on emergency services, healthcare and public safety. Investing in equitable housing access is both fiscally responsible and socially sound. Government alone won’t solve this. Your favorite comic
• The overall PIT count increased by nearly 43%, while Latino homelessness increased by over 112% in the same period.
• Black individuals also saw a significant rise, increasing nearly 67%, well above the total growth rate.
• White individuals experienced a slower increase of just under 45%, more in line with the overall trend.
• PIT is often considered a drastic undercount.
• The “Other” racial category (which includes individuals identifying with multiple races, Native American, Asian, Pacific Islander, or unspecified) was the only category to show a decrease between 2019 and 2024. This decline
may not reflect an actual drop in homelessness among these groups, but rather improvements in how racial identity is recorded during PIT counts. Enhanced volunteer training and interview protocols in recent years may have reduced the use of ambiguous or catch-all categories, resulting in more accurate racial classification.
• The PIT Count is conducted in January, providing a single-night snapshot.
• It is widely recognized by providers as an undercount, especially for hidden homelessness (e.g., car-sleepers, couch surfing, hotel nights).
• Despite its limitations, PIT is useful for benchmarking and year-overyear trend analysis, especially since counting errors are generally consistent over time.
book hero isn’t coming. Real solutions will come from all of us in our personal and professional capacities, choosing patience, curiosity and a data-informed commitment to co-creation.
Dr. Cornel West once said, “Justiceiswhatlovelookslikeinpublic.”
If that’s true, then a just society is one where every community is housed. That’s the kind of justice we are fighting for.
Richard Crews is the director of strategic impact at Keys to Change, the nonprofit lead agency for single adult homelessness in Maricopa County,Arizona. He drives systems change byaligning policy, data and lived experience to reimagine solutions to homelessness and housing injustice.
The Demographic
2025 to 2055
Congressional Budget Office, Nonpartisan Analysis for the U.S. Congress
In This Report, by the Congressional Budget Office, the CBO Projects That the Population will Grow to 372 Million by 2055.
SOURCE: The Demographic Outlook: 2025 to 2055 | Congressional Budget Office
Population growth is determined by births, deaths, and net immigration. In CBO’s projections, fertility rates continue to be lower than the replacement rate—the fertility rate required for a generation to exactly replace itself in the absence of immigration—which is 2.1 births per woman. Mortality rates generally continue to decline, and immigration becomes an increasingly important source of overall population growth.
CBO projects fertility rates on the basis of its assessment of past trends. For the 20 years before the 2007–2009 recession, the total fertility rate averaged 2.02 births per woman. After peaking at 2.12 in 2007, that rate has generally fallen, largely because of lower fertility rates among women ages 15 to 24. The total fertility rate was 1.64 births per woman in 2020 and declined slightly, to 1.62, in 2023 (the most recent year for which data were available when these projections were made). In CBO’s projections, the total fertility rate equals 1.62 births per woman in 2025, 1.60 in 2035, and 1.60 in 2055.
The fertility rate for women under 30 is projected to keep falling: from 0.79 births per woman in 2025 to 0.62 by 2055. The rate for women age 30 or older is projected to increase, from 0.84 births per woman in 2025 to 0.98 by 2055, in part because CBO expects women to delay bearing children until older ages.
CBO’s projections of fertility rates are subject to considerable uncertainty. If future trends in fertility differed from what CBO projects, the agency’s projections of overall fertility rates and the age distribution of mothers would change as well.
Rates, by Age Group
In CBO’s projections, fertility rates rise for women of older childbearing ages and fall for women of younger childbearing ages. That pattern is consistent with the recent trend of delays in childbearing.
2023 DOMESTIC MIGRATION DATA Migration Slowdown: Arizona Captures a Large Share of a Shrinking Pie
Common Sense Institute Arizona
Despite Arizona Ranking Top Five in Net Domestic Migration in 2023, the Report by the Common Sense Institute, Finds That Domestic Migration Rates Have Fallen Since 2022.
SOURCE: 2023 Domestic Migration Data| Common Sense Institute Arizona
OCTOBER 2024
Migration Slowdown: Arizona Captures a Large Share of a Shrinking Pie.
Author: Zachary Milne
Arizona continues to be a top destination for movers in the U.S. According to the most recently released state-to-state migration figures from the American Community Survey (ACS), Arizona ranked 5th in net domestic migration last year, which considers people both moving to and moving from the state.i Over 62,500 people moved to Arizona from other states in 2023. While Arizona continues to perform well relative to other states, migration is down significantly from recent years.
Domestic migration levels indicate the attractiveness of the state, including economic opportunity. It can also serve as a signal of current and future economic momentum; as economies grow and opportunities in the local area multiply, states tend to “pull” in residents from other states where opportunities may be stagnant, or even declining.
Key findings
Arizona had the 5th highest net domestic migration in 2023, attracting 62,533 more new residents to the state than left. Other low-tax, low-regulation states like Texas and Florida continued their trend of high net-migration year-over-year, while high-tax-high-regulation states like California, New York, and Illinois continued to lose more residents than they gained.
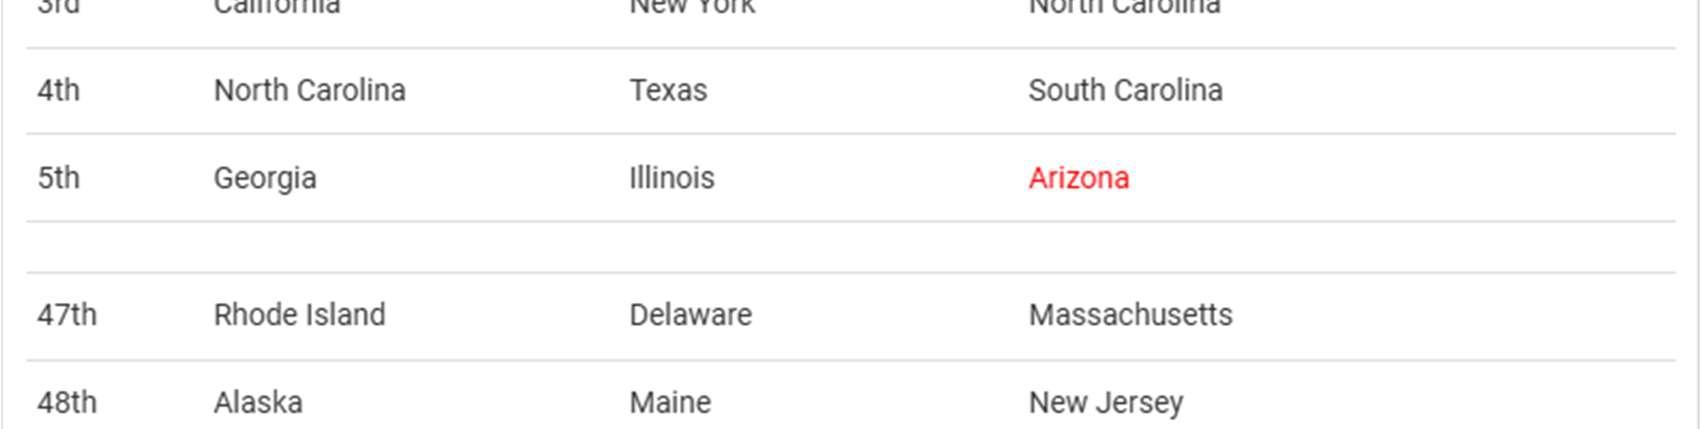
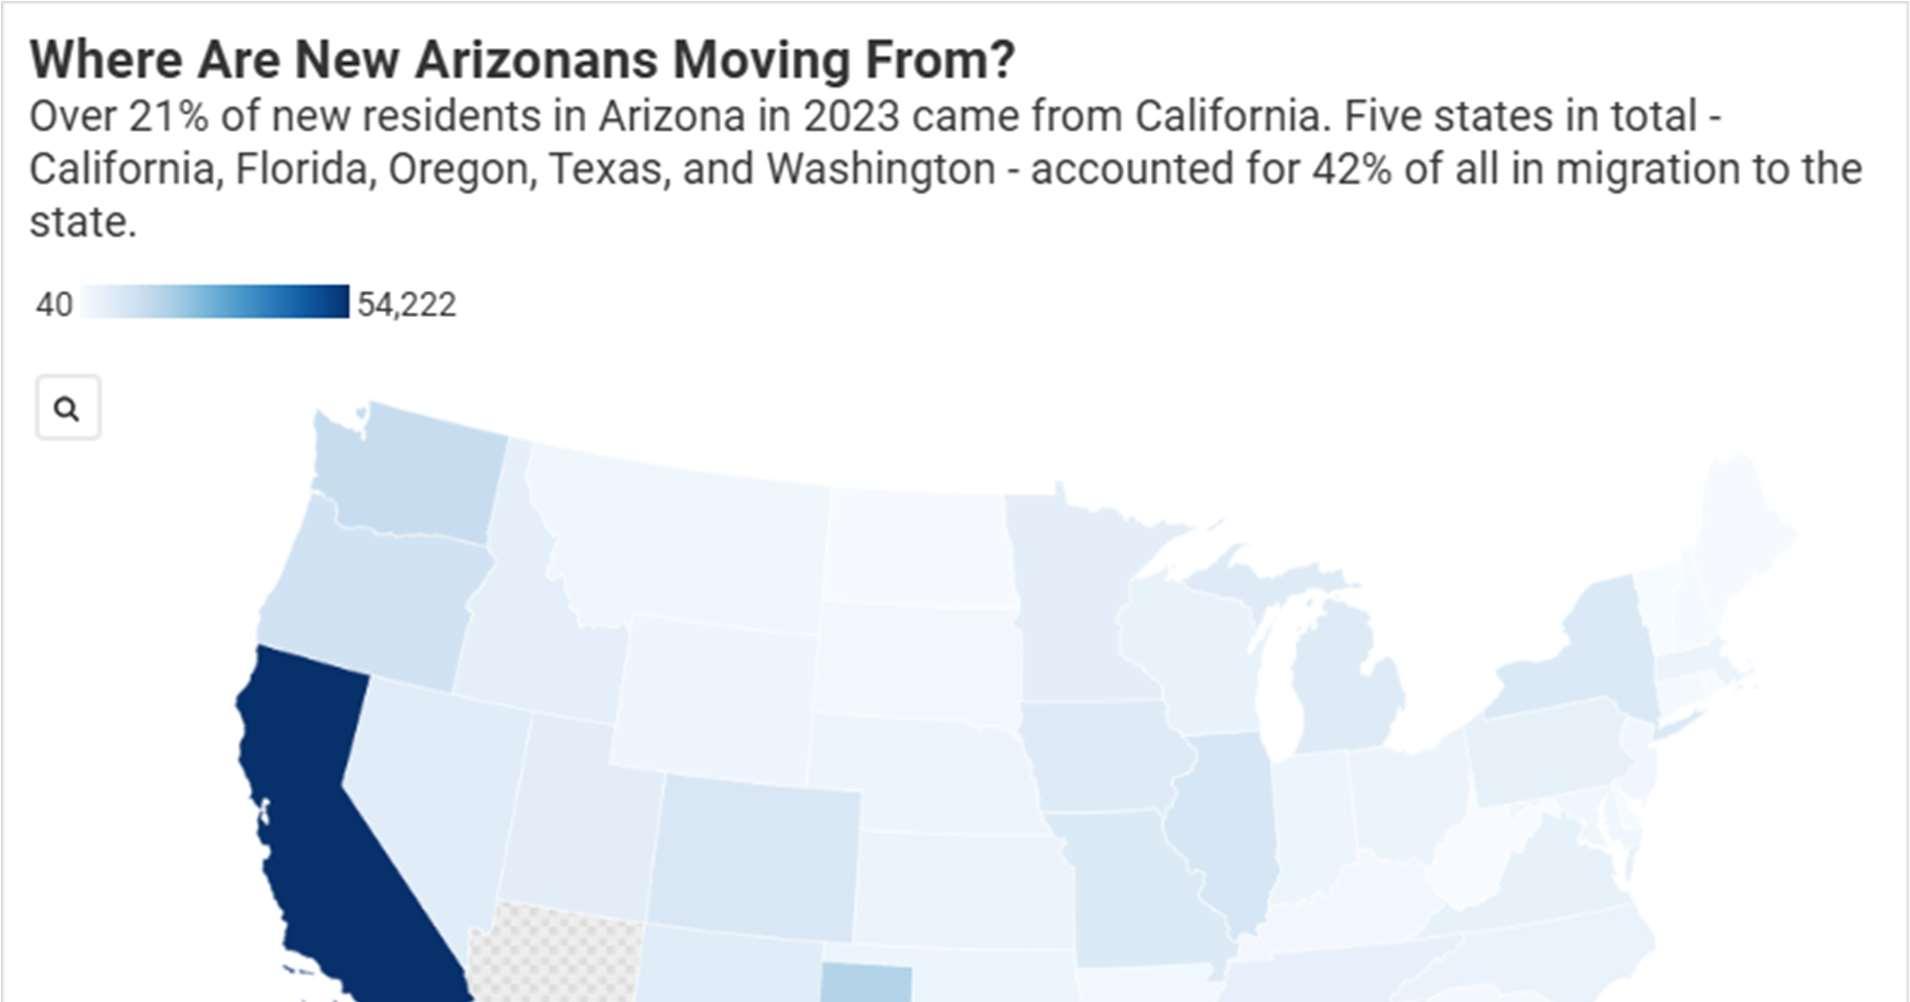
California continues to be the primary contributor of new residents to Arizona. 20% of all new movers to Arizona come from California, and over half of net migration is attributable to that state (inflow minus outflow).
Income data shows that new residents in Arizona have higher incomes on average than both current residents and those who leave the state. On average, taxpayers leaving the state earn 9% less than those who remain, while new entrants earn on average 6.4% more. In contrast, taxpayers moving to California earn 10% less than current residents, while those leaving earn 5.9% more.
On October 17th, 2024, the U.S. Census Bureau released its latest estimates of state-to-state migration based on the 2023 ACS 1-year survey. This newly released data shows that while migration to Arizona and elsewhere has fallen compared to recent years, the Grand Canyon state remains a top destination for domestic movers.
Arizona’s population grew by 1,024,002 persons (+16%) between 2010 and 2023 – the 8 th fastest growth by all 50 states and Washington DC – and over two-thirds of that growth was attributable to people moving to Arizona from other states. Although the share of population growth from domestic migration has fallen since 2020, it remains above 50%.
According to the most recent data for 2023, Arizona ranked 5th in total net migration by bringing in 62,533 more residents on net. California on the other hand had the lowest net domestic migration, losing over 268,000 residents. In comparison, Texas – the top state in terms of net migration –brought in 133,372 more new residents on net.
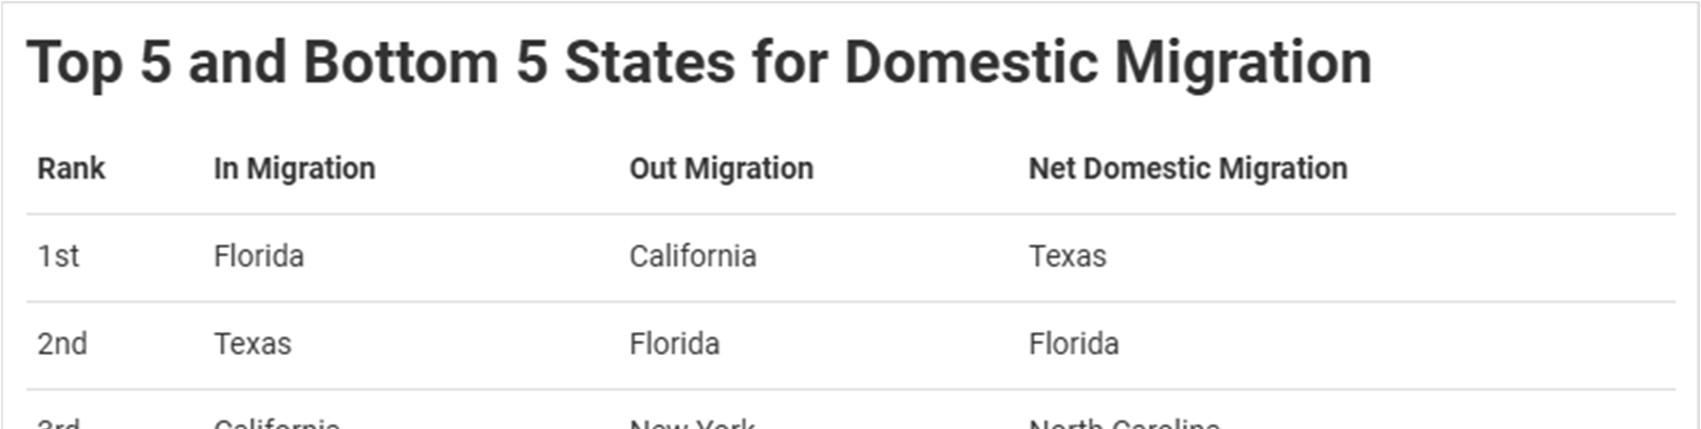
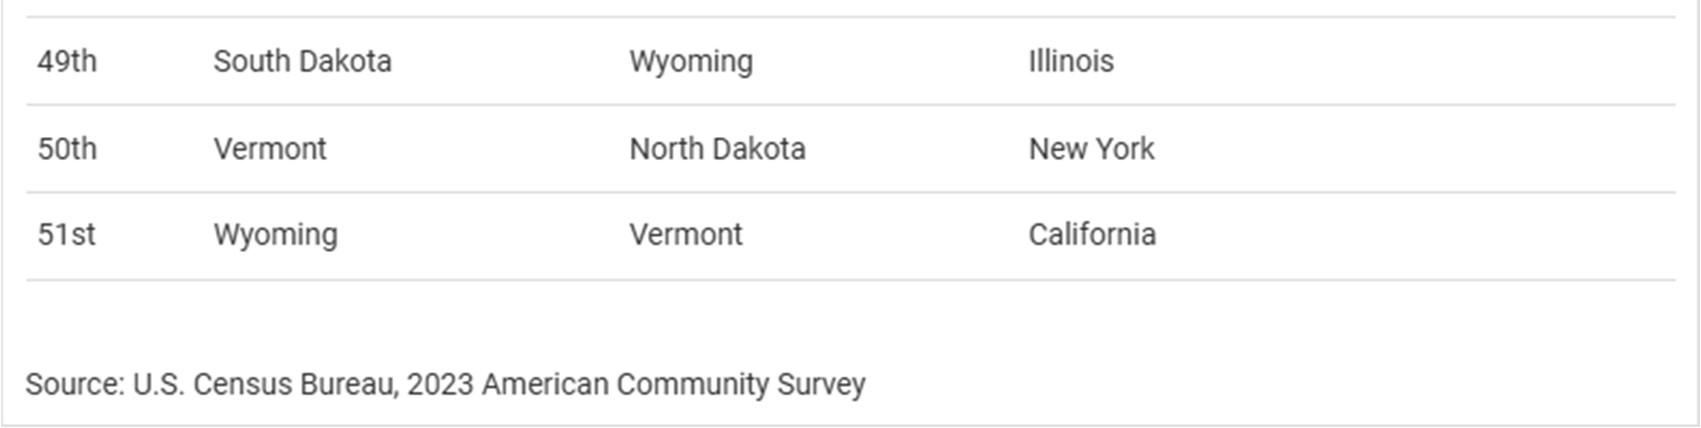
Although domestic migration fell overall in 2023, the trend of where people are moving to and from remained intact, with people overwhelmingly moving to high-growth, low-tax states, and away from high-regulation, high-tax states. States like Texas and Florida continue to attract many more new residents than they give up each year, while states like Illinois, New York, and California continue to lose many more than they bring in. For example, the top five states for net domestic migration in 2023 had an average top income tax rate of 2.75% (or 4.58% if you exclude Texas and Florida which do not have an income tax), while the top rate in the five bottom states averaged 9.78%. ii Similarly, four of the five bottom states in terms of net domestic migration– California, New York, New Jersey, and Illinois – rank in the top 5 for total regulatory restrictions in 2023 (Texas ranked 5 th in most regulatory restrictions).iii
Migration into Arizona continues to be dominated by people moving out of neighboring California. An estimated 54,222 individuals move from California to Arizona in 2023, which accounted for over 1/5th of all the movers into Arizona in that year. Although California also took in the largest share of movers out of Arizona, after factoring those who left Arizona for neighboring California the net migration figures from California dominated those from any other state. In net terms, California accounted for over 53% of all domestic migration to Arizona . In all, Arizona gained more Figure 3

• HIGHLIGHTS: U.S. Latino Economic Growth
• Hispanics Lead in Labor Force Participation
• Half of Hispanics Work in Management, Professional, Service, and Related Occupations
• Hispanic Unemployment Rate is Slightly Higher Than the Total Population
• Hispanic Unemployment has Decreased Substantially in the Last Decade
• The Civilian Labor Force in the U.S. has Become More Dependent on Foreign Born
• U.S. Immigrant Households Contribute Over $650 Billion in Federal and State Taxes
• Immigrants Spend Nearly $2 Trillion in Purchasing Power
• Mexico Surpasses all Countries in Remittances
• The Pandemic Impacted the Financial Situation of Hispanics More Than Others
• Less Than Half of Americans Could Handle an Emergency Expense Over $2,000
• Hispanics are Most Behind in Student Loan Payments
• Hispanic-owned Businesses have Grown Exponentially Compared to their White Counterparts
• Only 1/5 of Latinos Receive Funding for their Business Compared to 40% of Their White Counterparts
• Only Half of Latino Businesses Receive an Explanation for Funding Denied
• Average Annual Revenues of Hispanic Businesses Have Remained Steady Since 2017, While White Businesses Continue to Grow
• Hispanic Households' Net Worth is Significantly Less than Non Hispanic but are Growing Quickly
• While the Majority of Americans Don't Have a Will, Hispanics are Least Likely to Have One
• AZ Immigrant Households Contribute over $11 Billion in Federal and State Taxes
• Arizona's Unemployment has been Cut Nearly in Half Over the Last Decade
• Mexico is Arizona's Top Export Country
• Arizona Imports More From Mexico than Any Other Country
• Computer and Electronic Products are Arizona's Top Imports and Exports
• Many Arizonans Depend on Jobs Created by Foreign-Owned Firms
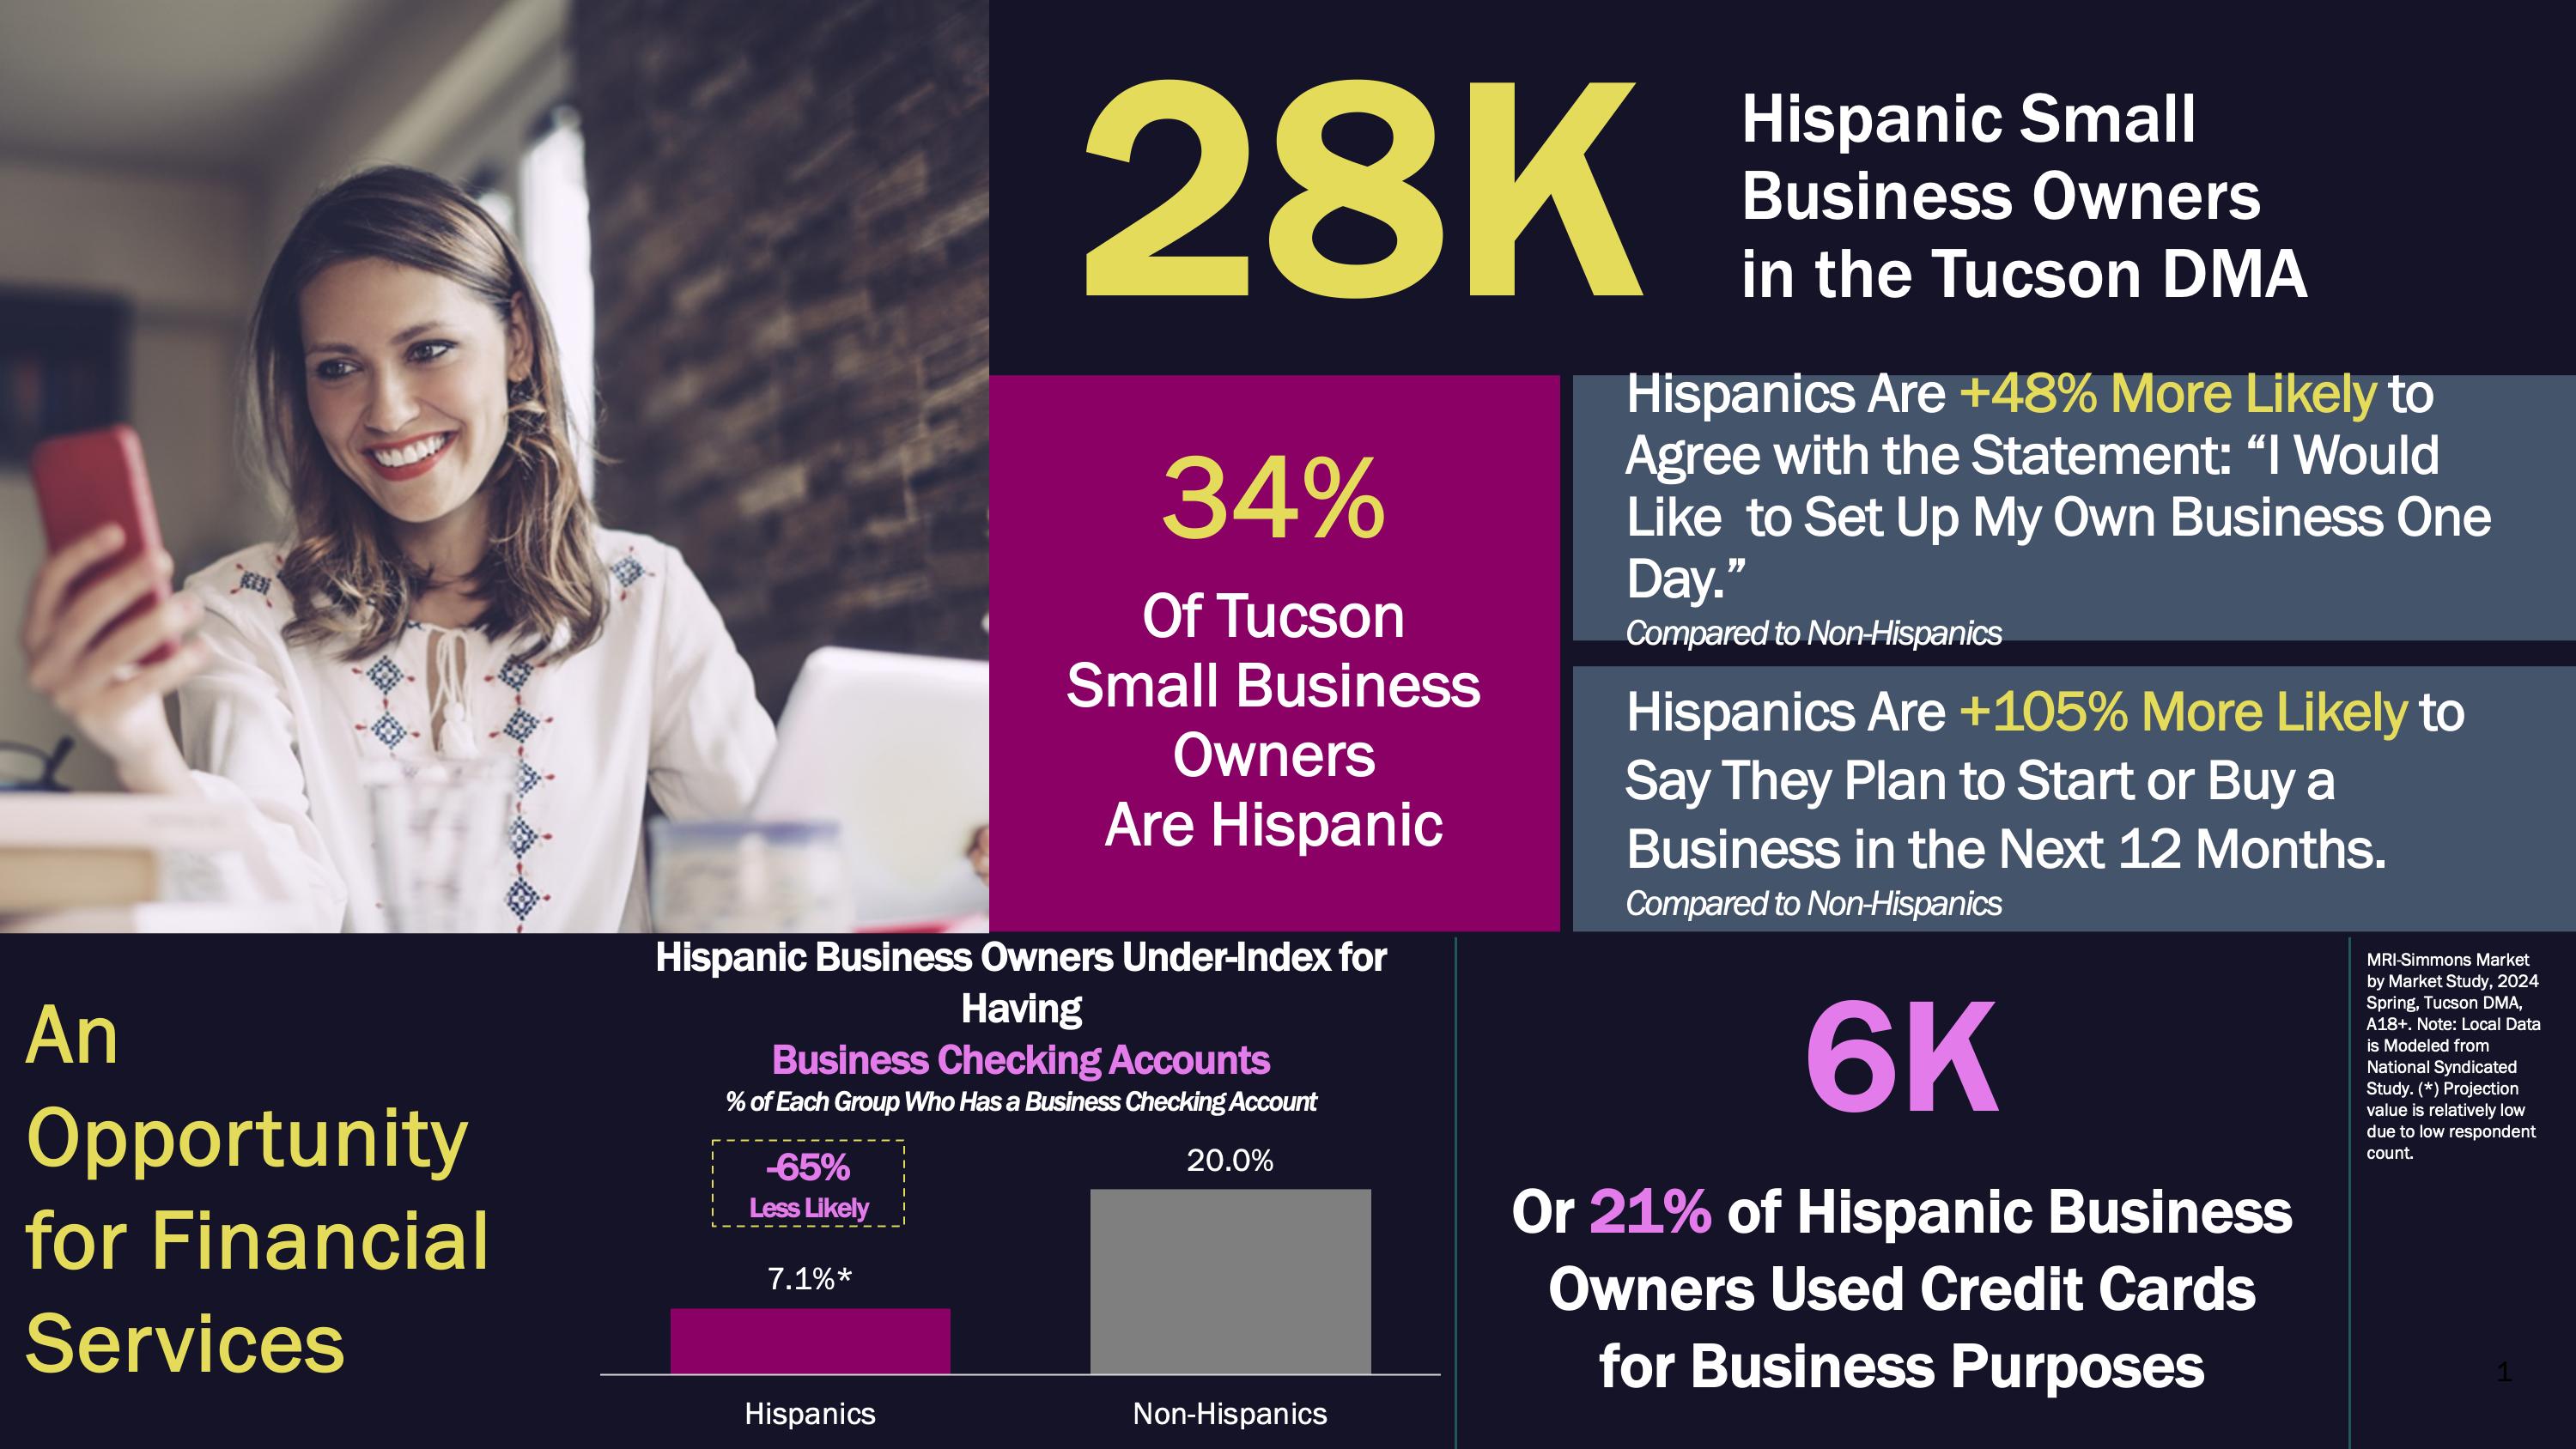
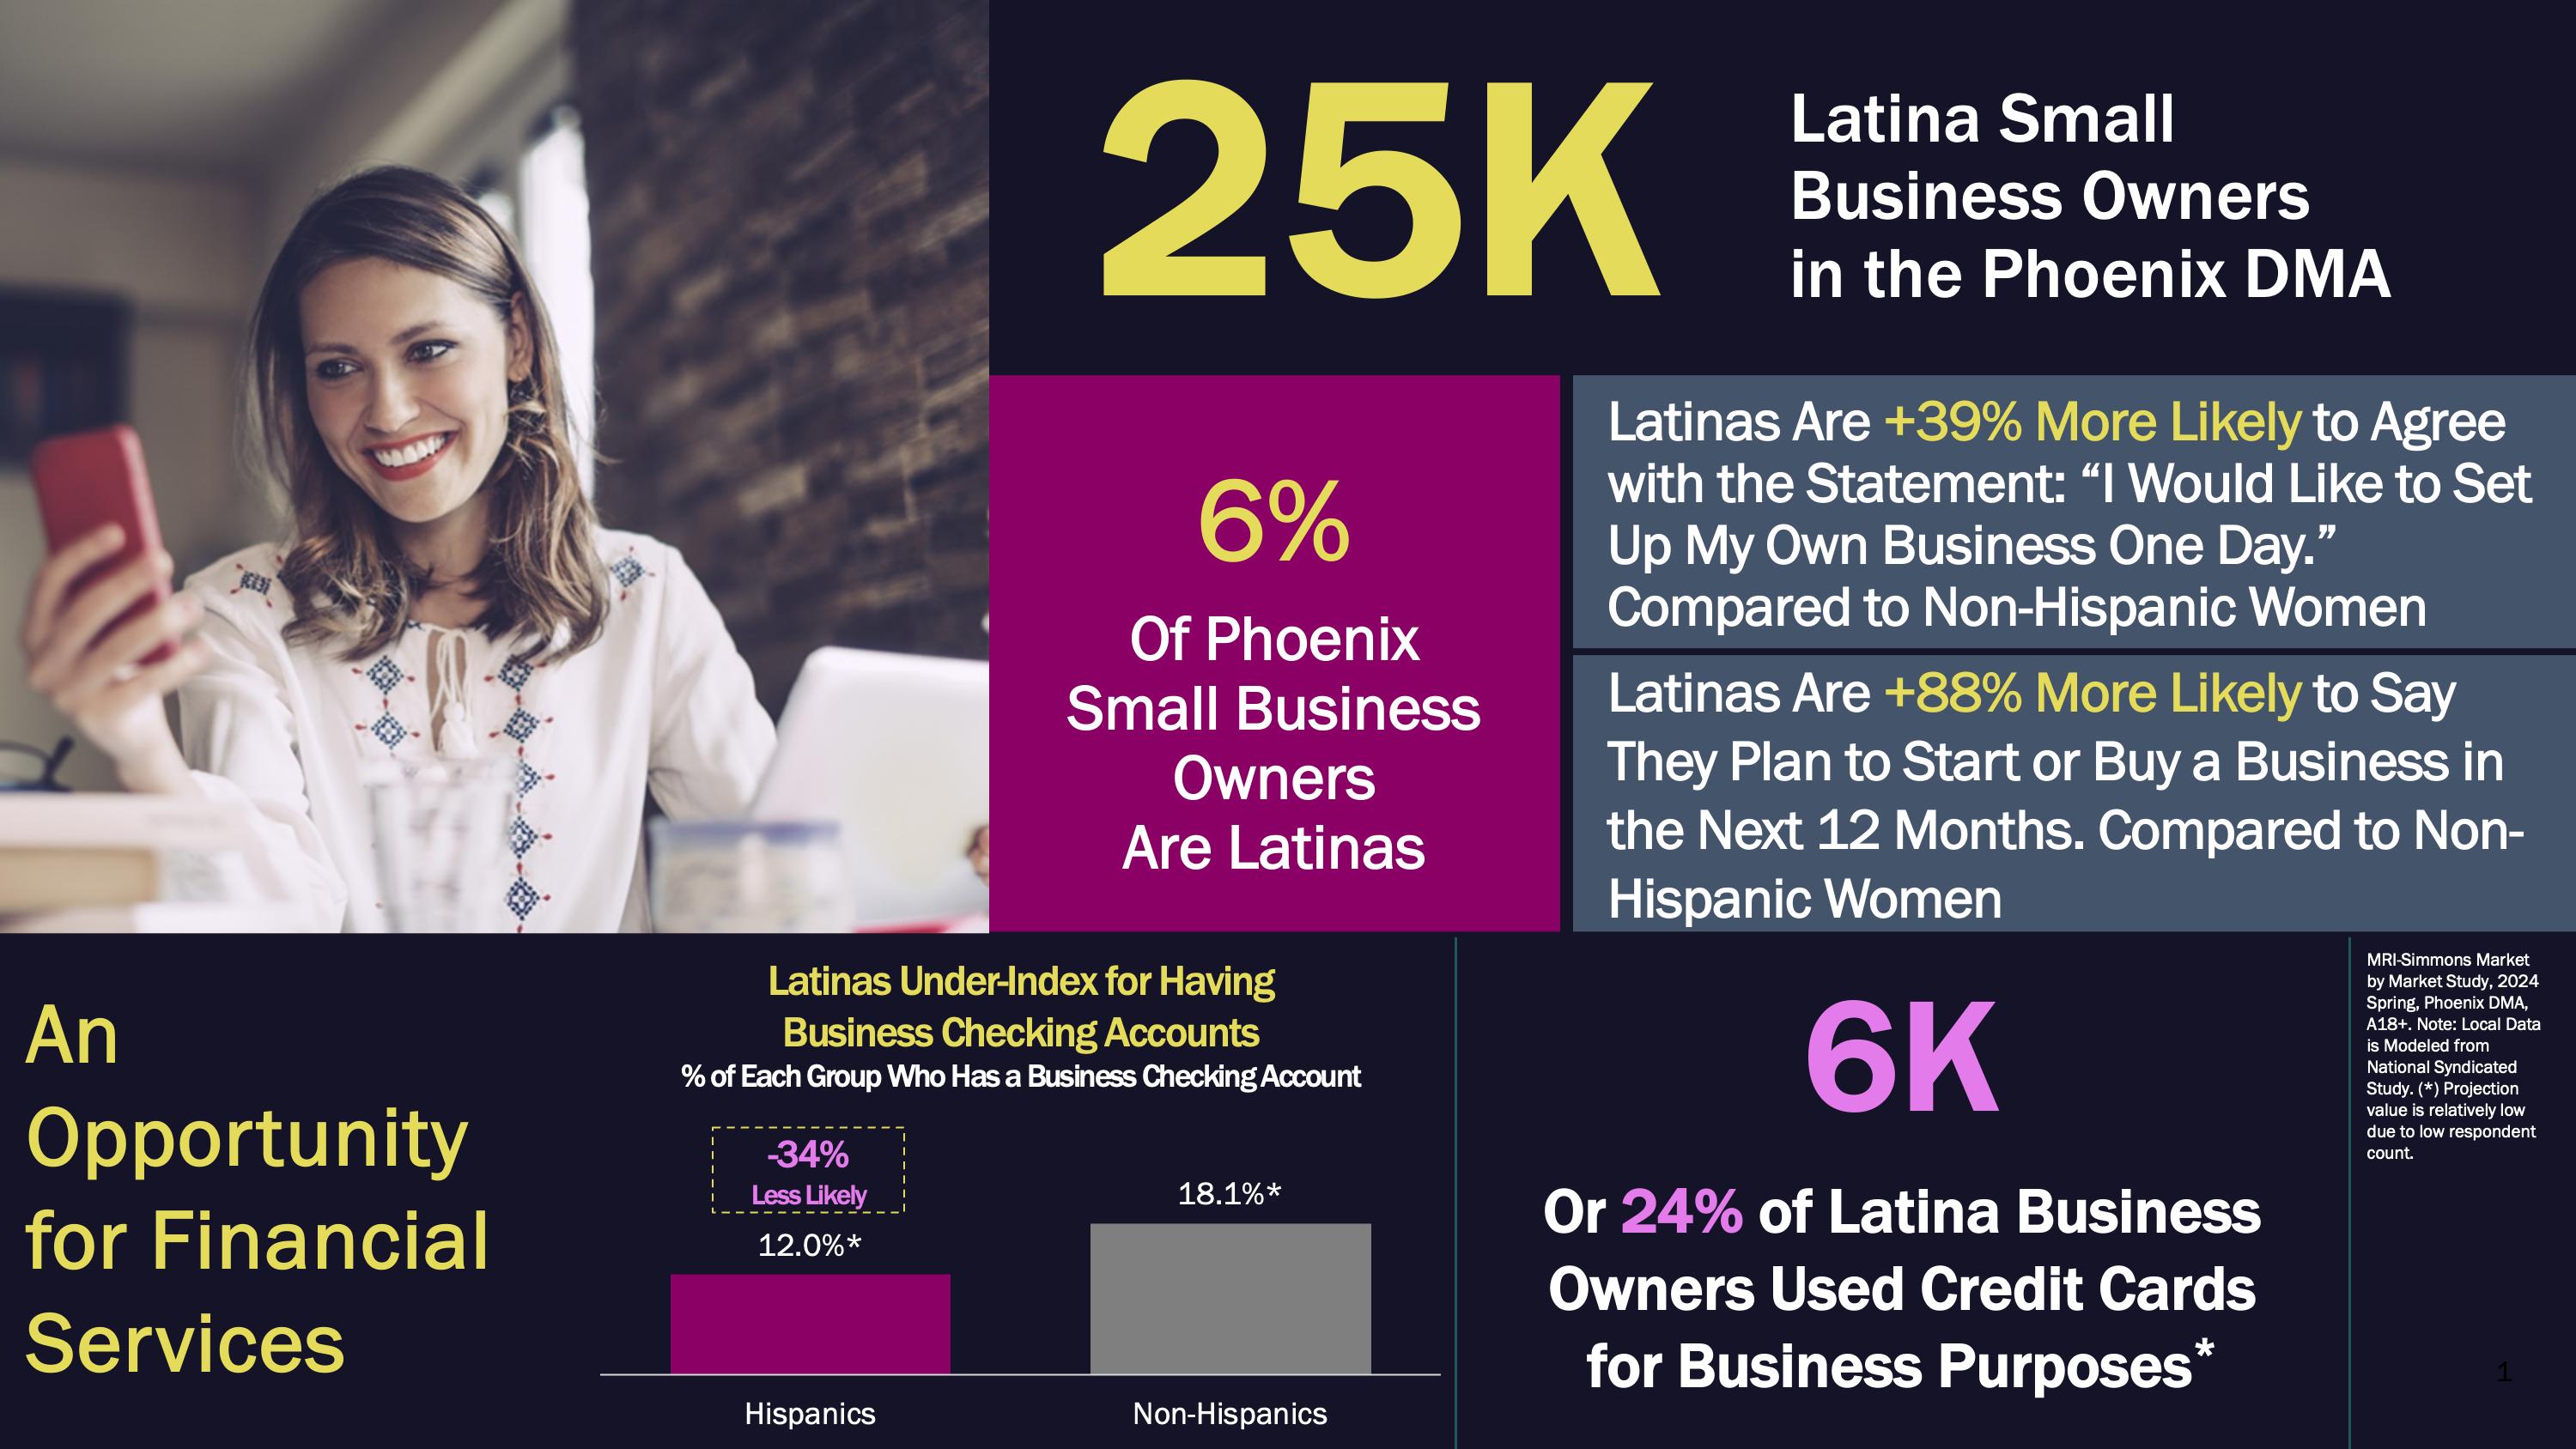
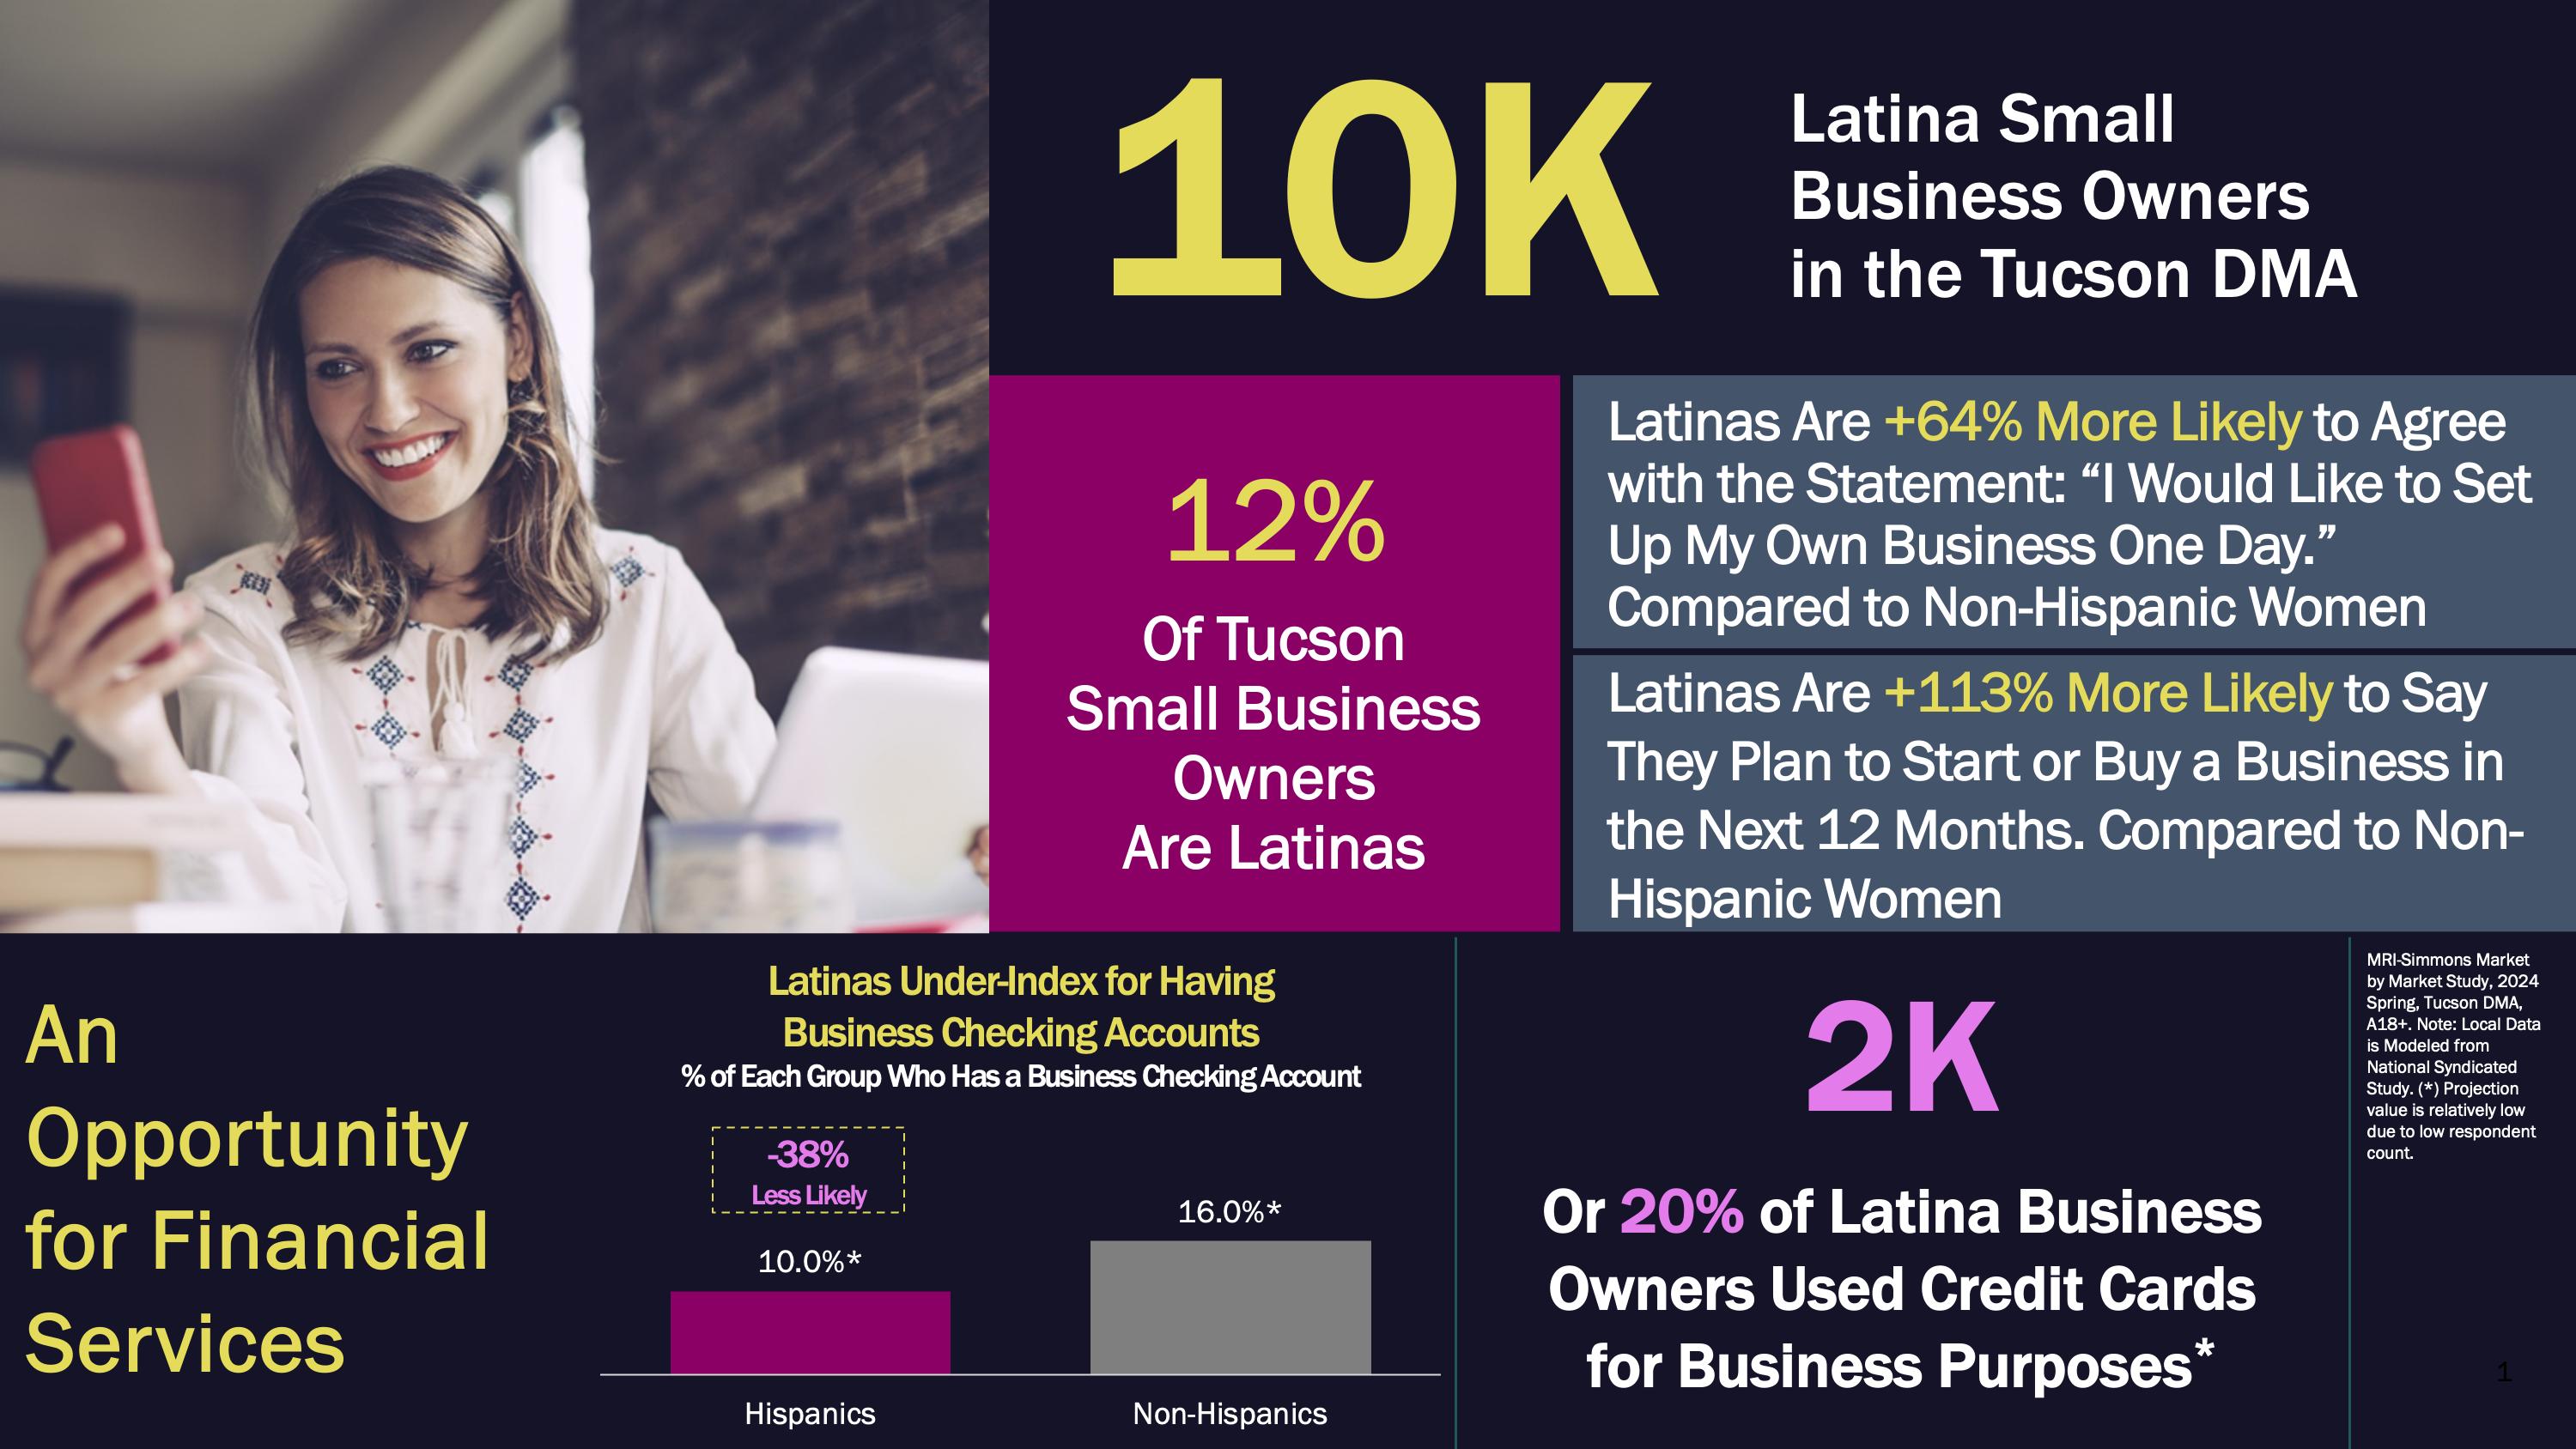
Univision Communications presents a comprehensive look at the financial picture for Hispanics in the Phoenix and Tucson markets, from the top financial institutions, a portrait of Hispanic small business owners, specifically Latinas, to the employment picture and spending habits
How the Trump Tariffs Derailed a Small Business in Arizona
—FOR PUBLICATION IN DATOS BY SONARY AMACHREE
A LOOK AHEAD:
Macro Impacts of Tariffs on America’s Economy BY SONARY AMACHREE
Building Arizona's Workforce Background Report
Latinos Make up 33% of Arizona’s Workforce, Nearly 1.05 Million Workers. Between 2011 and 2021, Arizona’s Workforce Grew by 400,000, With Latinos Making up 276,000 of New Workers. During That Period, Arizona’s Latino Labor Force Grew by 3.1% Annually, More Than Twice of Arizona’s Overall Labor Force (1.4%).
In Their Eight Annual Report, the Latino GDP Report Found That U.S. Latinos Generated an Extraordinary $4.1 Trillion in GDP, Constituting a Positive Trend Since 2010, Putting Latinos GDP Ahead of France and The United Kingdom.
In the Seventh Annual Edition of This Report, Researchers Estimate That U.S. Latinas are Economic Drivers, Increasing Their Economic Output From $661 Billion in 2010 to $1.3 Trillion in 2021.
EXCERPT 94
How Immigrants and Their U.S.-Born Children Fit into the Future U.S. Labor Market
Immigrants and Their U.S.-Born Children Have Become an Important Part of the U.S. Workforce, Accounting for all the U.S. Labor Force Growth in the Last two Decades and Represent a Plurality of Workers in Stem, Food and Personal Services, Health Care Support and Blue-Collar Occupations.
EXCERPT
EXCERPT
EXCERPT 97
100
EXCERPT
103
2024 State of Hispanic Wealth Report
In Their 10th Annual Report on Hispanic Household Wealth, the National Association of Hispanic Real Estate Professionals Estimate That Hispanic Household Wealth Reached $63,400, a 3.17 Jump From 2013. Similarly, Hispanic Homeownership Rates, Home Prices, and Hispanic-Owned Businesses Exprienced Similar Positive Growths.
2025 LDC U.S. Latinas Overview Report
According to Latino Donor Collaborative, Latinas Are A Driving Force in the Economy, Through High Labor Force Participation Rates and Entrepreneurial Efforts Like Latino-Owned Businesses. This is Despite Being Underrepresented in Government, Corporate Leadership, and Media.
2025 Protecting ITIN Taxpayer Privacy and the Integrity of Our Tax System
Despite the Calls to Collect the Information of 700,000 People with ITINS, UNIDOS Finds That ITIN Holders Contribute Enormously to the U.S. Economy and Public Services Through Paying Taxes.
2024 State of Latino Entrepreneurship Report
In Their 10th Annual Study of Latino-Owned Businesses, the Latino Entrepreneurship Initiative Found That the Value of Goods and Services Produced by All Latinos Reached $3.6 Trillion in 2022.
Now Valued at $3.6 Trillion With an Annual Average Real Growth Rate Of 4.6%, U.S. Latino GDP is the Second-Fastest Growing Among the World's Ten Largest Economies, Trailing Only China and Outpacing Countries Like India, France, Canada, and Even The Rest of the United States.
Despite Comprising 19.5% Of The U.S. Population, The U.S. Latino Cohort was Responsible for 28.3% of Total Additions to National Gdp Between 2017 and 2022.
U.S. Latino Purchasing Power is Measured at $3.78 Trillion.
U.S. Latino GDP is Projected to Rank as the World's Fourth Largest By 2029, Surpassing Japan by the end of 2024 and Germany by 2027.
The 10 Largest State Latino Economies, Including California, Texas, and New York, are all Growing Faster Than Non-Latino Counterparts.
Latino Income in the U.S. Grew To $2.83 Trillion in 2022 and Increased 4.8% per Year on Average Between 2017 and 2022.
Source: Latino Donor Collaborative, 2024 U.S. GDPGrows by13%to $3.6Trillion;TheWorld's Fifth-Largest Economyis NowProjectedto SurpassJapan and Germanyby2027 (September2024).
latinodonorcollaborative.org/press_release/2024-u-s-latino-gdp-grows-by-13-to-3-6-trillion-the-worlds-fifth-largest-economy-is-now-projected-to-surpass-japan-and-germany-by-2027/
Less Than Half of Americans Could Handle an Emergency Expense Over $2,000
GROWTH
CITATION: Recreated
www.gsb.stanford.edu/faculty-research/publications/state-latino-entrepreneurship-2024
Only 1/5 of Latinos Receive Funding for their Business Compared to 40% of Their White Counterparts Hispanic-owned Businesses have Grown Exponentially Compared to their White Counterparts
CITATION:
www.gsb.stanford.edu/faculty-research/publications/state-latino-entrepreneurship-2024
BUSINESSES By Race/Ethnicity (2018–2023)
PROPORTION OF FUNDING RECEIVED BY U.S. BUSINESSES By Race/Ethnicity (2024)
Only Half of Latino Businesses Receive an Explanation for Funding Denied
PROPORTION OF U.S. BUSINESSES RECEIVING EXPLANATION FOR FUNDING DENIAL
(2024) Average Annual Revenues of Hispanic Businesses Have Remained Steady Since
While White Businesses Continue
$3,654,059
Hispanic Households' Net Worth is Significantly Less than Non Hispanic but are Growing Quickly


U.S. Employment and Earnings Insights (2022)
Occupation: All
Race/Ethnicity:
Source: DATOS Interactive — Economic Opportunity Dashboard
Earnings Disparity
Total Employed (In Thousands)
474,871


Source:


7 1 % of U.S. Hispanics agree that they wish they had more ways to show the world how proud they are of their culture and heritage.2

8 4 % of U.S. Hispanics say, “companies that make sincere efforts to be a part of,
8 4 % of Phoenix Hispanics Speak Any Spanish3

7 1
8 4
8 7


BY SONARY AMACHREE
It was sometime in April 2025 when Jorge Diaz, owner and founder of Lemon Design 25, a small business that designs artisanal items inspired by Mexican culture, looked at his business bank account and saw zeroes. In 2024, it was starkly different: profit margins stood at 70%, his business had secured a corporate order and cultivated an enthusiastic community of customers passionate about his products. This year, his profit margins fell to under 25% — 50% decrease from last year. His highest-selling products had been discontinued to save money because of untenable price increases. He was calling the artisans he collaborated with in Mexico to tell them he might not be able to do business with them anymore.
Soon, the bills started piling up: vendor costs, shipping costs, operational costs and payroll costs, just to name a few. Diaz considered closing down his business and ending a successful half-decade company. “It was heartbreaking,” said Diaz. “I asked myself, ‘What do I do?’”
Despite the losses, Diaz was able to keep Lemon Design 25 open, but that meant using up his business's savings. And, for the first time since 2021, his small business would have to be a part-time job. Diaz isn’t alone in his struggles: many small business owners have reported the same since President Donald Trump imposed tariffs on trading partners across the globe. For many, the tariffs represent a financial penalty, but to Diaz, whose business relies on cross-cultural trade with Mexican artisans, it’s more than that — it’s a cultural penalty.
Founded in early 2020, Lemon Design 25 brought hope for Mr. Diaz at a particularly low moment in his life. Facing health issues that left him housebound and unable to work, Diaz was depressed and struggled to find reasons to keep fighting amid his illness. Around the same time, small businesses producing crafted products entered a boom era as platforms like TikTok enabled them to widen
Source: www2.claritas.com/Knowmore

their consumer base. Growing up in Mexico, crafting was near and dear to Diaz, bridging his love of art to the tactile world. Years later, it would become solace during a tumultuous time in his life, giving him the chance to do something he loved since childhood, while setting him on the path to becoming a business owner.
In its first year, Lemon Design 25 sold personalized cups, shirts and hats. As he entered remission in 2021, Diaz sought to turn Lemon Design 25 into more than a side-hobby: “We want Lemon Design to leave a mark.” He said over Zoom. He thought back to the family stories his grandfather regaled to him under the lemon tree in his backyard—the lemon tree that would later inspire the business's name. Then he looked inwards, at his immigrant identity, and its liminal nature, to the precarity of Mexican culture and history in the United States. All of this and more constitute Lemon Design
25’s mission and voice, at once an ode to the memories of his grandfather, and a vision of cultural advocacy: “We wanted to represent something and make an impact, so we created a business model that advocates for the cultural legacy of Mexico and gives back to the community.” This year, that became harder.
On March 4, the Trump administration imposed a 25% tariff on goods from Mexico; a few days later, on March 8, the Trump administration suspended the tariffs. Despite the reprieve, the damage was already done: cambaya, the fabric Mr. Diaz uses for his bags, increased to $25 per yard, almost three times more than what he paid a year ago; ceramic pieces used for necklaces, once sold at an affordable $6 (about 175 pesos), were $30 after tariffs. “It made it impossible to keep producing certain products,” Diaz said. “We had to retire almost everything.” For Diaz, the prices were already crushing, but it was “heartbreaking” to inform his artisans that the increases meant pausing their working relationship. “It really impacts you physically and psychologically, not being able to continue these relationships,” Diaz explained. “It’s hard to have to put everything on pause because they depend on you.” Those relationships, cultivated over years of travel throughout central Mexico, chance meetings and friends of friends, became collateral damage because of tariff policy.
The oft-repeated phrase, “Made in the USA,” conjures up images of American factories manufacturing products by Americans for Americans. It’s one of the stated reasons why the Trump administration is pursuing tariffs. But what does “Made in the USA” mean for businesses like Diaz’s, which depend on the transnational production bolstered by NAFTA and the USMCA? It means the Middle East. “It blew my mind because how is it that I brought a box that is 20 pounds from the Middle East, and it was cheaper than buying or getting a package from three hours away from the border?” Herein lies the question for businesses like Lemon Design 25: authenticity or replication. According to the US’s tariff policy, its replication; for Mr. Diaz, it’s the opposite: “it loses its soul when it’s not their cultural thing.” To Mr. Diaz, the choice between Mexico or elsewhere feels like a penalty: “We’re getting punished for being Mexican: for trying to bring a little bit of Mexico. For trying to represent who we are and show who we are.”

The choice between Mexico and America is a binary that Mr. Diaz has sought to avoid with his business, “All these different types of accessories became like a flag for everybody that is Chicano, Latino that feel like they don’t belong here or there.” One's sense of belonging is invariably shaped by history: their own, their family's and the physical locations they occupy. As funding cuts endanger initiatives that preserve and teach Mexican history, Mr. Diaz sees a calling for Lemon Design 25. “We’re at risk from being erased from history. I'm going to do whatever I can for Lemon Design to leave that mark and save that history.”
SonaryAmachreeisthewriter/journalistinternattheArizonaHispanic Chamber of Commerce.
BY SONARY AMACHREE
In 2024, the US imported over $364.9 billion in goods—about 14% of its GDP—that year, Canada, Mexico, China, Japan and the United Kingdom were the U.S.'s largest trading partners. According to the U.S. Census Bureau’s report, “A Profile of U.S. Importing and Exporting Companies, 2022 - 2023,” there are 242,515 total importers in the US; of that number, 236,045 are small businesses that imported over $868 billion in goods. In 2021, the Retail
Industry Leaders Association reported that 21 million U.S. jobs depend on imports. That all changed in February.
On Feb. 1, President Trump signed an executive order imposing tariffs on Mexico, Canada and China—25% on imports from Mexico and Canada, and 10% on imports from China. A few days later, tariffs on Mexico and Canada would be suspended, allowing
$8,164,961,489
$3,683,194,133
$2,283,902,413 $1,597,313,757 $1,294,484,903 $917,641,792 $861,571,360 $773,422,373 $756,762,171
China’s tariffs to go into effect. A month later, Mexico and Canada’s tariffs would follow China’s and begin, but a few days later, they would be paused. In April, the Trump administration announced a baseline tariff of 10% on all international goods—only for most of those tariffs to be paused for 90 days. 90 days would pass, and on Aug. 7, the Trump administration's broad tariff rate would take effect.
Economic indicators have, unsurprisingly, reacted accordingly. After the April tariff announcement, the S&P 500 posted its lowest close in a year, closing below 5,000 points. In the four days following the announcement, the index lost $5.83 trillion, its steepest losses since its creation in the 50s. The August job report
$9,388,711,945
showed that job growth had stalled, adding only 22,000 jobs, well below the number forecasted by economists.
Historically, tariffs have been implemented to protect domestic industries, respond to trade disputes and raise tax revenues, according to Luis Cordova, an economist and senior vice president at Rounds Consulting, an economic research firm. Signed by President Herbert Hoover at the onset of the Great Depression, the Smoot-Hawley Tariff Act of 1930 increased tariff rates on already tariffed goods to 60% and expanded the number of goods subject to tariffs. Economists argue that it deepened the economic crisis of the era by slowing trade and sparking an international trade war. Hoover’s reasoning was to protect American farmers from
foreign industries. Almost a 100 years later, President Trump strikes a similar tone, now promising to rejuvenate the desiccated domestic manufacturing industry. “The ultimate goal of the tariffs keep changing,” Mr. Cordova said over a Zoom call. “If that was the goal to bring back those [manufacturing] jobs, the tariffs would be more selective.”
Well, what about those jobs? Though early in its implementation, the tariffs don’t seem to be slowing down the trend of declining manufacturing jobs. According to the Federal Reserve Bank of St. Louis, manufacturing hiring plunged to its weakest pace since 2016. The August jobs report indicated that the U.S. lost 13,000 jobs in June, the first such loss since December 2020.
Here in Arizona, the impact may be worse: “Even for Arizona, specifically, it’s a big deal because Arizona is one of the top states in the U.S. with the most imports from Mexico as a percent of GDP. Our economy is reliant on Mexico, so putting all of those tariffs could have a negative effect,” says Mr. Cordova. “Arizona could be more negatively affected than the rest of the country.”
Last year, Arizona imported over $11.6 billion worth of goods from Mexico; the majority were agricultural products such as tomatoes and peppers, followed by computer and electronic products, and electrical equipment. In June 2025 alone, Arizona imported over $1.3 billion worth of goods from Mexico. Mexico is Arizona’s most important trading partner, accounting for 2.3% of Arizona’s GDP in 2023 and 27.5% of its international exports.
The timing of the tariffs allowed Arizona businesses time to stockpile inventories and import goods before tariffs took effect. According to data provided by the U.S Census Bureau, Arizona companies imported over $27 billion in goods between January and June—an increase of $7 billion compared to this same period in 2024. This stockpile protected consumers from price increases and gave companies a cushion; however, inflation data is slow to capture these increases, and they may have already happened. “A lot of the economic metrics are lagging; the numbers come in after.
Source: www2.claritas.com/Knowmore
They’re lagging indicators, so we see it after it’s already happened.” Mr. Cordova explained. As larger businesses have front-loaded inventory, smaller firms have been unable to do so, leading them to raise prices or halve inventory sizes.
The long-term impacts of tariffs are broad and touch every sector of the economy. “We’re already seeing a lot of slower economic growth due to the reductions in efficiency and productivity,” said Mr. Cordova. Four years after the enactment of the Smoot-Hawley Act (and five years into the Great Depression), President Franklin Delano Roosevelt signed the Reciprocal Trade Agreements Act of 1934, allowing the President to negotiate tariff rates up to 50% of the levels set by the Smoot-Hawley Act. It would ultimately be used to reduce tariff rates, but the damage was done, and the depression lasted for half a decade longer. Asked if a targeted backtrack—with less harmful effects—was possible, Mr. Cordova had this to say, “I’m not sure—maybe the damage is done.”
SonaryAmachreeisthewriter/journalistinternattheArizonaHispanic Chamber of Commerce
Rounds Consulting Group
480.508.4911
info@roundsconsulting.com
4450 S. Rural Rd., Suite C-220 Tempe, AZ 85282
• LinkedIN: Rounds Consulting Group
• X: @roundsconsult
• Facebook: @roundsconsulting Luis Cordova
602.849.0632
cordova@roundsconsulting.com
Building Arizona's Workforce Background Report Arizona Town Hall
SOURCE: Arizona Town Hall - #117 Building Arizona's Workforce
Latinos Make up 33% of Arizona’s Workforce, Nearly 1.05 Million Workers. Between 2011 and 2021, Arizona’s Workforce Grew by 400,000, With Latinos Making up 276,000 of New Workers. During That Period, Arizona’s Latino Labor Force Grew by 3.1% Annually, More Than Twice of Arizona’s Overall Labor Force (1.4%).
SOURCE: Latino Donor Collaborative study
Source: www2.claritas.com/Knowmore

THE WORKFORCE ARIZONA COUNCIL (WAC) IS TASKED WITH IMPLEMENTING THE GOVERNOR’S STRATEGIC VISION FOR WORKFORCE DEVELOPMENT.
ONE OF THE WAC’S RESPONSIBILITIES IS TO CREATE AND MAINTAIN A LIST OF IN-DEMAND INDUSTRY SECTORS BY COLLABORATING WITH EMPLOYERS AND UTILIZING LABOR MARKET DATA.
Likewise, Local Workforce Development Boards (LWDB) are responsible for the same at a local level. These lists are used to prioritize resource allocations, including Workforce Innovation and Opportunity Act (WIOA) funding.

Flagstaff, Arizona
• Tourism
• Bioscience & Healthcare
• Environmental Technologies
• Digital/E-commerce
• Retail
• Craft Brewing
• Manufacturing
• Aerospace & Astronomy
The City of Flagstaff Economic Development Department: https://www.chooseflagstaff.com/
Lake Havasu City, Arizona
• Agriculture
• Arts & Entertainment
• Biotechnology & Biosciences
• Food Processing
• Healthcare
• High-Tech Manufacturing
• Logistics
Partnership for Economic Development: https://www.lakehavasu.org/

Source: www2.claritas.com/Knowmore
Nogales, Arizona
• Transportation
• Logistics
• Distribution
• Produce
• Manufacturing
• Hospitality
• Construction
• Healthcare
• Government
• Education
Economic Development Foundation: https://www.nogales.com/
Safford, Arizona
• Retail & Service Business
• Mining
• Agriculture
• Education
• Medical
• Light Manufacturing
City of Safford: https://cityofsafford.us/149/Economic-Development
Sahuarita, Arizona
• Aerospace and Photonics
• Healthcare
• Mining
• Advanced Manufacturing &Technology
• International Business
Town of Sahuarita: https://sahuaritaaz.gov/567/Economic-Development
Show Low, Arizona
• Natural Resources
• Business Entrepreneurship
• Light Manufacturing
• Medical Advancement
• Tourism and Hospitality
• Filmmaking
City of Show Low: https://www.showlowaz.gov/o/cosl/ page/economic-development
Yuma, Arizona
• Agriculture
• Business
• Aerospace and Defense
• Resources and Manufacturing
• Transportation and Commerce
• Sustainable Energy
• US and Mexico: Industrial & Logistics
Greater Yuma Economic Development Corporation: https://www.greateryuma.org/
Arizona Industry Jobs Forecasting and Workforce Implications
Now that we have provided a statewide overview of local industry sectors, we invite deeper analysis into four key sectors—Construction, Healthcare, Manufacturing, and Agriculture—looking at employment trends and labor challenges for each.
Courtesy of the Lightcast labor market information tool, the table below presents data related to the number of jobs in Arizona in 2023, projections for 2030, and the projected percent change during that period of time, in addition to average earnings.

North American Industry Classification System
Note that Construction, Healthcare and Social Assistance, and Manufacturing are projected to experience growth through 2030, while Agriculture is expected to see a decline in jobs during the same period. As you continue reading this chapter, consider how these job projections align with broader industry trends and economic factors.
Source: www2.claritas.com/Knowmore
Advanced manufacturing is a priority for Arizona, fueled by the nation’s push to reshore production and strengthen domestic supply chains. Large-scale federal investments in manufacturing, including the 2022 passage of the CHIPS and Science Act, have played a key role in this effort, generating significant investment in semiconductor manufacturing, job creation, and local economic growth.
To date, the Department of Commerce has announced over $30 billion in proposed CHIPSrelated private sector investments supporting 23 projects in 15 states. Arizona has emerged as a major beneficiary, as industry leaders such as Intel, the Taiwanese Semiconductor Manufacturing Company (TSMC), and Amkor construct plants in the state. These large-scale investments in big industry also create a ripple effect by stimulating growth in supply chain businesses, infrastructure, and support services, including housing and transportation.
This growth accelerates the demand for skilled talent. According to the State Office of Economic Opportunity, Arizona’s total employment is projected to grow by 16.2% by 2033.

While the semiconductor industry has garnered great attention, it represents just one facet of Arizona’s broader advanced manufacturing ecosystem. Other industry segments include:
• Electric vehicles
• Aerospace and defense
• Battery storage
• Medical device manufacturing
These industries, and others, are impacting both urban and rural communities, reinforcing the need for a trained workforce to sustain Arizona’s position as a leader in advanced manufacturing.
Further reading: https://www.commerce.gov/news/blog/2024/08/twoyears-later-funding-chips-and-science-act-creatingquality-jobs-growing-local
A November 2024 study by the University of Arizona’s College of Agriculture and Life Sciences highlights the key contributions of Arizona’s agribusiness system to Arizona’s economy.
Economic Contribution of Arizona Agriculture
• $30.9 billion in economic activity (sales) in 2022.
$30.9 BILLION
Agriculture’s Employment and Labor Income Contribution
• Directly and indirectly supported more than 126,000 full- and part-time jobs, employing more than 160,000 unique workers.
• Generated $7.2 billion in labor income, including workers’ wages, salaries, and benefits and business owner income.
• A significant portion of this labor income—$3.3 billion—supported non-agribusiness industries through indirect and induced effects:
» $135 million paid to employees in hospitals and physician offices
» $66 million paid to workers in retail food and beverage stores
» $70 million paid to employees in the real estate industry.
Agricultural Industry Highlights
• 16,710 farm operations in Arizona
• 25.5 million acres of land (35% of Arizona’s total land area) managed by Arizona farmers and ranchers
• $24.2 billion in farm assets (land, buildings, and machinery)
• The top 5% of farms account for 97% of total agricultural sales
• The top 114 farms generate 75% of all agricultural sales
• Maricopa, Pinal, and Yuma produce 81% of the state’s agricultural sales
• These same three counties ranked in the top 1% among all U.S. counties in total agricultural sales.
• 79% of Arizona farms and ranches report sales of less than $25,000
• 89% of Arizona farms are operated by families, individuals, or partnerships
• Arizona has the highest percentage of female agricultural producers in the country (48%)
• Among Native Americans and Alaska Natives, Arizona has the highest share of Indigenous producers in the country (56%)
2025 U.S. Latino GDP Report Latino GDP
In Their Eight Annual Report, the Latino GDP Report Found That U.S. Latinos Generated an Extraordinary $4.1 Trillion in GDP, Constituting a Positive Trend Since 2010, Putting Latinos GDP Ahead of France and The United Kingdom.
Source: Latinogdp.us
Source: www2.claritas.com/Knowmore
The 2025 U.S. Latino GDP Report represents the 8th vintage of an annual series of reports which document the large and rapidly growing economic contribution of Latinos living in the United States. It is also the 29th full-length report that the Latino GDP team has produced as part of an ambitious research initiative which analyzes the contributions of Hispanic males and females across various geographies, including targeted states and major metropolitan areas. The current release follows closely on the heels of the inaugural U.S. Latina GDP Report, which was released in Fall of 2024 and which was covered in more than 600 separate features across print, electronic and broadcast media
Collectively, the 29 reports document substantial economic premiums, specifically growth premiums, enjoyed by Latinos relative to Non-Latinos in the United States. These premiums exist across a wide range of economic indicators – population and labor force, labor force participation rates, educational attainment, real income, consumption, and more. And Latino economic premiums are large – for example, U.S. Latino labor force growth is 7 9 times faster than Non-Latino labor force growth from 2010 to 2023. Educational attainment growth is 3 1 times faster than that of Non-Latinos, and real income growth is 2.9 times faster.
The participation of Latinos in the U.S. economy is more active, more intense than Non-Hispanic participation. The importance of rapid Latino growth rates, and the intensity of economic activity which they represent, cannot be overstated. The vitality of the overall U.S. economy depends on the intensity of the economic activity of U.S. Latinos.
As a society, we benefit meaningfully from greater economic vitality, and we should understand and invest in the drivers of that vitality. Stronger economic growth, or GDP growth, is associated with rising wages, higher standards of living, and greater economic mobility across the economy. By driving economic growth in the United States, Latinos provide these benefits and opportunities for all Understanding the drivers of growth and making the proper investments can secure even greater economic growth and the greater prosperity that it produces.
The 2025 U.S. Latino GDP Report marks a remarkable milestone in the eight years and 29 reports that comprise the full body of Latino GDP research. As documented in this report, in 2023, the U.S. Latino GDP surpassed $4 trillion, up from just $1.6 trillion in 2010. The economic contribution of U.S. Latinos remains the equivalent of the world’s fifth largest economy and the single fastest growing among major economies. Larger than India and faster growing than China, the U.S. Latino GDP is a tremendous source of economic vitality that benefits all.
After reading about the world-leading and vitality sustaining growth of the U.S. Latino GDP documented in this report, we urge readers to visit www.LatinoGDP.us and to access reports for various states and major metropolitan areas. Surveying those reports will reinforce that the economic impact of U.S. Latinos touches every corner of the nation.
The 2025 U.S. Latino GDP Report provides a factual view of the large and rapidly growing economic contribution of Latinos living in the United States. In this 8th annual publication, we again estimate the U.S. Latino GDP based on a detailed, bottom-up construction that leverages publicly available data from major U.S. agencies. At the time of writing, the most recent year for which the core data are available is 2023. Thus, this year’s report provides a snapshot of economic activity in that year.
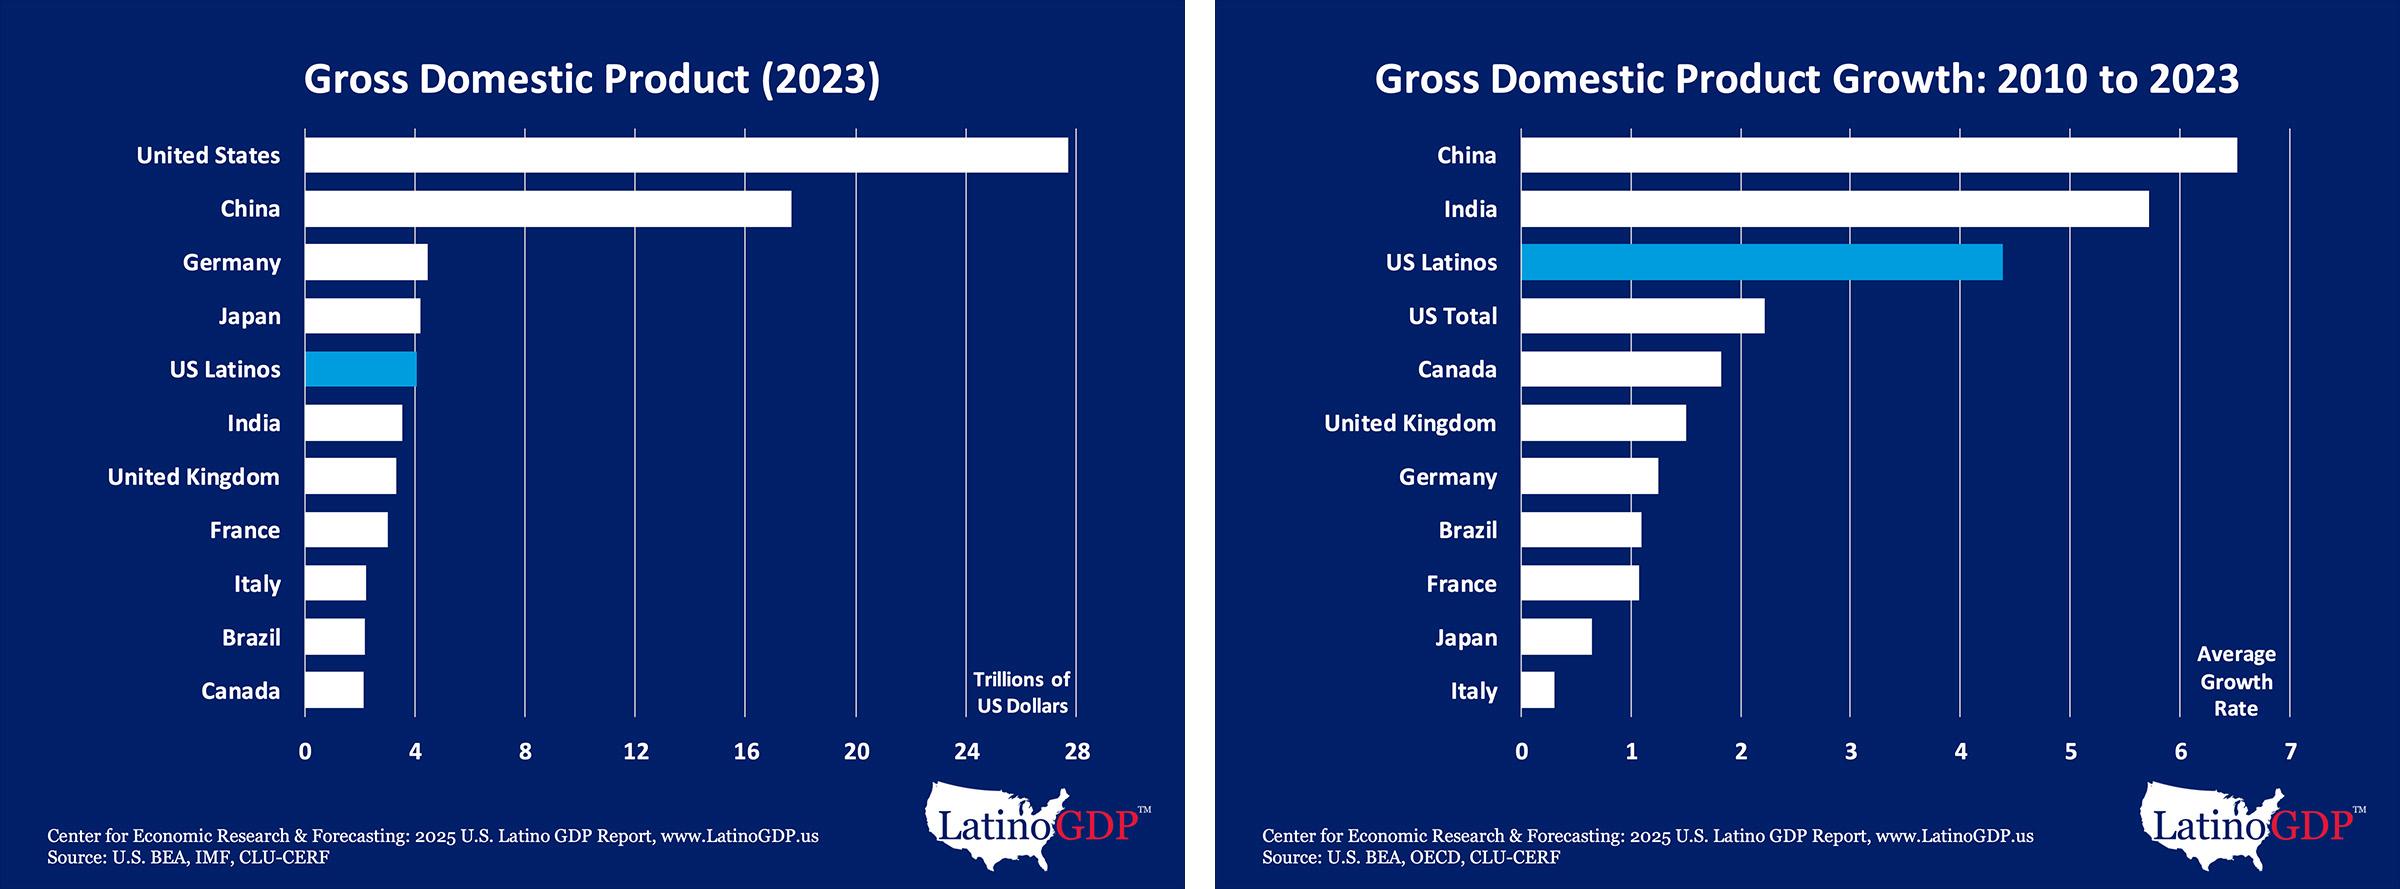
As a summary statistic for the economic performance of U.S. Latinos, the 2023 U.S. Latino GDP is extraordinary. The total economic output (or GDP) of Latinos living in the United States in 2023 is $4 1 trillion, up from $2.8 trillion in 2019 and $1.6 trillion in 2010. If Latinos living in the United States were an independent country, the U.S. Latino GDP would be the fifth largest GDP in the world. For the fourth consecutive year, U.S. Latino GDP is larger than the GDPs of India, the United Kingdom, or France.
While impressive for its size, the U.S. Latino GDP is truly remarkable for its rapid growth. Among the ten largest GDPs, the U.S. Latino GDP was the third fastest growing from 2010 to 2023. Over that period, real Latino GDP increased 2.7 times faster than Non-Latino.
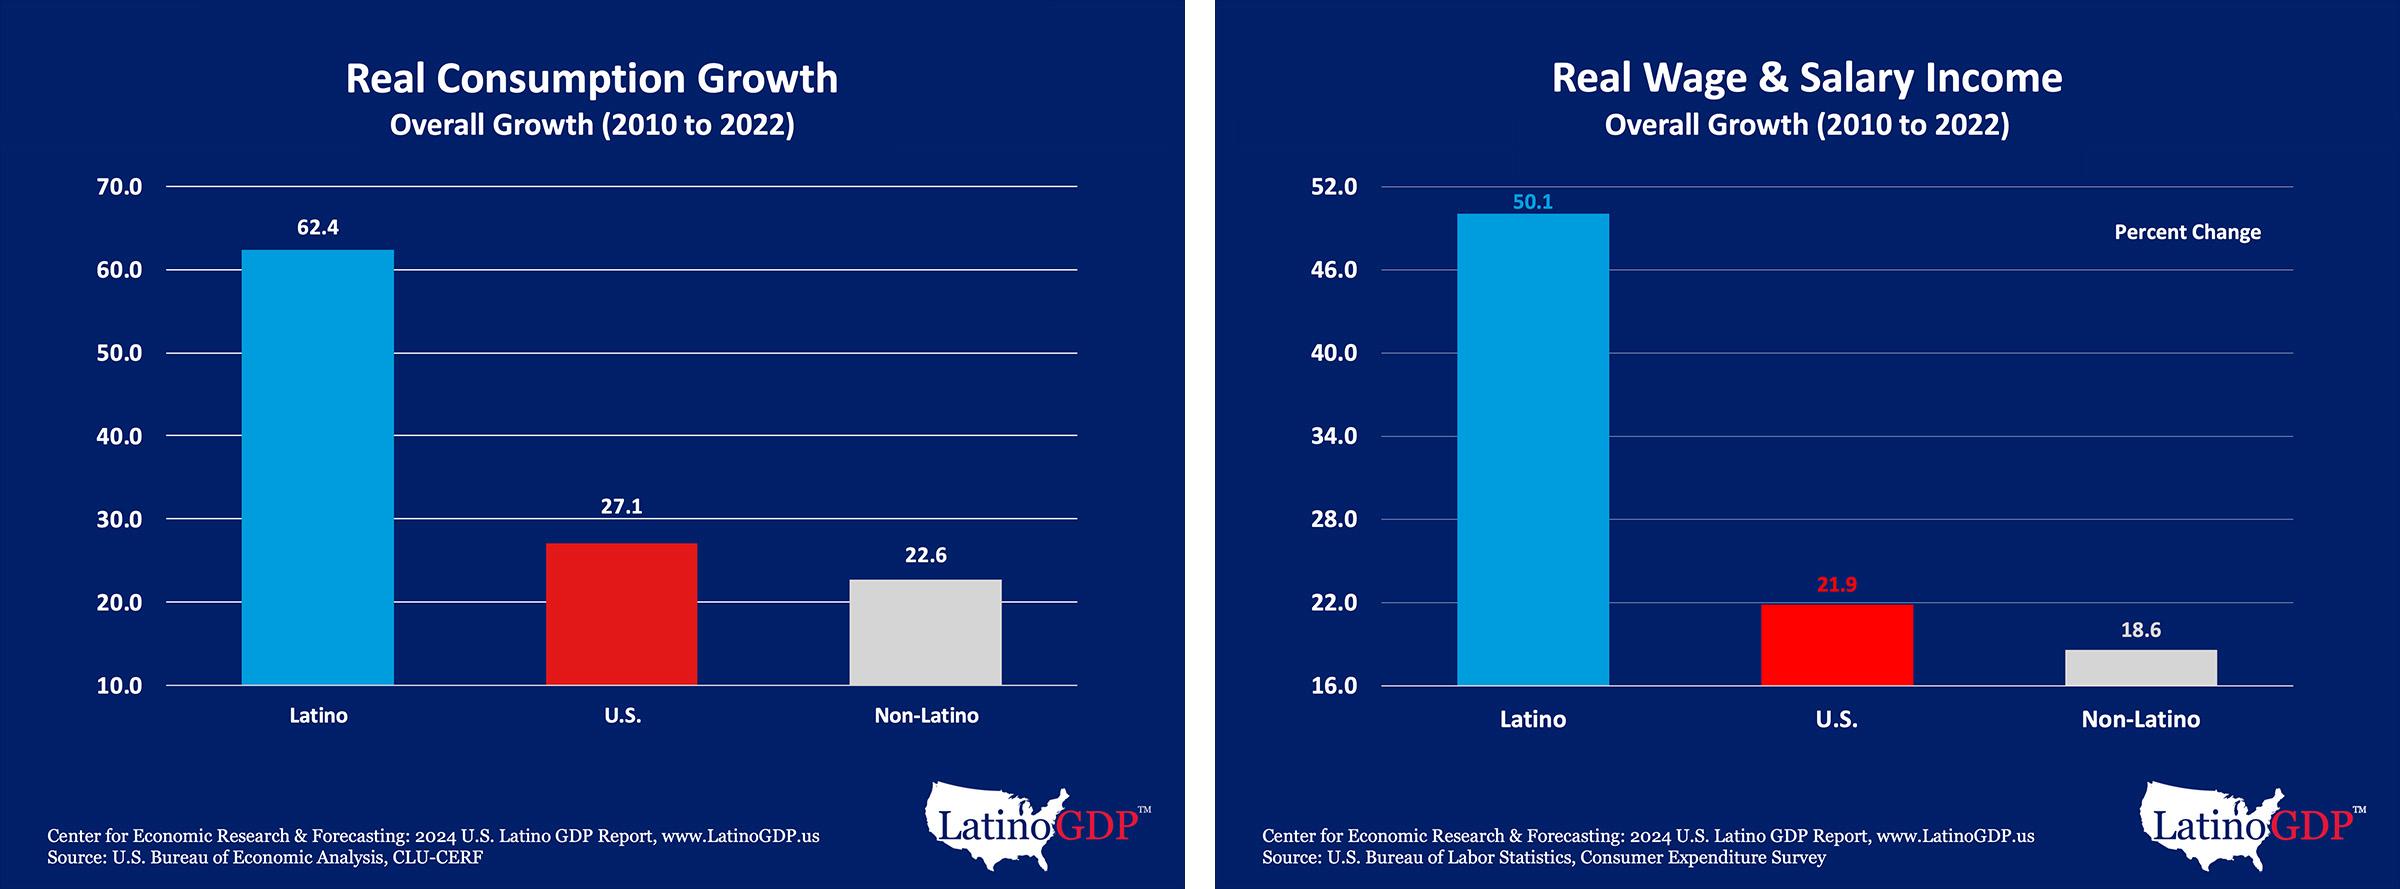
In 2023, Latino consumption stood at $2.7 trillion. Latinos in the U.S. represent a consumption market 20 percent larger than the entire economy of Italy and 24 percent larger than Brazil. From 2010 to 2023, Latino real consumption grew 2.6 times faster than Non-Latino, driven by rapid gains in Latino income. Over the same period, Latino real incomes grew 2.9 times faster.
The Latino income growth premium naturally flows from Latinos’ rapid gains in educational attainment and strong labor force participation. From 2010-2023, the number of people earning a bachelor’s degree grew 3.1 times faster for Latinos than Non-Latinos. In 2023, Latinos were 6.7 percentage points more likely to be actively working or seeking work than their Non-Latino counterparts. This Latino labor force participation premium sits at an all-time high. Considered together, these patterns underscore the fact that Latinos are drivers of economic growth in the U.S.
Data since the start of the COVID-19 pandemic reveal that, beyond being drivers of economic growth, U.S. Latinos are an important source of resilience even when historic challenges impact the broader economy. When COVID-19 struck, observing the differential impacts to Latino health, many analysts predicted that earlier Latino economic gains would be erased. Despite being hit harder by COVID-19, the Latino GDP has roared back.
Across the years 2020 through 2023, the cumulative number of COVID deaths was nearly twice as high for Latinos (520 deaths per 1,000 Latino deaths) compared to Non-Hispanic Whites (only 263 per 1,000 Non-Latino deaths). Yet, the performance of Latinos during and after the pandemic is sufficient to make the U.S. Latino GDP the single fastest growing among the ten largest GDPs, faster even than China or India. The broader U.S. economy ranks a distant fourth.
Juxtaposing data on the extraordinary growth of Latino GDP from 2019 to 2023 with data on health impacts for Latinos is an important exercise. It illustrates the extraordinary sacrifices made by Latinos during the pandemic. It also highlights just how vital and uplifting Latino strength and resilience are for the nation. Hard work, self-sufficiency, optimism, perseverance – these are the characteristics that underly the strength and resilience of U.S. Latinos. These same characteristics will continue to drive growth in the overall United States economy for years to come
2025 U.S. Latina GDP Report Latina GDP
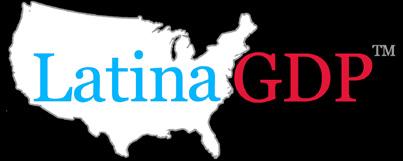
In the Seventh Annual Edition of This Report, Researchers Estimate That U.S. Latinas are Economic Drivers, Increasing Their Economic Output From $661 Billion in 2010 to $1.3 Trillion in 2021.
SOURCE: latinagdp.us
Source: www2.claritas.com/Knowmore
The Inaugural U.S. Latina GDP Report builds directly upon six annual U.S. Latino GDP Reports released since 2018 as well as eight State and a dozen Metro Latino GDP Reports written in partnership with Bank of America. Those reports provide a factual view of the large and rapidly growing economic contribution of Latinos living in the U S. and document substantial economic growth premiums enjoyed relative to Non-Latinos. These premiums exist across a wide range of economic indicators, and Latino economic premiums are large – for example, U.S. Latino labor force growth is 9 times faster than Non-Latino labor force growth. U.S. Latino GDP growth is 2.4 times faster than Non-Latino GDP.
Analysis of U.S. Latinas reveals that, in almost every case, the economic growth premium enjoyed by Hispanics females is even larger than the already impressive premium for all Hispanics. It is not enough then to say that U.S. Latinas are drivers of economic growth and a critical source of resilience for the broader economy. They are drivers of economic vitality. U.S. Latinas are giving life to the U.S. economy, dando vida a la economía
Dando Vida a la Economía | the Latina
The 2021 U.S. Latina GDP is $1.3 trillion, up from $661 billion in 2010. The total economic output of Hispanic females in 2021 is larger than the entire economy of the state of Florida. In fact, only the GDPs of California, Texas and New York are larger than the U.S. Latina GDP.
As with the broader Hispanic economy, while impressive for its size, the Latina GDP is truly remarkable for its rapid growth. From 2010 to 2021, the economic contribution of Latinas grew a total of 51.1 percent. Over this entire period, the real GDP of Hispanic females grew 1.2 times the rate of Hispanic males’ GDP and an astonishing 2.7 times the rate of Non-Hispanic GDP. Educational Attainment
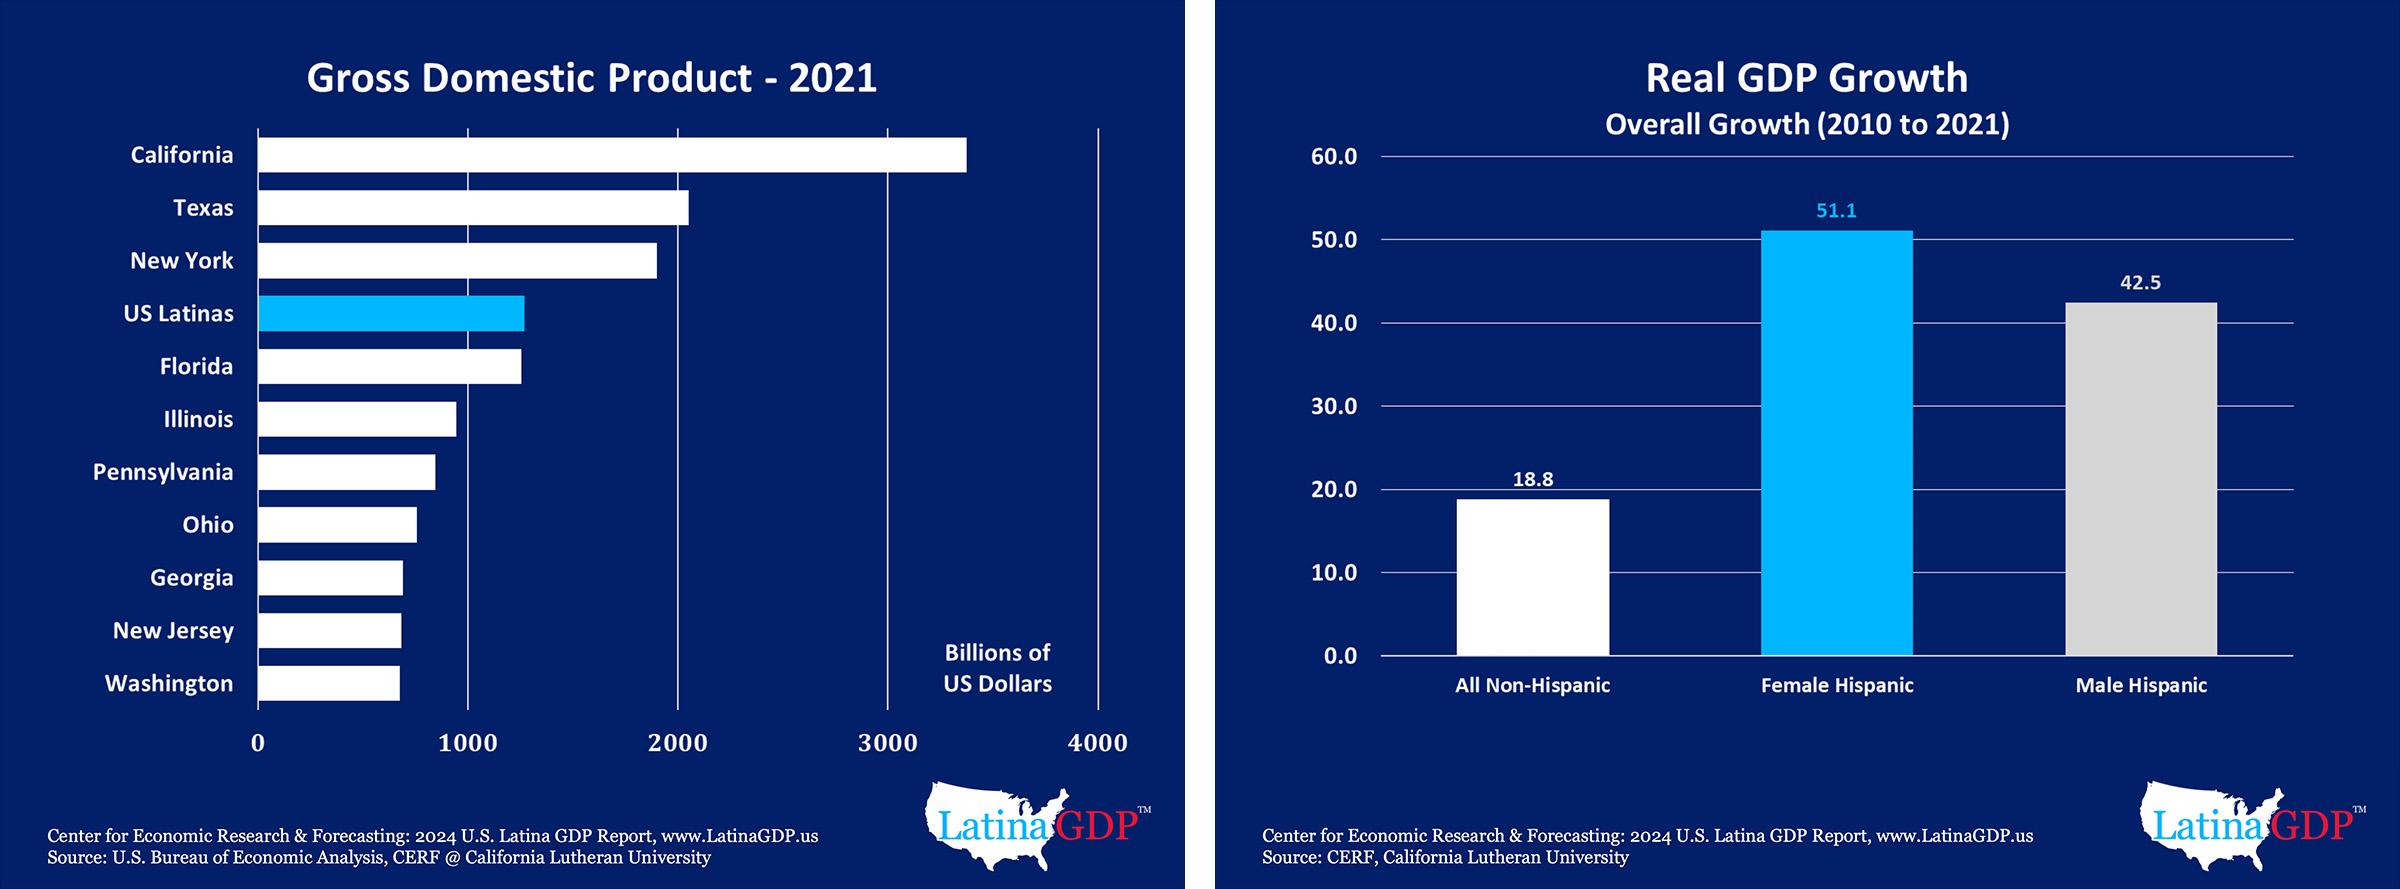
Dramatic growth of Latina GDP is driven by rapid gains in human capital. Educational attainment grew rapidly for Latinos of all genders from 2010 to 2021. During those years, the number of Hispanic females with a bachelor’s degree grew a total of 103.0 percent, while the number of highly
educated Non-Hispanic females grew just 38.3 percent. In other words, over the entire period that we examine, Latina educational attainment grew 2.7 times that of Non-Hispanic females in the U.S.
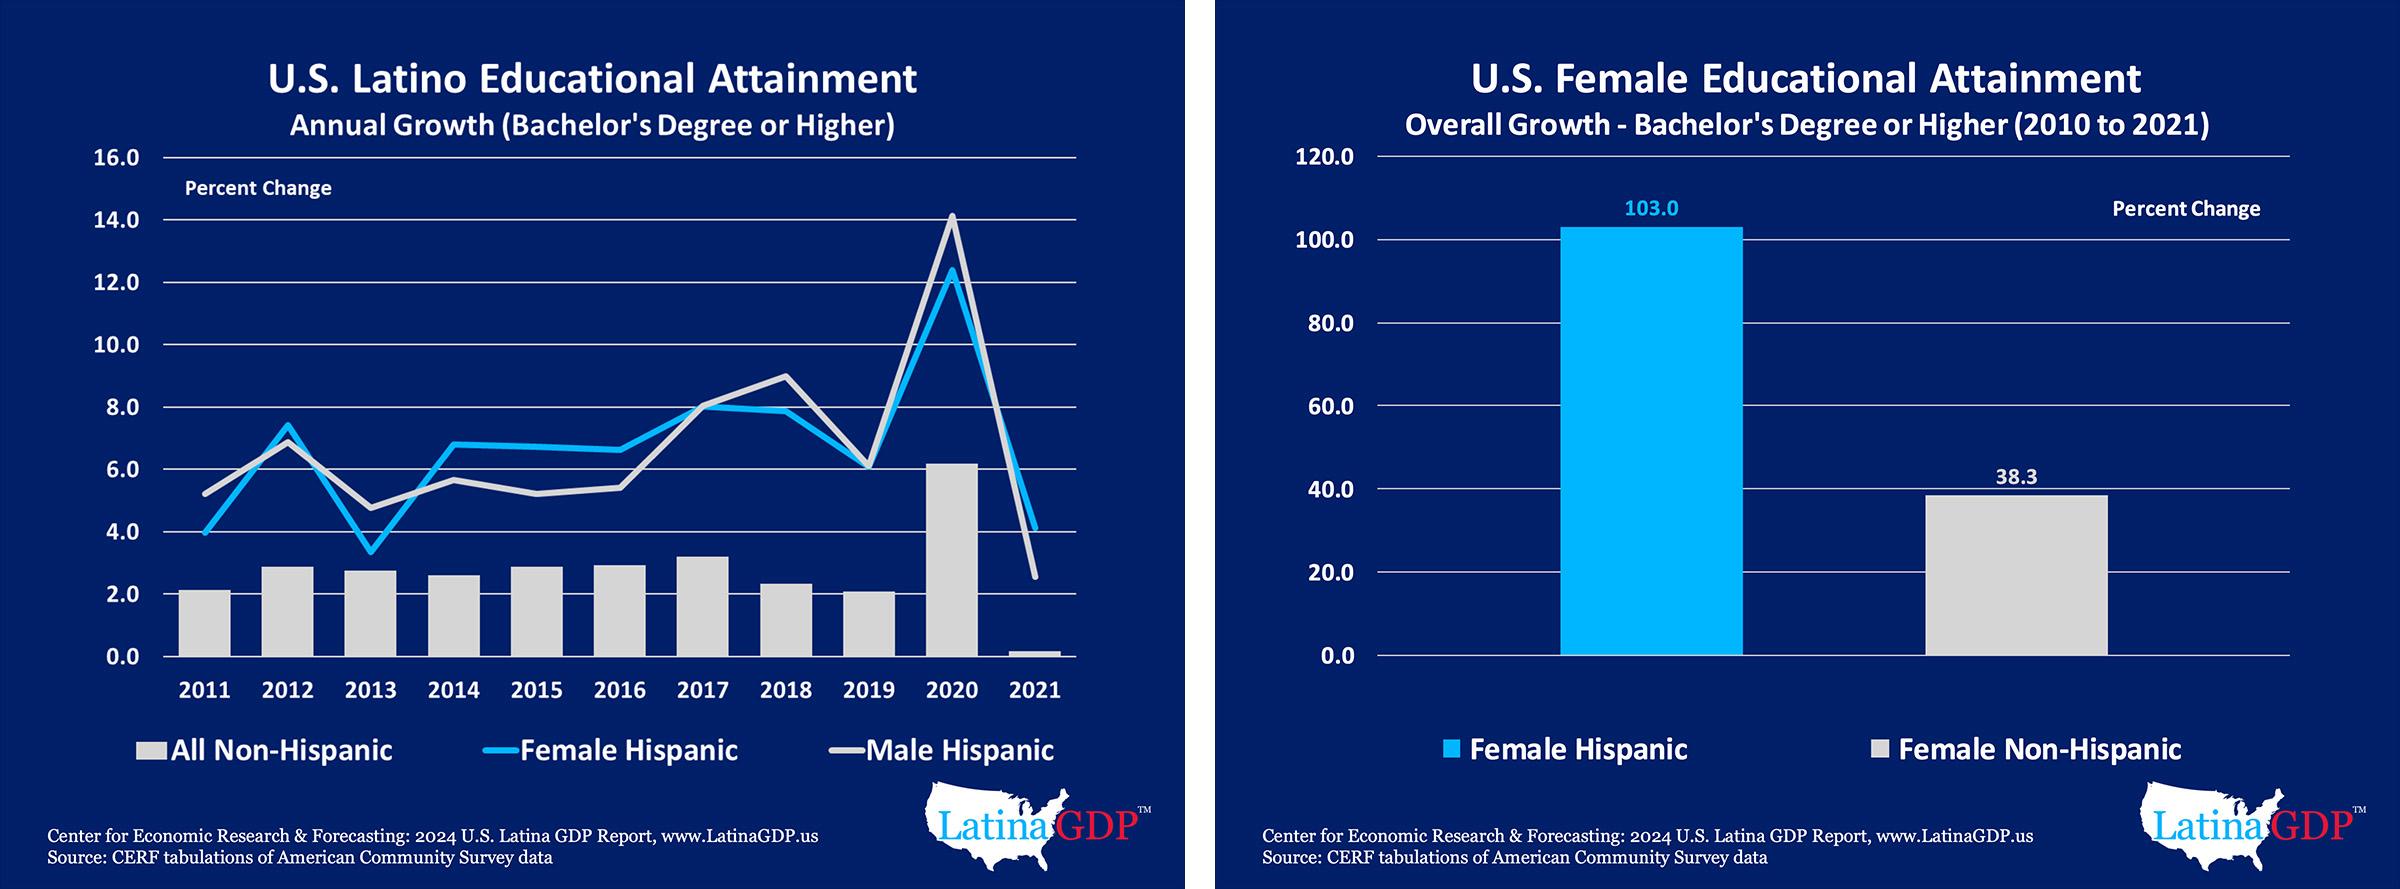
Rapid growth of educational attainment is accompanied by strong labor force participation. The Latina labor force participation rate has grown steadily from 2000 to the present, adding 7.5 percentage points over two decades. During this same period, the labor force participation rate of Non-Hispanic females was essentially flat.
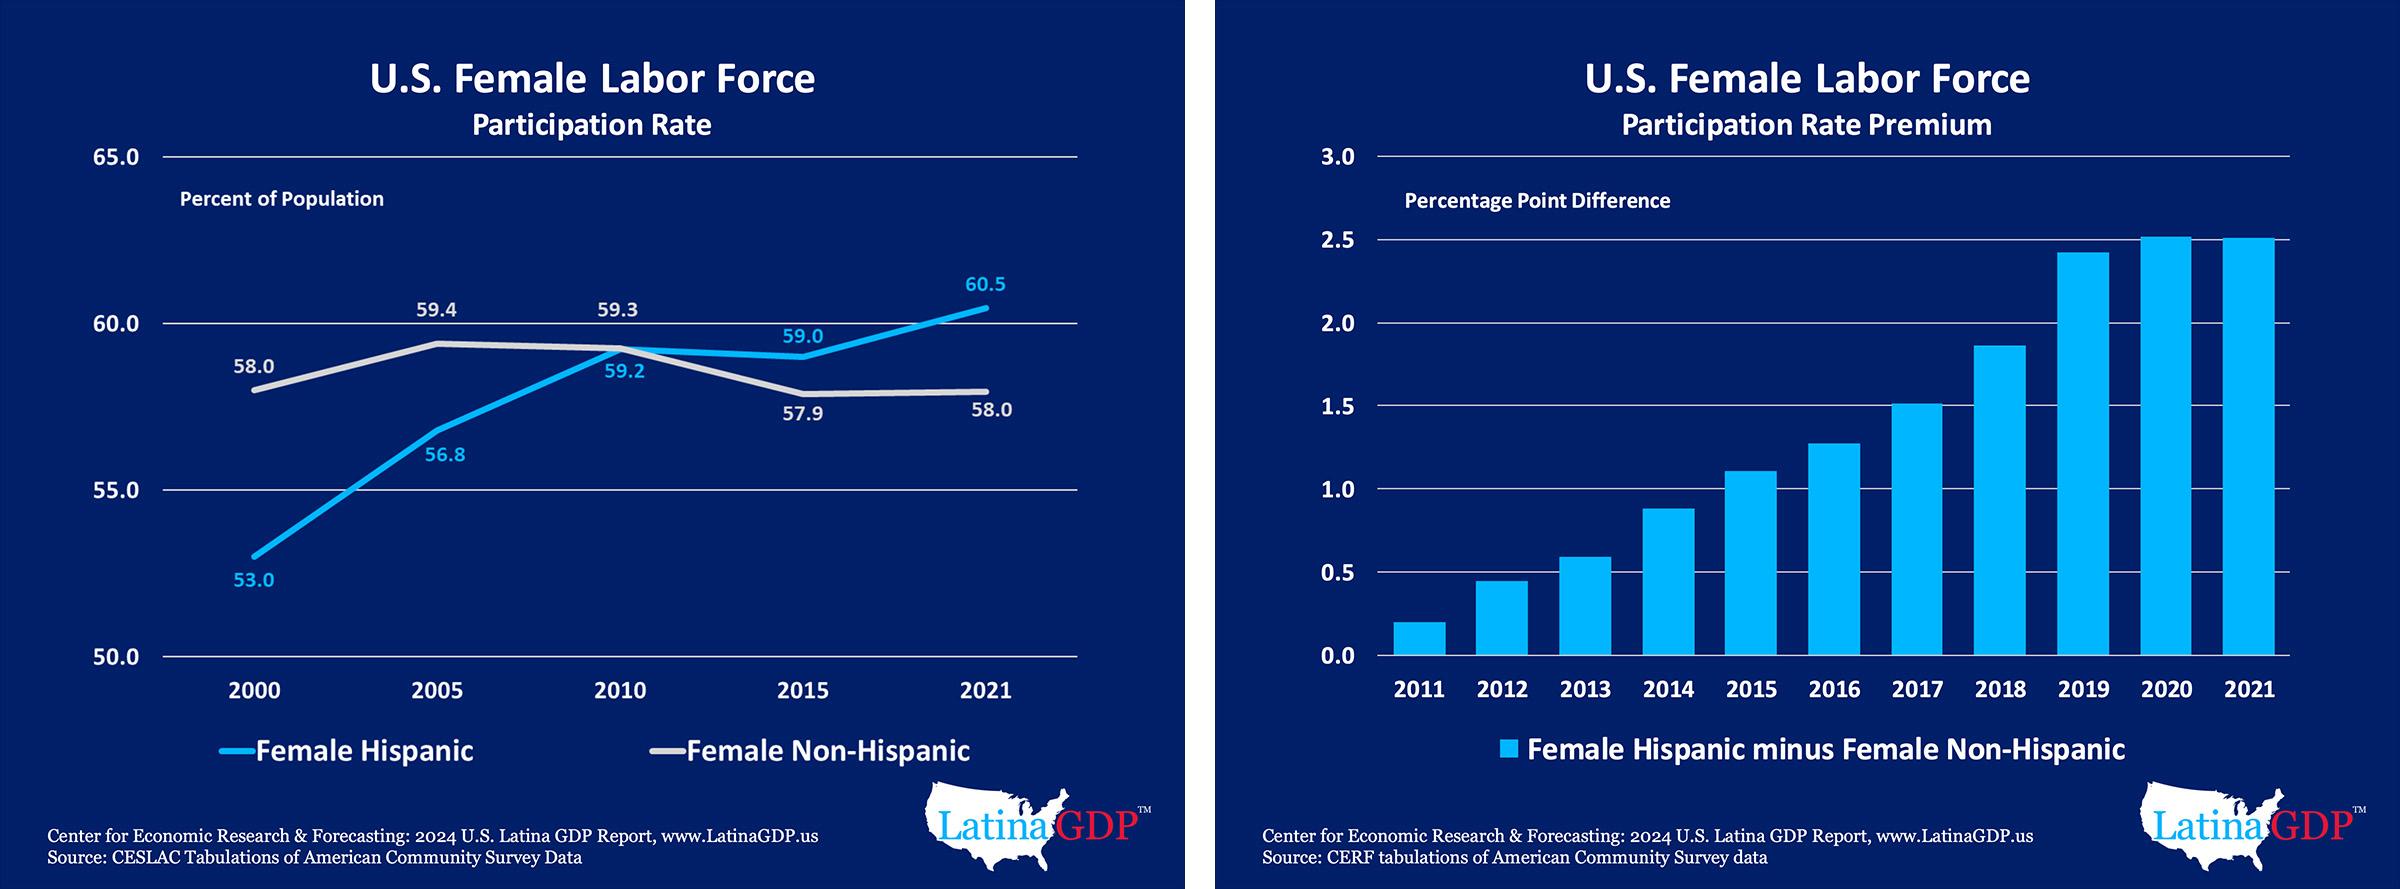
Rapid gains in real income naturally flow from Latinas’ strong gains in human capital. While all Latino incomes grew strongly from 2010 to 2021, Hispanic females saw even stronger gains than Hispanic males. Compared to Non-Hispanic females, this income growth is especially noteworthy. From 2010 to 2021, the real incomes of Hispanic females grew a total of 46.0 percent compared to only 18.5 percent for Non-Hispanic females. In other words, Latinas enjoy an income growth rate that is 2.5 times that of their Non-Hispanic female counterparts.
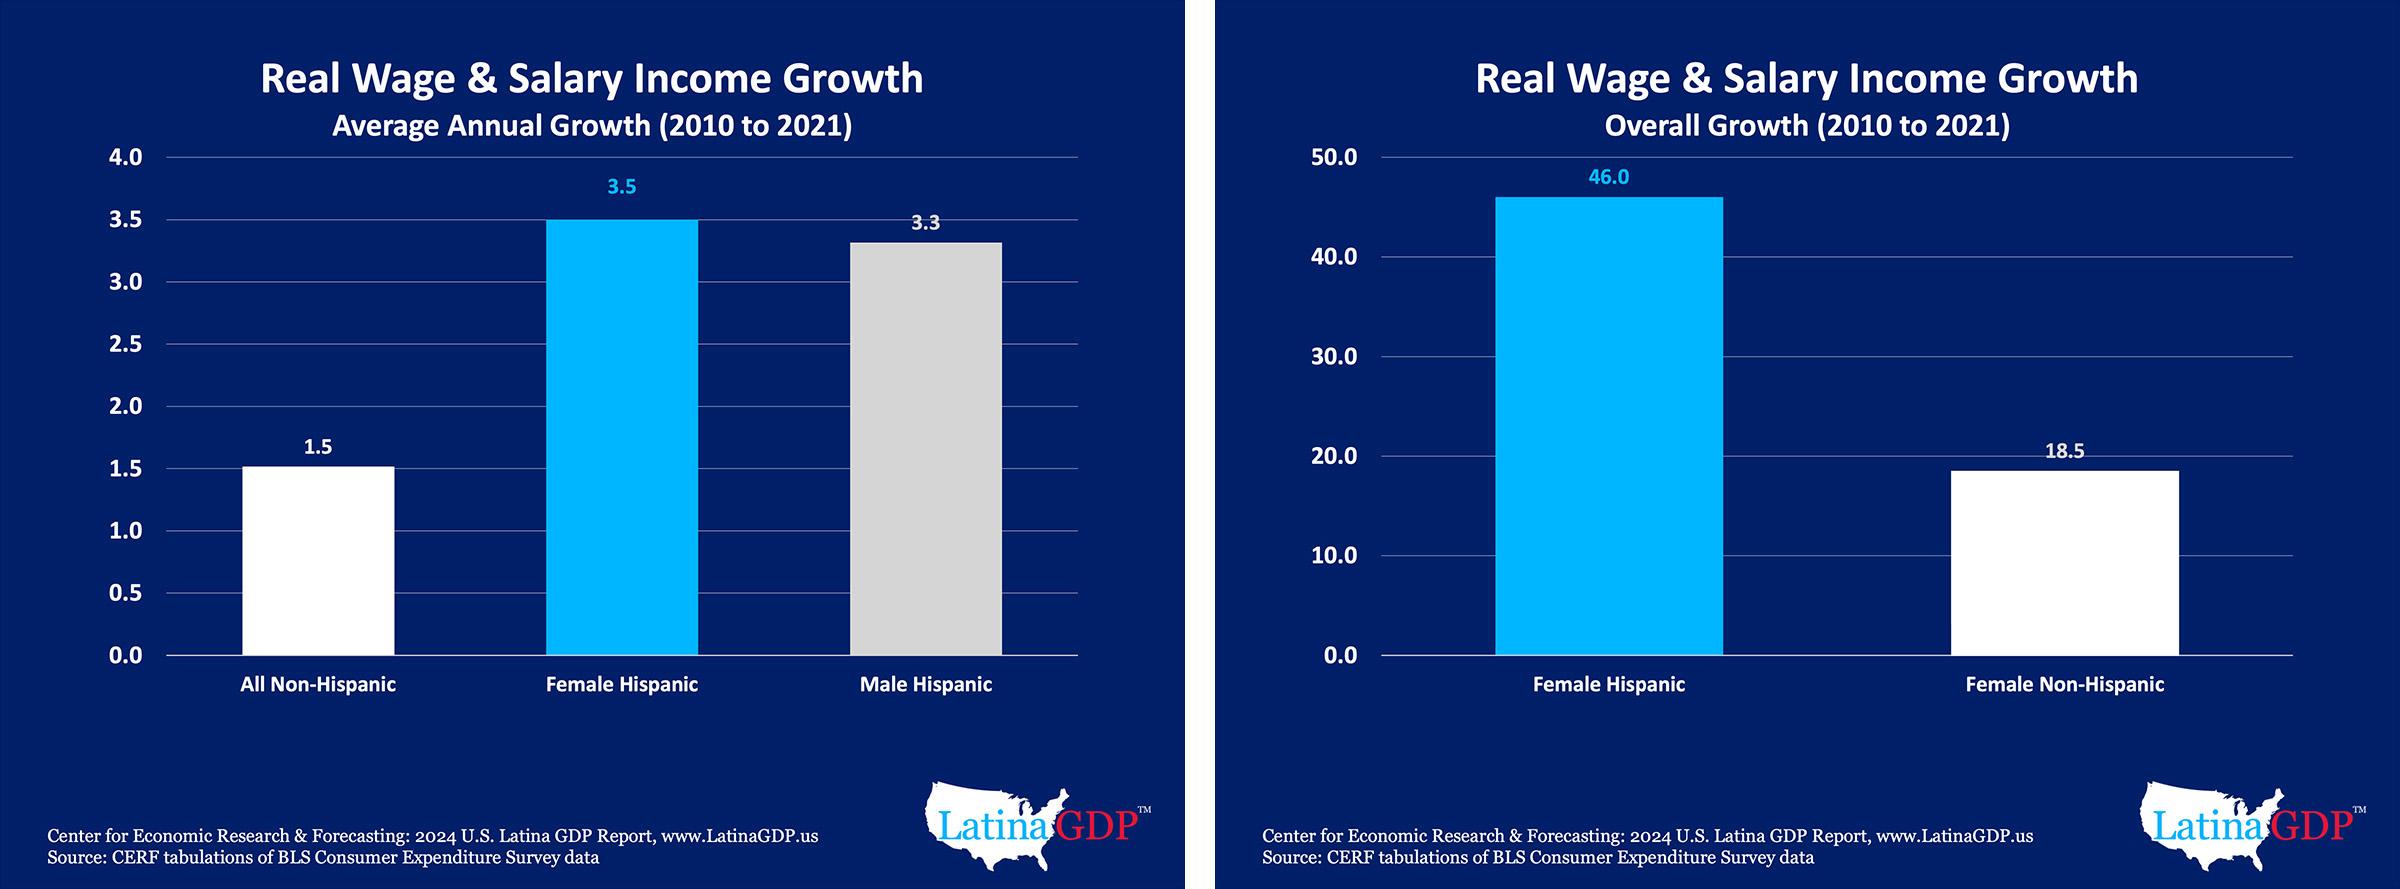
COVID-19 Pandemic and the Latina GDP
According to the dominant narrative, Latinos as a demographic cohort should have been knocked down by the COVID-19 pandemic. Yet, examining the impacts of COVID-19 through the lens of the Latino GDP reveals a very different narrative.
From the pre-pandemic peak of economic activity to 2021, real U.S. Latina GDP grew a total of 7.7 percent. This eclipses the 1.5 percent growth of Non-Hispanic GDP over the same period.
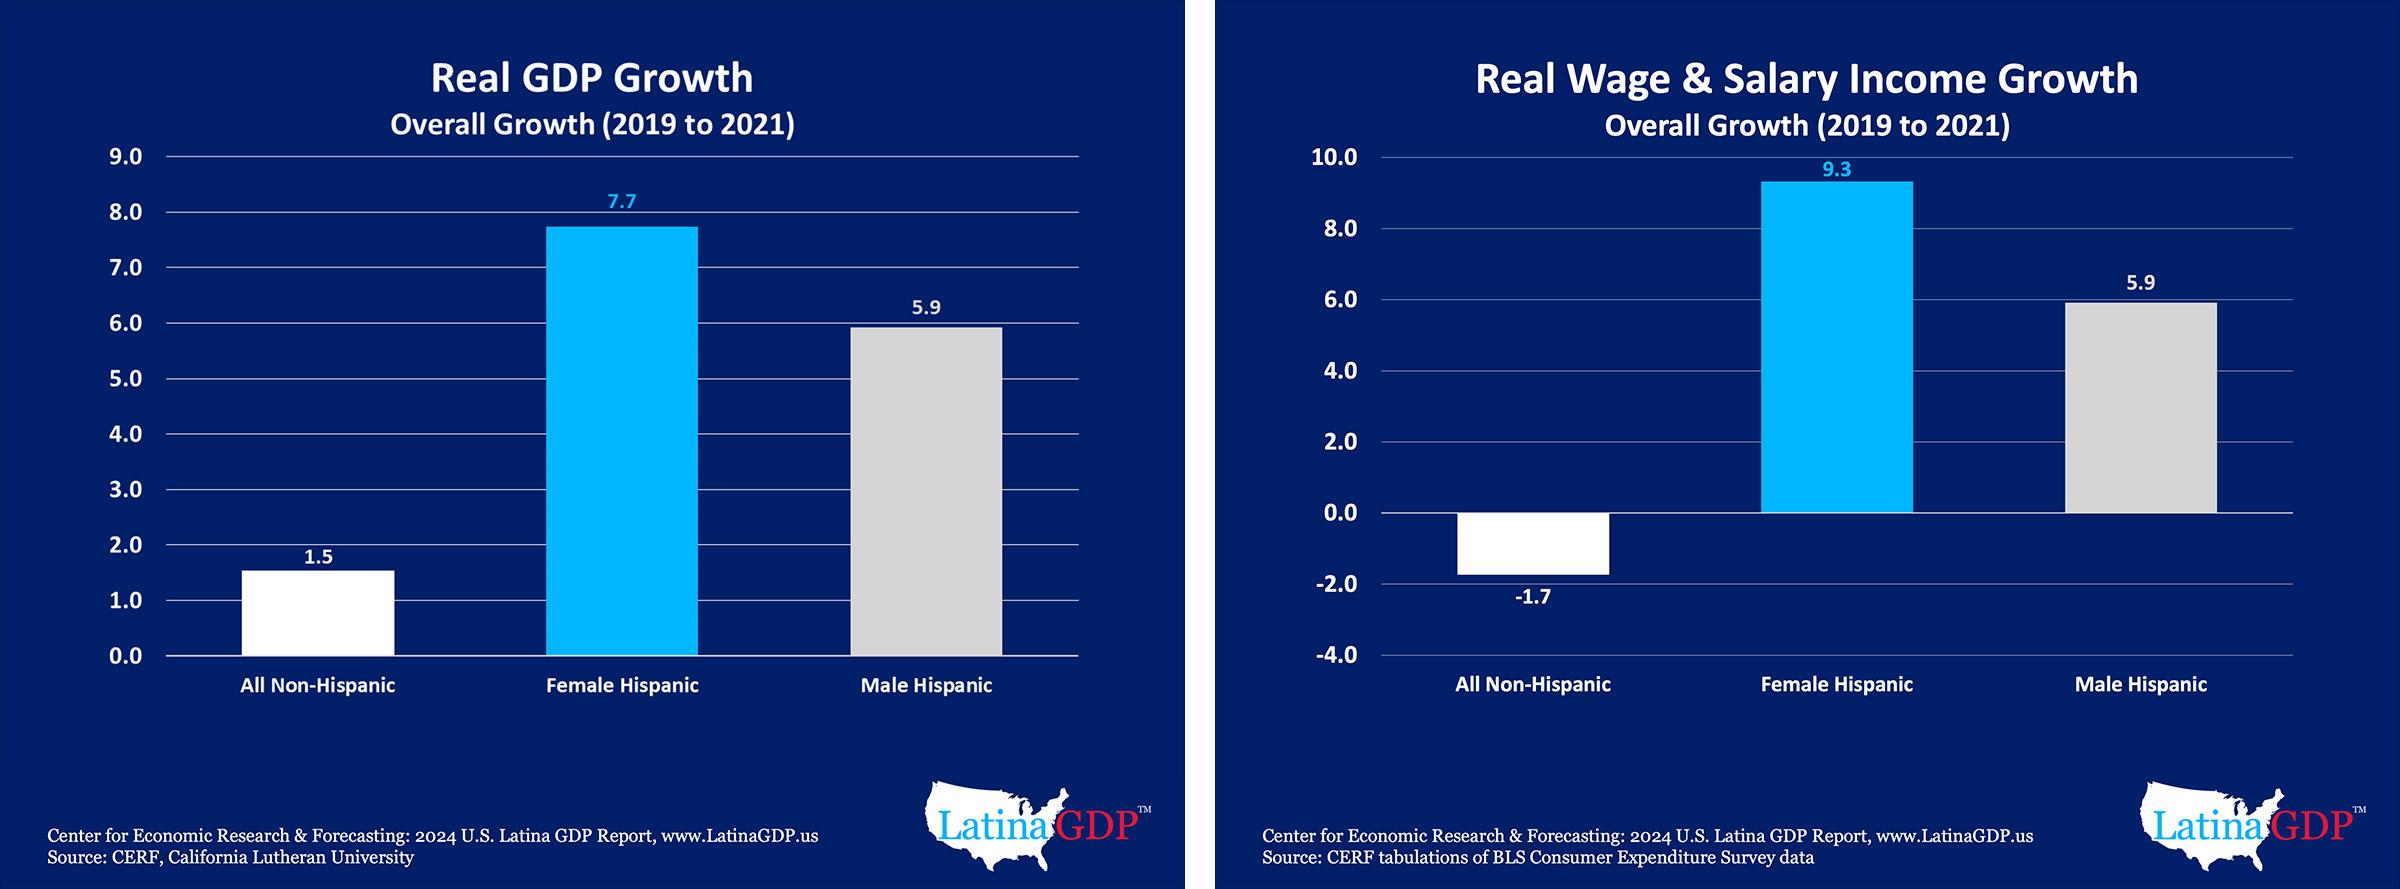
The strength of Latina GDP growth during the pandemic is consistent with the extraordinary growth of Latina incomes. Over the first two years of the COVID-19 pandemic, the real wage and salary income of U.S. Latinas increased a total of 9.3 percent, while Non-Hispanic income declined by a total of 1.7 percent. The extraordinary efforts of Latinas during the darkest days of the COVID19 pandemic and throughout the economic recovery that followed gave life to the U.S. economy, at a time of desperate need
Given the remarkable growth of the U.S. Latina GDP and other important trends outlined in this report, we expect that Latinas will continue to enjoy substantial growth premiums and provide greater vitality, giving life to the economy, dando vida a la economía, for the foreseeable future.
Migration Policy Institute, April 2024
Immigrants and Their U.S.-Born Children Have Become an Important Part of the U.S. Workforce, Accounting for all the U.S. Labor Force Growth in the Last two Decades and Represent a Pluarity of Workers in Stem, Food and Personal Services, Health Care Support and Blue-Collar Occupations.
CITATION: This analysis was originally published by the Migration Policy Institute (MPI), a nonprofit, nonpartisan think tank, in April 2024 as part of the report: Jeanne Batalova, Julia Gelatt, and Michael Fix, How Immigrants andTheir U.S.-Born Children Fit into the Future U.S. Labor Market (Washington, DC: MPI, 2024). It is reprinted with permission. The full report can be found at: https://www.migrationpolicy.org/research/immigrants-future-us-labor-market
Source: www2.claritas.com/Knowmore
As the U.S. economy has transformed from being heavily industrial to mostly service and knowledge based in the past four decades, demand has grown for higher-skilled and more highly educated workers. Long gone are the days when having a high school diploma was enough to support a family. Postsecondary credentials such as college degrees and professional certifications offer pathways to better-paying and higher-quality jobs and function as a protective factor during economic crises. And despite provocative debates about the value of a college education, recent employment projections show that demand for well-educated workers will continue to grow in the next decade: while 62 percent of U.S. adults had postsecondary education or training in 2023, 72 percent of U.S. jobs in 2031 will require this level of education or training.
This report examines the projected educational demands of future U.S. jobs and how well the education and training of today’s workers meets those demands. It focuses on the country’s 47.6 million immigrant-origin workers, who make up a growing share of the country’s workforce—rising from 19 percent in 2000 to 29 percent in 2023. This population consists of immigrants and their U.S.-born children (often referred to as the first and second immigrant generations). The report compares these trends in the immigrant-origin population with those among U.S.-born adults with U.S.-born parents (the third-and-higher generation). To do so, Migration Policy Institute researchers analyzed data from the U.S. Census Bureau’s Current Population Survey, the most recent occupational projections from the U.S. Bureau of Labor Statistics, and projections of the future educational requirements of U.S. jobs developed by the Georgetown University Center on Education and the Workforce.
The report’s key findings include:
While 62 percent of U.S. adults had postsecondary education or training in 2023, 72 percent of U.S. jobs in 2031 will require this level of education or training.
► With U.S. birth rates falling, the immigrant-origin population has been a vital source of growth for the U.S. population in the past two decades. Without immigrants and their U.S.-born children, the prime working-age population (ages 25–54) would have shrunk by more than 8 million people and the population of children and young adults under age 24 would have shrunk by more than 5 million people between 2000 and 2023.
► Immigrants and their U.S.-born children accounted for all U.S. civilian labor force growth in the past two decades. Immigrant-origin persons contributed more to the growth of the civilian labor force (102 percent) than to the growth of the overall U.S. population (62 percent). This is in part due to their higher labor force participation rates, with particularly high participation rates among immigrant men and rising rates among immigrant women.
► Immigrant-origin workers are already an important part of the U.S. workforce across occupations and skill levels. In 2023, the country’s 47.6 million immigrant-origin workers represented 29 percent of all U.S. workers (age 18 and older), but they made up 38 percent of workers
Source: www2.claritas.com/Knowmore
in science, technology, engineering, and mathematics (STEM) occupations, 36 percent of workers in food and personal services, and 34 percent of workers in both health-care support and blue-collar occupations. These four occupational clusters are important as they are projected to grow within the 2022–32 decade.
► Some immigrant-origin adults are well-positioned to participate in a future labor market that will require a higher level of education and skills. As of 2023, 75 percent or more of second-generation Asian American and Pacific Islander, Black, and White adults had at least some postsecondary education (some college attendance, an associate’s degree, or a bachelor’s or higher degree)—a share that exceeds the projection that 72 percent of workers will need this level of education in the future U.S. economy. In contrast, less than 60 percent of Latino adults across immigrant generations and 62 percent of Black immigrants had postsecondary education.
► Even occupations that have long employed large shares of people without postsecondary education and training (such as health-care support, food and personal services, and some blue-collar jobs) will require higher levels of education in the next decade, increasing the need for upskilling efforts. Among the 29.8 million immigrant-origin adults with no postsecondary education or training, many are first-generation immigrants who would need to obtain a high school diploma or its equivalent before considering postsecondary options. Additionally, more than 6 million immigrant-origin students are currently enrolled in colleges and universities, many of whom will need to graduate to obtain the benefits of a college education. At the same time, some adults with a college-level education may need assistance converting their international credentials and experience so they will be valued and recognized in the U.S. labor market.
To support the ongoing growth of the U.S. economy, many workers will need to upskill or retrain to acquire in-demand credentials and competencies, or strengthen their general skills and digital literacy. Such efforts could include policies and programs to reduce barriers that affect all workers seeking to increase their skills—including financial strains and family pressures. At the same time, immigrant-origin workers in particular would benefit from assistance with recognition of the credentials and skills they gained abroad and access to quality English language and literacy instruction. With growing numbers of U.S. immigrants holding provisional (liminal) legal statuses that do not offer a path to permanent resident status (such as Deferred Action for Childhood Arrivals, Temporary Protected Status, and various forms of humanitarian parole), Congress could also consider creating ways for them to transition to a more stable status in order to encourage immigrant workers and their employers to invest in upskilling, benefitting both the national and local economies.
To support the ongoing growth of the U.S. economy, many workers will need to upskill or retrain to acquire in-demand credentials and competencies, or strengthen their general skills and digital literacy.
Source: www2.claritas.com/Knowmore
NAHREP / Hispanic Wealth Project
In Their 10 th Annual Report on Hispanic Household Wealth, the National Association of Hispanic Real Estate Professionals Estimate That Hispanic Household Wealth Reached $63,400, a 3.17 Jump From 2013. Similarly, Hispanic Homeownership Rates, Home Prices, and Hispanic-Owned Businesses Exprienced Similar Positive Growths.
SOURCE: State of Hispanic Wealth Report
Source: www2.claritas.com/Knowmore
STATE OF HISPANIC WEALTH REPORT 6
Since the Hispanic Wealth Project began, Hispanic household wealth has seen substantial growth. The goal to triple Hispanic household wealth by 2024 was achieved two years early. By 2022, the median net worth of Hispanic households reached $63,400 — 3.17 times higher than in 2013, when adjusting for inflation.13 Not only did Hispanic household wealth more than triple, but it outpaced that of any other racial or ethnic group, with the general population’s wealth rising by 1.9x over the same period.
This progress is particularly noteworthy considering that it came on the heels of the COVID-19 pandemic, a global health and economic crisis that devastated millions of households and businesses. Although recovery efforts and investments remain ongoing, studies have found that minority communities, including Hispanic households, were disproportionately affected by job loss, limited access to remote work, and a greater need to use their savings than their non-Hispanic White counterparts.14 Additionally, Hispanics faced worse health outcomes, and were 1.5 times more likely to contract COVID-19, 1.8 times more likely to be hospitalized, and 1.7 times more likely to die from the disease.15 Despite these challenges, Hispanic household wealth has flourished. Increasing homeownership rates, rising home prices, a surge in Hispanic-owned businesses, and steady growth in participation in non-cash financial assets have all contributed to this steady growth.
While Hispanic household wealth is rising, a significant gap remains when compared to non-Hispanic White households. In 2022, the median net worth for Hispanic households was $63,400 compared to $283,300 for nonHispanic White households and $192,160
for the general population.16 In terms of dollar amounts, the difference between wealth held by Hispanic households and non-Hispanic White households is large, and larger today that it was two decades ago.
SOURCE: FEDERAL RESERVE SURVEY OF CONSUMER FINANCES, 2022 INFLATION-ADJUSTED DOLLARS, PUBLIC-USE DATA.
Source: www2.claritas.com/Knowmore
FACT : Since 2013 , the gap has closed propor tionall y by nearly half. W hen accounting fo r age, the gap narrow s eve n fur the
While the difference in median net worth between Latino households and their non-Hispanic White counterparts remains significant, the proportional wealth gap is shrinking, and quite rapidly. Since the Hispanic Wealth Project’s inception, this gap has been nearly halved. In 2013, for every dollar held by Latino households, non-Hispanic White households had $8.87, almost double what it is today.17 MY TH BU ST ER : MY TH : Th e wealth gap between Hispanic households and non-Hispanic White households is growing
While the growth in Hispanic household wealth over the last decade is significant, it does not fully account for a major factor: age. Latinos are significantly younger than the general population and their non-Hispanic counterparts. With a median age of 30, Latinos are the youngest racial or ethnic group in the U.S, younger by 8 years than the overall population and 14 years younger than non-Hispanic Whites.18 This relative youth means Hispanic households have had much less time to build wealth, with fewer years in the workforce and less time for their assets to appreciate. Consequently, a portion of the wealth gap can be attributed to age.
When age is factored in, the proportional wealth gap between Latinos and their non-Hispanic White counterparts narrows by nearly one-fifth — a significant reduction. Understandably, households headed by individuals under 35 have significantly less wealth than those led by older individuals. Not only are they presumably earning less, but they’ve had less time to save, and less time for their investments to grow. Latino households under 35 have a median net worth of $16,060, compared to $58,350 for nonHispanic White households and $39,040 for all households under 35, reducing the proportional wealth gap to $3.63 and $2.43, respectively.19
For every $1 a Hispanic household holds …
$1 $3.63 $2.43
HISPANIC HOUSEHOLDS UNDER 35
NH WHITE HOUSEHOLDS UNDER 35 ALL HOUSEHOLDS UNDER 35
SOURCE: FEDERAL RESERVE SURVEY OF CONSUMER FINANCES, 2022 INFLATIONADJUSTED DOLLARS ANALYZED IN PARTNERSHIP WITH POLYGON RESEARCH
Although there is much to be optimistic about, there is still work to be done.
The wealth gap, while declining proportionally, is still large. Hispanic households have not yet fully reached their potential in homeownership, business ownership, and savings and investments. Beyond that, those who have achieved significant wealth must take steps to protect it and ensure a successful transfer of generational wealth.
Given the relative youth of the Latino community, now is the time to prepare this vibrant population to take advantage of all the wealth-building opportunities ahead. Over the next ten years, the Hispanic Wealth Project will continue to monitor household wealth acquisition, with its new goal to reduce the proportional wealth gap by 50 percent – guided by targeted efforts in real estate, entrepreneurship, financial investments, and asset protection.
2025 LDC U.S. Latinas Overview Report Latino Donor Collaborative According to Latino Donor Collaborative, Latinas Are A Driving Force in the Economy, Through High Labor Force Participation Rates and Entrepreneurial Efforts Like Latino-Owned Businesses. This is Despite Being Underrepresented in Government, Corporate Leadership, and Media.
SOURCE: 2025 LDC U.S. Latinas Overview™ - Latino Donor Collaborative
Source: www2.claritas.com/Knowmore
Latinas are increasingly recognized as a pillar in the U.S. economy, both in the workforce and as influential consumers. With their expanding presence in the labor market and households, Latinas are reshaping industries and making major strides as key economic decision-makers at home.
Latinas play a vital role in the workforce, with a participation rate of 69%, the second-highest among women, surpassed only by non-Hispanic women This figure highlights their growing economic impact . 2 Their contributions are not limited to specific sectors—Latinas help drive the nation’s overall productivity and growth
Latinas are also central to economic decision-making within their households Approximately 86% of Latinas are the primary shoppers in their households,4 outpacing the national average of 78% for women in the United States 11 This prominence in household purchasing underscores Latinas’ growing economic influence—not only as key contributors to the labor
force but also as major drives of consumer markets .
The impact of Latinas as consumers extends beyond household products Nearly 80% of Gen Z Latinas consider their heritage a key part of their identity, with 44% actively seeking to incorporate their cultural background into their appearance 8 As an example, they represent a significant and rapidly growing market within the beauty industry
The importance of Latinas to the U S . economy extends beyond statistics— it is a testament to their hard work, ambition, and resilience Businesses, brands, and policymakers that recognize and invest in this growing demographic will be better positioned for success in the years to come
Latinas are significant contributors to the U.S. beauty industry, accounting for 14.1% of beauty households and 16.4% of the dollars spent.6 The beauty market was valued at $95.55 billion in 2023 and is projected to reach approximately $185.26 billion by 2034.12
Consumer preferences are evolving, with 50% of Gen Z Latinas preferring organic and chemical-free beauty products. Social media also plays a key role, with 53% using it for beauty tips and trends and 57% following strict skincare routines influenced by online content.8 For beauty brands, this shift highlights the importance of clean formulations, influencer-driven marketing, and culturally inclusive campaigns to engage Latina consumers effectively.
Source: www2.claritas.com/Knowmore
Latinas are not just excelling in education and the workforce—they are also becoming leading entrepreneurs. According to a recent study, nearly half of all Latinas believe that owning a business is an essential part of the American Dream.16 This ambition translates into action—27% of all Latino/ Latina-owned businesses are owned by women, surpassing the 21% ownership rate of non-Hispanic White women.17 Their cultural adaptability and strong ties to both their heritage and American society allow Latinas to easily navigate different cultural spaces and engage with mainstream markets, giving them a distinct advantage in business.
Despite challenges such as limited access to capital and systemic barriers, Latina-owned businesses continue to thrive Over the past five years, Latina entrepreneurs have achieved a remarkable 6 . 3% compound annual growth rate (CAGR), outpacing the 3 9% growth of White female-owned businesses 5 This upward trajectory signals that, given the right resources and opportunities, Latinas excel at driving economic prosperity and job creation
Latinas are not just contributing to the economy—they are shaping it As entrepreneurs, executives, educators, and leaders, they are breaking barriers and transforming industries Recognizing the power of Latina women is about more than acknowledging their contributions; it is an investment in the future of the U S economy As society embraces and empowers Latinas, they will continue to drive excellence, innovation, and leadership, fueling economic growth and advancing U S prosperity

ITIN holders are essential contributors to America’s economy and public services
These taxpayers — who include millions of small business owners, entrepreneurs and hardworking families — make substantial contributions that benefit all Americans:
• In 2022, immigrants paid a substantial $97 billion in federal, state and local taxes.
• On average, ITIN holders contribute $8,889 annually in taxes — money that funds schools, roads, health care and national defense.
• More than one-third ($33.9 billion) of tax contributions from undocumented immigrants go toward Social Security, Medicare and unemployment insurance programs they cannot access — effectively subsidizing these critical programs for U.S. citizens.
• ITIN holders contribute billions to Social Security without being eligible to claim benefits, directly strengthening the solvency of a retirement system depended on by millions of Americans.
• 1 in 6 U.S. citizen children who are living in poverty in the U.S. has an ITIN-holding parent, making these tax contributions vital to the well-being of vulnerable American children.
Source: www2.claritas.com/Knowmore
The economic impact of ITIN holders’ tax contributions is both substantial and irreplaceable:
• $25.7 billion in Social Security taxes — money that directly supports current retirees and strengthens the system for future generations.
• $6.4 billion in Medicare taxes — helping fund health care for older adults.
• $1.8 billion in unemployment insurance taxes — providing a critical safety net that ITIN holders themselves cannot access.
• For every 1 million undocumented immigrants in the U.S., public services receive a remarkable $8.9 billion in additional tax revenue.
• ITIN holders are entrepreneurs and job creators — starting businesses, paying payroll taxes and contributing to economic growth in communities across America.

If tax information can be shared with immigration authorities despite clear legal prohibitions:
• Your financial secrets could be next on the government’s list. Once taxpayer privacy is breached for political purposes, no one’s tax information will be truly safe.
• The IRS could become a surveillance tool — shifting from a tax collection agency to a mechanism for monitoring and targeting any group that falls out of political favor.
• Billions would disappear from local economies overnight — as taxpaying business owners, workers and consumers close shop or fail to report to work.
• Social Security and Medicare would lose critical funding — the $33.9 billion that ITIN holders contribute to these programs would vanish.
• A dangerous precedent would be established that following the law provides no protection when political winds shift.
Source: www2.claritas.com/Knowmore
2024 State of Latino Entrepreneurship Report Stanford Graduate School of Business in Collaboration with the Latino Business Action Network
In Their 10 th Annual Study of Latino-Owned Businesses, the Latino Entrepreneurship Initiative Found That the Value of Goods and Services Produced by All Latinos Reached $3.6 Trillion in 2022.

Source: 2024 State of Latino Entrepreneurship | Stanford Graduate School of Business CITATION:
Source: www2.claritas.com/Knowmore


The 2024 State of Latino Entrepreneurship (SOLE) Report marks the tenth annual study dedicated to understanding the evolving landscape of Latino-owned businesses in the United States. Latinos account for over 70% of the overall growth in the U S population between 2022 and 2023 Economically, this impact is profound The value of goods and services produced by all Latinos in the U.S. reached $3.6 trillion in 2022, ranking as the fifth largest economy globally, surpassing the GDPs of the United Kingdom and India Driving this economic contribution is the rapid growth of Latino-owned businesses, which are the fastest-growing and most dynamic group of the entrepreneurial landscape Since we began this research, over the past decade, we have found that Latino entrepreneurs have significantly contributed to job creation, economic growth, and business diversification across the nation The Stanford Latino Entrepreneurship Initiative (SLEI) has closely tracked this growth, offering data driven insights to inform future economic trends, policies, and programs. We highlight below key findings on the contributions, opportunities, and challenges facing this fast-growing segment of the business population. All data reported henceforth refer to 1
Source: www2.claritas.com/Knowmore
Latino-owned employer businesses (LOBs), with at least one paid employee other than the owner, generating at least $10,000 in annual revenue, and White-owned employer businesses (WOBs) with the same criteria, unless stated otherwise
Latino-owned businesses are a critical driver of US entrepreneurial growth, demonstrating resilience and expansion even amidst economic challenges.
Over a five-year period, LOBs grew in number by 44%, coupled with a 36% increase in total revenue, generating $654 billion in 2022 (according to ABS 2023) During the same time period, the number of White-owned businesses decreased by 3%. Despite a challenging economic climate, LOBs have shown consistent expansion in number of businesses, revenue, and workforce Without Latino-owned firms, the U S would have seen no net new growth in the number of businesses during the pandemic (2020-2021) Further, LOBs led growth in the number of firms across all industries including Arts and Entertainment (+86%), Construction (+75%), Transportation (+74%), Real Estate (+66%), and Professional Services (+48%). These indicators underscore their role as a critical driver of entrepreneurial activity in the U.S. economy.
Latino-owned businesses have rebounded in profitability post-pandemic, outperforming White-owned businesses in recent years.
Since 2016, profitability trends among Latinoowned businesses (LOBs) have revealed a story of resilience and recovery Prior to the pandemic, our study found that Latino-owned firms were less likely than WOBs to report operating profitably During the pandemic, both LOBs and WOBs experienced significant declines in the proportion of firms operating profitably The portion of profitable LOBs dropped to 53% in 2020, with the comparable portion of WOBs falling to 62% The lowest point for LOBs occurred in 2021, when only 43% reported profits However, LOBs have since rebounded, slightly outpacing WOBs This year we saw 84% of LOBs operating profitably, a notable change over the past 10 years of Latino business trajectory
Latino-owned businesses continue to lead in providing opportunities for employee growth and advancement.
Latino business owners remain more likely to offer their employees benefits and pathways for growth and advancement compared to their White counterparts. The data reveal that 89% of Latino-owned businesses provide employer-paid benefits, compared to 75% of White-owned businesses, and 90% of Latino-owned businesses offer skill development opportunities, surpassing 77% among White-owned businesses. These trends align with our prior findings and underscore Latino-owned businesses’ commitment to job quality. While White-owned businesses are more likely to offer remote work options, Latino-owned businesses prioritize benefits that foster upward mobility As workforce dynamics evolve, these practices highlight the role of Latino entrepreneurs in shaping equitable employment opportunities 5
Latino entrepreneurs show strong sustainability efforts.
Latino-owned businesses are moderately more likely to implement green practices, such as water conservation and renewable energy use, compared to White-owned businesses. This
Source: www2.claritas.com/Knowmore
commitment stems from motivations like cost savings, enhancing brand reputation, and meeting regulatory requirements. These sustainable initiatives not only improve environmental outcomes but also provide a model for businesses seeking to integrate sustainability into their operations.
Latino-owned businesses are adopting AI to enhance operations while fostering workforce growth and upskilling.
LOBs show similar levels of full AI integration as White-owned businesses, yet a higher proportion of LOBs view AI as applicable to their operations
Among businesses implementing AI, 59% of LOBs reported increases in worker skill levels compared to 55% of WOBs, and LOBs were more likely to report increased workforce size as alongside AI adoption While both groups primarily adopted AI to improve the quality and reliability of goods and services, LOBs were more likely to report positive impact of AI adoption for their employees
Challenges such as system integration and data privacy/security were common across both groups, but LOBs were more inclined to express caution about future AI adoption. Nevertheless, 74% of LOBs cited increased operational efficiency due to AI, demonstrating its potential to drive business improvements
Over the past decade, Latino-owned businesses have consistently faced funding challenges and receive less transparency regarding the criteria for funding decisions. For the last ten years, Latino-owned businesses have reported persistent challenges in accessing capital. Latino entrepreneurs today are half as likely to receive full funding compared to Whiteowned businesses (21% vs. 40%). Additionally, only 51% of Latino business owners receive an explanation for funding denial, compared to 87% of their White counterparts. This lack of transparency can perpetuate long-standing challenges in financial systems and makes it difficult for Latino business owners to close the loop and effectively address gaps in their applications. Adding to this challenge, financing is often reported as the greatest low moment by Latino business owners a stark contrast to the
high levels of optimism and resilience they otherwise exhibit Over the years, many have navigated these disparities by tapping into personal savings or relying on high-interest funding sources like credit cards This recurring reliance highlights the resilience of Latino entrepreneurs but also underscores the urgent need for equitable access to capital in the financial ecosystem
Latino-owned businesses face common business challenges but big gap in marketing. While inflation was the most commonly reported challenge this past year across all businesses, marketing and customer acquisition reveal the largest gap. Latinoowned businesses are more likely than Whiteowned businesses to identify marketing as their primary obstacle These challenges include establishing an online presence, managing social media, and executing customer outreach effectively
Certifications open contracting opportunities for Latino-owned businesses but fall short of addressing barriers.
Certifications have proven instrumental in helping Latino-owned businesses secure local government contracts, with certified businesses 40% more likely to win contracts than their noncertified counterparts These certifications create pathways for growth and scalability. However, challenges such as limited access to decision-makers and complex procurement processes continue to hinder their full potential Addressing these persistent barriers could significantly enhance the impact of certifications, allowing Latino-owned businesses to scale and thrive in the contracting space
Latino entrepreneurs exemplify optimism and resilience, even amidst significant challenges.
Over the past decade, Latino business owners have consistently demonstrated remarkable resilience and optimism, often reporting greater enthusiasm for their business futures compared to Whiteowned businesses This year, 72% of Latino entrepreneurs reported a positive outlook on their business trajectory, despite navigating persistent funding challenges, market challenges, and economic pressures like inflation While financing remains one of the most significant low points for Latino-owned businesses, their ability to adapt and remain optimistic underscores their entrepreneurial spirit and determination. This optimism will continue to drive their contributions to the U S economy

Source: www2.claritas.com/Knowmore

In its 5th year, surveying more than 5,000 U.S. adults and 500 employers, the study provides a comprehensive evaluation of U.S. career perceptions.
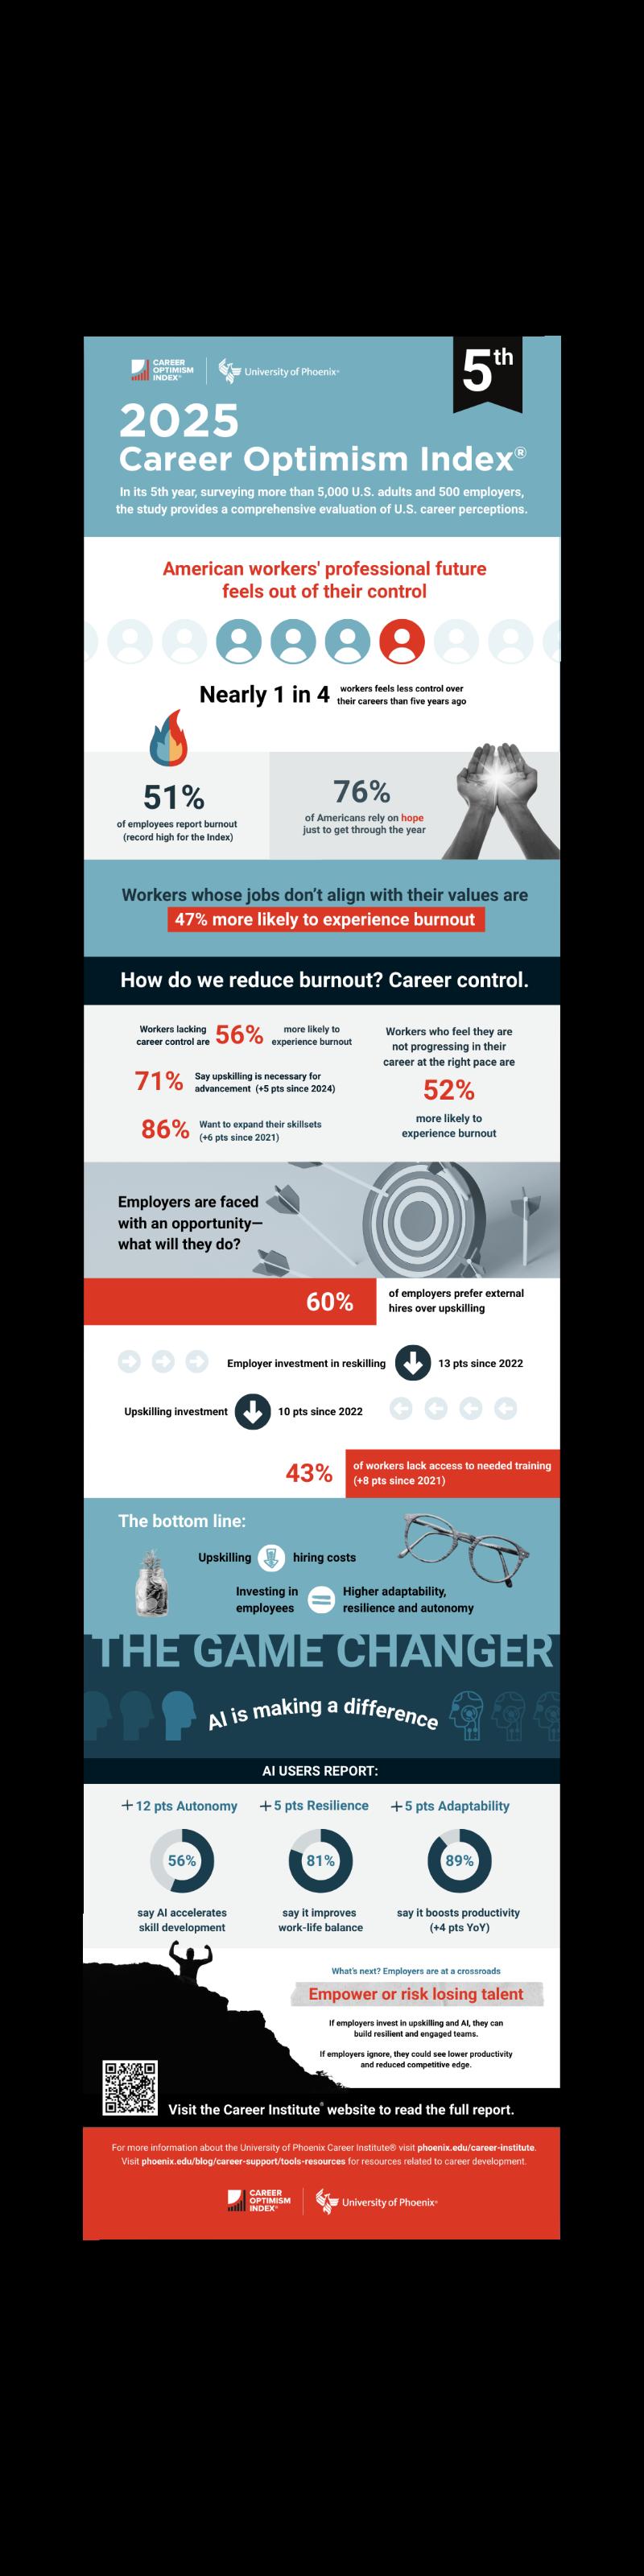


• One-third of U.S. Hispanics are Chronically Absent from School
• Teachers Make on Average 5% Less than 10 Years Ago and 9% Less than the Peak in 2009–10, Adjusted for Inflation
• Most American College Students Attend 4-Year Public Institutions
• Federal Government Spends $100 Million Less Than it Did in 2004
• Average Daily Attendance has Decreased in the Last 10 Years
• Federal Spend on Education has Sharply Decreased
• AZ is 46th in per Pupil Spending
• AZ has the Fourth Highest Rate of Chronic Absenteeism
• AZ Teachers are Paid 13% Less Than the National Average
• Federal Sources Account for 20% of School Revenue Sources for Arizona
• Nearly Half of AZ K-12 Students are Hispanic
• Low-Income Title 1 Schools Have Nearly 3x the Number of Teachers with Temporary Certificates
• More than 1 in 8 Teachers Low Income Title 1 Schools are Not Fully Qualified or Certified to Teach Their Subjects, vs 1 in 11 for non-Title 1
• Enrollment in AZ K-12 Schools has only Varied by 50,000 Since 2012
• Hispanics, African American, and Native Americans Remain Among the Lowest Graduation Rates
• Arizona K-12 Teachers Do Not Match The Student Demographics
• More than Half of Teachers are at Least Somewhat Likely to Leave
• Nearly 3/4 of AZ Teachers Consider Leaving Due to Salary & Benefits
• Only 1/3 of AZ Teachers Recommend Their Profession
• States Budgets Make Up The Majority of K-12 Education Funding
SPECIAL FEATURE
Educational
A closer look at schooling for ages 5–17 and 18+ in the Phoenix and Tucson Markets, courtesy of Univision Communications
IN FOCUS
IN FOCUS
EXCERPT
130
EXCERPT
BREAKING BARRIERS, BUILDING FUTURES: The Pendergast Approach to Innovation in Education
BY RAMIRO ALVAREZ
EXCERPT
EXCERPT
Maricopa Community Colleges Powers Arizona’s Workforce Through Expansive Education Pathways
BY DEANNA VILLANUEVA-SAUCEDO
Still Missing Too Much School: A Follow Up Analysis of Arizona Chronic Absence Trends in Grades 1–8
In the 2020–2021 P ost-pandemic cohort, chronic absences for Hispanic students in grade 5 was 24%; while chronic absences for Hispanic students in grade 7 was 34%.
Knocking at the College Door (2024)
In 2023, Hispanic public graduates accounted for almost 944,000 students, and are projected to grow to 1.1 million graduates in 2041.
Hispanic public high school graduates made up 27 percent of the total public graduating class in 2023, with that number set to increase to 36 percent in 2041.
Graduate Degrees: Risky and Unequal Paths to the Top (2024)
A Study by the Georgetown University Center on Education and the Workforce Found That Graduate Degrees Offer Numerous Financial and Quality of Life Benefits, but Their Increasing Costs Risks Limiting it’s Benefit to a Small Number of People.
2024–2025 REPORT
MAPA The State of Arizona Latino Education, Power, and Influence Despite Representing a Vital Part of Arizona’s Student Population, Multilingual Learners Face Disparities in Proficiency Rates Compared to Their Peers.
*Estimated
47,035,260
More than 1 in 8 Teachers Low Income Title 1 Schools are Not Fully Qualified or Certified to Teach Their Subjects, vs 1 in 11 for non-Title 1
Enrollment in AZ K-12 Schools has only Varied by 50,000 Since 2012
ARIZONA OUT OF FIELD K–12 TEACHERS By School Type (2018–2024)
ALL TITLE 1 NON- TITLE 1
ENROLLMENT IN ARIZONA PUBLIC ELEMENTARY AND SECONDARY SCHOOLS (FALL 2014–2023)
1,102,445 1,111,695 1,109,040 1,123,137 1,110,851 1,141,511 1,152,586 1,111,500 1,133,284 1,132,223 1,117,630
Hispanics, African American, and Native Americans Remain Among the Lowest Graduation Rates
More than Half of Teachers are at Least Somewhat Likely to Leave
NOTE: Data based on 3 surveys, covering 7,788 current K-12 educators, 732 former K-12 educators, and 933 education support professionals.
CITATION:
Nearly 3/4 of AZ Teachers Consider Leaving Due to Salary & Benefits
ARIZONA EDUCATORS LIKELIHOOD OF LEAVING THE PROFESSION WITHIN THE NEXT 1–2 YEARS
VE R Y LIKE LY LIKE LY SOMEWH AT LIKE LY SOMEWH AT UNLIKE LY UNLIKE LY VE R Y UNLIKE LY
CITATION:
HAVE CONSIDERED LEAVING THE PROFESSION
I AM NOT SATISFIED WITH MY SALARY AND BENEFITS
I AM NOT SATISFIED WITH MY TEACHING ASSIGNMENT OR OTHER FACTORS RELATED TO MY CLASSROOM INSTRUCTION
I DO NOT FEEL SUPPORTED BY MY SCHOOL COMMUNITY MY PERSONAL LIKE REASONS
I AM NOT SATISFIED WITH MY SCHOOL
I AM NOT SATISFIED WITH MY OPPORTUNITIES FOR PROFESSIONAL DEVELOPMENT OR CAREER ADVANCEMENT I AM NOT SATISFIED WITH THE WAY I AM EVALUATED REASONS WHY ARIZONA
NOTE: Data based on 3 surveys, covering 7,788 current K-12 educators, 732 former K-12 educators, and 933 education support professionals.
CITATION: Recreated by the Arizona Hispanic Chamber of Commerce from Figure
issuu.com/asu_morrison_institute/docs/2023_educator_working_conditions_study_final_5-23


Source: DATOS Interactive — Educational Opportunity Dashboard


BY RAMIRO ALVAREZ

Arizona’s education system has long been under strain from inadequate school funding, resulting in overcrowded classrooms, outdated resources and one of the highest teacher turnover rates in the country. At the center of this crisis lies a critical issue of social justice: the right of every child, regardless of zip code, to access a high-quality education. In communities with high Latino populations, this funding inequity is felt even more deeply.
The Pendergast Elementary School District, which serves approximately 8,200 students in the West Valley (Phoenix, Glendale, & Avondale), is no stranger to these challenges. Like many districts across Arizona, Pendergast has grappled with teacher shortages fueled by stagnant salaries, lack of support and a national workforce crisis. Yet instead of accepting the status quo, the district has taken bold, innovative steps to reimagine what public education can look like, especially for communities that have been historically underserved. In response to the teacher shortage, Pendergast has implemented a groundbreaking teaming teaching model that allows educators to collaborate more effectively, focus on their strengths and reduce burnout. Rather than placing the weight of an entire classroom on
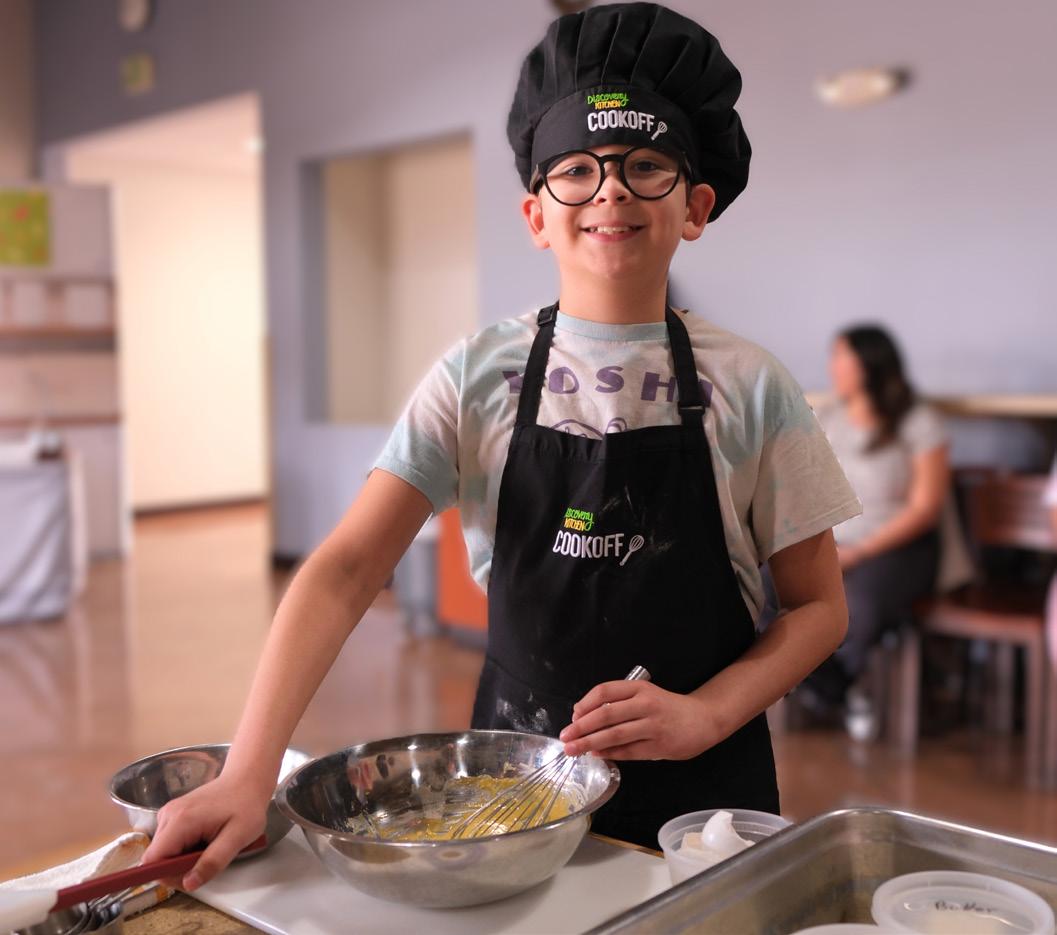
one teacher’s shoulders, this approach creates dynamic teaching partnerships, improves staff morale and most importantly, enhances learning experiences for students.
But innovation at Pendergast doesn’t stop at instruction. The district has launched a visionary academy model that provides families with access to schools featuring specialized themes and programs tailored to students' interests and real-world skills. From Computer Science and World Languages to Leadership, Communications and Visual & Performing Arts, each of the district’s 12 schools offers a unique lens through which students explore learning.

One of the district’s most transformative innovations is its groundbreaking partnership with Arizona State University and Dreamscape Learn. In 2024, Pendergast became the first public elementary school district in the nation to pilot a fully immersive virtual reality (VR) learning experience. This educational breakthrough merges science, storytelling and exploration in a way that deeply engages students. The pilot, launched with eighthgrade science students at Villa de Paz Elementary, was met with overwhelming success. Now, this cutting-edge VR experience is expanding to all 12 Pendergast schools, providing students across the district with equitable access to a next-generation learning opportunity that sparks curiosity, creativity and academic growth.
Pendergast’s commitment to social justice isn’t just about overcoming the obstacles created by underfunding, it’s about redefining what’s possible. By investing in teacher support, embracing visionary partnerships and empowering students through choice and innovation, the district is charting a new path forward. In doing so, it sends a clear message to students, families and communities: education should never be limited by circumstance, it should be elevated by imagination, courage and hope.
BY DEANNA VILLANUEVA-SAUCEDO
As Arizona’s largest higher education provider, Maricopa Community Colleges plays a critical role in driving the state’s economic future by equipping students with the skills, knowledge and credentials employers need. Across its 10 colleges, the system offers over 600 degree and certificate programs, including 11 bachelor’s degrees, preparing graduates for high-demand roles in healthcare, business, technology, education, public safety and skilled trades.
Maricopa Community Colleges designs its bachelor’s degrees, certificates, microcredentials and apprenticeship programs to meet the needs of sectors essential to Arizona’s economic future— including industries facing some of the most urgent workforce shortages in the nation:
• Healthcare – Arizona is projected to be short nearly 4,700 registered nurses, 412 nurse practitioners and 4,100 physicians by 2032. Across its 10 colleges, Maricopa educates roughly one-third of the state’s nurses, while offering multiple nursing and behavioral health pathways, including RN-toBSN and Behavioral Science bachelor’s degrees.
• Construction — With construction employment up 23% since 2020, Maricopa’s skilled trades and construction technology programs provide hands-on training that helps meet surging demand for qualified workers in one of the state’s fastest-growing sectors.
• Advanced Manufacturing — Arizona’s manufacturing employment will add 31,000 jobs by 2033. The system’s manufacturing, machining and semiconductor training programs, including two Future48 Workforce Accelerators, prepare graduates for technician and production roles in expanding industries like aerospace and defense, automotive and semiconductor manufacturing.
• Behavioral Health — With demand for behavioral health professionals expected to rise 40% in the next decade, Maricopa’s counseling, social work and addictions and substance use disorders programs are building a pipeline of qualified practitioners to serve communities in every corner of the state.
From nursing and teaching to emerging careers in artificial intelligence, Maricopa Community Colleges tailors its programs to meet both employer demands and student goals. The system’s workforce strategy includes:

• Baccalaureate Programs — Eleven bachelor’s degrees designed to meet critical workforce shortages in fields like behavioral health, business administration and information technology.
• Career and Technical Education — Hands-on programs in trades, manufacturing and allied health, enabling students to enter the workforce in as little as six weeks to six months.
• Microcredential Pathways & Fast Track Certificates — Short-term, industry-recognized credentials that quickly prepare learners for in-demand roles.
• Apprenticeships & Work-Based Learning — Opportunities for students to gain paid, real-world experience while completing their studies, ensuring they graduate job-ready.
Every year, Maricopa Community Colleges educates more residents of Maricopa County than any other college or university, making it the largest contributor to Arizona’s workforce pipeline. By combining affordability with flexible learning formats and industry partnerships, the system ensures that graduates enter the job market with the credentials and experience employers value.
“Today, more than ever, students need access to opportunities that will help them move into high-demand jobs and earn a living wage,” said Dr. Steven R. Gonzales, Maricopa Community Colleges Chancellor. “Affordability doesn’t mean that students lose out on academic rigor or real-world training; it simply means a student’s dollar stretches further, for the same education a traditional, fouryear institution offers.”
With tuition starting at just $97 per credit hour, students save thousands compared to the cost of a traditional four-year university. This accessibility enables more Arizonans to pursue

higher education without the burden of significant student debt. According to the Integrated Postsecondary Education Data System (IPEDS), only 7% of students across all 10 Maricopa Community Colleges take out federal student loans, with an average loan amount of $3,765. These official figures, reported by the federal government, highlight the system’s ongoing commitment to
providing accessible, high-quality education without saddling its students with long-term financial burdens.
Learn more about programs that connect education to opportunity at maricopa.edu.
Deanna Villanueva-Saucedo serves as associate vice chancellor for Maricopa Community Colleges' Center for Excellence in Inclusive Democracy (CEID). CEID is committed to fostering meaningful relationships between Maricopa Community Colleges and the communitieswe serve byadvancing democracyand civic engagement, shared governance, and academicfreedom.
Maricopa Community Colleges www.maricopa.edu
2411 W. 14 th Street Tempe, AZ 85281
• FB: maricopa.edu
• IG: maricopacolleges
• X: mcccd
• LI: maricopa-community-colleges
Helios Education Foundation, 2025
In the 2020–2021 Post-pandemic cohort , chronic absences for Hispanic students in grade 5 was 24%; while chronic absences for Hispanic students in grade 7 was 34%.
In the 2018–2019 Pandemic cohort , 13% of Hispanic students in grade 5 are reported to have been chronically absent; while 31% of Hispanic students in grade 7 are reported to be chronically absent.
In the 2016–2017 pre-pandemic cohort , chronic absences for Hispanic students in grade 5 was 11%; for Hispanic students in grade 7 chronic absences rates increased to 18%.
SOURCE: helios.org
A Follow-Up Analysis of Arizona Chronic Absence Trends in Grades 1–8
JANUARY 2025


Chronic absence rates peaked in the 2021–22 school year at 34 percent. Compared to this peak, chronic absence in 2022–23 declined by five percentage points, potentially signaling the beginning of a recovery. Despite this decline, chronic absence rates statewide were still more than twice as high in 2022–23 as they were pre-pandemic and are above the levels during the pandemic in the 2020–21 school year, as reported in the 2022 brief Missing Too Much School.
Using the most recent data available (2022–23 school year), we examined chronic absence rates by grade level and by student mobility. These analyses show that chronic absence was pervasive across grade levels and especially pronounced for mobile students. Compared to pre-pandemic rates for the 2018–19 school year, chronic absence rates doubled across nearly every grade level in 2022–23 and for all groups of students.3
3 For students with some Arizona Online Instruction (AOI) enrollments, changing schools does not imply the same challenges as for those with only non-AOI enrollments. As such, the relationship between mobility and chronic absence was examined only for students with non-AOI enrollments.
For mobile students who changed schools at least once during the 2022–23 school year, chronic absence rates were generally higher than those who did not change schools (according to the official state definition), especially in grades 5 through 8.
Additionally, examining cumulative absences across all schools where a student was enrolled shows that mobile students were chronically absent at rates that were at least 10 percentage points higher at each grade level when compared to students who did not change schools. This was especially pronounced among mobile grade 8 students, 55 percent of whom were chronically absent in 2022–23.
In 2023, Hispanic public graduates accounted for almost 944,000 students, and are projected to grow to 1.1 million graduates in 2041. Hispanic public high school graduates made up 27 percent of the total public graduating class in 2023, with that number set to increase to 36 percent in 2041.
SOURCE: Knocking at the College Door | 11th Edition | 2024 - WICHE

The total number of high school graduates is expected to peak in 2025 and then decline steadily through 2041.
For the last three editions of Knocking at the College Door, WICHE has projected a peak in the number of high school graduates (between 3.8 and 3.9 million) in 2025. In the years following 2025, individuals born in 2008 and after (when births fell more sharply due to the Great Recession) will begin graduating from high school.
The latest available data confirm while there are periods of projected relative stability (e.g., 2028-29 through 2034-35), the overall national trend is a downward slope to below 3.4 million by 2041. Based on the most recent available data, WICHE projects that 2041 will see about 13% fewer graduates than in 2025, as can be seen in Figure 1.
Figure 1. High school graduates, reported (2009 to 2023) and projected (2024 to 2041)
Graduating Class
Although this report focuses primarily on the number of high school graduates, it is important to recognize that K-12 systems have already been grappling with this peak and subsequent decline as lower enrollments have been making their way through earlier grades. Additionally,
some states and regions are already in the midst of steady declines, a trend that is presented in greater detail in the section of this report focusing on geography. Figure 2 shows the change in the projected number of graduates at four points in time compared to 2023.
As most institutions of higher education and training programs draw from a state or regional pool of graduates, it is essential for postescondary policymakers and practitioners to understand the geographic variation behind these numbers. While the topic is explored in detail in a later section of this report, consider that, compared to 2023 (the last year of reported data), only 12 states and the District of Columbia are projected to see an increase in the total number of graduates in 2041, while 38 states will see a decline. Additionally, while the decline between 2023 and 2041 is projected to be about 10% nationally, seven states will see a decline of greater than 20%. In terms of total numbers, five high-population states (California, Illinois, Michigan, New York, and Pennsylvania) are projected to account for about three-fourths of the expected decline in total projected graduates between 2023 and 2041.
This broad and substantial decline is primarily dependent on two key factors: the number of births in previous years and the rate at which students progress through school and earn a high school diploma. Other factors like net migration and mortality also contribute to the total number of high school graduates.
13 KNOCKING AT THE COLLEGE DOOR: PROJECTIONS OF HIGH SCHOOL GRADUATES
Compared to 2023, 38 states are projected to see a decline in the number of graduates by 2041, as most regions in the U.S. continue to shrink.
rends in the number of high school graduates vary across the country. Given that most colleges and universities draw from a specific geographic area, more detailed information is essential. This section of our report examines the key higher-level trends by region of the country, with additional state-level data and analysis. We then provide an analysis of trends by whether schools are located in or near cities or rural areas. While it is not possible to provide as much detail as is warranted for each state in this report, WICHE's web resources allow users to look at many more dimensions. Regional trends, as well as those for most individual states, have remained stubbornly consistent across several editions of these projections. Figure 17 shows the percent change for each state and region in the number of graduates between the Class of 2023 (the last year of reported data) and the projected number for the Class of 2041.23
Figure 17. Projected percent change in high school graduates, 2023 to 2041
Notes: Total high school graduates include public and private schools. In these projections, the U.S. includes the 50 states and the District of Columbia. Future work will explore projected trends for the U.S. Territories and Freely Associated States.
Graduate Degrees: Risky and Unequal Paths to the Top (2024)
Western Interstate Commission for Higher Education
A Study by the Georgetown University Center on Education and the Workforce Found That Graduate Degrees Offer Numerous Financial and Quality of Life Benefits, but Their Increasing Costs Risks Limiting it’s Benefit to a Small Number of People.
SOURCE: Graduate Degrees: Risky and Unequal Paths to the Top - CEW Georgetown
An advanced degree confers great advantages in the labor market, but not all graduates benefit equally. Cost and debt—the two major risks associated with graduate education—tend to fall more heavily on historically underrepresented racial/ ethnic minority groups and on women. These groups also tend to earn less once employed. These disparities point to powerful structural forces that continue to channel underrepresented racial/ethnic minority groups and women toward fields of study associated with lower-paying occupations.
American Indian/Alaska Native/ Native Hawaiian/Pacific Islander, Black/African American, and Hispanic/Latino adults are underrepresented among graduate degree holders relative to their share of the population.
American Indian/Alaska Native/Native Hawaiian/Pacific Islander (AI/AN/NH/PI), Black/African American, and Hispanic/Latino adults are underrepresented among graduate degree holders relative to their representation in the adult population (ages 25–64) overall. Hispanic/ Latino adults make up 17 percent of the adult population but only 8 percent of graduate degree holders. Similarly, Black/African American adults make up 12 percent of the population but only 9 percent of graduate degree holders, and AI/AN/NH/PI adults are 1 percent of the population but only 0.5 percent of graduate degree holders. By contrast, white adults make up 62 percent of the population compared with 68 percent of graduate degree holders. Asian/Asian American adults make up 7 percent of the population and 13 percent of graduate degree holders (Figure 22).
The differences in graduate degree attainment are driven by well-documented inequalities in our educational system and society, many of which
unfold long before individuals arrive at graduate school. These inequalities begin in the pre-K through 12 system and extend into the college admissions process and undergraduate education. Racial wealth and income gaps contribute to differences in how much families can invest in educational opportunities for their children, including funding their undergraduate and graduate education.117 Family income also helps determine the communities where individuals reside, which then influence the schools their children attend and the social networks they can access.118 These factors—when combined with other elements such as cultural expectations, exposure to crime, and environmental stress—have a cumulative impact on individuals’ life, educational, and career trajectories. They affect students’ likelihood of applying to and enrolling in selective colleges and programs, influence their choices of field of study, and affect their chances of landing high-quality entry-level jobs or internships that can help launch their careers. These disparities can in some cases be mediated by access to culturally responsive counseling, teaching, and guidance. Unfortunately, too many students lack access to these supports.119
The differences in graduate degree attainment are driven by welldocumented inequalities in our educational system and society, many of which unfold long before individuals arrive at graduate school.
117 Board of Governors of the Federal Reserve System, Greater Wealth, Greater Uncertainty, 2023.
118 Chetty et al., Social Capital and Economic Mobility, 2022.
119 For more on racial/ethnic inequalities and how they affect education and career pathways, see Strohl et al., Progress Interrupted, 2024; Carnevale et al., How Racial and Gender Bias Impede Progress toward Good Jobs, 2022; Carnevale et al., The Cost of Economic and Racial Injustice in Postsecondary Education, 2021; Carnevale et al., If Not Now, When?, 2021; Carnevale et al., Born to Win, Schooled to Lose, 2019; Carnevale et al., The Unequal Race for Good Jobs, 2019.
Hispanic/Latino adults are underrepresented among graduate degree holders relative to both bachelor’s degree holders and the overall population.
POPULATION DISTRIBUTION BY RACE/ETHNICITY, AGES 25–64
AI/AN/NH/PI
Asian/Asian American
Black/African American
Hispanic/Latino
Multiracial
White
Georgetown
Note: AI=American Indian, AN=Alaska Native, NH=Native Hawaiian, and PI=Pacific Islander. Values may not sum to 100 percent due to rounding.
Moreover, undergraduate enrollments at selective colleges and universities do not reflect the true diversity of the college-age population in the United States. Hispanic/Latino, Black/African American, and American Indian/Alaska Native students collectively compose 37 percent of the college-age population, but just 21 percent of first-time enrollments at selective colleges. White and Asian American/ Pacific Islander students, meanwhile, make up
60 percent of the college-age population, but 73 percent of enrollments at selective institutions.120
Further inequalities emerge in the types of graduate institutions that different student groups attend and how much debt they incur in pursuit of their graduate degrees. Black/African American graduate students disproportionately enroll in private, forprofit universities relative to white, Asian/Asian American, and Hispanic/Latino graduate students.121
120 Strohl et al., Progress Interrupted, 2024.
121 Monarrez and Matsudaira, U.S. Department of Education: Trends in Federal Student Loans for Graduate School, 2023.
Graduate Degrees: Risky and Unequal Paths to the Top
Compared to white graduate students, Black/African American and Hispanic/Latino graduate students are also more likely to take on federal student loans to pay for their graduate studies, have higher median graduate debt, and are more likely to have undergraduate student debt as well.122 All these factors may deter some students from marginalized racial/ethnic groups from pursuing graduate education.
Nor does attaining a graduate degree lead to equal earnings in the labor market. While Asian/ Asian American adults and white adults with graduate degrees earn more than $100,000 per year at the median ($117,000 and $101,000, respectively),
Black/African American and Hispanic/Latino graduate students are more likely to take on federal student loans to pay for their graduate studies, have higher median graduate debt, and are more likely to have undergraduate student debt.
both American Indian/Alaska Native adults and Hispanic/Latino adults earn $83,000 annually at the median (Figure 23).
The median earnings among American Indian/Alaska Native and Hispanic/ Latino workers with graduate degrees are $18,000 below the median earnings of white workers with graduate degrees.
MEDIAN EARNINGS OF GRADUATE DEGREE HOLDERS
Source: Georgetown University Center on Education and the Workforce analysis of data from the US Census Bureau and Bureau of Labor Statistics, Current Population Survey, 2018–22 (pooled).
Note: AI=American Indian, AN=Alaska Native, NH=Native Hawaiian, and PI=Pacific Islander. Earnings are for full-time, full-year workers ages 25–64 with graduate degrees and are inflation-adjusted to 2022 dollars and rounded to the nearest thousand.
122 Miller, Graduate School Debt, 2020.
SOURCE: allineducation.org/mapa
Arizona stands at a critical crossroads. As one of the most linguistically diverse states in the nation, with over 90 languages spoken across our state, our Multilingual Learners (MLs) represent a vital yet underserved segment of our student population. Multilingual Learners are students who are developing proficiency in English while maintaining or acquiring fluency in one or more other languages. This term encompasses English Learners (ELs)—students whose primary language is not English and who require additional support to develop English proficiency—as well as students who are bilingual or multilingual from various linguistic and cultural backgrounds. These students possess extraordinary potential, yet systemic barriers and outdated policies continue to stifle their success. If we fail to act, Arizona risks perpetuating cycles of inequity and missing out on the immense economic and social benefits of a multilingual and diverse workforce.
The data in this report reveals stark disparities. Only 6% of ELs meet 3rd-grade reading proficiency, and a mere 4% are proficient in 8th-grade math. By the time they reach high school, EL students graduate at a rate of just 74%, compared to 83% of white students. These gaps are not reflective of a lack of talent or potential but of a system designed without multilingual learners in mind.
Moreover, this disparity extends beyond the classroom. Latino students account for 48% of Arizona’s PK-12 population, yet only 18% of teachers and school administrators share their cultural or linguistic backgrounds. This gap in representation deprives students of the cultural and linguistic alignment that is proven to enhance learning outcomes. We must ensure that our teaching workforce reflects the diversity of the students it serves.

At ALL In Education, we believe the solutions lie within our communities. Through initiatives like the Parent Educator Academy, Adelante Fellowship, and LISTO Academy, we are equipping parents, educators, and emerging leaders with the tools to advocate for multilingual learners and dismantle systemic barriers. Our programs have already empowered participants to secure leadership roles in schools, non-profits, and communities across Arizona. These are more than individual success stories—they represent our mission in action.
The stakes extend far beyond education. A well-educated multilingual workforce is a critical driver of economic growth. Arizona’s proximity to Mexico, its reliance on tourism, and its growing trade sectors underscore the need for workers fluent in multiple languages. Investing in multilingual learners is not just about equity; it’s a strategic imperative for Arizona’s future competitiveness.
This report is a call to action. To business leaders, policymakers, and educators: we must act now to ensure our multilingual learners have the opportunities they deserve. It’s time to invest in culturally responsive education, increase representation in our schools, and prepare students to thrive in a global economy.
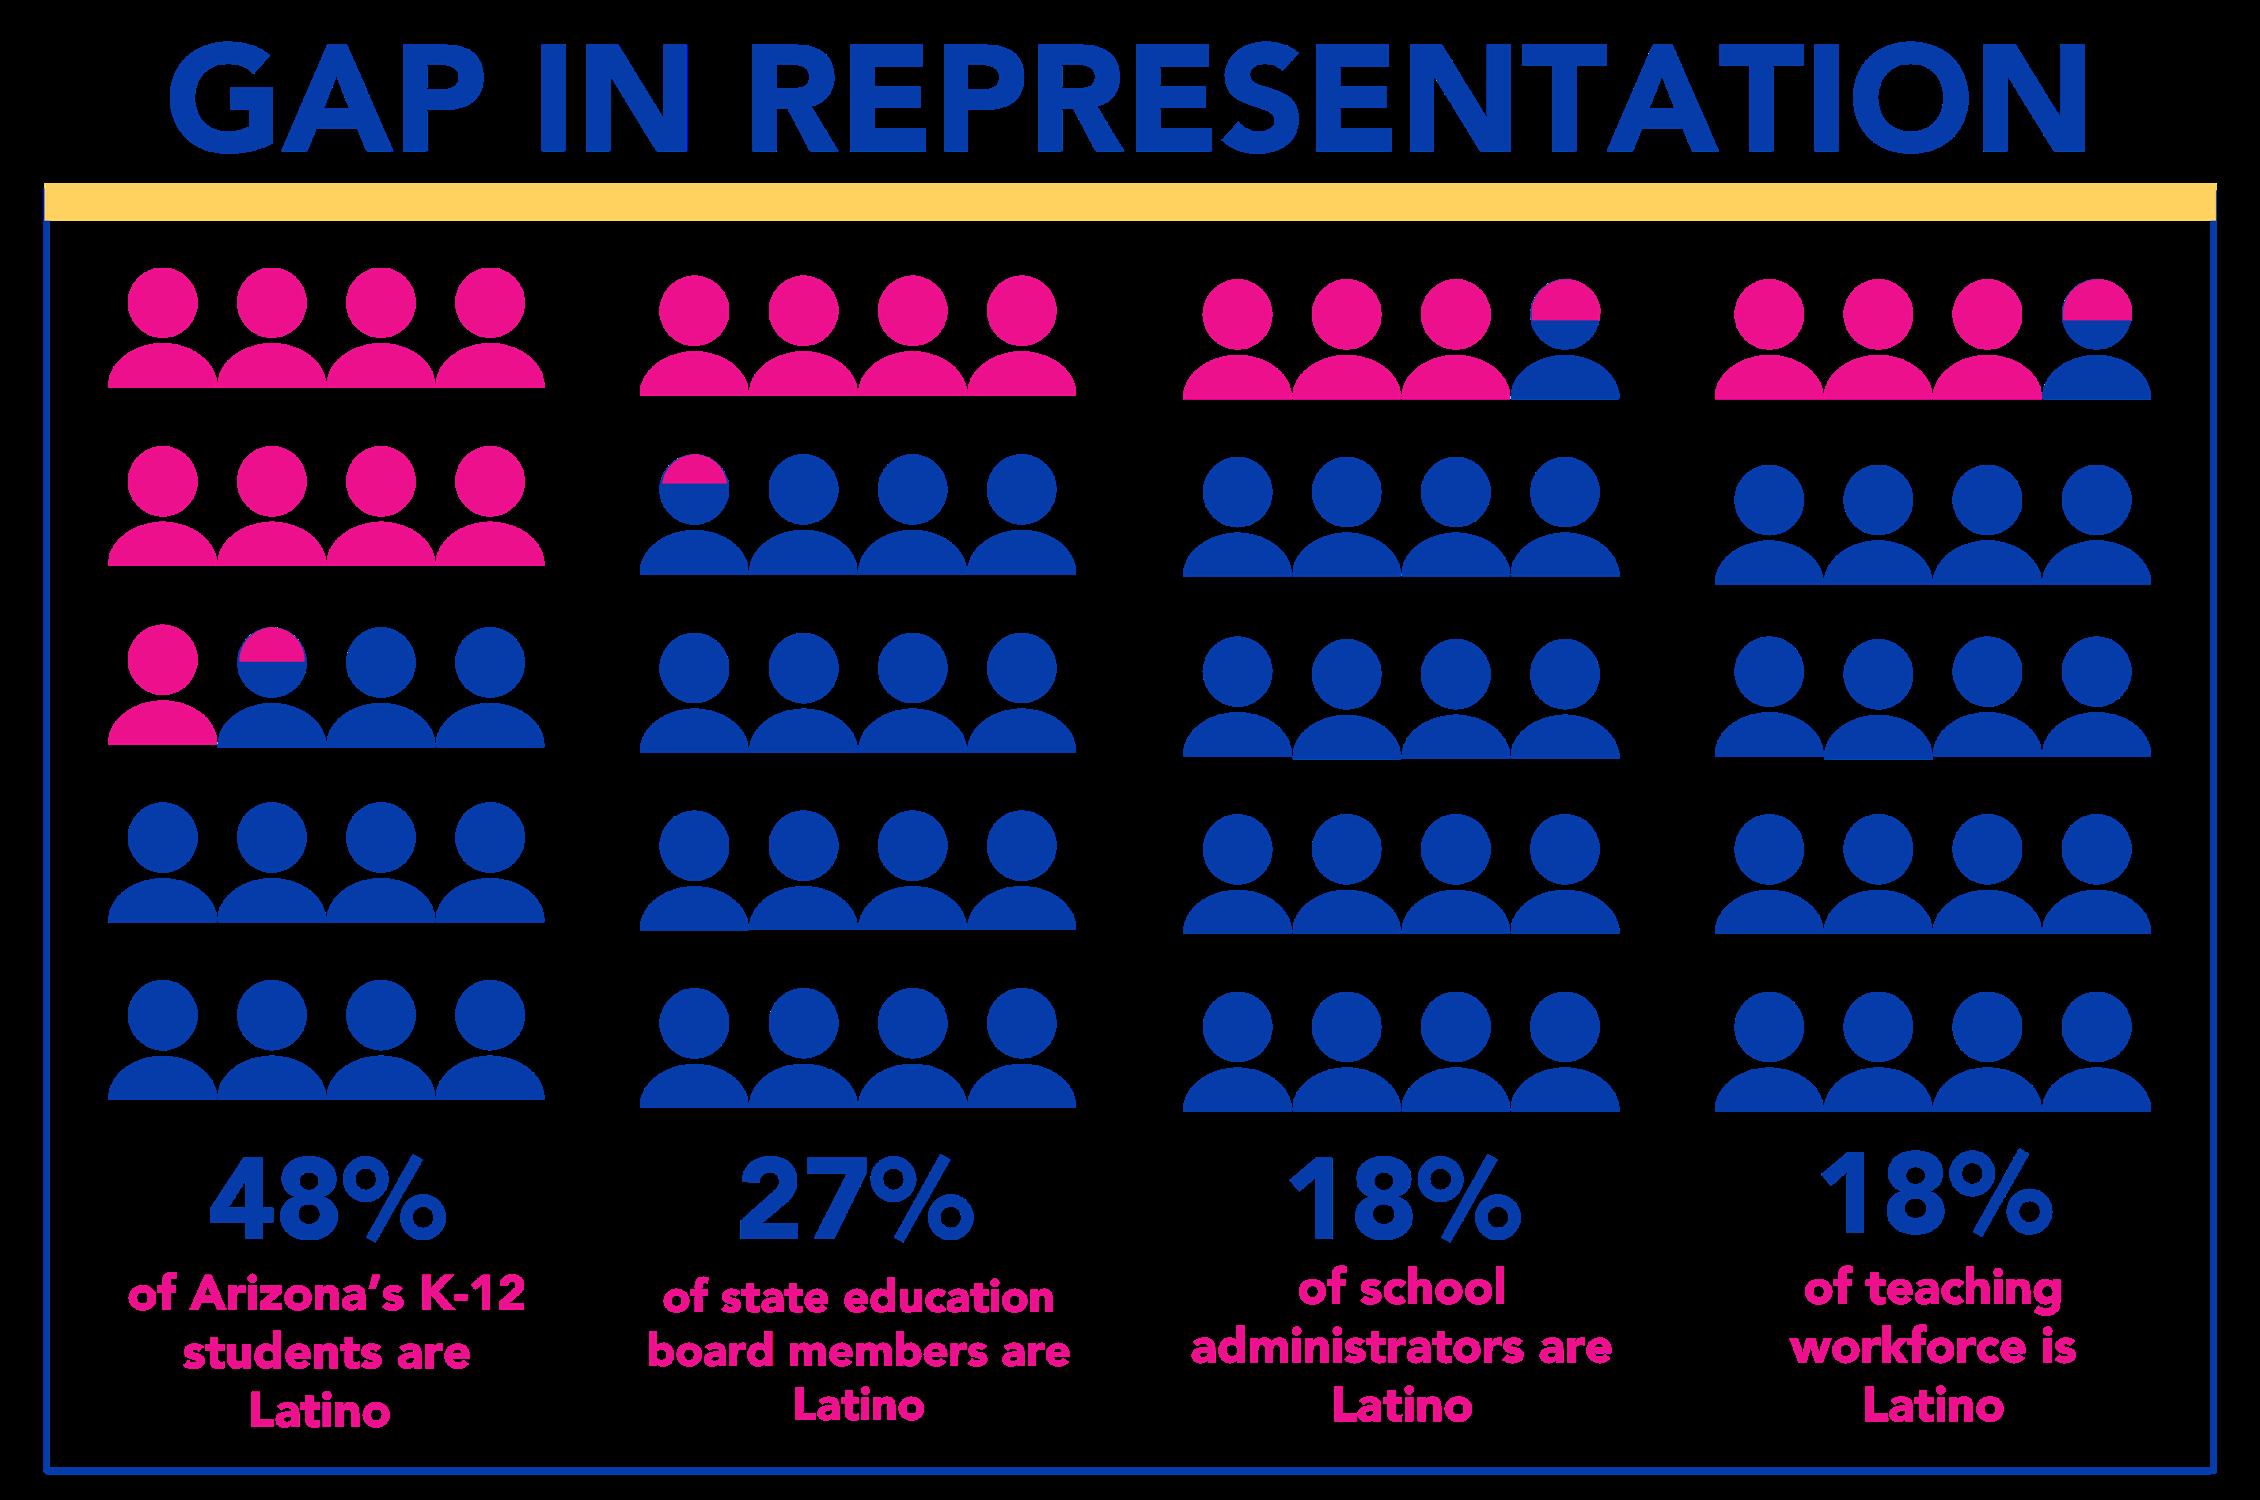
Arizona has the talent and potential to lead, but it requires bold, values-driven leadership. Together, we can create a state where every student, regardless of their background or language, has the opportunity to succeed. Let’s build systems that celebrate multilingualism, reflect our communities, and ensure that Arizona is a place where all can thrive.
Page 3

Over the past five years, proficiency data for English Learners (ELs) in Arizona has highlighted a critical and persistent concern for ALL In Education. The data reveals that ELs have long been underserved, under-resourced, and under-valued in our education system. This clear indication drives ALL In Education’s unwavering commitment not only to continue highlighting these numbers but also to amplify the stories of a community rich in talent, potential, and deserving of investment. There is immense opportunity within this community. As a diverse pool of talent, culture, and knowledge, we must ensure that Arizona stops creating barriers and challenges that hinder their academic success. We are firm in our core belief that every child deserves access to a high quality education, and English Learners are no exception.
Our commitment is rooted in ensuring that Arizona recognizes ELs as the future of our state, country, and world. In an increasingly globalized, interconnected, multicultural, and multilingual society, it is imperative that we shift the narrative and mindset to fully embrace, promote and invest in multilingualism as a vital asset to our state’s economic future. It is time to welcome and uplift this community for the prosperity of all.
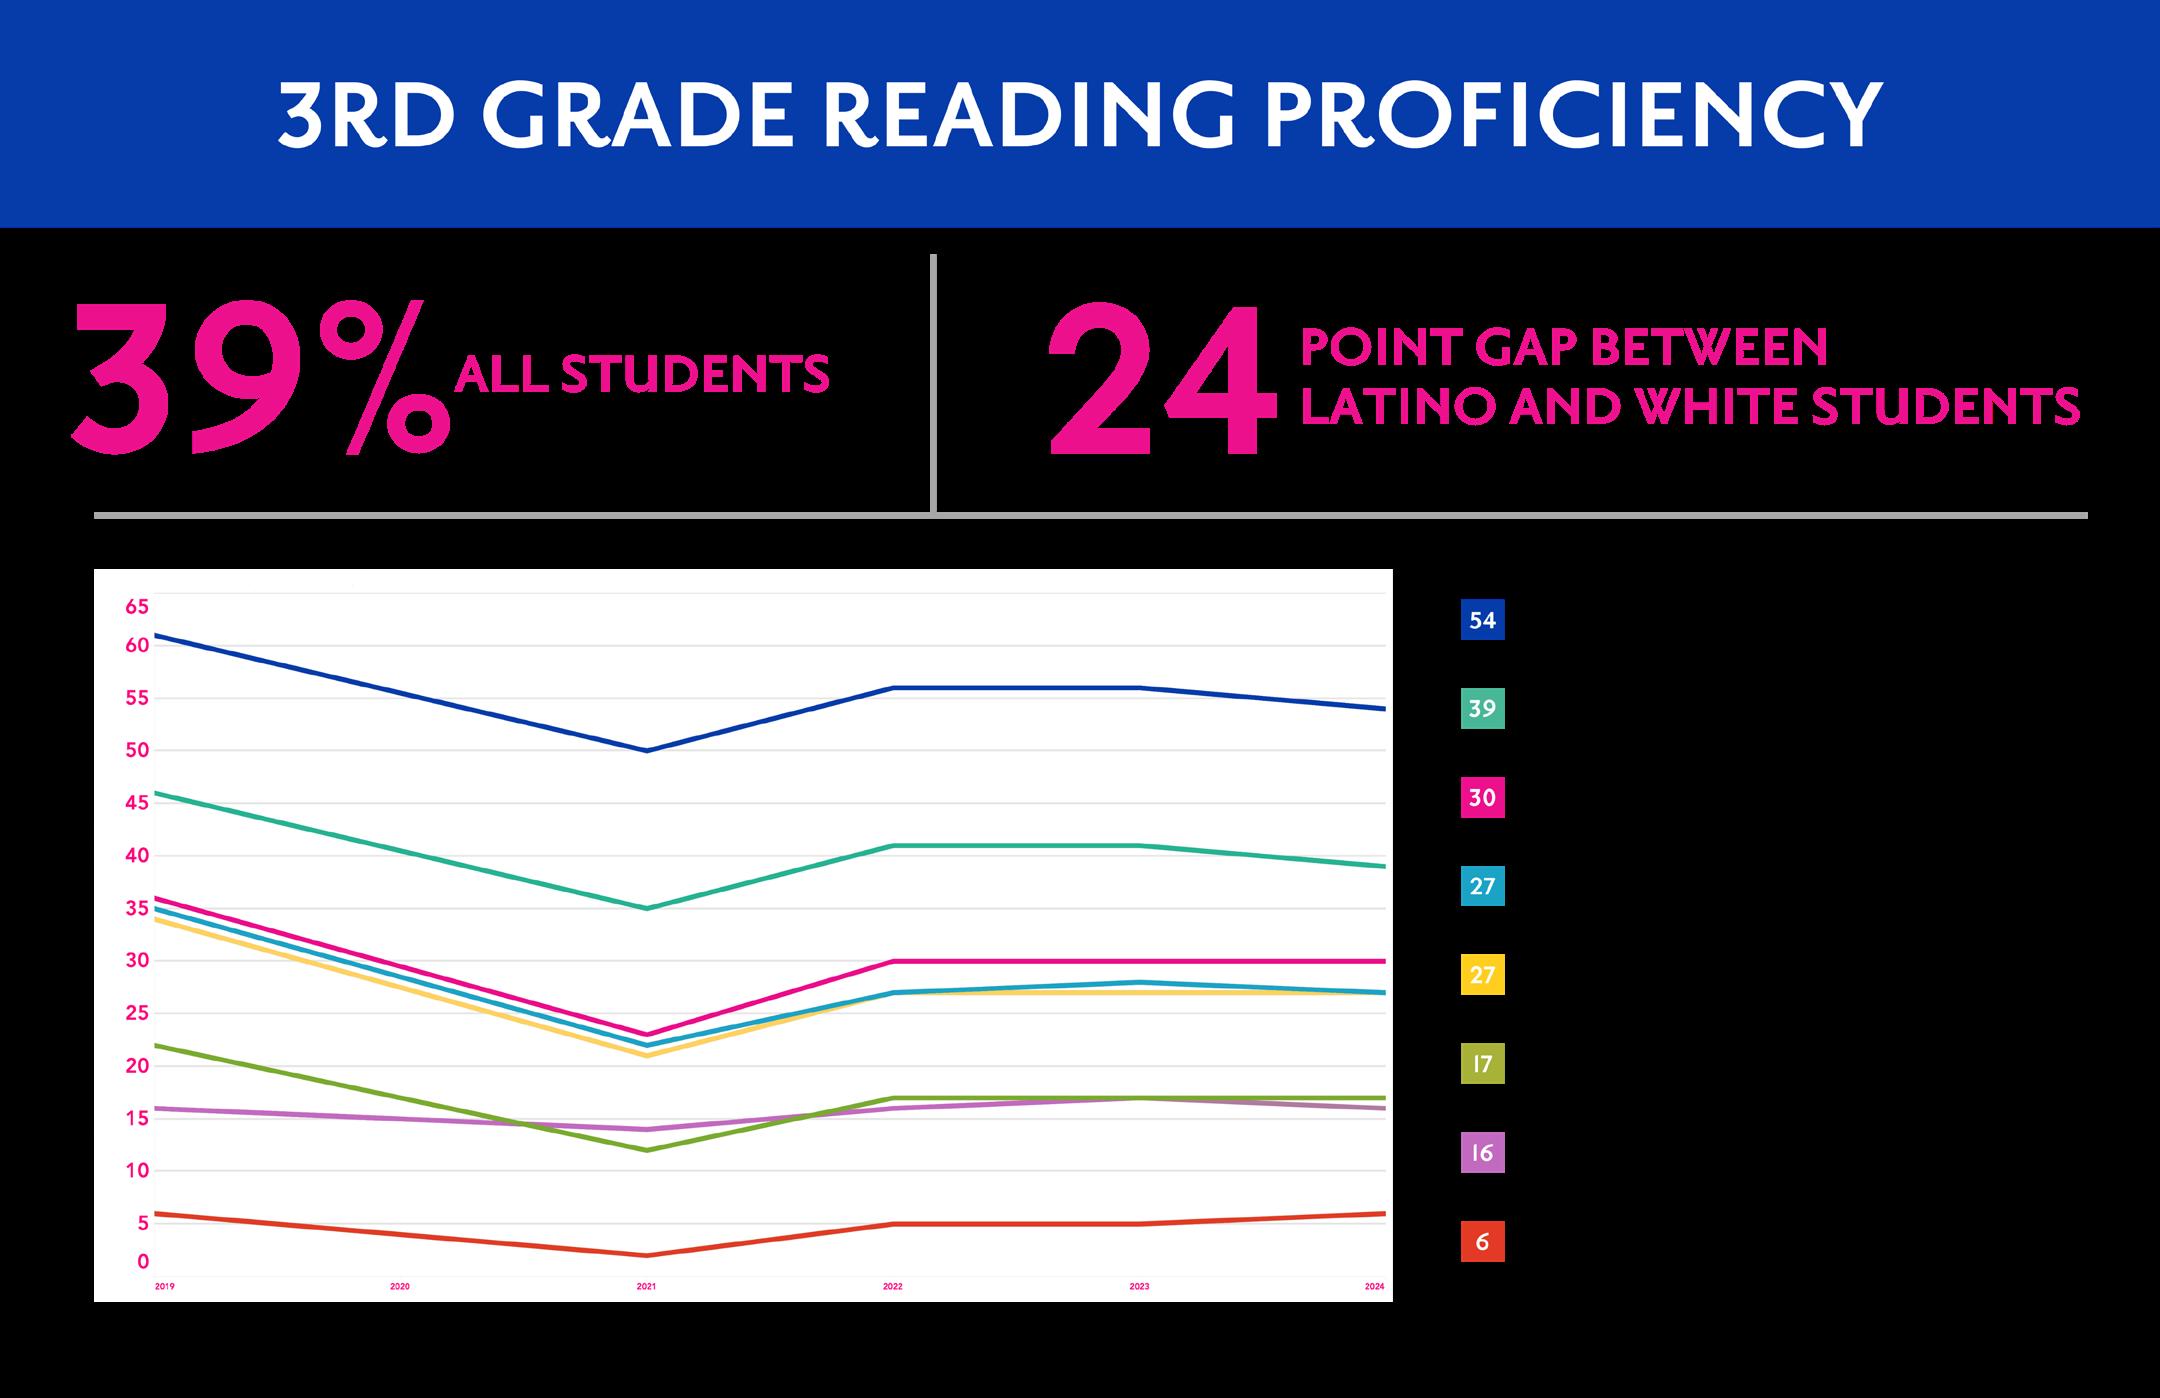
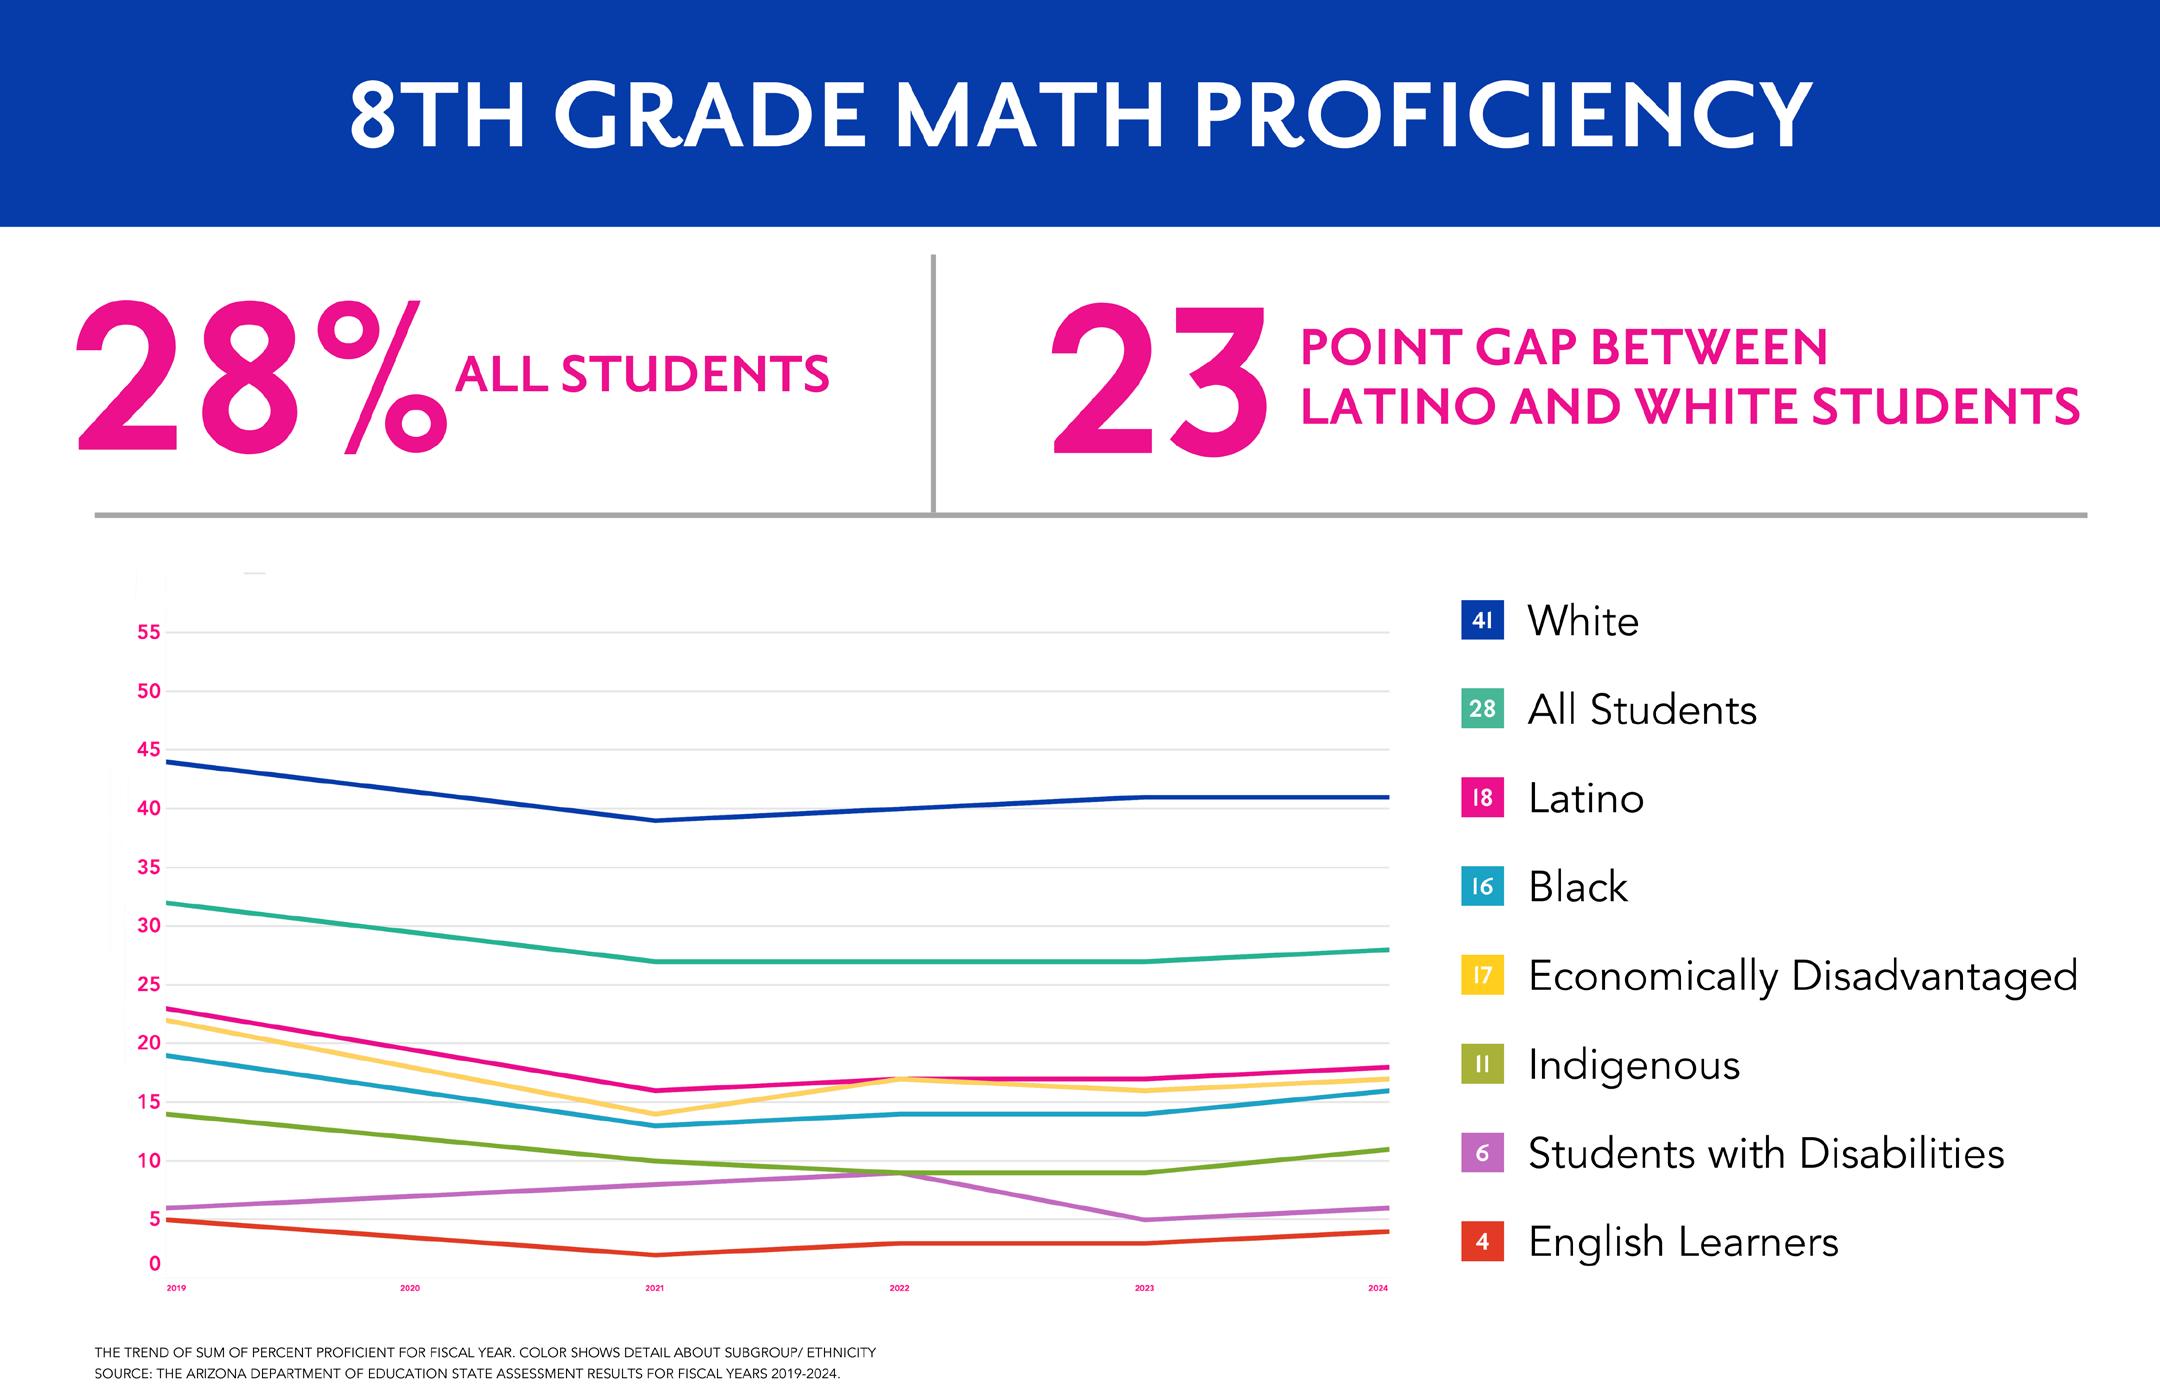
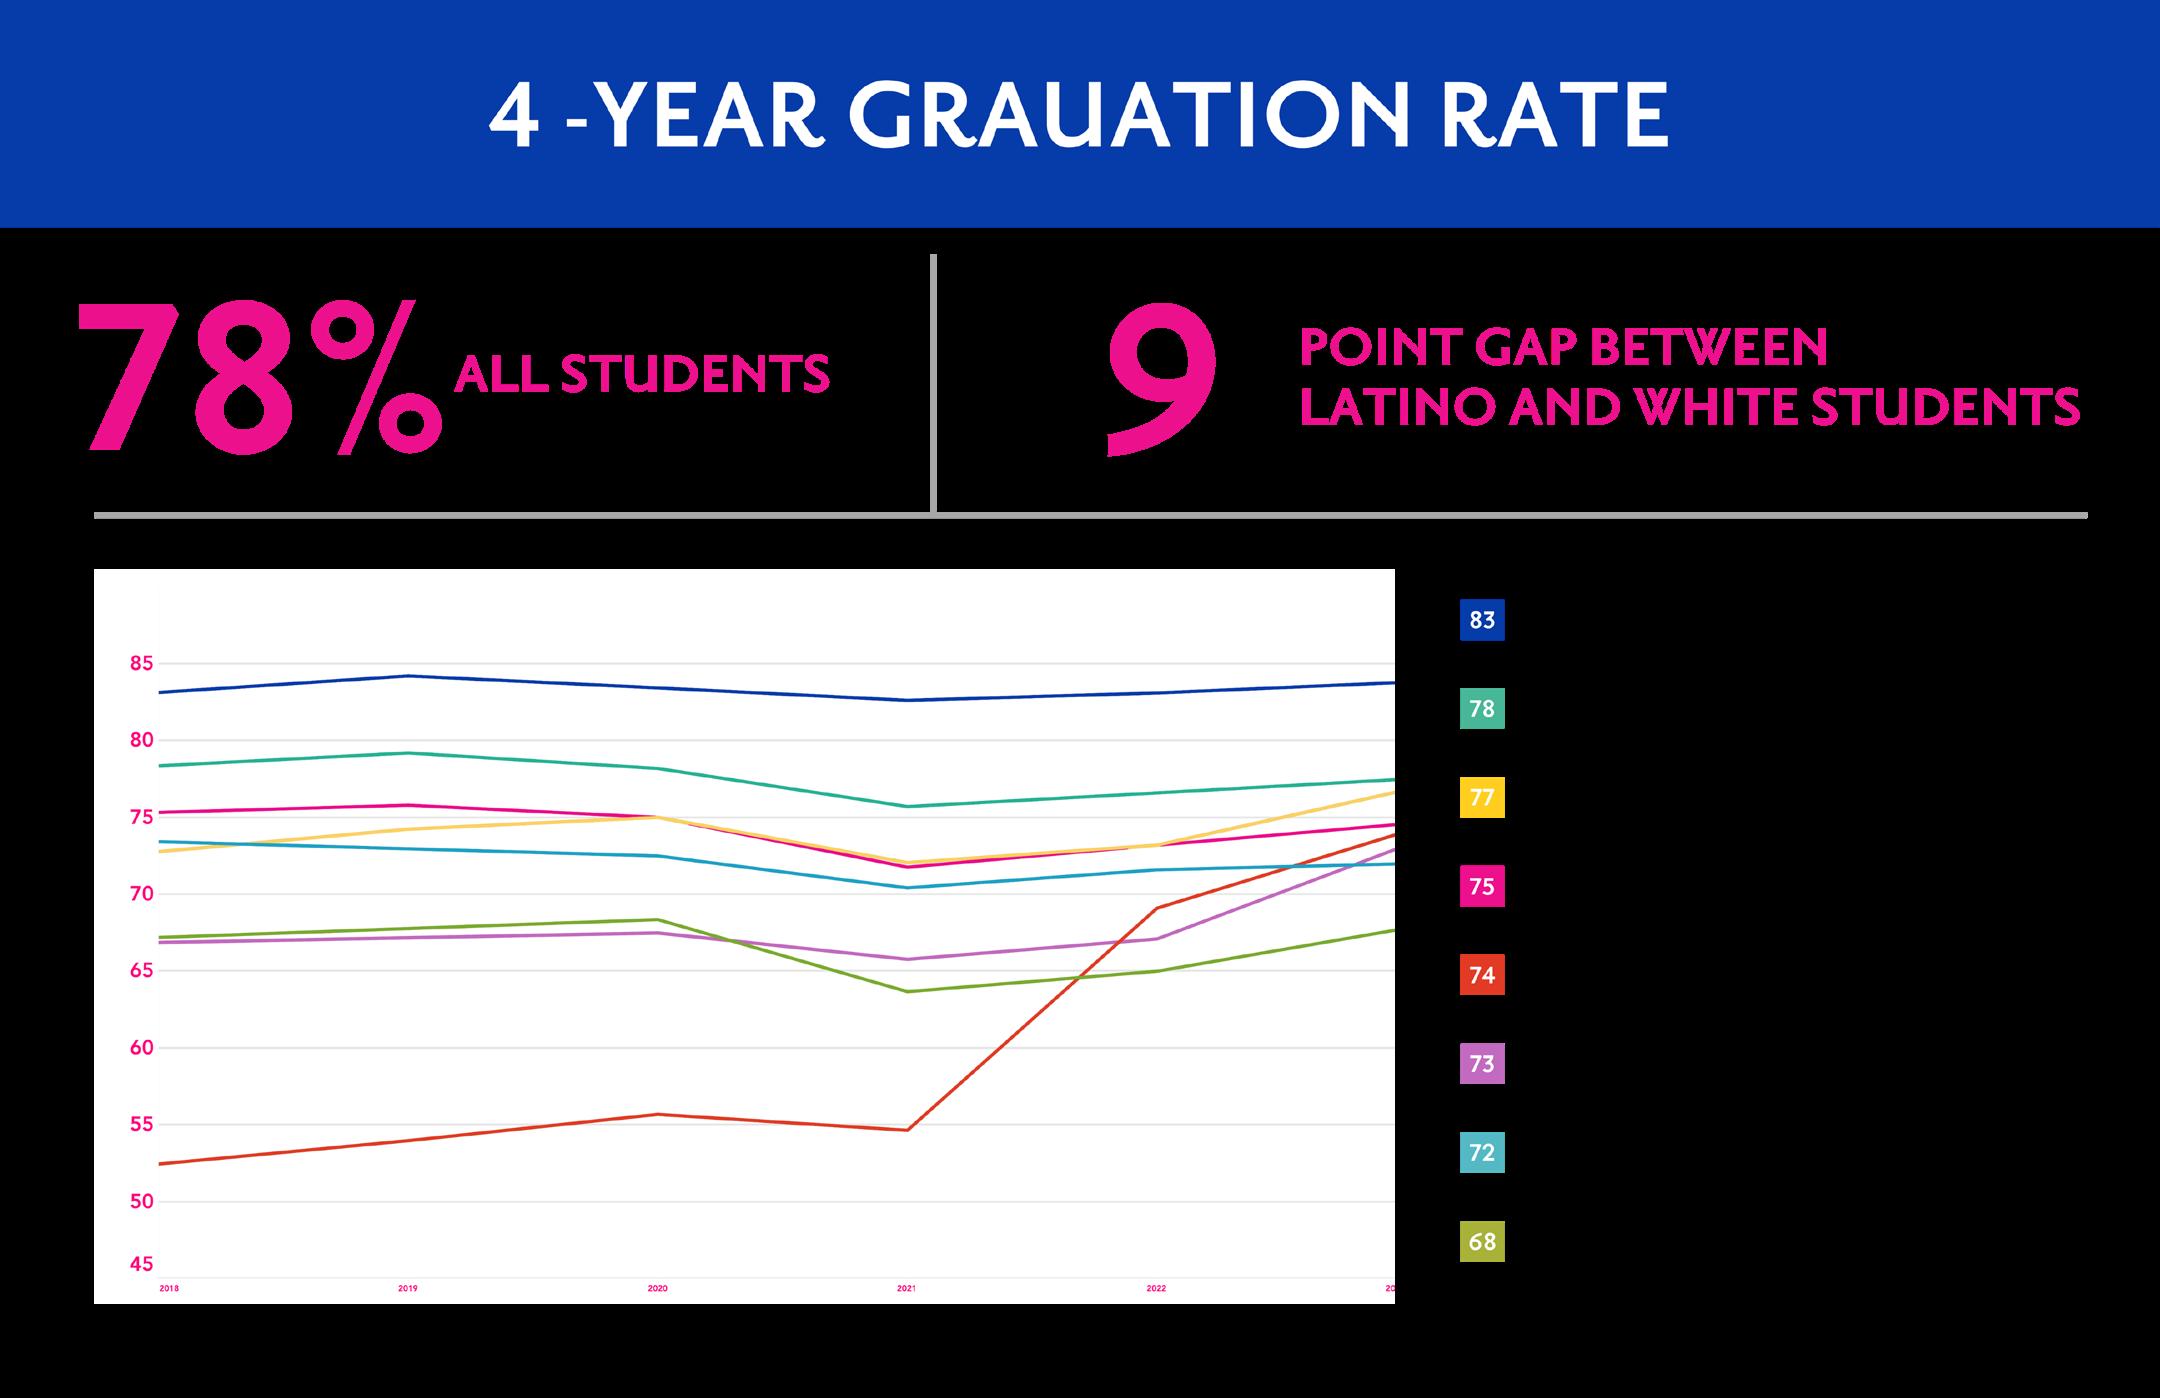
In Arizona, multilingual learners account for approximately 12% of the total student population With a statewide enrollment of about 1.1 million K-12 students, this translates to roughly 132,000 multilingual learners (Arizona Department of Education, n.d.). Their success is critical to Arizona’s educational and economic future. However, outdated policies like Proposition 203 have historically hindered these students by limiting the use of their native languages, contributing to poor academic outcomes. To unlock the full benefits of multilingualism, schools must provide targeted and culturally responsive support that recognizes linguistic diversity as an asset, not a deficit.
The failure of Structured English Immersion (SEI) programs in Arizona is evident in the persistently low proficiency rates for English Learner (EL) students, with only 6% reading proficiently at a 3rd grade level compared to 39% for students statewide and 54% of white students (Arizona Department of Education, 2024). Arizona’s linguistically diverse student population speaks over 90 languages statewide - with Spanish, Vietnamese, Navajo, and Somali being the top spoken languages outside of English (Arizona Department of Education, 2018).
The obstacles confronting Multilingual Learners go beyond access to quality dual-language programs. Legacies of redlining and economic segregation have concentrated Latino students in underfunded schools with limited resources and less experienced teachers. These schools often lack the infrastructure to support effective dual-language education, further perpetuating the opportunity gap (Gandara & Orfield, 2012). Addressing these systemic challenges requires a comprehensive, equity-driven approach.
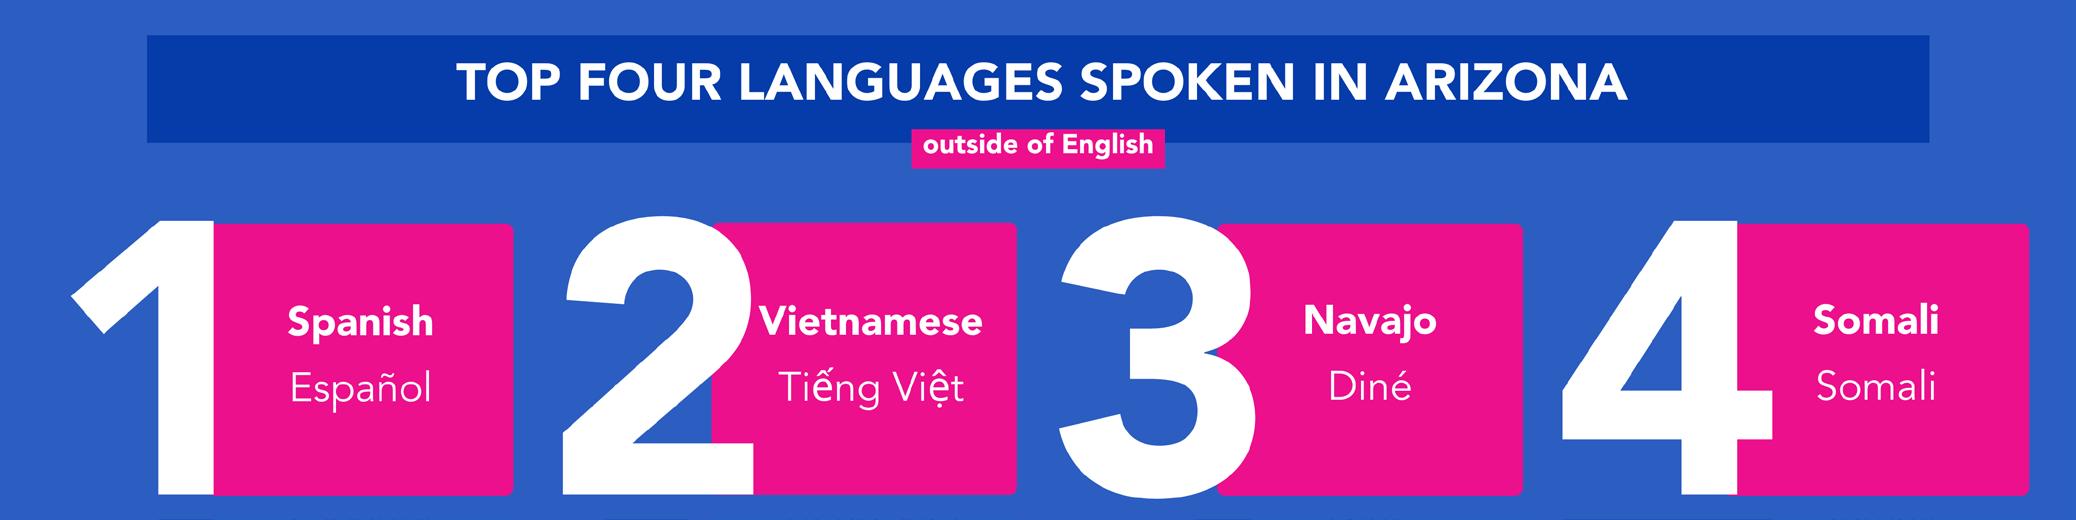
Dual-language programs offer a proven solution, fostering bilingualism and academic excellence. Students in dual-language immersion programs outperform their peers academically, gaining up to nine months of additional learning in reading by eighth grade (RAND Corporation, 2019). Moreover, dual-language education enhances cognitive skills like problem-solving and adaptability, while promoting social cohesion and multicultural understanding—vital for Arizona’s diverse communities (New American Economy, 2017).

Caring, giving and making things better. It all starts by working together. Join us in celebrating the power of community.
INTERACTIVE DASHBOARD
Affordable Quality Housing Insights
IN FOCUS
Real Estate and Home Improvement
This Special Feature courtesy of Univision Communications looks at Hispanics and real estate in Phoenix and Tucson and homeownership and home improvement, which include HVAC repairs and furniture/ mattress purchases
MORE THAN A STAY: How Homesharing is Empowering Arizona’s Hispanic Communities
BY ORLANDO CAZAREZ
EXCERPT
Improving America's Housing 2025
In 2023, the Hispanic homeownership rate was 49.5 percent, the median home value for Hispanic homeowners was $340,000 and the median home equity for Hispanic owners was $135,000.


COURTESY OF
• IN 2021, NEARLY 1/5 OF HISPANICS IN THE U.S. DID NOT HAVE HEALTH INSURANCE COVERAGE
THE PERCENTAGE OF UNINSURED HISPANICS AGED 18–64 ROSE TO MORE THAN THREE TIMES THAT OF NON-HISPANICS BY 2021


MEDICARE/CHIP IS THE LARGEST SOURCE OF COVERAGE FOR LATINO KIDS IN ARIZONA
NUMBER & RATE OF UNINSURED LATINO CHILDREN BY ARIZONA COUNTY (2018)
HISPANICS AGED 18–29 FIND THE PROCESS TO GET MEDICAL CARE HARDER TO UNDERSTAND THAN OTHER HISPANIC AGE GROUPS
ABOUT A THIRD OF HISPANIC ADULTS SAY THEY WOULD PREFER A HEALTH CARE PROVIDER WHO SPEAKS SPANISH
A GREATER PERCENTAGE OF HISPANIC ADULTS 18+ VS. NON-HISPANICS DID NOT GET NEEDED MEDICAL CARE DUE TO COST
• A GREATER PERCENTAGE OF HISPANIC ADULTS 18+ VS. NON-HISPANICS DID NOT TAKE
• MEDICATION AS PRESCRIBED TO SAVE MONEY
• A GREATER PERCENTAGE OF HISPANIC ADULTS 18+ VS. NON-HISPANICS WERE OBESE
• LATINO DIABETES RATES HAVE REMAINED CONSTANT OVER THE LAST DECADE IN ARIZONA (2011–2021)
• MENTAL HEALTH IN ARIZONA (FEBRUARY 2021)

SINCE 2020, ALL RACIAL/ETHNIC GROUPS HAVE EXPERIENCED HIGHER RATES OF MENTAL DISTRESS
53% OF HISPANIC ADULTS SAY HEALTH RISKS IN JOBS ARE MAJOR REASON FOR GENERALLY WORSE HEALTH OUTCOMES
BY ORLANDO CAZAREZ
• IN 2021, NEARLY 1/5 OF HISPANICS IN THE U.S. DID NOT HAVE HEALTH INSURANCE COVERAGE
• THE PERCENTAGE OF UNINSURED HISPANICS AGED 18–64 ROSE TO MORE THAN THREE TIMES THAT OF NON-HISPANICS BY 2021
Airbnb got its start during a major recession as a way to help our founders pay their rent. More than 15 years since our founding, over 2 billion guests have stayed in an Airbnb and more than 40% of hosts say the income from hosting allows them to stay in their home. Today, the typical host shares one home on Airbnb, helping to provide affordable accommodation options for guests, disperse travel to new destinations and generate billions in economic activity and tax revenue for communities.
• MEDICARE/CHIP IS THE LARGEST SOURCE OF COVERAGE FOR LATINO KIDS IN ARIZONA
• NUMBER & RATE OF UNINSURED LATINO CHILDREN BY ARIZONA COUNTY (2018)
• HISPANICS AGED 18–29 FIND THE PROCESS TO GET MEDICAL CARE HARDER TO UNDERSTAND THAN OTHER HISPANIC AGE GROUPS
• ABOUT A THIRD OF HISPANIC ADULTS SAY THEY WOULD PREFER A HEALTH CARE PROVIDER WHO SPEAKS SPANISH
• A GREATER PERCENTAGE OF HISPANIC ADULTS 18+ VS. NON-HISPANICS DID NOT GET NEEDED MEDICAL CARE DUE TO COST
In Arizona, Airbnb is an important economic tool for residents who rely on sharing their home to earn extra income. In 2024 alone, Airbnb hosts in Arizona collectively earned an estimated $900 million from homesharing. This is increasingly important amidst the state’s rising costs of living and growing income gap, which is felt harder by Hispanic Arizonans. Hosting on Airbnb has also become a vital lifeline for many in the Hispanic community. Notably, since 2019, the number of Spanish-speaking Airbnb hosts in Arizona has doubled, supporting the livelihood of more families while contributing to income equality within the Hispanic community.
• A GREATER PERCENTAGE OF HISPANIC ADULTS 18+ VS. NON-HISPANICS DID NOT TAKE

• MEDICATION AS PRESCRIBED TO SAVE MONEY
• A GREATER PERCENTAGE OF HISPANIC ADULTS 18+ VS. NON-HISPANICS WERE OBESE
A Family Project to Fulfill a Dream:
• LATINO DIABETES RATES HAVE REMAINED CONSTANT OVER THE LAST DECADE IN ARIZONA (2011–2021)
• MENTAL HEALTH IN ARIZONA (FEBRUARY 2021)
• SINCE 2020, ALL RACIAL/ETHNIC GROUPS HAVE EXPERIENCED HIGHER RATES OF MENTAL DISTRESS
“When we found our humble 1953 Craftsman-style casita in Flagstaff’s Sunnyside neighborhood, our hosting dream was born. It needed work, but with Irma’s design sense, my skills with tools and help from our kids' selecting books and games to fill the home, we poured ourselves into the project.
• 53% OF HISPANIC ADULTS SAY HEALTH RISKS IN JOBS ARE MAJOR REASON FOR GENERALLY WORSE HEALTH OUTCOMES
Two of these hosts are Irma and Orlando Cazarez. Traveling with three growing kids, the couple always enjoyed staying in spaces that felt like home and reflected the character of the communities they visited. With over 40 years of combined experience in real estate, they had dreamed of owning an Airbnb of their own, offering the same thoughtful touches and local flair to visitors in their community. That dream came true in 2019.
This was more than an investment. It was the beginning of a legacy for our children and a welcoming space for the thousands of guests we hoped to host. We filled it with local art, stocked it with amenities we had sought during our own travels, and created a personalized Instagram page to engage with our guests and highlight the local favorite spots we love to support. Irma is an NAU alum, and our oldest son had set his sights on becoming a Lumberjack, so planting roots in Flagstaff felt right.
Hosting has changed our lives. We have built equity and supported local businesses through the economic ripple
effect of tourism. We even helped friends become hosts themselves. Most meaningfully, our kids have been involved every step of the way. They have learned the value of hard work, hospitality and building something together.
We are proud to offer a place where guests can experience moments that matter. From NAU graduations, visits to the Grand Canyon or ski trips to Snowbowl, our guests have created incredible memories in our home, and we are grateful to Airbnb for making hosting accessible to families like ours.”
—Irma and Orlando Cazarez
• IN 2021, NEARLY 1/5 OF HISPANICS IN THE U.S. DID NOT HAVE HEALTH INSURANCE COVERAGE
ECONOMIC BENEFITS TO ARIZONA HOMEOWNERS
• THE PERCENTAGE OF UNINSURED HISPANICS AGED 18–64 ROSE TO MORE THAN THREE TIMES THAT OF NON-HISPANICS BY 2021
75%
Percent of hosts who confirm hosting on Airbnb is not their primary occupation
• MEDICARE/CHIP IS THE LARGEST SOURCE OF COVERAGE FOR LATINO KIDS IN ARIZONA
• NUMBER & RATE OF UNINSURED LATINO CHILDREN BY ARIZONA COUNTY (2018)
Beyond the benefits to individual hosts, Airbnb helps bolster tourism economies by driving guest spending locally. According to Airbnb’s 2024 Economic Impact Report, Airbnb and hosts helped fuel more than $90 billion in economic activity for U.S. cities and small businesses in 2024. In Arizona, Airbnb helped contribute about $3.5 billion in economic activity last year, including generating approximately $867 million in tax revenue and supporting over 42,000 estimated jobs. With the typical Airbnb guest in Arizona spending an estimated $830 per trip at local businesses, Airbnb helps more communities benefit from tourism—including in neighborhoods without hotels that might otherwise miss out on tourism dollars.
• HISPANICS AGED 18–29 FIND THE PROCESS TO GET MEDICAL CARE HARDER TO UNDERSTAND THAN OTHER HISPANIC AGE GROUPS
$14,200 Typical earnings for hosts per year
• ABOUT A THIRD OF HISPANIC ADULTS SAY THEY WOULD PREFER A HEALTH CARE PROVIDER WHO SPEAKS SPANISH
38%
Percent of hosts who say hosting allows them to keep up with cost of living
• A GREATER PERCENTAGE OF HISPANIC ADULTS 18+ VS. NON-HISPANICS DID NOT GET NEEDED MEDICAL CARE DUE TO COST
40%
Percent of hosts who say Airbnb has helped them stay in their home
• A GREATER PERCENTAGE OF HISPANIC ADULTS 18+ VS. NON-HISPANICS DID NOT TAKE
• MEDICATION AS PRESCRIBED TO SAVE MONEY
ESTIMATED ECONOMIC BENEFITS TO ARIZONA’S COMMUNITIES
• A GREATER PERCENTAGE OF HISPANIC ADULTS 18+ VS. NON-HISPANICS WERE OBESE
• LATINO DIABETES RATES HAVE REMAINED CONSTANT OVER THE LAST DECADE IN ARIZONA (2011–2021)
Not only does Airbnb boost Arizona’s economy, but it provides affordable accommodation options to everyday Arizonans. For
• MENTAL HEALTH IN ARIZONA (FEBRUARY 2021)
• SINCE 2020, ALL RACIAL/ETHNIC GROUPS HAVE EXPERIENCED HIGHER RATES OF
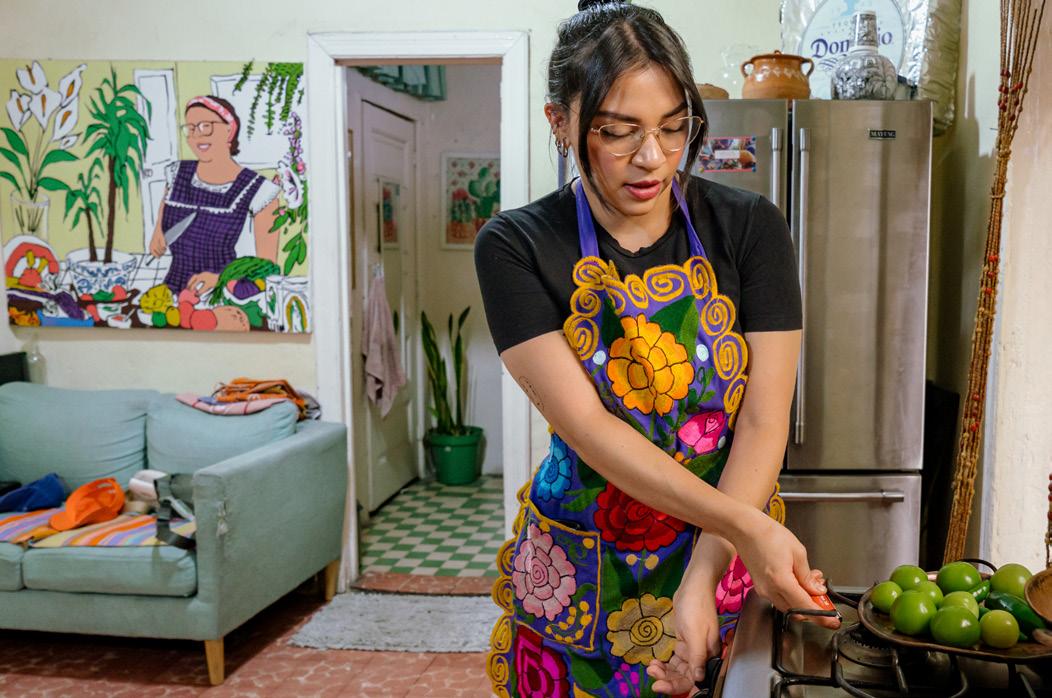
$3.4 Overall economic impact BILLION $867 MILLION
Total tax revenue
53% OF HISPANIC ADULTS SAY HEALTH RISKS IN JOBS ARE MAJOR REASON FOR GENERALLY WORSE HEALTH OUTCOMES
Estimated jobs supported 42,000 $2 BILLION
Labor income
$830
Labor income
MORE THAN A STAY: HOW HOMESHARING IS EMPOWERING ARIZONA’S HISPANIC COMMUNITIES
many of Arizona’s Hispanic residents, travel is becoming a growing priority. In Phoenix, for example, 57% of Latinos report that they plan to travel more in 2025 according to Airbnb’s 2024 US Latin and Hispanic Traveler Report. What’s more, Airbnb provides affordable lodging options for exploring their own backyard with nearly 30% of Arizona guest check-ins coming from in-state guests in 2024.
• IN 2021, NEARLY 1/5 OF HISPANICS IN THE U.S. DID NOT HAVE HEALTH INSURANCE COVERAGE
• THE PERCENTAGE OF UNINSURED HISPANICS AGED 18–64 ROSE TO MORE THAN THREE TIMES THAT OF NON-HISPANICS BY 2021
In times of crisis, homesharing can also provide critical support. Earlier this year, when devastating wildfires struck Los Angeles, Airbnb.org— a nonprofit founded by Airbnb in 2020 to provide emergency housing to people in times of crisis —partnered with 211 LA and has provided free stays to more than 24,000 people impacted by the fires to date. Hosts from across the west, including many in Arizona, stepped up to help house displaced residents for free or at a discount. This generosity is a powerful reminder of what’s possible when Arizonans share their homes with visitors, supporting their families, neighbors and communities in the moments that matter most.
• MEDICARE/CHIP IS THE LARGEST SOURCE OF COVERAGE FOR LATINO KIDS IN ARIZONA
• NUMBER & RATE OF UNINSURED LATINO CHILDREN BY ARIZONA COUNTY (2018)
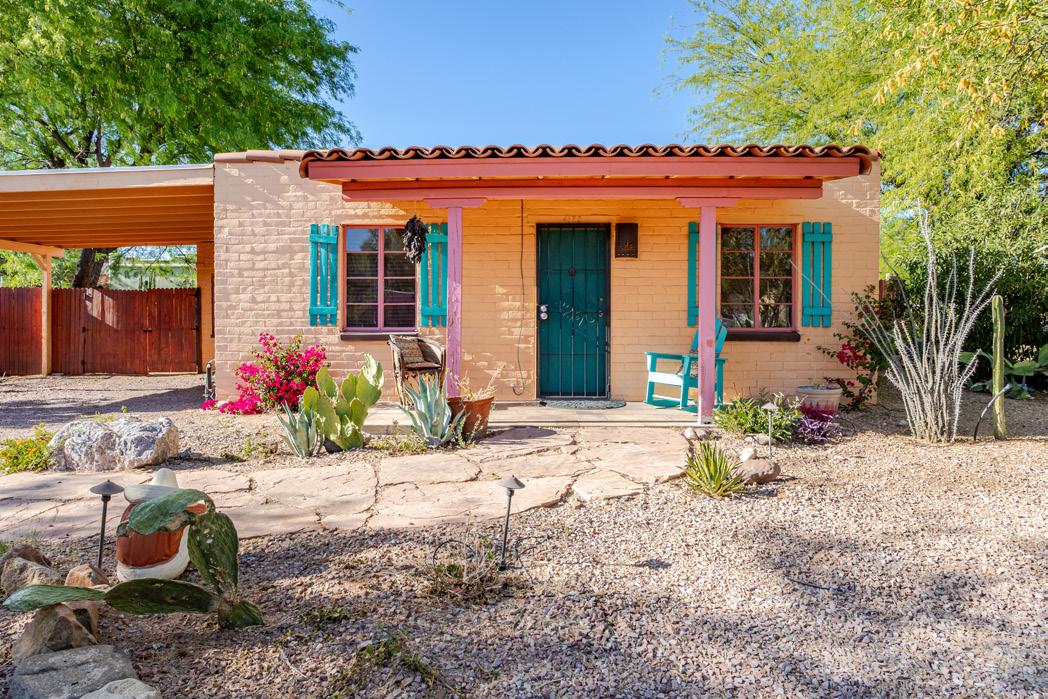
• HISPANICS AGED 18–29 FIND THE PROCESS TO GET MEDICAL CARE HARDER TO UNDERSTAND THAN OTHER HISPANIC AGE GROUPS
• ABOUT A THIRD OF HISPANIC ADULTS SAY THEY WOULD PREFER A HEALTH CARE PROVIDER WHO SPEAKS SPANISH
• A GREATER PERCENTAGE OF HISPANIC ADULTS 18+ VS. NON-HISPANICS DID NOT GET NEEDED MEDICAL CARE DUE TO COST
Orland and Irma Cazarez have beenAirbnb hostsforthe lastfiveyears. Theyspeak spanish, havethree children and lovetotraveltogether.
• Airbnb: airbnb.com/h/cedarhouseflagstaff
• Instagram: @CedarHouseFlagstaff
• A GREATER PERCENTAGE OF HISPANIC ADULTS 18+ VS. NON-HISPANICS DID NOT TAKE
• MEDICATION AS PRESCRIBED TO SAVE MONEY
• A GREATER PERCENTAGE OF HISPANIC ADULTS 18+ VS. NON-HISPANICS WERE OBESE
• LATINO DIABETES RATES HAVE REMAINED CONSTANT OVER THE LAST DECADE IN ARIZONA (2011–2021)
• MENTAL HEALTH IN ARIZONA (FEBRUARY 2021)
• SINCE 2020, ALL RACIAL/ETHNIC GROUPS HAVE EXPERIENCED HIGHER RATES OF MENTAL DISTRESS
• 53% OF HISPANIC ADULTS SAY HEALTH RISKS IN JOBS ARE MAJOR REASON FOR GENERALLY WORSE HEALTH OUTCOMES
COURTESY OF
• IN 2021, NEARLY 1/5 OF HISPANICS IN THE U.S. DID NOT HAVE HEALTH INSURANCE COVERAGE
In 2023, the Hispanic homeownership rate was 49.5 percent, the median home value for Hispanic homeowners was $340,000 and the median home equity for Hispanic owners was $135,000.
• THE PERCENTAGE OF UNINSURED HISPANICS AGED 18–64 ROSE TO MORE THAN THREE TIMES THAT OF NON-HISPANICS BY 2021
• MEDICARE/CHIP IS THE LARGEST SOURCE OF COVERAGE FOR LATINO KIDS IN ARIZONA
• NUMBER & RATE OF UNINSURED LATINO CHILDREN BY ARIZONA COUNTY (2018)
In 2023, Hispanic homeowners accounted for 9 percent of national improvement expenditures, but on the state-level, accounted for higher spending shares in:
• HISPANICS AGED 18–29 FIND THE PROCESS TO GET MEDICAL CARE HARDER TO UNDERSTAND THAN OTHER HISPANIC AGE GROUPS
• ABOUT A THIRD OF HISPANIC ADULTS SAY THEY WOULD PREFER A HEALTH CARE PROVIDER WHO SPEAKS SPANISH
• Riverside, California (37 percent)
• A GREATER PERCENTAGE OF HISPANIC ADULTS 18+ VS. NON-HISPANICS DID NOT GET NEEDED MEDICAL CARE DUE TO COST
• Los Angeles, California (20 percent)
• A GREATER PERCENTAGE OF HISPANIC ADULTS 18+ VS. NON-HISPANICS DID NOT TAKE
• Miami, Florida (30 percent)
• MEDICATION AS PRESCRIBED TO SAVE MONEY
• A GREATER PERCENTAGE OF HISPANIC ADULTS 18+ VS. NON-HISPANICS WERE OBESE
• Dallas, Texas (21 percent)
• LATINO DIABETES RATES HAVE REMAINED CONSTANT OVER THE LAST DECADE IN ARIZONA (2011–2021)
• Houston, Texas (19 percent).
• MENTAL HEALTH IN ARIZONA (FEBRUARY 2021)
• SINCE 2020, ALL RACIAL/ETHNIC GROUPS HAVE EXPERIENCED HIGHER RATES OF MENTAL DISTRESS
• 53% OF HISPANIC ADULTS SAY HEALTH RISKS IN JOBS ARE MAJOR REASON FOR GENERALLY WORSE HEALTH OUTCOMES
In the same year, Hispanic homeowners spent an average of $3,700 on home improvements, lower than white homeowners ($5,000) and Asian homeowners ($4,500). The share of aggregate improvement spending funded by home equity was 11.7 percent for Hispanic owners, lower than white owners (12.2%).
SOURCE: Improving America's Housing 2025 | Joint Center for Housing Studies
• IN 2021, NEARLY 1/5 OF HISPANICS IN THE U.S. DID NOT HAVE HEALTH INSURANCE COVERAGE


• THE PERCENTAGE OF UNINSURED HISPANICS AGED 18–64 ROSE TO MORE THAN THREE TIMES THAT OF NON-HISPANICS BY 2021
Spending in the US residential remodeling market reached unprecedented heights in the wake of the COVID-19 pandemic, soaring above $600 billion in 2022. Despite modest declines in 2023 and 2024, market expenditures for improvements and repairs to owner-occupied and rental properties remained far above pre-pandemic levels. This extraordinary boom was driven by strong growth in the number of owners undertaking projects and in average spending, bolstered by a healthy labor market, record-high property values, and aging homes in need of investment. Many owners continue to adapt their properties for changing needs and uses, even as today’s lower rates of personal savings and household mobility dampen improvement and repair spending.
• MEDICARE/CHIP IS THE LARGEST SOURCE OF COVERAGE FOR LATINO KIDS IN ARIZONA
• NUMBER & RATE OF UNINSURED LATINO CHILDREN BY ARIZONA COUNTY (2018)
• HISPANICS AGED 18–29 FIND THE PROCESS TO GET MEDICAL CARE HARDER TO UNDERSTAND THAN OTHER HISPANIC AGE GROUPS
• ABOUT A THIRD OF HISPANIC ADULTS SAY THEY WOULD PREFER A HEALTH CARE PROVIDER WHO SPEAKS SPANISH
Significant inflation in the costs of building materials and labor coupled with a large and persistent skilled trade labor shortage have challenged not only owners seeking to update and maintain their properties, but also professional contracting firms. Overcoming these obstacles is essential in order to meet the current and
• A GREATER PERCENTAGE OF HISPANIC ADULTS 18+ VS. NON-HISPANICS DID NOT GET NEEDED MEDICAL CARE DUE TO COST
• A GREATER PERCENTAGE OF HISPANIC ADULTS 18+ VS. NON-HISPANICS DID NOT TAKE
future demand for modernizing and preserving the existing housing stock. Despite unparalleled spending in recent years, much more investment is required to address the large and growing need to further improve energy efficiency, disaster resiliency, and accessibility for the nation’s 145 million homes.
• MEDICATION AS PRESCRIBED TO SAVE MONEY
• A GREATER PERCENTAGE OF HISPANIC ADULTS 18+ VS. NON-HISPANICS WERE OBESE
The Home Remodeling Market Is Expected to Remain Above $600 Billion in 2025 Market Spending (Billions of Dollars)
• LATINO DIABETES RATES HAVE REMAINED CONSTANT OVER THE LAST DECADE IN ARIZONA (2011–2021)
• MENTAL HEALTH IN ARIZONA (FEBRUARY 2021)
• SINCE 2020, ALL RACIAL/ETHNIC GROUPS HAVE EXPERIENCED HIGHER RATES OF MENTAL DISTRESS
• 53% OF HISPANIC ADULTS SAY HEALTH RISKS IN JOBS ARE MAJOR REASON FOR GENERALLY WORSE HEALTH OUTCOMES
Note: Estimated (e) and forecasted (f) values are modeled using the 2024:Q4 Leading Indicator of Remodeling Activity (LIRA).
Source: JCHS analysis of US Department of Housing and Urban Development (HUD), American Housing Surveys; US Department of Commerce, Retail Sales of Building Materials; US Census Bureau, Surveys of Residential Alterations and Repairs (C-50); US Bureau of Economic Analysis, Detailed Fixed Asset Tables; US Bureau of Labor Statistics, Consumer Price Index: Rent of Primary Residence; and LIRA.
The pandemic sparked a spending boom in improvements—which include projects, whether discretionary or required, that typically boost home values—and in routine maintenance and repairs that generally prevent depreciation. Since peaking at $611 billion in 2022, the remodeling market has contracted slightly in the face of mixed economic and industrial conditions (Figure 1). Yet spending is ultimately expected to remain near its peak through 2025, according to the latest estimates and projections from the Joint Center for Housing Studies.
• IN 2021, NEARLY 1/5 OF HISPANICS IN THE U.S. DID NOT HAVE HEALTH INSURANCE COVERAGE
• THE PERCENTAGE OF UNINSURED HISPANICS AGED 18–64 ROSE TO MORE THAN THREE TIMES THAT OF NON-HISPANICS BY 2021
• MEDICARE/CHIP IS THE LARGEST SOURCE OF COVERAGE FOR LATINO KIDS IN ARIZONA
• NUMBER & RATE OF UNINSURED LATINO CHILDREN BY ARIZONA COUNTY (2018)
The market decline in the aftermath of the pandemic is modest, thus demonstrating the underlying strength of consumer demand for home improvements and repairs. Indeed, the recent dip in spending is projected to be short-lived and mild, especially compared to the previous downturn during the Great Recession, when home improvement and repair spending fell 17 percent from peak to trough (Figure 2). The Center forecasts that the remodeling market will return to growth in 2025, but at a rate well below the historical average
• HISPANICS AGED 18–29 FIND THE PROCESS TO GET MEDICAL CARE HARDER TO UNDERSTAND THAN OTHER HISPANIC AGE GROUPS
The sharp increase since 2019 was propelled by the owner-occupied segment, which accounts for more than 80 percent of total expenditures. In 2023, both the number and the share of homeowners spending on improvements remained above pre-pandemic levels and rates at almost 26 million households and 29.7 percent of owners. In 2019, just over 22 million, or 28.0 percent of owners, were undertaking improvements. The share of owners spending on maintenance remained steady from 2019 to 2023 at 75 percent, even as the number increased from 60 million to 65 million. On average, homeowners spent almost $4,700 on improvements in 2023, nearly 9 percent above per owner spending in 2007 during the prior market boom after adjusting for inflation. Additionally, average per owner maintenance spending hit a new high of $1,200.
• ABOUT A THIRD OF HISPANIC ADULTS SAY THEY WOULD PREFER A HEALTH CARE PROVIDER WHO SPEAKS SPANISH
• A GREATER PERCENTAGE OF HISPANIC ADULTS 18+ VS. NON-HISPANICS DID NOT GET NEEDED MEDICAL CARE DUE TO COST
• A GREATER PERCENTAGE OF HISPANIC ADULTS 18+ VS. NON-HISPANICS DID NOT TAKE
gain of about 5 percent.
• MEDICATION AS PRESCRIBED TO SAVE MONEY
Some early pandemic shifts in the composition of home improvement spending have since reverted to pre-pandemic trends. Aggregate improvement expenditures became more concentrated among high-spending households between 2021 and 2023 as homeowners focused relatively less on do-ityourself (DIY) projects and more on professional installations. During the same period, owner expenditures on projects that often require skilled labor—such as
• A GREATER PERCENTAGE OF HISPANIC ADULTS 18+ VS. NON-HISPANICS WERE OBESE
The Remodeling Downturn Is Expected to Be Short-Lived and Mild
• LATINO DIABETES RATES HAVE REMAINED CONSTANT OVER THE LAST DECADE IN ARIZONA (2011–2021)
• MENTAL HEALTH IN ARIZONA (FEBRUARY 2021)
• SINCE 2020, ALL RACIAL/ETHNIC GROUPS HAVE EXPERIENCED HIGHER RATES OF MENTAL DISTRESS
• 53% OF HISPANIC ADULTS SAY HEALTH RISKS IN JOBS ARE MAJOR REASON FOR GENERALLY WORSE HEALTH OUTCOMES
Notes: Estimated (e) and forecasted (f) values are modeled using the 2024:Q4 LIRA. Historical average annual growth is from 1995 to 2023. Source: JCHS analysis of HUD, American Housing Surveys; US Department of Commerce, Retail Sales of Building Materials; US Census Bureau, C-50; US Bureau of Economic Analysis, Detailed Fixed Asset Tables; US Bureau of Labor Statistics, Consumer Price Index: Rent of Primary Residence; and LIRA.
kitchen and bath remodels, interior replacements including flooring, system replacements like electrical and HVAC, and disaster repairs—increased at a faster pace than the improvement market overall. Annual spending on professionally installed projects grew 14 percent between 2021 and 2023 in real terms, while DIY spending declined 13 percent.
• IN 2021, NEARLY 1/5 OF HISPANICS IN THE U.S. DID NOT HAVE HEALTH INSURANCE COVERAGE
• THE PERCENTAGE OF UNINSURED HISPANICS AGED 18–64 ROSE TO MORE THAN THREE TIMES THAT OF NON-HISPANICS BY 2021
Changing homeowner demographics are impacting the size and composition of the improvement market. In 2023, owners age 65 and over contributed 27 percent of total improvement outlays, up from 14 percent two decades earlier. This gain reflects the large increase in the number of older homeowners and the considerable growth in their average spending. Between 2003 and 2023, the number of owners age 65 and over grew by 12 million, pushing their share of owners from 24 percent to 34 percent. Over the same time, their average per owner spending climbed from an inflation-adjusted $1,800 in 2003 to $3,800 in 2023— more than twice the 48 percent growth in per capita spending among all homeowners.
Younger homeowners have also increased their improvement spending in the past decade, although the worsening housing affordability crisis suppresses their ranks and their contributions to the remodeling market. After a steep decline in the wake of the Great Recession, the number of homeowners under age 35 grew 15 percent to 8 million between 2015 and 2023, though there were still 25 percent fewer younger owners than during the mid-2000s housing boom. While real aggregate spending by owners under age 35 jumped 51 percent over the same period, their market expenditure remained 14 percent below the prior peak.
• MEDICARE/CHIP IS THE LARGEST SOURCE OF COVERAGE FOR LATINO KIDS IN ARIZONA
• NUMBER & RATE OF UNINSURED LATINO CHILDREN BY ARIZONA COUNTY (2018)
• HISPANICS AGED 18–29 FIND THE PROCESS TO GET MEDICAL CARE HARDER TO UNDERSTAND THAN OTHER HISPANIC AGE GROUPS
• ABOUT A THIRD OF HISPANIC ADULTS SAY THEY WOULD PREFER A HEALTH CARE PROVIDER WHO SPEAKS SPANISH
• A GREATER PERCENTAGE OF HISPANIC ADULTS 18+ VS. NON-HISPANICS DID NOT GET NEEDED MEDICAL CARE DUE TO COST
• A GREATER PERCENTAGE OF HISPANIC ADULTS 18+ VS. NON-HISPANICS DID NOT TAKE
As the overall population becomes more racially and ethnically diverse, households headed by a person of color contribute more to the home improvement market despite enduring disparities in income, homeownership, and home equity. In 2023, homeowners of color accounted for 23 percent of aggregate improvement expenditures, up from 14 percent in 2003. This corresponded with a nearly 9 percentage point increase in the share of homeowner households headed by a person of color. Immigrant owners account for a growing share of the market as well, up from 8 percent of aggregate improvement expenditures in 2003 to 13 percent in 2023. Foreign-born
• MEDICATION AS PRESCRIBED TO SAVE MONEY
• A GREATER PERCENTAGE OF HISPANIC ADULTS 18+ VS. NON-HISPANICS WERE OBESE
• LATINO DIABETES RATES HAVE REMAINED CONSTANT OVER THE LAST DECADE IN ARIZONA (2011–2021)
• MENTAL HEALTH IN ARIZONA (FEBRUARY 2021)
• SINCE 2020, ALL RACIAL/ETHNIC GROUPS HAVE EXPERIENCED HIGHER RATES OF MENTAL DISTRESS
• 53% OF HISPANIC ADULTS SAY HEALTH RISKS IN JOBS ARE MAJOR REASON FOR GENERALLY WORSE HEALTH OUTCOMES
Notes: Recent movers bought their homes within the previous year. Estimates for 2020 are omitted due to data collection issues experienced during the pandemic.
Source: JCHS tabulations of US Census Bureau, American Community Survey 1-Year Estimates.

Fry’s Food Stores is Proud to


As Arizona’s fourth largest employer, Fry’s is committed to investing in people by cultivating inclusive, safe environments that embrace each individual’s authentic self – creating a workplace where every voice is valued, and every person’s story matters.

162 SPECIAL FEATURE
166 SPECIAL FEATURE
167 IN FOCUS
EXCERPT
170
Quality Affordable Food Insights
Affordable Food
Univision Communications takes a deep dive into everything related to food in the Phoenix and Tucson markets, from grocery shopping to quick service and sit-down restaurants
Confronting Truth, Advancing Equity YWCA Metropolitan Phoenix and the Pursuit of Social Justice in Arizona
BY ANGELA SALAZAR
The State of Healthy School Meals for All: Eight States Show the Nation What Is Possible
According to the Food Research & Action Center’s Report, the Passing Of Healthy School Meals for all Policies in Eight States, Led to Increased School Lunch and Breakfast Participation.
Food insecurity is defined as "lack of consistent access to the food needed for an active, health life" and is considered a major threat to public health with various consequences on mental and physical well-being. In the United States the primary cause of food insecurity is related not to food production or availability but rather is related to income distribution which affects individuals purchasing power (Berkowitz et al., 2024; Olufemi-Philips et al., 2024).
12-month Percentage Change, Consumer Price Index for All Urban Consumers:


BY ANGELA SALAZAR
In a year when the call for equity and justice echoes louder than ever, the Arizona Hispanic Chamber of Commerce’s 2025 DATOS report centers on social justice, a theme that resonates deeply with the mission and legacy of YWCA Metropolitan Phoenix. For over a century, YWCA continues to lead the charge in dismantling systemic barriers and building community-rooted solutions that uplift and empower in the name of justice.
Social justice is our jam. It’s the heartbeat of everything we do. In a region as diverse and dynamic as the Phoenix metro area, our work is not just relevant, it’s essential. From grassroots advocacy to executive leadership development, YWCA’s programs uplift historically marginalized communities, particularly women and people of color, who continue to face disproportionate challenges in education, employment, healthcare, civic participation and economic mobility. In 2024, our equity team partnered with 23 nonprofits, 11 schools and 15 corporate organizations, reaching thousands of professionals and community leaders. We continue to develop more relationships with others who also want to “Be the change.”
We invite you to be part of Until Justice Just Is, our ongoing campaign for racial equity and justice.
This free, self-guided Racial Justice Challenge, available in both English and Spanish, is open to individuals, teams and organizations who are ready to learn, reflect and take action. Because justice begins with awareness and grows through collective accountability.
This year’s challenge explores timely and critical issues, including how misinformation in Spanish- language media erodes trust in
public health and civic institutions, how microaggressions and language-based bias harm Latinx communities, and how the myth of the American dream often excludes communities of color. It also examines how the racialization of crime leads to both overpolicing and under-protection of black and brown families.
The challenge culminates in Building Bridges, a powerful community summit that connects participants with local leaders
and actionable strategies for change. But the journey doesn’t end there… you can join at any time throughout the year and become part of a growing movement committed to justice.
The real impact happens when participants take what they’ve learned back to their neighborhoods, workplaces and families. Ready to take the challenge? Visit ywcaaz.org to sign up and start your journey today.
Through our Equity in STEAM initiative and partnerships, we create access and opportunity in science, technology, engineering, arts and mathematics for underrepresented youth in a time where the state continues to face a significant shortfall in skilled STEAM workers, with job growth in education, health services and construction outpacing the availability of trained professionals.
We aim to build an ecosystem of STEAM programs, nonprofits and funders who are all working to bridge the Grand Canyon-sized workforce gap in Arizona. The majority of individuals we serve identify as Latinx, ensuring that our programs are both culturally responsive and community informed. We support educators across K–12, higher education and workforce development pathways, while deepening partnerships with organizations that share a vision for justice. Join the cause by supporting our capacity building framework to support those who are directly involved with cultivating our future engineers, artists, architects and scientists.
Our fee-for-service learning sessions bring customized, equity-centered training directly to nonprofits, businesses and institutions across Arizona. These sessions, covering topics like Unconscious Bias, Inclusive Leadership and Building a Diverse Talent Pipeline; equip teams with the tools to foster inclusive cultures and drive systemic change from within.
This model sustains our ability to offer free community programming, including financial empowerment, food security, civic engagement and leadership development. Every session, every conversation and every partnership contributes to a more just and equitable Arizona.
This work is not theoretical; it is deeply personal and profoundly local. YWCA’s programs continue to reach across the Valley, sparking critical conversations and catalyzing action in boardrooms, classrooms and community centers alike. Our leadership in the social justice space is not only recognized but also trusted.
As Arizona continues to grow and diversify, the need for intentional, equity-driven leadership has never been greater. The 2025 DATOS report underscores the economic and cultural contributions of
the Hispanic community, and YWCA Metropolitan Phoenix stands as a vital partner in ensuring those contributions are met with opportunity, dignity and justice.
If you believe in equity, not just in words, but in action, this is your moment. The work we do lifts up the Hispanic community and so many others who’ve been pushed to the margins. But we can’t keep doing it without real support. If this mission speaks to you to create equitable access to opportunity by investing in people and communities that have been historically marginalized, then let’s partner up. Donate. Collaborate. Reach out. Every bit of support helps us keep fighting for justice, opportunity and lasting change. We’re building something powerful here and we need you with us.
In the words of YWCA’s guiding principle: “Eliminating racism, empowering women and promote peace, justice, freedom and dignity for all.” This is not just a mission; it is a movement. And in 2025, that movement is more powerful than ever.

Angela identifies as Yaqui and Xicana, born and raised in Phoenix, Arizona. She is the equity programs director, focusing on racial justice & social equity for YWCA Metropolitan Phoenix.
YWCA Metropolitan Phoenix ywxaaz.org 8561 N. 61 st Ave. Glendale, AZ 85302 602.258.0990
• IG: ywcaaz
• FB: ywcaAZ
THE STATE OF HEALTHY SCHOOL MEALS FOR ALL: Eight States Show the Nation What is Possible Food Research & Action Center
According to the Food Research & Action Center’s Report , the Passing Of Healthy School Meals for all Policies in Eight States, Led to Increased School Lunch and Breakfast Participation.
SOURCE: frac.org/research/resource-library/hsmfa-report-2025

During the 2023–2024 School Year
Three Healthy School Meals for All states — California, Maine, and Massachusetts — that first implemented during the 2022–2023 school year saw INCREASES in both school breakfast and lunch participation in 2023–2024, compared to the previous year. This shows that there was still room for participation to increase, even after the first year of implementation.1
The four Healthy School Meals for All states — Colorado, Michigan, Minnesota, and New Mexico — that implemented during the 2023–2024 school year all saw INCREASES in both breakfast and lunch participation, compared to the previous year when many schools went back to determining student eligibility for free, reduced-price, and paid meals.
All eight states continued to have a gap between breakfast and lunch participation, showing there is still ROOM FOR GROWTH in the School Breakfast Program. Participation in lunch is growing faster than breakfast, so barriers preventing students from participating in school breakfast still exist.
School meals have always played an important role in reducing childhood hunger, supporting good nutrition, and ensuring that students can get the most out of their school day. For more than two school years during the height of the COVID-19 pandemic, schools were able to offer meals to all students at no charge through the pandemic-related child nutrition waivers offered by the U.S. Department of Agriculture (USDA). This served as a trial run for nationwide Healthy School Meals for All (HSMFA), and it was a resounding success.
Students, regardless of household income, had access to nutritious meals to help them thrive at school. Parents did not have to worry about packing lunches or paying for meals, and school nutrition professionals were able to give a meal to any child that needed one without worrying about account balances or collecting unpaid school meal debt. Several states decided they did not want to return to pre-pandemic school meal operations, which required determining children’s eligibility for free, reduced-price, or paid meal categories, and introduced legislation to permanently provide free school meals for all students.

During the 2023–2024 school year, 60 PERCENT of schools that participated in the National School Lunch Program offered free meals to all their students, either because the school utilized the Community Eligibility Provision or because the school was in a Healthy School Meals for All state2
Currently, eight states — California, Colorado, Maine, Massachusetts, Michigan, Minnesota, New Mexico, and Vermont — have passed policies to make school meals available to all students at no charge, regardless of household income. Similar legislation has been introduced in more than 20 other states.
It has become clear that meanstesting access to school meals is not an efficient or effective way to run school meal operations. Collecting school meal applications from families is cumbersome, leads to schools charging students different prices for the same meal, and
creates administrative burdens for school food service departments. The increase in school meal participation in Healthy School Meals for All states shows the success and popularity of the approach and highlights the need for Congress to pass legislation so that all students, regardless of where they live, have access to the nutrition they need to learn and thrive. Until Congress acts, states should continue to pass Healthy School Meals for All policies that ensure the children in their state have access to nutritious food that helps them succeed at school.
There are many benefits to offering school breakfast and lunch to all students at no charge to families.
` Ensures all students are hunger-free and ready to get the most out of their school day: It is hard for students to learn and fully benefit from educational investments when they do not have the focus or energy to concentrate because they are hungry. It only takes one hungry student who cannot pay attention to disrupt learning in an entire classroom, so everyone benefits when all students are well-fed.
` Reduces stigma in the cafeteria: Students from households with low incomes, particularly those in middle and high school, often worry that participating in school meals will negatively identify them among their peers. As a result, students feel shame or skip meals. When all students have access to free meals, regardless of household income, any stigma about eating school meals is reduced, and the cafeteria can be a more welcoming space for everyone.
` Ends school meal debt: School nutrition departments no longer need to track and follow up on school meal debt, which is a significant problem for families and schools. Dealing with school meal debt takes time away from serving high-quality nutritious meals and building a sense of community in cafeterias.
` Supports innovative service models: When all students can eat free meals at school, it is easier for school nutrition departments to use innovative service models such as breakfast in the classroom and grab-and-go kiosks to serve more students. As participation increases, economies of scale can allow for serving more fresh produce and quality menu items that appeal to students.
` Advances racial equity: Healthy School Meals for All policies are critical to advancing racial equity and justice, ensuring that all students have access to the nutrition they need to succeed at school and beyond.
In 2021, FRAC conducted nationwide public opinion polling and found that 63 percent of voters nationwide support legislation that would allow schools to offer meals to all students at no charge. Since then, several states have conducted their own state-specific polling and found publicsupport numbers that are even higher.
` More than 70 percent of Minnesota voters — including majorities across every ideological and demographic category — say they approve of the state legislature’s decision [in 2022] to provide free school meals to all students, regardless of income.
` 77 percent of registered New York voters support state funding for Healthy School Meals for All.
` 81 percent of voters in North Carolina support school meals for all.
` 87 percent of Ohio parents of school-age children agree that schools should provide school meals at no cost to all students, regardless of the student’s ability to pay.
` Eight in 10 Pennsylvanian voters support expanding the state’s free breakfast program to include lunch.

At Comerica Bank, we believe when everyone has an equal opportunity to thrive, we all thrive.
That’s why we invest time, resources and capital into creating economic opportunities that help build stronger communities.
From a ordable housing to financial education and workforce development, Comerica is committed to helping everyone … succeed.
MEMBER FDIC. EQUAL OPPORTUNITY LENDER.
CB-822550-03-02 08/23
Raise Your Expectations ® ®
We remain focused on making health care easier so life can be better for all those we serve. At the heart of Banner’s Here for Everyone culture is our belief that every individual deserves respect. We stand united against hate and discrimination to continue building a respectful and inclusive environment for all.

YOUR CUSTOM END-TO-END MARKET
RESEARCH AND DATA ANALYTICS PARTNER
Since 1959, WestGroup has helped local, national and global organizations make better decisions through best practice market research.

Gain a trusted advisor who understands your business and sound market research practices
Brand Health and Positioning
Customer Experience
Telephone Interviewing Center
Gain a collaborative partner with a full suite of proven market research and data tools to meet your needs and budget
Breathe easier knowing you have the reliable data and insights you need to confidently make the best business decisions
Concept and Message Testing
Consumer/Citizen Surveys
Employee Engagement User Experience
Focus Groups – Facilities, Recruiting and Moderating

On-site Intercept Surveys
Web and Panel Research
Statisticians/Data Analytics
INTERACTIVE DASHBOARD
IN FOCUS
Planting Roots for a Greener Arizona
BY ARIZONA SUSTAINABILITY ALLIANCE (AZSA)
In a National Representative Survey of Americans Beliefs and Attitudes About Global Warming, the Yale Program on Climate Change Communication and Mason University Center for Climate Change Communications, Found That a Majority of Americans Believe Global Warming is Happening and are Worried About its Effects on the Planet and Their Lives.
Trees make a big difference in how we experience our cities. They cool our neighborhoods, clean our air and provide a sense of beauty and calm. In many parts of Arizona, especially in underserved communities, there simply aren’t enough trees. The Arizona Sustainability Alliance (AZSA) is working to change that.
BY ARIZONA SUSTAINABILITY ALLIANCE (AZSA)
Screening Tool, EPA’s EJScreen and American Forests’ Tree Equity Score to guide decisions on where to plant.
AZSA manages the full process, from sourcing trees and selecting planting sites to organizing volunteer days and creating long-term
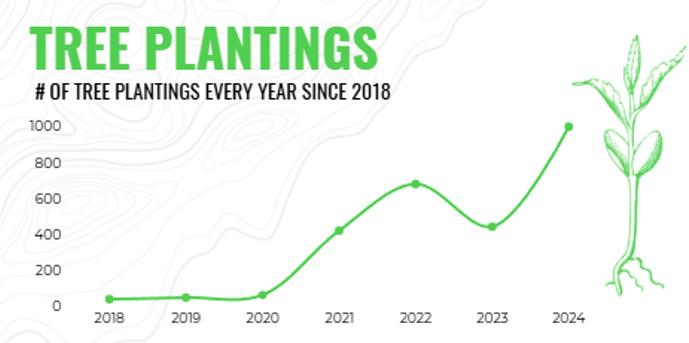
Through the Urban Forestry initiative, AZSA is planting trees where they are needed most. Since 2018, the organization has planted more than 3,000 trees across the Valley, including 1,000 trees last year alone. These efforts focus on neighborhoods that have low tree canopy coverage, higher temperatures and fewer resources. AZSA uses national tools like the Climate and Economic Justice
maintenance plans. After the trees are planted, AZSA continues to support them through a five-year monitoring program. Staff members measure the trees’ growth and health through field visits, taking data on size, temperature and watering conditions, all of which is entered into an online mapping system. This helps make sure the trees survive and grow strong over time.

Urban forestry at AZSA goes beyond tree planting. The organization leads the Urban Forestry Roundtable, a growing network of over 185 members across local governments, nonprofits and the private sector. The roundtable brings people together to improve how trees are planted and cared for in Metro Phoenix, with a focus on neighborhoods that lack shade.
Three committees within the roundtable focus on different challenges. The Tree Species Committee is building a reliable list of trees that grow well in our desert climate. The Municipalities Committee helps cities and planting groups work better together. The Workforce Development Committee is creating opportunities for training and jobs in tree care for people from diverse backgrounds.
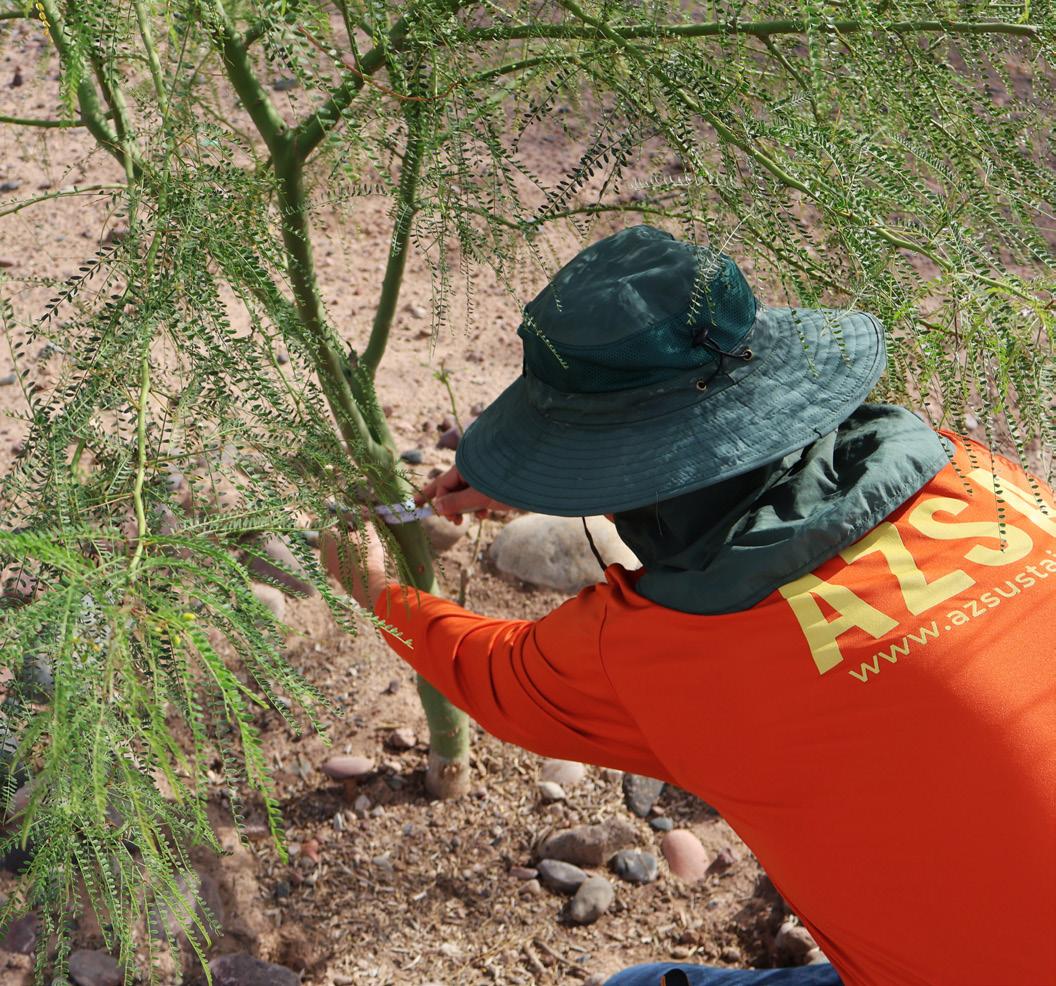
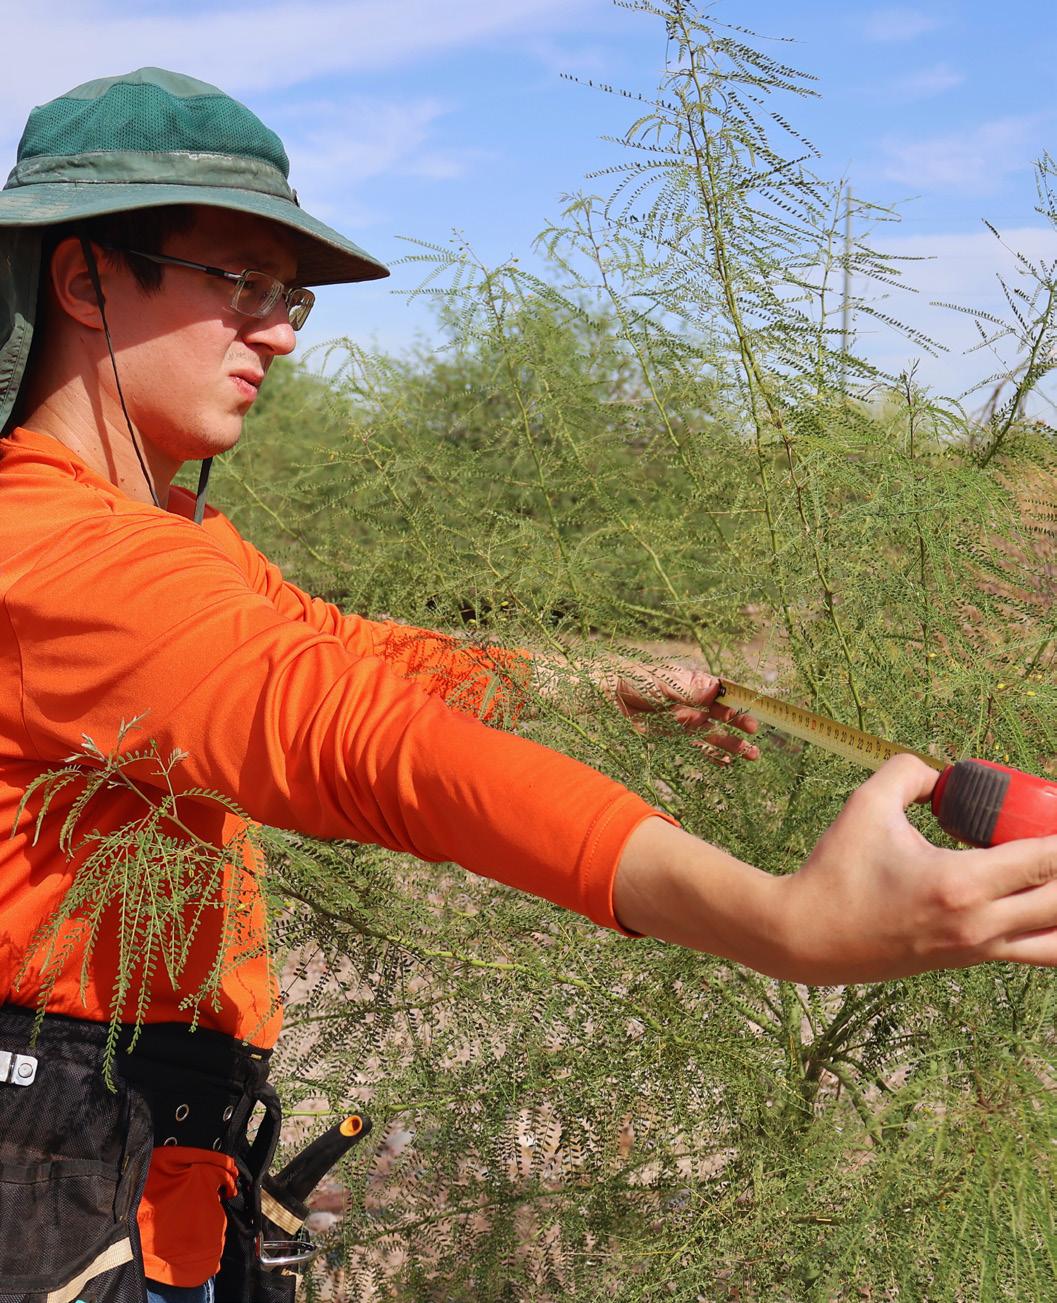
Education is another key part of AZSA’s approach. Through the Urban Forestry Education Initiative, teachers receive training in a weeklong summer program. They are given lessons, resources and field experiences that help them bring urban forestry into their classrooms. This is the first Arizona-specific curriculum of its kind, and it’s designed to teach K–12 students about the role of trees in our environment, our health and our neighborhoods.
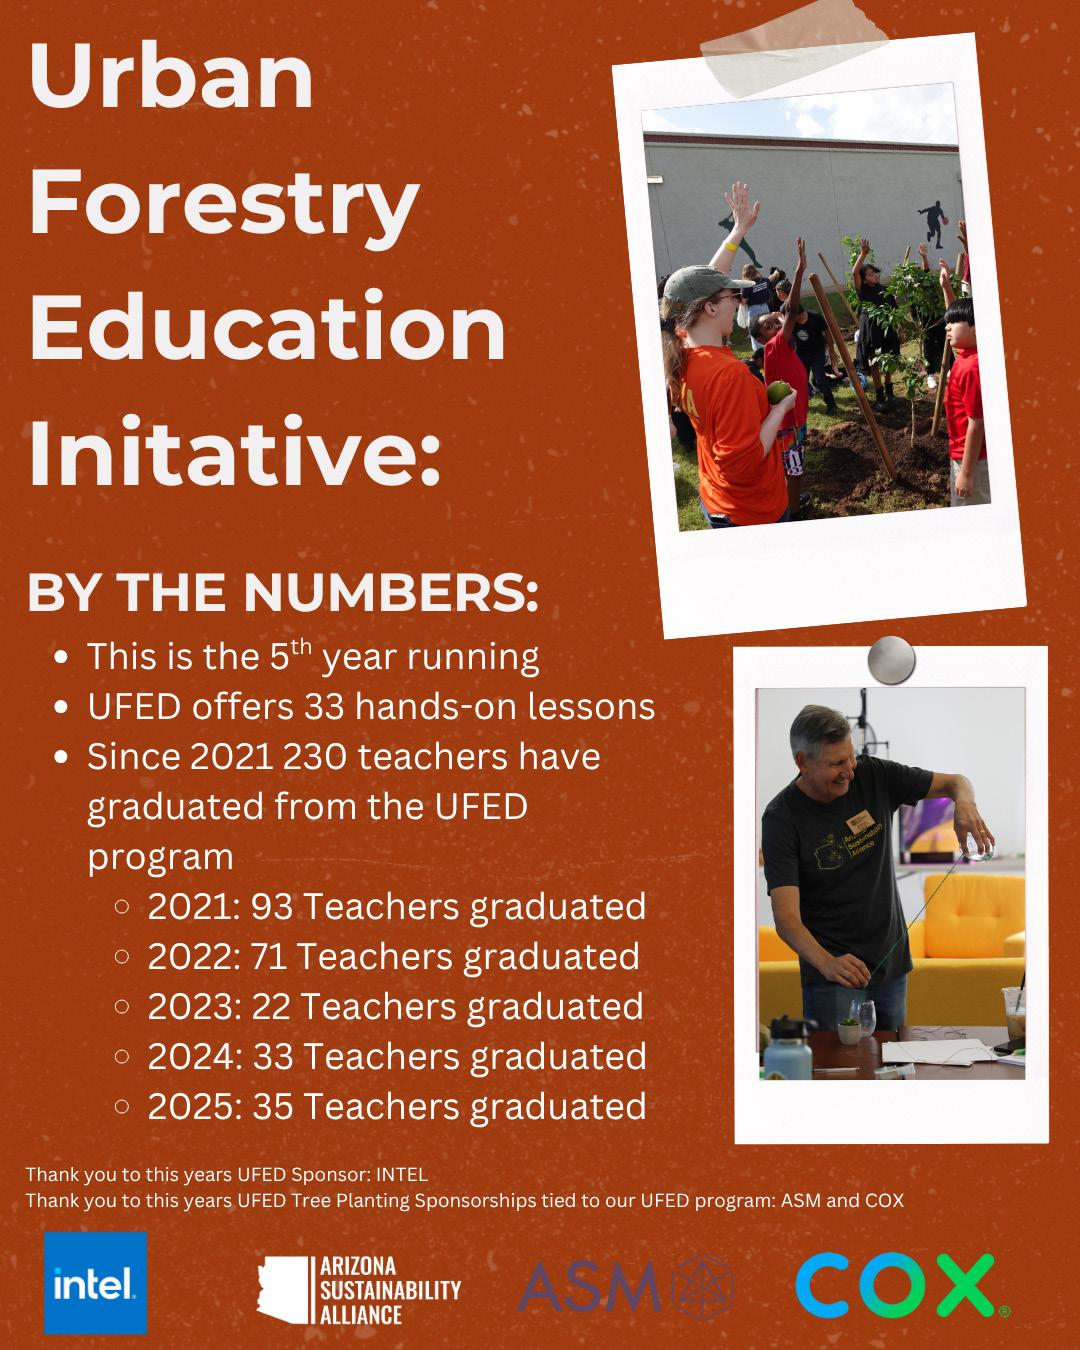
AZSA is also expanding its Tree Stewards Program in Mesa. Community members join a training program made up of eight modules and hands-on learning. After graduating, they help lead outreach events and even organize their own tree planting projects. Each cohort is responsible for planting up to 100 trees in their own neighborhoods, working alongside partners like the City of Mesa, American Forests and Tree Theory.
Urban forestry is about more than trees. It’s about creating cooler, healthier and more livable neighborhoods for all. As Arizona continues to grow, this work is a reminder that sustainability must be rooted in community. By planting trees today, we’re planting the foundation for a better tomorrow.
The Arizona Sustainability Alliance (AZSA) drives project-based sustainability solutions across Arizona through civic engagement, collaboration and education, focusing on four key priorities: Conservation, Urban Forestry, Clean Energy and Sustainable Food Systems.
The Arizona Sustainability Alliance (AZSA) azsustain.org info@azsustainabilityalliance.com
• IG: azsustainabilityalliance
• FB: AZSustain
• LI: azsustain

Whether you're a municipal forester, nonprofit partner, educator, or community member, you're welcome to join us.
The Roundtable is open to everyone working toward a greener, cooler Arizona
Contact: UFRT@azsustain.org
Yale Program on Climate Change Communication and George Mason University Center for Climate Change Communications.
In a National Representative Survey of Americans Beliefs and Attitudes About Global Warming, the Yale Program on Climate Change Communication and Mason University Center for Climate Change Communications, Found That a Majority of Americans Believe Global Warming is Happening and are Worried About its Effects on the Planet and Their Lives.
SOURCE: Climate Change in the American Mind
Climate Change in the American Mind: Beliefs & Attitudes, Spring 2025 3
Executive Summary
Drawing on a nationally representative survey (n = 1,040) conducted from May 1–12, 2025, this report describes Americans'1 beliefs and attitudes about global warming. Among the key findings in this report:
Global Warming Beliefs
● Americans who think global warming is happening outnumber those who think it is not by a ratio of more than 4 to 1 (69% versus 15%).
● 60% of Americans understand that global warming is mostly human-caused. By contrast, 28% think it is caused mostly by natural changes in the environment.
● 58% of Americans understand that most scientists think global warming is happening. By contrast, 21% think there is a lot of disagreement among scientists about whether it is happening.
Emotional Responses to Global Warming
● 65% of Americans say they are at least “somewhat worried” about global warming. This includes 29% who say they are “very worried.”
● Many Americans say they feel the following emotions about global warming: interested (58%), sad (44%), disgusted (44%), afraid (39%), anxious (39%), angry (39%), hopeful (38%), outraged (36%), hopeless (34%), or depressed (28%).
Perceived Risks and Impacts of Global Warming
● 48% of Americans think people in the United States are being harmed by global warming “right now,” and 46% say they have personally experienced the effects of global warming.
● Half or more Americans think global warming will harm plant and animal species (71%), future generations of people (69%), the world’s poor (66%), people in developing countries (65%), people in the United States (62%), and people in their community (50%). Many also think their family (49%) and they themselves (46%) will be harmed.
● 12% of Americans have considered moving to avoid the impacts of global warming.
● 64% of Americans think global warming is affecting weather in the United States, including 34% who think weather is being affected “a lot.”
● Majorities of Americans think global warming is affecting many extreme weather events or related impacts in the United States, including extreme heat (75%), wildfires (72%), droughts (72%), flooding (71%), air pollution (69%), rising sea levels (69%), hurricanes (68%), water shortages (67%), tornados (67%), reduced snowpack (64%), water pollution (62%), agricultural pests and diseases (60%), electricity power outages (59%), and diseases carried by mosquitoes and ticks, such as Lyme disease and West Nile Virus (58%).
● 58% of Americans think extreme weather poses a “high” (18%) or “moderate” (40%) risk to their community over the next 10 years.
1 Throughout this report, we use the term “Americans” to refer to adults (18+) who reside in the United States (the 50 states plus the District of Columbia).


Climate Change in the American Mind: Beliefs & Attitudes, Spring 2025 4
Harm from Local Environmental Problems
● Majorities of Americans say they are worried their local area might be harmed by extreme weather events or related impacts including air pollution (78%), water pollution (77%), diseases carried by mosquitoes and ticks, such as Lyme disease and West Nile Virus (76%), extreme heat (73%), droughts (73%), agricultural pests and diseases (71%), electricity power outages (71%), wildfires (67%), water shortages (67%), flooding (61%), tornados (60%), rising sea levels (55%), hurricanes (50%), and reduced snowpack (49%)
Personal and Social Engagement with Global Warming
● 52% of Americans say they have thought about global warming at least “some.”
● 65% of Americans say they “rarely” or “never” discuss global warming with family and friends, while 35% say they do so “occasionally” or “often.”
● 39% of Americans think it is at least “moderately” important to their family and friends that they take action to reduce global warming (an injunctive norm), and 35% say their family and friends make at least “a moderate amount of effort” to reduce global warming (a descriptive norm).
● 37% of Americans say they hear about global warming in the media about once a month or more frequently. Fewer say they hear about global warming on social media once a month or more often (23%) or that they hear people they know talk about global warming once a month or more frequently (17%).
● 64% of Americans say the issue of global warming is “extremely,” “very,” or “somewhat” important to them personally, while 36% say it is “not too” or “not at all” personally important.
● 61% of Americans feel a personal sense of responsibility to help reduce global warming.
● 29% of Americans say they have rewarded companies that are taking steps to reduce global warming by buying their products at least “once” in the past 12 months; 25% say they have punished companies that are opposing steps to reduce global warming by not buying their products at least “once” in the past 12 months.
Global Warming and Personal Agency
● 60% of Americans disagree that it’s already too late to do anything about global warming and 55% disagree that the actions of a single individual won’t make any difference in global warming.
● 53% of Americans disagree that new technologies can solve global warming without individuals having to make big changes in their lives.

186
Access to Care Insights
Health Care
Univision Communications presents the facts on health care of all types for Hispanics in Phoenix and Tucson
IN FOCUS
INTERACTIVE DASHBOARD 187 SPECIAL FEATURE 192 IN FOCUS
194 EXCERPT
Here for Everyone:
BY JULIE ANN ALVARADO-DUBEK
Arizona Works When Child Care Works
BY OFELIA GONZALEZ
2024 State of Mental Health in America Report
Arizona ranks 50th in Mental Health America’s state-by-state ranking of mental health prevalence and access to care, indicating higher prevalence of mental illnesses and lower rates of access to care.


H O E N I X
I S PA N I C S &
OF
(received dental care in the past 12 months)
E N TA L O P P O R T U N I T I E S

484K DENTAL SERVICES CONSUMER PROFILE
Or 4 0 % of Hispanics in Phoenix Visited a Dentist in the Past Year
HISPANICS ARE YOUNG *
5 8 % of Hispanics are between 25-54 years; whereas 61% of Non-Hispanics are ove r the age of 50
HISPANICS HAVE MORE CHILDREN **
4 5 % of Hispanic households have children compared to 19 % of Non-Hispanics
HISPANICS ARE SPENDING
$2.4 BILLION ON HEALTHCARE IN 20252
DENTAL SERVICES
HISPANICS ARE YOUNG *
5
142K
Or 41 % of Hispanics in Tucson Visited a Dentist in the Past Year
HISPANICS
HISPANICS ARE SPENDING
MILLION


59K Or 5 % Received Dental Implants in the Past 3 Years

486K Or 4 2 % Have Dental Insurance3 60K Or 5 % Used an Orthodontist in the Past Year vs. 2% Non-Hispanics

8K Or 2 % Used an Orthodontist in the Past Year
145K Or 41 % Have Dental Insurance3 vs. 2% Non-Hispanics
15K Or 4 % Received Dental Implants in the Past 3 Years
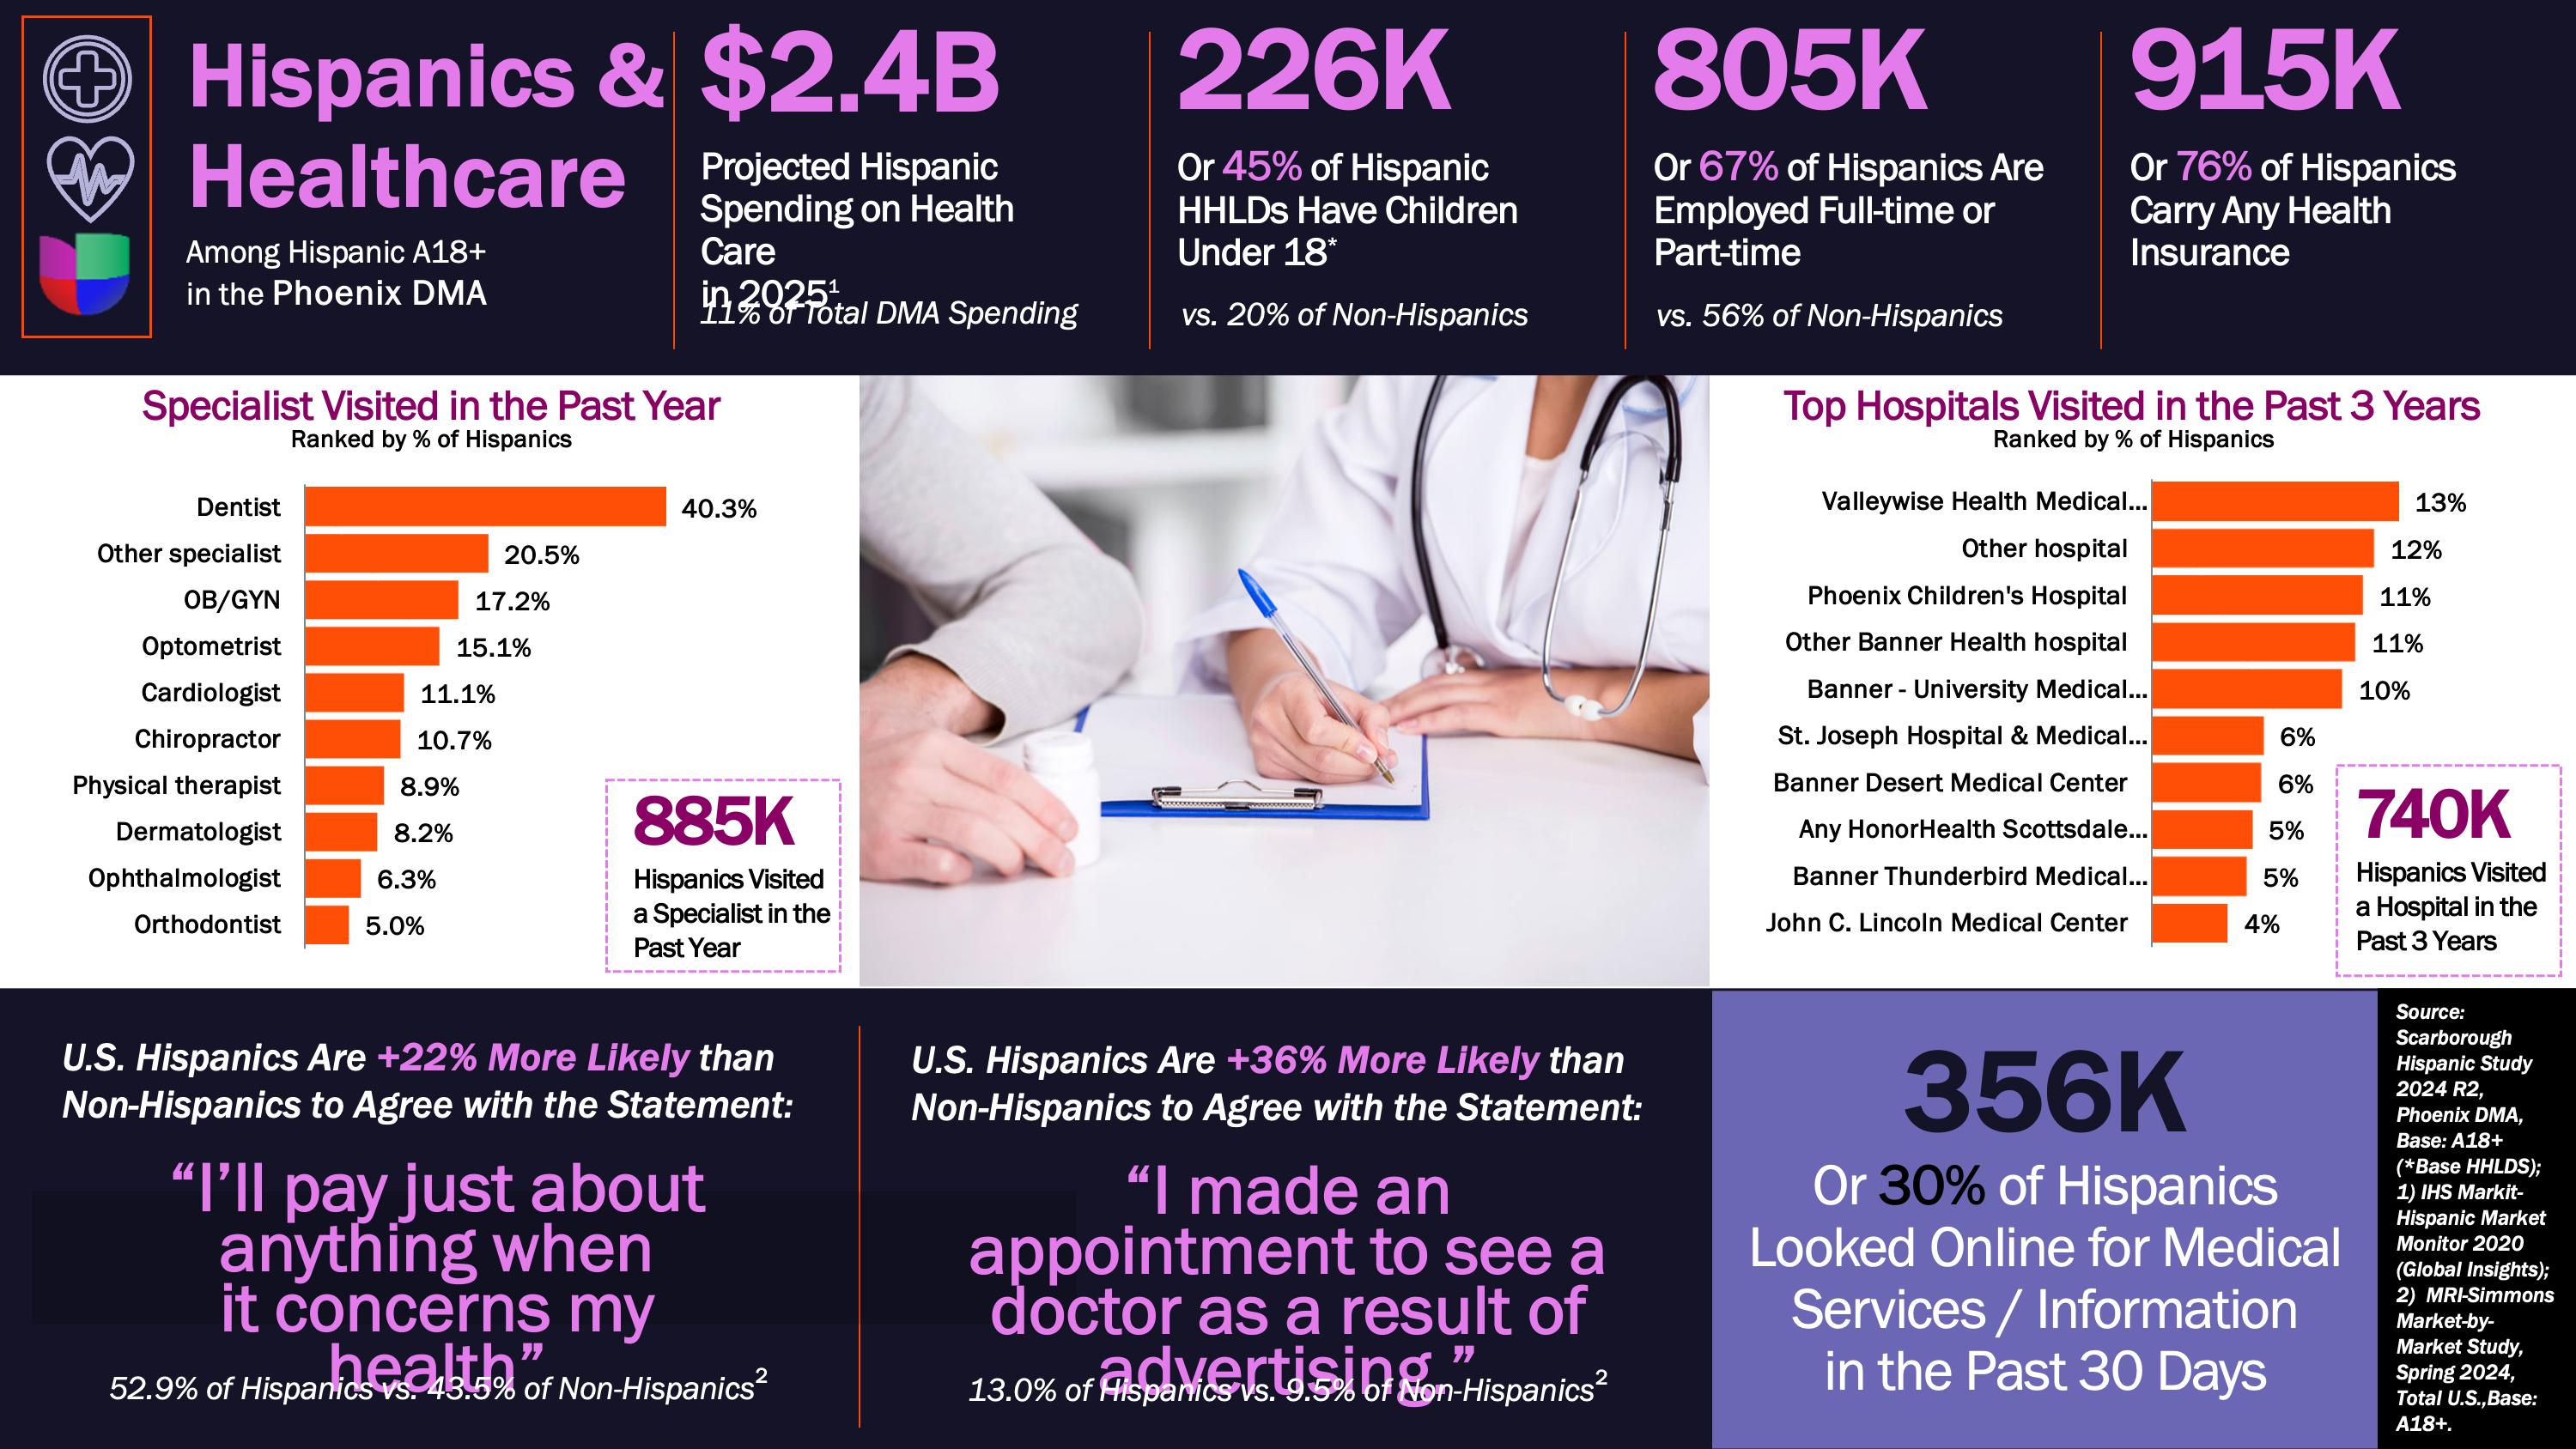
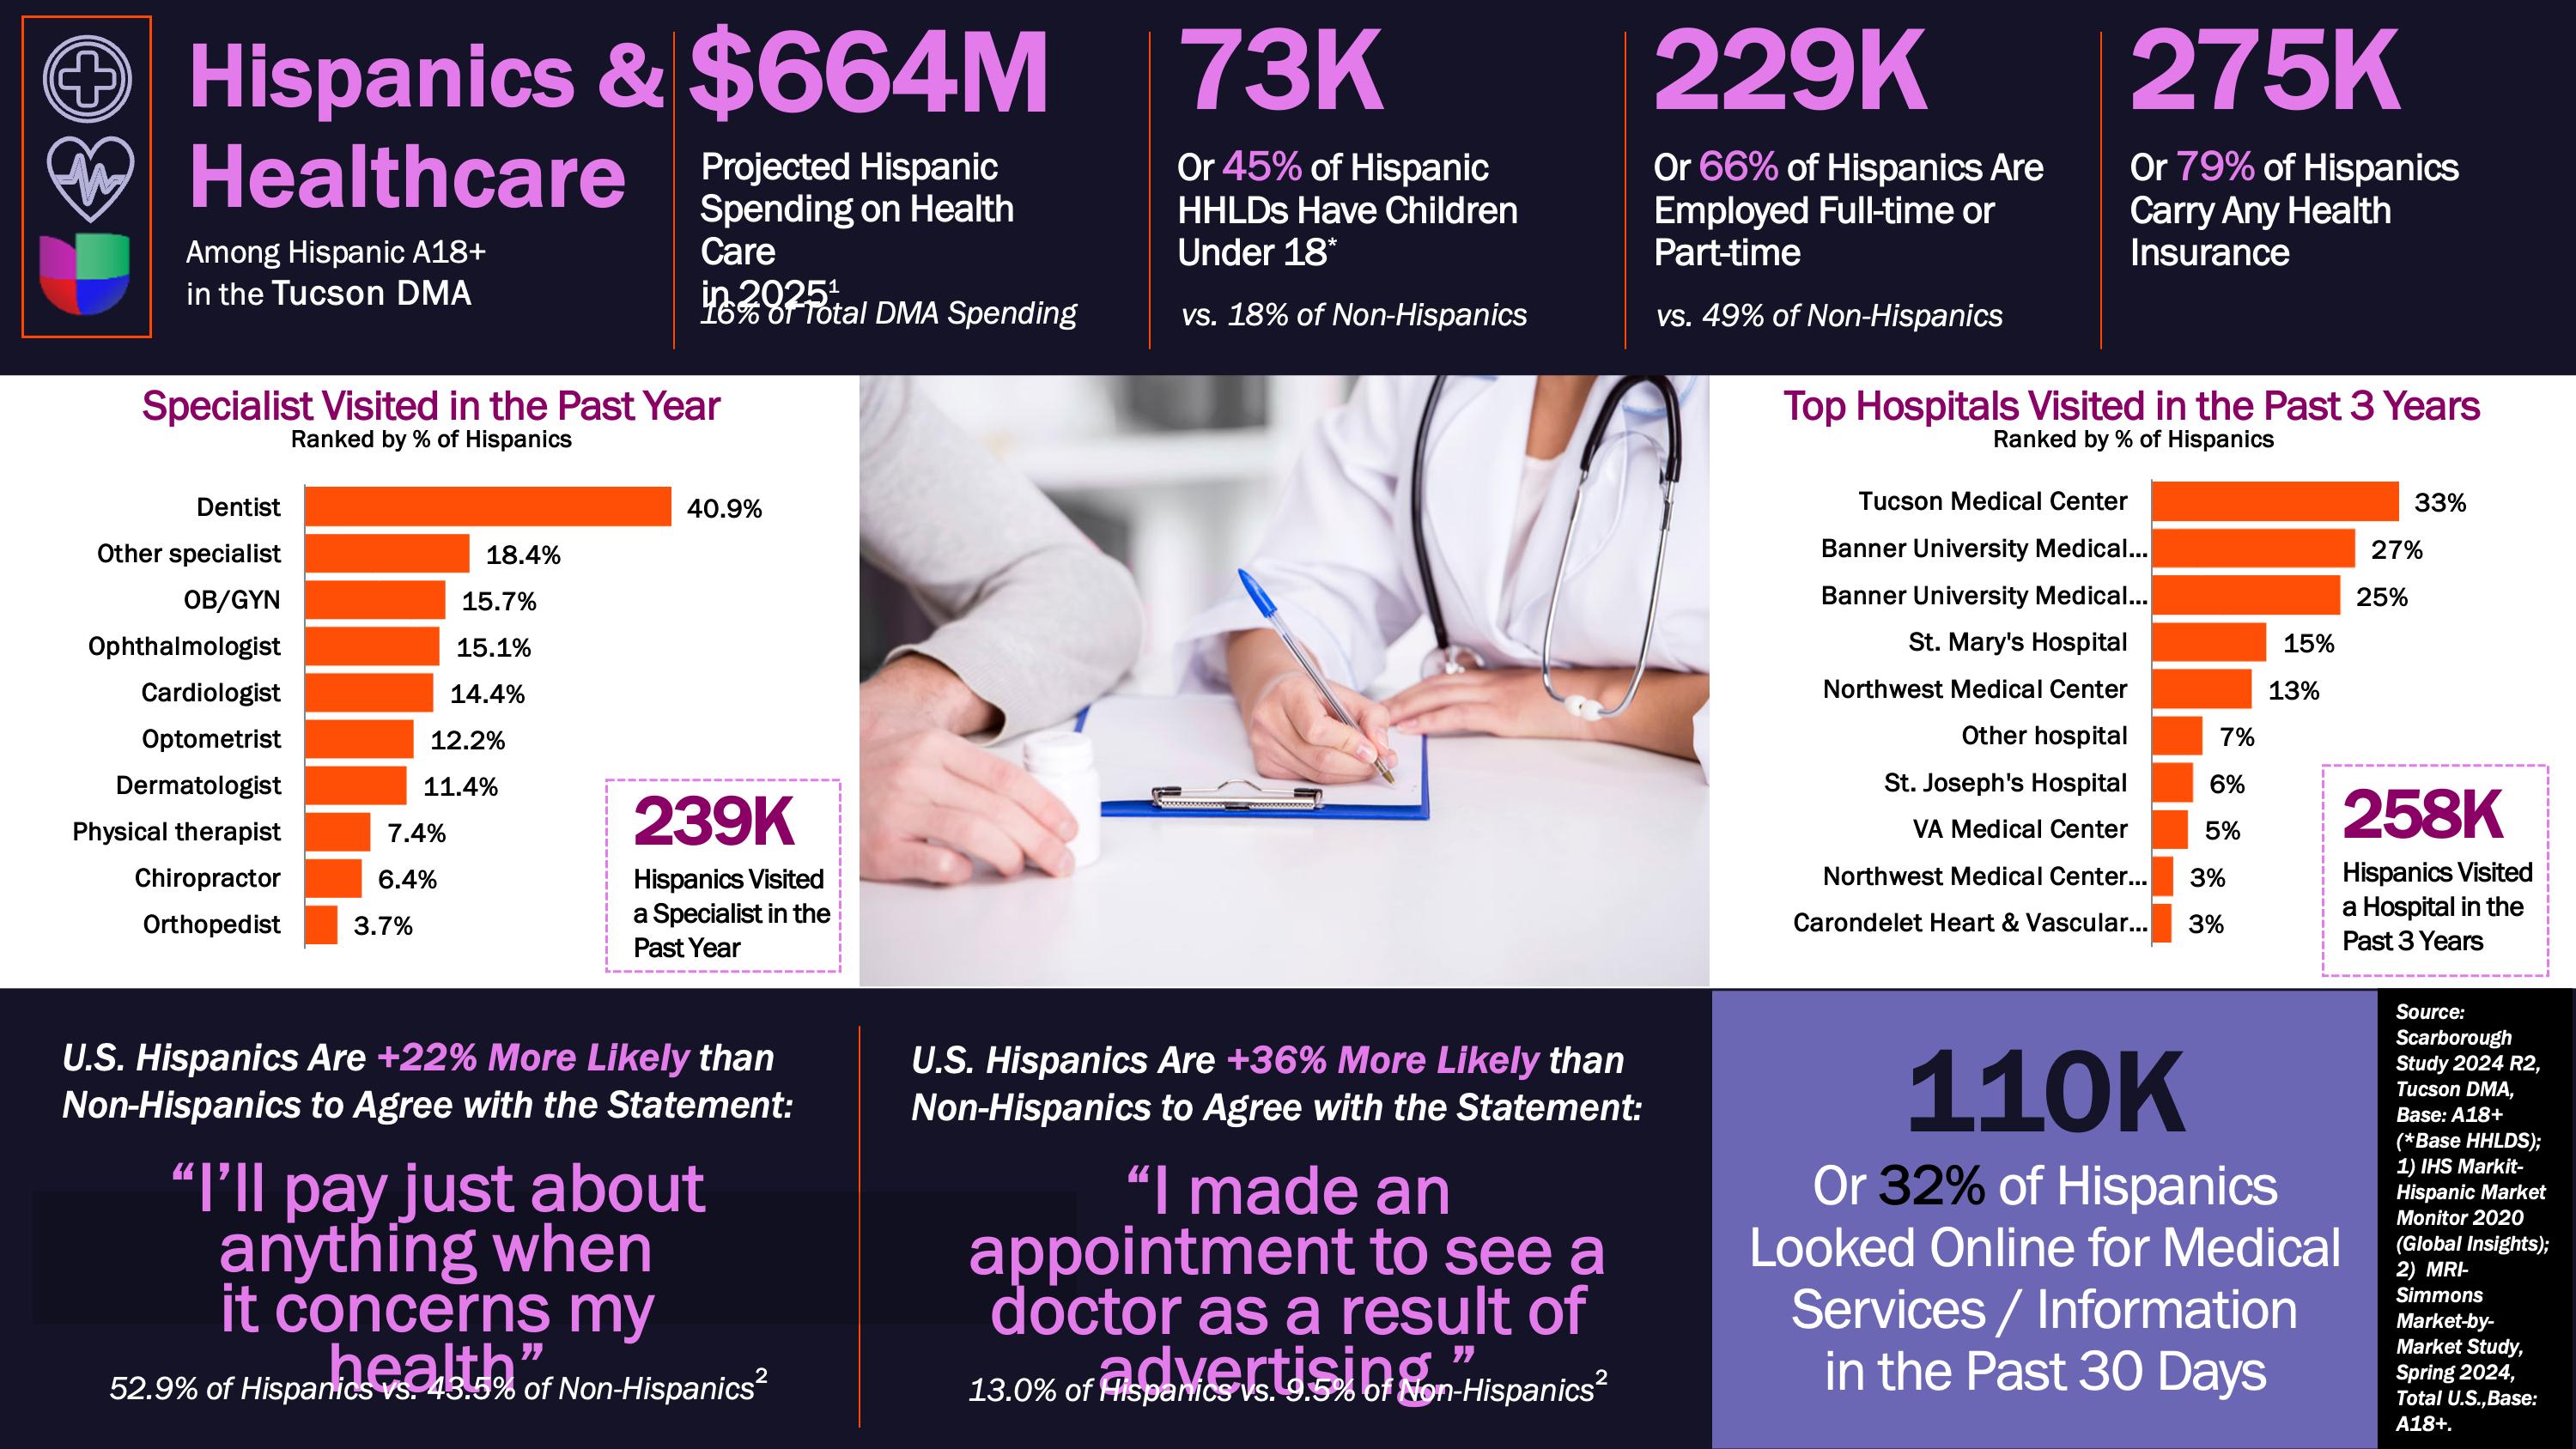
187K
690K
$82M


393K


150K
$19M


13K
BY JULIE ANN ALVARADO-DUBEK
At Banner Health, our mission encompasses a deep commitment to honoring and serving the culturally rich communities we care for. Our guiding principles are built on a foundation of inclusivity, respect and an understanding that everyone deserves compassionate and responsive care.
Guided by our principles
Banner's approach to cultural commitment is woven into the fabric of our organization. We believe health care must recognize and embrace the unique backgrounds, traditions and needs of all community members. This philosophy drives our initiatives, partnerships and everyday interactions with patients and families.
Our commitment to the Hispanic community and other cultural groups is demonstrated through meaningful engagement and dedicated outreach programs led by our Banner Unidos team member resource group. Banner Unidos is comprised of team members dedicated to uniting and empowering the Hispanic and
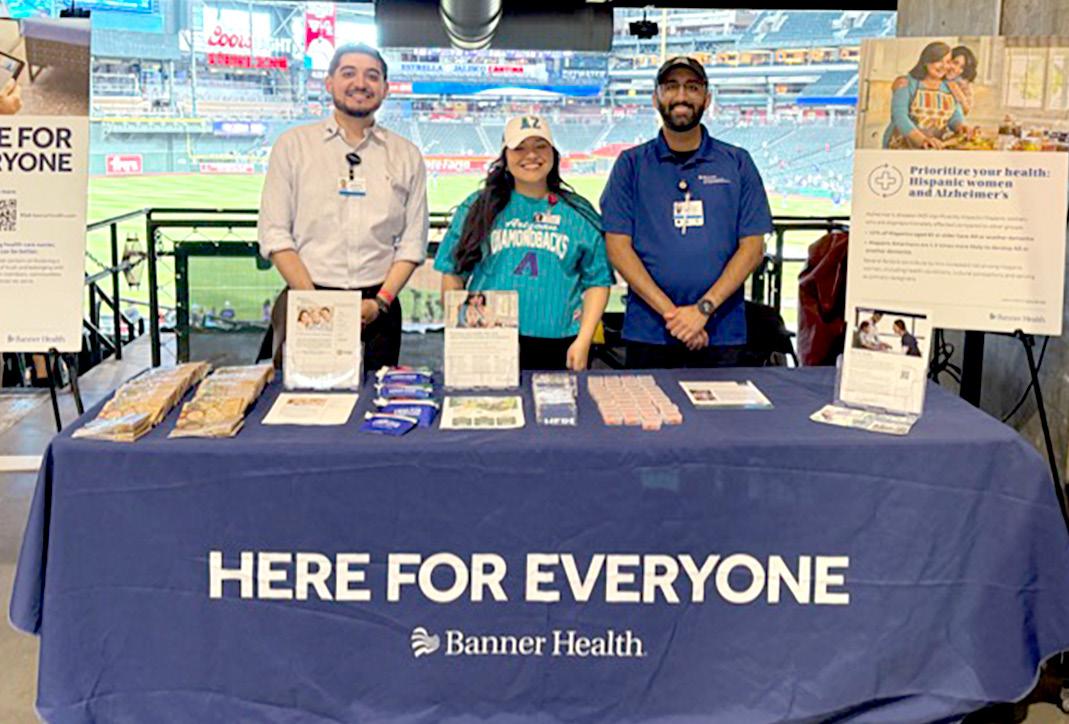

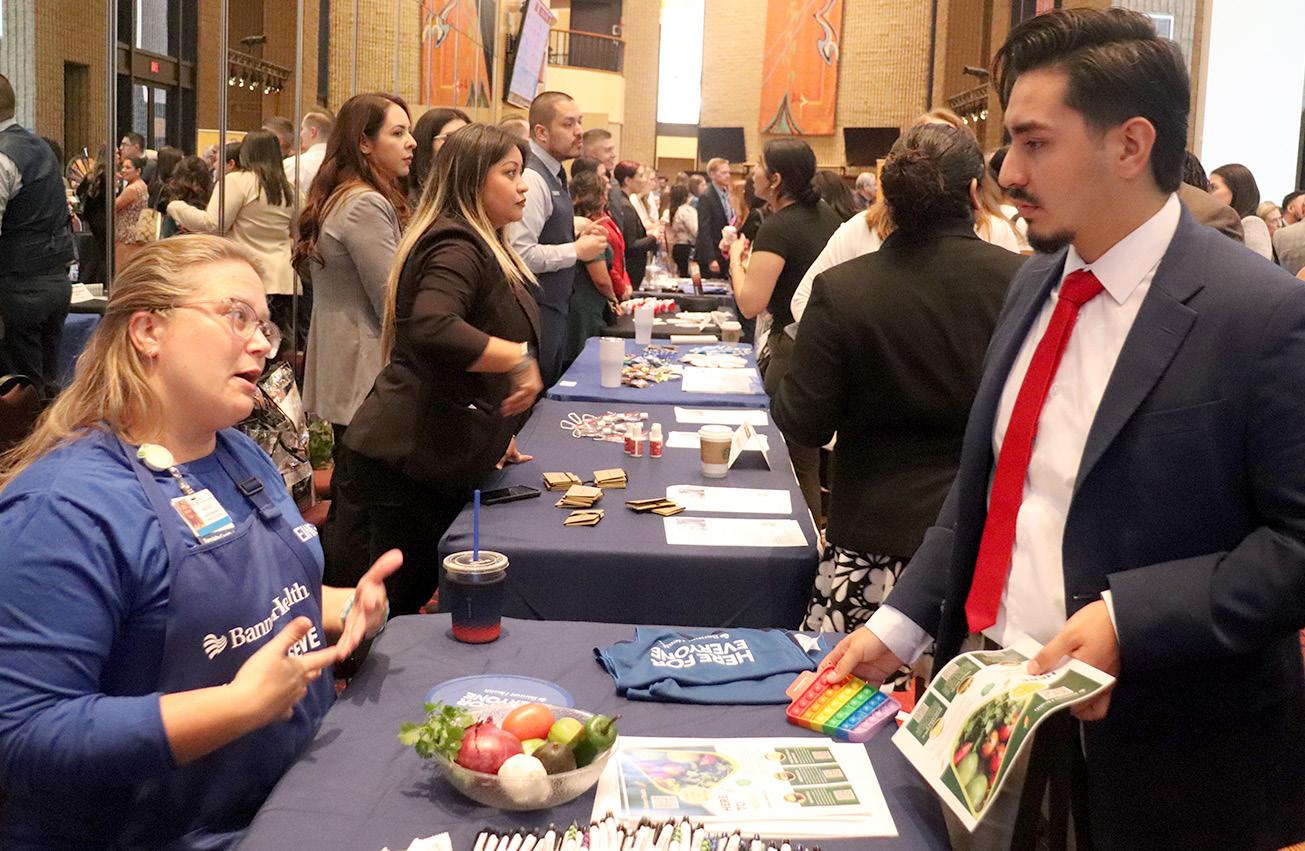
Latino community within and outside our doors. From leading health education workshops to participating in cultural celebrations that bring communities together, Banner strives to be a trusted health partner for everyone we serve.
In addition to providing reliable and high-quality care, we also build lasting relationships based on mutual respect and shared goals for healthier communities. Our commitment recently earned Corporation of the Year recognition from the Arizona Hispanic Chamber of Commerce, an honor we achieved thanks to our partnerships, community impact and team member commitment.
A health care home for all
Everyone who receives care from Banner will feel welcomed, understood and valued. Our team members receive ongoing education about cultural sensitivity and inclusive practices, ensuring the care we provide honors each person's unique journey and needs, because we know when everyone belongs, life is better.
Banner's promise is simple yet profound: we’re here for everyone, committed to making health care easier, so life can be better—for all the communities we’re privileged to serve.
Julie Ann Alvarado-Dubek is the executive vice president, chief administrative & people officerforBannerHealth.
BY OFELIA GONZALEZ
Arizona, like the rest of the nation, is currently experiencing a childcare crisis. Not being able to find or afford quality childcare is a growing problem for working parents.
It’s also a problem for businesses. Arizona employers lose $958 million annually due to childcare challenges faced by their workforce, according to a study funded by the Helios Education Foundation. The study surveyed working parents of children birth to age 5 across the state.
The lack of accessible and affordable childcare can wreak havoc on parents’ work lives. More than half of parents report being late for work, leaving work early or being distracted at work due to childcare problems. Nearly two-thirds reported missing a full day of work, while 28% of parents have quit a job due to childcare problems. These impacts to employees also impact business and their bottom line.
Working parents are a critical part of the U.S. labor supply: about 11% of workers in the U.S. have a young child under age 5 at home.
In Arizona, that equals about 474,000 working parents with children under age 6. And 60% of young children live in households where all adults work, which means many of them may need child care.
But childcare demand far exceeds available supply. A recent study by the Bipartisan Policy Center showed that in our state, about 304,000 young children may need child care, but only 230,000 childcare openings exist.
One reason is that childcare owners struggle to hire and retain employees due to historically low wages and a lack of benefits. This impacts the Latino community directly as Latinas are overrepresented in the childcare workforce – about 24% nationally and about 27% in the West.
And in our state, according to the Arizona Early Childhood Workforce Registry, which helps providers advance their professional development, about 36% of providers voluntarily reported themselves as Hispanic/Latino. Many of the nearly 3,000 childcare providers in Arizona are small businesses that contribute to the economy of their local communities.
As Arizona’s early childhood agency, First Things First (FTF) has been working throughout the state to engage the state’s business and economic development sector to find long-term solutions for the childcare crisis and early childhood investments. It’s important that all Arizonans understand that investing in quality childcare is investing in our future. Our state’s economic development starts with early childhood development.
Ensuring babies, toddlers and preschoolers get a strong start and supporting working families is the key to our state's success, because Arizona’s childcare crisis costs the state $4.7 billion annually in lost earnings, productivity and revenue.
First Things First will continue to work with partners, the business community, economic development and chambers across the state to find solutions that reflect Arizona’s values, the needs of young children, their caregivers and those that employ them.
Since the pandemic, Arizona has added over 600,000 jobs, a 23% increase over five years, according to Arizona’s Office of Economic Opportunity. And its executive officer, Carlos Contreras has called childcare one of the pillars for Arizona’s economic growth, especially during a time when Arizona is projected to add another 480,000 jobs by 2033.
“We have a lot of talent sitting on the sidelines. Access to affordable childcare is such a big factor in getting these talented people into the workforce,” Contreras said.
So what can businesses do?
Here are some quick steps to take today:
• Connect with First Things First through our Take Action page.
• Support more public funding for child care.
• Provide reliable work schedules and information about childcare assistance programs to employees. Predictive scheduling — advance notice of weekly and on-call shift scheduling — can help retain employees and attract new hires. It can also save money because it reduces the frequency of absenteeism, which can decrease revenue and drive up operational costs.
Quality childcare ensures that parents can work, that children can learn and that Arizona’s businesses and economy can thrive.
Ofelia Gonzalez is the First Things First senior director of public information. She talks with childcare providers, early childhood professionals and families to tell the stories of babies, toddlers and preschoolers growing up inArizona.
About First Things First — As Arizona’s early childhood agency, First Things First is committed to the healthy development and learning of young children from birth to age 5. It funds services to help kids be successful once they enter kindergarten. Decisions about how to invest early childhood funds are informed by local councils staffed by communityvolunteers.To learn more,visit FirstThingsFirst.org.
SOURCE: allineducation.org/mapa

REPORT 2024 - 2025

Achieving meaningful and lasting change in education systems, especially in underserved areas, requires more than isolated improvements or one-off initiatives. It demands an intentional, coordinated effort that aligns all components of the system—school boards, district leaders, parents, and the broader community. By creating alignment across these different sectors, educational systems can more effectively address the social determinants of education, improve academic outcomes, and create sustainable opportunities for students and their families. We know that when we have strong relationships and the willingness to collaborate and engage leaders from every level, student outcomes will change.
Generally, systems change involves a comprehensive transformation of the structures, policies, and relationships that govern how education is delivered, assessed, and supported. Instead of making small, isolated fixes, it requires an overhaul of the entire system to work together more effectively. Systems change needs alignment between school boards, district leadership, families, and communities. Without this alignment, reforms are often disconnected, and fail to produce long-term solutions and results. School board governance and leadership structures are key determinants of educational equity and progress. Poor governance frameworks and ineffective leadership often exacerbate the gap between district goals and classroom realities, leading to fragmented, short-term solutions that fail to address systemic issues—particularly in underserved communities.


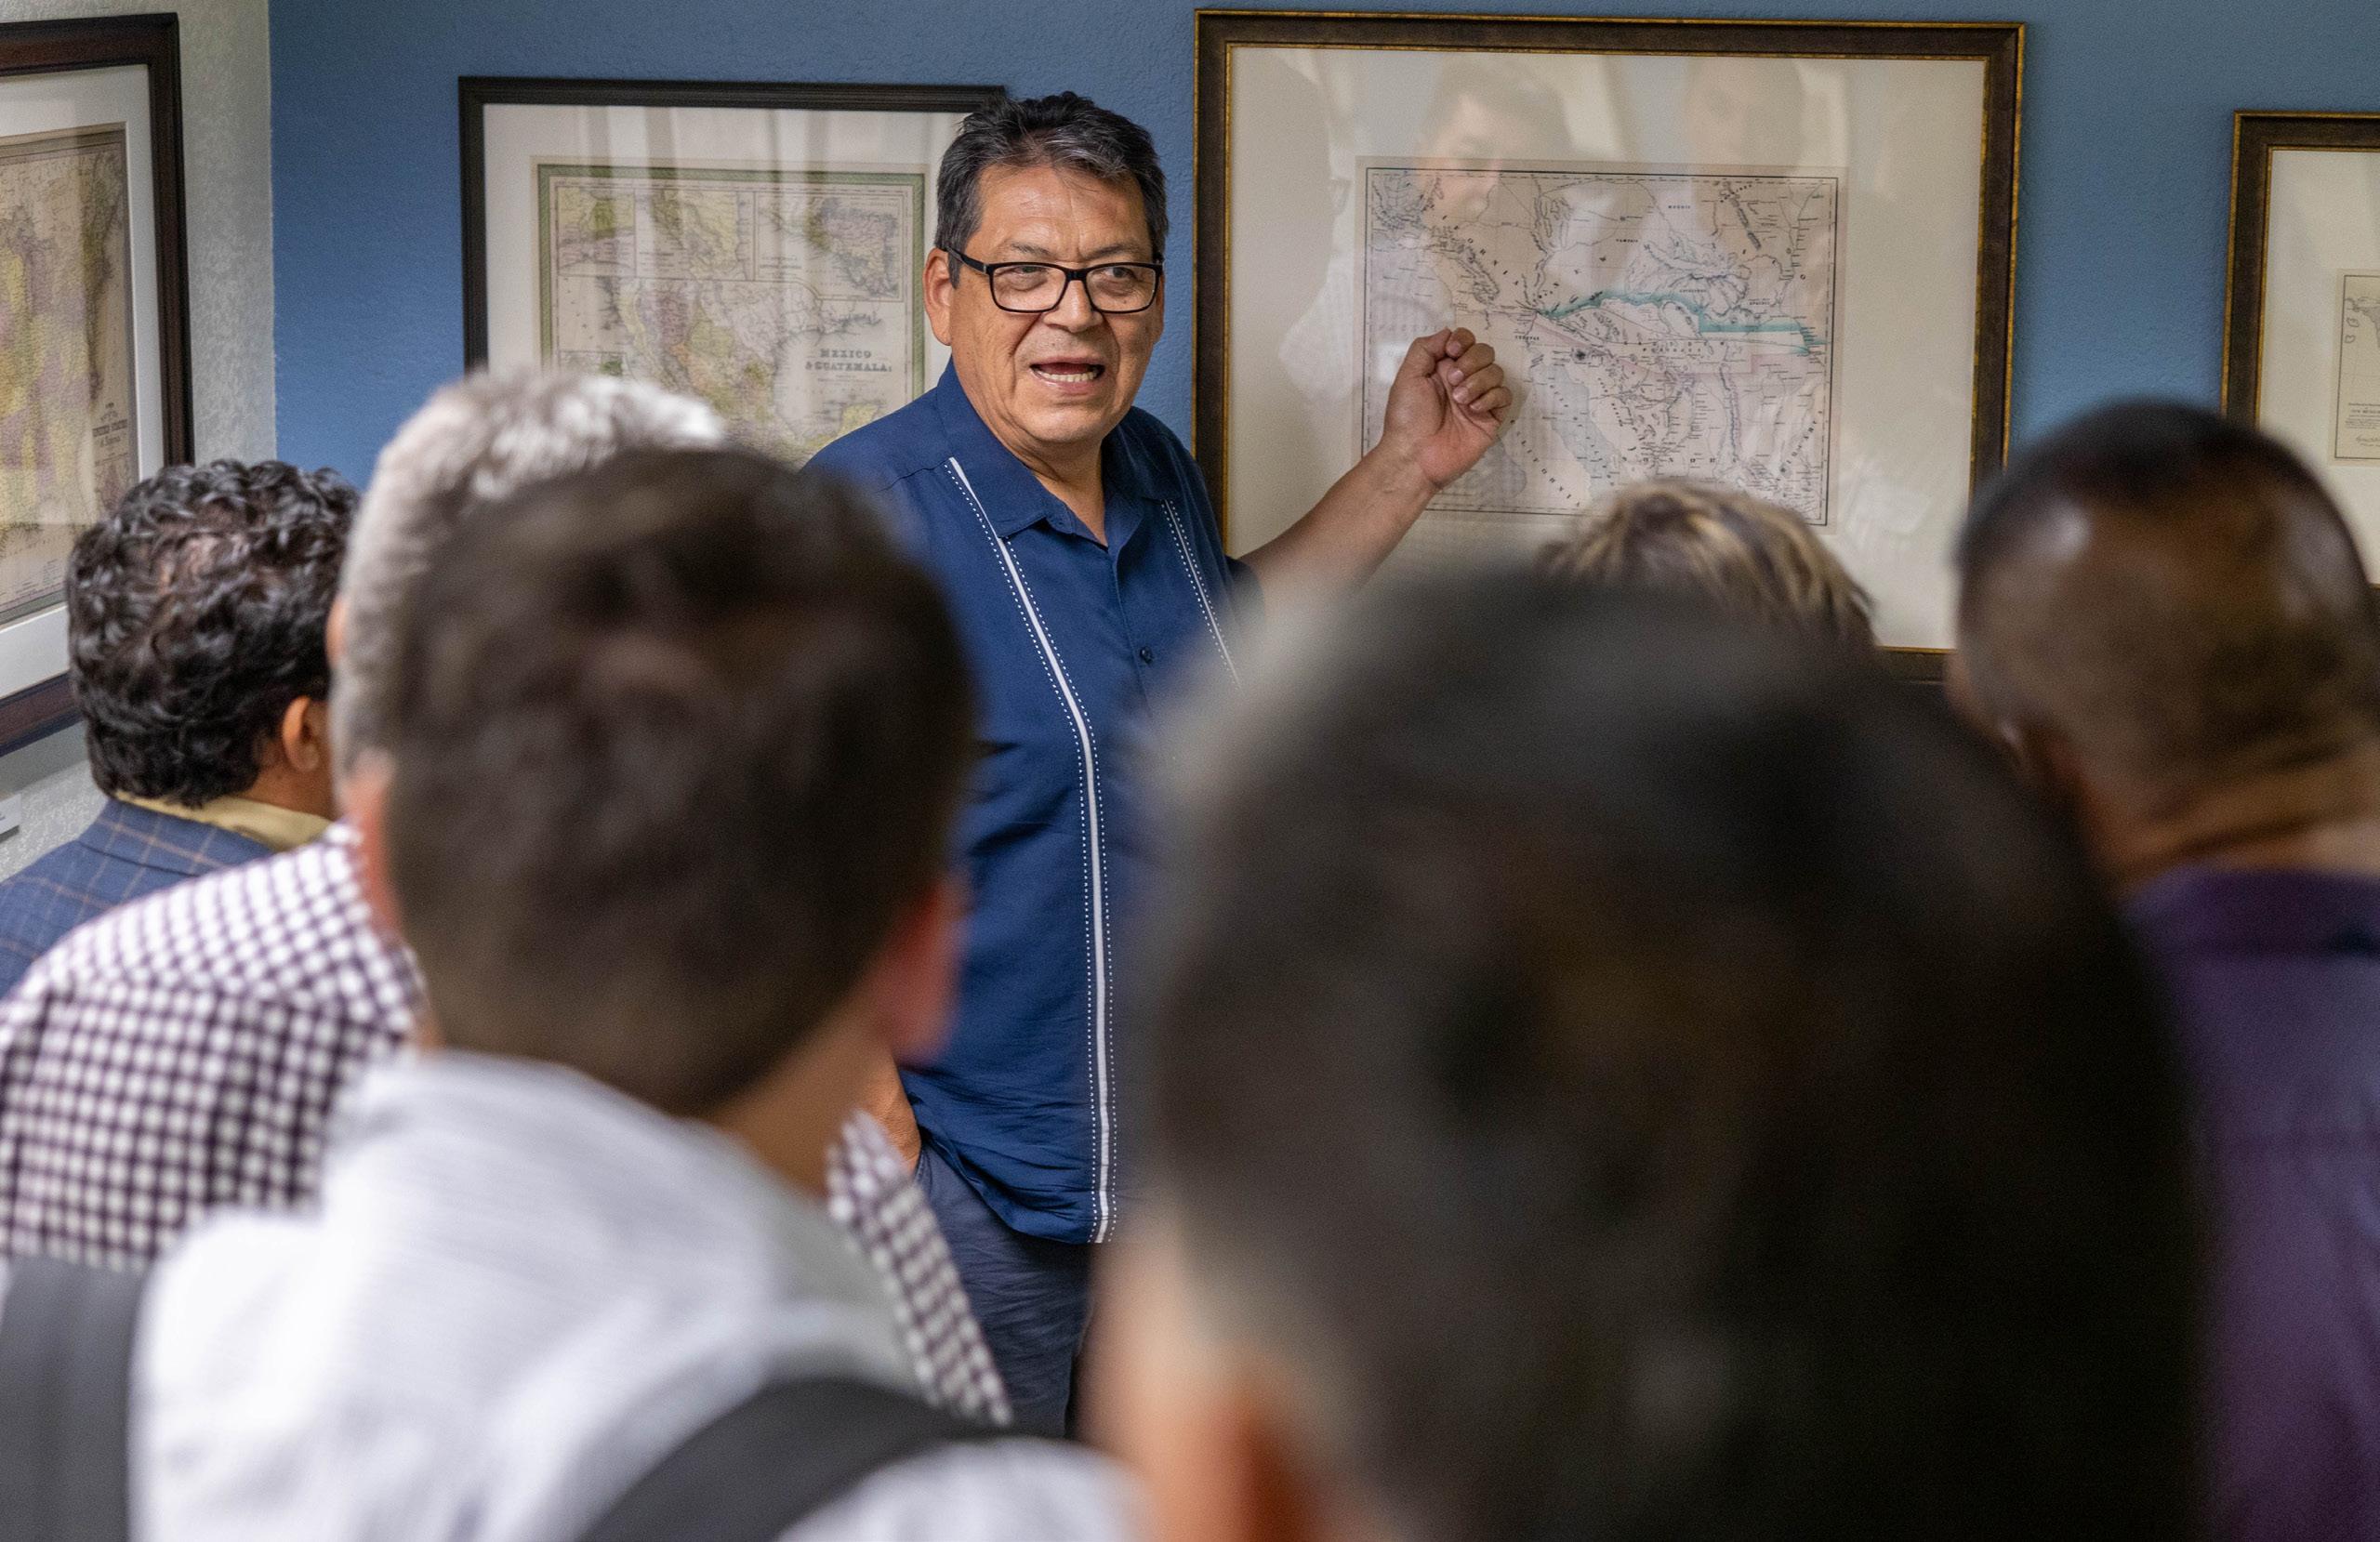


200 INTERACTIVE DASHBOARD
201 IN FOCUS
204 EXCERPT
210 EXCERPT
Community Safety Insights
BEATING THE HEAT TOGETHER:
The Red Cross and Partners Mobilize to Save Lives During Extreme Heat Events BY
EDGAR R. OLIVO
Improving Public Safety Through Better Accountability and Prevention
The Center for American Progress Explores Strategies to Improve Public Safety Through Accountability and Prevention Programs.
Crime Overview 2024 Arizona
According to the Arizona Department of Public Safety, Reported Crimes Were 3.68% Lower in 2024 Compared to 2023.
BY EDGAR R. OLIVO
Extreme heat is now the deadliest weather-related hazard in the United States. According to the National Weather Service, more people lose their lives each year to heat-related illness than to hurricanes, floods or tornadoes combined. In 2023, Maricopa County reported 645 heat-related deaths, the highest number ever recorded in Arizona. That crisis intensified in 2024 as extreme heat events became more frequent, more severe and longer lasting across the Southwest.
At the American Red Cross of Arizona and New Mexico, we are witnessing the growing impact of climate-driven disasters in real time. We respond to home fires, wildfires, flooding, extreme weather and dangerously high temperatures. The communities we serve are facing more risk with fewer resources, and our mission is clear: we are here to help people prepare, respond and recover.
Across the country, Red Cross volunteers respond to an average of 66,000 disasters every year. Billion-dollar events are now occurring every two weeks. In Arizona alone, our teams responded to 1,066 local disasters in 2025, supported 1,466 families, and distributed more than $982,000 in direct financial assistance. Through our statewide Home Fire Campaign, we installed 2,401 smoke alarms and helped create 842 escape plans, increasing household safety in some of our most vulnerable neighborhoods.
In response to the increasing dangers of extreme heat, we are taking bold actions. In 2025, we launched large-scale community outreach campaigns in partnership with government agencies, tribal nations and local organizations. Our goal is to get to zero deaths each summer by equipping people with the tools they need to stay safe. From heat safety canvassing to educational outreach, we are bringing life-saving information to doorsteps across Arizona.
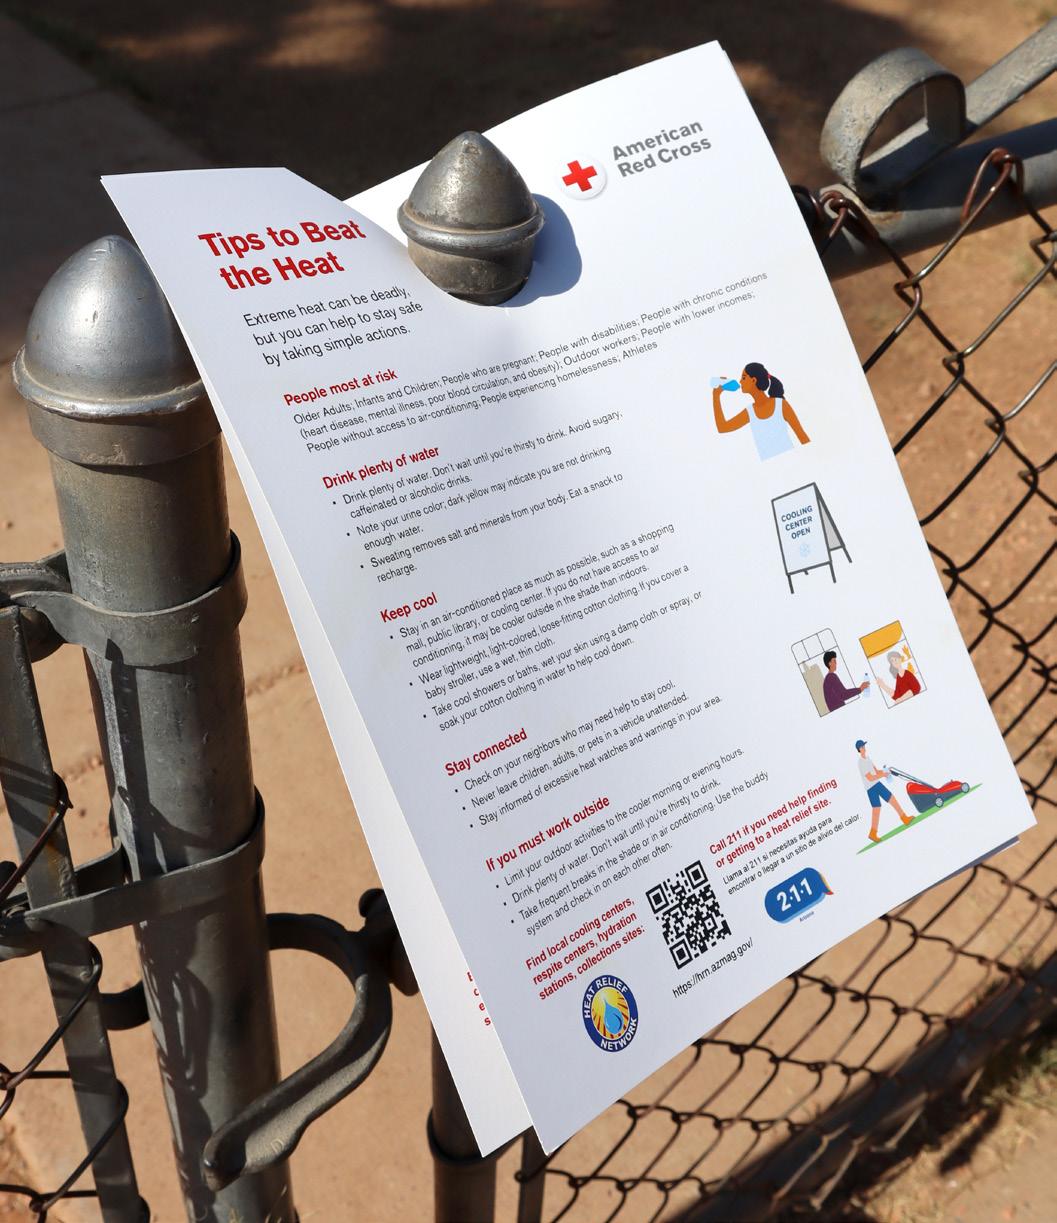
Extreme Heat Doorstep Education Outreach Events
Extreme Heat Doorstep Education Outreach events are one of our most impactful community preparedness efforts the local
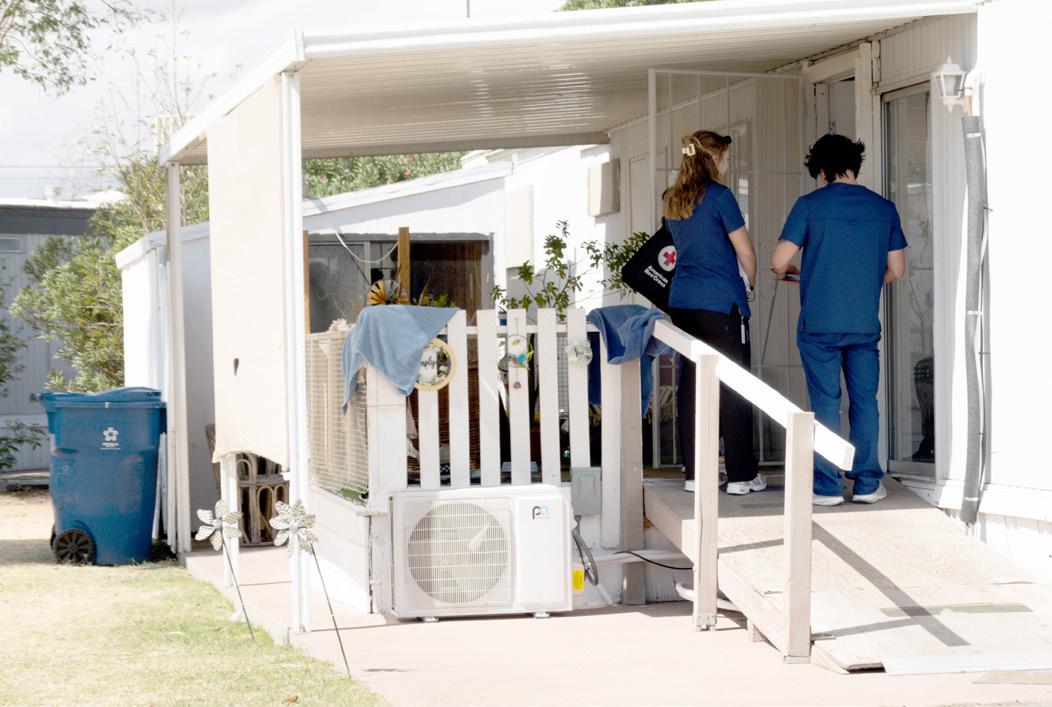
Red Cross launched in the City of Tolleson in 2024 in response to climate-driven heat emergencies. With a goal to distribute 150,000 bilingual door hangers, our campaign delivered simple but potentially life-saving information directly to the doorsteps of people in high-risk areas. And this season, in Tucson, Arizona, we have knocked on hundreds of doors in mobile home communities across many counties by engaging with local volunteer groups to check on our neighbors.
The extreme heat resources include tips on staying hydrated, recognizing symptoms of heat exhaustion and heat stroke, finding local cooling centers, and creating a personal heat safety plan. They also encourage residents to check on their neighbors, especially older adults, young children and individuals with chronic medical conditions. These groups are the most vulnerable when temperatures rise to dangerous levels.
While many people in Arizona are used to summer heat, they are not used to extreme heat. The lack of awareness and preparedness is costing lives, and which means we need to continue building resilience. These deaths are preventable when communities have the right tools and knowledge to stay safe.
This campaign is made possible by the powerful support of partners. From the Arizona Department of Health Services and
Maricopa County Public Health to tribal governments like Salt River Maricopa Indian Community, city leaders and grassroots organizations, the Red Cross is proud to be part of a coordinated movement to raise awareness and distribute resources.
One inspiring example took place in the City of Tolleson, Arizona, where local volunteers, Central Arizona Chapter board members, Alverno College nursing students, and community residents came together to knock on more than 200 doors in a single day. Recognizing that access to cooling centers remains a challenge for many, the City of Tucson partnered with us to amplify extreme heat safety tips and spotlight nearby cooling center locations, especially for residents in mobile home communities. Through strategic partnerships, we also extended our outreach to Mohave County, where some of Arizona’s highest temperatures are
recorded. Together, we engaged in meaningful conversations and delivered critical information in both English and Spanish, ensuring communities had the tools they needed to stay safe.
Small businesses are key allies in building community resilience. The Red Cross offers free emergency preparedness training for business owners, including tips for responding to extreme heat. Whether it is offering water, sharing door hangers or serving as a neighborhood cooling space, small businesses can have a big impact.
During an extreme heat event, take these essential steps:
• Stay cool by avoiding the sun and staying in air-conditioned spaces.
• Drink water often, even if you are not thirsty. Avoid alcohol and caffeinated drinks.
• Postpone outdoor activities or limit them to early morning or evening hours.
• Check on family, friends and neighbors who may be vulnerable.
• Never leave anyone, including pets, in a parked vehicle.
These simple actions can save lives. But real resilience is built when we look out for one another. Studies show, communities that know their neighbors recover faster, respond better and save more lives. A knock on the door. A shared bottle of water. A moment of care. These are the building blocks of stronger, safer neighborhoods. To learn more about how to get involved, please visit redcross.org/aznm.
Edgar Olivo is the regional chief executive officer of the American Red Cross of Arizona and New Mexico. He leads regional efforts to build community resilience, improve emergency response systems and ensure equitable services for vulnerable populations across the Southwest. Edgar brings deep expertise in Latino community engagement and a strong commitment to climate adaptation and public health outreach.
Improving Public Safety Through Better Accountability and Prevention
The Center for American Progress Explores Strategies to Improve Public Safety Through Accountability and Prevention Programs.
SOURCE: Improving Public Safety Through Better Accountability and Prevention
8/26/25, 9:55 AM


Crime spikes during and after the COVID-19 pandemic affected every corner of the country and rendered public safety a While many categories of crime , these gains have not been across the country, and remain around causes and solutions As policymakers, elected officials, and community leaders craft public safety responses, they should resist resorting to punitive strategies such as more and , as these have failed to secure lasting and inclusive and have across the country, particularly communities of color

Improving public safety requires a comprehensive approach that pairs more effective and targeted accountability with greater investment into prevention, and reflects robust support for this strategy Effective accountability acknowledges and repairs wrongdoing while avoiding the harms of the past Strategies should be locally tailored and aim to reduce future crime by emphasizing rehabilitation and empowering people to rebuild their lives Policymakers and community leaders should also identify and reject criminal legal system policies that have failed to improve safety or have actively harmed communities Simultaneously, leaders should prioritize building infrastructure and services that prevent crime and foster well-being in the communities most harmed by crime Many of these prevention strategies can be implemented at lower costs than arrest and incarceration, and they also hold the greatest promise of durable reductions in crime and violence
Cities across the country are exploring a wide range of accountability and prevention strategies to reduce crime and improve safety, including expanding the range of services and experts available to meet community needs and building community collaborations focused on preventing crime Law enforcement plays a key role in addressing and solving serious crime, but communities are increasingly calling for evidence-based approaches that avoid the harms of overpolicing Strategies that center the people most affected by crime and that emphasize prevention have long been underutilized in relation to law enforcement and incarceration, yet offer a less harmful and more just and effective path to public safety This fact sheet outlines a two-part framework for accountability and prevention strategies that can improve public safety now and in the future
Leaders should embrace meaningful solutions to hold those responsible for wrongdoing accountable and stop crime and violence To be effective at reducing crime, accountability should rehabilitate and change behavior, empower people harmed by crime to repair their lives, and focus on reducing future crime
Serious crime, and gun violence in particular, remains one of the public’s largest safety concerns Police should focus their resources on reducing crime and violence without perpetuating the harms of aggressive enforcement or overpolicing, and they should build robust community partnerships to target the few people driving the majority of crime. Law enforcement, elected leaders, and community leaders can collaborate on the following solutions to hold accountable those who commit violent crime and reduce violence altogether:
8/26/25, 9:55 AM Executive Summary: Improving Public Safety Through Better Accountability and Prevention - Center for American Progress https://www americanprogress org/article/executive-summary-improving-public-safety-through-better-accountability-and-prevention/
■
■
Tailor solutions to community needs through better data collection and collaboration by collecting, analyzing, and sharing firearm-related data and gunshot injuries from multiple agencies This should include information on gunshot-related deaths and injuries captured by county and city hospitals and involve regular, systemwide reviews of other types of serious crime to build accurate and timely profiles of crime and violence challenges within communities
■ Improve the serious crime solve rate by increasing the time and personnel that police dedicate to serious crime investigations, including for nonfatal shootings Law enforcement should also expand training and support for detectives, lower detective caseloads, hire civilian support for nonenforcement functions, and shift enforcement priorities away from routine traffic and other minor violations
Improve police-community relations and crime investigation outcomes by eliminating aggressive policing tactics such as “stop and frisk,” chokeholds, and quick-knock and no-knock warrants Police departments should improve hiring and recruitment tactics to build a more experienced, diverse, and effective police force and improve training and resources for officer wellness and community engagement Police departments and elected leaders should hold officers accountable for misconduct, violence against civilians, and other forms of corruption.
People should be held accountable in ways that address underlying issues, deliver holistic and restorative outcomes, and reduce the likelihood of future criminal activity Most criminal legal system approaches fail to interrupt cycles of crime or put people on a better path. Stakeholders and elected leaders should change accountability strategies to focus on the following solutions:
■ ■ ■ Expand and increase access to community-based diversion and treatment programs that target underlying issues that drive people to commit certain crimes, including pre-booking diversion, prosecutorial-led diversion, and court-based programming Eligibility for these programs should be expanded to ensure participation by the widest possible range of people, including those charged with felonies, those charged with both first-time and repeat offenses, and people who cannot afford program fees
Ensure age-appropriate accountability strategies for children that recognize their unique developmental stage and allow for growth and change. This includes prioritizing supportive services such as counseling, social services, and mental health care in schools over police presence; implementing school-based restorative justice practices that prioritize mediation and repair; and employing diversion programs as early as possible once a child has become involved with the juvenile legal system Eliminate barriers for people with criminal convictions and provide them with meaningful second chances by removing barriers to rebuilding their lives This includes increasing the supply of and expanding access to safe and affordable housing, passing automatic record expungement measures, banning questions about criminal records on employment and training program applications, and increasing access to safety net programs including health care and food assistance
8/26/25, 9:55 AM Executive Summary: Improving Public Safety Through Better Accountability and Prevention - Center for American Progress
to prioritize supporting crime sur vivors
Robust and timely victim services are instrumental to interrupting cycles of retaliatory violence, as many perpetrators were first victims who never received the necessary treatment, services, or support to address their trauma They can also improve police investigations by fostering trust between crime survivors and law enforcement The following solutions prioritize supporting crime survivors and victims:
■ ■ Interrupt cycles of retaliatory violence through comprehensive, culturally relevant, and trauma-informed services immediately after a crime and throughout the investigation The most impactful supports include trauma recovery and other hospital-based intervention programs that offer medical services and wraparound support for people at risk of further violence and additional services such as housing, relocation, legal, and financial support
Expand victim compensation funding streams to increase available resources, incentivize collaboration across providers, and reduce reliance on criminal fines and fees State and federal administrators of victim services and funds should also remove harmful exclusions to ensure support reaches those who have been historically excluded, including gunshot victims, people perceived as contributing to their own victimization, and people with prior criminal offenses or outstanding fines
Investing in prevention strategies will improve public safety by changing the conditions that give rise to crime A wide range of approaches that can have both an immediate and long-term impact on crime are available to policymakers
One of the most significant factors driving violent crime is easy access to firearms States that have weaker gun laws are experiencing higher homicide rates, faster increases in mass shootings, and higher rates of police officer fatalities than states with strong gun laws State and federal legislators can adopt the following policies to reduce gun violence:
■ ■ ■ Pass extreme risk protection order laws, which create civil remedies to allow the temporary removal of weapons from individuals who pose a high risk of violence to themselves or others.
Adopt child access prevention and safe storage laws, which require secure storage of locked and unloaded firearms, preventing theft and unauthorized access by others, and which impose penalties on gun owners if a failure to properly secure a firearm results in access by a child
Pass permit-to-purchase laws that require an individual to apply to local or state law enforcement, complete a thorough background check with fingerprinting, and complete a firearms safety course in order to purchase a firearm
8/26/25, 9:55 AM Executive Summary: Improving Public Safety Through Better Accountability and Prevention - Center for American Progress
■ Create accountability for the gun industry by repealing federal protections that created unprecedented immunity for gun manufacturers, dealers, and advertisers from civil lawsuits, even in the cases of negligence and criminal or unlawful misuse of a firearm or ammunition
Communities face a wide range of social challenges that police are poorly equipped to address and that divert resources from investigating and solving serious crime Leaders should expand the suite of community-based, civilian-led services and resources available to people in crisis and vulnerable communities, including those at risk of violence, and ensure government infrastructure exists to coordinate and support these strategies:
■
■
■ Establish and expand community responder programs that reduce the burden on law enforcement and more effectively respond to community needs by dispatching specialized teams of experts including nurses, paramedics, peer specialists, social workers, behavioral health specialists, and mediators to situations that do not require armed officer involvement
Develop and sustain community violence interventions that interrupt cycles of violence and retaliation by conducting targeted outreach to people most at risk of violence through credible, community-based organizations that can mediate conflict, connect individuals to resources, and collaborate across social services to address unmet needs
Build local government infrastructure to support community partnerships, including establishing dedicated offices within city governments that can coordinate a whole-of-government and communitycentered approach to public safety, develop comprehensive public safety plans, and provide support for an ecosystem of community organizations and service providers
To build lasting safety, historically marginalized and neglected communities need investments in the kinds of institutions that create stable communities and foster well-being Federal, state, and local leaders can adopt both immediate and long-term strategies to improve access to each of these community institutions:
■ ■ Expand access to public health and housing resources that reduce crime and the conditions that lead to crime, including expanding access to Medicaid and substance abuse treatment centers, increasing the supply of affordable, high-quality housing; providing rental assistance; and improving housing infrastructure
Increase economic opportunities in disinvested communities that are proven to reduce crime including subsidizing youth summer jobs and subsidizing employment for individuals at high risk of violence in conjunction with support services and providing direct assistance to people experiencing sudden financial shocks, such as eviction or homelessness
8/26/25, 9:55 AM
■
Protect and empower young people by providing them with opportunities to learn positive social and conflict resolution skills; investing in before- and after-school programs for at-risk young people; providing school-based support; and providing targeted, wraparound violence intervention services for young people who have been affected by violence
Improve the built environments of neighborhoods that have been systematically disinvested from, neglected, redlined, and segregated by removing or repairing abandoned homes and those of low-income residents, turning vacant lots into parks and green spaces, increasing tree canopy, and increasing street lighting
Durable and equitable safety requires a comprehensive set of strategies that improve accountability for both the people and systems that cause harm alongside investment into infrastructure and services that prevent crime altogether Elected and community leaders should act swiftly to identify critical safety challenges and collectively commit to building locally tailored, community-centered policies that create thriving neighborhoods
The positions of American Progress, and our policy experts, are independent, and the findings and conclusions presented are those of Amer can Progress alone American Progress would like to acknowledge the many generous supporters who make our work possible


Our goal is to reduce gun violence by enacting strong gun laws, increas ng investment in local solutions, and growing the movement ded cated to this m ssion
Data is collected from participating agencies on a monthly basis and all charts reflect data processed prior to the current day. The current year does not reflect a full 12 months of data and should not be compared to previous years.
3.68% Lower in 2024 Compared to 2023.
SOURCE: Crime Overview 2024 Arizona
Data is collected from par ticipating agencies on a monthly basis and all charts re�ect data processed prior to the current day. The current year does not re�ect a full 12 months of data and should not be compared to previous years.
The data on this page is based on data repor ted in the legacy FBI format (known as "Summary"), which has some limitations. Since 2017, some agencies in the state have been repor ting more detailed repor ts (known as "NIBRS"). As a result, the data may not re�ect the data exactly as submitted by the agency. For exact repor ting information, please contact the repor ting agency
The graphs in this theme are an overview of crime in the jurisdictions within the state of Arizona. Number of Crimes: 243,023
5-YEAR TREND

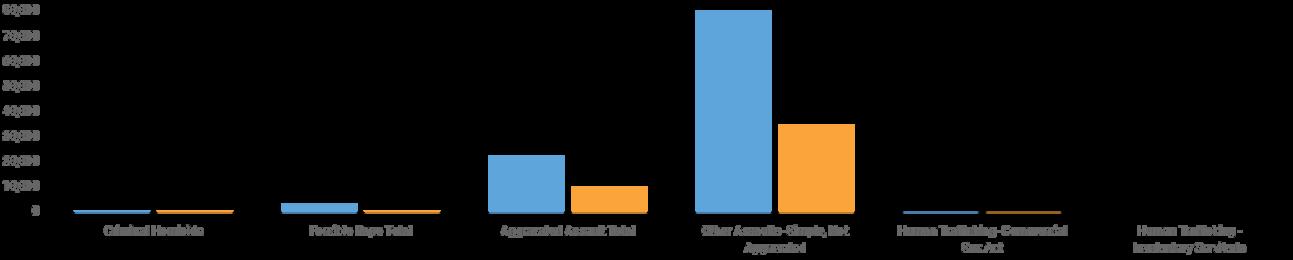
At Lyft, we recognize the power and potential of the Latino community, a vibrant tapestry of visionaries, creators and game-changers driving us towards a brighter future.
That’s why we’re proud to partner with the Arizona Hispanic Chamber of Commerce at DATOS, where we celebrate the indomitable entrepreneurial spirit of the Latino community.


We’re more than a financial institution – we’re clearing the way for you to achieve your dreams.
INTERACTIVE DASHBOARD
Transportation Options Insights
SPECIAL FEATURE Transportation
Univision Communications takes a close look at auto insurance and auto repair & service in the Phoenix and Tucson markets
IN FOCUS
EXCERPTS
EXCERPTS
Support on Track for Local Businesses
JULIANA VASQUEZ-KEATING
Key facts about Arizona’s surface transportation system
Arizona’s Surface Transportation System is Underfunded and Require More Investments to Improve it.
The CDC Foundation’s Public Health Action Guide on Public Transportation, Found That Increased Access to Frequent and Timely Public Transportation Resulted in Less Traffic, Less Vehicular Crashes, Less Congestion and Lowered Community Healthcare Costs.


BY JULIANA VASQUEZ-KEATING
When a major transit project is introduced in a community, local businesses often face a delicate balancing act: managing shortterm disruptions while preparing for long-term opportunities. Valley Metro and the City of Phoenix worked together to minimize construction disruptions while maximizing opportunities for local businesses during the construction of the light rail in South Phoenix.
Launching in 2019, the Business Assistance Program had a 93% participation rate among eligible businesses. Of the 406 businesses located within a quarter mile of the construction corridor, 379 took advantage of one or more program elements that would help them during construction and position them for success once light rail service began.
"We have been very grateful to Valley Metro's assistance during the construction of light rail," said Pradip Popat, owner of Corral Cleaners. "We have taken advantage of several elements of Valley Metro's Business Assistance Program, including grant funding and social and website support, which was really appreciated."
The program operated on four core principles: construction mitigation, marketing, direct financial support and business consulting services.
The first pillar of the program focused on keeping businesses visible and accessible during construction. In addition to business access signage, a dedicated community relations team also served as a direct liaison between construction partners and local businesses. They offered construction updates and responded to inquiries.
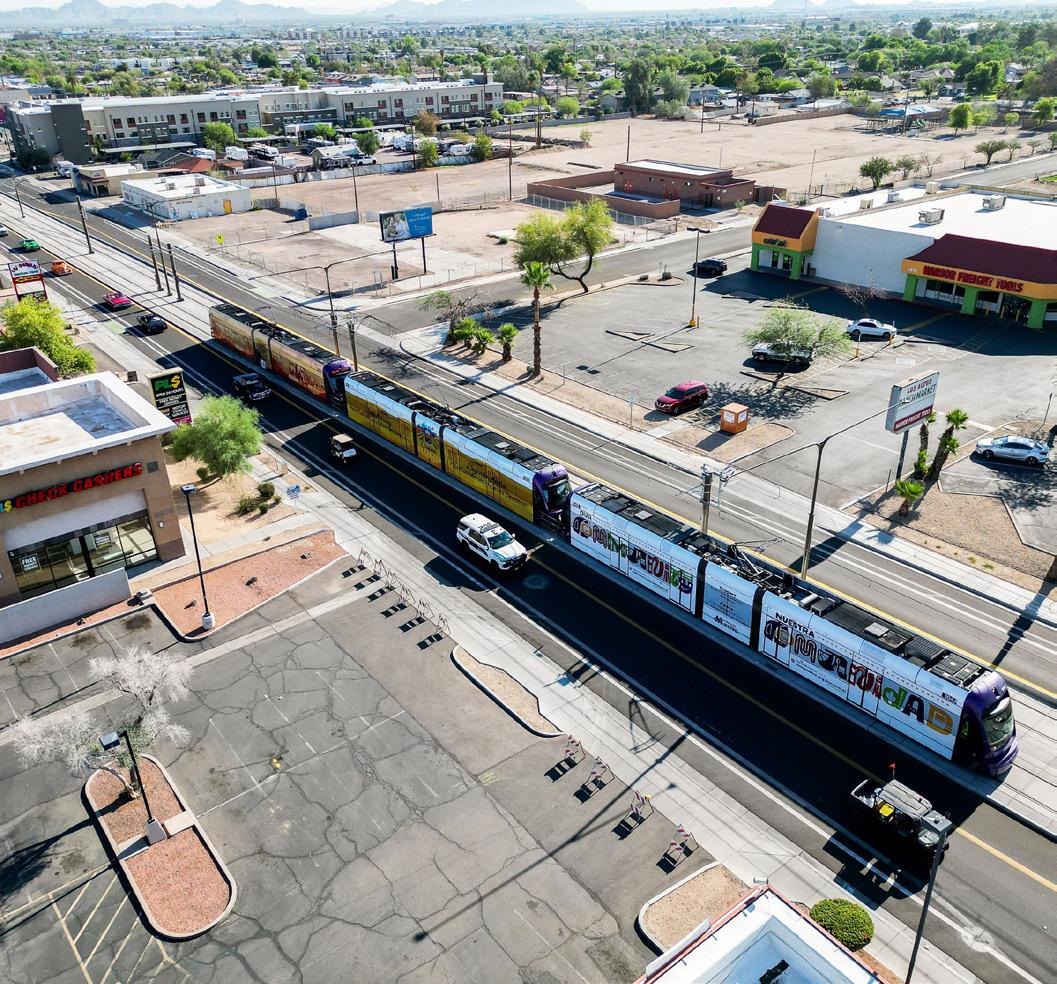
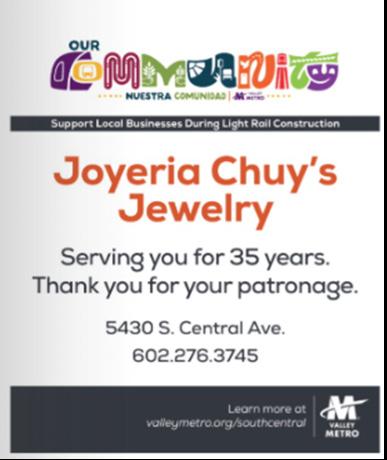
Beyond access, Valley Metro also provided extensive marketing and advertising opportunities for increased visibility. Businesses could take advantage of individual ads in local English and Spanish publications at no cost.
Valley Metro also focused on creative ways to encourage community members to support local businesses who
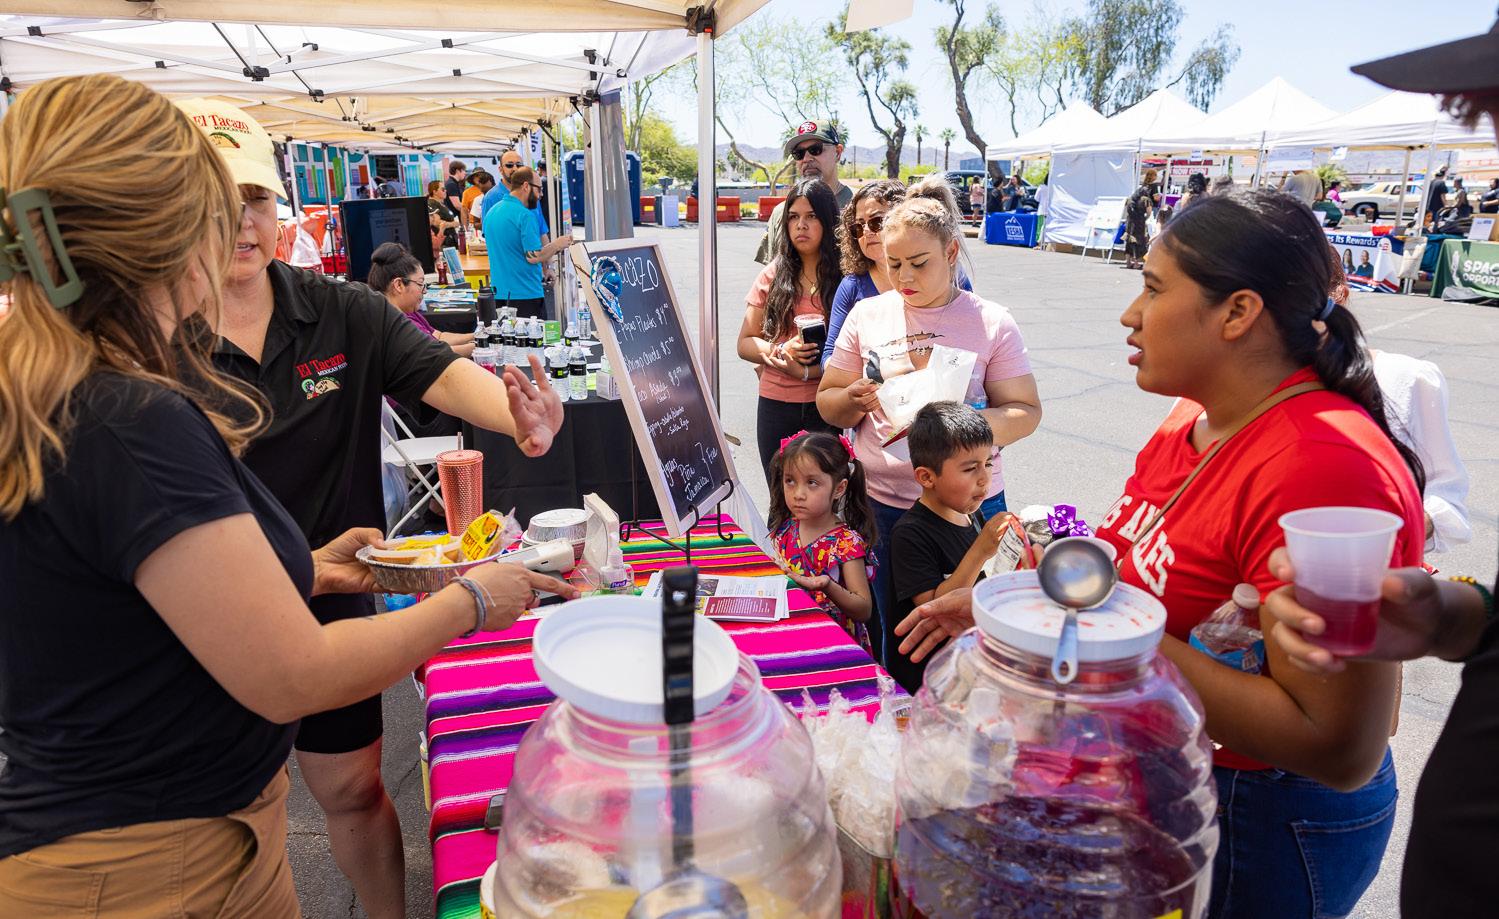
were impacted early on by the pandemic, as well as throughout construction. Lunchtime promotions at local restaurants helped build back business at local establishments.
“Fiesta on Central” events featured more than two dozen businesses and showcased local arts and entertainment, drawing more than 300 community members at each of the three events.
Business Boosters
Complimentary business consulting services were provided
to 83 businesses along the construction corridor. Most services included marketing and advertising support, website development, Search Engine Optimization assistance and even the creation of business logos.
“I am so happy with the website, Grace Foster of Andy’s Shoe Shine & Repair said.
“The consultant really went the extra mile to find the right image for the home page and showcase the shop.”
Direct financial assistance was also provided to small and micro-businesses along the corridor through the Small Business Financial Assistance Program (SBFAP). The SBFAP was a first-ofits-kind program created with significant community feedback and
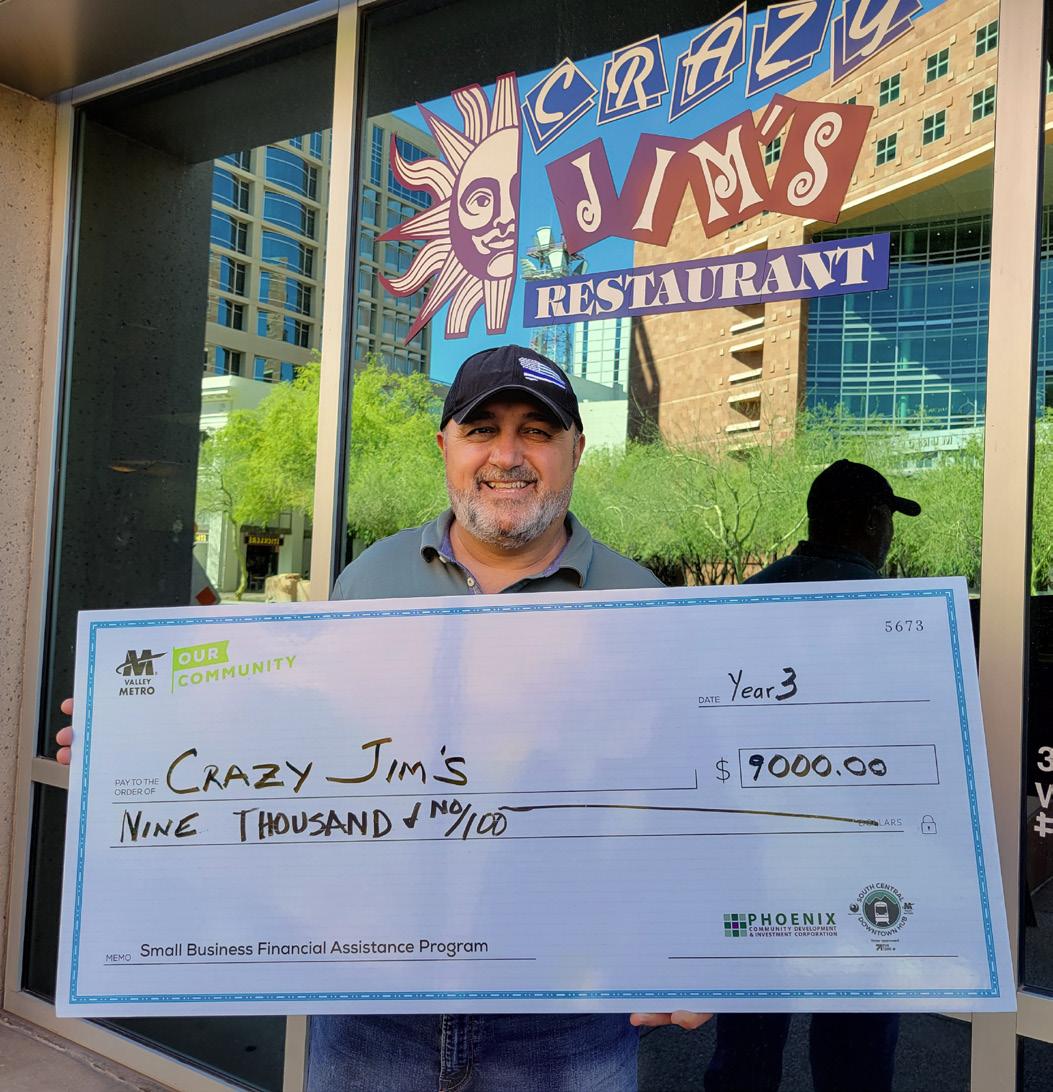
financial backing from Phoenix Transportation 2050 (T2050) and the Phoenix Community Development & Investment Corporation (PCDIC) that offered grants between $3,000 and $9,000
Since launching in 2021, 272 grants totaling $1.6 million were distributed to small and micro-businesses along the SCE/DH corridor.
"It helped me a lot with my rent when we needed the most help, Albert Behram, Crazy Jim’s restaurant owner said.” During COVID-19 we were very slow and when Valley Metro started helping small businesses like mine, it was a huge deal to us.”
While supporting businesses through construction was the program's core purpose, its impact extends well beyond project completion. Valley Metro designed the opening celebration of the new light rail extension in south Phoenix to showcase local businesses. The Cruisin' Central celebration provided a powerful
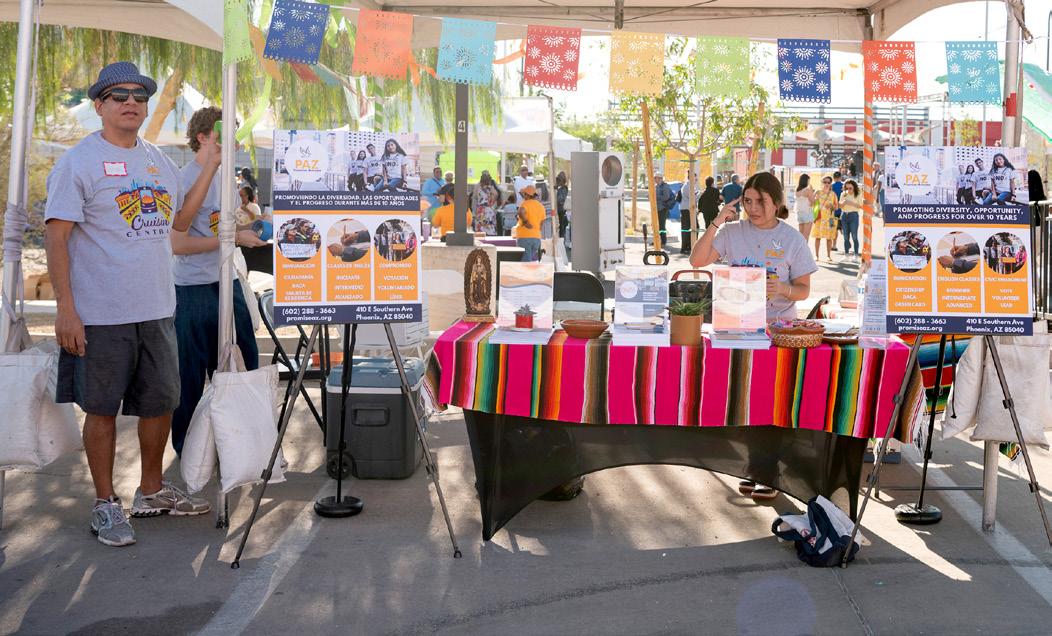
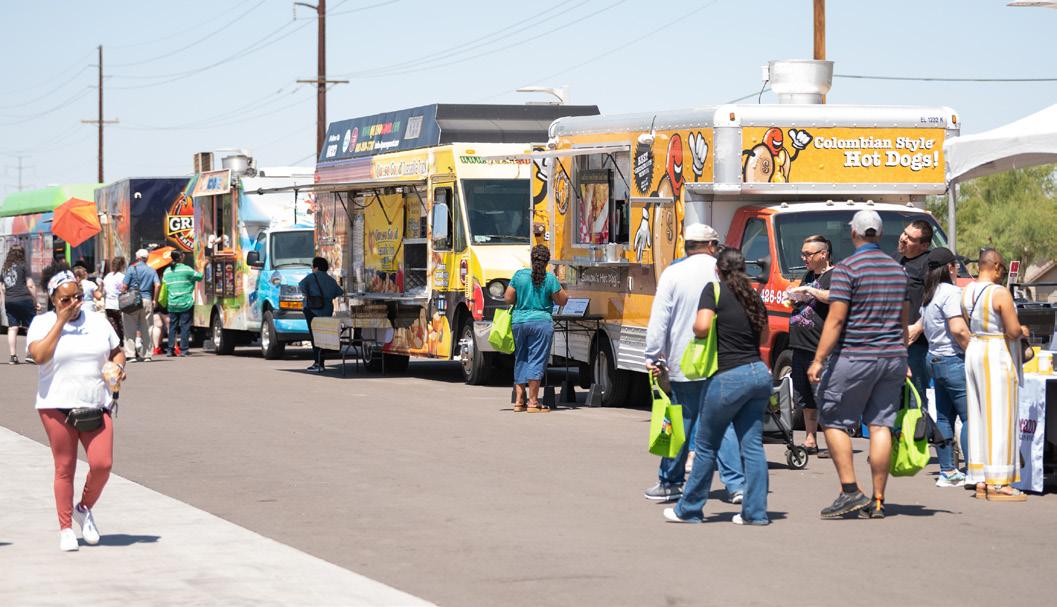
platform for businesses to connect with new customers. Festivities at three locations gave more than 50 local businesses the opportunity to engage directly with more than 5,000 attendees.
Valley Metro also developed the Cruisin' Central Business Digital Directory as a strategic tool to drive both ridership and business patronage once the extension opened. The directory lists more than 350 businesses along the new alignment and encourages residents to ride light rail to visit participating locations. Customers could check in at businesses using the digital pass for
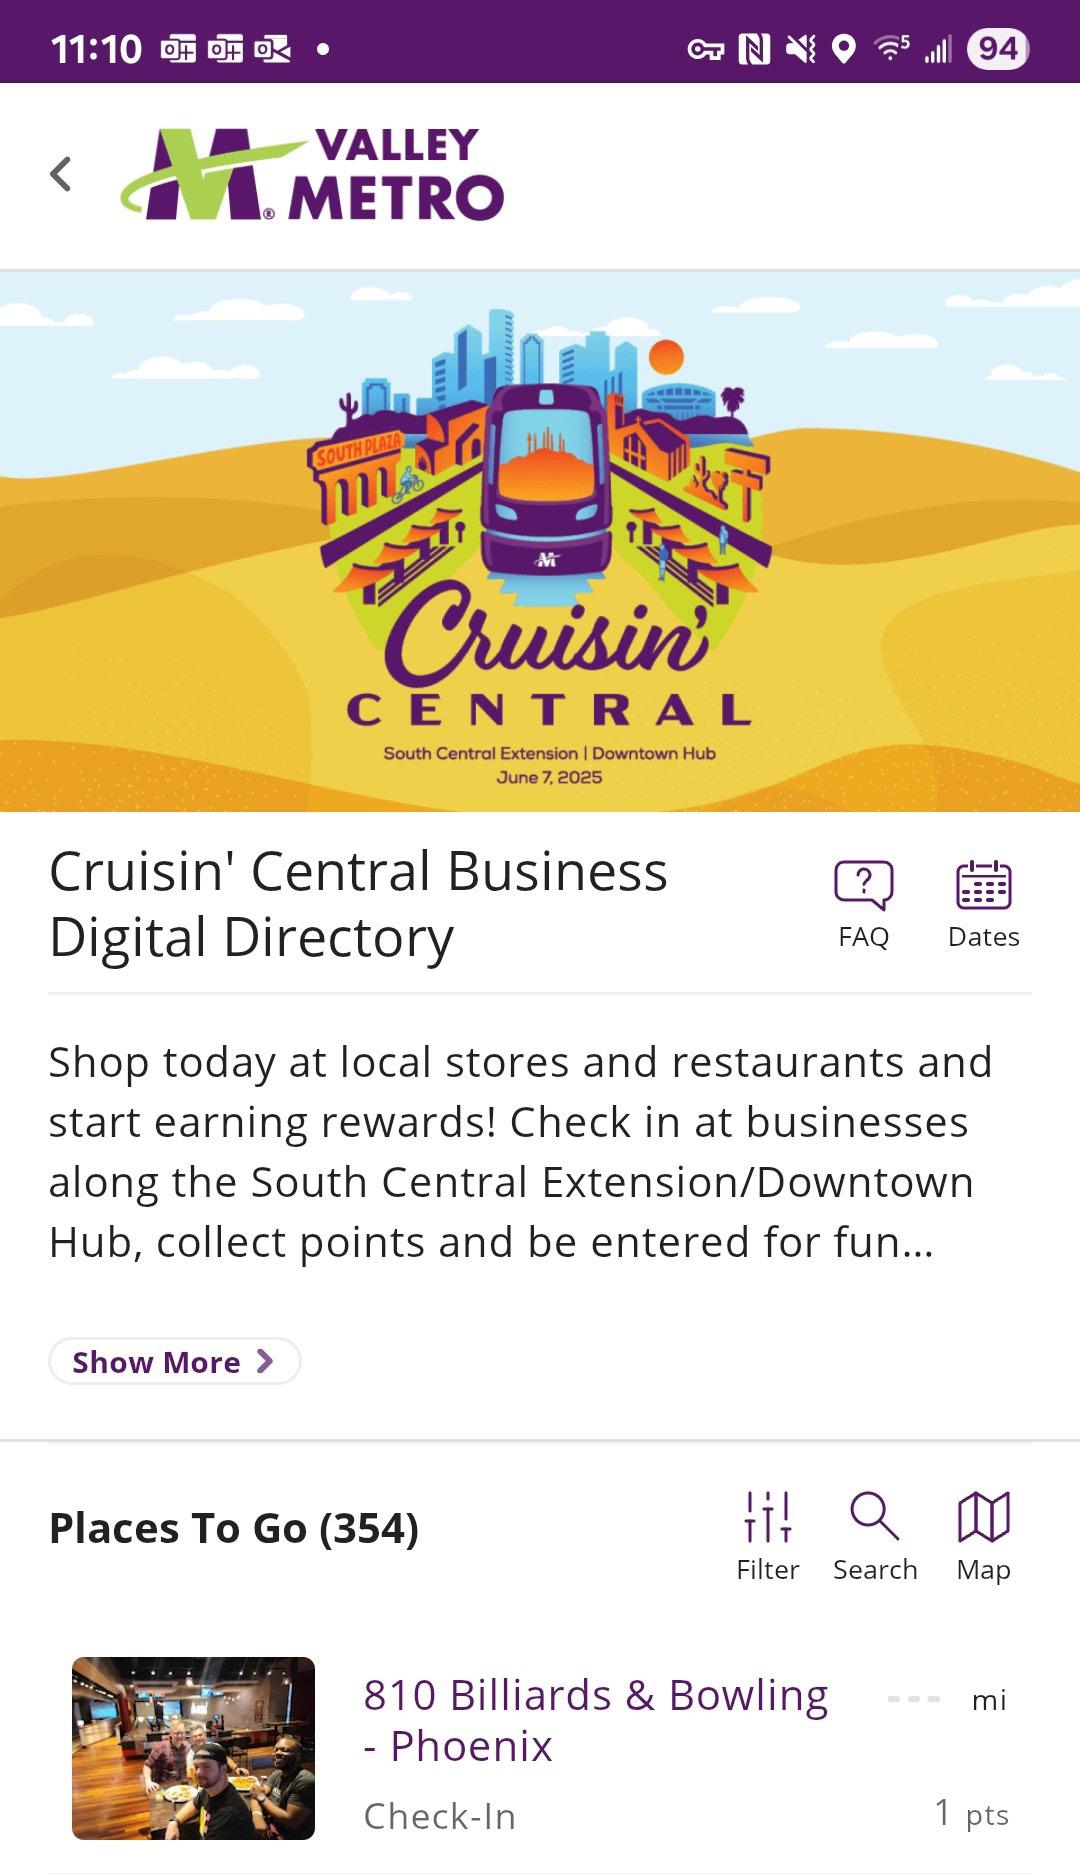
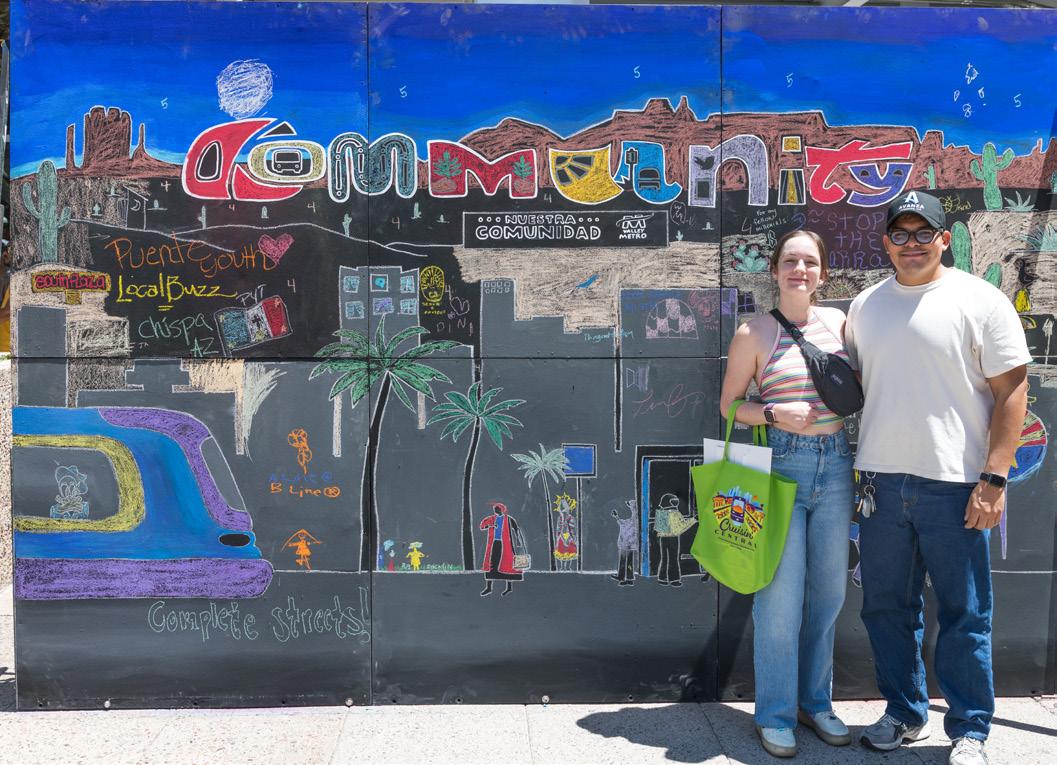
chances to win prizes, helping to boost both transit ridership and local commerce.
Community outreach and business assistance staff remain committed to the community beyond opening and is working to develop continued outreach strategies to support businesses along the line, encourage ridership and address concerns and questions about the new service.
A model for major construction projects
Valley Metro's Business Assistance Program demonstrates how large-scale infrastructure projects can strengthen local business communities even during construction. By listening to community
feedback and building programs around those insights, agencies can also build trust in the communities where they're working.
The program can serve as a blueprint for any agency planning major construction projects. Whether building transit, highways or other infrastructure, one thing is clear: when communities invest in both progress and the businesses that serve them, everyone moves forward together.
JulianaVasquez-KeatingisapublicinformationofficerforValleyMetro Regional Public Transportation Authority. Based in Phoenix, Arizona, Vasquez-Keating manages media relations and other communications initiativesthat connectwiththousands oftransit riders daily.
Key facts about Arizona’s surface transportation system
TRIP: A National Transportation Research Nonprofit.
Arizona’s Surface Transportation System is Underfunded and Require More Investments to Improve it.
SOURCE: Traffic & Road Research Reports | TRIP
Investing in Arizona’s surface transportation system improves road and bridge conditions and reduces driver costs
• A total of 54% of Arizona’s major roads are in poor or mediocre condition. Driving on deteriorated roads costs Arizona motorists $5.1 billion a year – $871 per driver – in the form of additional repairs, accelerated vehicle depreciation, and increased fuel consumption and tire wear.
• A total of 1% of Arizona’s bridges are rated in poor/structurally deficient condition, meaning there is significant deterioration to the major components of the bridge. A total of 40% of the state’s bridges were built prior to 1970. Many bridges that are 50 years or older may require significant rehabilitation or replacement.
• Vehicle travel in Arizona dropped by 33% in April 2020 due to the Covid-19 pandemic (as compared to the same month the previous year), but rebounded to 12% above pre-pandemic levels by 2024. Since 2000, vehicle travel on Arizona’s roads increased 53% and the state’s population increased 48%.
• The Infrastructure Investment and Jobs Act (IIJA), signed into law in November 2021, will provide $5 billion in federal funds for highway and bridge investments in Arizona over five years, including a 29% increase over the previous federal surface transportation program. The IIJA is set to expire on September 30, 2026.
• Construction cost inflation, the erosion of motor fuel taxes due to inflation, improved fuel efficiency, and the adoption of hybrid and electric vehicles threaten the state’s ability to keep pace with growing transportation needs. The Federal Highway Administration’s national highway construction cost index, which measures the rate of inflation in labor and materials cost, increased 54% from the beginning of 2022 through the third quarter of 2024. Roadway improvements can reduce traffic crashes and save lives
• From 2020 through 2024, 6,101 people died on Arizona’s highways, an average of 1,220 annual fatalities. Arizona’s traffic fatality rate of 1.59 fatalities per 100 million vehicle miles of travel is higher than the national average of 1.2.
• A total of 898 people were killed in traffic crashes in work zones in the U.S. in 2023, 34% higher than a decade ago. There were 132 work zone fatalities in Arizona from 2019 to 2023. Work zone safety can be improved through the use of safety countermeasures including improved work zone design, improved driver messaging, high-visibility markings and speed enforcement.
• Traffic crashes in Arizona imposed a total of $9.3 billion in economic costs in 2024. TRIP estimates that a lack of adequate roadway safety features, while not the primary factor, was likely a contributing factor in approximately onethird of all fatal traffic crashes, resulting in $3.1 billion in economic costs in the state in 2024. These costs include work and household productivity losses, property damage, medical costs, rehabilitation costs, legal and court costs, congestion costs, and emergency services.
Investing in our transportation system generates jobs, fosters economic recovery and growth, and improves safety
• Investments in the surface transportation system will boost Arizona’s economy in the short-term by creating jobs and in the long-term will enhance economic competitiveness, stimulate sustained job growth, improve access and mobility, improve traffic safety, reduce travel delays, and improve road and bridge conditions.
• Roads and highways are the backbone of our economy, allowing Arizona motorists to travel 78.6 billion miles annually and moving a significant portion of the $365 billion worth of commodities shipped to and from the state each year. But, conditions on the system are deteriorating, as the need for transportation improvements far outpaces the amount of state and federal funding available.
• The design, construction and maintenance of transportation infrastructure in Arizona supports approximately 65,000 full-time jobs across all sectors of the state economy. Approximately 1.1 million full-time jobs in Arizona in key industries like tourism, retail sales, agriculture and manufacturing are completely dependent on the state’s transportation network.
Latest data from the U.S. Census Bureau, USDOT, FHWA, BTS, ARTBA, NHTSA, and AAA compiled and analyzed by TRIP.

Public Transportation Drives Health by Moving People CDC Foundation, Together our impact is greater.
The C DC Foundation’s Public Health Action Guide on Public Transportation, Found That Increased Access to Frequent and Timely Public Transportation Resulted in Less Traffic, Less Vehicular Crashes, Less Congestion and Lowered Community Healthcare Costs.
SOURCE: New Action Guide Promotes Health Benefits of Expanding Public Transportation Systems
PUBLIC HEALTH ACTION GUIDE
PROBLEM In the United States, 45% of people have no access to public transportation,1 making it difficult to access jobs, food, education, healthcare services, and social connections.
SOLUTIO N All modes of public transportation are important, but bus routes play a special role in the lives of Americans. Frequent and reliable bus routes allow for service to more destinations over a larger area and can adapt to meet the changing needs of communities. Buses are also used by more people who depend on public transportation, thereby providing greater equity benefits.2
RESULTS Increasing access to frequent, reliable public transportation can lead to fewer traffic vehicle crashes, reduced air pollution and associated respiratory illnesses, and increased physical activity levels.3 Even people who don’t use public transportation benefit from less traffic congestion, less pollution, and lower community costs for healthcare. Buses can connect more people to everyday destinations by allowing riders to get closer to their final destinations.
What is Public Transportation?
Public transportation varies by community and includes many mobility options for the public such as: BUSES
PARATRANSIT
SUBWAY SYSTEMS
How Can Public Transportation Improve Economic Development and Health?
PEOPLE
Increases access to jobs, schools, grocery stores, and medical care
Increases physical activity
Reduces respiratory symptoms including asthma
Helps conserve limited resources for families who would struggle to pay for a private vehicle
Provides personal mobility and freedom
COMMUNITIES
Improves air quality by reducing pollution
Reduces injuries and deaths from motor vehicle crashes
Reduces traffic congestion, improving air quality and quality of life for all
Revitalizes communities and stimulates local economies
Minorities are more likely to depend on public transportation.
HOUSEHOLDS THAT DO NOT OWN A CAR: 4
Over two thirds of riders walk to their stop or station.1
87% of trips on public transit directly affect the local economy.1


INTERACTIVE DASHBOARD
230
231 IN FOCUS
Parks and Recreation Insights
235 EXCERPT
EXCERPT
237
INSPIRED BY MARY ROSE
Leading with Heart, Serving with Purpose BY COUNCILWOMAN KESHA HODGE WASHINGTON, ESQ.
Parks: The Great Unifiers
The Trust For Public Lands Surevy of Park Attendees Reveals That Americas View Their Local Parks Favorably and Want to Spend More Time There
Outdoor Recreation Satellite Account, U.S. and States, 2023
In Arizona, the Value Added of the Outdoor Recreation Economy Accounted for 2.7 of the State’s GDP.


BY COUNCILWOMAN KESHA HODGE WASHINGTON, ESQ.
Mary Rose Wilcox didn't just break barriers; she demolished them. As the first Hispanic woman elected to the Phoenix City Council, the first Hispanic woman to serve as vice mayor of Phoenix, and the first Hispanic woman elected to the Maricopa County Board of Supervisors, Mary Rose boldly transformed “firsts” from personal achievements into community victories. Her decades-long commitment to Phoenix and Maricopa County gave and continues to give voice to those that had been previously silenced, proving that when barriers fall, entire communities rise. Her unwavering commitment to equity and community continues to inspire leaders like me, who share her belief that public service is rooted in compassion, courage and connection.
As someone who also broke barriers as the first African American woman elected to serve on the Phoenix City Council, I carry a deep personal connection to her story. I know the weight of being “the first.” I understand the responsibility that comes with it and the strength it takes to continue showing up, even when the road isn’t easy. It’s a path Mary Rose helped pave, and I walk it today with admiration and gratitude.
I vividly remember joining Mary Rose at the 2023 Latinos Contra Cancer Community Resource Fair, held in conjunction with the Barrios Youth Project, a space she has long uplifted through her service. It was days after I won the runoff election, and although we had met before, this moment stood out. Despite having supported my opponent during the campaign, what she offered me that day when I approached her was something far more meaningful: words of acceptance and belonging. She told me that what mattered most was showing up for our community, and that she was glad I was there doing just that.
That day, Mary Rose walked me through the American Legion Post 41, a powerful space built specifically for minority soldiers returning from World War II. She wanted me to meet the leadership and as much of the community as possible. Next door sits “El Portal,” the restaurant she owns with her husband, Earl Wilcox.
El Portal is a home away from home for many, it is the heart of the Grant community on the corner of 2nd Ave and Grant St. That afternoon, they welcomed me with warmth and humility.
Mary Rose even joined my transition team. It was more than a gesture; it was clear that Mary Rose’s love for this city is not just rooted in politics, it lives in the neighborhoods she’s fought for, the spaces she’s preserved, and the relationships she’s built. My respect for her leadership and her heart for community only deepened.
Mary Rose’s commitment to equity extended to her work on the City’s General Obligation Bond initiatives. In 2006, she led the GO Bond campaign, helping secure vital investments across Phoenix. Seventeen years later, in 2023, she continued that legacy by serving as chair of the parks and recreation subcommittee on the
GO Bond Executive Committee. In that role, she helped identify and prioritize ten impactful projects totaling $64 million, ranging from aquatic facilities and sports courts to new recreation centers, and park improvements. She also championed funding for smaller, yet meaningful, upgrades that improve the daily lives of families. Her leadership in both efforts reflects a long-standing dedication to making Phoenix more equitable, inclusive and livable for all. When I took on the role of co-chair of the 2023 GO Bond, she was right there, doing her part to ensure the passage of the bond.
Mary Rose’s work has always been grounded in heart and vision. Revitalizing the Grant Park neighborhood remains one of her key priorities, and she and her husband, Earl Wilcox, became stewards of the park through a meaningful public-private partnership with the City of Phoenix. Together, they helped transform the area into
a space that served and uplifted the surrounding community. She founded the City of Phoenix Kool Kids program, which allowed children to swim for free at public pools, and, alongside, Earl helped launch and run the city’s Late Night Basketball program, offering free sports programming for inner-city youth for over 30 years. From co-leading the Grant Park Barrio Youth Project, which continues to provide educational and cultural programming, to championing health equity, education, workers’ rights and immigrant voices, her legacy runs deep. She stood on the frontlines of the Chicano and farmworker movements, registered voters, marched and proudly served as a member of the United Farm Workers Union. She also served on the Phoenix 2010 Census Complete Count Committee, working to ensure underserved communities were fully counted. Her advocacy helped shape not just policies, but the very spirit of Phoenix.
Earlier this year, I had the honor of recognizing Mary Rose and other influential women of the Chicano Movement at the historic Santa Rita Hall. I and former Councilmember Carlos Galindo-Elvira joined forces to unveil “Avenida de Las Mujeres” and present medals to each honoree for their lifetime of service. When I noticed that Mary Rose was not in attendance, I stopped by her home to
share the news and personally tell her about the recognition. She then met us at El Portal, where we officially presented her medal, surrounded by a number of the other honorees.
Just a few weeks later, on April 19, 2025, we gathered again this time outside her restaurant surrounded by Mary Rose’s family and members of the community she’s served so faithfully. Together, we unveiled “The Mary Rose Wilcox Way,” a street sign that now stands as a lasting tribute to her tireless work, unwavering resilience and profound love for our city. She said something that day that stays with me: “Most people don’t live to see a street named after them.” And yet, she was, receiving her flowers, surrounded by generations she helped uplift in the community she helped build.
Mary Rose Wilcox is, in every sense, the embodiment of community. She has created opportunity where there was none, stood fiercely for families and fought to bring resources to neighborhoods too often ignored. Even in the face of violence, when she was shot in 1997 for standing up for what she believed, she remained undeterred. Her voice did not waver; it grew stronger. Her life’s work continues to be a powerful example of courage, resilience and a deep, unwavering commitment to justice.
INSPIRED BY MARY ROSE: LEADING WITH HEART, SERVING WITH PURPOSE
I am proud to know her, honored to learn from her, and committed to carrying forward the work she began and still leads with passion and purpose. We must continue sharing her story not only to honor the ground she has broken, but to inspire those still finding their voice. Her legacy is not something of the past. It is alive in the neighborhoods she has uplifted, the policies she has shaped, and the people she continues to empower.
Like Mary Rose Wilcox, I believe that true leadership begins and ends with service to community. I am proud to carry that torch, guided by her ongoing example, her courage and her enduring love for the people of this city.
Kesha Hodge Washington was sworn in as the District 8 Councilwoman on April 17, 2023, becoming the first African American woman elected to the Phoenix City Council. She brings over20yearsoflegalandgovernmentexperience, with a background that includes serving as an Assistant Attorney General and working in private practice. Her top priorities include addressing homelessness, expanding affordable housing, and promoting economic development. Originallyfrom the U.S. Virgin Islands, she is a first-generation college graduate, active community leader, and mentor who supports youth, women, and underserved residents.
District 8 City of Phoenix
200 W Washington St, Phoenix, AZ 85003
602.262.7493
www.phoenix.gov/administration/mayorcouncil/ district8.html
Social media handles: @phxdistrict8
Parks: The Great Unifiers Trust for Public Land
The Trust For Public Lands Survey of Park Attendees Reveals That Americas View Their Local Parks Favorably and Want to Spend More Time There.
SOURCE: Parks: The Great Unifiers - Trust for Public Land
Published annually since 2012, Trust for Public Land’s ParkScore® index ranks the park systems across the country’s 100 most populous cities This year, with growing division, disconnection, and distrust in our communities, the importance of investing in spaces that bring us together seems to have struck a particular chord with Americans across the country. For the first time, we are supplementing our annual rankings with national polling to better understand this dynamic and the role people hope for parks to play in bringing us back together
Washington, DC, defends its #1 ranking for the fifth consecutive year.
• Irvine, CA, jumped to 2nd place (from 4th last year), its highest-ever finish, propelled by continued progress on its “Great Park,” one of the most ambitious public park projects in the country
• Minneapolis, MN; Cincinnati, OH; and St Paul, MN, round out the top five.
• For the full rankings, see tpl org/parkscore
Parks are omni-partisan: Americans of all stripes deeply value and desire more time in their local parks, where they experience joy, connection, and strong civic engagement.
• In these increasingly polarized times, parks are also among the few settings free from partisan divide According to TPL research, a plurality of Americans— including both Trump and Harris voters—wish they’d spent more time outdoors last year than anywhere else, including home, place of worship, or the gym
• Two-thirds of respondents (66 percent Harris voters; 67 percent Trump voters) say they struck up a conversation with a person at a park they hadn’t known previously, with over half reporting a conversation with somebody of a different social or economic background
• Having a top park system matters Cities with topranked park systems have more friendships between people of different income groups, higher rates of volunteering, and more civic organizations than lowerranked cities
Since the COVID-19 pandemic, civic leaders have stepped up by investing both in necessary park repairs and in programs and people. They’re implementing trusted strategies and emerging best practices to ensure our shared public spaces foster greater public trust and serve as vital civic infrastructure.
• Seventy-six percent of ParkScore city residents live within a 10-minute walk of a park That’s an all-time record, up from 75 5 percent and 68 percent when the ParkScore index launched in 2012
• Across the 100 most populous cities, a record $12 2 billion was invested in park and recreation systems, the most since Trust for Public Land started tracking city park trends in 2007 and a 16 percent inflation-adjusted increase since 2019
• TPL’s annual survey of parks departments shows that— beyond just increasing funding and access—cities are changing how they create and steward their park systems More of them are investing in human capital— the fitness instructors, community leaders, and park neighbors—as the essential ingredient
This repor t explores these trends through the stories of civic leaders from four major U S cities—Atlanta, GA; Fort Worth, TX; Colorado Springs, CO; and Chicago, IL—that show us what can happen when leaders invest in the spaces that bring us together

Outdoor Recreation Satellite Account, U.S. and States, 2023
Bureau of Economic Analysis
U.S. Department of Commerce
In its Latest Report, the Bureau of Economic Analysis at the U. S . Department of Commerce, Reported That the Value Added of the Outdoor Recreation Economy Accounted for 2.7 of the State’s GDP.
SOURCE: Outdoor Recreation Satellite Account, U.S. and States, 2023 | U.S. Bureau of Economic Analysis (BEA)

EMBARGOED UNTIL RELEASE AT 10:00 a.m EST, Wednesday, November 20, 2024 BEA 24–53
Technical: Stanislaw Rzeznik (Regional) Connor Franks (National)
Media: Thomas Dail
301-278-9458
301-278-9710
301-278-9003
OutdoorRecreation@bea.gov
Thomas.Dail@bea.gov
New Statistics for 2023; Updates for 2012–2022
The U.S. Bureau of Economic Analysis released statistics today measuring the outdoor recreation economy for the nation, all 50 states, and the District of Columbia. The new U.S. data show that the value added of the outdoor recreation economy accounted for 2.3 percent ($639.5 billion) of currentdollar gross domestic product (GDP) for the nation in 2023 (national table 2). At the state level, value added for outdoor recreation as a share of state GDP ranged from 6 3 percent in Hawaii to 1 6 percent in Delaware, Connecticut, and New York The share was 0 8 percent in the District of Columbia (state table 1).
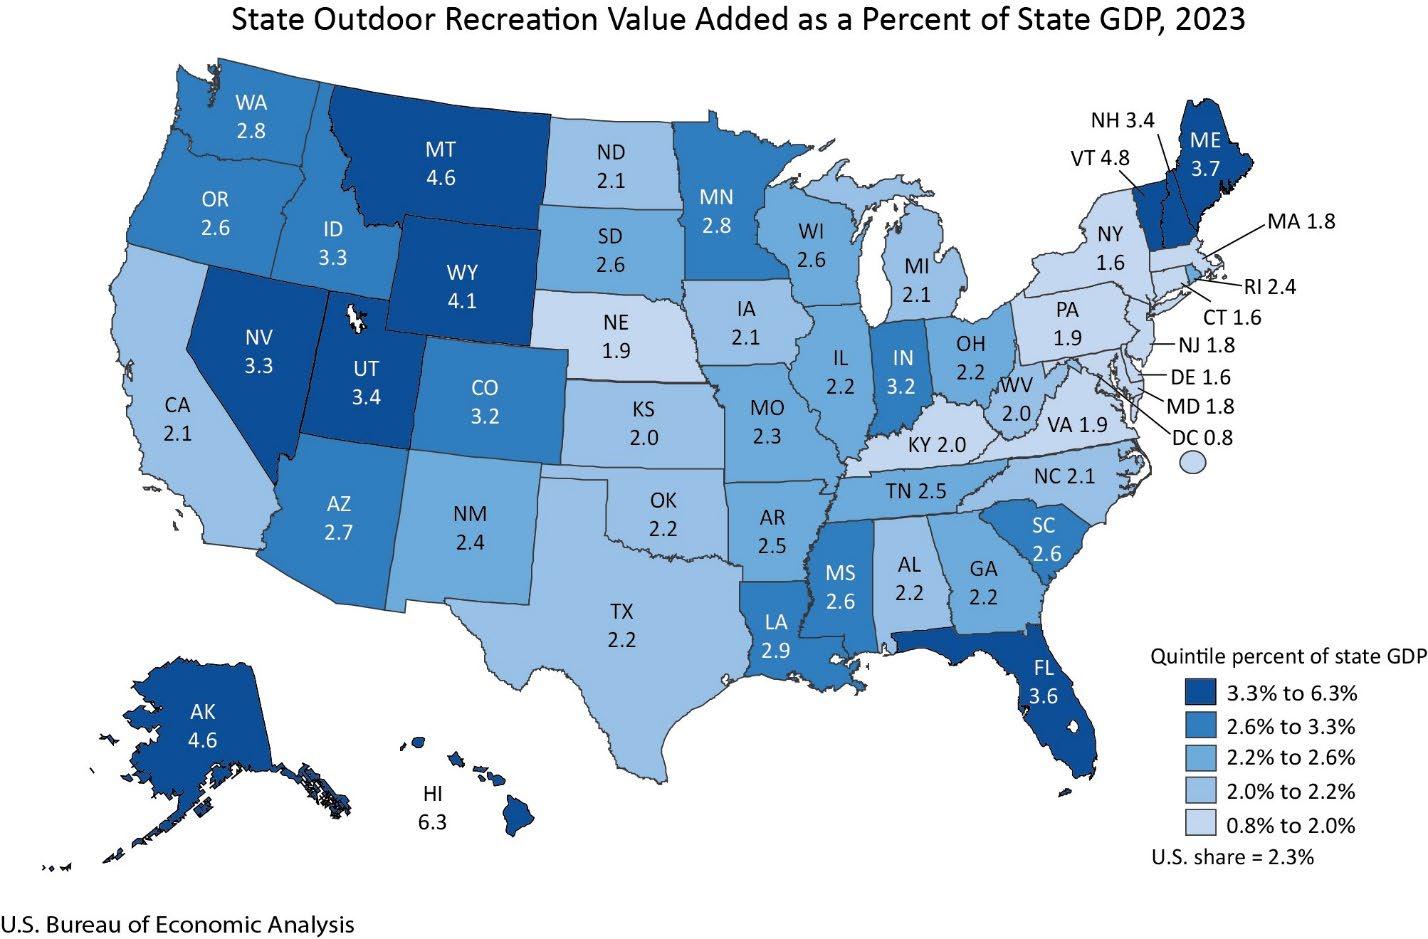
Inflation-adjusted (“real”) GDP for the outdoor recreation economy increased 3.6 percent in 2023, compared with a 2.9 percent increase for the overall U.S. economy, reflecting a deceleration from the increase in outdoor recreation of 10.2 percent in 2022 (chart 1 and national table 1). Real gross output for the outdoor recreation economy increased 3.2 percent, while outdoor recreation compensation increased 9.0 percent, and employment increased 3.3 percent (national table 9).
Page 2 of 8
Across all 50 states and the District of Columbia, outdoor recreation employment increased in 49 states and the District of Columbia in 2023, ranging from 7.5 percent in Alaska to 4.8 percent in Indiana. The percentage change was 3.8 percent in the District of Columbia (BEA interactive tables).
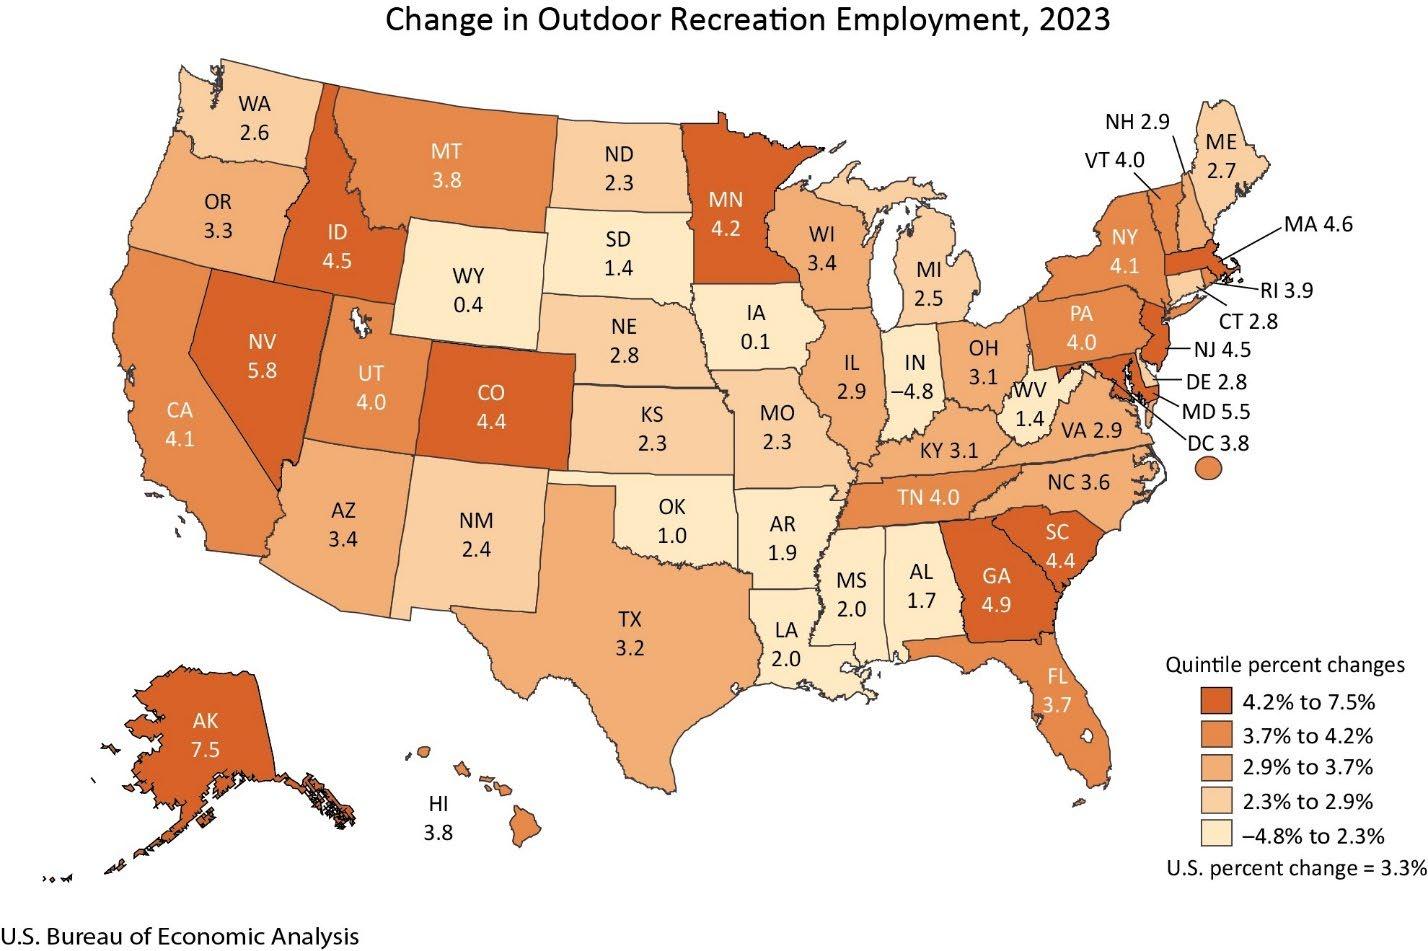
Outdoor recreation activities fall into three general categories: (1) conventional activities such as bicycling, boating, hiking, and hunting, (2) other activities such as gardening and outdoor concerts, and (3) supporting activities such as construction, travel and tourism, local trips, and government expenditures.
In 2023, conventional outdoor recreation accounted for 31.4 percent of U.S. outdoor recreation value added, compared with 32.7 percent in 2022 (chart 2). “Other outdoor recreation” accounted for 20.1 percent of value added in 2023, compared with 19.7 percent in 2022 Supporting activities accounted for the remaining 48.5 percent of value added in 2023, compared with 47.6 percent in 2022 Growth in supporting activities was led by travel and tourism, reflecting growth in spending on transportation, hotels, and restaurants (national table 4).
Page 3 of 8

Explore Guide to Your Future, a free bilingual website to help Arizona students and families plan for life after graduation with tools, tips, and support at every step. From exploring your options to finding ways to pay for school, we make the journey clear and achievable. ¡Tu Guía para el Futuro Después de la Escuela Secundaria!


INTERACTIVE DASHBOARD
244
248 IN FOCUS
EXCERPT
251
EXCERPT
256
Community Design Insights
Trees Matter BY
ARIEL STONE
The State Of Racial/Ethnic Equity In Children’s Neighborhood Opportunity In This Report, diversitydatekids.org Found That Children in Lower Opportunity Neighborhoods Have a Lower Life Expectancy Rate Than Children in Neighborhoods With Higher Levels of Neighborhood Opportunity.
The 2024 Annual Homelessness Assessment Report (AHAR) to Congress In the 2024 Annual Homelessness Assessment Report (AHAR) to Congress, the U.S. Department of Housing and Urban Development reports that homelessness on a single night in 2024 was the highest ever recorded.


BY ARIEL STONE
“Trees Matter is a local environmental nonprofit here in the Valley, and I have had the pleasure of taking part in its growth over the last nine years I have worked here. Through the efforts of our amazing staff, volunteers, donors and overall community support, we’ve been able to serve local communities in need of more access to the benefits of trees. Here is some background about our organization:
The need for trees in the Valley of the Sun has never been greater. Our communities depend on them not only for health and safety infrastructure but also for environmental heat mitigation. Through the education, distribution and planting of the right trees in the right place, Trees Matter fosters and inspires an increased, more balanced tree canopy in the Valley of The Sun. A resilient future is possible for all generations—we just have to plant it.
Trees Matter is a Phoenix-based 501 (c)(3) environmental education nonprofit. We see a need to provide resources to the public so they can properly choose, plant, care for and advocate for the trees. We encourage a culture of tree advocates and stewards. Our mission is to foster and inspire an increased, more balanced tree canopy in the Valley of the Sun. Our vision is a Valley where all generations have lifelong access to the benefits of trees for now and the future.
Trees offer many critical functions such as shade, pollution reduction, dust reduction, food, increased property value, carbon sequestration, and improved mental and physical health. The Valley has an immediate need for an increased tree canopy: Trees Matter works to alleviate this need by educating the public on tree knowledge, while distributing and planting trees to residents, schools, and parks across the Valley.
We have two utility shade tree programs: our SRP Shade Tree Program and our Mesa Shade Tree Program. Working in conjunction with the Salt River Project (SRP) utility company and City of Mesa, we distribute thousands of free desert-adapted shade trees to SRP customers and Mesa residents across the Valley every

year. This is our largest program, and also our longest running program, as well. Participants can receive up to two free trees after attending a workshop, teaching how to plant and care for their new shade trees. We conduct the multiple distribution events
a season, to reach as many residents as possible. By the end of each year through both programs, we distribute over 5,000 trees and educate almost 4,000 Valley residents
We also have our planting programs: Trees for Schools and other community plantings. Trees for Schools is a program that is actively increasing tree canopy coverage on school campuses, while educating students about the benefits of trees. This program provides free trees to schools, and hands-on planting experience to engage students, teachers and staff in the process of increasing urban forestry.
In addition to school campuses, we also plant trees in various parks and neighborhoods in need of more access to shade and other benefits of trees. Our focus is on finding ways to offer equal access to tree infrastructure. We canvas in neighborhoods where we are planting trees to support residents in signing up for our programming, as direct community outreach is critical to our work. Through our planting efforts, annually we plant hundreds of trees across the Valley, and engage almost 1,000 students through school plantings.
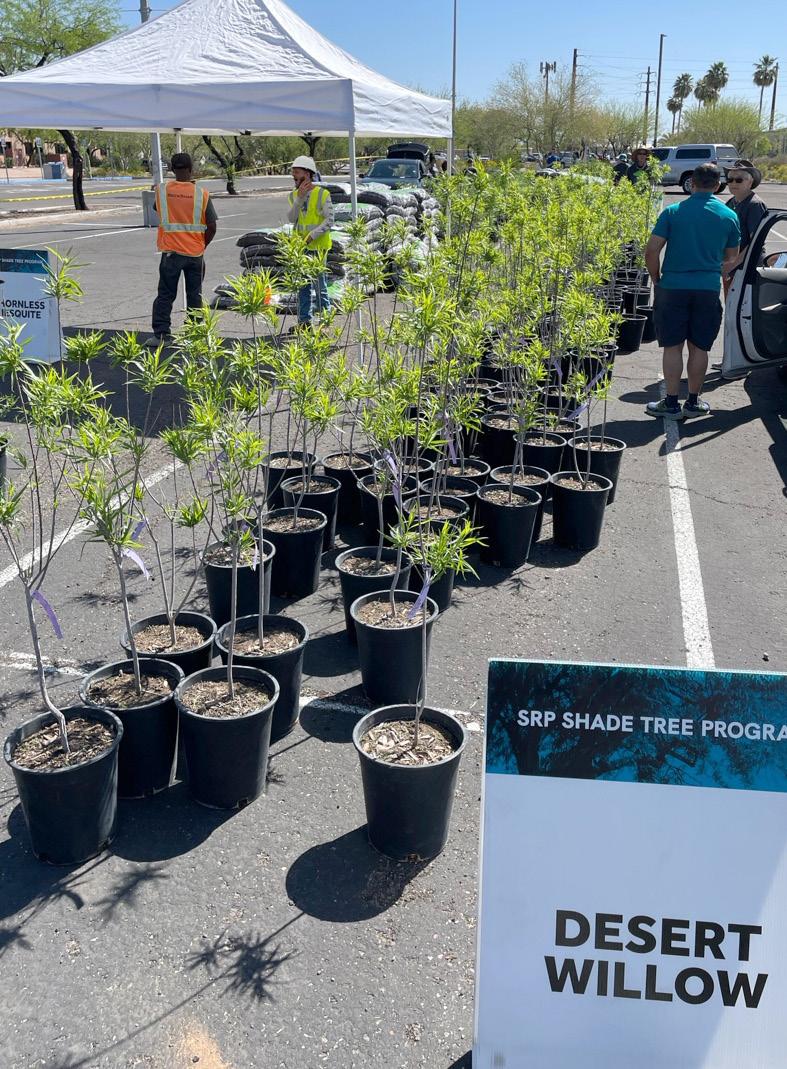
All this work would not be possible without our community! Support from you all is what keeps us going!
We hope to see you out there at upcoming events!
Trees Matter is a proud member of the Arizona Hispanic Chamber of Commerce, and we are grateful to take part in this year’s DATOS: TheStateofArizona’sHispanicMarket publication.”
Ariel Stone is the outreach manager for Trees Matter and has been with the organization since 2016. Ariel connects with thousands of volunteers, donors, event participants and overall community supporters annually through her work.
Trees Matter www.treesmatter.org 734 W. Polk St, Phoenix AZ 85007
treesmatter.org/subscribe
treesmatter.org/volunteer
treesmatter.org/volunteer
@TreesMatterAZ
The Great Start Readiness Program (GSRP), which provides public preschool to over half of eligible low-income four-year-old children in Michigan, uses the Child Opportunity Index to evaluate the extent to which the program is implemented equitably. GSRP serves over 35,000 young children in over 2,500 classrooms across Michigan. Funds for GSRP are administered through Michigan’s Department of Education to Intermediate School Districts, which implement programs through a network of providers locally across the state. Evaluations from Michigan State University have found that, compared to children who were waitlisted for the program, GSRP students have higher levels of kindergarten readiness and better school attendance through kindergarten, as well as reduced literacy gaps between higherand lower-risk learners.
State-funded evaluations use the Child Opportunity Index to assess the extent to which the program reaches children in high-needs communities. Public mapping projects overlay location data of GSRP sites with the Child Opportunity Index, demonstrating which low- and very low-opportunity neighborhoods are lacking public preschool sites. Evaluators are also investigating whether new preschool programs are opening in these lower-opportunity areas, and they are sharing that data in monthly meetings with local administrators.
Says Jamie Wu, the principal investigator at Michigan State leading these evaluations, the straightforward question administrators have from viewing COI maps is, “Why don’t we have a program in that area where opportunity is low?” Whether those barriers include staff shortages, zoning regulations or lack of suitable infrastructure, the Child Opportunity Index provides a starting point for real conversations to take place about how to provide highquality early education to children in those communities.
Supporting Neighborhood Opportunity (SNO Mass), run by Massachusetts’ Executive Office of Housing and Livable Communities, helps families with children eligible for Housing Choice Vouchers relocate to designated “opportunity areas,” as defined by the Child Opportunity Index. The program supports families in identifying neighborhoods with resources that support healthy child development and then finding appropriate housing there. Each family is matched with a mobility specialist, who supports families through the process of moving and settling into their new neighborhoods. SNO Mass also works closely with landlords, encouraging them to participate in the program and supporting them once they begin leasing to program participants.
Since the start of the program in 2019, diversitydatakids.org has partnered with SNO Mass to define its designated opportunity areas; provide the data and specialized support for its address locator tool; and customize the Child Opportunity Index to reflect local conditions.
Recent studies of SNO Mass participants’ experiences and early outcomes have promising findings. Overall, 125 families—including 270 children—have moved to higher opportunity neighborhoods since 2019 as a result of the program. The positive impacts for these families and their children have been profound. Interviews and surveys with 34 families reveal improved physical and mental health, feelings of safety, educational opportunities and access to green space in their new neighborhoods. Nearly all participants described their new neighborhood as inclusive and welcoming. The participants have also expressed great satisfaction with the program, with a remarkable 88% reporting no drawbacks for themselves or their children after relocating to their new neighborhood.
CITATION: Acevedo-Garcia, D., McArdle, N., Shafer, L., & Noelke, C. The State of Racial/Ethnic Equity in Children’s Neighborhood Opportunity: First Findings from the Child Opportunity Index 3.0. diversitydatakids.org and Brandeis University. www.diversitydatakids.org/research-library/state-racialethnic-equity-childrens-neighborhood-opportunity
While for the 100 largest metros combined there is a clear association between child neighborhood opportunity and life expectancy, the extent of inequity in life expectancy between very low- and very high-opportunity neighborhoods—the “life expectancy gap”—varies by metro. Figure 27 shows the 10 metros with the widest and the 10 with the narrowest life expectancy gaps. In the Dayton, OH metro area, which has a very large Opportunity Gap (82) between very low- and very high-opportunity neighborhoods, we observe a corresponding life expectancy gap of 10.1 years. On the other hand, in Provo, UT, which has a small Opportunity Gap (32), the life expectancy gap is only 3.1 years.
Figure 27: Ten metro areas with the widest and narrowest life expectancy gap (100 largest metropolitan areas)
Widest life expectancy gap (years)
Narrowest life expectancy gap (years)
Note: Life expectancy gap defined as the difference in median life expectancy at birth between the 20% of neighborhoods with the lowest opportunity and the 20% of neighborhoods with the highest opportunity in the specified metro area. Metro names abbreviated to first named city.
Sources: diversitydatakids.org Child Opportunity Index 3.0; American Community Survey, 5-Year Summary Files; U.S. Small-Area Life Expectancy Estimates Project (CDC-NCHS).
The Child Opportunity Index is associated with a range of other health outcomes, too. For example, using CDC PLACES data4 on health behaviors, conditions and other health measures, we find that the prevalence of diabetes, limited physical activity and obesity for adults over the age of 18 in the 100 largest metros increases as neighborhood opportunity decreases (Figure 28). In very low-opportunity neighborhoods, 38% of adults report being obese, 37% report having no physical activity outside of work and 14% have diabetes. In contrast, in very high-opportunity neighborhoods, only 26% of adults qualify as obese, 18% report having limited physical activity and just 8% have diabetes. Each of these health conditions can affect quality of life and lead to a range of other poor health outcomes.
CITATION: Acevedo-Garcia, D., McArdle, N., Shafer, L., & Noelke, C. The State of Racial/Ethnic Equity in Children’s Neighborhood Opportunity: First Findings from the Child Opportunity Index 3.0. diversitydatakids.org and Brandeis University. www.diversitydatakids.org/research-library/state-racialethnic-equity-childrens-neighborhood-opportunity
The extent of the inequity in socioeconomic mobility between very low- and very high-opportunity neighborhoods—the “socioeconomic mobility gap”—also varies across metros. Figure 30 shows the 10 metros with the widest and the 10 with the narrowest socioeconomic mobility gaps.
Figure 30: Ten metro areas with the widest and narrowest socioeconomic mobility gap (100 largest metropolitan areas, excluding Milwaukee and Madison)
Widest socioeconomic mobility gap
Richmond, VA
Philadelphia, PA-NJ-DE-MD
Baltimore, MD
Cleveland, OH
Milwaukee, WI
Birmingham, AL
Akron, OH
St. Louis, MO-IL
Toledo, OH
New York, NY-NJ-PA
$27,378
$26,393
$25,825
$24,305
$24,305
$24,096
$23,254
$23,020
$23,020
$22,852
Narrowest socioeconomic mobility gap
McAllen, TX
Visalia, CA
Brownsville, TX
Fayetteville, AR
Fayetteville, NC
Charleston, SC
Boise City, ID
El Paso, TX
Stockton, CA
Urban Honolulu, HI
$2,744
$3,968
$4,090
$5,365
$6,448
$6,566
$6,745
$8,240
$9,360
$9,811
Note: Socioeconomic mobility gap is defined as the difference in median household income at age 35 for individuals born between 1978 and 1983 with parents at the 25th percentile of the parent income distribution between the 20% of neighborhoods with the lowest opportunity and the 20% of neighborhoods with the highest opportunity in the specified metro area. Metro names abbreviated to first named city.
Sources: diversitydatakids.org Child Opportunity Index 3.0; American Community Survey, 5-Year Summary Files; Opportunity Atlas (Chetty et al.)
The Richmond, VA area, which has a relatively wide Child Opportunity Gap (81), has the widest socioeconomic mobility gap of more than $27,000 (ranging from $55,000 expected income in its highest opportunity neighborhoods to $28,000 in its lowest). On the other end of the spectrum is McAllen, TX, McAllen, which has both very low overall opportunity and a relatively small Opportunity Gap, also has a socioeconomic mobility gap of only $3,000 (ranging from $45,000 expected income in its highest opportunity neighborhoods to $42,000 in its lowest).
• Analyses using the Child Opportunity Index 3.0 show strong associations between neighborhood opportunity and adult outcomes. “Greater life expectancy; lower rates of adult diabetes, obesity and limited physical activity; and higher intergenerational socioeconomic mobility are all associated with higher levels of neighborhood opportunity.
• In some metro areas, these differences are particularly stark. For example, the difference in life expectancy at birth in very low- versus very high-opportunity neighborhoods in Dayton, OH is 10 years. The difference in expected adult income for a child from a low-income family in a very low- versus very-high opportunity neighborhood in Richmond, VA is $27,000.
CITATION: Acevedo-Garcia, D., McArdle, N., Shafer, L., & Noelke, C. The State of Racial/Ethnic Equity in Children’s Neighborhood Opportunity: First Findings from the Child Opportunity Index 3.0. diversitydatakids.org and Brandeis University. www.diversitydatakids.org/research-library/state-racialethnic-equity-childrens-neighborhood-opportunity
There are also vast racial/ethnic inequities. We find that, in the 100 largest metro areas, the typical White child or Asian child lives in a neighborhood with many resources for healthy development (Child Opportunity Scores of 74 and 77, respectively), while the typical Black child or Hispanic child lives in a neighborhood with limited resources (Scores of 30 and 33, respectively). These racial/ethnic inequities cannot be explained by family income. In the 100 largest metros, Black and Hispanic children in poverty are 3.1 and 2.9 times more likely, respectively, to live in very low-opportunity neighborhoods than White children in poverty.
These differences in neighborhood opportunity can have lifelong consequences. Using COI 3.0 data, we find strong associations between neighborhood opportunity and adult outcomes. In the 100 largest metros, life expectancy is six years longer in very high-opportunity neighborhoods (82 years) than it is in very low-opportunity neighborhoods (76 years). In some metros, such as Dayton, OH, and Birmingham, AL, that gap is as large as 10 years. Lower rates of adult diabetes, obesity and limited physical activity, as well as greater socioeconomic mobility, are also associated with higher levels of neighborhood opportunity.
The differences in neighborhood opportunity are so profound that it is as if children in the United States are growing up not in one country, but in five different nations. These “Five Americas” are not always geographically contiguous, but the neighborhoods within each one often have more in common with each other than they do with others just a short distance away. For example, the Very Low-opportunity nation has a median household income of about $45,000 and a high school graduation rate of 81.2%; in contrast, the Very High-opportunity nation has a median household income of about $135,000 and a high school graduation rate of 93.9%. Compared to their shares of the child population nationally, Hispanic and Black children are vastly overrepresented in the Very Low-opportunity America, and White children are overrepresented in the Very High-opportunity America.
The segregation that underlies racial/ethnic inequities in neighborhood opportunity was, in large part, created and maintained through policies designed to hoard opportunity to benefit Whites, primarily White homeowners. While certain policies, such as exclusionary zoning and school attendance zones rigidly tied to students’ neighborhoods, continue to reinforce segregation, other policies serve to counter these forces and further equity. Support for some these policies seems to be on the rise due to concerns about economic development, lack of affordable housing and the environment—and perhaps because of concern about inequities. Zoning reform, including the ending of single-family only zoning in some states, fair housing enforcement, programmatic changes to the Housing Choice Voucher and Low Income Housing Tax Credit program, as well as the expansion of source of income anti-discrimination laws all serve to foster open communities, despite often forceful and vocal opposition.
School finance reform has cut the rigid ties between local tax base and school funding in many areas, helping equalize how funding is distributed. Still, the level of funding achieved for high-need schools may not yet be sufficient to provide an adequate and equitable education for all students. The challenges experienced by low-income, largely minority schools go beyond what can be addressed by funding alone. Changes in school attendance policies have also loosened the link between neighborhoods and schools, for both good and bad. Certain policies, such as controlled choice plans and integrative magnet and charter schools, have helped counter segregation, while some voucher, charter and open enrollment policies have strengthened it.
Other policies can help offset some of the inequities in families’ economic situations. Among these are an expanded and inclusive Child Tax Credit, building on the expanded Child Tax Credit of 2021, which would provide meaningful relief to the lowest-income families and reduce child poverty and poverty concentration.
CITATION: Acevedo-Garcia, D., McArdle, N., Shafer, L., & Noelke, C. The State of Racial/Ethnic Equity in Children’s Neighborhood Opportunity: First Findings from the Child Opportunity Index 3.0. diversitydatakids.org and Brandeis University. www.diversitydatakids.org/research-library/state-racialethnic-equity-childrens-neighborhood-opportunity
The 2024 Annual Homelessness Assessment Report (AHAR) to Congress Office of Policy Development and Research (PD&R) In the 2024 Annual Homelessness Assessment Report (AHAR) to Congress, the U.S. Department of Housing and Urban Development Reports That Homelessness on a Single Night in 2024 was the Highest Ever Recorded.
SOURCE: 2024 AHAR: Part 1 - PIT Estimates of Homelessness in the U.S.
The number of people experiencing homelessness on a single night in 2024 was the highest ever recorded. A total of 771,480 people – or about 23 of every 10,000 people in the United States –experienced homelessness in an emergency shelter, safe haven, transitional housing program, or in unsheltered locations across the country. Several factors likely contributed to this historically high number. Our worsening national affordable housing crisis, rising inflation, stagnating wages among middle- and lower-income households, and the persisting effects of systemic racism have stretched homelessness services systems to their limits. Additional public health crises, natural disasters that displaced people from their homes, rising numbers of people immigrating to the U.S., and the end to homelessness prevention programs put in place during the COVID-19 pandemic, including the end of the expanded child tax credit, have exacerbated this already stressed system.
Nearly all populations reached record levels. Homelessness among people in families with children, individuals, individuals with chronic patterns of homelessness, people staying in unsheltered locations, people staying in sheltered locations, and unaccompanied youth all reached the highest recorded numbers in 2024.
People in families with children had the largest single year increase in homelessness. Between 2023 and 2024, 39 percent more people in families with children experienced homelessness. Overall, the number of people experiencing homelessness increased by 18 percent.
Nearly 150,000 children experienced homelessness on a single night in 2024, reflecting a 33 percent increase (or 32,618 more children) over 2023. Between 2023 and 2024, children (under the age of 18) were the age group that experienced the largest increase in homelessness
Veterans were the only population to report continued declines in homelessness. Between 2023 and 2024, the number of veterans experiencing homelessness declined by eight percent, or 2,692 fewer veterans. The number of veterans experiencing homelessness has declined by 55 percent since data collection about veteran homelessness began in 2009. The declines in sheltered and unsheltered experiences of homelessness were similar, (56% and 54%). These declines are the result of targeted and sustained funding to reduce veteran homelessness.
About one in every five people experiencing homelessness on a single night in 2024 was age 55 or older. More than 104,000 people experiencing homelessness were aged 55 to 64, and just over 42,150 people were over age 64. Nearly half of adults aged 55 or older (46%) were experiencing unsheltered homelessness in places not meant for human habitation.
People who identify as Black, African American, or African continue to be overrepresented among the population experiencing homelessness. People who identify as Black made up just 12 percent of the total U.S. population and 21 percent of the U.S. population living in poverty but were 32 percent of all people experiencing homelessness. However, the share of people experiencing homelessness who identify as Black (of any ethnicity) decreased from 37 percent of all people experiencing homelessness in 2023. 1
1 This change could partially be due to changes in the way race and ethnicity was reported this year and the inclusion of additional reporting categories. However, in recent years, many Communities of Care (CoCs) have engaged in additional technical assistance to correct for bias in the allocation of housing and prevention resources. This decline could also reflect the effects of those and other local efforts to more fairly distribute resources.
One in every three individuals experiencing homelessness reported having experienced chronic patterns of homelessness, or 152,585 people. This is the highest number of individuals experiencing chronic patterns of homelessness counted in the PIT. Individuals experiencing chronic patterns of homelessness have increased by 27 percent since data was first collected in 2007. Sixty-five percent of all individuals experiencing chronic patterns of homelessness, or more than 99,500 people, were counted in unsheltered locations. This is also the highest number recorded since data collection began.
Exhibit A-1: Change in the Number of People Experiencing Homelessness
*Baseline comparison year for veterans is 2009; baseline for unaccompanied youth is 2017
The national inventory of beds for people currently experiencing homelessness increased by 13 percent between 2023 and 2024. This increase was driven by increases in emergency shelter beds, which increased by 18 percent between 2023 and 2024 and have doubled since 2007. Transitional housing, meanwhile, has steadily decreased over time – declining by 4 percent between 2023 and 2024 and by 60 percent since 2007. However, this reduction since 2007 does not necessarily mean that transitional housing beds were completely removed from the national inventory. Often transitional housing programs realize they function more like emergency shelter and convert their project type to align better with the way they actually function. In other cases, transitional housing programs converted to permanent housing projects, including transition-in-place and rapid rehousing.
Nearly 60 percent of the national inventory of beds is for people formerly experiencing homelessness. Rapid rehousing (RRH), permanent supportive housing (PSH), and other permanent housing (OPH) programs make up 57 percent of all beds reported in the housing inventory count (HIC)— people in these programs are not counted as experiencing homelessness in the PIT count data. Between 2023 and 2024 total inventory for these programs increased by 3 percent, with the largest increase among OPH programs (14,735 more beds). This reflects significant investments into OPH through the Emergency Housing Voucher program. PSH makes up the largest share of all inventory for people formerly experiencing homelessness (at 58%). While nationally the supply of PSH beds has more than doubled since 2007, there are still areas where the need for permanent housing has outpaced the supply
Page | vi
Exhibit A-2: Share of Inventory that is Dedicated to Emergency Housing (ES/TH/SH) vs. Permanent Housing (RRH/PSH/OPH), 2007-2024
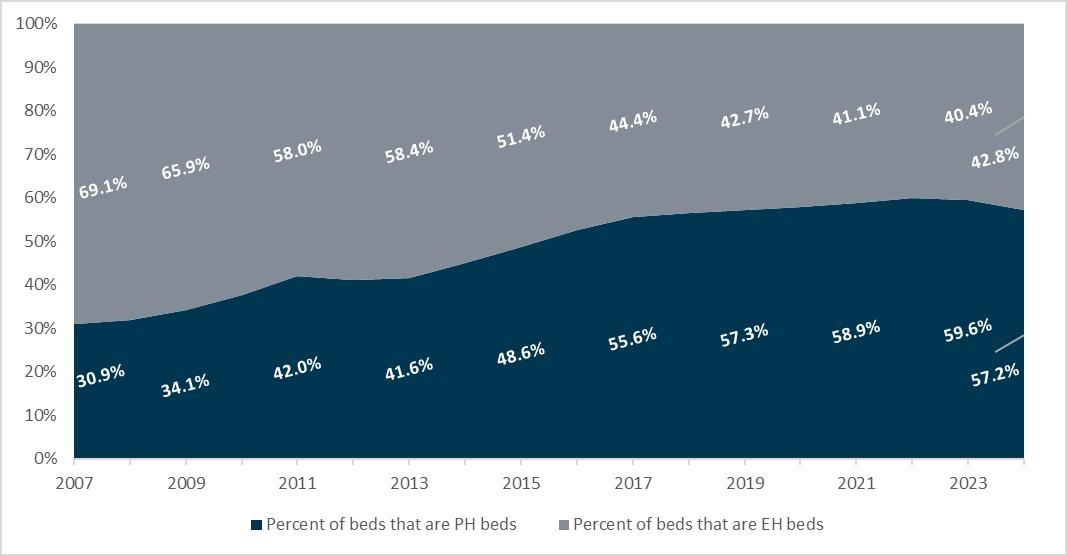
Page | vii


INTERACTIVE DASHBOARD
262
Social/Cultural Cohesion Insights
Social/Cultural Cohesion
Univision Communications takes a look at cell phone usage, beauty services, movie attendance and pet ownership among Hispanics in the Phoenix and Tucson metro areas 264
266 IN FOCUS
EXCERPT
269
NAU Hosts Second Annual Hispanic/Latine Youth Media Workshop
BY PAUL HELFORD
1st 100 Days Poll Of Hispanic Voters
According to polling conducted by the Colorado Latino Agenda, 60% of Latino voters believe the country is headed in the wrong direction.


BY PAUL HELFORD
In June 2025, Northern Arizona University’s School of Communication hosted its second Hispanic/Latine Youth Media Workshop (H/LYMW). Designed to inspire Hispanic and Latine high school students, the workshop encourages participants to view college as an attainable goal while gaining career-related skills and building confidence in their creative and professional potential.
All participants received full scholarships to attend the threeday workshop, providing students with hands-on experience in photography, filmmaking, animation and other media fields. Students also lived on the NAU campus, immersing themselves in college life.
Workshop director professor Paul Helford developed the H/ LYMW after professor Rima Brusi visited NAU’s 2023 Indigenous Youth Media Workshop (IYMW)—a program Helford has directed

since founding it in 2012. Inspired to create a similar opportunity for Hispanic and Latine youth, Brusi helped the School of Communication secure support from NAU’s Office of the President for the inaugural 2024 event.
For the 2025 workshop, the workshop team raised funds through grants, donations and a crowd funding campaign, and those funds were matched by NAU’s President’s Office.
Recruitment efforts included an email to every high school in Arizona, alongside social media outreach. The response was enthusiastic: over 45 students from 13 Arizona cities applied for just 25 available spots. Applicants were required to submit either a 100- to 200-word written essay or a 2- to 3-minute video essay explaining their interest in the program.
On June 13, students arrived at Cowden Residence Hall on NAU’s campus and kicked off the workshop with a lunch featuring multiaward-winning guest speaker León Felipe González, Univision’s news anchor and managing editor in Phoenix. Accompanied by a Univision reporter who produced a story about the event, González shared highlights from his 30-year journalism career, which has included covering papal visits, presidential elections and the World Cup.
The workshop was led by NAU Communication faculty, supported by Hispanic student production assistants from NAU’s Visual Communication and Creative Media and Film programs. On the first afternoon, students learned smartphone photography techniques and, after dinner at the Student Union, worked in three-and-four person teams to write, shoot and edit short silent horror films.
On the second day, another prominent voice from Arizona’s Hispanic media community, Gibby Parra—a Good Morning Arizona reporter with 3TV in Phoenix since 1994—joined via Zoom. Parra inspired students with his story, recalling how he started his career as a high school junior working as a tape operator for KYEL-TV in Yuma.
Additional activities included hands-on lessons in drone cinematography, gaming, virtual reality and zine making, as well as a session with NAU’s Office of Admissions.
When asked about the most important thing they learned from the workshop, students shared:
• "How many connections you get from being in a community or school setting with others doing the same things as you."
• "Art can be a career."
• "There are many different career paths in media."
• “I loved it so much, I (sic) want to learn more and more.”
Source: www2.claritas.com/Knowmore

Aaron Rodriguez, an NAU Creative Media and Film major who worked both the 2024 and 2025 workshops, said he was grateful to help foster the next generation of communication students. “It was really cool to work with kids who are mostly first-generation college students like me, and who are interested in this college,” Rodriguez said. “They may not even be interested in media, but they’re getting to try it out while meeting new people and faculty. They’re making connections right from the start, which gives them a huge step up. I think it’s awesome that I was a part of that.”
Looking ahead, the goal for NAU’s Hispanic/Latine Youth Media Workshop is simple: to keep it going. With the President’s Office once again pledging matching funds for 2026, the team again plans to apply for grants, solicit donations and launch another crowdfunding campaign to secure the workshop’s future.
Both the Hispanic/Latine Youth Media Workshop and the Indigenous Youth Media Workshop have the power to be transformational, helping students embrace their creativity, build confidence, begin to identify professional pathways and envision a path to higher education.
“I hope these students go back and tell their classmates how great the experience is,” said Helford. “To me, the most special thing about this workshop—and the Indigenous workshop—is that it can be truly life-changing and that it is free to the participants. There are very few opportunities like that.”

Paul Helford is NAU professor emeritus and School of Communication Workshop Director. Professor Helford had a 33 year career as an NAU professor and is founder and director of two summer workshops: the Indigenous Youth Media Workshop and the Hispanic Youth Media Workshop.
NAU School of Communication Box 5619, Flagstaff, AZ 86001 nau.edu/communication/summer-workshops/
UNIDOS US, LULAC, Climate Power en Acción, Colorado Latino Agenda
According to Polling Conducted by the Colorado Latino Agenda, 60% of Latino Voters Believe the Country is Headed in the Wrong Direction.
SOURCE: 2025 100-Days Poll
Source: www2.claritas.com/Knowmore
1. Evaluations of the economy dominate Latino political views.
➢ Latinos think the economy is bad and worry it is getting worse.
➢ Trump receives most of the blame/credit for the economy.
2. Partisan predispositions are the dominant force behind attitudes towards Trump’s main policy initiatives: Republicans support them, Democrats oppose them.
➢ However, the data indicate that Latino Trump voters are not all on board with some of the president’s policies. Latino support for many policies lags Trump’s vote by 7-10 points
➢ On the other hand, the data do not show that they have embraced the Democrats’ positions on these policies. Instead, opposition numbers mostly match Harris’s 2024 vote.
3. The clear exception is on immigration, where Latinos continue to support a path to citizenship, and oppose mass deportations by greater than a 3:1 margin.
Generally speaking, do you think things in the United States TODAY are going in the right direction, or the wrong direction?
Thinking about THE US IMMIGRATION SYSTEM, which of the following do you think are the most important issues that elected officials should address? (all that apply)
Provide path to citizenship for undocumented immigrants who have been in US a long time
Provide a path to citizenship for undocumented individuals brought to the US as children
Crack down on human smugglers and drug traffickers
Provide asylum to people fleeing violence or war in their home countries
Increase legal immigration through family and employment-based visas
Provide support to U.S. communities receiving immigrants
Increase border security
Make sure that local officials help enforce federal immigration laws
Finish the wall along the U.S.-Mexico border
Deport all undocumented immigrants, regardless of how long they have been here
Something else
None of these
Source: www2.claritas.com/Knowmore
selected one of the two path to citizenship
No community is complete without successful small businesses and entrepreneurs. JPMorganChase is committed to helping businesses of all sizes at every stage of maturity achieve their financial goals. Learn about our business programs for entrepreneurs at: chase.com/business/coaching-for-impact


• Nearly 1/3 of Crimes Sentenced in the U.S. are Immigration Violations
• Hispanic Individuals Accounted for the Largest Share of Sentencings in 2024
• Hispanics Accounted for Nearly All Federal Immigration Sentencings in FY 2024
• Federal Sentencings of Non-U.S. Citizens: Trends from FY 2020 to FY 2024
• Immigration Offenses Represent Represent More Than Double All Other Sentencings Combined
• 94.4% of non-U.S. Citizens Sentenced in the Federal System Were Men.
• 88.7% were illegal aliens, 8.5% were Legal aliens, 1.3% were Extradited Aliens, and 1.5% were Unknown Status.
• 93.7% were Hispanic, 2.3% were Black, 2.2% were White, and 1.8% were Other Races.
• 65.9% were from Mexico, 8.7% from Honduras, 5.8% from Guatemala, 4.0% from the Dominican Republic, 3.0% from El Salvador, and 12.6% Originated from Other Countries.
• Their Average Age Was 38 Years.
• The most common guidelines under which non-U.S. citizens were sentenced include: Immigration (72.3%); Drug Trafficking (17.6%); Fraud (3.1%); Money Laundering (1.8%); and Firearms (1.7%).
• U.S. Ranks 5th Globally in Incarceration Rates per 100,000 People (2024)
• Decade of Decline: Sentencing Rates Drop Among All Racial Groups (2012–2022)
• Hispanic and Black Households Face Highest Rates of Food Insecurity in 2023
• Hispanic Households Experienced the Largest Rise in Food Insecurity Prevalance from 2022 to 2023
• Hispanic Workers Show Steady Growth in Self-Employment Across Generations
• Hispanic and AIAN Populations Maintain Highest Uninsured Rates Over Time
• Hispanics Face the Highest ACA Ineligibility Due to Immigration Status Among Uninsured Under Age 65
• Real Median Household Incomes Increased by 5.4 Percent for White Households and by 5.7 Percent for Non-Hispanic White Households Between 2022 and 2023. There was No Significant Change in Median Incomes for Black, Asian, and Hispanic Households Hispanic Households Consistently Earn Less Than National Median Income
• Erosion of Low-Cost Rentals: U.S. Housing Market Shifts Toward Higher Rent Tiers
• U.S. Population Experiencing Homelessness Reaches New High in 2024
• Labor Force Participation Gap Between Men and Women Narrows Slightly Despite Long-Term Decline for Women
• In 2022, Child Care for One Child Could Cost as Much as a Year of Rent
• Historic Shift: Hispanic Homeownership Surpassed Renting in Arizona in 2022
• Arizona Rental Market Shifts Sharply Toward Higher-Priced Units
• Arizona Among Top 10 States for People Experiencing Homelessness (2023–2024)
• Hispanics Make Up The Most Of Arizona's Incarcerated Population


INTERACTIVE DASHBOARD
Social Justice Insights
SPECIAL FEATURE
Social Justice
Univision Communications presents data on the legal services available in the Phoenix and Tucson DMAs
SPECIAL FEATURE
WestGroup Research
Arizona Resident Survey Results
IN FOCUS
IN FOCUS
Empowering Second Chances
ThemissionofNewFreedomProjectistocreategenerationalchangeandstrengthencommunitiesby providingcriticalresourcestoindividualsontheirreentryjourney.
BY MEGHAN MURPHY
CREATING HOME AND HOPE: Helping Refugees Thrive in Arizona
BY JILLIAN LICURGO
Abriendo Puertas Opening Doors, Fourth Annual Study of the Social and Economic Issues Facing Latino Families. IN FOCUS
Los Deseos Son Para Todos
BY FRAN MALLACE
2025 National Latino Family
EXCERPT 328
EXCERPT
Many Latine Lgbtq+ Youth Report Experiencing Some Form of Prejudice due to Their Sexuality and Ethnicty, Accroding to the Joint Report by the Human Rights Campaign Foundation and the University of Connecticut.
DIVERSITY
In their fourth report on leadership diversity and company performance, McKinsey & Company’s research links companies with diverse leadership teams to higher financial returns.
Nearly 1/3 of Crimes Sentenced in the U.S. are Immigration Violations
Hispanics Accounted for Nearly All Federal Immigration Sentencings in FY 2024
19,118 19,893 21,502 21,304
29,668
Immigration Offenses Represent Represent More Than Double All Other Sentencings Combined
Source:
94.4% of non-U.S. Citizens Sentenced in the Federal System Were Men.
88.7% were illegal aliens, 8.5% were Legal aliens, 1.3% were Extradited Aliens, and 1.5% were Unknown Status.
Source: Federallysentenced
MOST COMMON OFFENSE TYPES FOR NON-U.S. CITIZENS Fiscal Year 2024
MONEY L AUNDERING FRAUD/THEFT/ EMBEZZLEMENT O THER DRUG TRAFFICKING IMMIGRATION
93.7% were Hispanic, 2.3% were Black, 2.2% were White, and 1.8% were Other Races.
65.9% were from Mexico, 8.7% from Honduras, 5.8% from Guatemala, 4.0% from the Dominican Republic, 3.0% from El Salvador, and 12.6% Originated from Other Countries.
327 360 612 702 3,480 14,309
Their Average Age Was 38 Years.
The most common guidelines under which non-U.S. citizens were sentenced include: Immigration (72.3%); Drug Trafficking (17.6%); Fraud (3.1%); Money Laundering (1.8%); and Firearms (1.7%).
Hispanic Workers Show Steady Growth in SelfEmployment Across Generations Source:
Hispanics Face the Highest ACA Ineligibility Due to Immigration Status Among Uninsured Under
Real Median Household Incomes Increased by 5.4 Percent for White Households and by 5.7 Percent for Non-Hispanic White Households Between 2022 and 2023. There was No Significant Change in Median Incomes for Black, Asian, and Hispanic Households
By Total Money Income All Races vs Hispanic 2015 to 2023
Households Consistently Earn Less Than National Median Income
2023 6,525,581 10,698,558 9,062,744 11,209,636 9,095,023
630,806 558,573 575,714 577,778 649,535 767,856
$15,600
8,119,492 8,268,022 8,382,274 8,443,892 8,675,952 8,834,012 9,048,690
INCARCERATED
As of April 30, 2025


Incarceration Rate by Crime

Administration of Justice
Antitrust
Arson
Assault
Bribery/Corruption
Burglary/Trespass
Child Pornography
Commercialized Vice
Drug Possession
Drug Trafficking
Environmental
Extortion/Racketeering
Firearms
Food and Drug
Forgery/Counter/Copyright
Fraud/Theft/Embezzlement
Immigration
Individual Rights
Kidnapping
Manslaughter
Incarceration
Administration of Justice
Antitrust Arson Assault
Bribery/Corruption
Burglary/Trespass
Child Pornography
Commercialized Vice
Drug Possession
Drug Trafficking
Environmental
Extortion/Racketeering
Firearms
Food and Drug
Forgery/Counter/Copyright Fraud/Theft/Embezzlement
Immigration
Individual Rights
Kidnapping
Manslaughter
65% of People Taken by ICE had No Convictions, 93%


ThemissionofNewFreedomProjectistocreate generationalchangeandstrengthencommunities byprovidingcriticalresourcestoindividualson theirreentryjourney.
BY MEGHAN MURPHY
“My name is Darvel and my journey with the New Freedom facility has been nothing short of transformative. I've been through eight different treatment centers, but it's here that I truly found success. Here, I was able to put aside my pride, feelings and emotions, and focus on accomplishing everything they had to offer.
New Freedom Project helped me regain my driver's license, supported me through my court dates and even enhanced my writing and spelling skills. One of my biggest accomplishments was graduating from their culinary arts program and earning my ServSafe certificate, a five-year career plan that I can use to succeed in society.
The New Freedom facility became more than just a place for me; it felt like home, a family that welcomed me with open arms. The experience was different from any other reentry facility I've been a part of. They never discriminated against me, instead, they treated me as a brother, a father, a son. They saw me for who I am, and for that, I'm eternally grateful.
Without New Freedom Project, I don't know where I'd be. But now, I'm ready to give back to society and the community using everything I've learned. New Freedom truly represents a new beginning, a new start, a new way of looking at life. And now, freedom is anointed inside of me. Thank you, New Freedom Project.”
At New Freedom Project, we believe that everyone deserves a second chance—and the support to make it count. Our mission is simple but powerful: to break cycles of incarceration, create generational change and strengthen communities by walking alongside people as they reenter our community.
Every day, we provide the tools, structure and care needed to help justice impacted individuals rebuild their lives—with dignity, purpose and hope.
EMPOWERING SECOND CHANCES
7%
Recidivism Rate of our Graduates. (AZ Avg. = 40%)
7000
91%
Employment Rate of our Graduates After two Years Annualized Economic Impact (One Facility)
380 $200M
Members Served Since Inception, 2020 Capacity of our Men’s Facility

150 Capacity of our Women’s Facility
MORE THAN A PROGRAM—A PATHWAY TO A NEW LIFE
Reentry is one of the most difficult journeys a person can face. That’s why New Freedom Project offers a one-of-a-kind, allinclusive reentry model—right here in Arizona. We are the first behavioral healthcare provider in the state specifically designed for both men and women transitioning out of the justice system.
We are so grateful for staff that feels like family and facilities that feel like home.
New Freedom Project
2532 W. Peoria Ave. Phoenix, AZ 85029 connect@nfproject.org or Meghan.murphy@nfproject.org www.nfproject.org
• Facebook: New Freedom Project
• LinkedIn : newfreedomproject
Whether at our men's or women’s facility, our 90-day voluntary programs provide comprehensive, gender-specific care under one roof—so no one falls through the cracks.
Our members have access to the critical resources they need to heal, grow and thrive:
• Individual & group therapy
• Behavioral health services
• Peer recovery support & certification
• Vocational training & job placement
• Safe, supportive housing
• Budgeting & credit education
• Healthy relationship & parenting skills
• Wellness, nutrition, and life skills
We don’t just offer services—we build self-worth, create community and open doors that were once shut.
Meghan Murphy is the executive director of New Freedom Project and a passionate advocate for equitable access to lifechangingresources.Sheworksalongsidethe board of directors and community partners to ensure every individual has the support theyneedtothrive—and neverfeel alone.
BY JILLIAN LICURGO
Lutheran Social Services of the Southwest has proudly walked alongside refugee families for 50 years, offering stability and opportunity to some of the world’s most persecuted people.
Since 1975, LSS-SW has served refugees in Tucson and Phoenix, helping them navigate new systems, overcome barriers and feel at home in their new communities. While refugee resettlement has been upended on the federal level, LSS-SW remains deeply committed to supporting the refugee community in Arizona through a broad range of services.
“Arizona has always been a place of opportunity and resilience,” says Connie Phillips, MSW, president & CEO of LSS-SW. “At this critical time in our state, our work becomes even more important to those who depend upon us.”
Connie Phillips has led Lutheran Social Services of the Southwest since 2015, bringing over two decades of experience in nonprofit leadership across mental health, domestic violence and social services. Based in Phoenix and traveling statewide, she champions responsive programs that meet the evolving needs of Arizona’s refugee population.
So, who is a refugee? A refugee is someone who has been forced to flee their home country because of violence, persecution or war. These individuals and families seek safety and protection in other countries, often leaving behind everything familiar to them. 73 percent of all refugees come from just five countries: Afghanistan, Syria, Venezuela, Ukraine and Sudan.
In 2024, LSS-SW became Arizona’s largest refugee resettlement organization. Today, while new arrivals are on hold, the organization has shifted its focus on helping refugees already in Arizona to continue building strong, self-reliant foundations.

Through case management, employment support, K-12 education services and many other services, LSS-SW ensures refugee families continue to thrive long after their arrival. A key part of that support is the Women’s Empowerment Program, which offers refugee women a safe and welcoming space to learn English, develop job skills and build community.
CREATING HOME AND HOPE: HELPING REFUGEES THRIVE IN ARIZONA
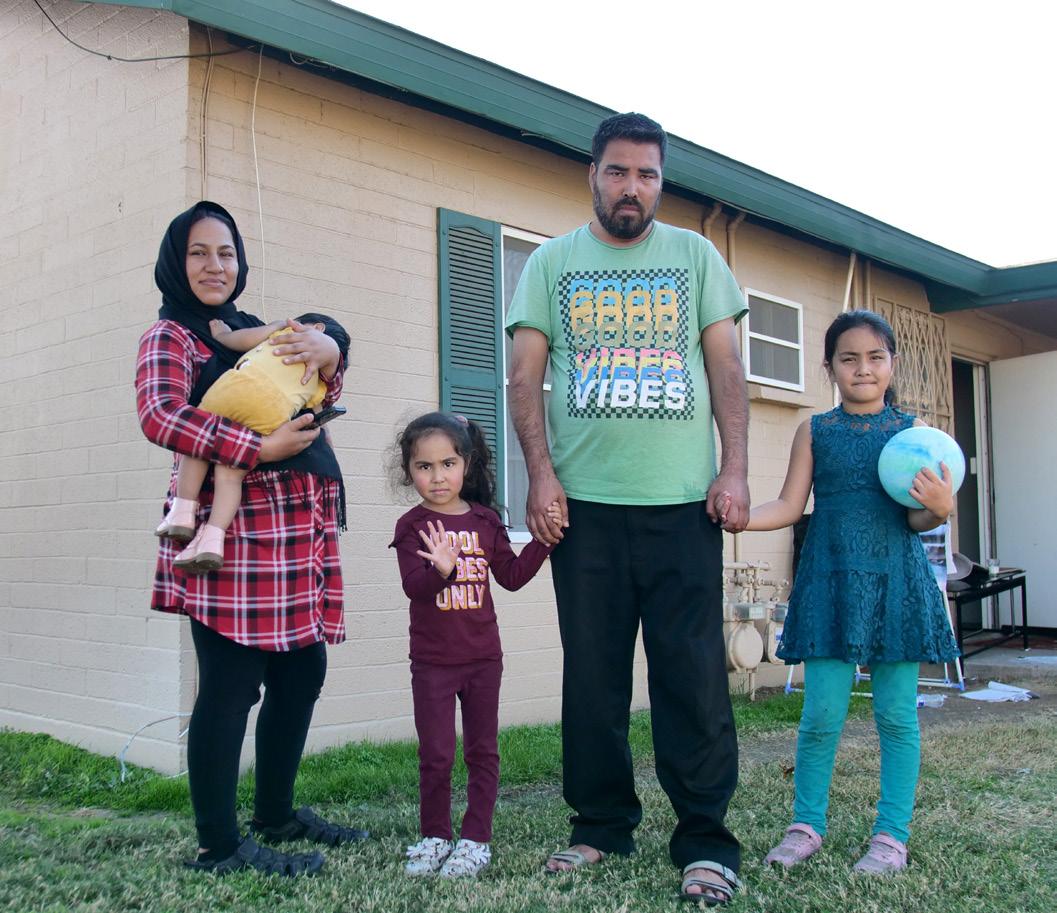

When Basira and her husband, Said, fled Afghanistan with their baby daughter, their lives were in danger. Said had worked as an interpreter for the U.S. military, making them a target for the Taliban.
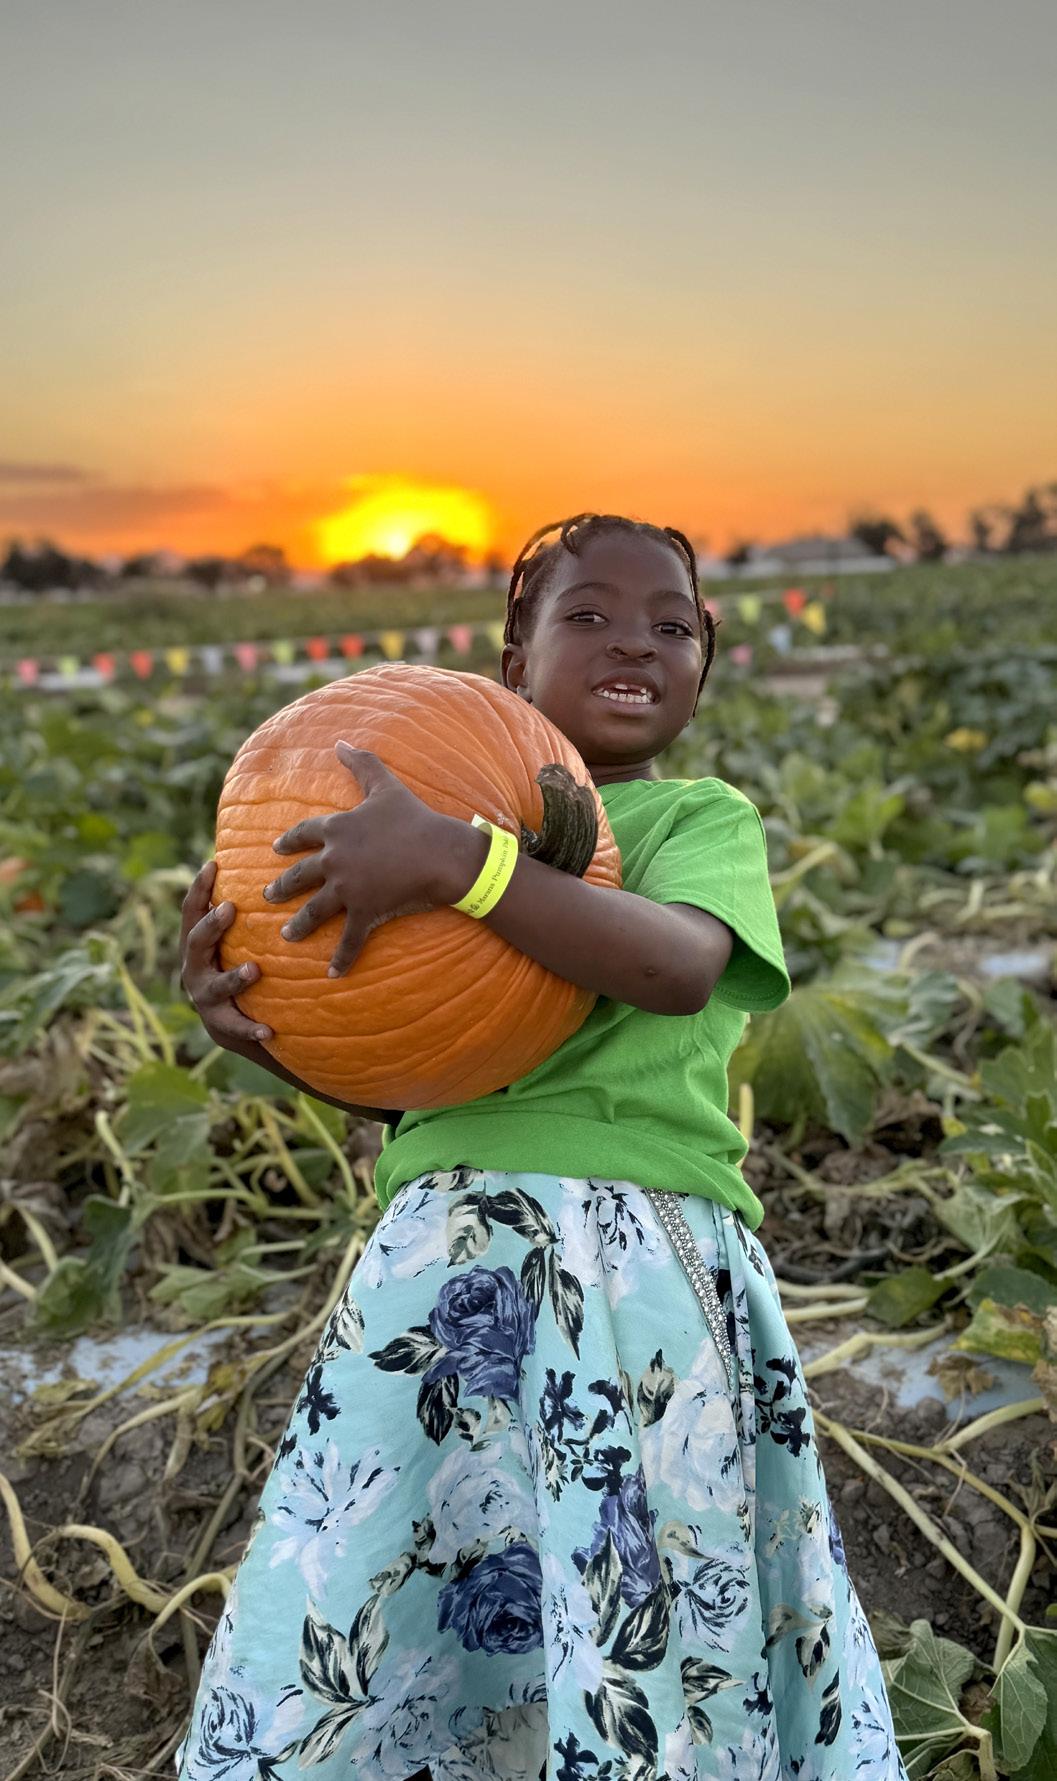
Arriving in a new country with her child and limited English, Basira found herself alone at home, feeling scared and isolated, until she joined LSS-SW’s Refugee Women’s Empowerment Program.
Through English, sewing and computer classes, Basira found not only skills but community. “At first, I couldn’t even say ‘water’ in English. After a few months, I was helping other students,” she says.
Sewing became both a source of income and strength. After Said was injured in a car accident, Basira used her sewing skills to help support her family.
“Now, I’m not scared of anything. I feel strong. I know I can do everything because of my classes. My children are safe, my husband is safe and we have a future here.”
Basira’s journey reflects what’s possible when refugee families have the right support and a community that believes in them. Volunteers, donors and partner organizations play a crucial role in this work, whether it’s tutoring, assembling backpacks filled with school supplies or mentoring refugee youth, community members help ensure families feel not just safe, but truly at home in Arizona.
While refugee resettlement remains a cornerstone of LSS-SW’s history, it is only one part of our broader mission. Lutheran Social Services of the Southwest works every day to support Arizona’s most vulnerable neighbors.
Jillian Licurgo is the communications specialist for Lutheran Social Services of the Southwest in Phoenix.
Lutheran Social Services of the Southwest 3636 N. Central Ave, Suite 300 Phoenix, AZ 85012
480.396.3795
www.lss-sw.org
• Facebook: www.facebook.com/lsssw
• Instagram: lsssw_1070
• YouTube: lutheransocialservicesofth9807
www.lss-sw.org/donate
www.lss-sw.org/volunteer
BY FRAN MALLACE
At Make-A-Wish Arizona, our mission is simple: Together, we create life-changing wishes for children with critical illnesses.
This year marks 45 years since the very first wish was granted — right here in Arizona. What began as one Arizona boy’s wish more than four decades ago has grown into a global movement that continues to spark joy for children facing critical illness across 50 countries.
Yet our focus remains rooted in the local communities that gave birth to that first wish. Each day, we are reminded of the strength and resilience of the children we serve. We meet families navigating unimaginable challenges, coping with diagnoses that no child should ever have to face. Every 20 minutes, a family in the United States hears the life-altering news that their child has a critical illness.
Imagine life through a child’s eyes – learning to ride a bike, playing with siblings and friends, and worrying about nothing more than finishing homework or deciding which superhero to dress up as. Then one day, you feel unwell. One doctor’s visit turns into two or three. You undergo tests and scans. You watch your parents’ faces become more worried with every passing day. In an instant, your whole childhood is put on pause.
In Arizona, 41% of the children we serve identify as Hispanic or Latino. That’s nearly half of the 475 wishes we granted this past year. And yet, too many eligible families still do not know a wish is available to them or how to access it.
At Make-A-Wish Arizona, we are committed to meeting families where they are. That means eliminating barriers to access. We want every eligible child to feel seen, supported and empowered to discover their one true wish.
We cannot do it alone.
A wish transforms the lives of everyone it touches – the child, their family, volunteers, supporters, medical professionals and entire communities. It is a shared experience of hope, strength and joy. To serve every eligible child in Arizona, we need more bilingual

volunteers — dedicated WishMakers — who can walk alongside these families and ensure they feel seen and supported during their Wish Journey.
Volunteers are at the heart of our mission and currently only 20% are bilingual. These WishMakers serve as advocates, cheerleaders, translators and trusted guides throughout a child’s wish journey, from discovery to wish day. Whether you are helping a child uncover their wish, planning a send-off party or delivering moments of joy along the way, bilingual volunteers ensure every family is fully heard and understood.


We also need the support of Arizona’s vibrant Hispanic business community. Your partnership is vital. With your support, we can grow our reach, increase access to wishes and provide culturally relevant experiences that reflect the families we serve.
Whether through corporate volunteerism, financial support or inkind donations, your involvement makes a tangible impact not only on a child’s life but on the health and spirit of our entire community.
A wish is more than a moment. It is a life-changing experience that has been shown to improve a child’s emotional and physical wellbeing. It builds strength. It sparks joy. It inspires hope – not just for the child, but for every person who takes part in making that wish come true.
From puppies and Quinceañeras to becoming a zookeeper for a day, every wish is deeply personal – and every wish matters.
Fran Mallace is president and CEO of Make-A-Wish® Arizona. As the leader of the organization’s founding chapter, Fran is committed to ensuring every eligible child experiences the hope, strength, and joy that awish can bring.
Make-A-Wish Arizona
2901 N 78 th St, Scottsdale, AZ 85251
602.395.9474
arizona.wish.org
• Facebook: @MakeAWishAZ
• Instagram: @MakeAWishArizona
• LinkedIn: Make-A-Wish_Arizona
• TikTok: @MakeAWishAZ
• X: @MakeAWishAZ
• YouTube: @MakeAWishAZ
Wishes are for everyone. And with your help, we can ensure that no eligible child waits for theirs. NOTES
ap-od,AbriendoPuertas|OpeningDoors Unidos US
BSP Research
SOURCE: Abriendo Puertas | Opening Doors


What impact do you think the president’s economic policies will have on your family’s finances?
Hurt my family’s finances 48%
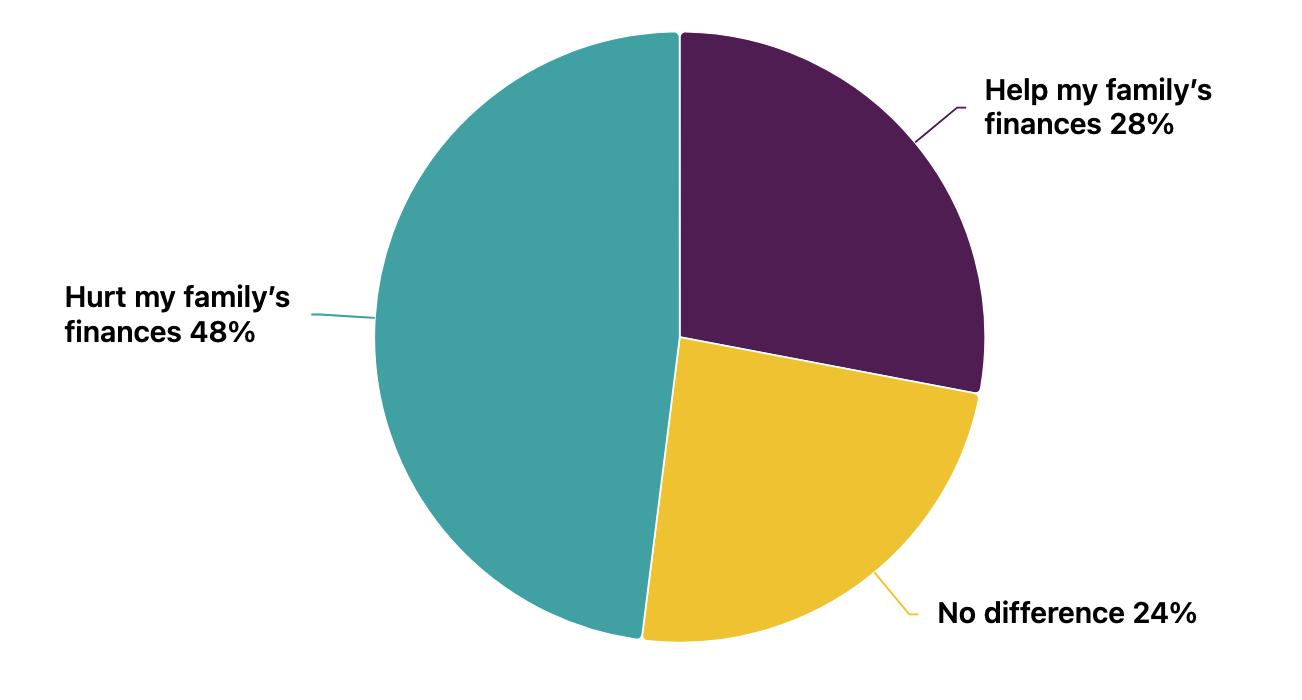
Help my family’s finances 28%
No difference 24%
The largest percentage of respondents in the survey’s history (45%) said their financial situation worsened over the past year. Economic data hints at why this may be. While overall wage growth outpaced inflation between the onset of the COVID-19 pandemic and the end of 2024 (with gains disproportionately benefiting low-income earners)[4], wealth remained concentrated among high earners. In mid-2024, the top 1% of earners maintained more than 30% of the nation’s wealth.[5] Latino families may have felt the impact of inflation more severely in a few key ways.


The average household spends about 11% of its budget on food[6], but families with children have more mouths to feed. Between 2020 and 2024, grocery prices rose 23.6%[7], one of the highest inflationary increases by category.
Latinos’ average household income was $65,540 in 2023, about $15,000 less than the national average.[8] A Harvard University study found that prices for cheaper brands in some cases grew nearly twice as fast as prices for more expensive brands. This phenomenon, known as cheapflation, disproportionally reduces lower-income families’ purchasing power.[9]
Homeownership rates among Latino families are lower than those of the general population. (Among survey participants, 35% reported owning their home, nearly half the U.S. average.[10]) Rent prices have increased by 25% since the start of the pandemic, and homeowners — especially those with pre-pandemic low-interest-rate mortgages — were shielded from rising housing costs.
Historically, incomes for Hispanic households have risen more slowly than their non-Hispanic white counterparts. While real income increased by 5.7% for non-Hispanic white households between 2022 and 2023, it did not increase at all for Hispanic households.[11]
[4] Center for American Progress
[5] Federal Reserve
[6] U.S. Department of Agriculture Economic Research Service
[7] U.S. Department of Agriculture Economic Research Service
[8] U.S. Census Bureau
[9] Journal of Monetary Economics
[10] U.S. Census Bureau
[11] U.S. Census Bureau

Latino families continue to show strong buy-in for social safety net programs. Nearly 9 in 10 respondents said they support revising the Earned Income Tax Credit (EITC) and the Child Tax Credit to allow families to receive $5,000 per child per year, paid quarterly. More than half (54%) said they strongly support that policy. The EITC benefits low-income households, especially those with children. During the pandemic, the U.S. government distributed nearly $2 trillion in stimulus payments and expanded child tax credits, helping an estimated 14.5 million Americans, including 5 million children, escape poverty. However, Congress let the Child Tax Credit expire, and bipartisan efforts to reinstate it have stalled in the Senate.[15]
Would you support revising the Earned Income Tax Credit and Child Tax Credit so qualifying families receive $5,000 per child per year, paid quarterly?
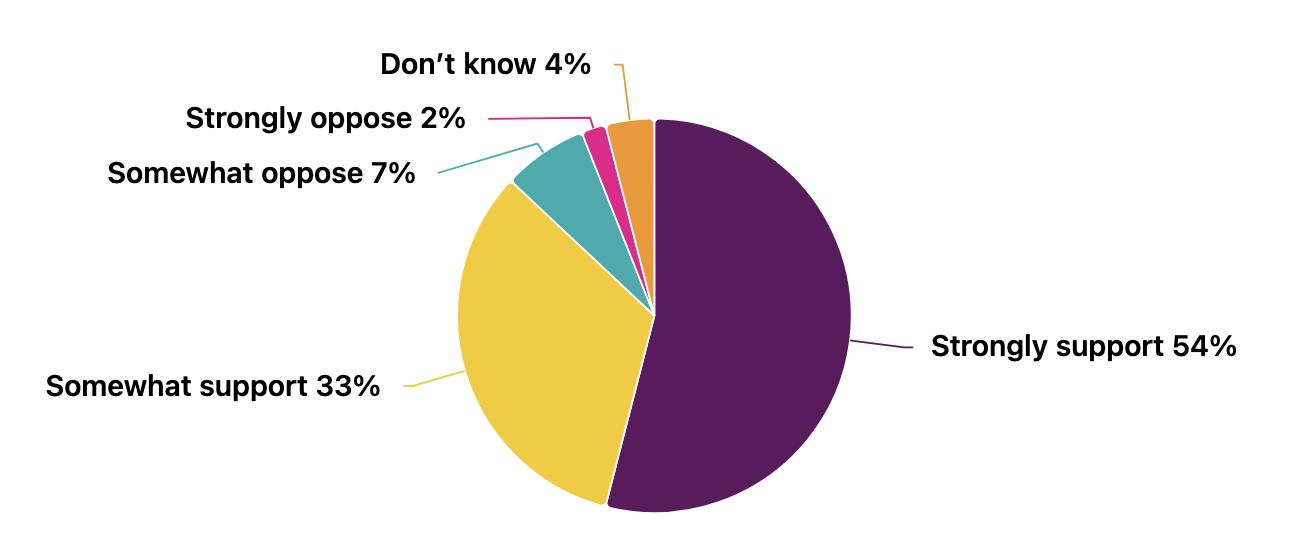

Child care costs are not immune to inflation, and prices for care in the United States have increased significantly since before the COVID-19 pandemic. According to a Center for American Progress report, the annual cost for two children in center-based care increased by about $1,000 between 2016 and 2023, even after adjusting for inflation.[22] This year, 53% of survey respondents said their youngest child had received child care outside the home, compared to 59% in the general population.[23] Among respondents whose children had not received care outside the home, 32% cite prohibitive cost as a primary reason.
The U.S. Department of Health and Human Services’ (HHS) benchmark for affordable child care is 7% of a family’s income. But this year, 39% of respondents said they spend between 11% and 25% of their take-home pay on child care. Another 17% spend between 26% and 50% of their income — a potentially debilitating financial burden that far exceeds the federal benchmark.
How much do you spend on child care each month, as a percentage of your monthly income?
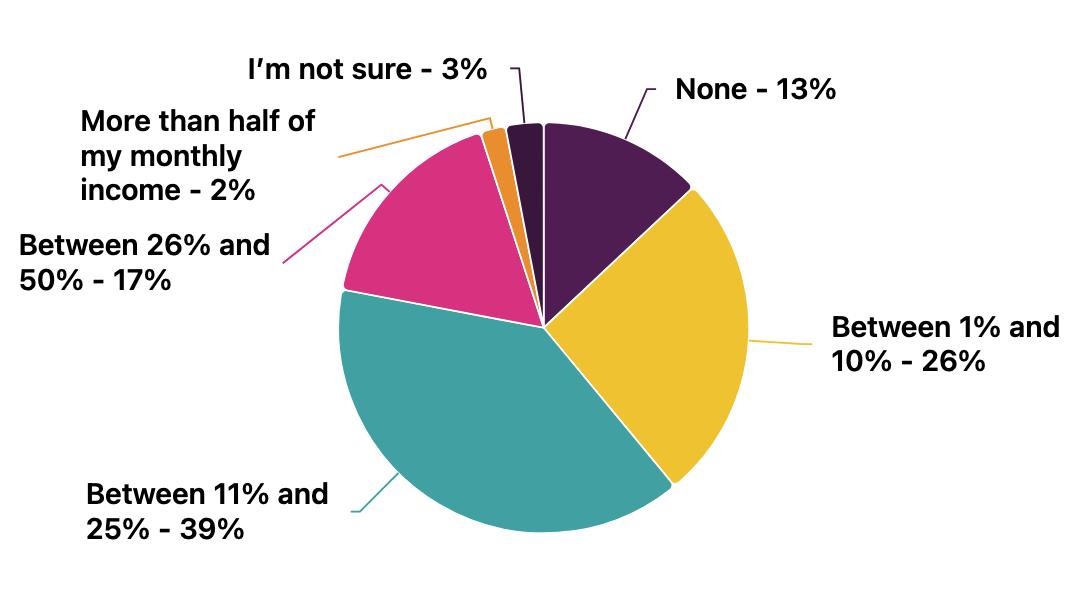
[22]

In March, President Trump issued an executive order establishing English as the official language of the United States and rescinding a federal policy that required agencies to provide information in multiple languages. Immigrant rights advocates feared the move would fuel discrimination and make it more difficult for non-English speakers to vote and to access critical federal benefits.
Two weeks later, the administration announced the firing of half the staff at the Department of Education, including nearly all employees in the Office of English Language Acquisition (OELA).[24] As its name implies, the OELA ensures the proper spending of money earmarked to help students learn English. It remains unclear whether the office will continue to exist in any capacity after its gutting.
There are 5.3 million English learners in U.S. schools,[25] and 76% of them speak Spanish. Public schools are required by federal law to ensure these students have access to high-quality education. For many parents queried in our survey, that means enrolling their kids in bilingual programs.
Nearly 40% of survey respondents said their children attended bilingual, dual-language, or immersion programs. Latino families expressed deep pride in their language and culture, and they indicated strong support for bilingualism and bilingual education. Eighty-eight percent of participants reported they want their children to be bilingual, and 92% said child care facilities should offer multilingual and multicultural education. [24] Chalkbeat
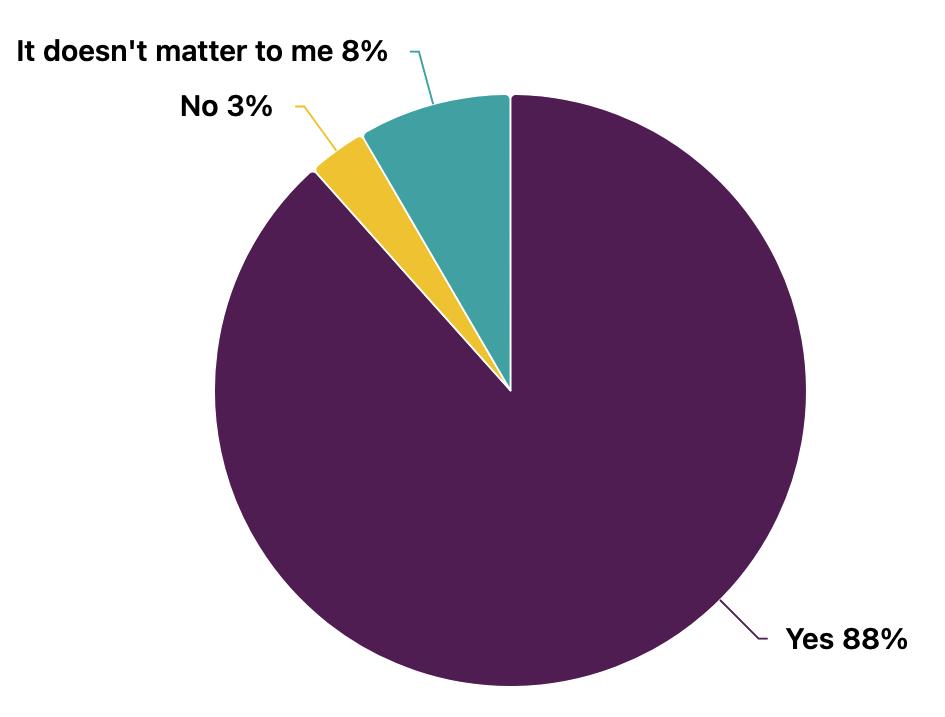
Latine LGBTQ+
Human Rights Campaign Foundation®, October 2024
due to Their Sexuality and Ethnicty, Accroding to the Joint Report by the Human Rights Campaign Foundation and the University of Connecticut.
SOURCE: Latine LGBTQ+ Youth Report
Child care costs are not immune to inflation, and prices for care in the United States have increased significantly since before the COVID-19 pandemic. According to a Center for American Progress report, the annual cost for two children in center-based care increased by about $1,000 between 2016 and 2023, even after adjusting for inflation.[22] This year, 53% of survey respondents said their youngest child had received child care outside the home, compared to 59% in the general population.[23] Among respondents whose children had not received care outside the home, 32% cite prohibitive cost as a primary reason.
The U.S. Department of Health and Human Services’ (HHS) benchmark for affordable child care is 7% of a family’s income. But this year, 39% of respondents said they spend between 11% and 25% of their take-home pay on child care. Another 17% spend between 26% and 50% of their income — a potentially debilitating financial burden that far exceeds the federal benchmark.
How much do you spend on child care each month, as a percentage of your monthly income?
[22]
In March, President Trump issued an executive order establishing English as the official language of the United States and rescinding a federal policy that required agencies to provide information in multiple languages. Immigrant rights advocates feared the move would fuel discrimination and make it more difficult for non-English speakers to vote and to access critical federal benefits.
Two weeks later, the administration announced the firing of half the staff at the Department of Education, including nearly all employees in the Office of English Language Acquisition (OELA).[24] As its name implies, the OELA ensures the proper spending of money earmarked to help students learn English. It remains unclear whether the office will continue to exist in any capacity after its gutting.
There are 5.3 million English learners in U.S. schools,[25] and 76% of them speak Spanish. Public schools are required by federal law to ensure these students have access to high-quality education. For many parents queried in our survey, that means enrolling their kids in bilingual programs.
Nearly 40% of survey respondents said their children attended bilingual, dual-language, or immersion programs. Latino families expressed deep pride in their language and culture, and they indicated strong support for bilingualism and bilingual education. Eighty-eight percent of participants reported they want their children to be bilingual, and 92% said child care facilities should offer multilingual and multicultural education. [24] Chalkbeat
Diversity Matters Even More: The Case for Holistic Impact McKinsey & Company In Their Fourth Report on Leadership Diversity and Company Performance, Mckinsey & Company’s Research Links Companies With Diverse Leadership Teams to Higher Financial Returns.
SOURCE: Diversity matters even more: The case for holistic impact
CITATION: Excerpted from “Diversity matters even more: The case for holistic impact”, December 2023, McKinsey & Company, www.mckinsey.com. Copyright (c) 2025 McKinsey & Company. All rights reserved. Reprinted by permission.

For almost a decade through our Diversity Matters series of reports, McKinsey has delivered a comprehensive global perspective on the relationship between leadership diversity and company performance. This year, the business case is the strongest it has been since we’ve been tracking and, for the first time in some areas, equitable representation is in sight. Further, a striking new finding is that leadership diversity is also convincingly associated with holistic growth ambitions, greater social impact, and more satisfied workforces.
At a time when companies are under extraordinary pressure to maintain financial performance while navigating a rapidly changing business landscape, creating an internal culture of transparency and inclusion, and transforming operations to meet social-impact expectations, the good news is that these goals are not mutually exclusive. On the contrary, our research suggests a strong, positive relationship between them. And in an increasingly complex and uncertain competitive landscape, diversity matters even more.
For this report, the fourth edition of Diversity Matters, we drew on our largest dataset yet— spanning 1,265 companies, 23 countries, and six global regions. We also extended our research beyond the relationship between diversity and financial performance, for the first time exploring the holistic impact of diversity on communities, workforces, and the environment.
There have been far-reaching changes in the business environment over the past few years, yet, companies with diverse leadership teams continue to be associated with higher financial returns. Our expanded dataset shows this is true across industries and regions, despite differing challenges, stakeholder expectations, and ambitions.
The business case for gender diversity on executive teams1 has more than doubled over the past decade. Each of our reports—2015, 2018, 2020, and now 2023—has found a steady upward trend, tracking ever greater representation of women on executive teams. At each time point we have assessed the data, the likelihood of financial outperformance gap has grown: Our 2015 report found top-quartile companies had a 15 percent greater likelihood of financial outperformance versus their bottomquartile peers; this year, that figure hits 39 percent.
A strong business case for ethnic diversity is also consistent over time, with a 39 percent increased likelihood of outperformance for those in the top quartile of ethnic representation versus the bottom quartile. This has persisted even with eight new economies added in our analysis of 2022 financial data. 2


1. The business case is the percent difference in likelihood of outperformance between companies in the top and bottom quartile for a characteristic. Outperformance is calculated as the likelihood to place above the median profitability of other companies in the same industry and region. For more information on our calculation of the likelihood of outperformance analysis, see “Methodology for financial performance.”
2. Our 2023 report draws on data that was collected in both 2021 and 2022. For this analysis, we used data collected in 2022.
Companies in our top cohorts have shown rapid, groundbreaking growth in representation, with some even attaining gender parity. In fact, diversity-leading companies in the United Kingdom have reached an ethnic-representation average, at 28 percent, that exceeds the region’s general population. Diversityleading US companies have reached 50 percent representation of women on executive teams. In addition, leading companies in the United States now have on average 39 percent of executives from historically underrepresented ethnicities.
Companies with average levels of diverse representation have also shown substantial progress. Eight in ten companies now have at least one woman on their executive team, compared to less than two-thirds in 2020’s Diversity Wins.
Considering the dataset as a whole, however, there is still a substantial gap in ethnic representation at top levels. For companies included in both our 2020 and 2023 reports, only 16 percent of leaders on executive teams belong to historically underrepresented ethnicities. 3 These gains have slowed since 2019. In 2020, 61 percent of companies had at least one person in leadership from a historically underrepresented group; this figure has grown only slightly (68 percent).
Because each region has a unique ethnic makeup and cultural norms, we have assessed rates of ethnic representation by evaluating equitable representation levels—how closely leadership mirrors regional demographics. 4 US companies are currently the closest to representing the population at 20 percent ethnic representation, but still lag behind the population share of 41 percent.
We have continued to look at boards, given the association of diverse boards with better financial performance and inclusive growth;5 even more than executive teams, they can also be a strong positive influence on the societal disposition of a company. This year we once again found that financial impact is linked to increased representation of women on boards. For the first time, we also see a significant association with ethnic representation.
Business success is not only about financial returns: with companies across the world considering their holistic impact, we’ve broadened our research lens to include environmental and social-impact performance.
Our findings are striking. Across all industries surveyed, more diversity in both boards and executive teams, in both gender and ethnicity, is robustly correlated with higher social and environmental impact scores.
We recognize that creating social impact, alongside other business priorities, is a challenging task, even for companies who have strong intentions to do so. Yet, over half of sampled companies in our dataset perform well in community involvement. 6 We find that diverse leadership teams could help to bolster community involvement, positively impacting ethical disposition, community orientation, and the general image of a company.
3. Historically underrepresented group refers to populations who have historically not been represented within leadership teams at the same rate that they exist within the general population.
4. Equitable representation refers to the level at which a leadership team's diverse representation matches the level of representation of historically underrepresented ethnicities within a given region’s population.
5. Companies in the top quartile of board-gender diversity are 27 percent more likely than those in the bottom quartile to outperform financially, and companies in the top quartile for ethnically diverse boards are 13 percent more likely to outperform than those in the bottom quartile. We tested a variety of inclusive growth metrics, including social and environmental impact. For every woman added to a company board with ten directors, there was on average a two-point increase in holistic impact scores. Additional detail located on page 16.
6. Defined as scoring above 75 on the community measure.
5 The case for diversity and holistic impact

TITLE SPONSOR
DATOS INTERACTIVE SPONSOR
FOOD SPONSORS
DATOS SCHOLARS SPONSOR
BRONZE SPONSORS
GOLD SPONSOR
EVENT PARTNERS
MEDIA PARTNERS