11 minute read
T.U.T.O.R


Select Questions From Inquiring Minds About Cooling Towers
By Robert Ferguson, French Creek Software
Over the past 46 years, several questions have been asked by generations of water treaters. This article describes these queries and provides practical answers. These questions are of interest because they cover concepts important to successful water reuse and maximizing cycles of concentration. Although these queries deal with cooling water systems, the concepts are applicable to other areas of water treatment. Each of the following sections will investigate relevant questions appropriate for successful water treatment. How Can I Tell What Is Depositing in My System? One of the first lessons for new cooling water chemists deals with determining what scales are precipitating from a particular water. Determining what ions are precipitating is straightforward and can be done using a pad and paper, Excel spreadsheet, or intense computer water modeling program. Table A summarizes the process. Note that there is a cooling tower schematic under Table A to illustrate the system used for the chemical dosage and feedrate calculations.
Table A: Determining Ions That Will Precipitate
The “Raw” column contains the water source before acid or alkali addition for pH control. The “Make-up” column depicts the chemistry after acid and or alkali addition. The “Theoretical” column contains the predicted values. For most ions, this can be calculated from Equation 1.
Theoretical = Concentration Ratio x Ion Concentration Eq. 1
This simple equation does not necessarily work for chlorides when chlorination is used for biocontrol. Chlorination adds chloride to the system. Alkalinities can be cycled in this manner because cooling towers maintain alkalinity. Certain techniques can improve the predicted theoretical values for carbonic acid species.
The “Actual” column details the measured values from the recirculating water. The accuracy of this method suffers from the use of varying makeup sources, or a source with varying chemistry. Check for precipitation by comparing the “Actual” to the “Theoretical” values. A difference of more than 20% typically flags potential deposition (1).
Why Is the pH at One Cycle Different Than the Makeup pH? Water in an open recirculating cooling system is in an ideal, aerosol state as it goes over the tower and fill. The aerosol promotes both evaporation and the exchange of carbon dioxide (CO2) with the atmosphere. This has a dramatic, predictable effect on the water chemistry and pH, as the water strives to achieve equilibrium with the atmosphere.
Cooling water flowing over a cooling tower conserves alkalinity as it exchanges CO2 with the atmosphere. The change and direction are dependent upon the initial water condition with respect to CO2 equilibrium. Deep well water, for example, may start out downhole under a high partial pressure of CO2 in the gas phase (pCO2). As the water becomes an aerosol, CO2 is released. The resultant decrease in CO2 shifts the carbonic acid equilibrium towards bicarbonate (HCO3) and carbonate (CO2), and the pH increases. The carbonic acid species rearrange maintaining alkalinity. The pH might increase from the low 6’s to the high 6’s or 7’s as the water equilibrates. Cold-lime softened makeup, on the other hand, is CO2 deficient. The cooling water aerosol absorbs gaseous CO2, shifting the alkalinity types present from hydroxide (OH) and CO3 to HCO3 and CO3. The pH might drop from the high 9’s or low 10’s to the 8’s as the water equilibrates with the atmosphere.
So, the pH at one cycle is dependent upon the initial state of the water with respect to CO2, and whether excess CO2 is flashed to the atmosphere raising the recirculating water pH, or a water deficient in CO2 absorbs CO2, lowering the pH.
How Come Silica Scale Deposits From a Water That Is Undersaturated? This common question was asked recently by the discusser of an International Water Conference paper on precipitation (2).
Silica scales differ from the common scales encountered in cooling water and other water treatment applications. Silica is incorporated into scale as a co-precipitant. Water need not be supersaturated in the bulk water with silicon dioxide (SiO2) for its inclusion in scale. Silica incorporation into scale can be critical due to the property of silica-hardening scale. Silicates are used to harden concrete and have a similar effect on scale.
Magnesium silicates in lower temperature systems tend to be nonstoichiometric due to their incorporation into mineral scales, such as calcite as a co-precipitant, or by adsorption onto or absorbtion into precipitants like Mg(OH)2 (magnesium hydroxide). Metal silicates are sometimes included in the precipitate (3).
Silica need not be supersaturated as amorphous silica or a metal silicate to precipitate due to its ability to incorporate itself into other more common scales as a co-precipitant.
What Is the Best Method for Predicting pH in a Recirculating Cooling Water? Numerous papers have been published on predicting the recirculating water pH, notably the work of Kunz (4). He obtained recirculating cooling water analysis from production facilities throughout his company. The data
was fit to Equation 3. Equation 3 is a simplified version of Equation 2, the Henderson-Hasselbach Equation used in more sophisticated systems (5, 6). Figure 1 profiles the Kunz curve.
pH = pKa + log10({CO3}/{HCO3}) Eq. 2
pH = A + log10(“M” Alkalinity) Eq. 3
Figure 1: pH-alkalinity curve from Kunz Curve.
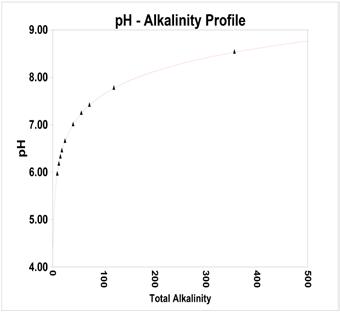
The Kunz curve is used by many of the billion-dollar water treatment service companies as a “go-to” prediction tool. It can also be found in industry handbooks.
Astute users of cooling water monitoring software “customize” the Kunz curve to a specific system. They use the slope of the Kunz curve and translate the intercept to intersect with a single pH alkalinity point from the recirculating water. Do not use a makeup water pH-alkalinity as the point for adapting the curve to a specific system. As previously discussed in this article, the pH of the makeup water is not usually the same as the recirculating water at one cycle.
A complete empirical curve can be developed from at least two data points by fitting to Equation 3. This has been found to be the most accurate method for estimating the pH of cycled waters.
More advanced methods, beyond the scope of this article, might be more appropriate when high levels of noncarbonate, nonhydroxide alkalinity are present, such as from high levels of phosphates, oxalates, ammonia, sulfides, cyanides, or other alkalis.
Why Do Saturation Ratio Predictions Sometimes Differ Greatly From Indices Such as the Langelier Saturation Index? Many water treaters ignore the limitations of simple indices such as the Langelier Saturation Index (LSI). As outlined in Langelier’s original 1936 paper (7), the index should be limited to use in waters with low total dissolved solids (TDS < 500), near ambient temperature (25 °C [77 °F]), and with alkalinity due almost totally due to carbonic acid species. Langelier also suggested that the index’s accuracy decreased as pH deviated from neutral. He suggested that iterative speciation calculations be employed to estimate free ion concentrations to account for effects like the reduction of free calcium by sulfate.
The LSI is based on the concept of supersaturation, like the more sophisticated indices calculated using free ion concentrations form speciation engines, and advance activity models (Equation 4).
Saturation Ratio = {Ca}{CO3}/Ksp’ Eq. 4
The LSI is calculated in this method using analytical values for calcium, a simple estimation for CO3, and simple activity coefficients, such as those calculated from the Debye-Hückel equation (8). The DebyeHückel model for activity coefficient estimation in aqueous systems is a simple correlation of activity to ionic strength, which is applicable to low total dissolved solids (TDS) systems only. A TDS of 500 milligrams per liter (mg/L) is a reasonable upper limit for its accuracy. This simple correlation accounts for distance effects of molecular interactions but does not cover near interactions. Activity estimations are covered in detail in References 9 and 10. Most users ignore Langelier’s admonition to correct alkalinity for noncarbonate alkalinity and use an iterative procedure to estimate carbonate concentration.
A paper presented by the author and a discussion by Bluemle (9, 10) at the 2011 International Water Conference helped to develop a thorough comparison of the calculation methods and their limitations. When the limits for using the LSI are exceeded, it is not unusual to see a high LSI predicting catastrophic scale formation,
while a more sophisticated index portrays a water that will tend to dissolve rather than form scale. For best results, do not apply the LSI outside of its limits.
Indices and saturation ratios calculated using speciation engines, free ion concentration rather than total analytical values, and sophisticated activity corrections overcome or minimize errors inherent in the simple indices and expand the temperature and ionic strength range for accuracy. Indices so calculated also are “transportable” and have the same meaning over a broad range of systems and waters.
Should I Be Concerned About Barium in the Makeup Water? In the era of low cycles of concentration and a constant freshwater makeup, the primary scaling concerns for water treaters were classics like calcium carbonate, silica, calcium phosphates, and calcium sulfates. Barium sulfate scales were primarily found in reverse osmosis, wastewater, and oil field applications. Field technicians rarely, if ever, tested for barium in the makeup source. With the advent of water reuse applications, the use of less than desirable makeup sources, and higher cycles, ”mystery” scales began to appear. This would occur with the use of previously “safe” makeup water sources such as Lake Michigan-derived waters, including the thoroughly studied Chicago Tap Water (11).
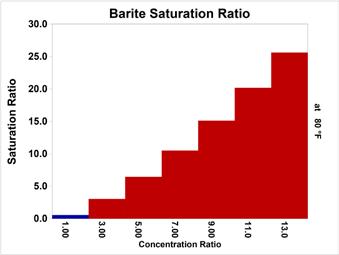
Lake Michigan water has around 0.02 of barium as Ba, which might seem like an insignificant concentration. At five cycles, the barium sulfate (barite) scale potential is readily inhibited by the typical treatments based on general use phosphonates and simple polymers, even when sulfuric acid is used for pH control.
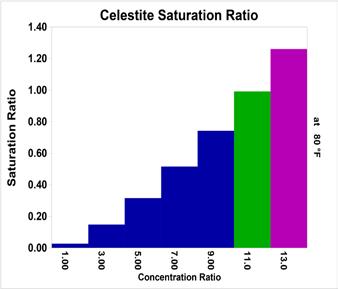
As cycles increased, the Barite Saturation ratio driving force exceeds that handled readily by phosphonate like HEDP (1,1-hydroxethylidene diphosphonic acid) and polymers like PAA (polyactrylic acid). At higher cycles, treatments based on phosphonates typically used for stressed sulfate scale systems must be implemented. Treatments for high-sulfate-scale potential waters include DTMPA (diethylenetriamine penta(methylene phosphonic acid)) combined with copolymers and higher sulfonic acid derived polymers. Figure 2 profiles barite (BaSO4) saturation ratio versus cycles of concentration ratio for Chicago Tap Water. Figure 3 profiles celestite (SrSO4) saturation ratio versus cycles of concentration ratio for Chicago Tap Water. Celestite is rarely, if ever, found as a sole scale but is often encountered as a co-precipitant with barite.
Figure 2: Barite (BaSO concentration ratio. 4) saturation ratio versus
Figure 3: Celestite (SrSO concentration ratio. 4) saturation ratio versus
In Summary Typical phenomena observed in cooling water and other industrial water systems can be explained and modeled using the basic laws and correlations of physical chemistry.
References
1. Ferguson, R.J. (Feb. 11–13, 2020). “Tailoring Scale Prediction Models to a
Specific Application: Cooling Water,” Paper No. CTI TP-19-20, Cooling
Technology Institute, New Orleans. 2. Ferguson, R.J. (November 2020). Modeling Mineral Scale Precipitation
Mass in Industrial Systems,” Paper No. IWC 20-73, International Water
Conference 2020 Virtual Conference. 3. Ferguson, R.J. (Sept. 16–20, 2003). “Water Treatment Rules of Thumb:
Myths or Useful Tools,” annual conference of the Association of Water
Technologies, Phoenix, Arizona. 4. Kunz, R.G.; Yen, A.F.; Hess, T.C. (1977). “Cooling-Water Calculations,”
Chemical Engineering, pp. 61–77. 5. Henderson, L.J. (1908). "Concerning the Relationship between the
Strength of Acids and their Capacity to Preserve Neutrality,” American
Journal of Physiology 21(2), pp. 173–179, doi:10.1152/ajplegacy.1908.21.2.173. 6. Hasselbalch, K.A. (1917). "Die Berechnung der Wasserstoffzahl des
Blutes aus der freien und gebundenen Kohlensäure desselben, und die
Sauerstoffbindung des Blutes als Funktion der Wasserstoffzahl,”
Biochemische Zeitschrift, 78, ("The Calculation of the Hydrogen Number of the Blood from the Free and Bound Carbonic Acid of the Same, and the
Oxygen Binding of the Blood as a Function of the Hydrogen Number."
Biochemical Journal) pp.112–144. 7. Langelier, W.F. (1936). “The Analytical Control of Anti-Corrosion Water
Treatment,” Journal of the AWWA 28(10), pp. 1500–1521. 8. Debye, P.; Hückel, M. (1923). “The Theory of Electrolytes,” PHYSIKA-
LISCHE ZEITSCHRIFT (Physical Magazine), S. Hirzel Publishing Co.,
Leipzig, Germany. 9. Ferguson, R.J. (Nov. 13–17, 2011). “Mineral Scale Prediction and Control at Extreme TDS” Paper No. IWC 11–77, International Water Conference,
Orlando, Florida. 10. Bluemle, M. (Nov. 13–17, 2011). “Prepared Discussion of Mineral Scale
Prediction and Control at Extreme TDS,” Paper No. IWC 11-77D,
International Water Conference, Orlando, Florida. 11. Ferguson, R.J.; Ferguson, B.R. (Oct. 20–24, 2010). “The Chemistry of
Strontium and Barium Scales,” annual conference of the Association of
Water Technologies, Reno, Nevada.
Robert J. Ferguson is the president of French Creek Software, Inc., a company he co-founded in 1989. His professional career includes positions with Nalco, Apollo, Mogul, Calgon, Chemlink, and Baker. Mr. Ferguson began modeling mineral scale formation and its control in 1974. Software he has developed is used for modeling cooling water, reverse osmosis, and oil field chemistry. He was educated at the U.S. Naval Academy and the University of Minnesota and received a B.S. in biochemistry and microbiology. Mr. Ferguson was honored to have been named the 2017 Ray Baum Water Technologist of the Year and to have received the first ever AWT Innovation Award in 2020.
World Leader in Supplemental Disinfection Technologies
Partner with Sanipur and become your clients water hygiene expert today!
Visit us @ www.sanipur.com or send an email to sales@sanipur.com Phone 484-351-8702