15 minute read
Can Packed-Bed IX Reduce the Environmental Impact for Makeup Water Treatment?

John Wale, Ecodyne LTD (Marmon Group), and David T. Dally, LANXESS Sybron
Historically in North America, ion exchange (IX) resins have proven to be one of the most reliable methods for producing large quantities of deionized (DI) water on a continuous basis. As with other technologies, the processes used to produce high-purity DI water have been greatly improved over the decades. Through 60 to 70 years of technical development and industrial production, IX systems have become remarkably high tech, powerful tools used in astonishingly sophisticated manufacturing applications.
The conventional co-flow and countercurrent block-flow demineralizer systems have been operating in most water treatment plants throughout North America for decades and have proven to be relatively trouble-free for treating industrial water.
However, it has been shown that a countercurrent, packed-bed demineralizer in combination with uniform particle size (UPS) resins can produce more water of higher quality, with less waste, at a lower cost. This article discusses the replacement of an existing blockflow countercurrent DI system (vintage 1975) with a custom-designed packed-bed system.A
Packed-Bed Systems Packed-bed technology was first developed by Bayer AGB in 1949. This new design featured an up-flow service and downflow regenerant countercurrent design. During the early 1970s the packed-bed technology was originally introduced into the United States by Bayer, but with little fanfare or interest. At the time, conventional co-current and countercurrent technology was well established and dominated the market.
By the 1980s, up-flow service countercurrent packed-bed technology was already in use and well accepted in Europe and much of the world. Packed beds were proven to be reliable and more importantly, already met most of the necessary criterion that would later become important to U.S. industry. However, their use in the United States was still limited.
During the late 1980s and early 1990s, packed-bed technology had finally started to gain acceptance in North America and was being marketed as the “new technology” by various major equipment and IX resin manufacturers. This was due in part to competition from other newer technologies, such as reverse osmosis (RO) and electrodeionization (EDI), and more importantly, to accommodate the new interest of users to improve operational efficiencies and meet stricter waste discharge limits.
Figure 1 provides two examples of common designs for packed-bed IX systems.
Figure 1: Two examples of common designs for packed-bed designs for IX systems using up-flow service design.
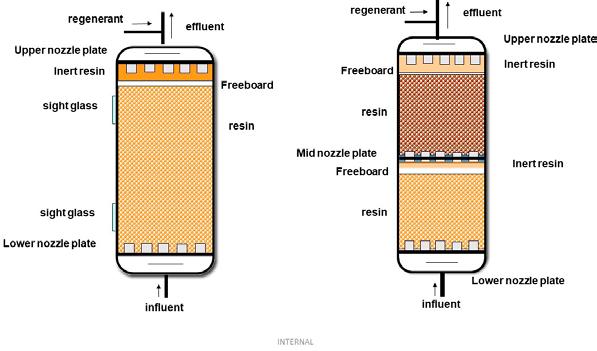
Packed-bed designed systems are a relatively simple design with up-flow exhaustion and downflow regeneration. The resin is placed between two nozzle plates or distributors. A layer of floating inert resin is placed between the active resin bed and the top nozzle plate. The floating inert resin prevents resin fines and impurities from clogging the upper nozzle plate, helps reduce pressure drop, and ensures optimum distribution of the regenerant. A minimum of freeboard is required to account for the swelling of the resin. Freeboard is minimized to prevent fluidization.
Up-flow design. Major advantages of the up-flow packed-bed design include:
Lower pressure drops, resulting in a narrower column diameter (smaller footprint).
Lower service and demineralized water consumption for rinsing and dilution.
Utilization of deeper resin beds
Lower and more consistent leakage than other regeneration strategies.
Lower regenerant usage/increased operating efficiency compared to other regeneration strategies.
More packed-bed (up-flow service) designed DI systems have been installed throughout the world than any other countercurrent design strategy.
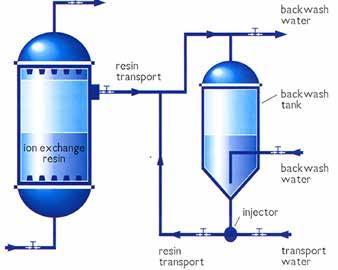
A commonly perceived disadvantage to the packed-bed system is the need for an external backwash tank. (See Figure 2.). In fact, some current manufacturers of packed-bed systems have tried to address this perceived disadvantage by asserting that IX resins never get fouled with their design and that an external backwash tank is not required. However, it is our experience that the resins in all systems will require backwashing or cleaning at some point in their life and there is no place in the vessel to perform the function—so an external backwash tank is strongly recommended in a carefully designed packed-bed system.
Furthermore, the external backwash tank provides maximum operating flexibility and has advantages such as provision for optimal resin cleaning, allowing for easy resin removal and replacement, and providing a place to conveniently store resin during vessel inspections or other required maintenance.
Figure 2: Packed-bed with external backwash tank. Note: For this schematic, the Resin Transfer Velocity = 1 meter per second (m/s) and the Mixing Ratio (water to resin) > 2:1.
Facility Description In this article, we use a fertilizer plant located in Alberta, Canada, as an example to compare the use of conventional IX to a packed-bed IX water treatment system. The raw river water source used at the facility is cold-lime softened followed by dual-media filtration systems prior to being directed to the DI trains. Since 1976, to provide boiler and process water to the plant, five block-flow, countercurrent demineralizer trains with the following dimensions and resin volumes were used, as detailed in Table A.
Table A: IX System Characteristics
IX System Size
3 Trains
Cation/Anion Vessel Size
Resin Volumes/ Type
Cation: 9.5 ft X 12 ft 443 ft3, SAC Anion: 8.5 ft X 12 ft 330 ft3, SBA
2 Trains Cation: 11 ft X 12 ft 475 ft3, SAC Anion: 11 ft X 13 ft 380 ft3, SBA
Notes: SAC = strongly acidic cation; SBA = strongly basic anion
A common degassifier was placed between the strongly acidic cation (SAC) and strongly basic anion (SBA) units. The demin trains were limited to a gallon set point based on free-mineral acidity (FMA) versus throughput based on historical data. The DI trains were considered exhausted on a silica break of 250 parts per billion (ppb) or a conductivity break greater than 10 microsiemens per centimeter (µS/cm).
During 2010, the facility decided to replace the older block-flow, countercurrent system with a new, custom-designed, packed-bed countercurrent system. The main reason for replacement was end-of-life of the vessels and control systems. RO was considered but dimissed due to cost comparisons and complications of downstream processes. It was decided that IX was a better choice.
Replacement Demineralizer Plant Compared to conventional demineralizer designs, up-flow service, downflow regenerated, countercurrent packed beds are designed for higher regenerant efficiency along with higher purity water production (lower leakage). Because of optimal internal design along with the use of UPS resins, both service water and regenerant are uniformly distributed through the resin bed, minimizing any hideout.
The replacement demineralization system has been operating since 2011. The DI system operates 24 hours a day, 7 days per week, with a design flow of 855 gallons per minute (gpm) per train and a normal flow of approximately 750 gpm per train. A single train operates for 30 to 35 hours between regenerations and produces approximately 1.3 to 1.6 million gallons (gal) of treated water. Four trains are included in the design.
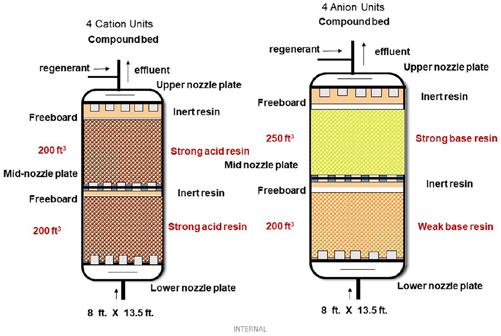
Each DI train consists of one cation unit containing two compartments (compound bed) with 200 cubic feet (ft3) of strong acid cation resin per compartment and one anion unit with two compartments (compound bed), with the bottom compartment containing 200 ft3 of weak-base resin and the top compartment containg 250 ft3 of strong-base resin (Figure 3). The cation unit in this application is a special liftbed design with minimal backwashing capability as contingency for potential upsets in the pretreatment equipment and the dual compartment anion is designed not only for optimum regeneration efficiency but also resistance to organic fouling due to the use of weak base resin.
A degassifier was not required due to lime-softened water. Additional dual-media filters were added to provide extra protection against total suspended solids (TSS) getting into the inlet. External backwash tanks were supplied for both the cation units and anion units. Each DI train is externally backwashed once or twice a year as required.
Figure 3: Compound beds unit sizes: left—8 ft X 13.5 ft; right—8 ft X 13.5 ft
Original Versus Updated IX System Performance Comparing performance data from pre-2010 (old DI system) to performance data from 2015 (modern packed-bed system) illustrates the improved performance and effluent quality with some interesting trends, as listed in Table B.
Table B: Packed-Bed System Performance and Effluent Quality Compared With Conventional IX
Parameter Conventional Packed Bed
Flow velocity (gpm/ft2) 8–12 15–18
Average conductivity (µmhos) 2–2.69 0.25–0.4 Silica (ppb) < 10 < 5 Average throughput/month (gal) 50,727,122 63,705,507 Average run length (gal) 840,067 1,534,672
Note: Effluent quality is improved by an 85% reduction in sodium (based on conductivity) and a 50% reduction of silica leakage.
Economics: Original Versus Modernized Comparing economic data from pre-2010 (old DI system) to performance data from 2015 (replacement packed-bed system) illustrates the improved economic performance, as shown in Table C. Cost figures are in Canadian dollars.
Table C: Cost Performance of Old Versus Updated DI System
Parameter
Conventional Packed Bed
Average acid/month (kg) 103,008 56,664 Average NaOH/month (kg) 119,941 51,193 Average regeneration/month 64 41 Total acid/year (kgr) 1,236,096 679,968 Total caustic/year (kgr) 1,439,292 614,316 Acid cost/year at $0.23/kg $284,302 $122,394 Caustic cost/year at $1.25 kg $1,799,115 $645,032 Labor at $35.00/hour $107,520 $60,270 Maintenance $50,000 $10,000 Total annual operating cost: $2,240,937 $837,696
Note: Cost figures in Canadian dollars.
Wastewater Reduction In addition to large cost savings in regenerant, energy, and labor, the generation of wastewater was reduced by approximately 46 million gallons per year due to longer service cycles (fewer regenerations per month) and a huge reduction in final rinse volumes because rinse recycle was incorporated into the final design. Although the customer is not charged for the final discharge of their wastewater, there is additional cost savings by not having to treat this water through lime softening and neutralization, as required with the older block-flow design.
These calculations do not include cost savings associated with four polishing mixed-bed units that would see extended service cyles due to a higher quality of water produced by the new demineralizer system. An additional reduction in yearly regenerant levels, labor costs, and wastewater would result for the existing downstream equipment as well (not included in this caclulation as operating data not provided by site). The mixed-bed units are now more of an insurance policy for more stable steam drum chemistry due to steady and low sodium levels in the mixed-bed outlet. The maximum run length for the MB units is 15 million gallons with no silica break.
Wastewater Calculations: 2015 New Packed-Bed System Table D provides calculations for the packed-bed system installed in 2015.
Table D: Regeneration Flows for Anion and Cation Resins
Regeneration Step Flowrate (gpm) Time (min)
Cation Unit 2015
Acid injection-1 262 Acid injection-2 262 Acid displacement 262 Fast rinse (recycle) 885 Total Cation Waste (gal)
Anion Unit 2015 X 30
X 15
X 32
30
20,174
Caustic injection 191.7 NaOH displacement 191.7 X 35
X 40
Fast rinse (recycle) 885 30
Total Anion Waste (gal) 14,379
Findings:
1. Total wastewater produced per regeneration: 20,174 gal + 14,379 = 34,553 gal
2. Average number of regenerations per year = 492
3. Volume of wastewater generated per year = 17,000,076 U.S. gal for the new system
Note: Gallons are in U.S. gallons.
Table E shows wastewater calculations for the old DI system.
Table E: Wastewater Calculations for Pre-2010 Conventional Block-Blow System
Cation Unit 2010 Regeneration Step Flowrate (gpm) Time (min)
Backwash (1oo10) 530 3 Acid injection 425 X 45 Acid displacement 425 X 30 Fast rinse 450 X 45
Anion Unit 2010
Total Cation Waste 52,125 gal
Backwash (1oo10) 170 Caustic injection 180 Caustic displacement 425
Fast rinse 400 3
X 45
X 30
X 45
Total Anion Waste 38,830 gal
Findings
1. Total wastewater produced per regeneration: 52,125 gal + 38,330 gal = 90,455 gal 2. Average number of regenerations per year = 768 3. Volume of wastewater generated per year = 69,469,440 U.S. gal for old system
Overall, the decision to replace the older block-flow demineralizer system with a high-efficiency packed-bed system has resulted in approximately 4+ million gallons per month in water savings. If we add a cost savings of $1 to $2 (Canadian $) per 1,000 gallons of treated water due to lime and neutralization chemicals, the customer should realize a yearly cost benefit of $43,000 to $86,000 per year.
Based on the calculated approximate annual operating cost savings of $1.5 million, the payback period for the premium paid to obtain a new packed-bed designed system compared to the cost of a new replacement-inkind conventional system at the time it was sold was less than six months.
Design Software A design softwareC was used to help determine required resin volumes and regeneration requirements based on specified operating conditions for the updated DI treatment plant. This is examined in the Appendix, which reviews the type of data the equipment supplier used when designing and then building the replacement packed-bed DI system.
Summary In reviewing this example, it is readily apparent that the use of optimally designed packed-bed systems will provide substantial performance improvement and operating cost benefits compared to older conventional units in similar operating conditions. The cost of chemicals is the main factor, but there are also additional savings in wastewater volume, energy, labor, maintenance, and reduced water consumption.
To summarize, here are some advantages for the use of packed-bed IX:
Decrease in consumable chemicals
Higher quality effluent to the polishing mixed-bed units
Increased throughput for separate beds and mixed beds
Ease of operation.
Reduction in wastewater/chemicals
Higher flux, small footprint per vessel
Endnotes
A The packed-bed design discussed in the text was developed by Ecodyne Ltd., the IX equipment supplier mentioned in the text, with the aid of software developed by LANXESS. B Bayer AG is one of the companies that pioneered in IX technology back in the 1940s. In 2004, Bayer reorganized its business to only focus on healthcare products and at that time formed LANXESS AG as a separate company focused on specialty chemicals and parts of Bayer’s polymer business, including IX resins. C The LewaPlus software was developed and provided by LANXESS (formerly Bayer) and the system design was conceived and implemented by Ecodyne.
John Wale has worked for Ecodyne Ltd. for the past 36 years and currently is a technical sales manager with the company. Mr. Wale holds a B.Eng. from McMaster University in Ontario, Canada, and has a P.Eng. designation in Ontario. He may be contacted at john.wale@ecodyne.com. Dave Dally holds a B.A. in geology from the University of California, a B.S. in chemical engineering from Drexel University, and an MBA from Drexel. His professional background includes 10 years at Crane Cochrane and 30 years with Sybron, Bayer, and LANXESS providing technical support with IX resins. Mr. Dally can be reached at dave.dally@ lanxess.com.
This paper was presented at the 2019 Electric Utilities Chemistry Workshop, which was conducted June 4–6, 2019, in Champaign, Illinois.
APPENDIX Figures 4 through 7 show types of data entered into the design software.C This was one of the tools that the supplier used as it designed and built the updated DI system. Figure 8 shows a packed-bed DI system built following this approach.
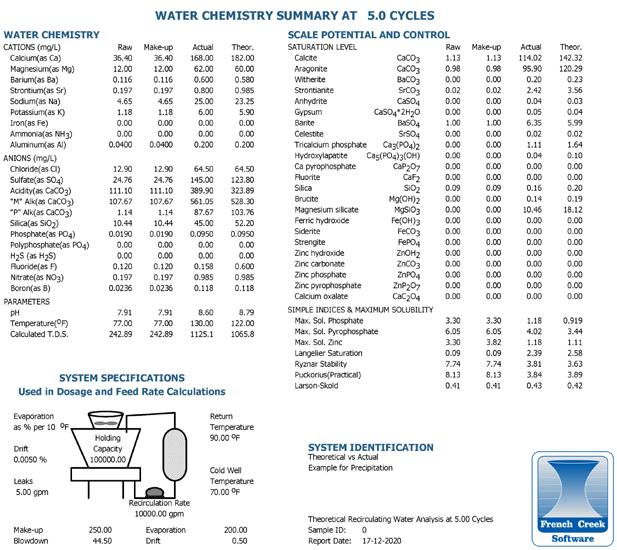
Water Analysis
Figure 4: Example of a water analysis for a treatment system.
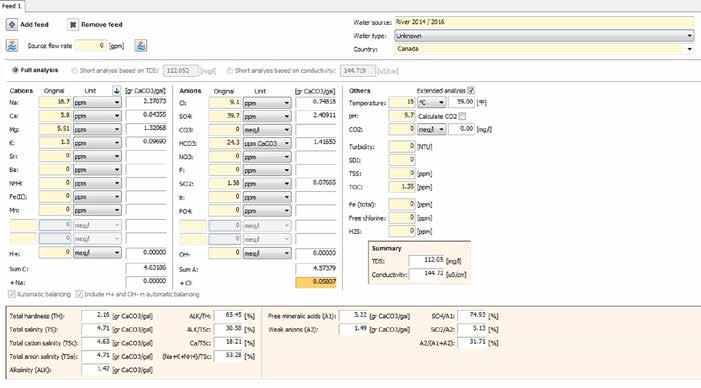
Comment: A complete, accurate water analysis is the most important part when designing a water treatment system. Total organic carbon (TOC), water temperature, pH, and silica levels are some of the most important items to be included in any water analysis. Design software packages like the one used for this report will calculate the total dissolved solids (TDS), free CO2 level, and conductivity for the raw water. When inputing data, units can be selected from a list that includes parts per million (ppm), mg/L, milliequivalents per liter (meq/L), and grams per liter (g/L), among others. The contaminant levels listed are averages taken from data collected by the customer for 2014 and February and June of 2016.
Resin and Regenerant Selection
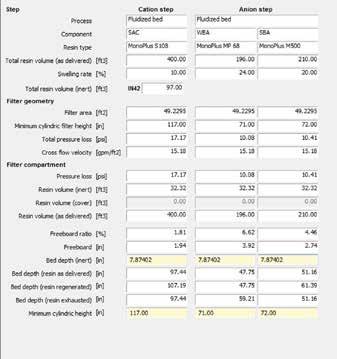
Figure 5: Displays product and regenerant selection, levels used to calculate the final water quality, and throughput. Actual net throughput is based on regenerant levels, resin volumes, and endpoint. The program automatically calculates a safe acid or caustic concentration based on the water analysis and system design. Unit Design
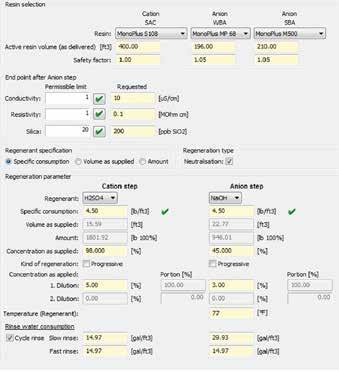
Figure 6: Displays include unit dimensions, resin volumes, resin bed depths, flow velocities, and others. Pressure drop and % free board along with floating inert volume and depth are calculated.
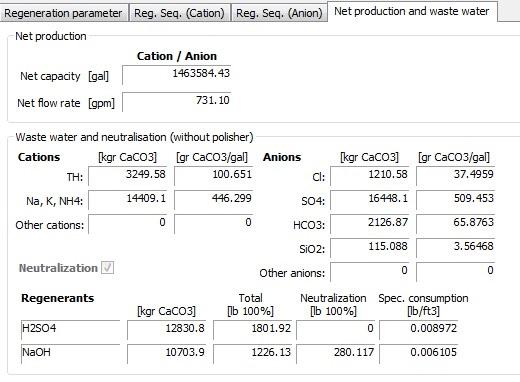
Net Production and Wastewater
Figure 7: Net production and flowrate along with wastewater neutralization.
Example of Packed-Bed IX Equipment
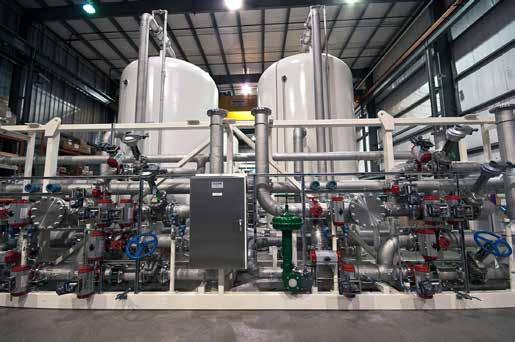
Figure 8 shows an example of an actual packed-bed system built based on this approach.
Figure 8: Example of a pack-bed IX system.
Ask for Legiolert and deliver more accurate Legionella results
The Legiolert® Test is a more
accurate culture test for Legionella pneumophila
Spread plate methods are notoriously inaccurate, with up to tenfold variability in results for the same sample.1 Multiple peer-reviewed studies have confirmed that the Legiolert Test provides more accurate and consistent results.2–5

Request the Legiolert Test from your laboratory today or find a laboratory at idexx.com/LPlabs.
References 1. Lucas CE, Taylor TH Jr, Fields BS. Accuracy and precision of Legionella isolation by US laboratories in the ELITE program pilot study. Water Res. 2011;45(15):4428–4436. doi:10.1016/j.watres.2011.05.030 2. Petrisek R, Hall J. Evaluation of a most probable number method for the enumeration of Legionella pneumophila from North American potable and nonpotable water samples. J Water Health. 2018;16(1):25–33. doi:10.2166/wh.2017.118 3. Spies K, Pleischl S, Lange B, et al. Comparison of the Legiolert/Quanti-Tray MPN test for the enumeration of Legionella pneumophila from potable water samples with the German regulatory requirements methods ISO 11731-2 and ISO 11731. Int J Hyg Environ Health. 2018;221(7):1047–1053.doi:10.1016/j.ijheh.2018.07.006 4. Sartory DP, Spies K, Lange B, Schneider S, Langer B. Evaluation of a most probable number method for the enumeration of Legionella pneumophila from potable and related water samples. Lett Appl Microbiol. 2017;64(4):271–275. doi:10.1111/lam.12719 5. Barrette I. Comparison of Legiolert and a conventional culture method for detection of Legionella pneumophila from cooling towers in Québec. J AOAC Int. 2019;102(4):1235–1240. doi:10.5740/jaoacint.18-0245