11 minute read
Advances in Online Iron Monitoring in the Presence of FilmForming Products


Advances in Online Iron Monitoring in the Presence of Film-Forming Products
Kenneth Kuruc, Hach Co.
Introduction Water plays a vital role in the successful operation of fossil power stations. High-purity water is used in boilers to produce steam to drive the turbines that generate electricity. And water is also used in cooling towers, which are also vital to operations at most power plants.
One area of concern is the metallurgy and how to properly treat the water to prevent boiler/steam system failures and possible plant shutdowns. Corrosion of ferrous steam cycle components is a serious safety and financial risk with the potential to cause fatal accidents, significant repair costs, and lengthy downtime (1). Accordingly, monitoring iron corrosion is a high priority for power and steam producers. Total iron monitoring has historically been performed via grab sampling and expensive, time-intensive laboratory analysis (2).
Since iron corrosion exists primarily in particulate or colloidal forms, online monitoring using nephelometers and particle analyzers have been employed as surrogate measurement techniques (3, 4). These kinds of instruments provide real-time data, but they do not measure iron directly, nor do they offer quantitative iron concentrations.
As the process waters used in power generation are extremely pure, it can be assumed that almost all insoluble matter present in a ferrous metallurgy process stream is due to steel corrosion in the form of particulate or colloidal iron oxides. This is an important assumption, and the entire discussion that follows is based on that premise. While the focus of this article is primarily made to the power generation sector, it holds true for any steam process utilizing ultrapure water as its source. However, caution must be exercised if considering return condensate in a cogeneration facility where there is any possibility of cross-contamination from the process.
Corrosion of steel components in power generation is generally found primarily as iron (II, III) oxide (magnetite), α-iron (III) oxide (hematite), or dissolved iron (1). Each of these species produces a different nephelometric response to visible light. Black magnetite absorbs more and reflects less light than red hematite. Dissolved iron does not produce any nephelometric response. Corrosion products range in size from sub-micron to 10 microns (µm) in diameter, with an average diameter of 1 µm (5). This range of diameters poses another challenge for particle monitoring, as nephelometers respond differently to different particle sizes. The variables associated with iron corrosion products (species, color, particle size) make it impossible to create a universal nephelometric calibration for quantification of corrosion products.
A nephelometric calibration that is appropriate for a particular sample location with corrosion characteristics will not be accurate for another location with different corrosion characteristics. Total iron measurements require digestion of the particulate and colloidal iron oxides that constitute most of these products.
By using a combination of a simple colorimetric total iron laboratory analysis with a sensitive nephelometric analyzer, a cost-effective, quantitative, real-time corrosion monitoring solution is possible. When properly calibrated, the nephelometric units provided by a nephelometer can be correlated to total iron concentration values. The iron concentration of the process water is a direct indicator of steel corrosion.
The Iron Correlation Curve Before being able to glean any information from an online nephelometer, it is first critical to establish a correlation curve for this analyzer. Typical units of measurement are in Nephelometric Turbidity Units (NTU), which measure the intensity of light scattered at 90 degrees as a beam of light (in this case a laser) passes through a water sample. The assumption is also being made that the water (condensed steam) sample does not contain any particulates other than iron. This is generally true in an all-ferrous steam cycle.
The fact that the majority (> 90%) of corrosion product in a steam cycle (assuming all ferrous construction) is in the particulate form is advantageous for this method, though not critical. Although particle counters have been employed in the past in this regard, they do not detect particles under 2 µm in diameter. The laser nephelometer can detect a large range of particle sizes down to sub-micron dimensions.
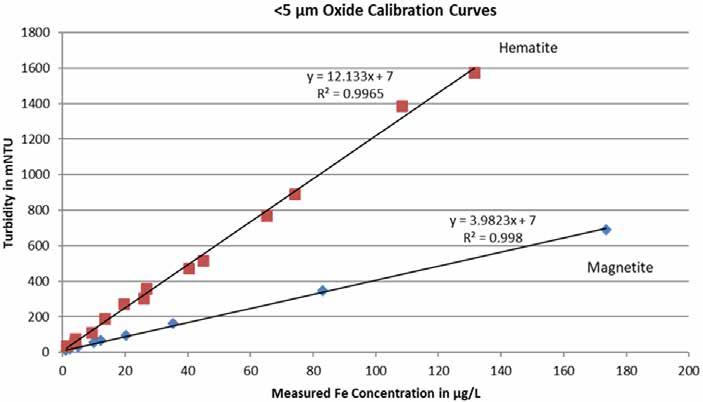
To develop a correlation between the process iron concentration in the steam cycle and an online laser nephelometer, a correlation curve must be developed. As illustrated in Figure 1, hematite and magnetite will reflect laser light differently. Also, nephelometers with different wavelengths of light will generate different curves.
Figure 1: Correlation curves for hematite and magnetite using two different nephelometers.
The first step is to obtain several (4 to 6) grab samples directly from the outlet of the nephelometer. It is important that the nephelometer reading is steady and has not been trending in either direction for at least a couple of hours. This will ensure that the sample being obtained is representative of the reading being displayed on the analyzer. As the samples are taken, the reading on the nephelometer is noted (in units of milli NTU [mNTU]).
The samples then need to be digested to get all iron present into solution. As this procedure has been discussed in prior papers, the reader can refer to the actual method for details (6, 7). Once the samples have been digested, they can be analyzed with a bench-top spectrophotometer at 562 nm using the proprietary FerroZine® Method 10287 (8). Samples are averaged, with any extreme outliers dropped.
The resulting concentration is used along with the nephelometer reading to create the site-specific curve. The relationship has been demonstrated to be linear, at least in the region of interest. Further, it has been demonstrated in the laboratory that ultrapure water with no particulates will produce a nephelometer reading of 7 mNTU. This value, along with the experimental value, provide the two data points required to obtain the equation for iron concentration.
Establishing a Site-Specific Correlation The charts in Figures 2 and 3 reflect correlation curves (slopes) for the two different sites being considered in this study. The x-axes represent the nephelometer readings in mNTU, and the y-axes represent iron concentrations in parts per billion (ppb). They are quite similar, indicating oxidizing chemistries in both cases. Although the slopes may become less linear at higher iron levels, the focus for monitoring corrosion product transport is at trace levels.
Figure 2: Site-specific correlation curve.
Combined Cycle Power Plant - AFP (Study 1)
mNTU
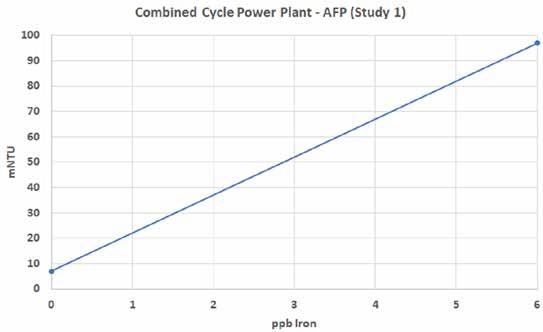
ppb Iron
Figure 3: Site-specific correlation curve.
Coal-Fired Power Plant - NFP (Study 2)
mNTU
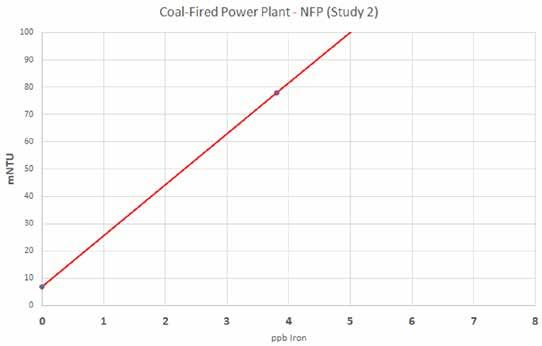
ppb Iron
From these linear relationships, an equation can be developed based on the simple y = mx +b relationship, where “m” is the slope of the line and “b” is the y-intercept. The online laser nephelometer can be monitored continually and the nephelometric readings converted to iron concentration using Equations 1 and 2.
Fe = (mNTU – 7)/15.0 for the AFP study Eq. 1 Fe = (mNTU – 7)/18.7 for the NFP study Eq. 2 The respective equations can either be entered into the process controller for the nephelometer (if equipped with that capability) or into the facility’s distributed control system (DCS). Either way, a direct reading in units of ppb iron can be obtained on a continuous basis from the process measurement.
Mitigating the Problem Film-forming products (FFP) continue to receive attention as a means of passivating metal surfaces in the steam cycle, especially with systems that cycle frequently. At the same time, facilities that have added these products to their cycle need to prove that their investments are effective in reducing both production and transport of corrosion products.
There are several commercially available amine-based film-forming products (AFP) and non-amine filmforming products (NFP). It is not the intent here to discuss the place of either of these types of products in the overall management of water chemistry in a steam cycle. Instead, it is the goal to demonstrate, with some degree of certainty, that they can be used and reliably monitored as one component of a well-managed chemistry program.
In two separate case studies, one using an NFP and the other an AFP, a laser nephelometer was employed along with a laboratory spectrophotometer to quantify online concentrations of iron on a continuous basis in the steam cycle. The results illustrate corrosion product transport on a real-time basis. The data at each facility was logged as the plant progressed through conditions such as repetitive load changes, where corrosion of an untreated surface can be most prevalent. The protective capacity for the specific product used can be observed to demonstrate its contribution in reducing corrosion product and its transport throughout the steam cycle.
Case Study No. 1
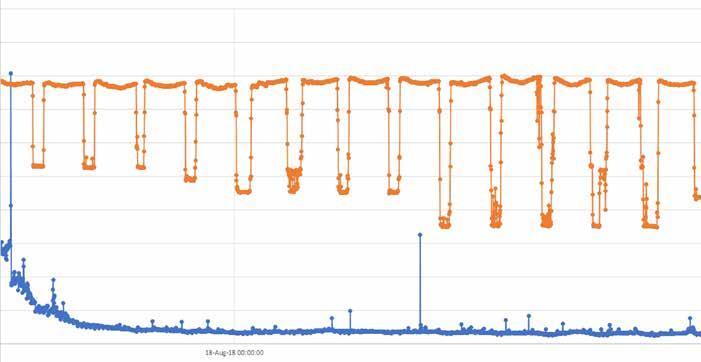
This site was a combined-cycle facility in the United States feeding an amine-based film-forming product (AFP). The product had already been introduced into the steam cycle prior to the start of the study. As a result, no pre-introduction baseline was able to be established as would be desired from an experimental perspective. For this study, the analyzer was placed on the intermediate-pressure (IP) drum. The resulting baseline reading corresponded to a consistent low level of iron, indicative that the filming amine was already reducing the transport of corrosion product (iron), even among 250 to 450 megawatt (MW) daily load changes, as seen in Figure 4. It has been previously demonstrated that change in load can be a significant source of corrosion product transfer.
Figure 4: Nephelometer (blue in mNTU) versus Load (orange in MW) over a 12-day period for the AFP study at the IP drum of a combined-cycle plant.

Case Study No. 2
The second site was a coal plant in the United States that fed an NFP. In this instance, a baseline was able to be established with the nephelometer prior to the addition of the product, as illustrated in Figure 5. For this study, the analyzer was placed at the economizer inlet of a coal-fired plant. It is apparent from the intensity of the nephelometer readings and corresponding iron values that corrosion product transport was taking place quite frequently over the seven-day period of monitoring.
Figure 5: Nephelometer (blue) and calculated iron (yellow) values before the addition of NFP at the economizer inlet of a coal plant
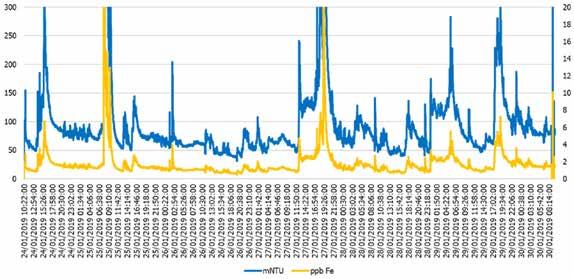
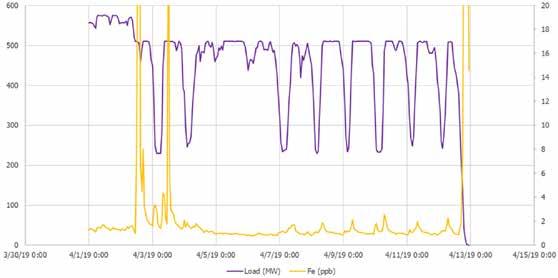
Figure 6 shows iron data for a two-week period after the film-forming product had been fed to the system for some time, along with load. The data clearly show that in the presence of the film-forming product, even load changes in the 250-MW range did not cause any substantial increase in corrosion product transfer. While it is unclear what caused the spike of iron at the beginning of the trace, it does appear that it was not aligned with a change in load.
At the end of the trace, another more significant spike of iron was noted that corresponded to a complete shutdown of the unit. While this cannot be taken as conclusive evidence, it does demonstrate that, while the presence of a filming amine in the steam cycle can reduce iron transport significantly, it does not necessarily eliminate it completely.
Figure 6: Calculated iron (yellow) and load (purple) after the addition of NFP at the economizer inlet of a coal-fired plant.
Conclusions In these two case studies, it was demonstrated that both the NFP and AFP could reduce the amount of corrosion product transport (i.e., iron) during certain events, such as a change in load, believed to be contributors to these products. It was also demonstrated that by using a laboratory method of correlating iron levels, a laser nephelometer could be employed as an online surrogate for measuring these corrosion products on a continual basis.
It should be further noted that, while the results here support the effectiveness of the two film-forming products being used, it was not within the intent or scope of this discussion to provide any prequalifications or system requirements for adding one of these products to a particular water loop or steam cycle. Before making any changes to a facility’s corrosion-prevention program, appropriate personnel and/or consultants should review existing conditions to determine whether this might be an effective alternative.
References
1. Dooley, R.B. (2008). “Flow-Accelerated Corrosion in Fossil and
Combined Cycle/HRSG Plants,” Power Plant Chemistry 10(2), pp. 68–89. 2. Sampson, D. (September 2011). “ACC Users Group: Corrosion Product
Transport Monitoring,” 3rd ACC Users Group Conference, San Francisco,
California. 3. Bryant, R.L. (2008). “Using Particle Counters for Pretreatment
Optimization, Iron Transport Monitoring, Condenser Leak Detection, and Carryover Monitoring – A Synopsis of Experiences,” Power Plant
Chemistry 10(2), pp. 102-114. 4. Hach Co. (2013). Monitoring Iron Transport in Power Generation,
Technical Document: LIT2011, Hach Co., Loveland, Colorado. 5. IAPWS (2013). Technical Guidance Document: “Corrosion Product
Sampling and Analysis for Fossil and Combined Cycle Plants,”
International Association for the Properties of Water and Steam, available from http://www.iapws.org. 6. Kuruc, K.; Johnson, L. (2015). “Further Advances in Monitoring Low–
Level Iron in the Steam Cycle, ” Power Plant Chemistry 17(2), pp. 86–89. 7. Johnson, L. (2015). “Monitoring Iron Transport in the Steam Cycle via
Grab Sample and Online Methods,” Power Plant Chemistry 17(4), pp. 218–222 8. Hach Co. (2018). Iron, Total, FerroZine Rapid Liquid Method 10287,
Technical Document: DOC316.53.01520, Hach Co., Loveland, Colorado.
Ken Kuruc holds a B.S. in chemistry from John Carroll University in Cleveland, Ohio, and has been active in the power industry for more than 25 years. In his current role, Mr. Kuruc provides technical support on all aspects of water-quality monitoring for fossil power generation sites across the United States. He has authored and co-authored articles appearing in several industrial publications, presented at numerous utility and water chemistry conferences, and given webinars on monitoring of industrial waters that have reached more than 60 countries.
This paper was presented at the 2019 Electric Utility Chemistry Workshop, which was conducted June 4-6, 2019, in Champaign, Illinois.