Reality check: Unpacking
Park Cool Island effects using remote-sensed, measured and modelled microclimatic data
©Australian Urban Design Research Centre


Bill Grace, Julian Bolleter, Maassoumeh Barghchi and James Lund
ACKNOWLEDGMENTS
This research was supported by the Water Corporation of Western Australia.
Figures
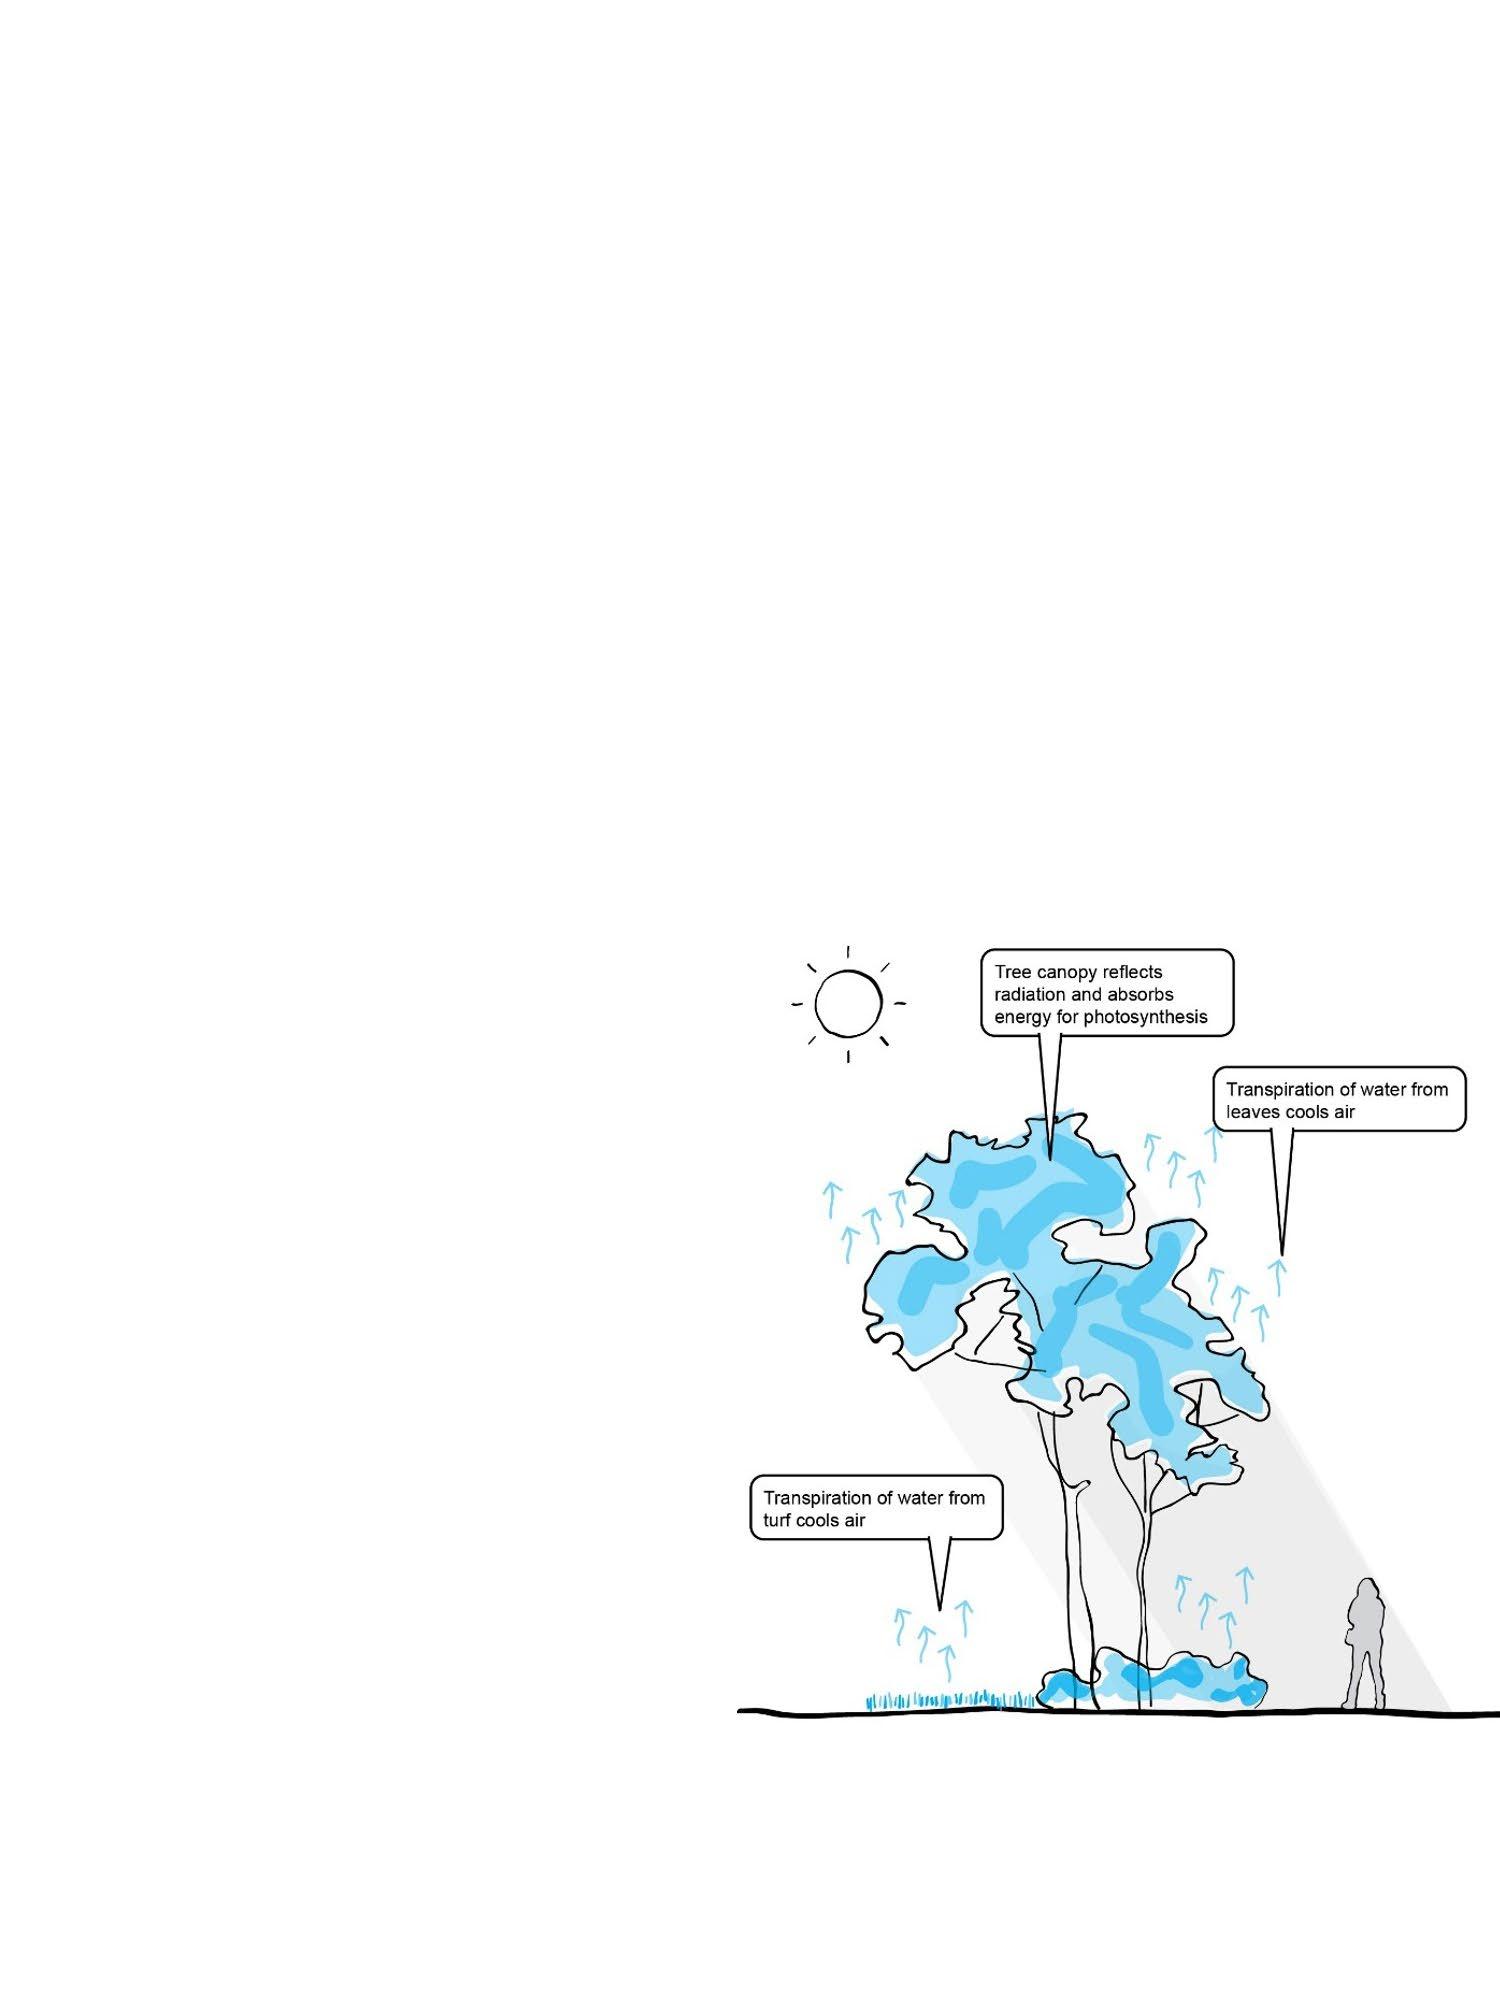
Figure 1. Vegetation in parks provides cooling through shade and evapotranspiration. 2
Figure 2. Measurements of near-surface air temperature during a heat wave in Birmingham indicated that the city centre was hotter than an urban park from around 4 pm, peaking at 5°C around 10 pm. Air temperature differentials were less than 1°C during most of the daytime. ........ 3
Figure 3. Measurements of surface and air temperatures in Phoenix, Arizona, show peak surface temperatures in the desert and over asphalt pavement of around 60°C in the middle of the day, compared to 45°C on a suburban irrigated grass surface (ΔTs ≈15°C). However, at the same time of day, the near-surface air temperatures of all three surfaces were similar (38-40°C). ................... 4
Figure 4. Case study park locations 6
Figure 5. Garry Meinck Park (pictured in the centre of the image) ..................................................... 7
Figure 6. MacNaughton Park (in the centre of the image) 8
Figure 7. Hyde Park ..................................................................................................................................... 9
Figure 8. The PET index accounts for the combined effect on human physiology arising from air temperature, mean radiant temperature, wind speed, and vapour pressure (i.e. a measure of humidity) 11
Figure 9. Garry Meinck Park measured surface temperature, air temperature and relative humidity. Note that the yellow boxes denote the park area. ............................................................ 13
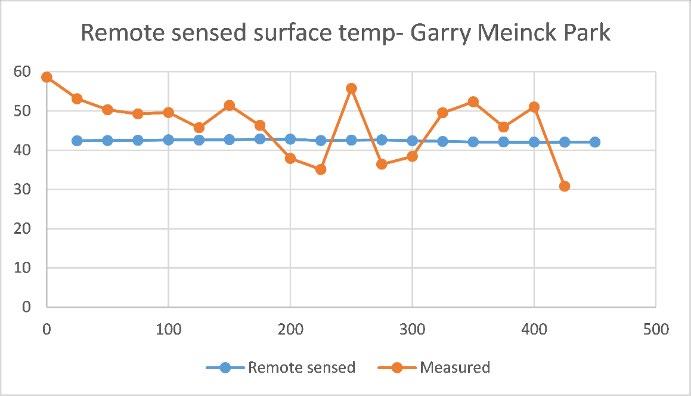
Figure 10. Garry Meinck Park remote-sensed surface temperature data. 13
Figure 11. The Macnaughton Park case study measured surface temperature, air temperature and relative humidity. bushland results in significantly less relative humidity. 15
Figure 12. Surface temperature data for the Macnaughton Park case study. ................................ 15
Figure 13. The Hyde Park case study measured surface temperature, air temperature, and relative humidity........................................................................................................................................ 17
Figure 14. Surface temperature data for the Hyde Park case study. 17
Figure 15. Hyde Park measured, remotely sensed and ENVI-met modelled surface temperature data. 18
Figure 16. Hyde Park a)-c) ENVI-met maps of air temperature, d)-f) comparisons with measured data (Note: the temperature scale varies in the ENVI-met maps.) 18
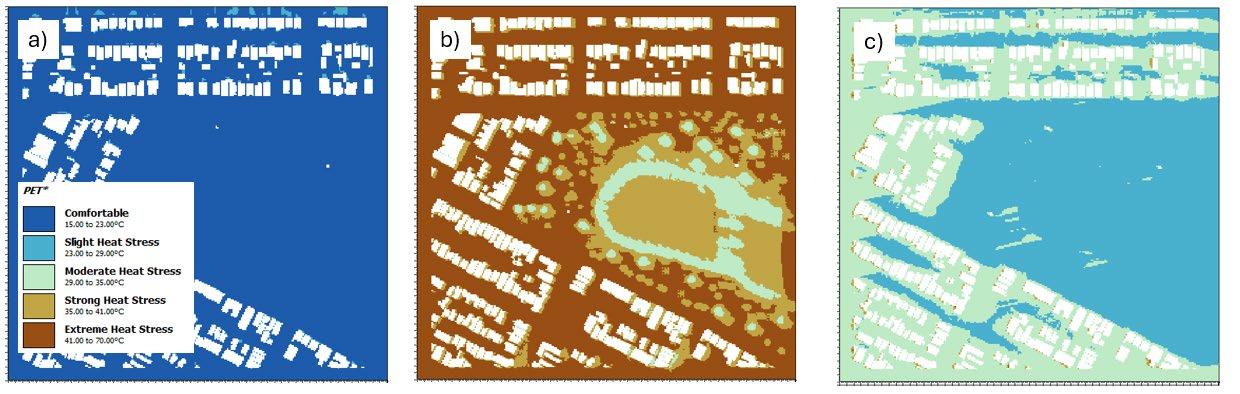
Figure 17. Hyde Park ENVI-met PET results in a) Morning, b) Afternoon and c) Evening ................. 19
Tables
Table 1. Microclimate data sources utilised 9
Table 2 Ta (°C) measured and ENVI-met for the Hyde Park case study (averaged for the hours in which data were collected) 20
Abstract
There is increasing interest in the role of parks as potential cool refuges in the age of cli-mate change. Such potential refuges result from the Park Cool Island (PCI) effect, reflecting the temperature differential between the park and surrounding urban areas. However, this study of different park typologies in Perth, Australia, reveals that while the PCI is a real phenomenon, the magnitude in terms of air temperature is minor, and it is of little relevance to the conditions felt by humans in average summer daytime conditions, which are dominated by solar radiation. Many studies have assessed the PCI effect, an indicator that has shown a wide range across different studies and measurement techniques. However, this novel paper utilises satellite remote-sensed surface temperatures, on-ground measurements of surface temperatures, air temperatures, and humidity, as well as modelling using the microclimatic simulation software ENVI-met. A reliance on surface temperature, which has a marginal correlation with human experience of thermal comfort, has led some researchers to overstate the PCI’s intensity and its spread into adjoining urban areas. In response, this paper cautions designers and planners from emphasising the role of parks, in isolation, as providing meaningful urban cooling. Rather, adaptation to increasing temperatures requires the creation of a continuous canopy, ideally on private lots, streetscapes and parks in an interconnected network.
1. Introduction
Many parts of Australia already have extensive exposure to extreme summer conditions. Perth (the capital city of West-ern Australia and the focus of this paper) has summer days that often exceed 40°C, which is projected to worsen with climate change. Recent updates on global warming (Climate Action Tracker, 2024) project that with current real-world policies and actions (as opposed to national pledges and targets), global temperature increases of 2.2-3.4°C above pre-industrial levels are likely by the end of the century and will continue to rise thereafter. These conditions will have dire implications for Australian cities, particularly for residents of suburban areas with minimal tree canopy cover, whether middle-ring suburbs experiencing urban infill (Bolleter, 2016) or compact new sub-urbs on the fringe (Bolleter, 2017).
1.1. Urban Heat Islands and Park Cool Islands
The Urban Heat Island (UHI) is a well-recognised phenomenon in cities. It arises from retaining solar radiation-induced heat in ‘hard’ urban surfaces with high solar absorptivity and heat capacity, such as roads, pavements and building surfaces (Mills & Stewart, 2021). The UHI effect can lead to surface temperatures 10°C higher than those of their peri-urban surroundings (Sharifi et al., 2016), and it is more pronounced at night than during the day (Nardino & Laruccia, 2019).
In contrast, vegetated surfaces in parks and gardens absorb and re-radiate less heat, resulting in lower surface temperatures. This phenomenon has come to be known as the Park Cool Island (PCI) effect (Lenzholzer, 2015, p. 72). Urban de-signers are increasingly interested in understanding the effects of UHI and PCI on improving summer thermal comfort conditions in urban settings, particularly the role of parks as refuges (Figure 1). Moreover, parks are also described as mitigating
UHI effects in high-level policy documents, such as Australia’s recent National Urban Policy, which de-scribes how ‘Green spaces play a key role in mitigating the urban heat island effect by providing shaded pathways, cooler environments and more comfortable conditions’ (Australian Government, 2024).

Figure 1 Vegetation in parks provides cooling through shade and evapotranspiration.
Many studies have assessed the PCI effect, which reflects the temperature differential between the park and surrounding urban areas, which are typically hotter in the middle of the day, an indicator that has shown a wide range across different studies and measurement techniques (García-Haro et al., 2023).
The literature includes studies based on the measurement of surface temperatures by remotely sensed surface temperature data (Cheng et al., 2015) or thermographic cameras (SpronkenSmith & Oke, 1998). Other studies involve the measurement of air temperature (Motazedian et al., 2020; Vanos et al., 2012). These measures reflect the urban energy balance but have different implications for human thermal comfort. The literature is also replete with studies implying that the PCI gives rise to the mitigation of UHI through the cooling of surrounding urban areas (Lenzholzer, 2015; Yu et al., 2017), which can even reduce energy for cooling in buildings (Kim et al., 2019; Kong et al., 2016).
An explanation of the urban energy balance is necessary to resolve the importance of these observations in the study of urban microclimatic conditions.
1.2. The urban microclimate
The UHI effect represents the difference in temperature between urban areas and their surrounding non-urbanised areas (Mills & Stewart, 2021). At the metropolitan scale, the difference
is between the ‘city’ and the adjacent ‘countryside.’ At the urban precinct scale, the differential of interest lies between urban streetscapes and vegetated areas, whether these are landscaped parks or conservation areas. When referring to UHI, it is important to define what is meant by both ‘temperature’ and the location of the temperature measurement. Regarding UHI studies, air temperature near ground level is the most relevant, noting that air temperature varies with elevation. This measure of UHI is known as the Canyon Urban Heat Island (CUHI). When the measurement is surface temperature, this is known as the Surface Urban Heat Island (SUHI) (Mills & Stewart, 2021). In urban areas, the near-surface air temperature is usually very different from that of the surface.
In essence, the UHI arises when the heat energy stored through absorbed solar radiation during the day within urban elements with (relatively) high thermal mass (such as roads and buildings) is released to heat the near-surface air during the late afternoons and evenings. The magnitude of the UHI effect depends on the amount and rate of energy stored and released, which are functions of solar exposure, albedo, heat capacity, thermal conductivity, and emissivity of the various surfaces. Measurements of near-surface air temperature during a heat wave in Birmingham, in the United Kingdom, reported by Stewart and Mills (2021), indicated that the city centre was hotter than an urban park from around 4 pm, peaking at 5°C around 10 pm. Air temperature differentials (ΔTa) were less than 1°C during most of the daytime (Figure 2).

Figure 2 Measurements of near-surface air temperature during a heat wave in Birmingham indicated that the city centre was hotter than an urban park from around 4 pm, peaking at 5°C around 10 pm. Air temperature differentials were less than 1°C during most of the daytime.
This behaviour is because it takes time for ground surfaces exposed to solar radiation to heat, only emitting long-wave radiation later in the day to heat the near-surface air. The higher heat capacity surfaces that have absorbed the heat continue to re-radiate heat well after (direct and diffuse) short-wave solar radiation has declined in intensity, but the effect diminishes as heat is lost from both the ground and the near-surface air overnight at similar rates (Spronken-Smith & Oke,
3
The University of Western Australia uwa.edu.au
Reality check: Unpacking Park Cool Island effects using re-mote-sensed, measured and modelled microclimatic data
1998). The CUHI effect, therefore, has little impact on peak daytime near-surface air temperatures in summer conditions (which typically occur in the mid-afternoon) and is largest in the evenings. Importantly, the CUHI also affects air-conditioning loads in buildings (as average daily air temperatures are higher in affected locations) (Kim et al., 2019).
Many UHI articles are based on surface temperature, which measures the surface urban heat island (SUHI) effect (Feyisa et al., 2014; Liao et al., 2023; Lin et al., 2015; Yu et al., 2017). As noted above, SUHI generally reflects CUHI effects but not quantitatively. When exposed to radiation, built-form elements that absorb more energy than vegetated surfaces develop much higher surface temperatures. Measurements of surface and air temperatures in Phoenix, Arizona (also reported by Mills and Stewart (2021)) show peak surface temperatures in the desert and over asphalt pavement of around 60°C in the middle of the day, compared to 45°C on a suburban irrigated grass surface (ΔTs ≈15°C). However, at the same time of day, the near-surface air temperatures of all three surfaces were similar (38-40°C) (Figure 3).
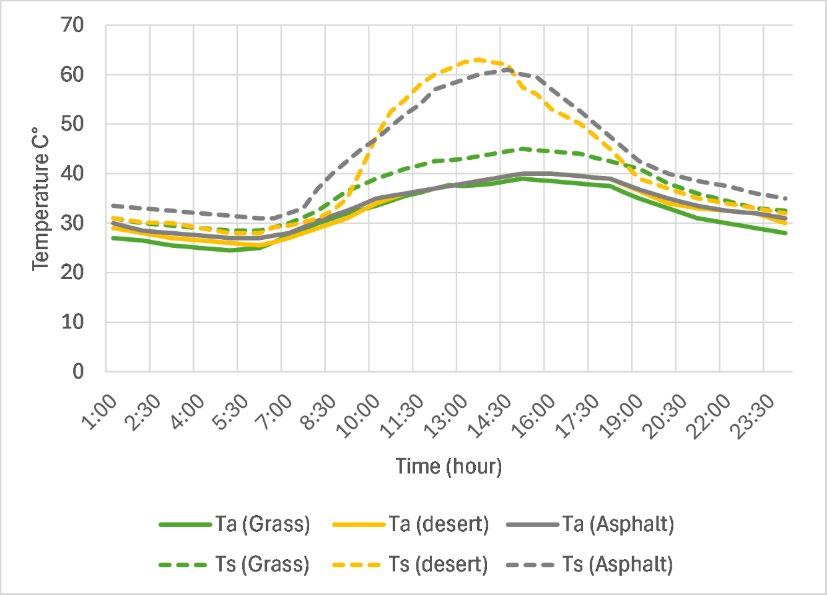
Figure 3 Measurements of surface and air temperatures in Phoenix, Arizona, show peak surface temperatures in the desert and over asphalt pavement of around 60°C in the middle of the day, compared to 45°C on a suburban irrigated grass surface (ΔTs ≈15°C). However, at the same time of day, the near-surface air temperatures of all three surfaces were similar (38-40°C).
Other studies involving the measurement of air temperature differences in urban areas also illustrate that ΔTa is much less than ΔTs. Eliasson (1996) found that overnight air temperature differentials (ΔTa) were seldom more than 2°C. Spronken-Smith and Oke reported average August time ΔTa values in Vancouver parks of 1.9°C (night) and 2.2°C (day) and in Sacramento parks of 2.4-3.3°C (night) and 1.2-2.4°C (day). In an extensive study in Tokyo, Sugawara (2021) re-ported measured ΔTa values of 0.5-1.8°C (composite of 72 fair-weather days in August). Many studies on the PCI utilise remotely sensed surface temperature data (Feyisa et al., 2014; Liao et al., 2023; Lin et al., 2015; Yu et al., 2017). Many of these sources use the surface temperature data to assess the apparent cooling effect of parks on adjacent urban areas, often referred to as the ‘park cooling distance’ (PCD) (Cai et al., 2023). The data analysis methodologies of these
studies vary, but they all rely on Landsat Thermal Infrared Sensor (TIRS) data. The spatial resolution of the raw data from Landsat 8 is 100m, and the data is ‘resampled’ to 30m - a process known as ‘Cubic convolution’ which averages the 16 closest 100m data points to the nominal 30m grid (Martí-Cardona et al., 2019). This process is generally acceptable for delineating large-scale temperature differences in the landscape.
However, as is clear from ground-based surface temperature data, there is a sharp delineation in Ts between park sur-faces such as grass and adjacent roads under exposure to short-wave solar radiation. If surface temperature data were accurate to 5m, that would be evident in the images. However, the resampling ‘averages out’ the differential between the actual surface temperature in the park and the actual surface temperature in the surroundings and will vary according to where the original image is taken relative to the park boundary. Accordingly, surface temperature sources are not a reliable guide to assessing small parks’ PCI or the ‘park cooling distance’ in general.
However, measurements of air temperatures (Spronken-Smith & Oke, 1998; Sugawara et al., 2021; Vanos et al., 2012) support the notion that the lower temperatures in parks influence temperatures in adjacent urban areas. Vanos et al. found that cooler air ‘extends outside the park in the direction of prevailing winds’ (Brown et al., 2015). This process is known as advection (which is analogous to convection). Sugawara et al. (2016) similarly found that ‘turbulent mixing transfers colder air from the park to urban areas in its vicinity’ with a greater distance in the downwind direction; how-ever, cooling also occurred in calm conditions. Sugawara refers to this phenomenon as a ‘gravity current driven by the pressure gradient between the colder park and the warmer town’ (Sugawara et al., 2021). Oke (1989) hypothesised a similar mechanism, with cooler, denser air from the park flowing outwards in a circulation pattern that brings ascending warmer air to converge at higher elevations above the park. This mechanism is analogous to the mechanism by which daytime sea breezes occur at much larger scales in coastal regions (including Perth). The process would be disrupted at the park / urban scale by any significant ground-level wind speeds.
1.3. Research questions
In order to identify the relevance of this previous work for evolving climate conditions in Perth, Australia, and their im-plications for urban and landscape design, in this article, we seek to resolve the following questions:
1. What are the factors that control the urban microclimate of Perth within the existing urban form?
2. What are the variables that are relevant to urban design and human thermal comfort?
3. What is the role of parks as Park Cool Islands in hot summer conditions?
2. Materials and methods
This study examined the likely PCI effects in park case studies (n = 3) in Perth, Western Australia. Perth has a hot-summer Mediterranean climate (Köppen climate classification Csa) and receives moderate, highly seasonal rainfall, predominantly during winter. Summers are generally hot and
dry, lasting from December to March, and can cause extreme heat events that pose risks to exposed populations’ health. Research has indicated that Perth has experienced more frequent, longer, and hotter heatwaves in the twenty-first century (Duncan et al., 2019).
The case study parks across Perth (Figure 4) represent different prevailing theories for POS provision and neighbour-hood design in the surrounding area. In brief, eligible park case studies were situated in predominantly residential areas. The case studies are discussed in relation to their respective landscape and urban design theories below.

2.1. The case study parks
2.1.1. Garry Meinck Park, Butler
The suburb of Butler in Perth’s north reflects the current ‘Liveable Neighbourhoods’ design code governing greenfield development in Western Australia (West Australian Planning Commission & Department of Planning, 2009) Following New Urbanist thinking, this policy calls for a compact suburban layout comprising small lots (averaging 300m2) with high site coverage by houses at a density of about 30 dwellings per hectare (R30) interspersed with smaller yet accessible neighbourhood parks (West Australian Planning Commission & Department of Planning, 2009). Due to high site coverage by buildings, small lots and juvenile tree specimens, these case studies have minimal urban canopy cover on private land. Comparatively narrow road sections and the
constraints presented by service infrastructure have also resulted in minimal tree canopy cover in streets.
Within Butler, Garry Meinck Park (Figure 5) is designated as a ‘Neighbourhood Park’ within the Western Australian classification framework for public open space (Department of Sport and Recreation, 2012). The landscaping of these neighbourhood parks consists of areas of irrigated and non-irrigated lawns, mulch and paving with some fringing trees. Typical tree types in Garry Meinck Park included native species such as Eucalyptus Gomphocephala, Agonis Flexuosa, Corymbia Calophylla, and Melaleuca Quinquenervia.

2.1.2. Macnaughton Park, Kinross
The 1990s suburb case study in Kinross reflects planning for semi-compact suburbs, comprising housing at a density of R25, with an average lot size of 350 m² and high site building coverage, resulting in minimal tree canopy cover on private lots. Due to comparatively narrow road sections and the constraints presented by service infrastructure, the streets in the case study also have minimal tree cover. The case study park has, in part, resulted from government policy aimed at protecting bushland in the Perth region (Davis & Harford-Mills, 2016) Macnaughton Park (Figure 6) is a designated ‘Neighbourhood Park’ within the Western Australian classification framework for public open space (Department of Sport and Recreation, 2012) The park also contains an irrigated oval and clubrooms. Typical trees are native, including Agonis Flexuosa, Xanthorrhoea Preissii, Jacaranda Mimosifolia, Allocasuarina spp and Eucalyptus

2.1.3.
Hyde Park, Highgate
The inner mixed zone case study comprises late nineteenth-century inner-city suburbs that fringe the Perth Central Business District. Various housing types include late nineteenth and early twentieth-century workers’ cottages, grand Federation houses and significant apartment developments from the 1960s and 1970s. Tree canopy cover on private lots is generally low due to high building cover, but it is reasonable within the streets. This urban form surrounds Hyde Park, a product of the public parks movement, which saw municipal parks (such as Olmsted’s and Vaux’s design of New York’s Central Park) being established in the mid-nineteenth century in major cities as a way of improving living conditions in overcrowded and quickly growing industrial cities (Summers, 2007). Hyde Park reflects such elaborately land-scaped parks of the late nineteenth century and comprises walking paths shaded by avenues of trees encircling a central lake (and once a wetland) (Figure 7). Trees are typically exotic and include Platanus Acerifolia, Ficus Macrophylla, Washingtonia Filifera and Jacaranda Mimosifolia. Hyde Park is a designated ‘Regional Park’ within the Western Australian classification framework for public open space (Department of Sport and Recreation, 2012).

2.2. Microclimatic case study data
Microclimate data for the case study sites were collected and analysed from three contrasting sources: remote-sensed surface temperature data (Devereux & Caccetta, 2019), on-site measurements, and ENVI-met microclimatic modelling (ENVI-met, 2021) (Table 1).
Table 1. Microclimate data sources utilised
Microclimate data source Garry Meinck Park, Butler Macnaughton Park, Kinross Hyde Park, Highgate
Measured surface temperature
Measured air temperature
Measured relative humidity
ENVI-met surface temperatures
ENVI-met air temperatures
ENVI-met Physiologically Equivalent Temperatures (PET)
2.2.1.
Remote-sensed surface temperature data
Surface temperature maps were generated for all Australian cities using Landsat 8 thermal infrared sensor (TIRS) band 10 data over the summer of 2018-19 (Devereux & Caccetta, 2019). Surface temperatures were collected for Perth on 14.12.18 and 21.1.19; both dates were cloudfree and had maximum temperatures of 39.1°C and 29.8°C, respectively (Bureau of Meteorology, 2019).
2.2.2. Measurements of surface temperature, air temperature, and relative humidity
Surface temperature, air temperature, and relative humidity were monitored inside and adjacent to each park. Measurements were taken every 25 metres, forming a transect that extended approximately 200m on either side of the park. Each set of measurements was taken on approximately average summer days, with an overnight minimum below 20°C, a maximum around 30°C, and clear, sunny conditions. Three sets of measurements were taken: at 7:00-8:00 am, 2:00-3:00 pm, and 7:00-8:00 pm (hereby referred to as morning, afternoon, and evening measurements).
Instruments were mounted on a trolley, which was used to ensure that measurements could be completed quickly, minimising the effects of changing conditions as the day progressed. Temperature and relative humidity were measured with a Sauermann Si-HH3 thermo-hygrometer, while surface temperatures were measured with a thermal camera [Topdon TC-003 thermal camera]. The thermo-hygrometer was shielded from solar radiation to ensure direct sunlight on the probe did not impact air temperature readings.
Temperature and humidity values from Bureau of Meteorology (BOM) measurement sites were used to adjust for changes in the macro weather as each collection event progressed.
2.2.3. ENVI-met microclimate modelling of surface temperature, air temperature, and Physiological Equivalent Temperature
Microclimate modelling was conducted for Hyde Park using the ENVI-met software version 5.0 (ENVI-met, 2021). ENVI-met is a three-dimensional software model for simulating urban environments that incorporates computational fluid mechanics, thermodynamics, and atmospheric physics.
The weather conditions set as inputs to the ENVI-met models were ‘epw’ files produced by the Commonwealth Scientific and Industrial Research Organisation (CSIRO). CSIRO typical meteorological year (TMY) files are based on historical weather data drawn from the years 1990 to 2015. The simulation runs for 14 hours on an ‘average’ summer day, selected to match the combination of hourly average dry bulb temperature and relative humidity best.
Surface and air temperature maps were generated using the ENVI-met Leonardo program to compare the microclimatic condition within parks and their surrounding environment. The human thermal comfort index was calculated using the ENVI-met BioMet program, a post-processing tool that calculates human thermal comfort indices from ENVI-met output files. Physiological Equivalent Temperature (PET) (Höppe, 1999) reflects ‘..the air temperature at which, in a typical indoor setting (without wind and solar radiation), the heat budget of the human body is balanced
with the same core and skin temperature as under the complex outdoor conditions to be assessed.’ The PET index accounts for the combined effect on human physiology arising from air temperature, mean radiant temperature, wind speed, and vapour pressure (i.e. a measure of humidity), depending on clothing and metabolic rate (Figure 8) (Höppe, 1999). ENVI-met produces calculated values of PET from a refined set of equations derived from Walther and Goestchel (2018).

Figure 8 The PET index accounts for the combined effect on human physiology arising from air temperature, mean radiant temperature, wind speed, and vapour pressure (i.e. a measure of humidity)
3. Results
Microclimate data for the case study sites is set out below, including on-site measurement of surface temperature, air temperature, relative humidity (%), remotely sensed surface temperature data (Devereux & Caccetta, 2019), and EN-VI-met microclimatic modelling for the final Hyde Park case study (ENVI-met, 2021)
3.1. Garry Meinck Park, Butler
The figure below shows the measured surface temperature, air temperature and relative humidity for the Garry Meinck Park case study (Figure 9). The surface temperatures of the irrigated turf within the park are substantially cooler in the middle of the day, and to a lesser extent in the morning and evening. Air temperatures are generally consistent between the park and the urban catchment. Relative humidity levels are consistent between the park and the urban context in the morning and evening, with a marked increase in humidity in the park (and to the south of the park) in the middle of the day due to the arrival of a sea breeze during the measurement process.
of


Figure 9. Garry Meinck Park measured surface temperature, air temperature and relative humidity. Note that the yellow boxes denote the park area.
The figure below shows the remotely sensed surface temperatures (Devereux & Caccetta, 2019) for the Garry Meinck Park case study (Figure 10). The surface temperature is approximately the average of the daytime measured temperatures in Figure 9. A negligible surface temperature difference is recorded between the park and the urban catchment.

3.2. Macnaughton Park, Kinross
The figure below shows the measured surface temperature, air temperature and relative humidity for the MacNaughton Park case study (Figure 11). The irrigated turf (left-hand yellow box on graph) provides substantial cooling of surface temperatures in the middle of the day; however, this cooling effect is substantially lower in the morning and evening. Notably, the area of non-irrigated bushland (right-hand yellow box on the graph) is hotter in the morning and midday than the surrounding urban context. The irrigated oval area of the park provides some cooling of air temperatures in the middle of the day and none in the evening. Notably, the air temperatures in the irrigated section of the park are slightly warmer in the early morning relative to the urban context. The non-irrigated bushland area of the park experiences warmer air temperatures in the afternoon compared to the surrounding urban context. The irrigated oval in the park results in a substantial increase in relative humidity during the middle of the day; however, the non-irrigated area is similar to the adjacent streets.
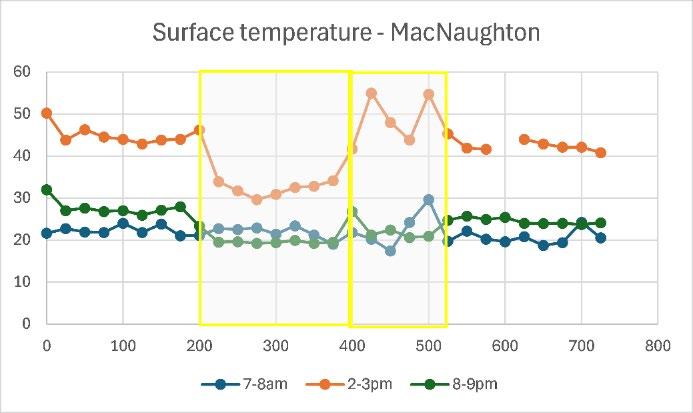


Figure 11 The Macnaughton Park case study measured surface temperature, air temperature and relative humidity. bushland results in significantly less relative humidity.
Figure 12 shows the remotely sensed surface temperature data for the Macnaughton Park case study. Again, the surface temperature is approximately the average of the daytime measured temperatures in Figure 11. A minor reduction in surface temperature is recorded on the irrigated oval but only on a portion of the adjacent bushland to the west.

3.3. Hyde Park, Highgate

The figure below shows the measured surface temperature, air temperature and relative humidity for the Hyde Park case study (Figure 13). In terms of surface temperatures, the park provides substantial cooling during the middle of the day; however, it has little effect on cooling in the morning or evening. In relation to air temperatures, the park provides the greatest cooling in the afternoon and to a lesser extent in the early morning. In the evening, the park provides no cooling in relation to air temperatures. Levels of relative humidity are elevated in the park, particularly during the midday hours, due to the lake. Evaporative cooling from the lake is also likely to contribute to the lower air temperatures.
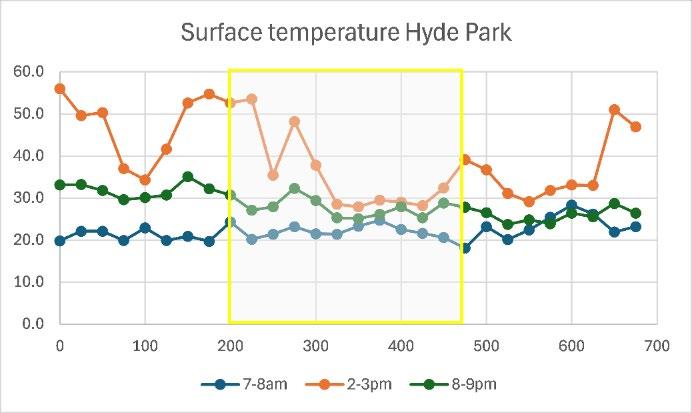

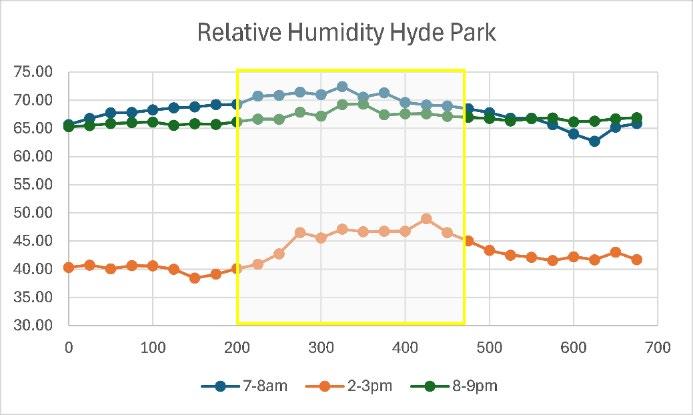
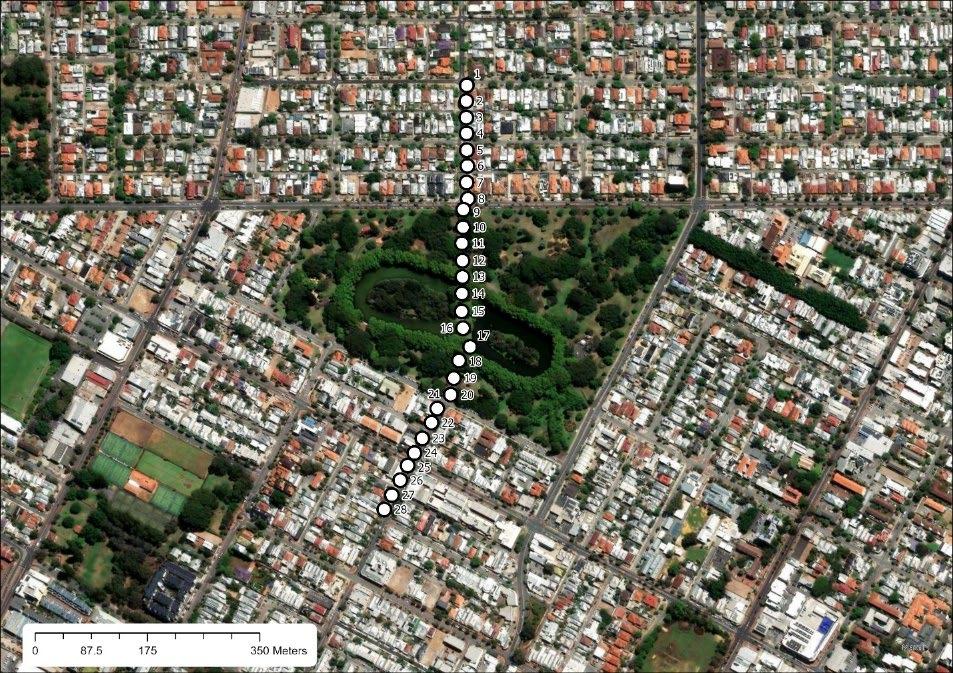
Figure 13 The Hyde Park case study measured surface temperature, air temperature, and relative humidity. Remote-sensed surface temperatures for the Hyde Park case study reveal lower temperatures in the park (Figure 14), but a considerably smaller temperature difference between the park and urban catchment compared to those measured during the middle of the day (Figure 13). Again, the remotely sensed data generally reflects the average of the measured data.


The following figures compare microclimatic data from on-site measurement, remote sensing (Devereux & Caccetta, 2019), and ENVI-met modelling (ENVI-met, 2021).
Figure 15 compares the remotely sensed surface temperature data, the measured surface temperatures and the ENVI-met modelled data for an average summer day in the Hyde Park case study. The results are similar within the park. However, ΔTs (between the unshaded areas of the park and street) is less than that in the measured surface temperature data. The measured surface temperatures show greater variability but generally correlate with those modelled in ENVI-met.

Figure 15 Hyde Park measured, remotely sensed and ENVI-met modelled surface temperature data
Figure 16 presents the Hyde Park ENVI-met map of air temperature, incorporating measured data throughout the day. The figure shows that ENVI-met projects cool air to the north of the park along a wind path through advection (the wind at 07:00 is a light breeze from the south at 2.5 m/s), noting also that warm air enters the park from the south. However, the air is only fractionally cooler (less than 1°C), and the effect diminishes during the day. By evening, there is no detectable effect. These results confirm that while the PCI is a real phenomenon, the magnitude in terms of air temperatures is minor.
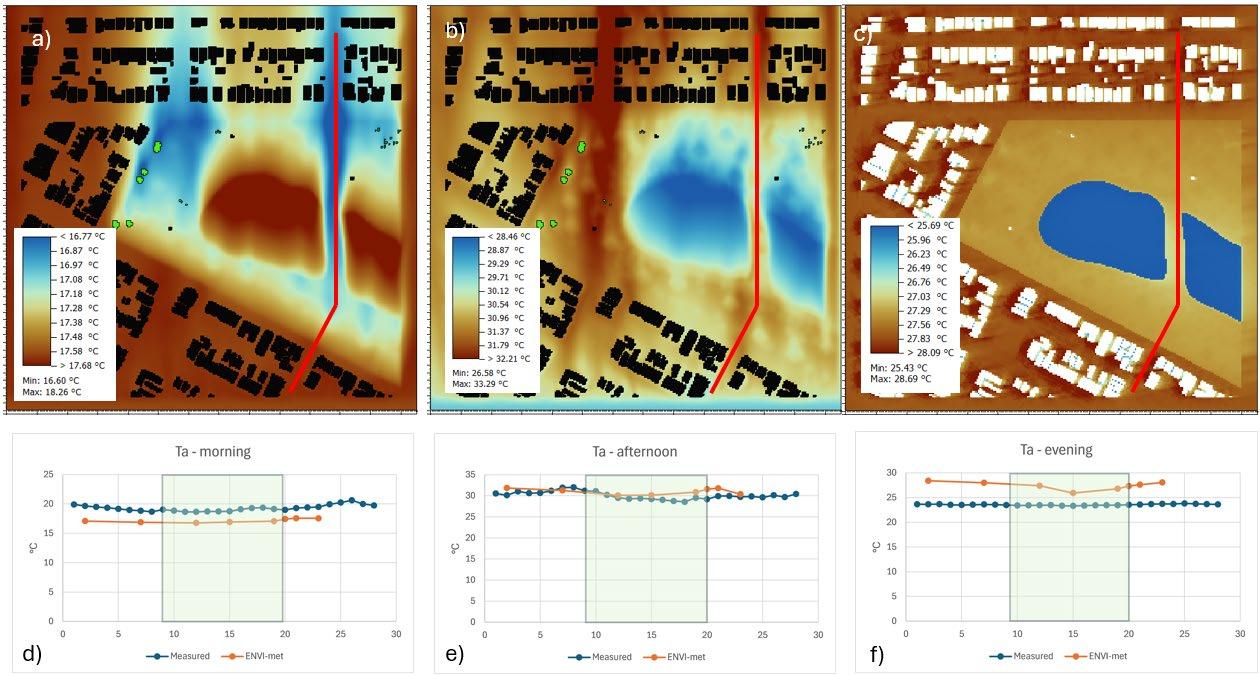
Figure 16. Hyde Park a)-c) ENVI-met maps of air temperature, d)-f) comparisons with measured data (Note: the temperature scale varies in the ENVI-met maps.)
Figure 17 sets out the ENVI-met PET outputs for Hyde Park. PET levels are generally consistent between the park and the urban context, except under tree canopies.
4. Discussion
4.1.
Park Cool Island Effects
The data presented above indicate that while the case study park surfaces (particularly grass) have cooler surface temperatures in the middle of the day than surrounding areas (positive ΔTs of 10-15°C) when direct solar radiation is most impactful, the effect diminishes by evening, and by morning, it is not evident. ΔTs values in the evening are similar to those reported by Spronken-Smith for a park in Vancouver (1998).
Regarding air temperatures, the afternoon ΔTa is significantly smaller than ΔTs, even in the afternoon (approximately 2°C), and is largely absent in the evenings and mornings. At MacNaughton Park, morning Ta is slightly higher than the park surrounds, as is afternoon Ta on the sandy soil surface of the park.
Spronken-Smith (1998) reported ΔTa of around 2°C in both daytime and nighttime for 10 parks in Vancouver, and 1.2-2.4°C (daytime) and 2.4-3.3°C (nighttime) for 10 parks in Sacramento, both sets of data from August. Sugawara (2021) reported ΔTa values ranging from 0.5-1.8 °C (nighttime) and 1-1.6°C (middle of the day) over 72 days in summer conditions in Tokyo. Those results are very similar to those reported here for daytime ΔTa but vary for other times.
The Hyde Park ENVI-met data show that the afternoon Ta in most of the park is similar to that of the adjacent streetscape, and in some exposed areas, it is even higher. Afternoon Ta is around 23°C lower to the north of the lake, where the water leads to some evaporative cooling. Also, that morning, Ta was relatively warmer in this location due to the retained heat in the lake.
Other studies have identified that the cool air in parks produces lower air temperatures in adjacent streetscapes. Spronken-Smith (1998) reported a PCD of approximately 75m in the Vancouver study, and Sugawara (2021) reported PCDs ranging from 31 to 120m in the Tokyo study. That effect is not evident in the datasets reported here for any case study park at any time of day, irrespective of their size. Indeed, Figure 16 shows that ENVI-met projects cool air to the north of the park along a wind path through advection (the wind at 07:00 is a light breeze from the south at 2.5 m/s), noting also that warm air enters the park from the south. However, the air is only fractionally cooler (less than 1°C) and the effect diminishes during the day. By evening there is no detectable effect.
These results confirm that while the PCI is a real phenomenon, the magnitude in terms of air temperatures is minor.
4.2. Correlations between remotely sensed, measured and modelled climate data
4.2.1. Remote-sensed and measured surface temperatures
Comparisons of remotely sensed surface temperatures (which reflect afternoon conditions) with measured data (Figure 13, Figure 14) illustrate that remotely sensed surface temperatures tend to slightly underestimate streetscape surface temperatures (Ts) and slightly overestimate Ts within parks. Remote-sensed surface temperatures also do not accurately delineate park boundaries for the smaller parks. Cooler surface temperatures evident through measurement in Garry Meinck Park, which is only around 75m in width, are not reflected in the remotely sensed surface temperature data (Figure 10).
These observations are consistent with the fact that the raw data from which the remotely sensed surface temperature maps are produced have a resolution of 100m and hence cannot identify small-scale surface temperature differentials. For example, remotely sensed surface temperatures underestimate generic urban form Ts values due to the averaging of streetscape hard surfaces and vegetated spaces in verges and yards.
Therefore, the use of remotely sensed surface temperature is of limited value in urban studies due to the limitations of the raw TIRS data’s resolution (e.g., Cheng et al., 2015). The resampling process used to produce 30m resolution images inevitably averages actual Ts values, resulting in underestimates in general urban form and overestimates in (all but large) parks.
4.2.2. ENVI-met surface and air temperatures
The Hyde Park ENVI-met model input is based on an ‘epw’ file representing average summer conditions, so macro-scale air temperatures are not identical to those measured during data collection, although they are very similar during the day (see Table 2).
Table 2 Ta (°C) measured and ENVI-met for the Hyde Park case study (averaged for the hours in which data were collected)
Ta is similar in the mornings and afternoons, but slightly higher in the evenings, as indicated in the ENVI-met input file.
The Hyde Park ENVI-met model shows reasonable agreement between modelled and measured data. Outside the park perimeter, the modelled Ts values (Figure 16) are somewhat lower than
the measured data in the mornings and evenings (when direct solar radiation is less influential). There is slightly more variance within the park, but this can be attributed to the model surface being grass rather than the actual surface, which is asphalt paving. The ENVI-met and measured Ts results within the park are similar in the afternoon, illustrating the overriding impact of surfaces shaded from direct solar radiation.
The air temperatures (Ta) (Figure 16) are similar between the datasets. The ENVI-met results are slightly lower in the morning, almost identical in the afternoon and slightly higher in the evening. This situation primarily reflects the macro-scale differences outlined in Table 2
4.2.3. Thermal comfort modelling
As described, the Physiological Equivalent Temperature (PET) index accounts for the combined effect on human physiology arising from air temperature, mean radiant temperature, wind speed, and vapour pressure (i.e. a measure of humidity) (Höppe, 1999). Mean radiant temperature (MRT) is a summation of radiative effects from both direct and diffuse (short-wave) and indirect (longwave) radiation. Direct solar radiation is by far the largest contribution to MRT in summer daytime conditions, and hence, PET is dominated by this exposure. This situation is starkly evident from the after-noon PET results in Figure 17, which show strong to extreme heat stress in the park, except in the shade of the trees. Except in those locations, the PET is no different from the surrounding urban areas. Exposure to direct solar radiation completely overwhelms any minor reduction in air temperature in the park. The thermal comfort benefits offered by the park are evident in the evenings, where the PET is lower than in the surrounding area due to lower Ta in the absence of solar exposure.
This analysis raises questions about the relevance of Ta and Ts in relation to the urban microclimate and their impact on outdoor human thermal comfort. As illustrated here and in other studies, the temperature of urban surfaces (Ts) is not a good indicator of near-surface air temperature (Ta), and neither is a good indicator of human thermal comfort, which reflects exposure to direct and indirect radiation, humidity and wind; and at the hottest time of day in summer is dominated by direct exposure to solar radiation. These results confirm that while the PCI is a real phenomenon, the magnitude is minor (ΔTa ≈ 2°C) and is of little relevance to the conditions humans feel in average summer daytime conditions. By far, the major benefit offered by parks is the shade provided by trees, as is evident from the PET maps of Hyde Park (Figure 17).
Similarly, PCD is of little relevance to the planning and design of urban areas. Although it was not evident in the results reported here, even when identified in other studies, the extent of influence on Ta was minor and limited to approximately 120m, and its effect is overwhelmed by direct solar radiation in any case.
5. Conclusion
The major factor that gives rise to the microclimatic conditions in urban areas is the modification of the macroclimatic impacts of solar radiation, air temperatures, and wind speeds and direction by buildings, artificial surfaces, and vegetation. The temperature of surfaces and near-surface air in any particular location results from the complex interaction between these factors. While Ta is important for human thermal comfort when solar radiation is absent, it is much less influential in
the hottest times of summer days in warm to hot climates. Accordingly, variables such as the PET are much more relevant to estimating the impact of urban design and parks on human thermal comfort.
There is increasing interest in the role of parks as potential refuges from heat in the age of climate change (Bolleter & Ramalho, 2014, 2019). However, as this study of different park typologies in Perth, Australia, illustrates, it is largely the shade provided by trees that provides any benefit. Therefore, the adaptation of urban areas to ameliorate daytime summer conditions requires the creation of a continuous canopy, as illustrated by the corridor of trees surrounding Hyde Park Lake (see Figure 17b). One of the dangers of a singular focus on Park Cool Island effects is that urban planners and designers neglect outdoor thermal comfort in streetscapes and private lots, as well as the need for connected urban greening more generally.
6. References
Australian Government. (2024). National Urban Policy: Consultation draft. A. Government. https://www.infrastructure.gov.au/sites/default/files/documents/draft-national-urbanpolicy.pdf
Bolleter, J. (2016). Background noise: a review of the effects of background infill on urban liveability in Perth. Australian Planner, 10, 1-14. https://doi.org/https://doi.org/10.1080/07293682.2016.1245201
Bolleter, J. (2017). Fringe benefits? A review of outer suburban development on Perth’s fringes in relation to state government goals concerning the natural environment and efficient transport connectivity. Australian Planner, 54(2). https://doi.org/https://doi.org/10.1080/07293682.2017.1319395
Bolleter, J., & Ramalho, C. (2014). The potential of ecologically enhanced urban parks to encourage and catalyze densification in greyfield suburbs. Journal of Landscape Architecture, 9(3), 54-65. https://doi.org/https://doi.org/10.1080/18626033.2015.968418
Bolleter, J., & Ramalho, C. (2019). Greenspace-Oriented Development: Reconciling urban density and nature in suburban cities. Springer. https://doi.org/https://doi.org/10.1007/978-3-030-29601-8
Brown, R., Vanos, J., Kenny, N., & Lenzholzer, S. (2015). Designing urban parks that ameliorate the effects of climate change. Landscape and Urban Planning(138), 118–131. https://doi.org/http://dx.doi.org/10.1016/j.landurbplan.2015.02.006
Bureau of Meteorology. (2019). Bureau of Meteorology. Australian Government. Retrieved 23.01 from http://www.bom.gov.au
Cai, X., Yang, J., Zhang, Y., Xiao, X., & Xia, J. (2023). Cooling island effect in urban parks from the perspective of internal park landscape. Humanities & social sciences communications, 10(1), 674-612. https://doi.org/10.1057/s41599-023-02209-5
Cheng, X., Wei, B., Chen, G., Li, J., & Song, C. (2015). Influence of Park Size and Its Surrounding Urban Landscape Patterns on the Park Cooling Effect. Journal of urban planning and development, 141(3). https://doi.org/10.1061/(asce)up.1943-5444.0000256
Climate Action Tracker. (2024). Warming Projections Global Update. https://climateactiontracker.org/documents/1277/CAT_2024-1114_GlobalUpdate_COP29.pdf
The University of Western Australia uwa.edu.au
Reality check: Unpacking Park Cool Island effects using re-mote-sensed, measured and modelled microclimatic data
Davis, G., & Harford-Mills, G. (2016). Examining 60 Years of Strategic Planning in Metropolitan Perth and Peel.
Department of Sport and Recreation. (2012). Classification framework for public open space. D. o. S. a. Recreation.
Devereux, D., & Caccetta, P. (2019). Land surface temperature and urban heat island estimates for Australian capital cities, summer 2018-19. CSIRO. Retrieved 07.07 from https://researchdata.edu.au/land-surface-temperature-2018-19/1426489
Duncan, J., Boruff, B., Saunders, A., Sun, Q., Hurley, J., & Amati, M. (2019). Turning down the heat: An enhanced understanding of the relationship between urban vegetation and surface temperature at the city scale. Science of the Total Environment, 656, 118-128.
Eliasson, I. (1996). Urban nocturnal temperatures, street geometry and land use. Atmospheric environment (1994), 30(3), 379-392. https://doi.org/10.1016/1352-2310(95)00033-X
ENVI-met. (2021). ENVI-met: decoding urban nature. ENVI-met. Retrieved 23.06 from https://www.envi-met.com/
Feyisa, G. L., Dons, K., & Meilby, H. (2014). Efficiency of parks in mitigating urban heat island effect: An example from Addis Ababa. Landscape and Urban Planning, 123, 87-95. https://doi.org/https://doi.org/10.1016/j.landurbplan.2013.12.008
García-Haro, A., Arellano, B., & Roca, J. (2023). Quantifying the influence of design and location on the cool island effect of the urban parks of Barcelona. Journal of Applied Remote Sensing, 17(3), 034512-034512.
Höppe, P. (1999). The physiological equivalent temperature – a universal index for the biometeorological assessment of the thermal environment. International Journal of Biometeorology, 43(2), 71-75. https://doi.org/10.1007/s004840050118
Kim, K., Yi, C., & Lee, S. (2019). Impact of urban characteristics on cooling energy consumption before and after construction of an urban park: The case of Gyeongui line forest in Seoul. Energy and Buildings, 191, 42-51.
Kong, F., Sun, C., Liu, F., Yin, H., Jiang, F., Pu, Y., Cavan, G., Skelhorn, C., Middel, A., & Dronova, I. (2016). Energy saving potential of fragmented green spaces due to their temperature regulating ecosystem services in the summer. Applied Energy, 183, 1428-1440.
Lenzholzer, S. (2015). Weather in the City: How Design Shapes the Urban Climate. nai010.
Liao, W., Guldmann, J.-M., Hu, L., Cao, Q., Gan, D., & Li, X. (2023). Linking urban park cool island effects to the landscape patterns inside and outside the park: A simultaneous equation modeling approach. Landscape and Urban Planning, 232, 104681. https://doi.org/https://doi.org/10.1016/j.landurbplan.2022.104681
Lin, W., Yu, T., Chang, X., Wu, W., & Zhang, Y. (2015). Calculating cooling extents of green parks using remote sensing: Method and test. Landscape and Urban Planning, 134, 66-75. https://doi.org/https://doi.org/10.1016/j.landurbplan.2014.10.012
Martí-Cardona, B., Prats, J., & Niclòs, R. (2019). Enhancing the retrieval of stream surface temperature from Landsat data. Remote Sensing of Environment, 224, 182-191. https://doi.org/https://doi.org/10.1016/j.rse.2019.02.007
Mills, G., & Stewart, I. D. (2021). The Urban Heat Island. Elsevier. Motazedian, A., Coutts, A. M., & Tapper, N. J. (2020). The microclimatic interaction of a small urban park in central Melbourne with its surrounding urban environment during heat events. Urban Forestry & Urban Greening, 52, 126688. https://doi.org/10.1016/j.ufug.2020.126688
Nardino, M., & Laruccia, N. (2019). Land use changes in a peri-urban area and consequences on the urban heat island. Climate (Basel), 7(11), 133. https://doi.org/10.3390/cli7110133
The University of Western Australia uwa.edu.au
Reality check: Unpacking Park Cool Island effects using re-mote-sensed, measured and modelled microclimatic data
Oke, T. R., Crowther, J. M., McNaughton, K. G., Monteith, J. L., & Gardiner, B. (1989). The Micrometeorology of the Urban Forest [and Discussion]. Philosophical transactions of the Royal Society of London. Series B, Biological sciences, 324(1223), 335-349. https://doi.org/10.1098/rstb.1989.0051
Sharifi, E., Sivam, A., & Boland, J. (2016). Resilience to heat in public space: a case study of Adelaide, South Australia. Journal of Environmental Planning and Management, 59(10), 1833-1854. https://doi.org/https://doi.org/10.1080/09640568.2015.1091294
Spronken-Smith, R. A., & Oke, T. R. (1998). The thermal regime of urban parks in two cities with different summer climates. International journal of remote sensing, 19(11), 2085-2104.
Sugawara, H., Narita, K.-i., & Mikami, T. (2021). Vertical structure of the cool island in a large urban park. Urban Climate, 35, 100744.
https://doi.org/https://doi.org/10.1016/j.uclim.2020.100744
Sugawara, H., Shimizu, S., Takahashi, H., Hagiwara, S., Narita, K. i., Mikami, T., & Hirano, T. (2016). Thermal Influence of a Large Green Space on a Hot Urban Environment. Journal of environmental quality, 45(1), 125-133. https://doi.org/10.2134/jeq2015.01.0049
Summers, L. (2007). From Wasteland to Parkland University of Melbourne]. Unpublished.
Vanos, J. K., Warland, J. S., Gillespie, T. J., Slater, G. A., Brown, R. D., & Kenny, N. A. (2012). Human Energy Budget Modeling in Urban Parks in Toronto and Applications to Emergency Heat Stress Preparedness. Journal of Applied Meteorology and Climatology, 51(9), 1639-1653. https://doi.org/10.1175/jamc-d-11-0245.1
Walther, E., & Goestchel, Q. (2018). The PET comfort index: Questioning the model. Building and Environment, 137, 1-10.
West Australian Planning Commission, & Department of Planning. (2009). Liveable Neighbourhoods; A Western Australian Government Sustainable Cities Initiative. G. o. W. Australia. https://www.wa.gov.au/system/files/202105/FUT_LN_Liveable_Neighbourhoods_update_02.pdf
Yu, Z., Guo, X., Jørgensen, G., & Vejre, H. (2017). How can urban green spaces be planned for climate adaptation in subtropical cities? Ecological Indicators, 82, 152-162. https://doi.org/https://doi.org/10.1016/j.ecolind.2017.07.002
The University of Western Australia uwa.edu.au
Reality check: Unpacking Park Cool Island effects using re-mote-sensed, measured and modelled microclimatic data