
Future Climate, Future Home
Evidence-based adaptive urban design strategies for Western Australia
Precinct climate performance in current conditions: Appendicies
©Australian Urban Design Research Centre


Evidence-based adaptive urban design strategies for Western Australia
©Australian Urban Design Research Centre
Data layers created in ArcGIS:
Layer Type Attributes
Height (using the building footprint layer values or check the Google Street View)
Buildings
Vegetation (Simple Plants)
Surfaces
Polygon
Roof type (chosen from Table 1)
Wall type (chosen from Table 2)
Polygon Simple vegetation (chosen from Table 3)
Polygon Surface type (chosen from Table 4)
Vegetation (3D Plants) Points Trees (chosen from Table 5)


Corrugated ironwhite 02WIRO 6
Corrugated irongrey


02GIRO 7


Corrugated iron –light grey

Corrugated ironblack

020LGG 15


8


Corrugated ironblue

9


Corrugated ironbeige


10


14


Solar panels
Solar panels on a terracotta tile roof
0250TT 13


Solar panels in a concrete tile roof
0250CT 133


Solar panels on a corrugated iron roof
0250IT 1333


16


Free-standing brick wall

1

To be digitised in 3D detailed design, ENVI-met


2


1

020ABR 2

0200ZB 3


1. WA
Pepp ermin t
AFWA4M WA
Peppermin t (very young)

AFWA7M WA
Peppermin t (young)


5 m > Trees

8 m > Trees ≥ 5 m
AFWA11 WA
Peppermin t (middle)

AFWA16 WA Peppermin t (old)

15 > Trees ≥ 8 m


25 > Trees ≥ 15 m


MQ005M Melaleuca quinquene rvia (very young) (Narrower compared to Eucalyptus )
MQ8.5M Melaleuca quinquene rvia (young)


7 m > Trees ≥ 4 m

10m >Trees ≥ 7 m


25 m >Trees ≥ 10 m
2 m ≥ Trees
EUC05M Eucalyptus (Very Young)


EUC05A Eucalyptus (Very Young)
Ample Canopy


5 m ≥Trees > 2 m
EUCA5A Eucalyptus (Very Young) Very Ample Canopy

EUC10A Eucalyptus (Young) Ample canopy


10 m >Trees > 5 m
EUC10M Eucalyptus (Young)


EUC10N Eucalyptus (Young) Narrower


EUC15N Eucalyptus
Narrow (Middle)


EUC15M Eucalyptus (Middle)


25 m >Trees ≥ 10 m
EUC15A Eucalyptus
(Middle)
Ample
canopy


EUC20A Eucalyptus (Old)
Ample
canopy


30 m >Trees ≥ 25 m


EUC20N Eucalyptus (Old)
Narrower


EUC30A Eucalyptus (Very Old)
Ample
canopy


EUC30M Eucalyptus (Very Old)


4. PYRUS2 Pyrus (very young, 2 m height)

PYRUS5 Pyrus (young 5 m height)


PYRU10 Pyrus (middle 10 m height)


(Very young)


SHEO8M Sheoak (young) 8 m


SHEOAK Sheoak (middle) 14 m


SHEO30 Sheoak (old) 30 m


old) 37 m


(Very young)


Pine (young) 10 m


Ficus macro phylla (Moret on Bay Fig)
LTHYDE Ficus macrophyll a has a height of around 20 m and a width of about 35 m.


Selected day for simulation:


ENVI-met Output Maps:
Surface Temperature Distribution Map

(Thermal Comfort Index) Distribution Map

Mean Radiant Temperature Distribution Map


Wind Speed and Direction Distribution Map

Humidity Distribution Map


Selected day for simulation:


ENVI-met Output Maps:
Surface Temperature Distribution Map

(Thermal Comfort Index) Distribution Map

Mean Radiant Temperature Distribution Map


Wind Speed and Direction Distribution Map

Humidity Distribution Map


Selected day for simulation:


ENVI-met Output Maps:
Surface Temperature Distribution Map

(Thermal Comfort Index) Distribution Map

Mean Radiant Temperature Distribution Map


Wind Speed and Direction Distribution Map

Humidity Distribution Map


Selected day for simulation:


ENVI-met Output Maps:
Surface Temperature Distribution Map

(Thermal Comfort Index) Distribution Map

Mean Radiant Temperature Distribution Map


Wind Speed and Direction Distribution Map

Humidity Distribution Map


Selected day for simulation:


ENVI-met Output Maps:
Surface Temperature Distribution Map

(Thermal Comfort Index) Distribution Map

Mean Radiant Temperature Distribution Map


Wind Speed and Direction Distribution Map

Humidity Distribution Map


Selected day for simulation:


ENVI-met Output Maps:
Surface Temperature Distribution Map

(Thermal Comfort Index) Distribution Map

Mean Radiant Temperature Distribution Map


Wind Speed and Direction Distribution Map

Humidity Distribution Map


Selected day for simulation:


ENVI-met Output Maps:
Surface Temperature Distribution Map

(Thermal Comfort Index) Distribution Map

Mean Radiant Temperature Distribution Map


Wind Speed and Direction Distribution Map

Humidity Distribution Map


Selected day for simulation:


ENVI-met Output Maps:
Surface Temperature Distribution Map

(Thermal Comfort Index) Distribution Map

Mean Radiant Temperature Distribution Map


Wind Speed and Direction Distribution Map

Humidity Distribution Map


Selected day for simulation:


ENVI-met Output Maps:
Surface Temperature Distribution Map

(Thermal Comfort Index) Distribution Map

Mean Radiant Temperature Distribution Map


Wind Speed and Direction Distribution Map

Humidity Distribution Map

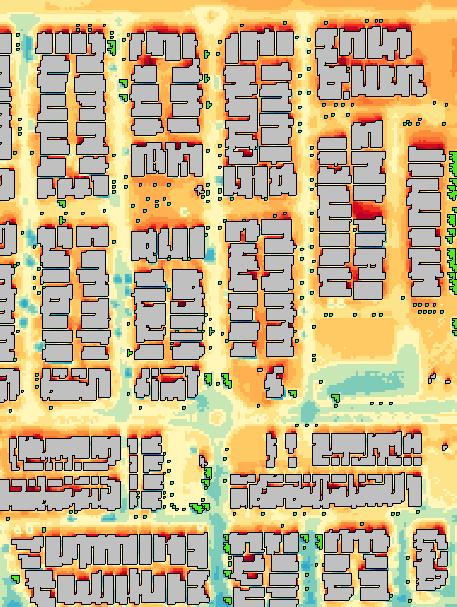
Perth Central
Aerial image:

Selected day for simulation:


ENVI-met Output Maps:
Surface Temperature Distribution Map

(Thermal Comfort Index) Distribution Map

Mean Radiant Temperature Distribution Map


Wind Speed and Direction Distribution Map

Humidity Distribution Map


Selected day for simulation:


ENVI-met Output Maps:
Surface Temperature Distribution Map

(Thermal Comfort Index) Distribution Map

Mean Radiant Temperature Distribution Map


Wind Speed and Direction Distribution Map

Specific Humidity Distribution Map


Selected day for simulation:

Modelling in ENVI-met Software:


ENVI-met Output Maps:
Surface Temperature Distribution Map

PET (Thermal Comfort Index) Distribution Map

Mean Radiant Temperature Distribution Map

Potential Air Temperature Distribution Map

Wind Speed and Direction Distribution Map

Specific Humidity Distribution Map


Selected day for simulation:
Modelling in ENVI-met Software:


ENVI-met Output Maps:
Surface Temperature Distribution Map

PET (Thermal Comfort Index) Distribution Map

Mean Radiant Temperature Distribution Map

Potential Air Temperature Distribution Map

Wind Speed and Direction Distribution Map

Specific Humidity Distribution Map

The irrigation requirements of various vegetation types depend on the location’s evapotranspiration characteristics. Evapotranspiration is the combined process of evaporation from soil and plant surfaces, as well as transpiration through plant surfaces (Burman & Pochop, 1994).
These have been derived from Bureau of Meteorology datasets for daily reference evapotranspiration (ETo) based on automatic weather station records and satellite measurements ETo is a theoretical measure based on a standardised vegetated surface A grass crop with a uniform height of 0.12 m, an albedo of 0.23 and a fixed surface resistance of 70 sm-1 applies to a moderately dry soil surface with an approximately weekly irrigation frequency
The irrigation requirements of various plant types have been taken from ‘Water Use Efficiency for Irrigated Turf and Landscape’ (Connellan, 2013).
In future study phases, the irrigation demands of public and private open spaces under changing climate conditions will be utilised in a bespoke irrigation model using the Vensim system dynamics software
Broome (and Kimberley in general) has the highest irrigation demand in the state despite the wet conditions during the monsoon. The irrigation demand for trees and lawns for both Broome Central and Broome North is calculated in Figure 1


The irrigation demand for trees and lawns in Bulgarra and Karratha town centre is shown in Figure 2


Geraldton irrigation demands
The irrigation demand for trees and lawns for Maitland Park is calculated in Figure 3


3
Toodyay irrigation demands
The calculated irrigation demand for trees and lawns at River Hills Estate is presented in Figure 4.


4
Perth irrigation demands
The calculated irrigation demand for trees and lawns in all the Perth case studies is set out in Figure 5

