Perth’s suburbs are dotted with drainage corridors and compensation basins. However, a preoccupation with drainage functions means most of this drainage land delivers little liveability or sustainability benefits to surrounding urban areas. As a result, Local Governments across Perth are engaged in providing green infrastructure upgrades to such drainage land. However, questions remain about where such improvements should be targeted for maximum benefit. In response, this project conducted a novel Suitability Analysis using environmental, societal, planning, climatic and hydrological mapping layers to determine which areas of drainage land are most opportune for upgrades.
Report commissioned by the Water Corporation.

Drainage for liveability
suitability analysis to guide investment in upgrading drainage land (Preliminary Report)
Using
© Australian Urban Design Research Centre 2024
Contents Background 6 Key findings 12 Suitability analysis mapping 14 Contributors 42 4
5
Background
Where should Local Governments focus green infrastructure upgrades of drainage land for maximum benefits?
6
Due to the historic draining of hundreds of hectares of wetlands, Perth’s suburbs are dotted with drainage corridors and compensation basins. However, a preoccupation with drainage functions (providing flood control and conveyance) means most of this drainage land delivers little liveability or sustainability benefits to surrounding urban areas.
As a result, Local Governments across Perth are engaged in delivering Green Infrastructure upgrades to such drainage land, often in the form of living streams that function as a biological filter sieving out both organic and inorganic material, providing a habitat and food web for a variety of plants and animals and enhance the amenity of the area. However, questions remain about where such upgrades should be targeted for maximum benefit. Indeed, some decisions on what drainage land to upgrade are made on a ‘rule of thumb’ or intuitive basis.
This situation is concerning because open space (including drainage land) needs to become more multifunctional as the urban density increases, climate change impacts escalate, biodiversity is increasingly threatened, and stubborn public health challenges endure. Moreover, such pressures are not felt evenly across metropolitan areas.
In response to a lack of an overarching framework to guide upgrades to drainage land, this research posed the question:
‘Where should planners and policymakers invest in green infrastructure upgrades to open drains and compensation basins for the greatest sustainability and liveability impact?’
In answering this question, we conducted a mapping-based ‘suitability analysis’ (in ArcMap 10.5) using five sub-models:
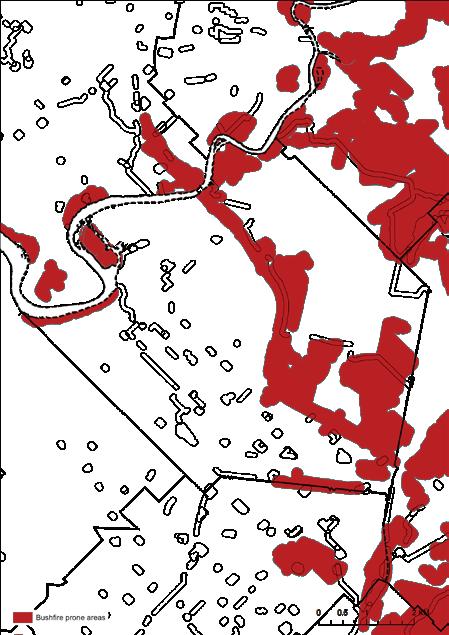
1. Environment: The environment sub-model included layers such as threatened ecological communities, urban forest canopy cover, and bushfireprone areas. Green infrastructure upgrades on drainage land should be targeted towards areas with threatened biodiversity and low existing canopy cover while avoiding bushfire-prone regions as much as possible.
2. Society: The societal submodel included layers such as the projected percentage of people who typically undertake low or no exercise, experience psychological distress, low socio-economic areas, and registered Aboriginal heritage places. Green infrastructure upgrades of drainage land to operate as public space should be targeted towards areas where people are sedentary, experience psychological distress, or form part of a lowseriocomic strata. Upgrades in the form of greater endemic shrub and tree planting should also be targeted to areas with indigenous significance.
3. Planning: The planning submodel included layers such as proximity to existing parks, land use, and planned wildlife corridors. Green infrastructure upgrades of drainage land to operate as
7
public space should be targeted towards areas with limited park access, residential and town centre land uses, and sites designated as wildlife corridors.
4. Hydrology: The hydrology sub-model included layers such as required phosphorous and nitrogen reduction in stormwater. Green infrastructure upgrades of drainage land in the form of macrophytic planting, which can clean stormwater, should be targeted towards areas with high phosphorous and nitrogen loads.
8
5. Climate: The climate sub-model included layers such as Land surface temperature and Urban heat island effect, which combine to influence climate comfort. Areas that experience elevated extreme temperatures should be targeted with green infrastructure upgrades in the form of tree and shrub planting on drainage land to deliver cooling effects.
While the suitability analysis was initially conducted at the metropolitan scale, we have focussed on two greyfield Local Government Areas, the City of Stirling and the City of Belmont, which have extensive open drainage networks and are experiencing pronounced growth pressures and associated increases in urban density.
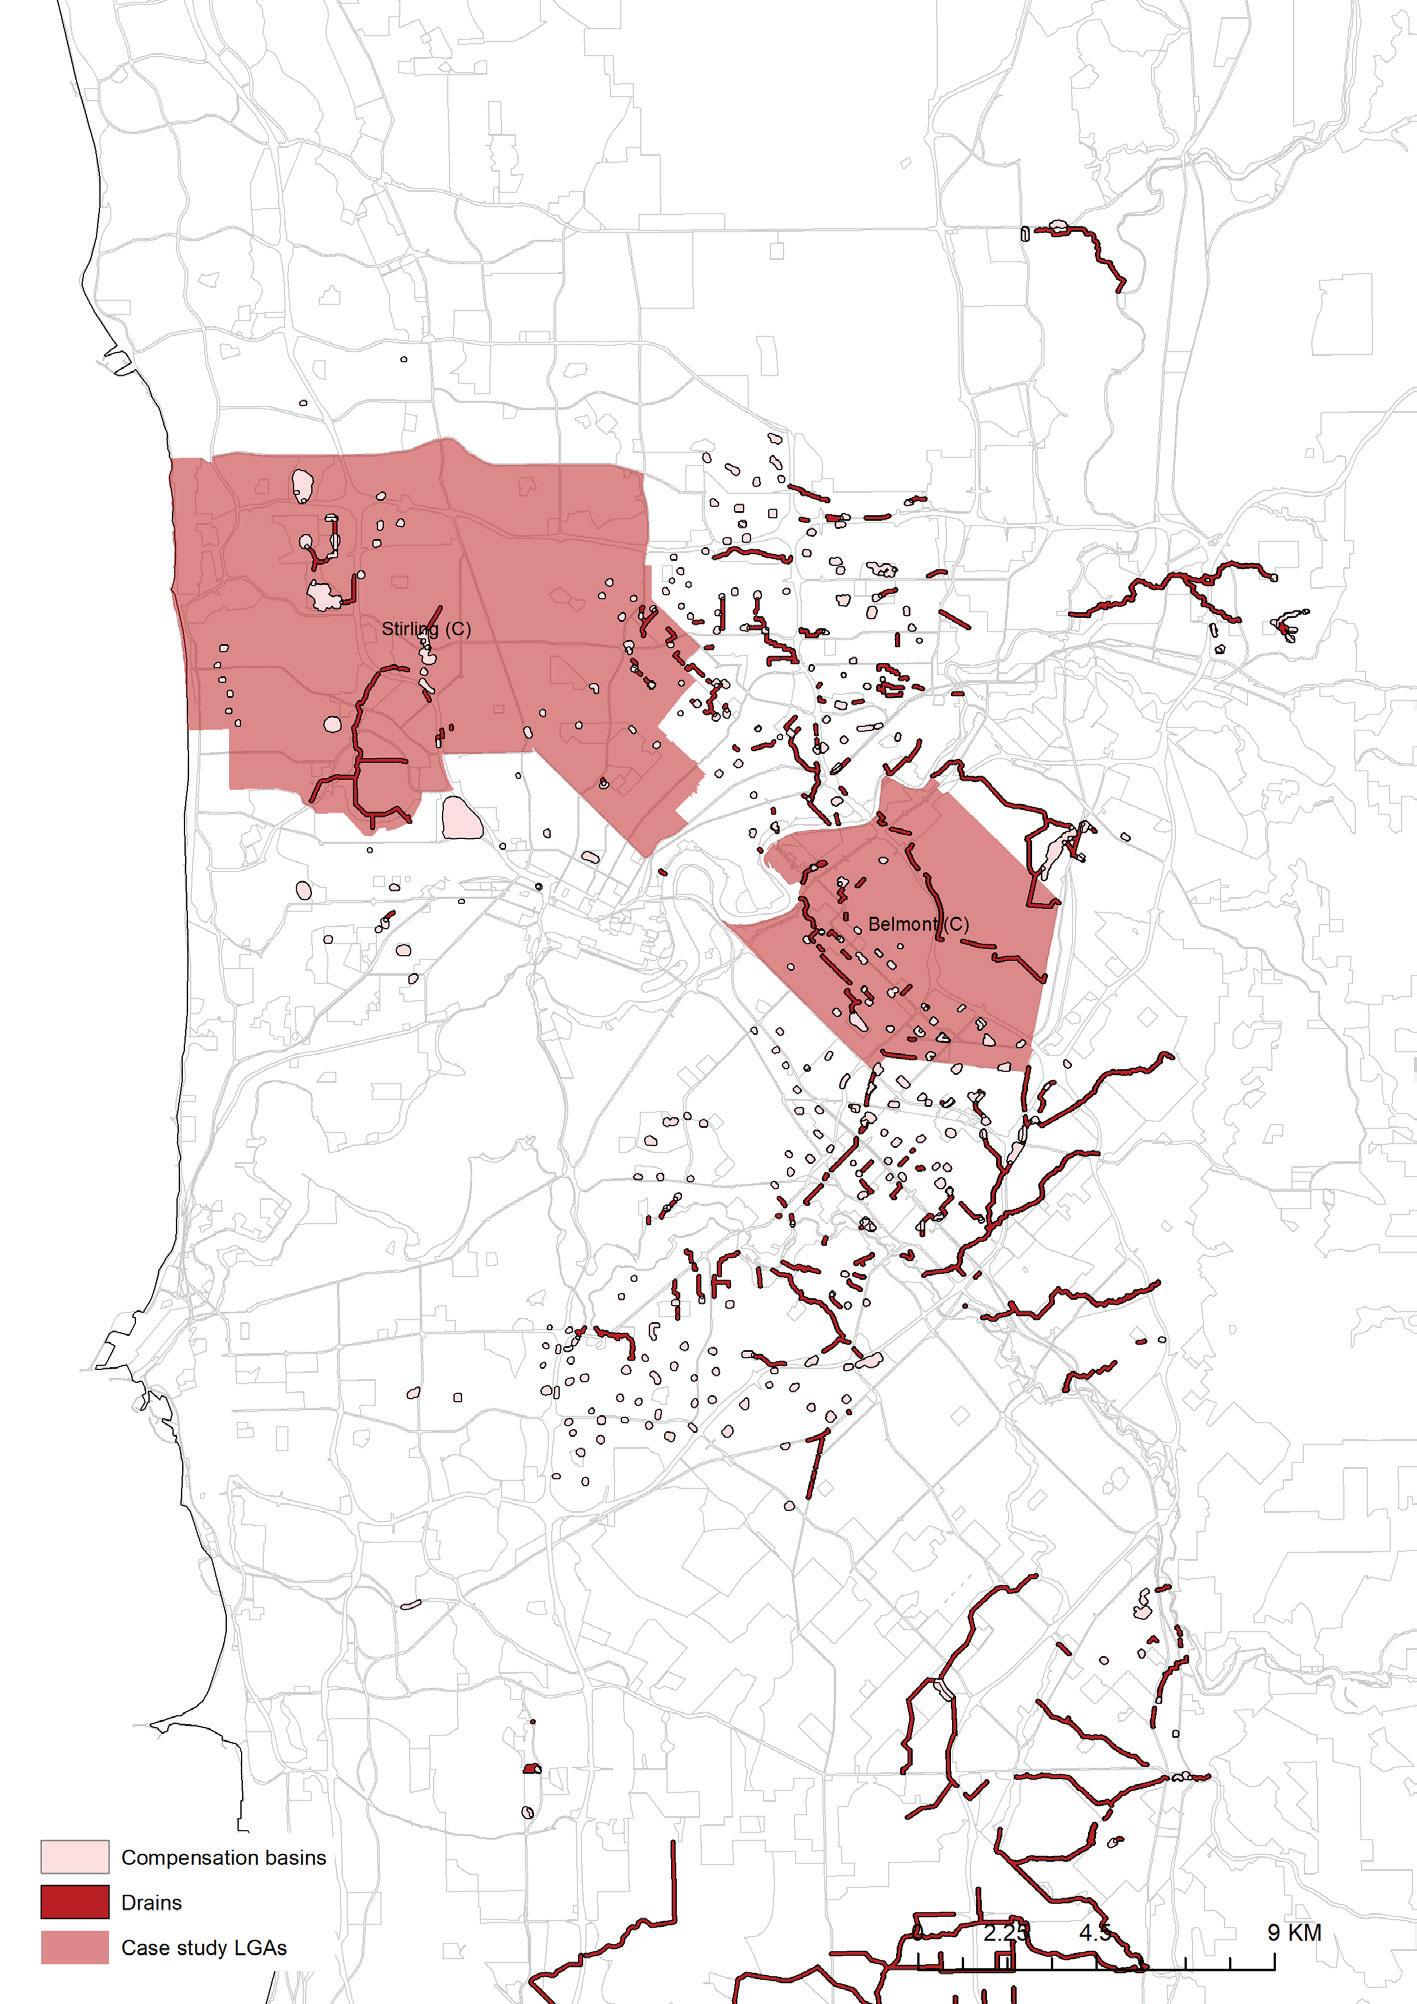
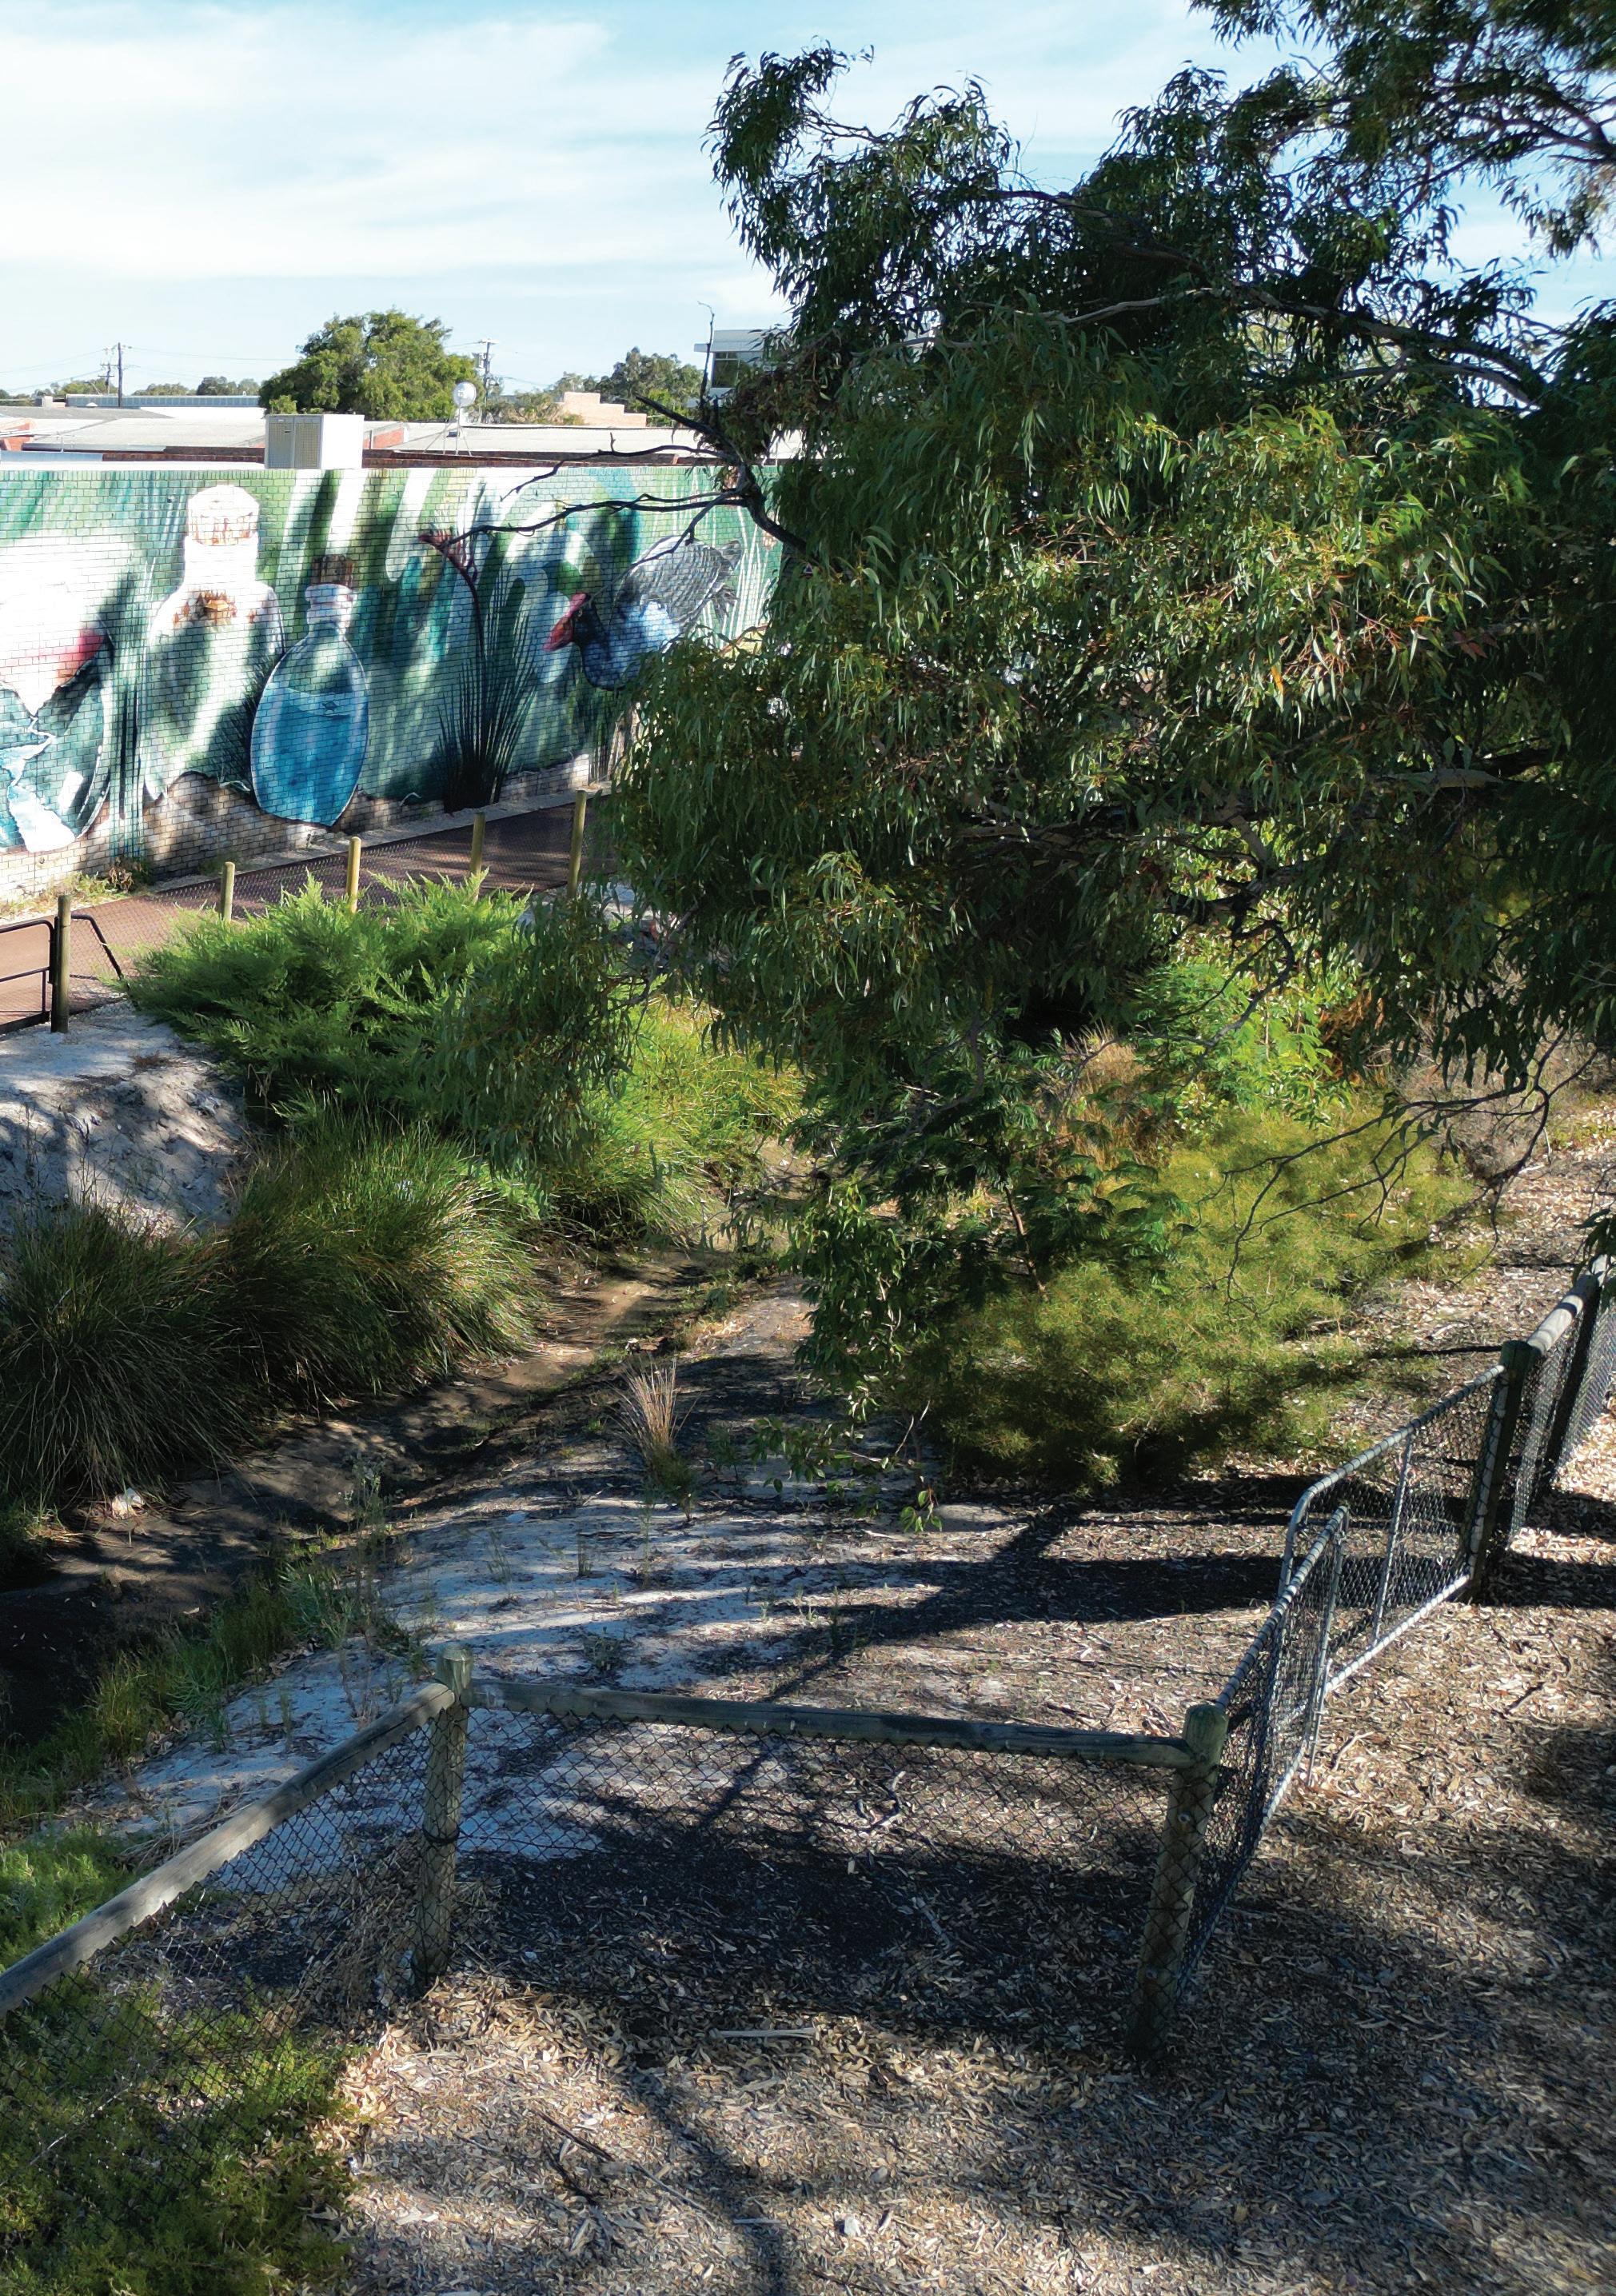
Case study areas
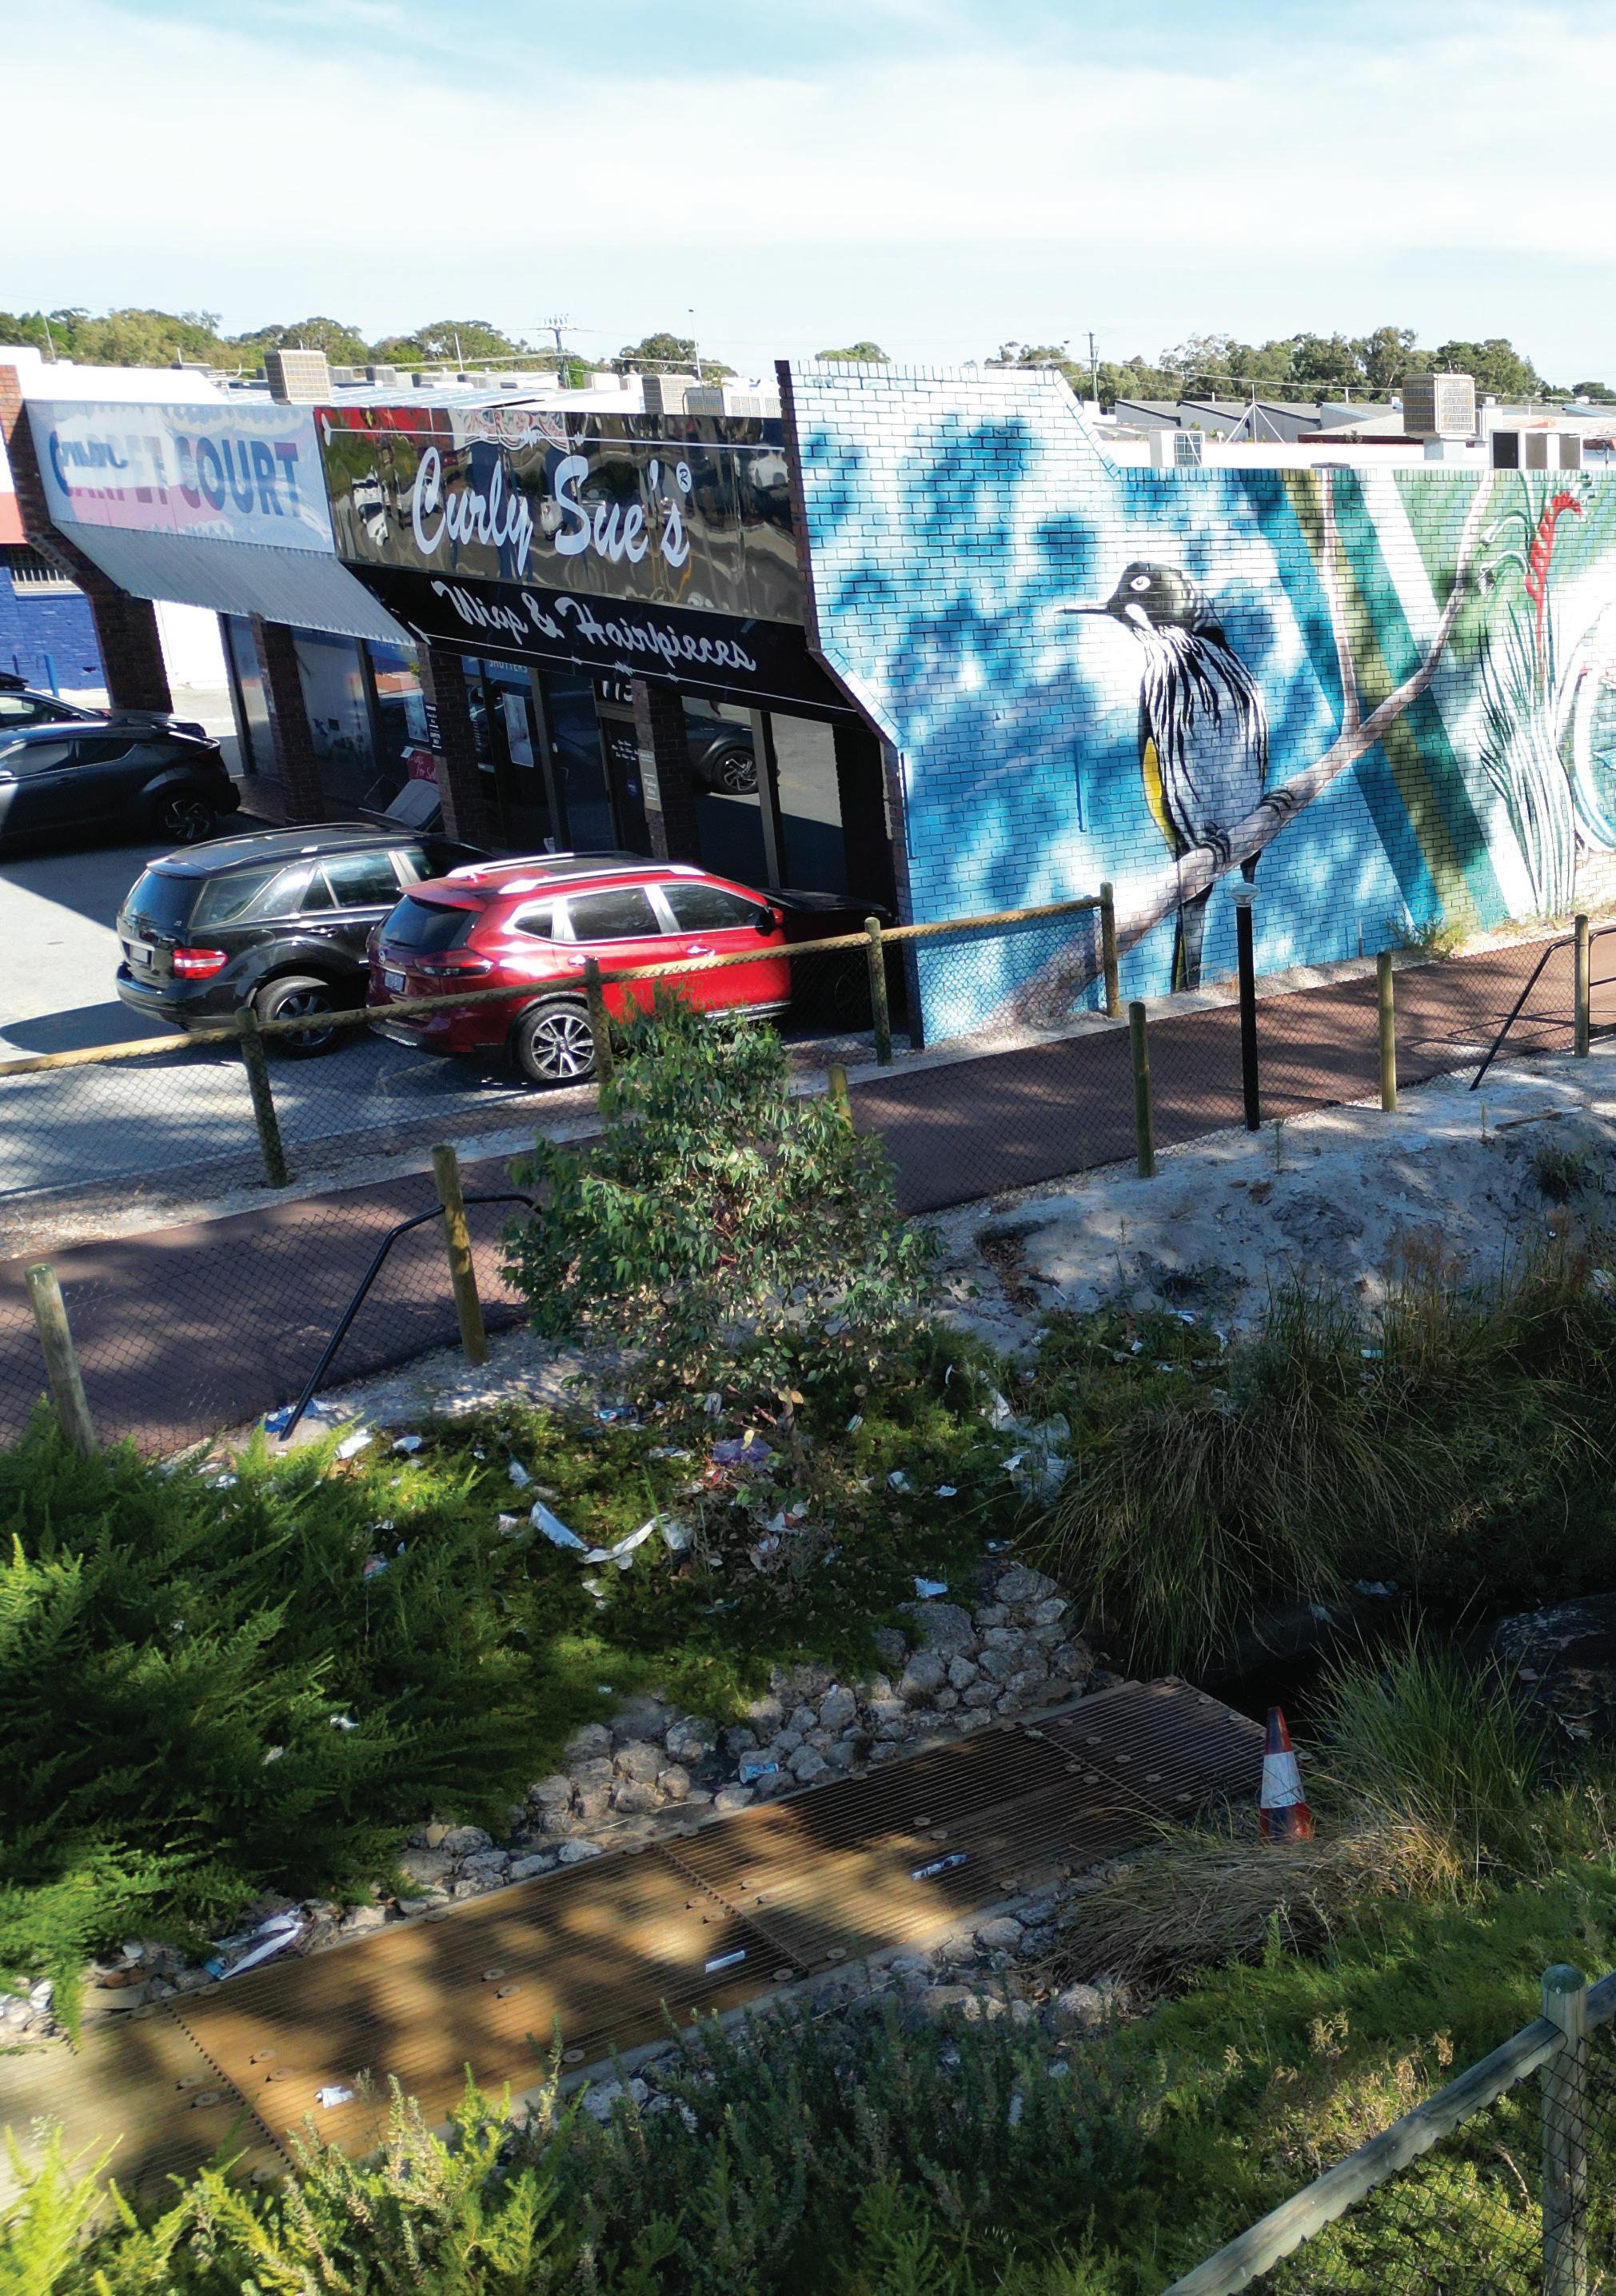
A recently established living stream, with an adjacent pedestrian path and artwork, in Russell
in Morley
Street Park
Key findings
Our analysis is novel, and its methodological innovation is assessing underutilised drainage land at a broad scale and using various societal mapping layers
12
Key findings of this preliminary research are:
• The absence of a comprehensive suitability analysis to guide drainage land upgrades is noteworthy and risks investments in drainage land upgrades that fail to deliver optimum benefits.
• Areas of highest priority vary considerably between the sub-models, and there is no one correct answer to the question of which drainage land to upgrade; it depends on what lens is applied (for example, whether an environmental or societal focus is adopted).
• The project’s next stage will work with select local governments to develop sub-model weighting appropriate to their priorities. Nonetheless, Local Governments can adopt the current sub-model map that relates to their preference (e.g., climatic or environmental factors and related sub-models)
• While this analysis focuses explicitly on drainage land, the suitability analysis maps can be used to assess other public land, for example, school sites, parks, or verges.
• Our analysis is novel, and its methodological innovation is assessing underutilised drainage land at a broad scale and using various societal (not only environmental) mapping layers.
13
Suitability analysis mapping
The following pages document our suitability analysis of our City of Stirling and City of Belmont case studies
14
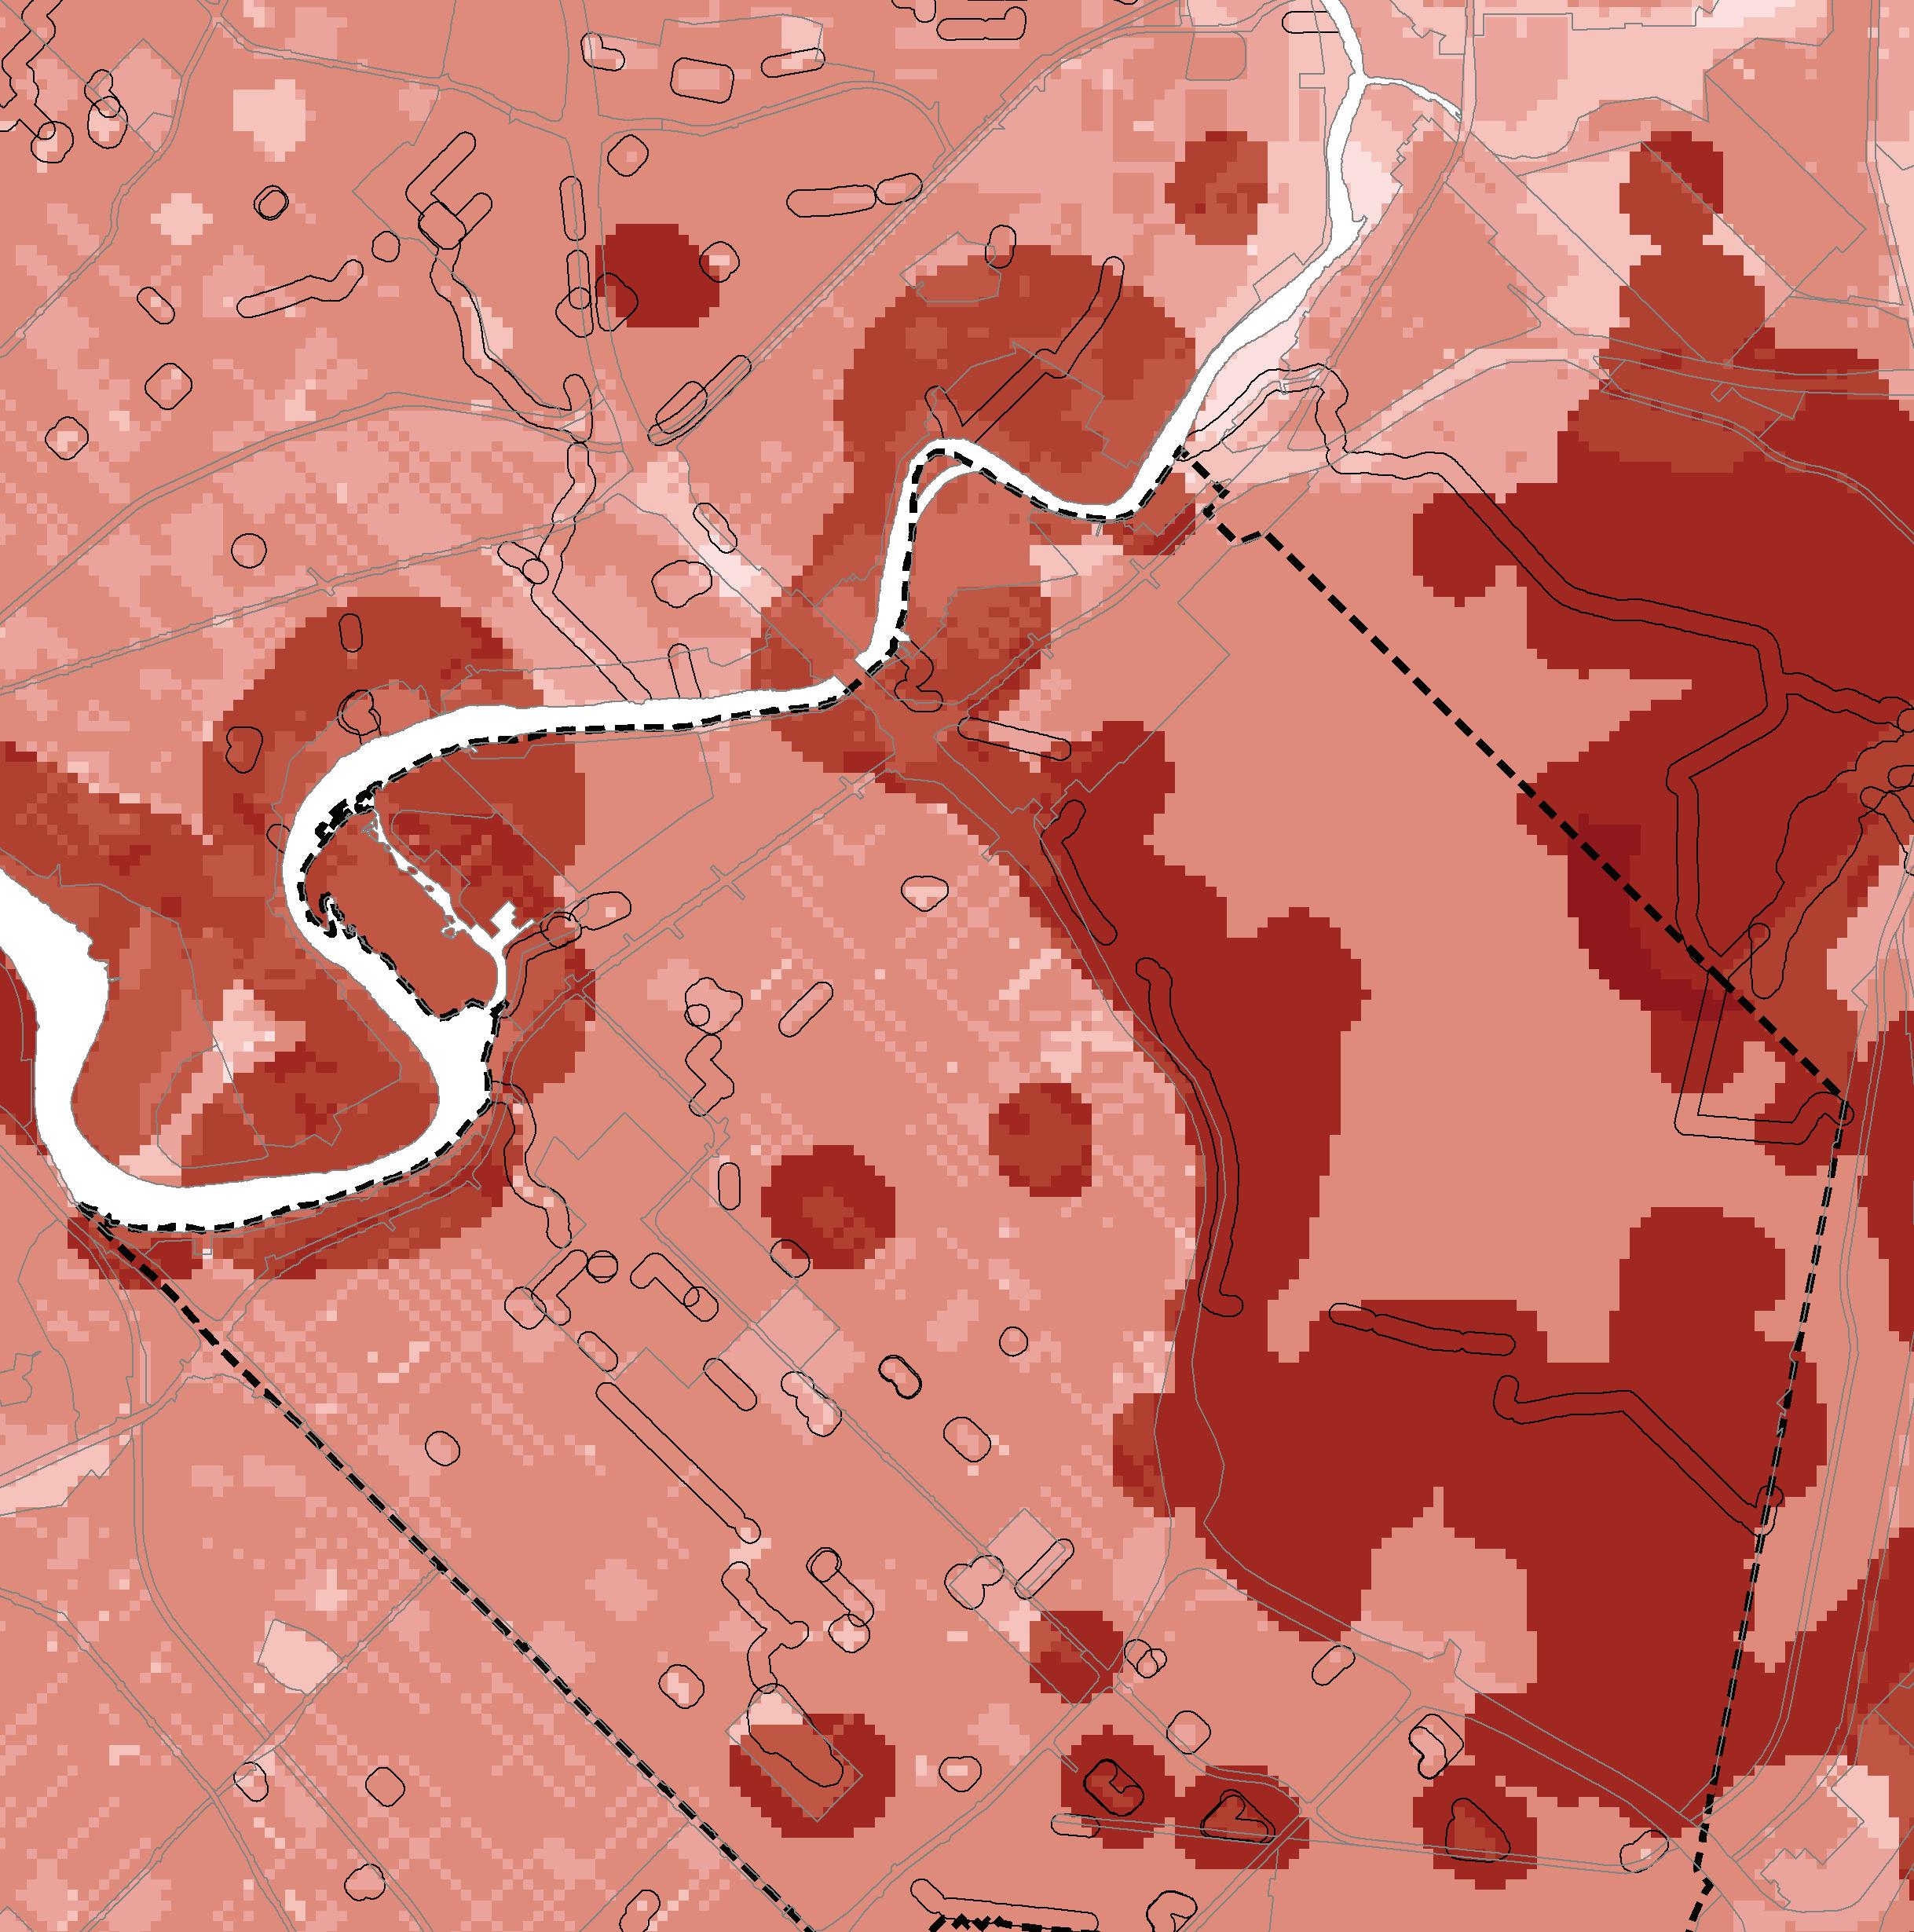
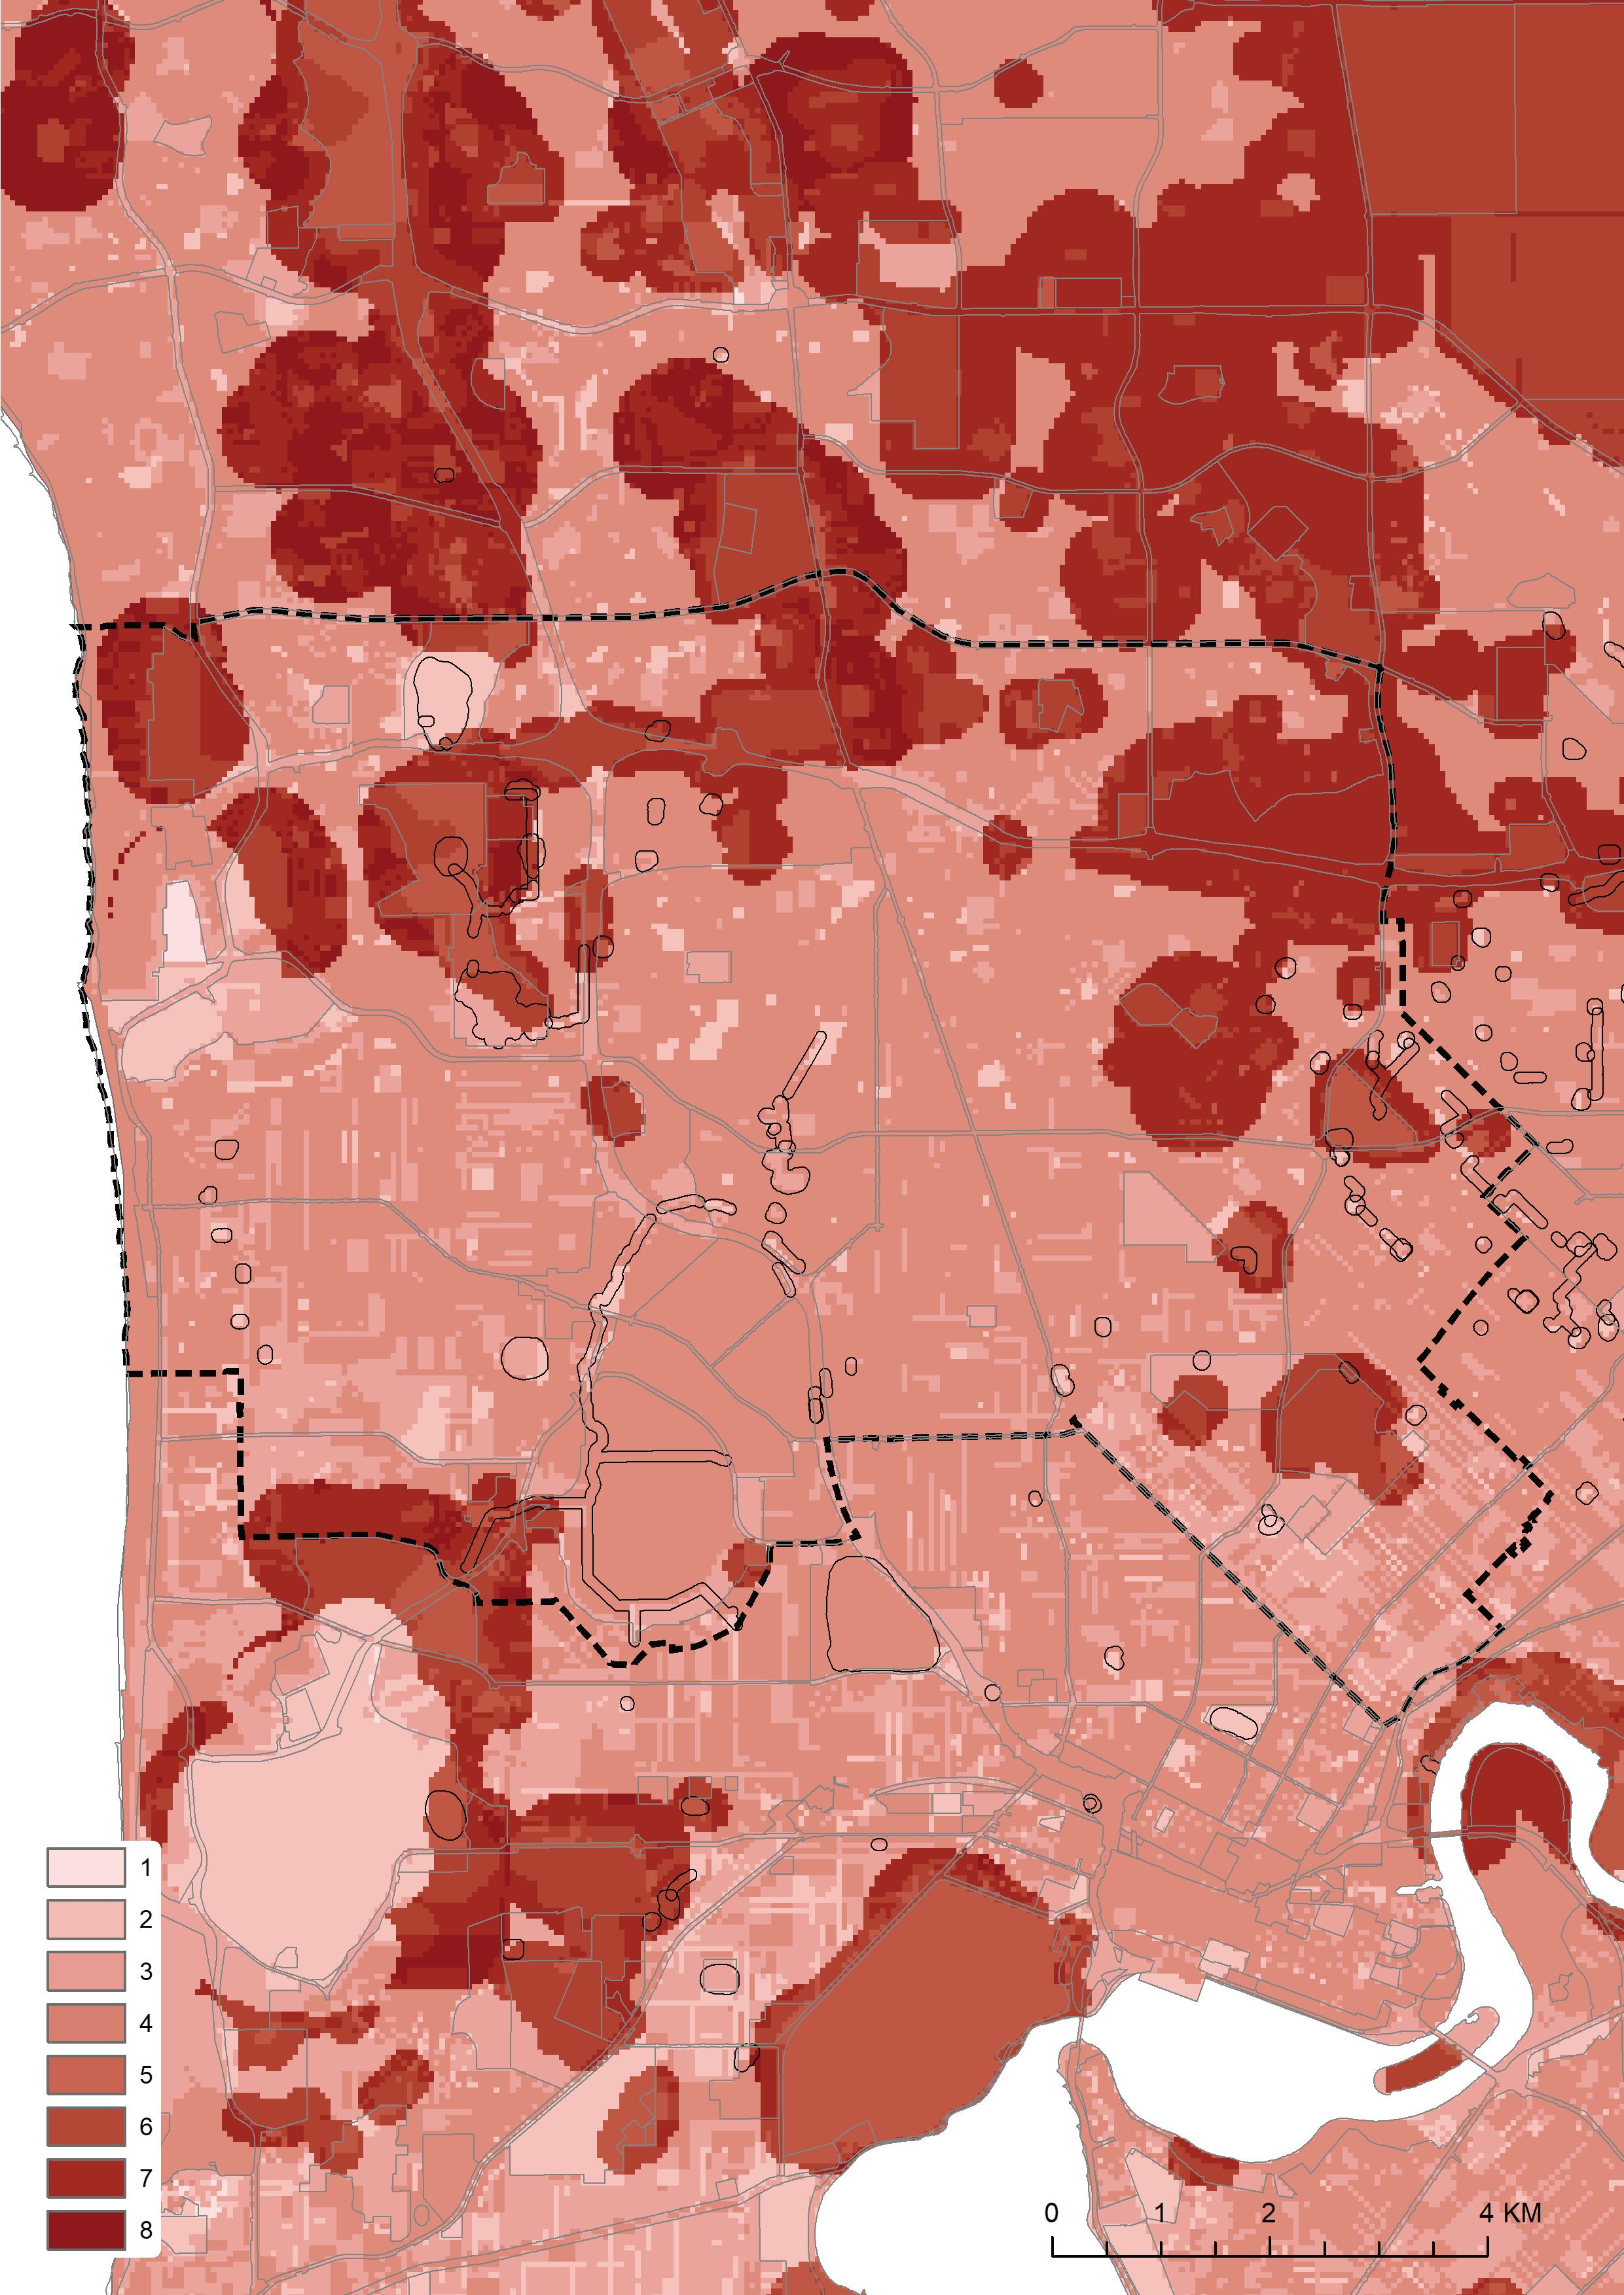
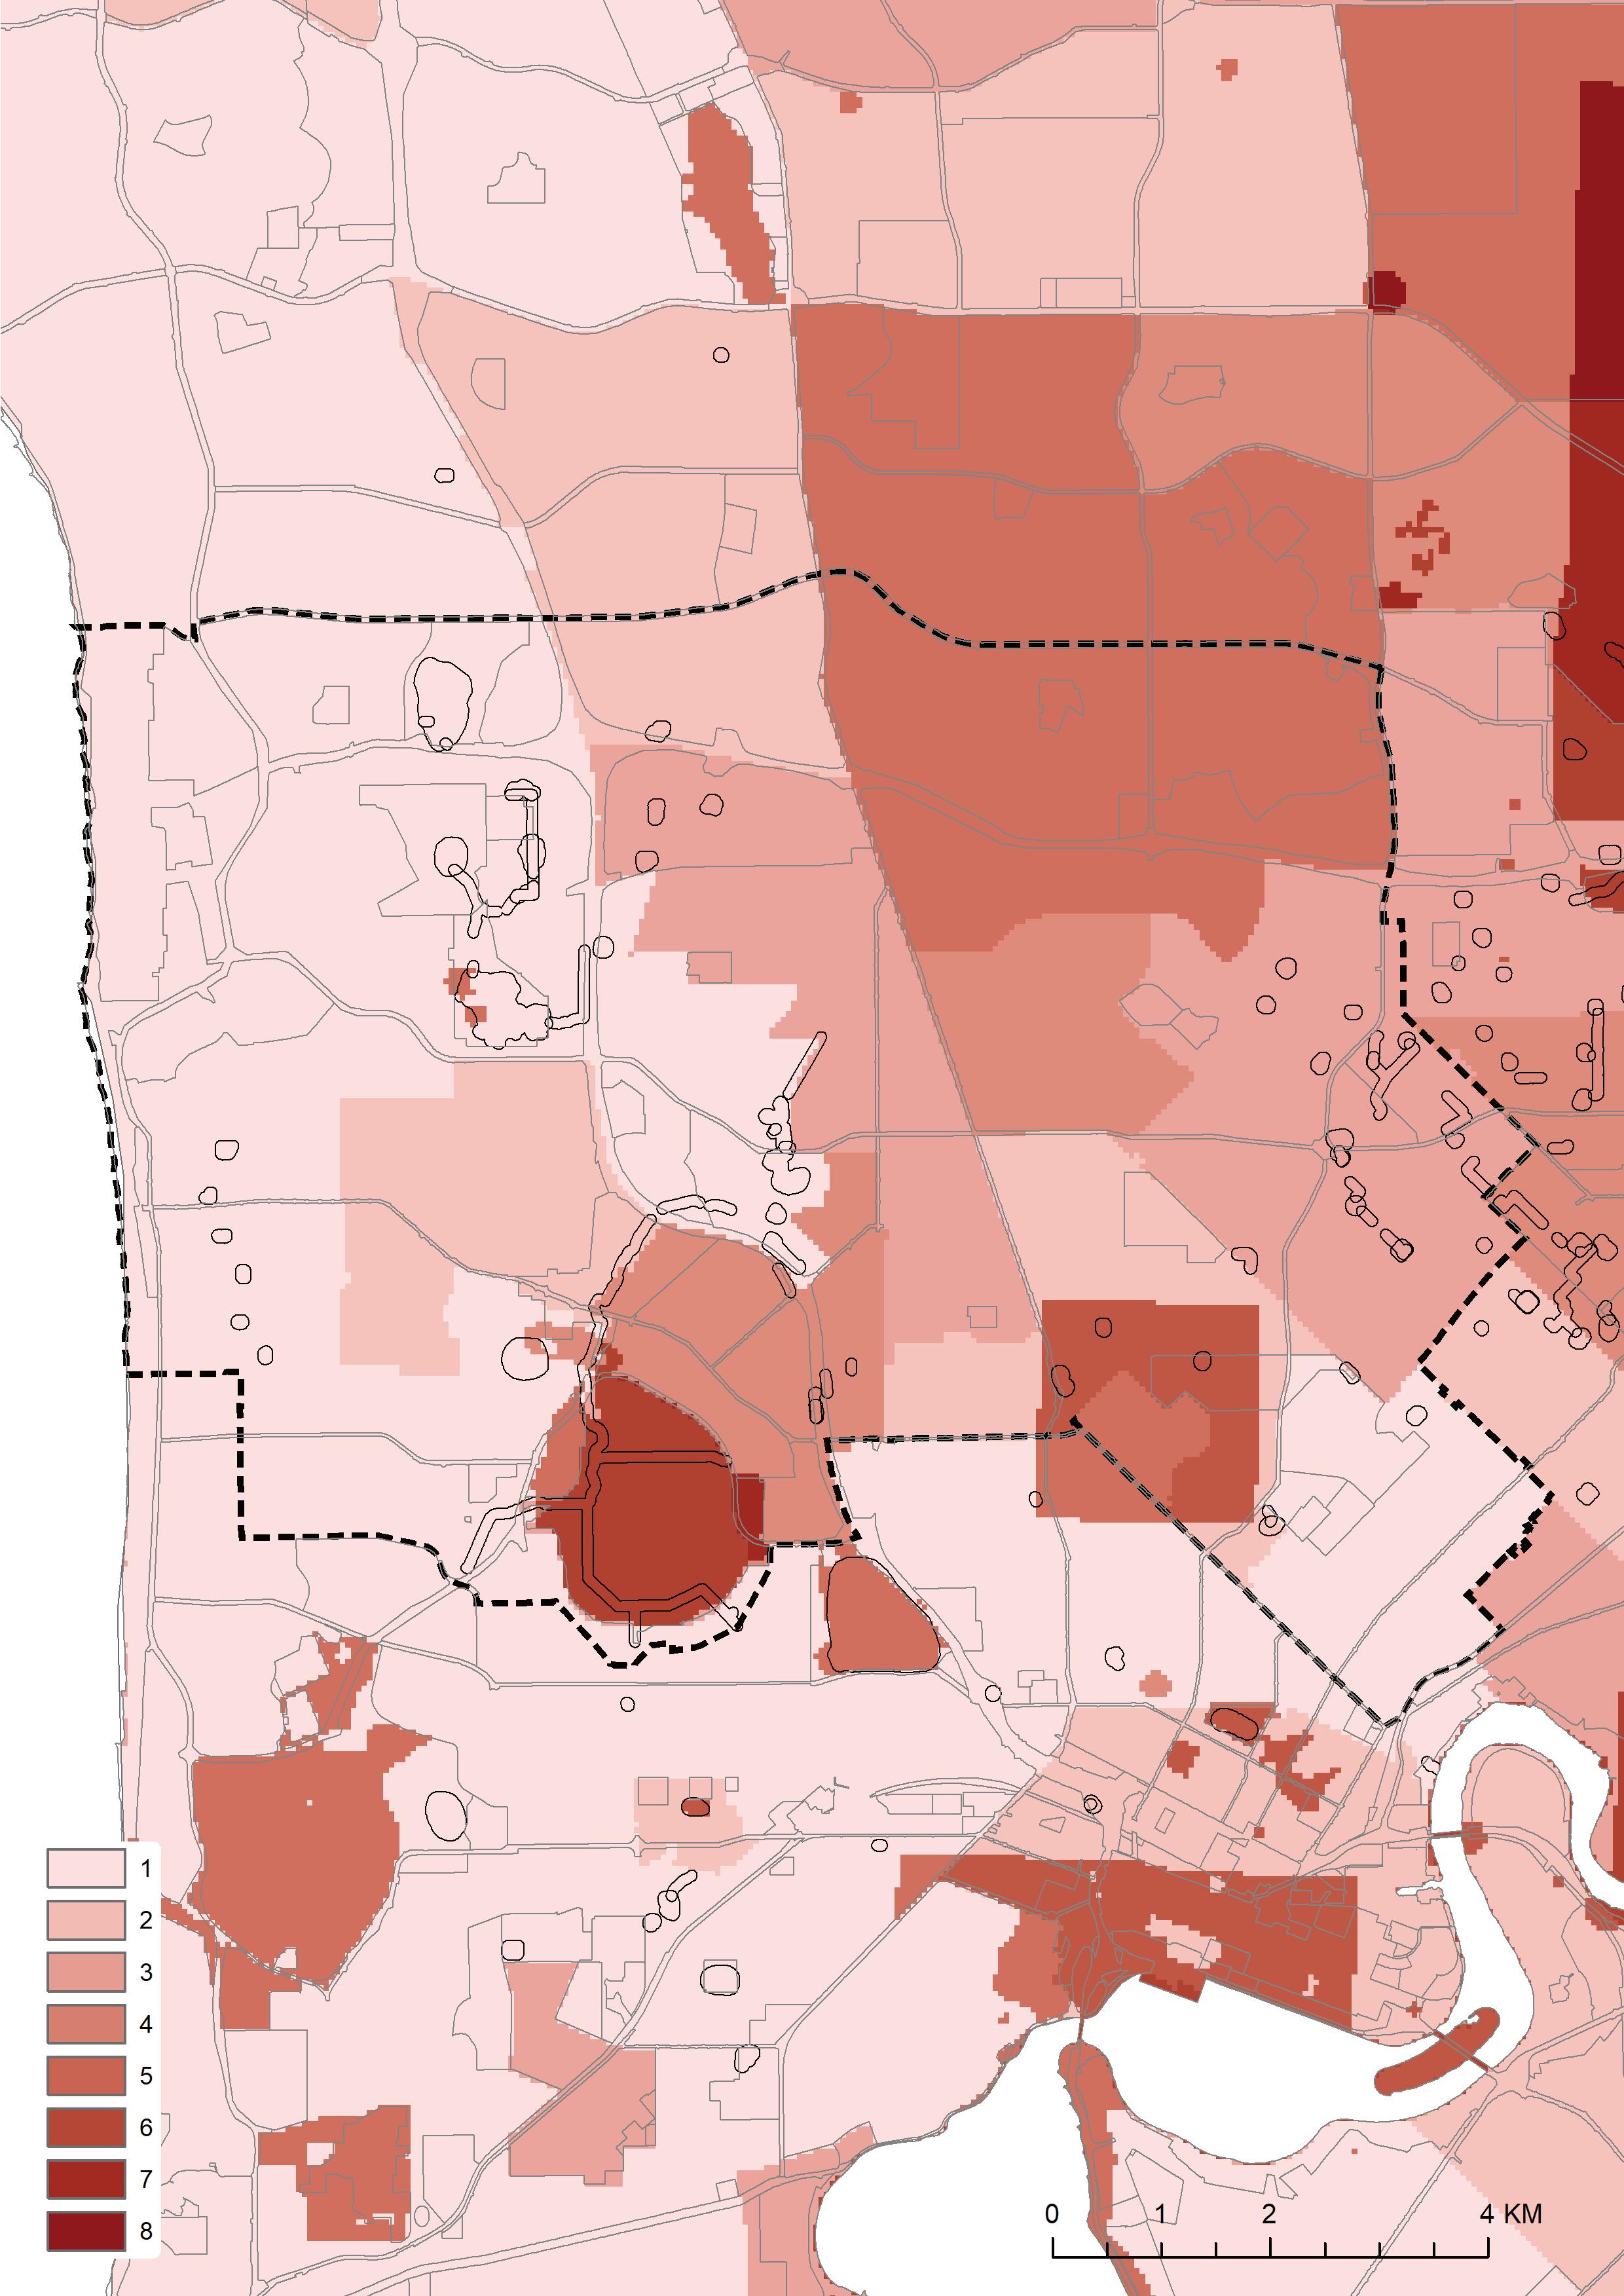
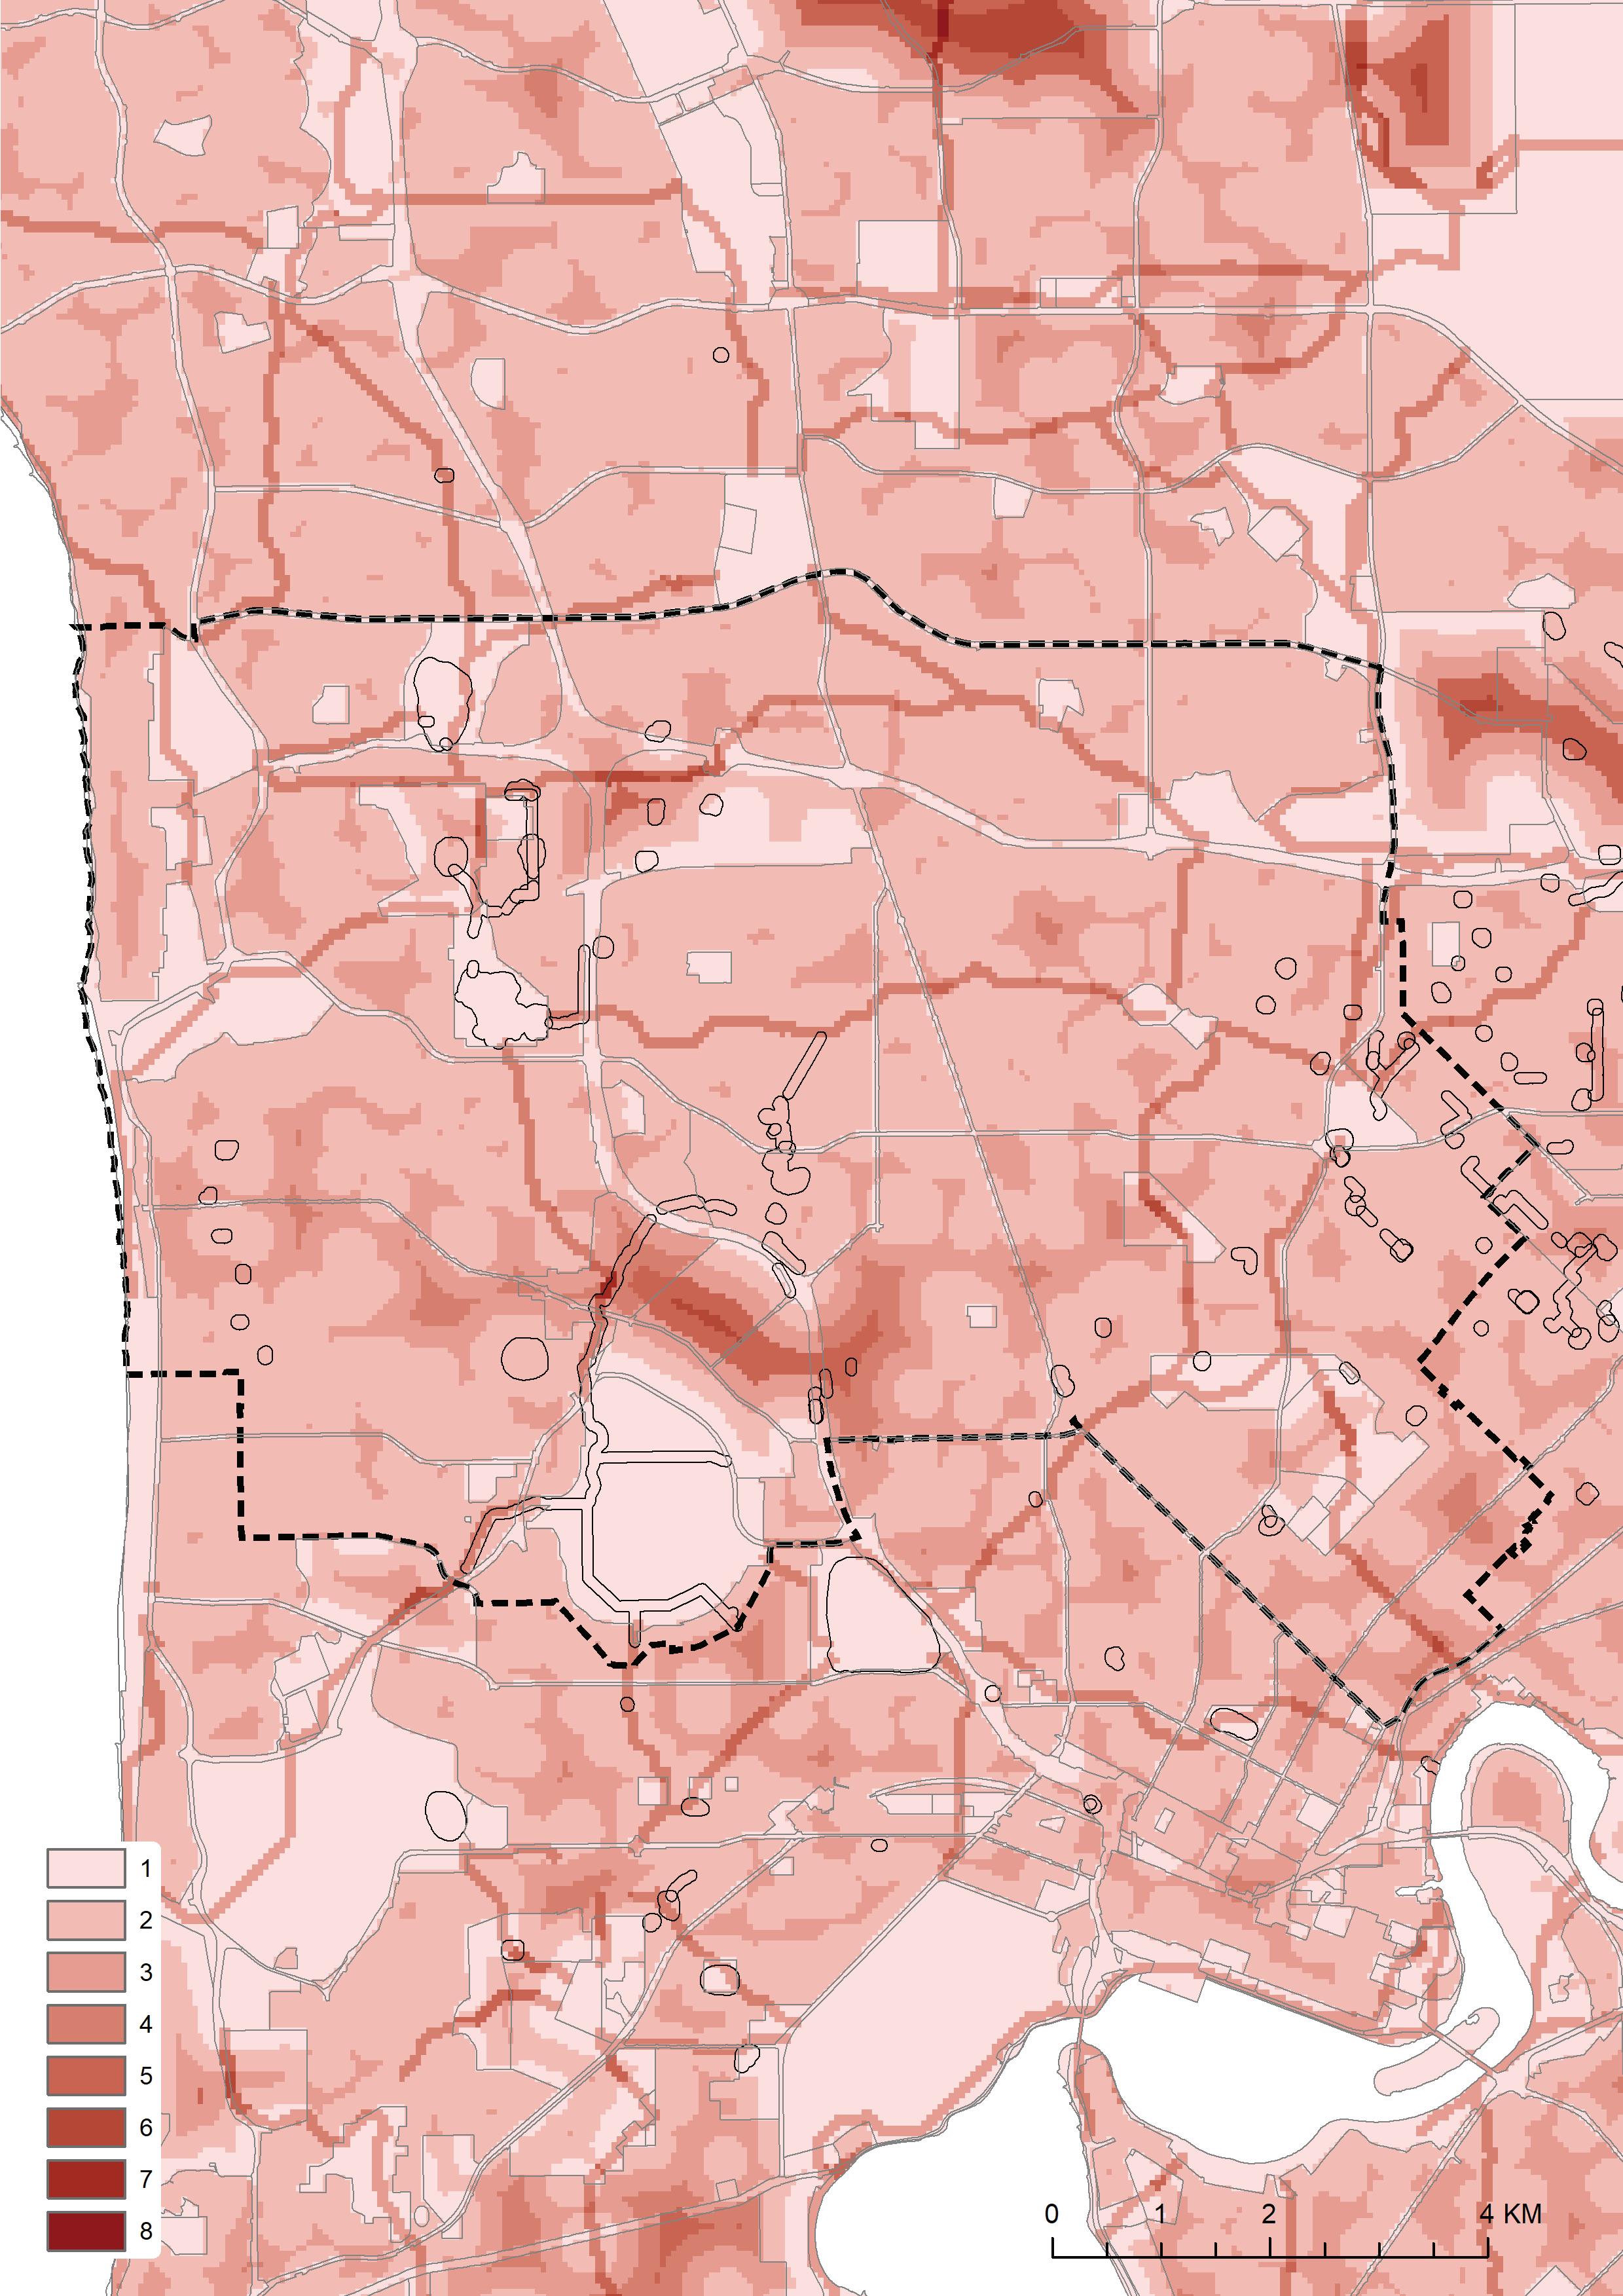
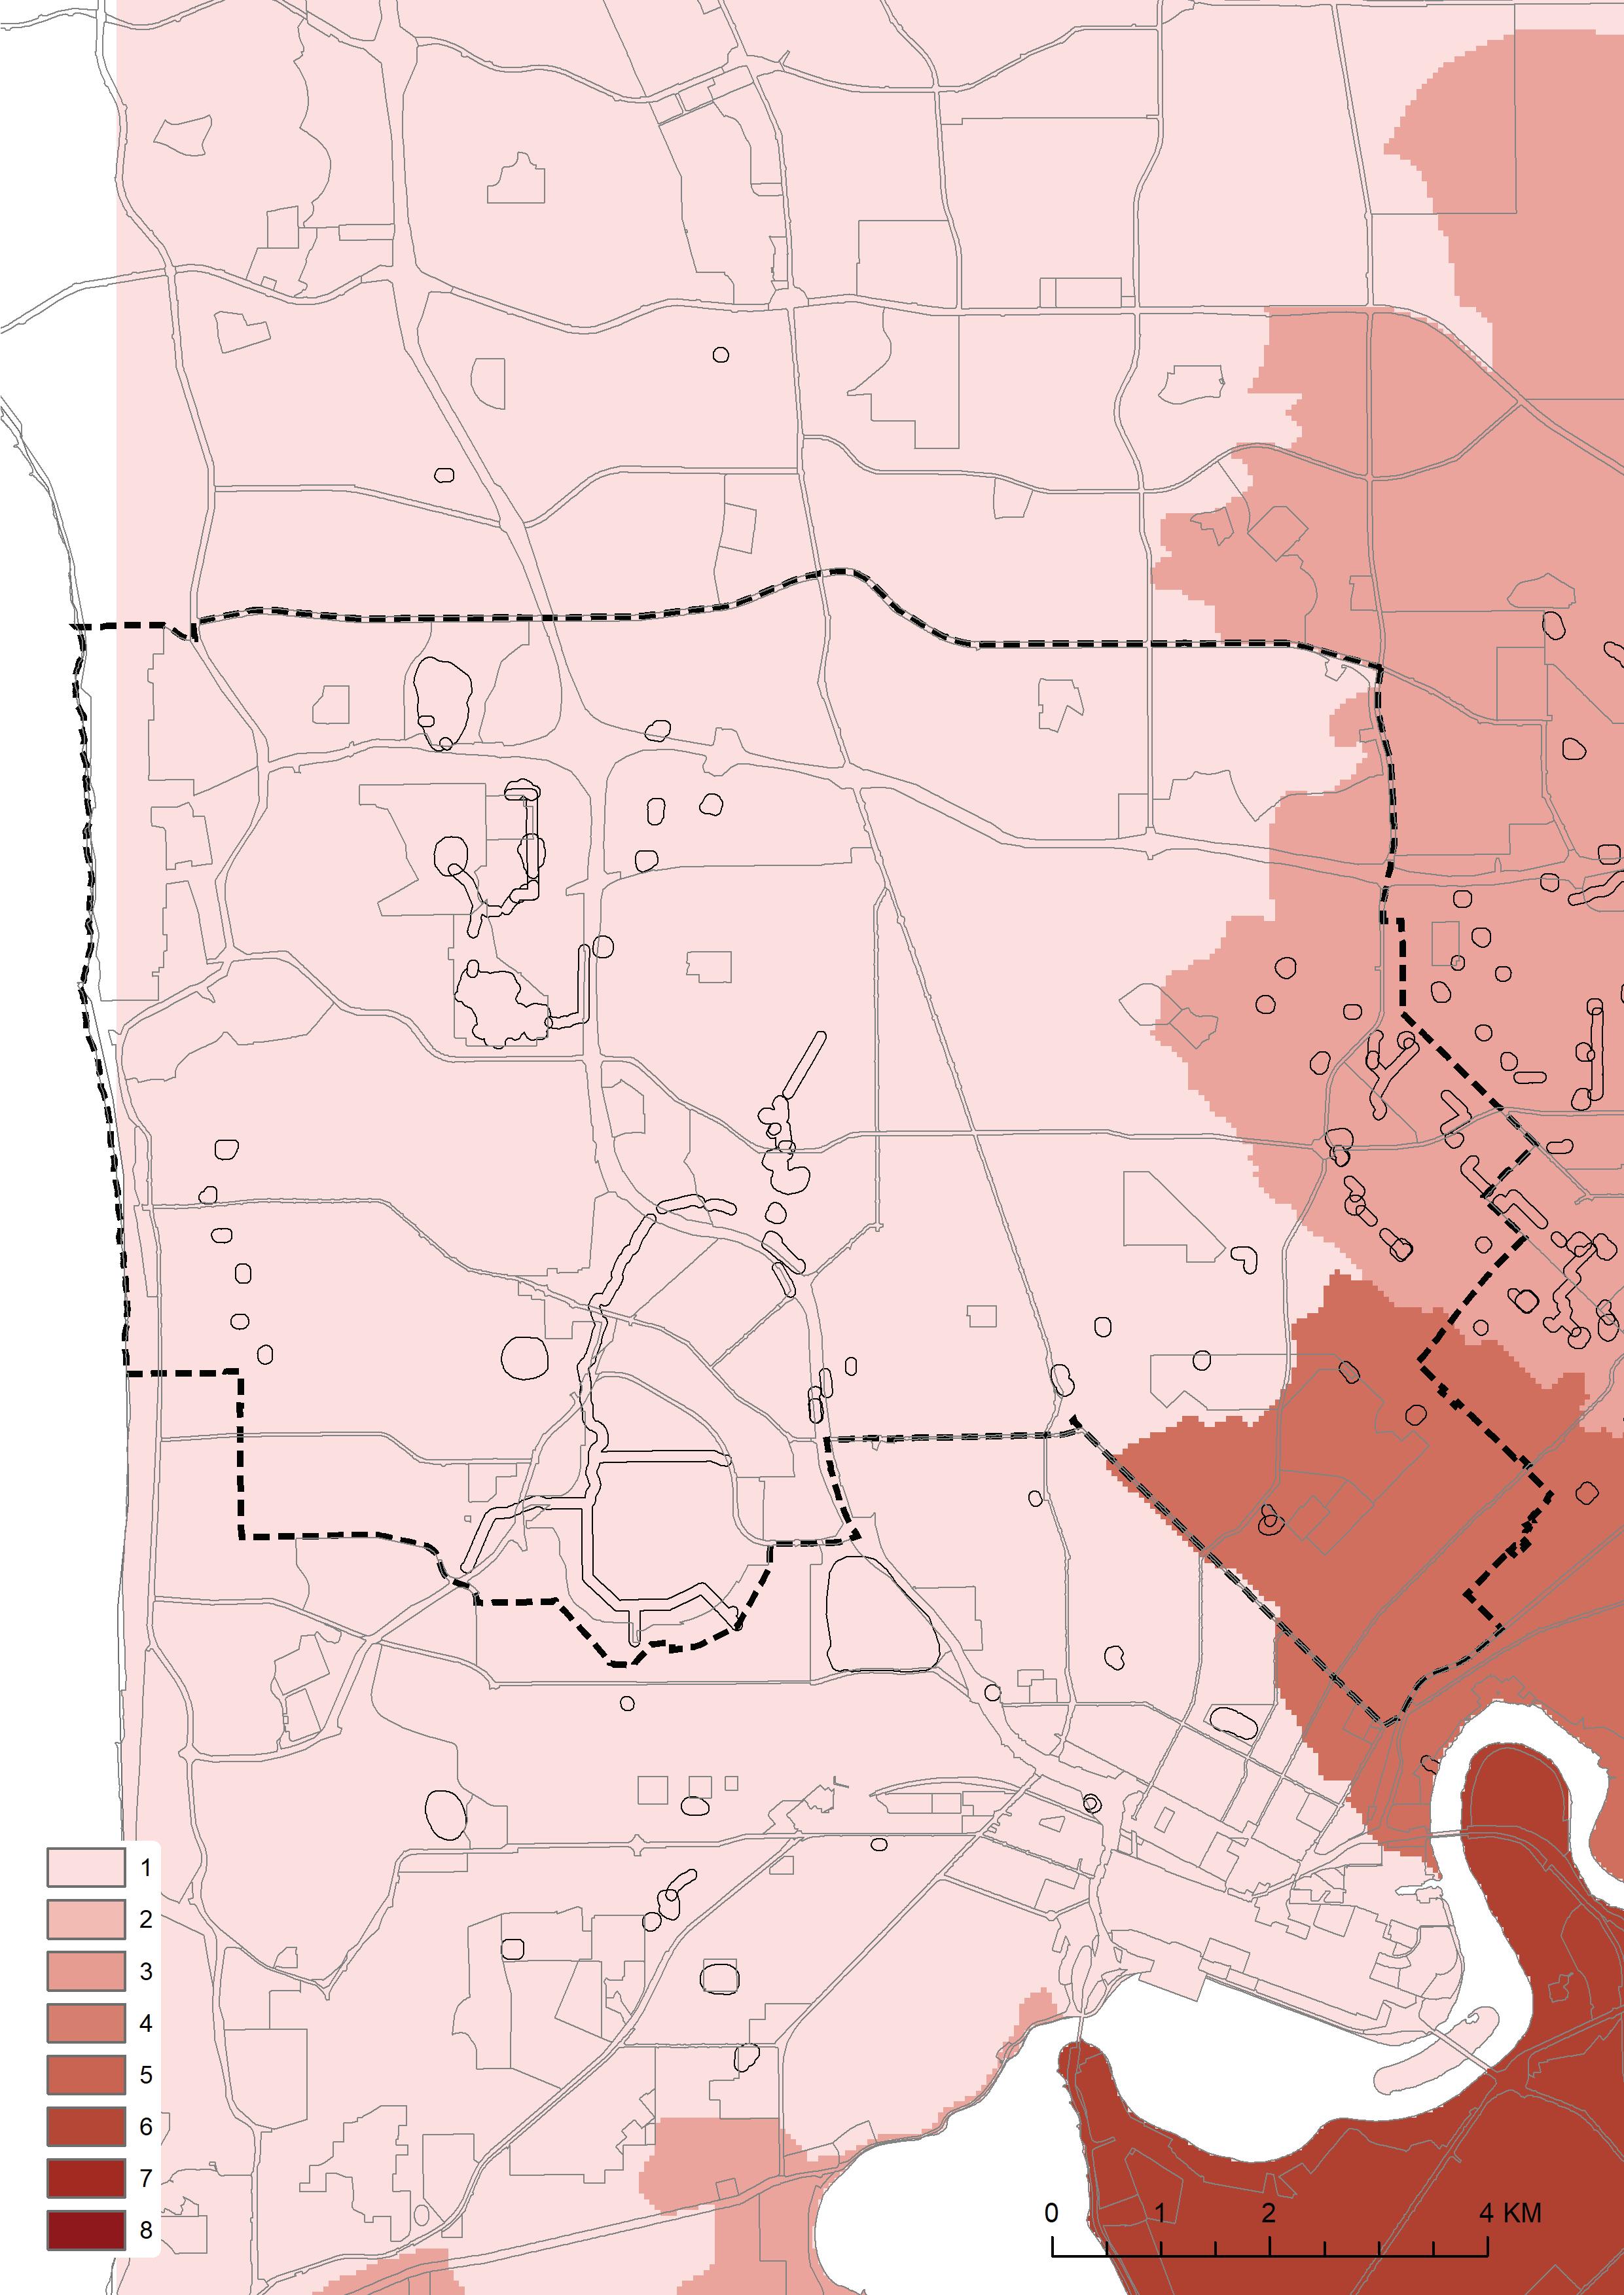
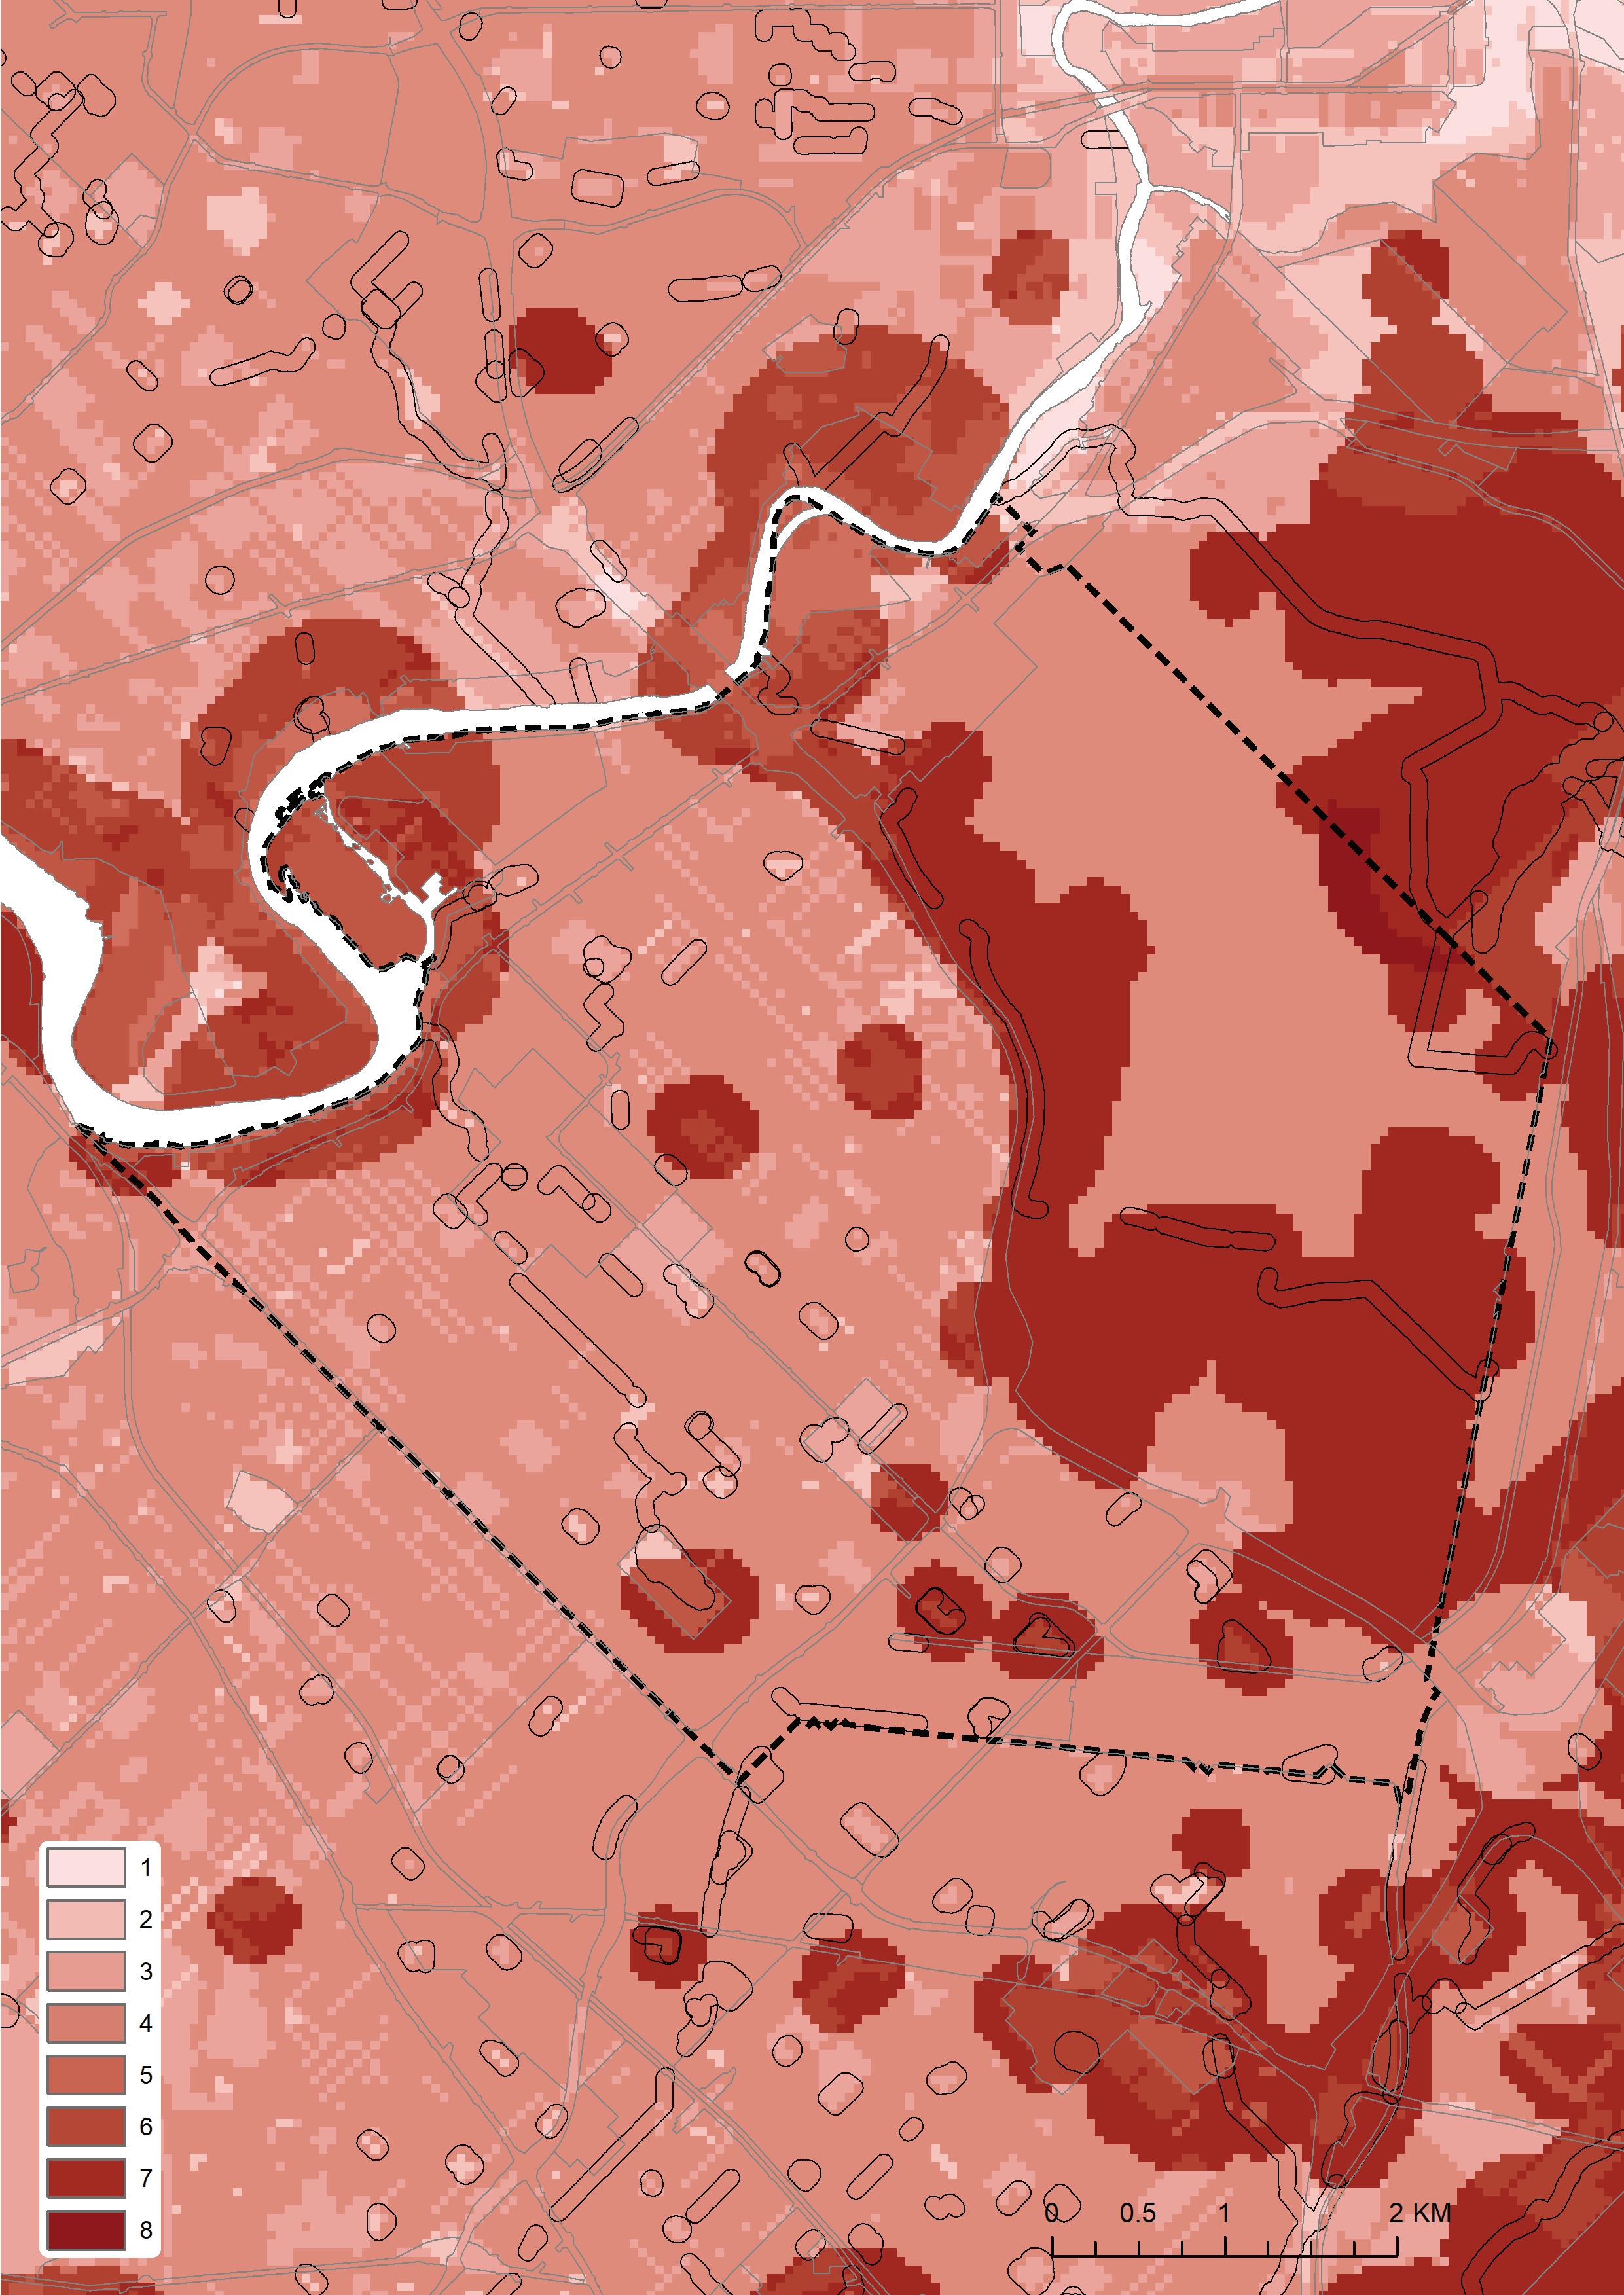
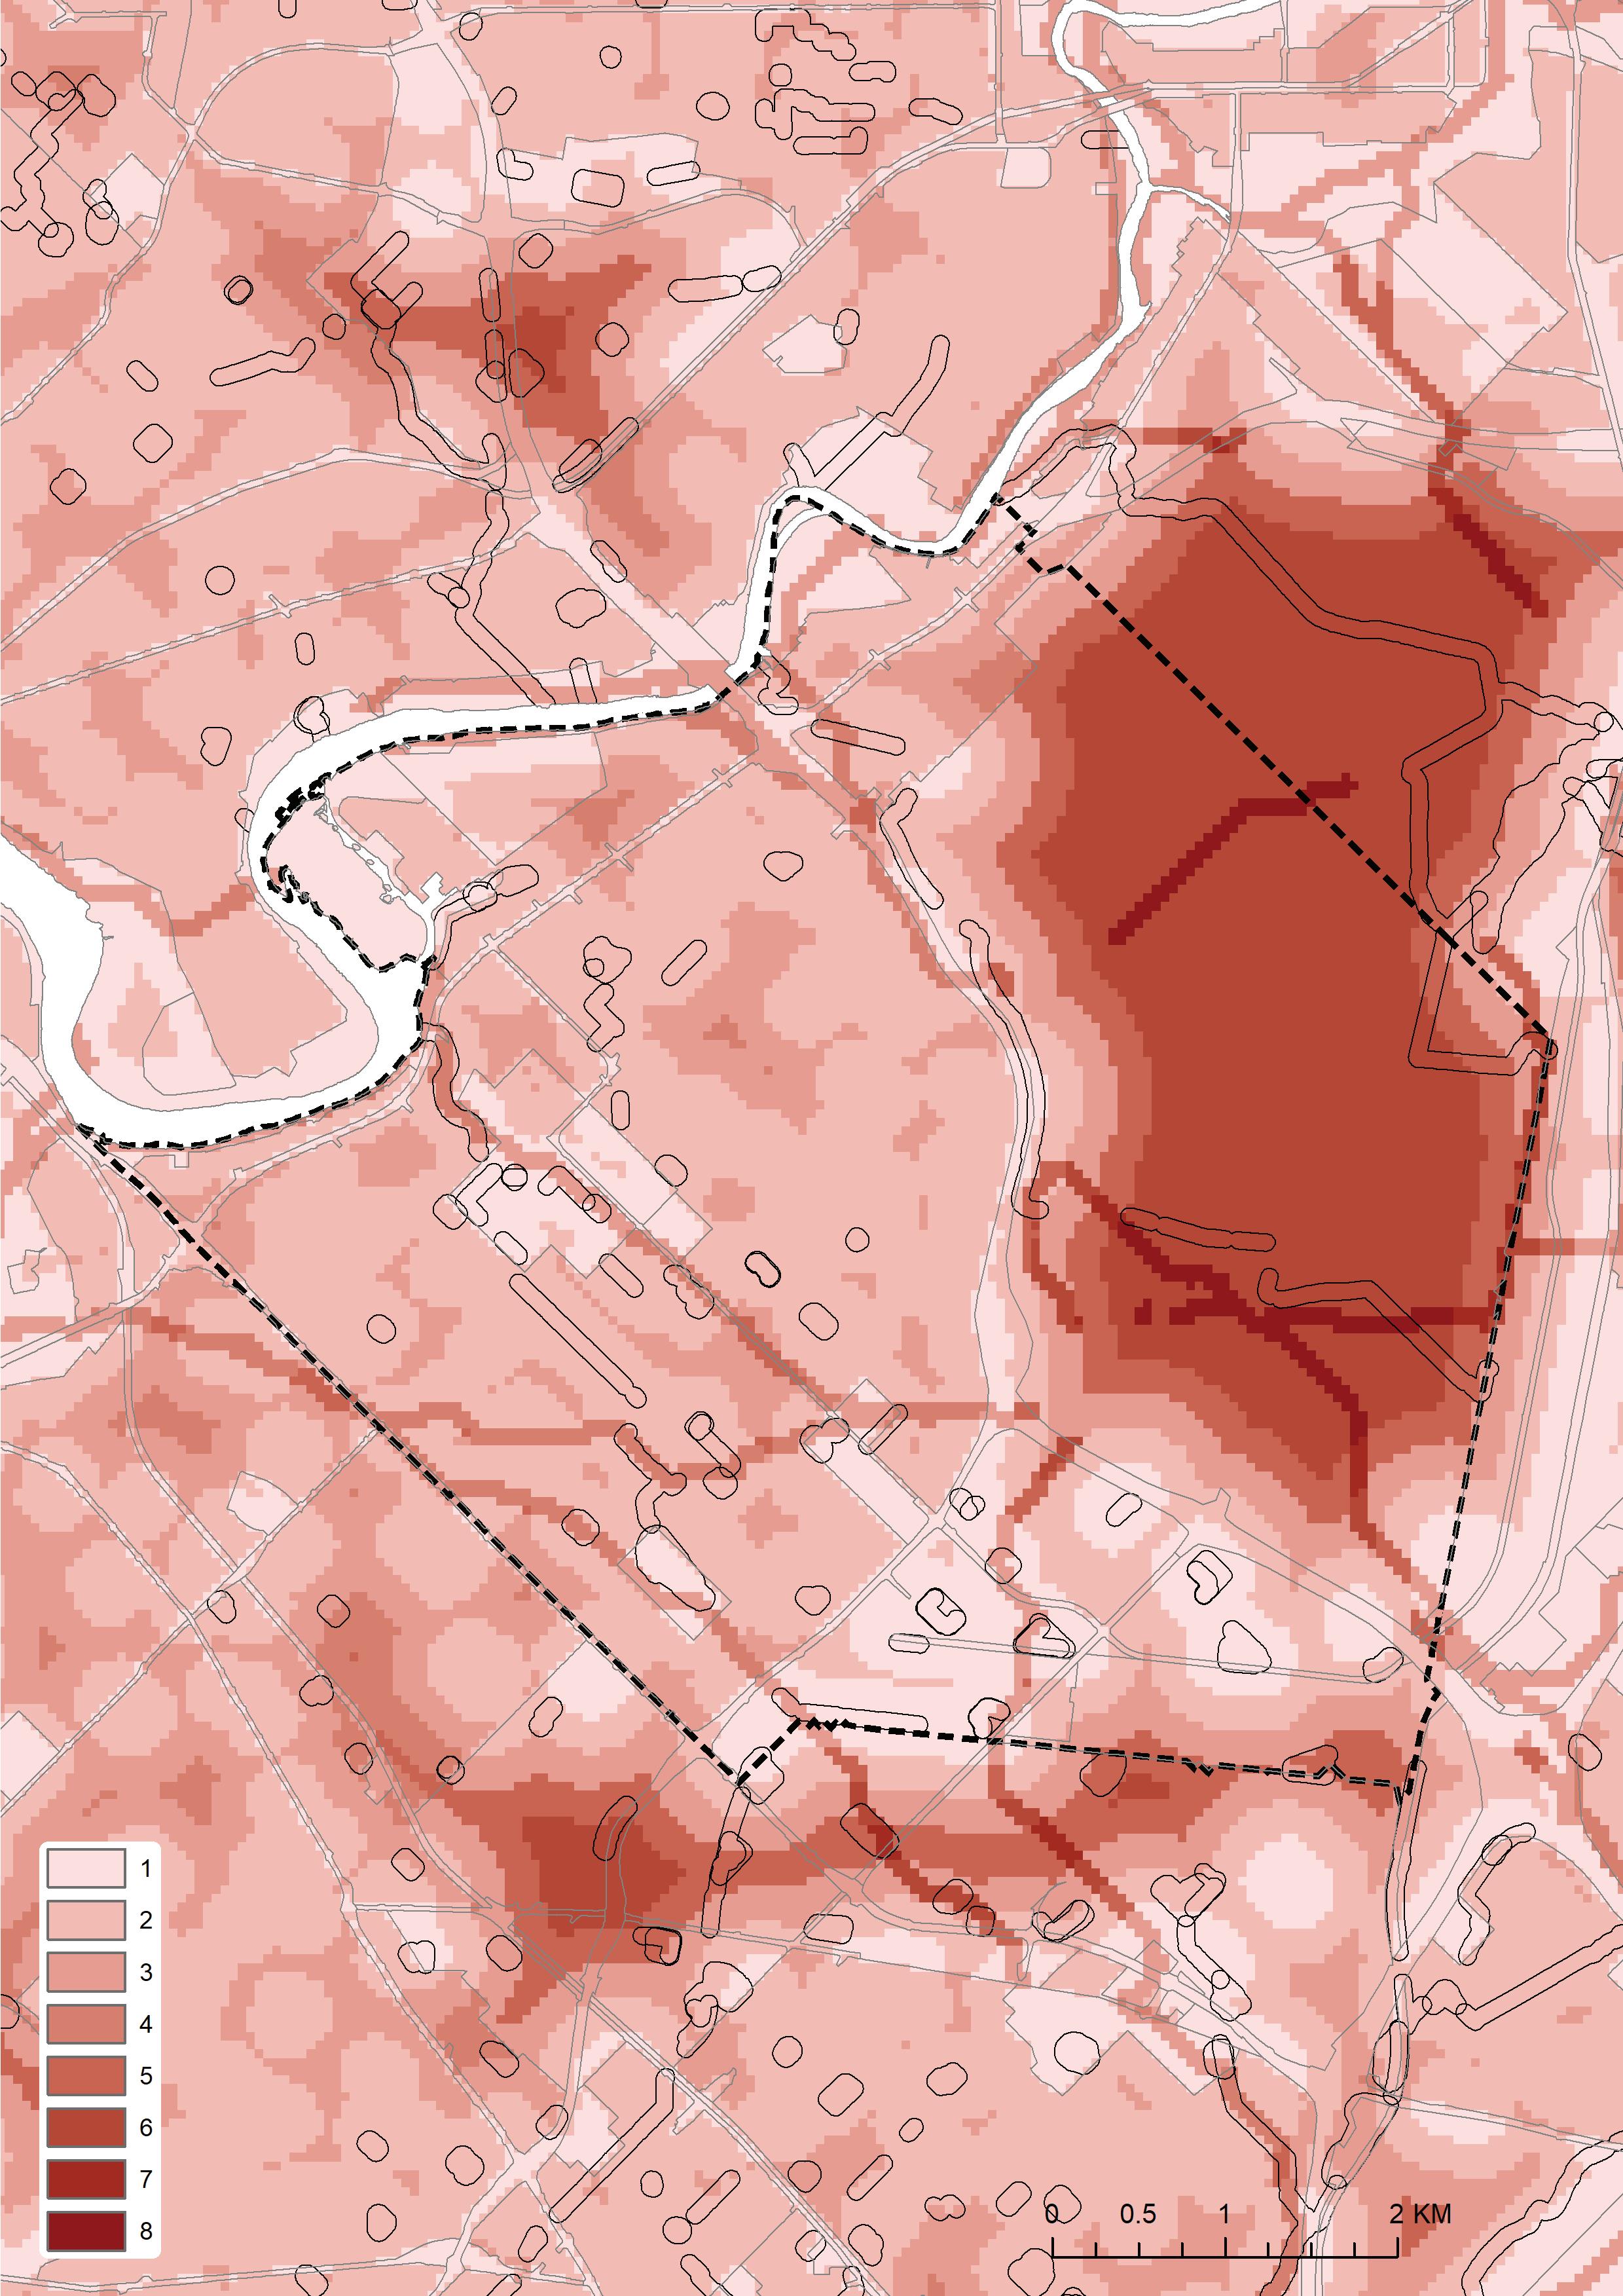
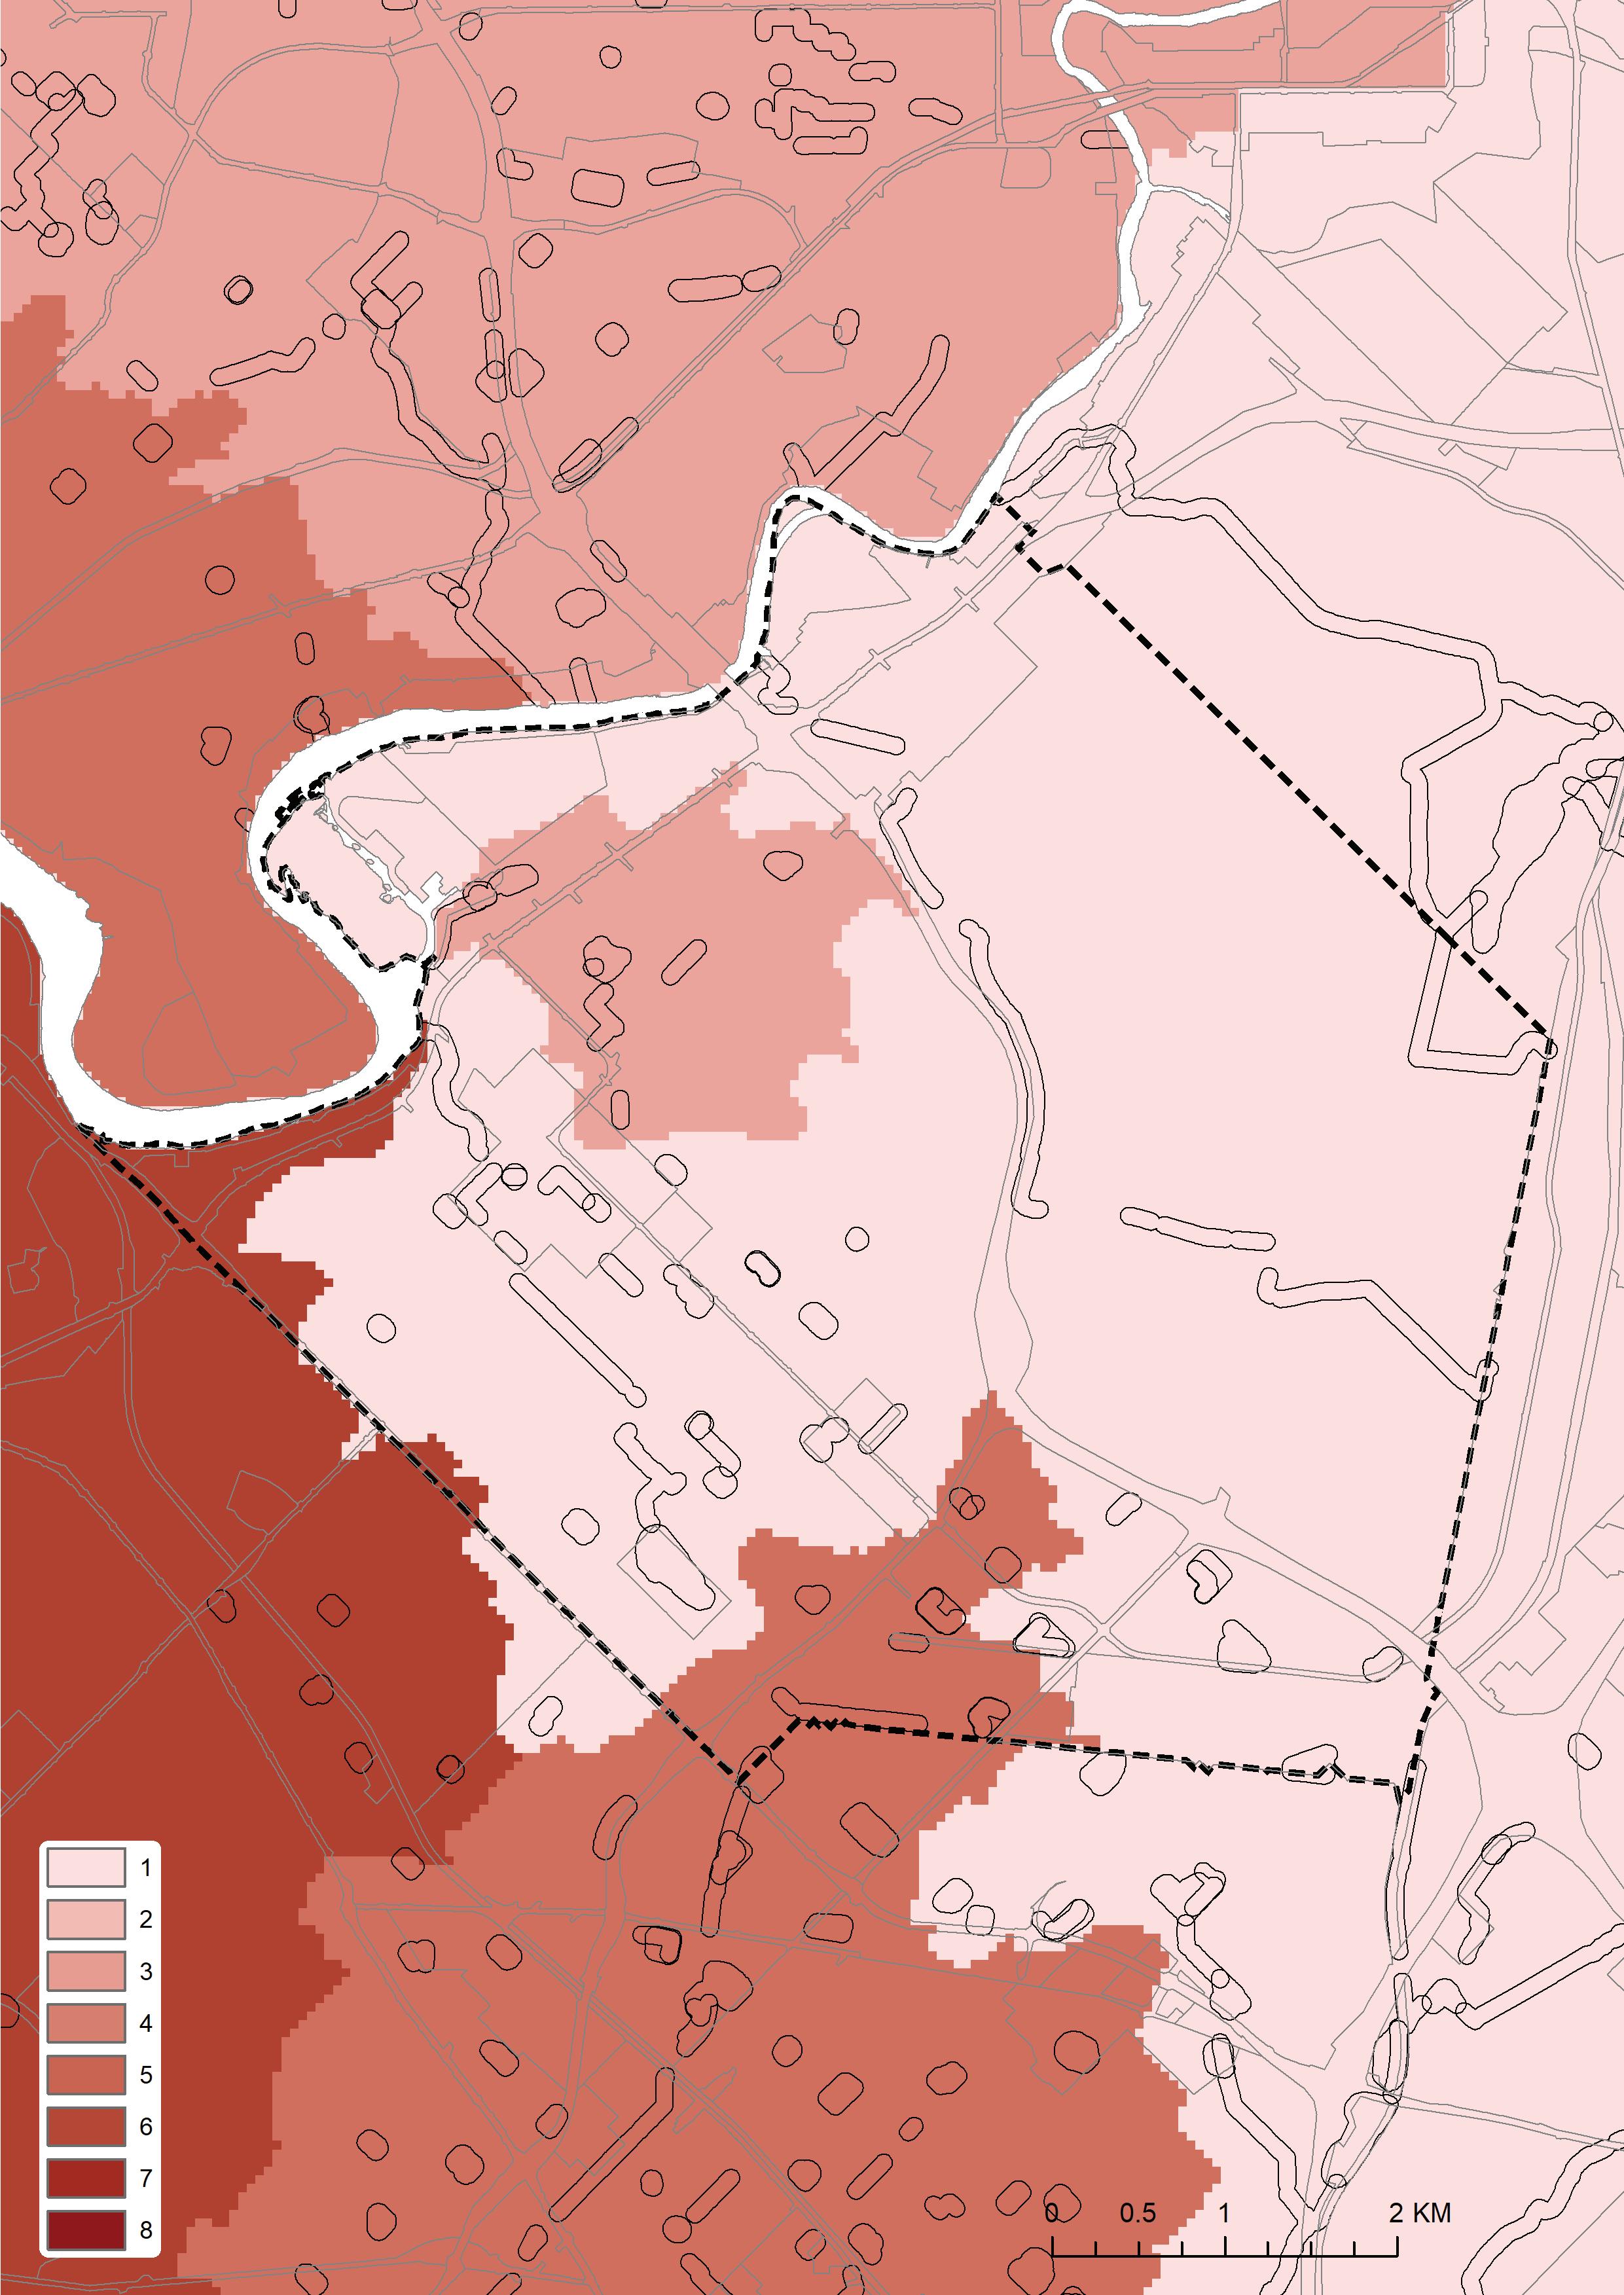
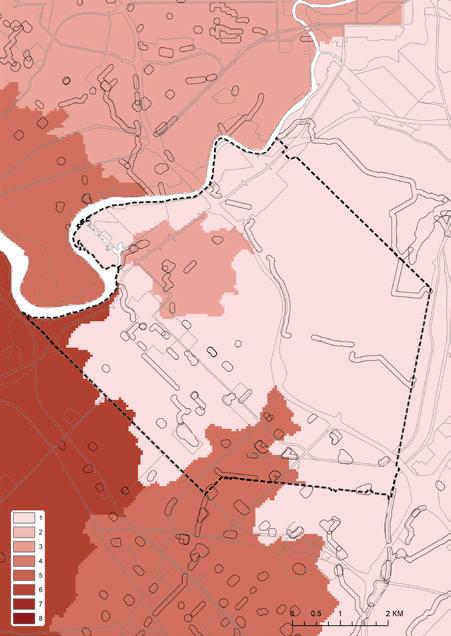
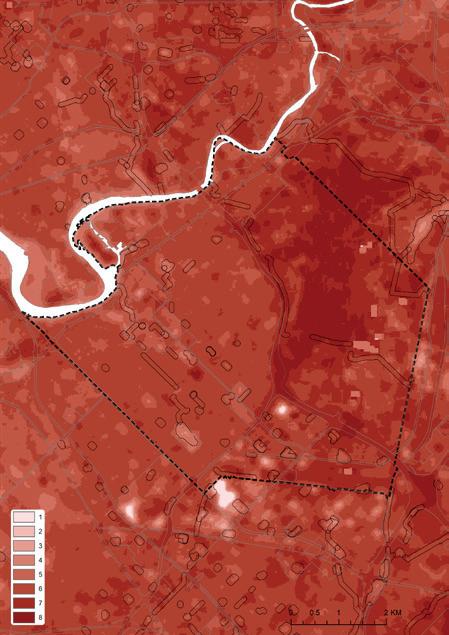
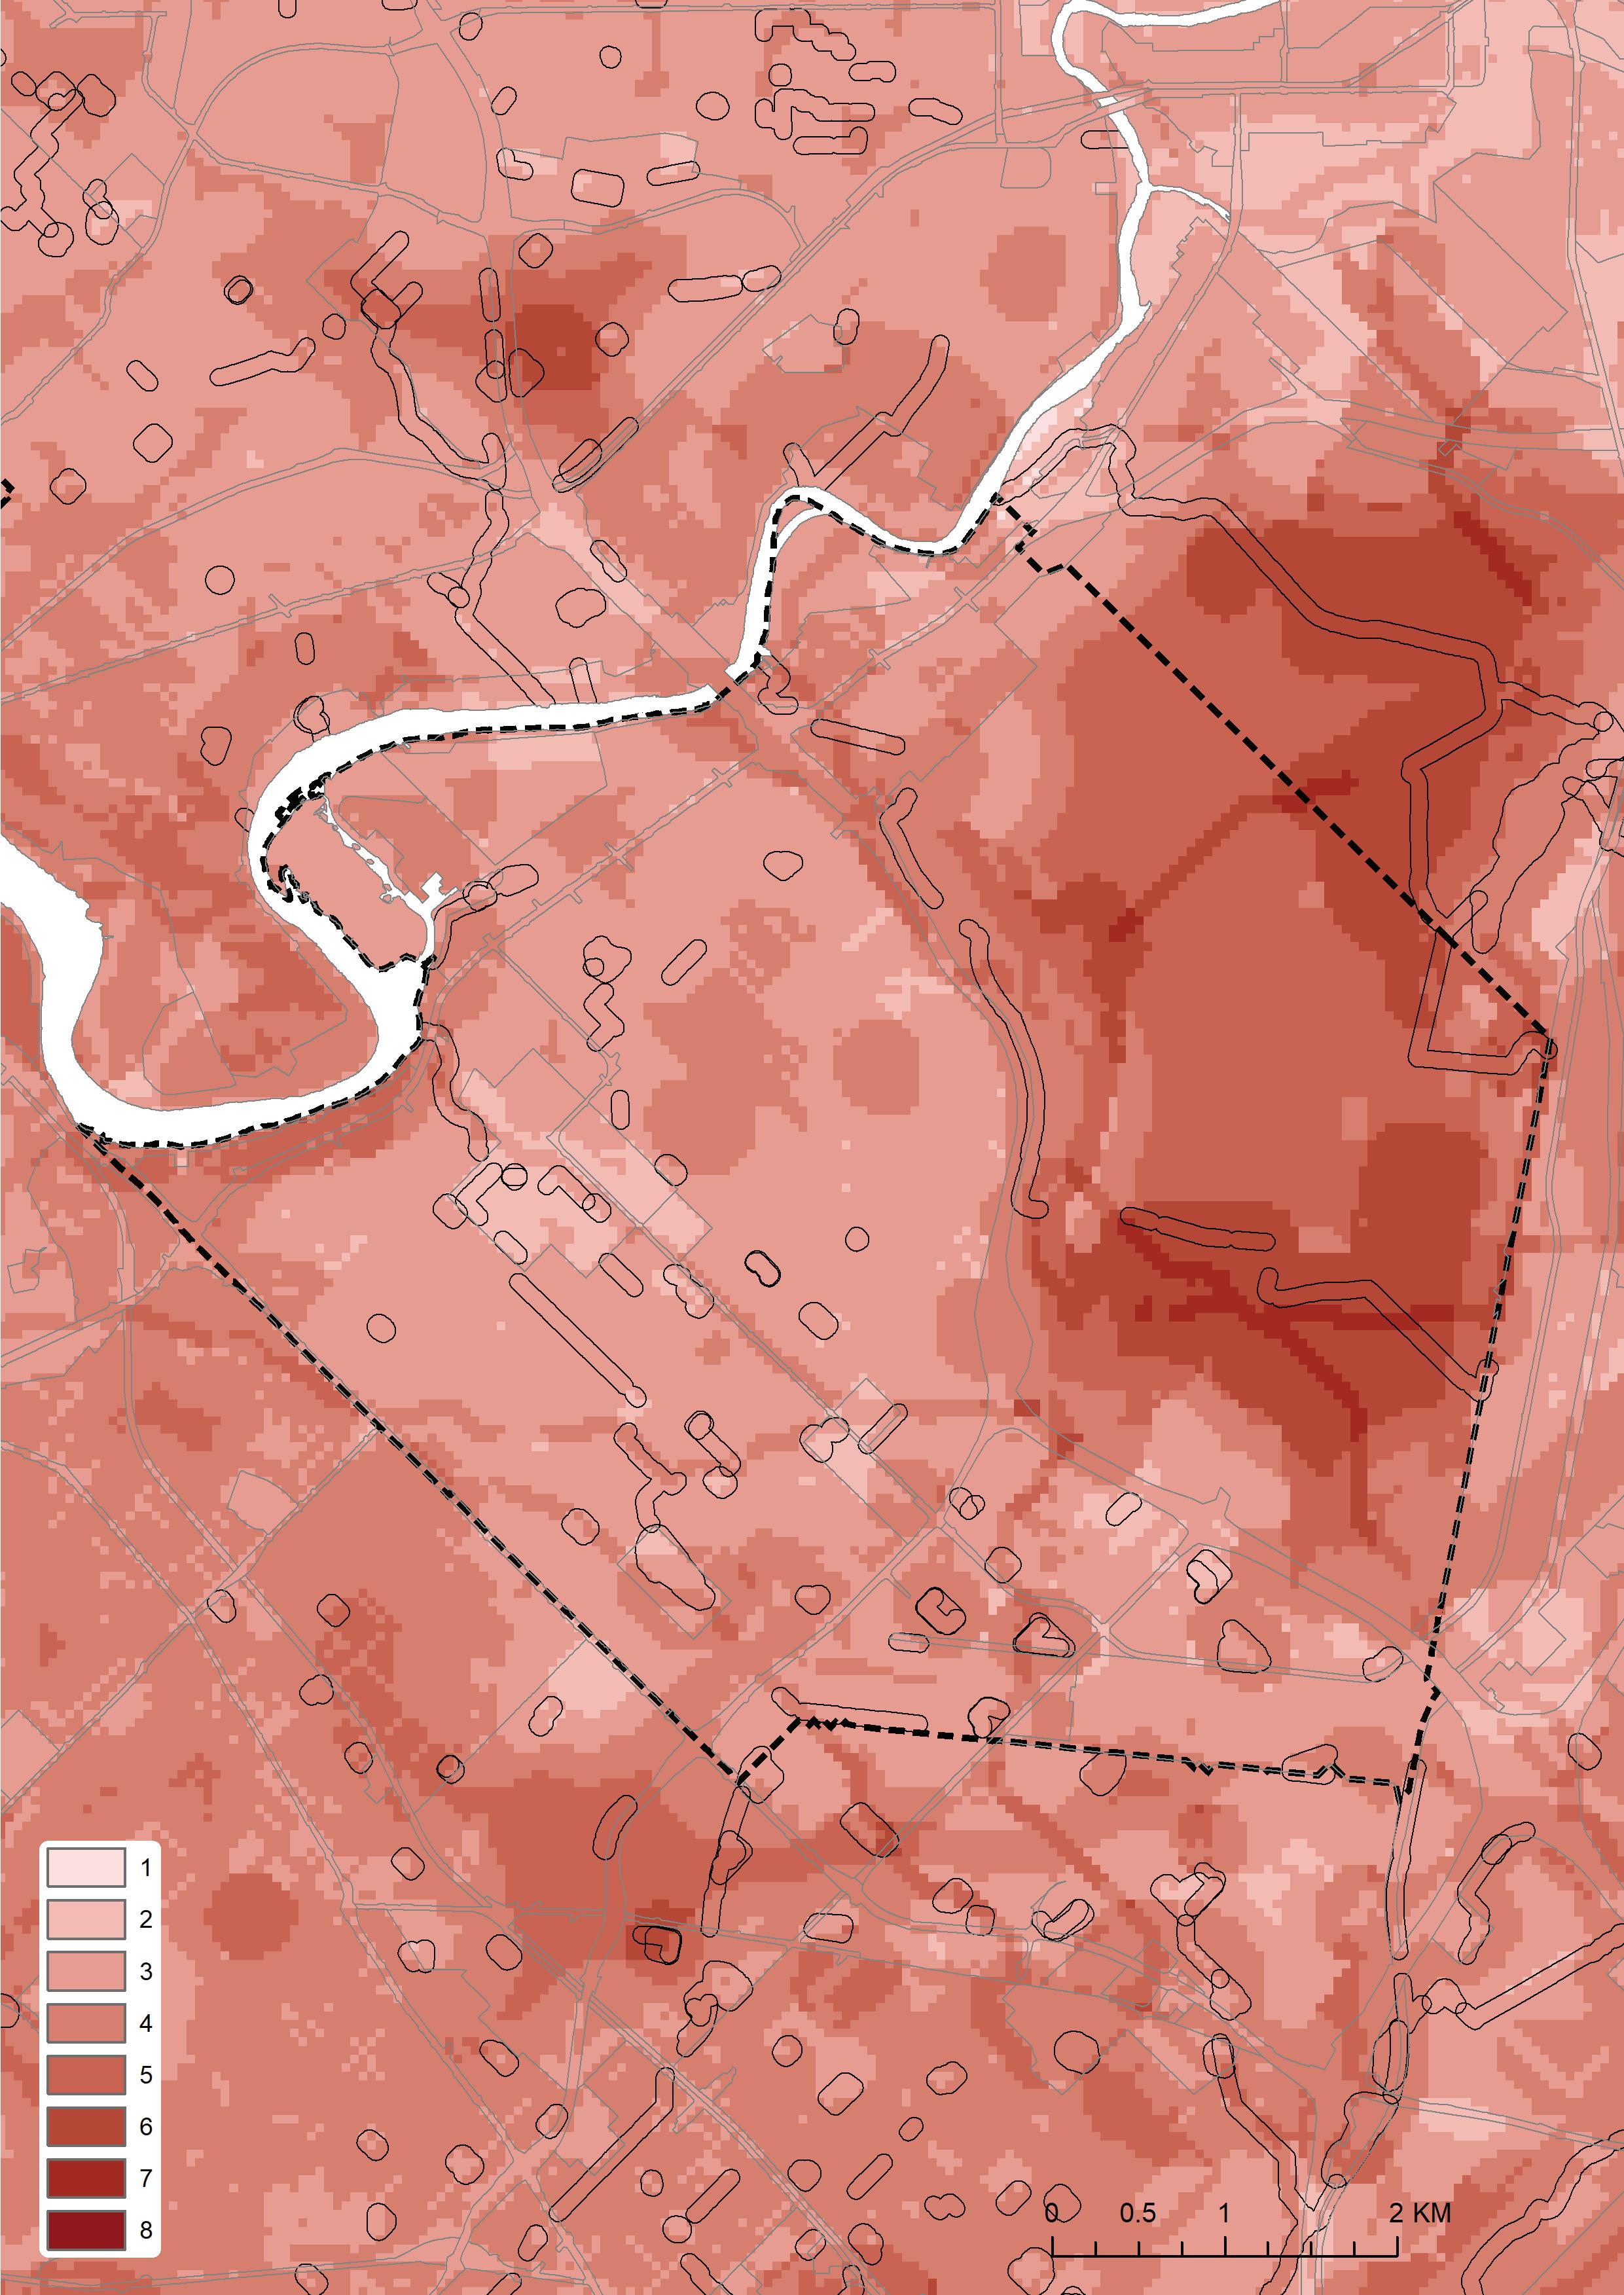
The mapping of the sub-models in the following pages reveals areas that should receive the highest priority for green infrastructure upgrades. Areas with a score of one denote very low priority, four medium priority and eight very high priority.
15
Classification table: This table shows the respective weightings of the sub-models and constituent geospatial layers. The weightings were established by the authors using a pair-wise comparison model.
Geospatial layer Classification Preference score Submodel weighting Factor weighting Dataset Climate submodel 9 Land surface temperature 264-301 301-302 302-304 304-307 307-310 310-312 312-315 315-318 318-329 1 2 3 4 5 6 7 8 9 50 CSIRO Urban heat island -45- -10 -10- -9 -9- -7.3 -7.3- -4 -4 – -1 -1- 1 1-4 4-7 7-17 1 2 3 4 5 6 7 8 9 50 CSIRO Environment submodel 29 Bushfire prone areas Bushfire prone areas Non bushfire prone areas 1 9 6.7 Fire and Emergency services Urban forest canopy cover (%) 0-5 5-10 10-15 15-20 20-25 25-30 30-35 35-40 40-100 9 8 7 6 5 4 3 2 1 33.3 Department of Planning Lands and Heritage Threatened ecological communities Vulnerable Endangered Critically endangered 7 8 9 60 Department of Biodiversity Conservation and Attractions Hydrology submodel 14 Required phosphorous reduction 0-9 10-44 45-100 1 5 9 50 Department of Biodiversity Conservation and Attractions Required nitrogen reduction 0-9 10-44 45-100 1 5 9 50 Department of Biodiversity
Conservation and Attarctions Planning submodel 44 Park buffers 0-200m 200-400m 400-600m 800-1000m 1000m + 1 3 5 7 9 60 AUDRC Naturelink NatureLink area Non- NatureLink area 9 1 30 NatureLink Perth Landuse Industrial Urban Central city 1 7 9 10 Department of Planning Lands and Heritage Societal submodel 4 Low or no exercise per 100 people 46-49 50-55 56-58 59-61 62-64 65-67 68-70 71-73 74-76 1 2 3 4 5 6 7 8 9 17.39 PHIDU/ Torrens University Psychological distress per 100 people 8-9 10 11 12 13-14 15 16 17 18-20 1 2 3 4 5 6 7 8 9 39.13 PHIDU/ Torrens University Aboriginal Heritage Places Not a site Lodged Registered site 1 7 9 39.13 Department of Planning Lands and Heritage Socio-Economic Indexes for Areas 1 2 3 4 5 6 7 8 9 9 8 7 6 5 4 3 2 1 4.35 Australian Burea of Statistics
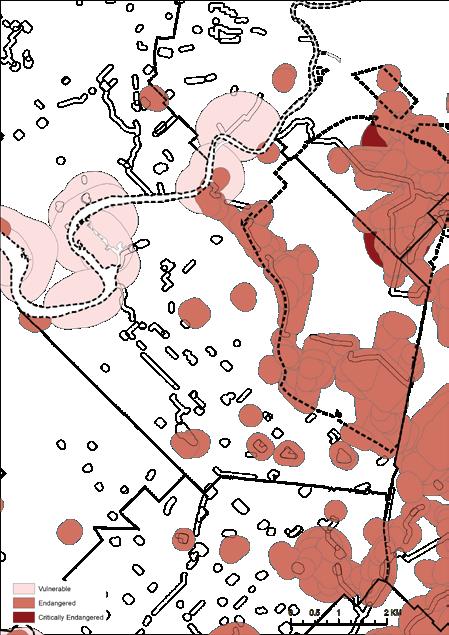
Environment sub-model mapping
City of Stirling
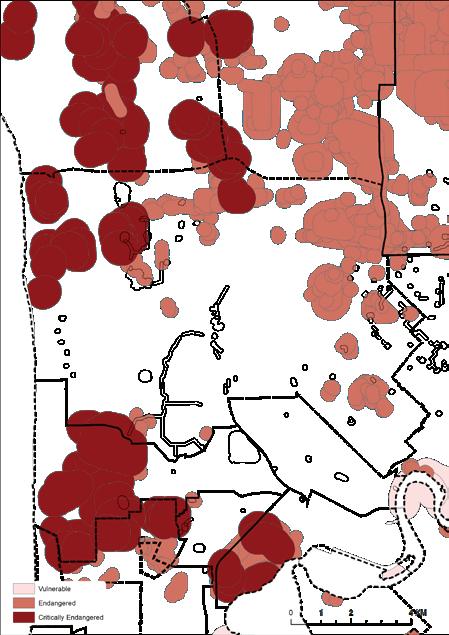
Threatened ecological communities (DCBA)
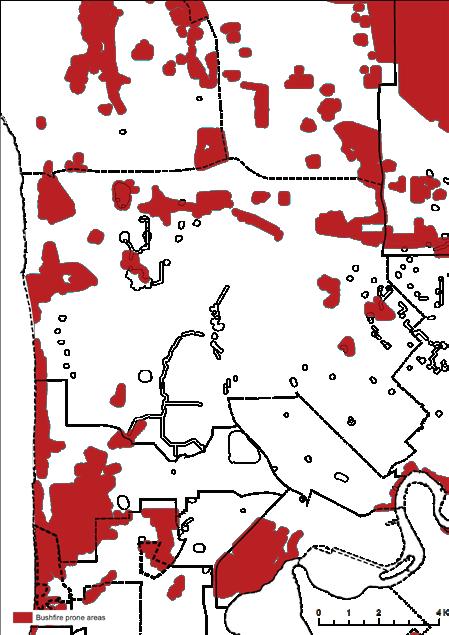
Bushfire prone areas (FES)
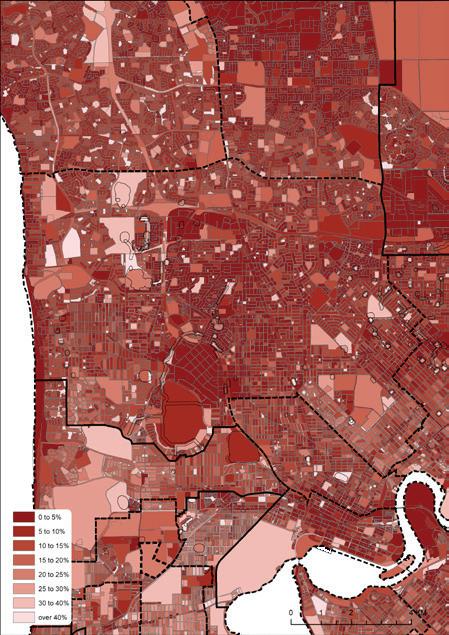
Urban forest cover % (DPLH)
An overlay of the geospatial layers in the environment sub-model. This map shows the drainage land that most require investment and upgrading (with higher scores) according to the presence of Threatened Ecological Species and minimal urban forest cover.
 City of Stirling
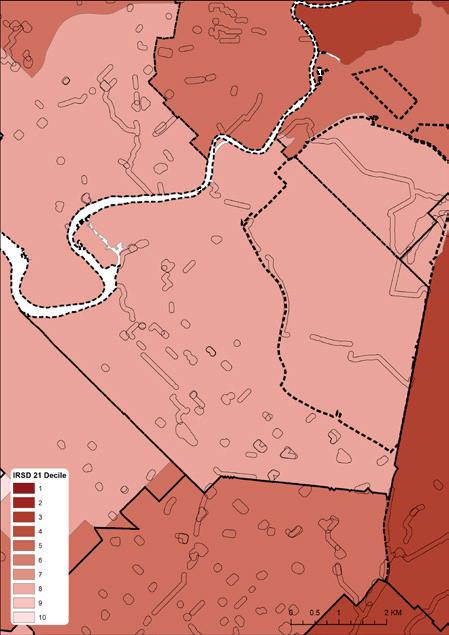
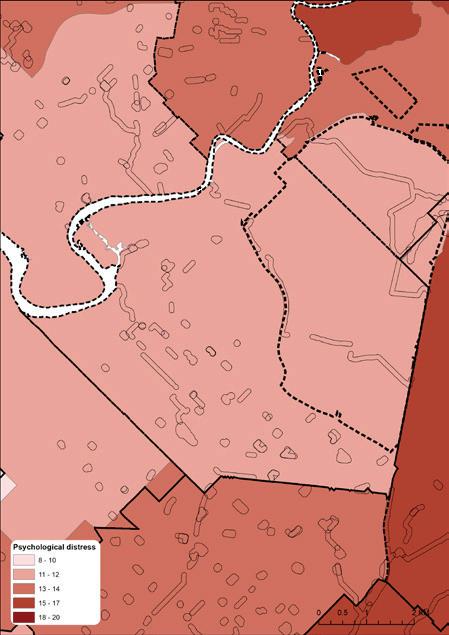
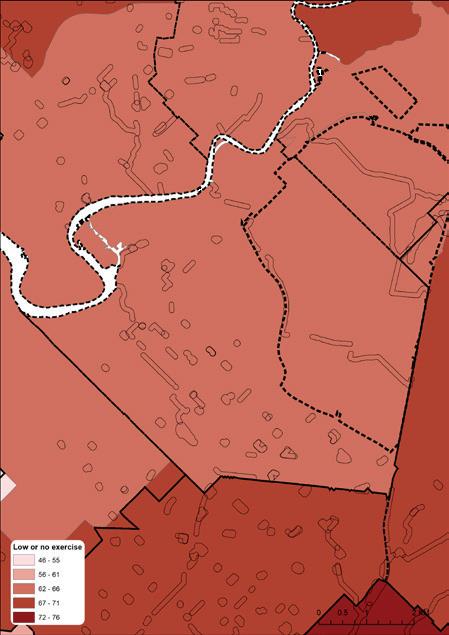
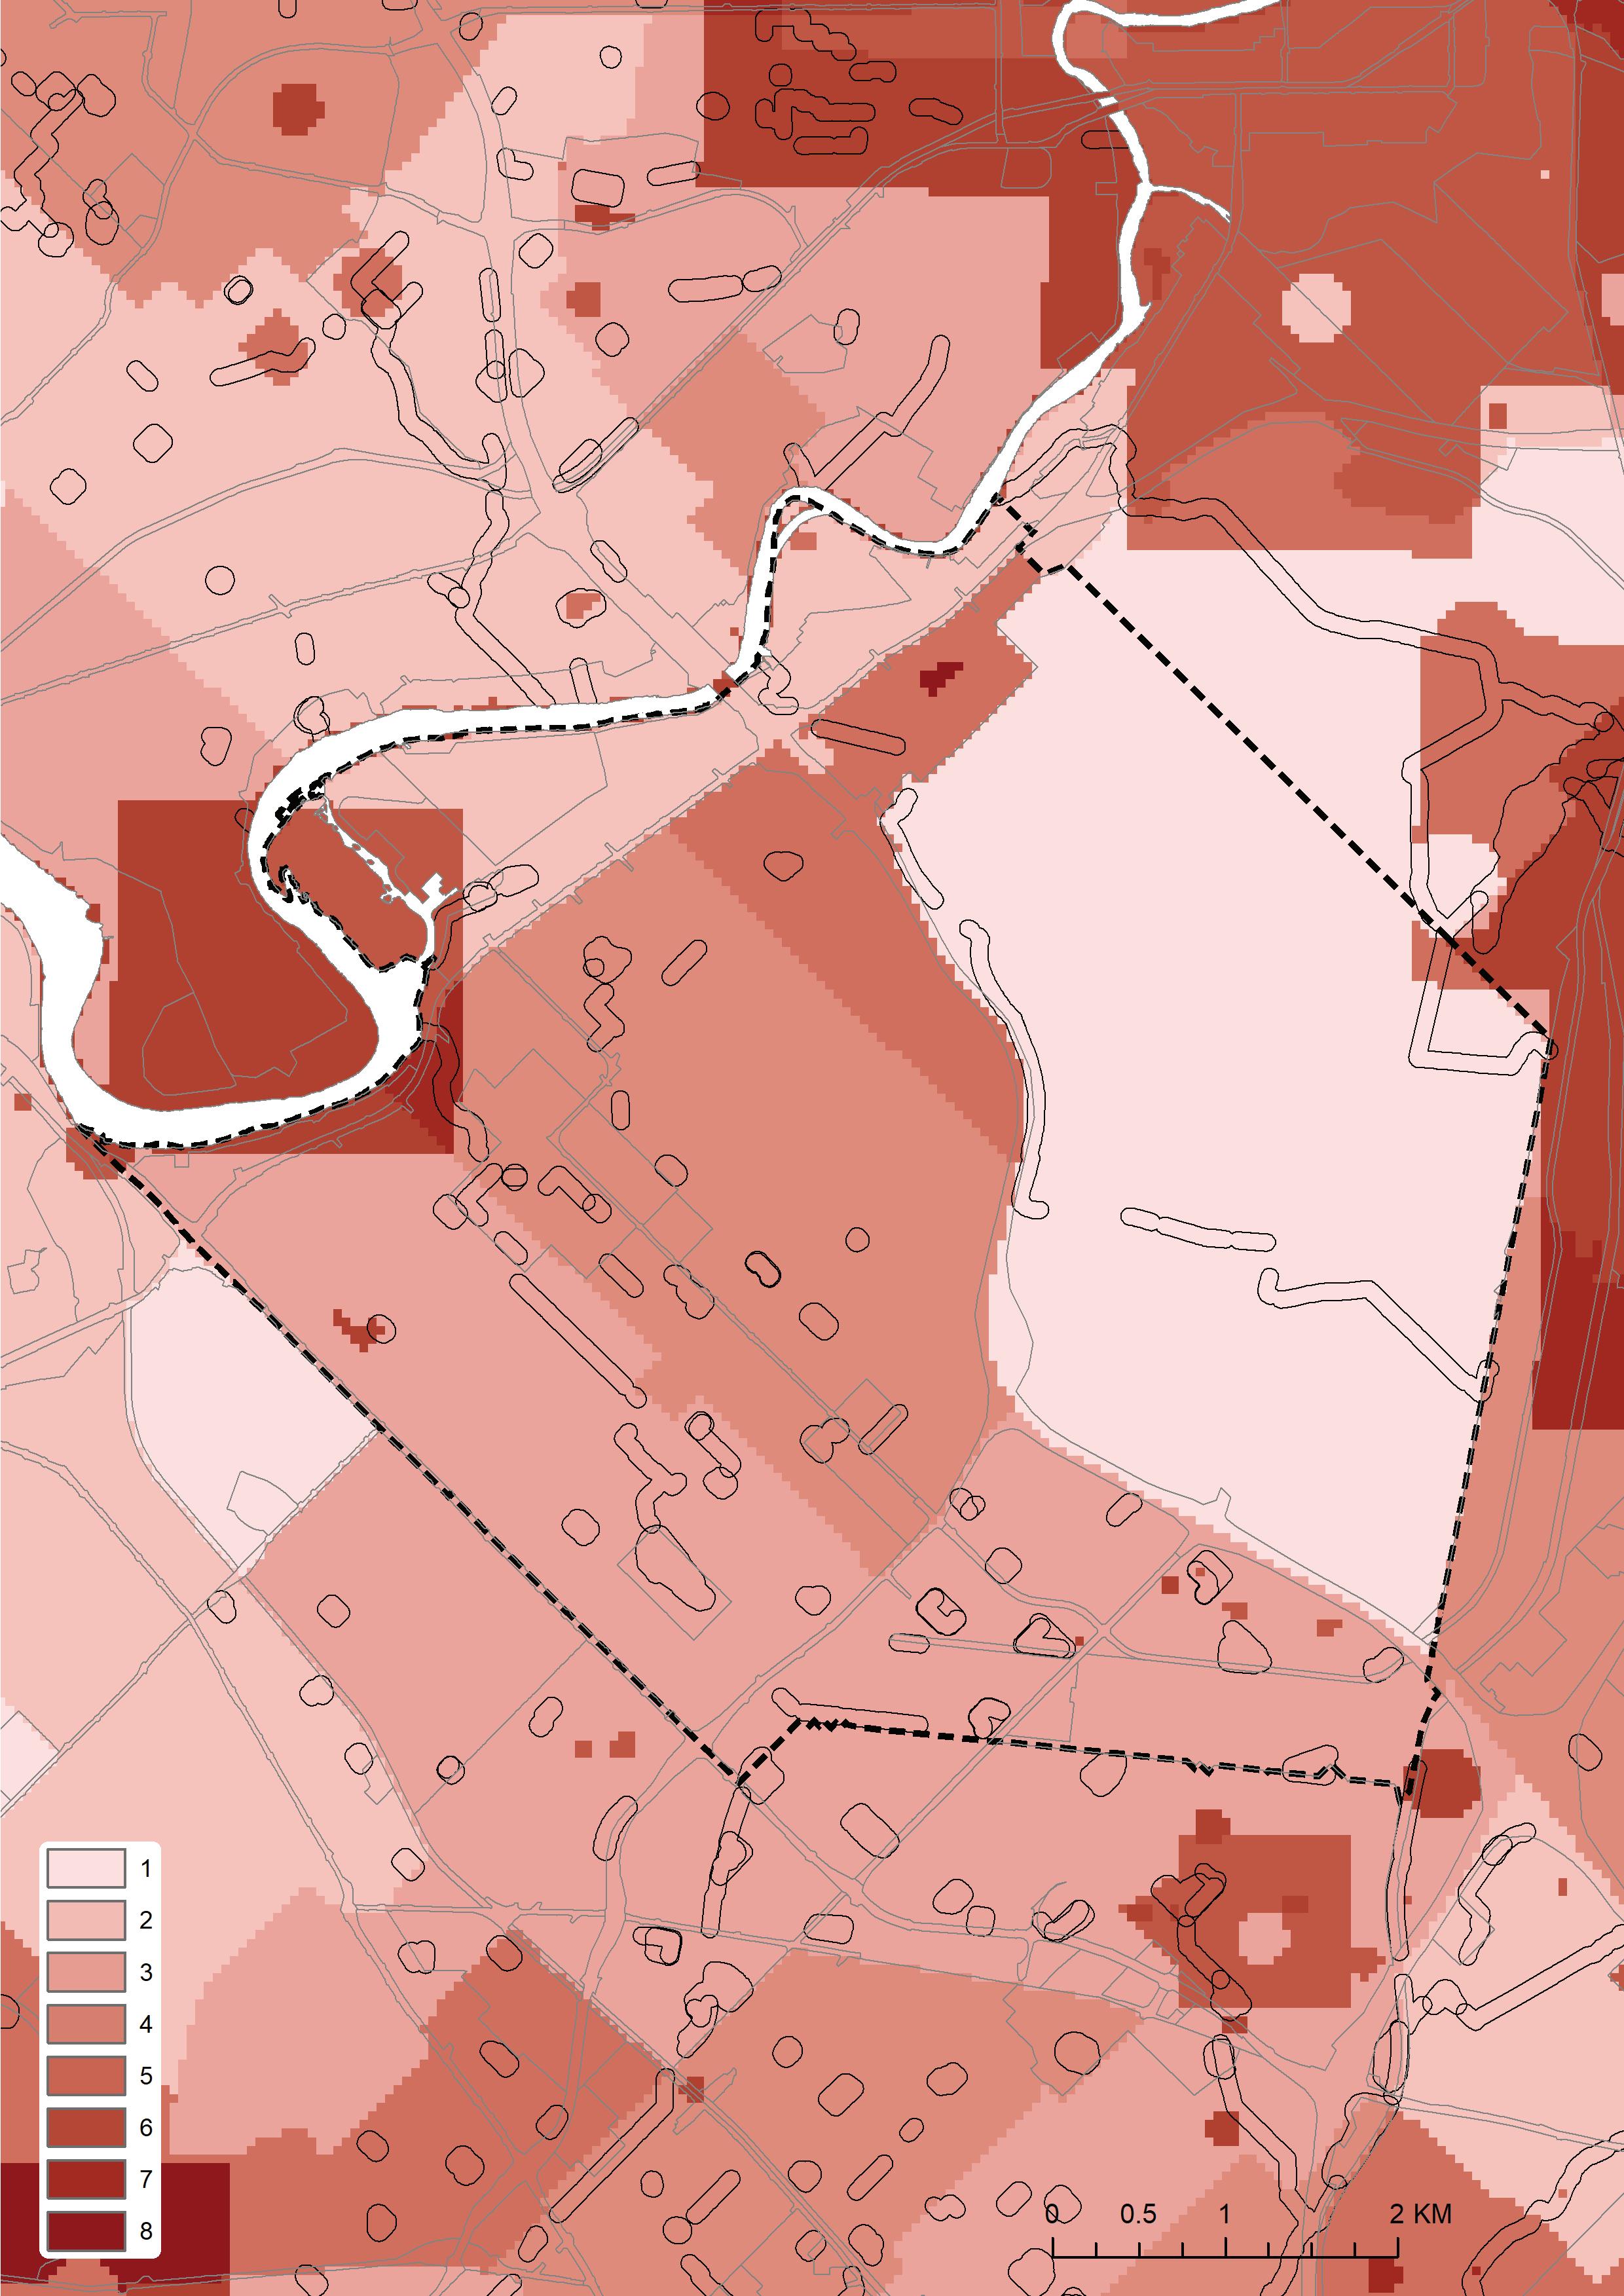
Society sub-model mapping
City of Stirling
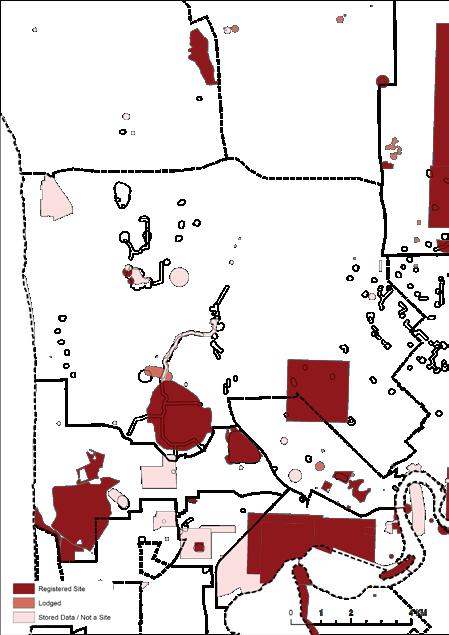
Aboriginal heritage places (Aboriginal Heritage)
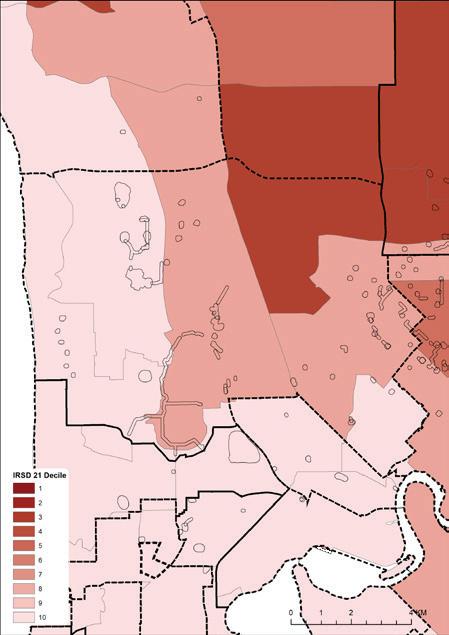
Socio-Economic Indexes for Areas – SEIFA (ABS)
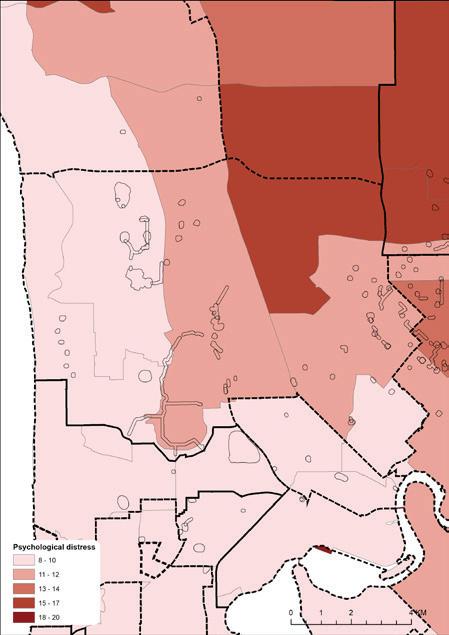
Psychological distress per 100 people (PHIDU/ Torrens University)
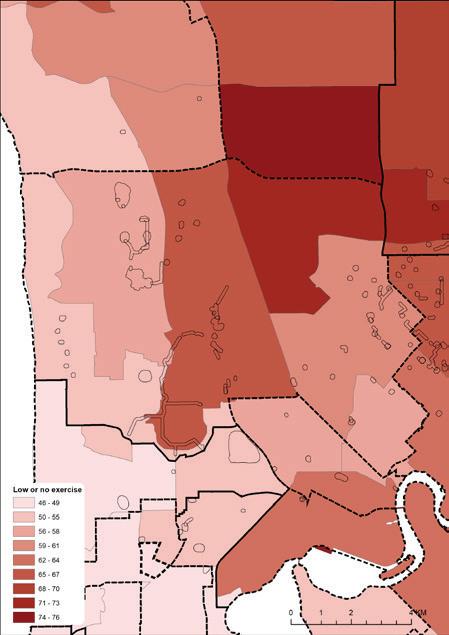
No/ little exercise last week per 100 people (PHIDU/ Torrens University)
An overlay of the geospatial layers in the society submodel. This map shows the drainage land that most require investment and upgrading (with higher scores) according to the presence of areas where high numbers of residents are undertaking little or no exercise or places of particular significance to Indigenous culture.
 City of Stirling
Herdsman Lake
City of Stirling
Herdsman Lake
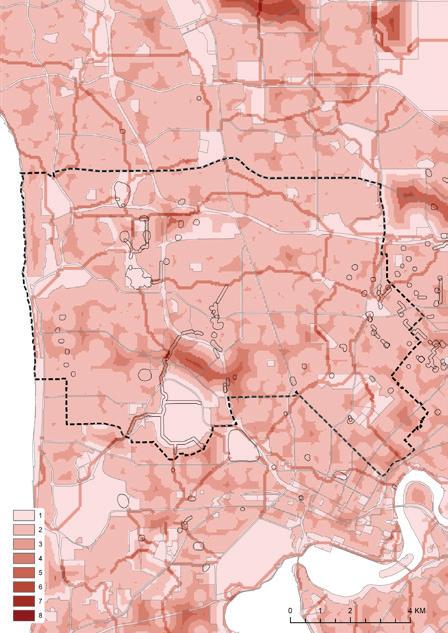
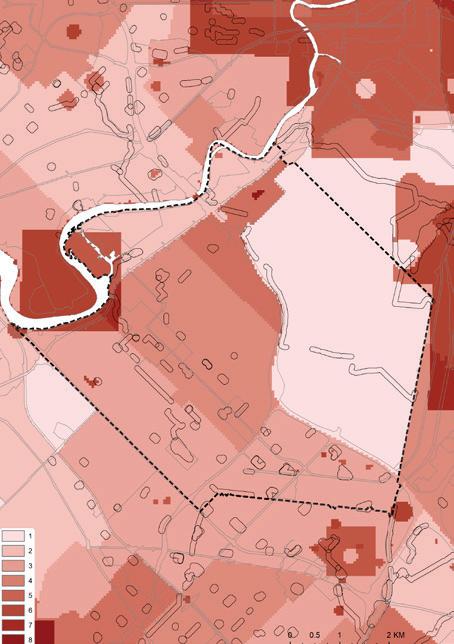
Planning sub-model mapping
City of Stirling
Public Open Space (AUDRC)
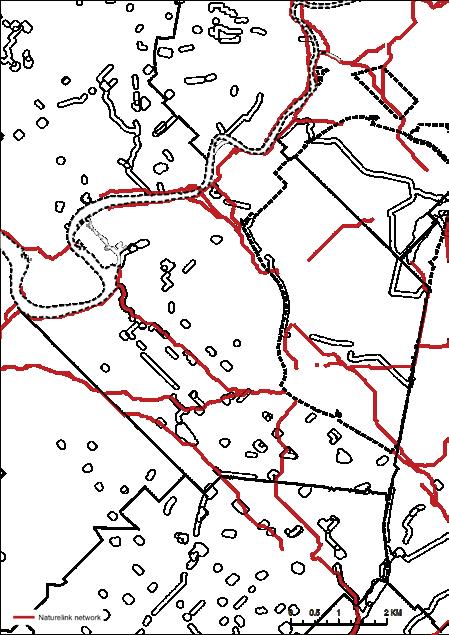
Naturelink corridors (NatureLink Perth)
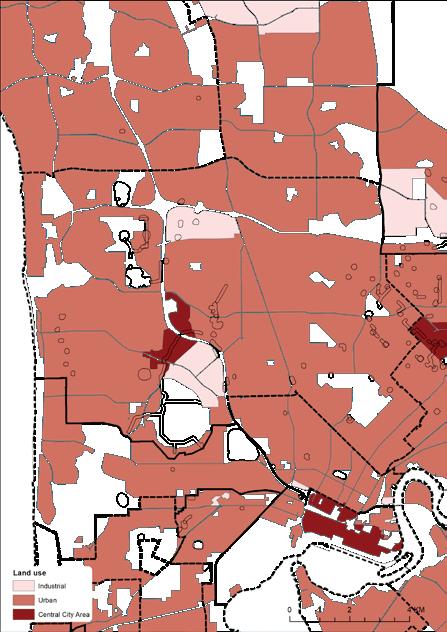
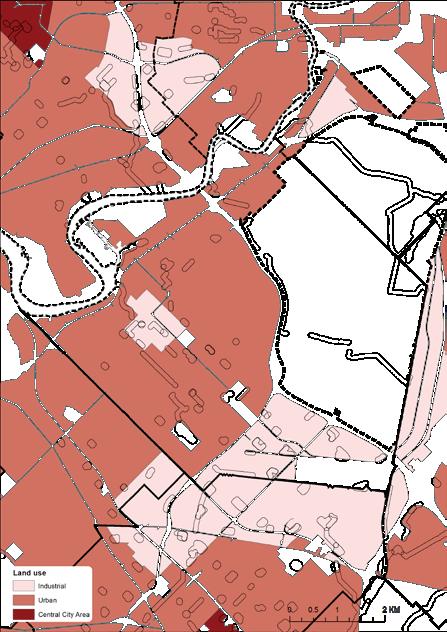
Land use MRS (DPLH)
An overlay of the geospatial layers in the planning sub-model. This map shows the drainage land that most requires investment and upgrading (with higher scores) according to areas with a shortage of open space and areas of planned high density.
 City of Stirling
Herdsman Lake
City of Stirling
Herdsman Lake
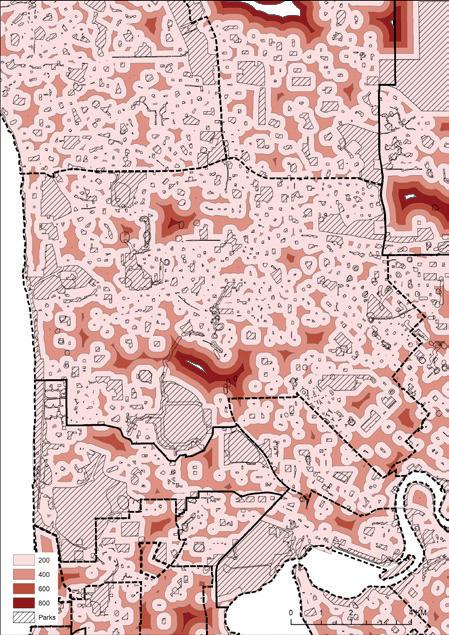
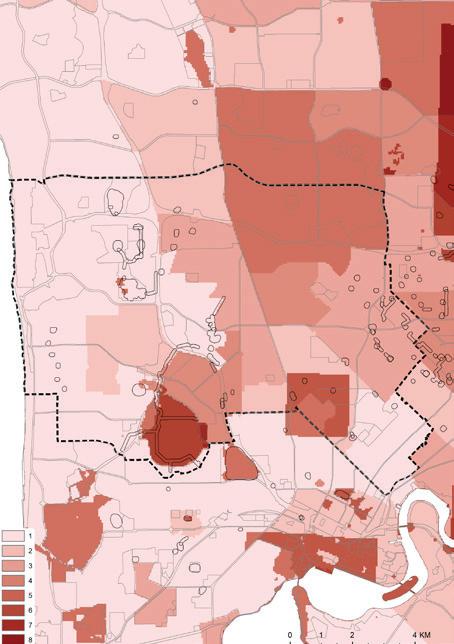
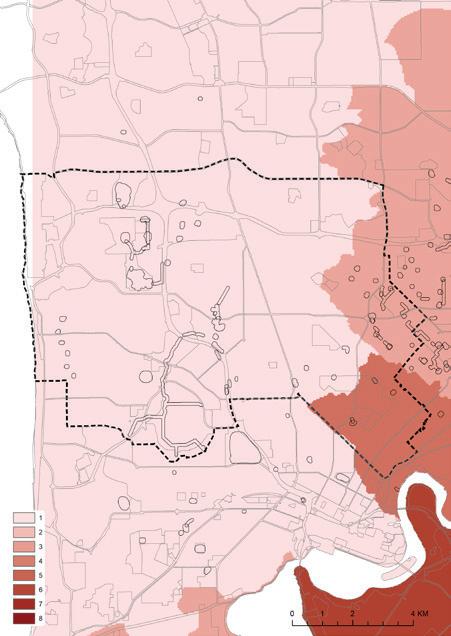
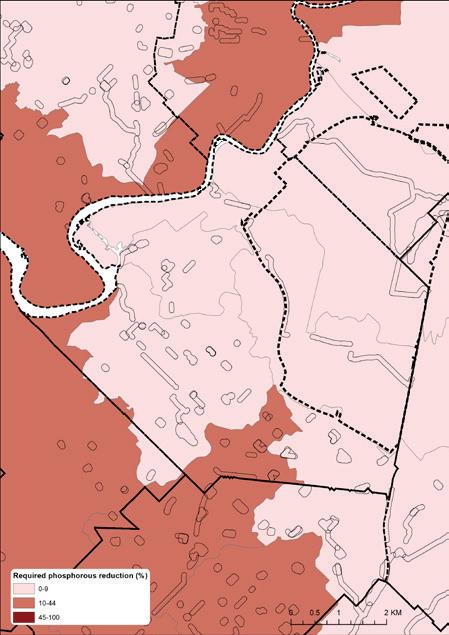
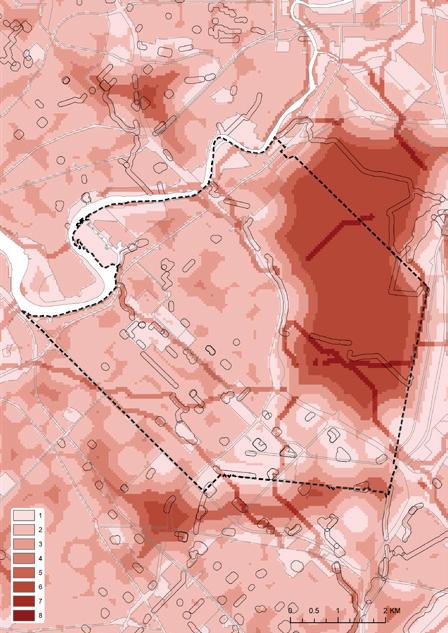
Hydrological sub-model mapping
City of Stirling
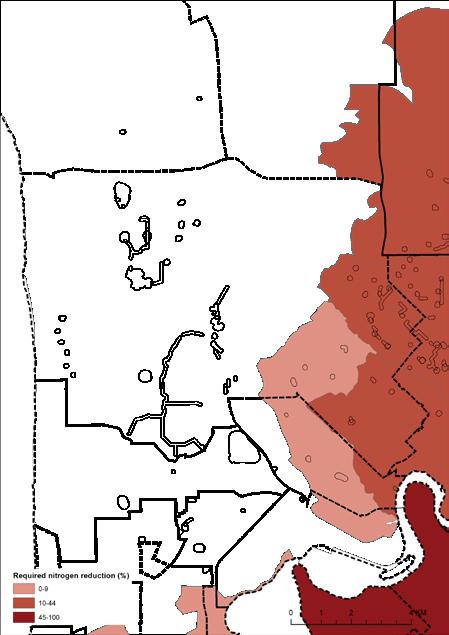
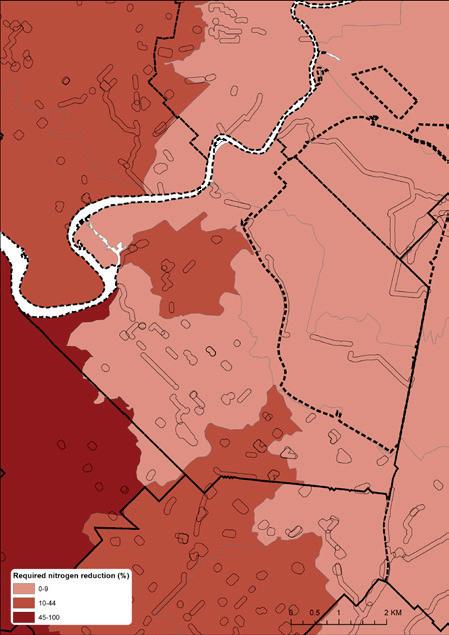
Required nitrogen reduction by catchment (DBCA)
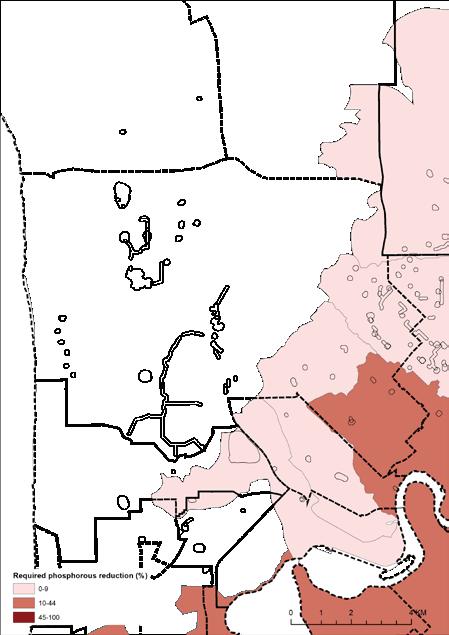
Required phosphorous reduction by catchment (DBCA)
An overlay of the geospatial layers in the hydrology sub-model. This map shows the drainage land that most require investment and upgrading (with higher scores) according to the presence of areas where stormwater flows have high nitrogen and phosphorous levels.
 City of Stirling
Herdsman Lake
City of Stirling
Herdsman Lake
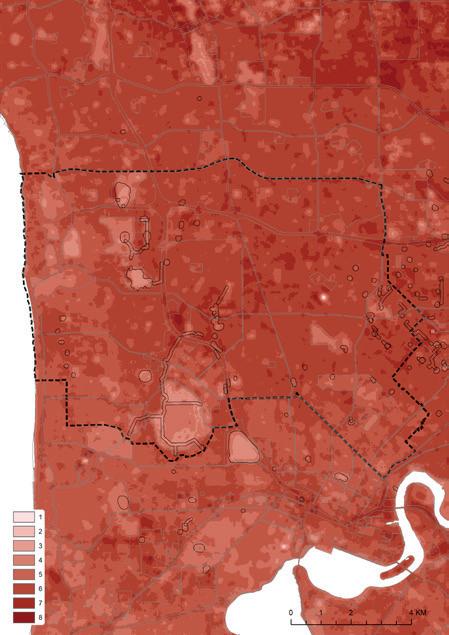
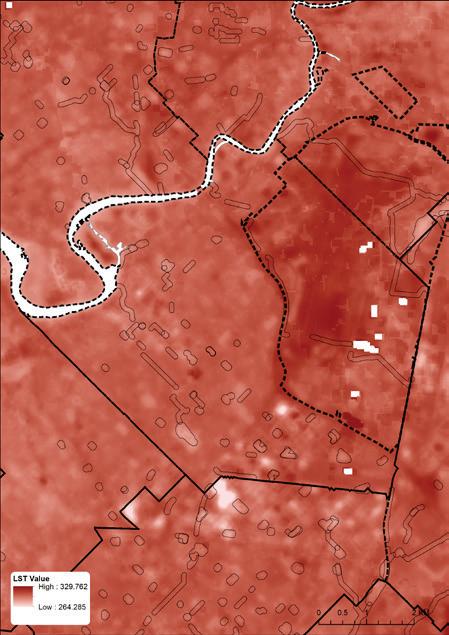
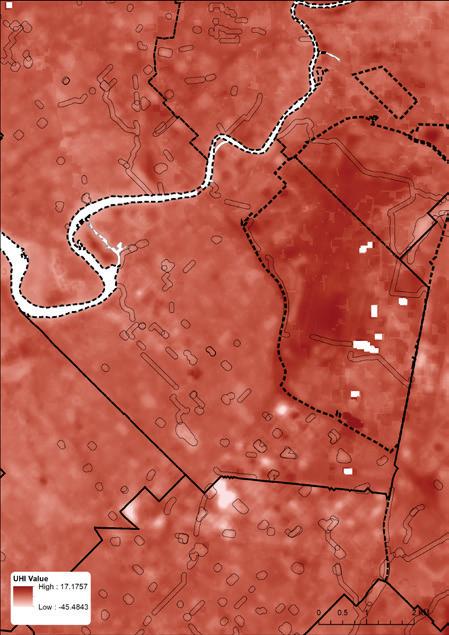
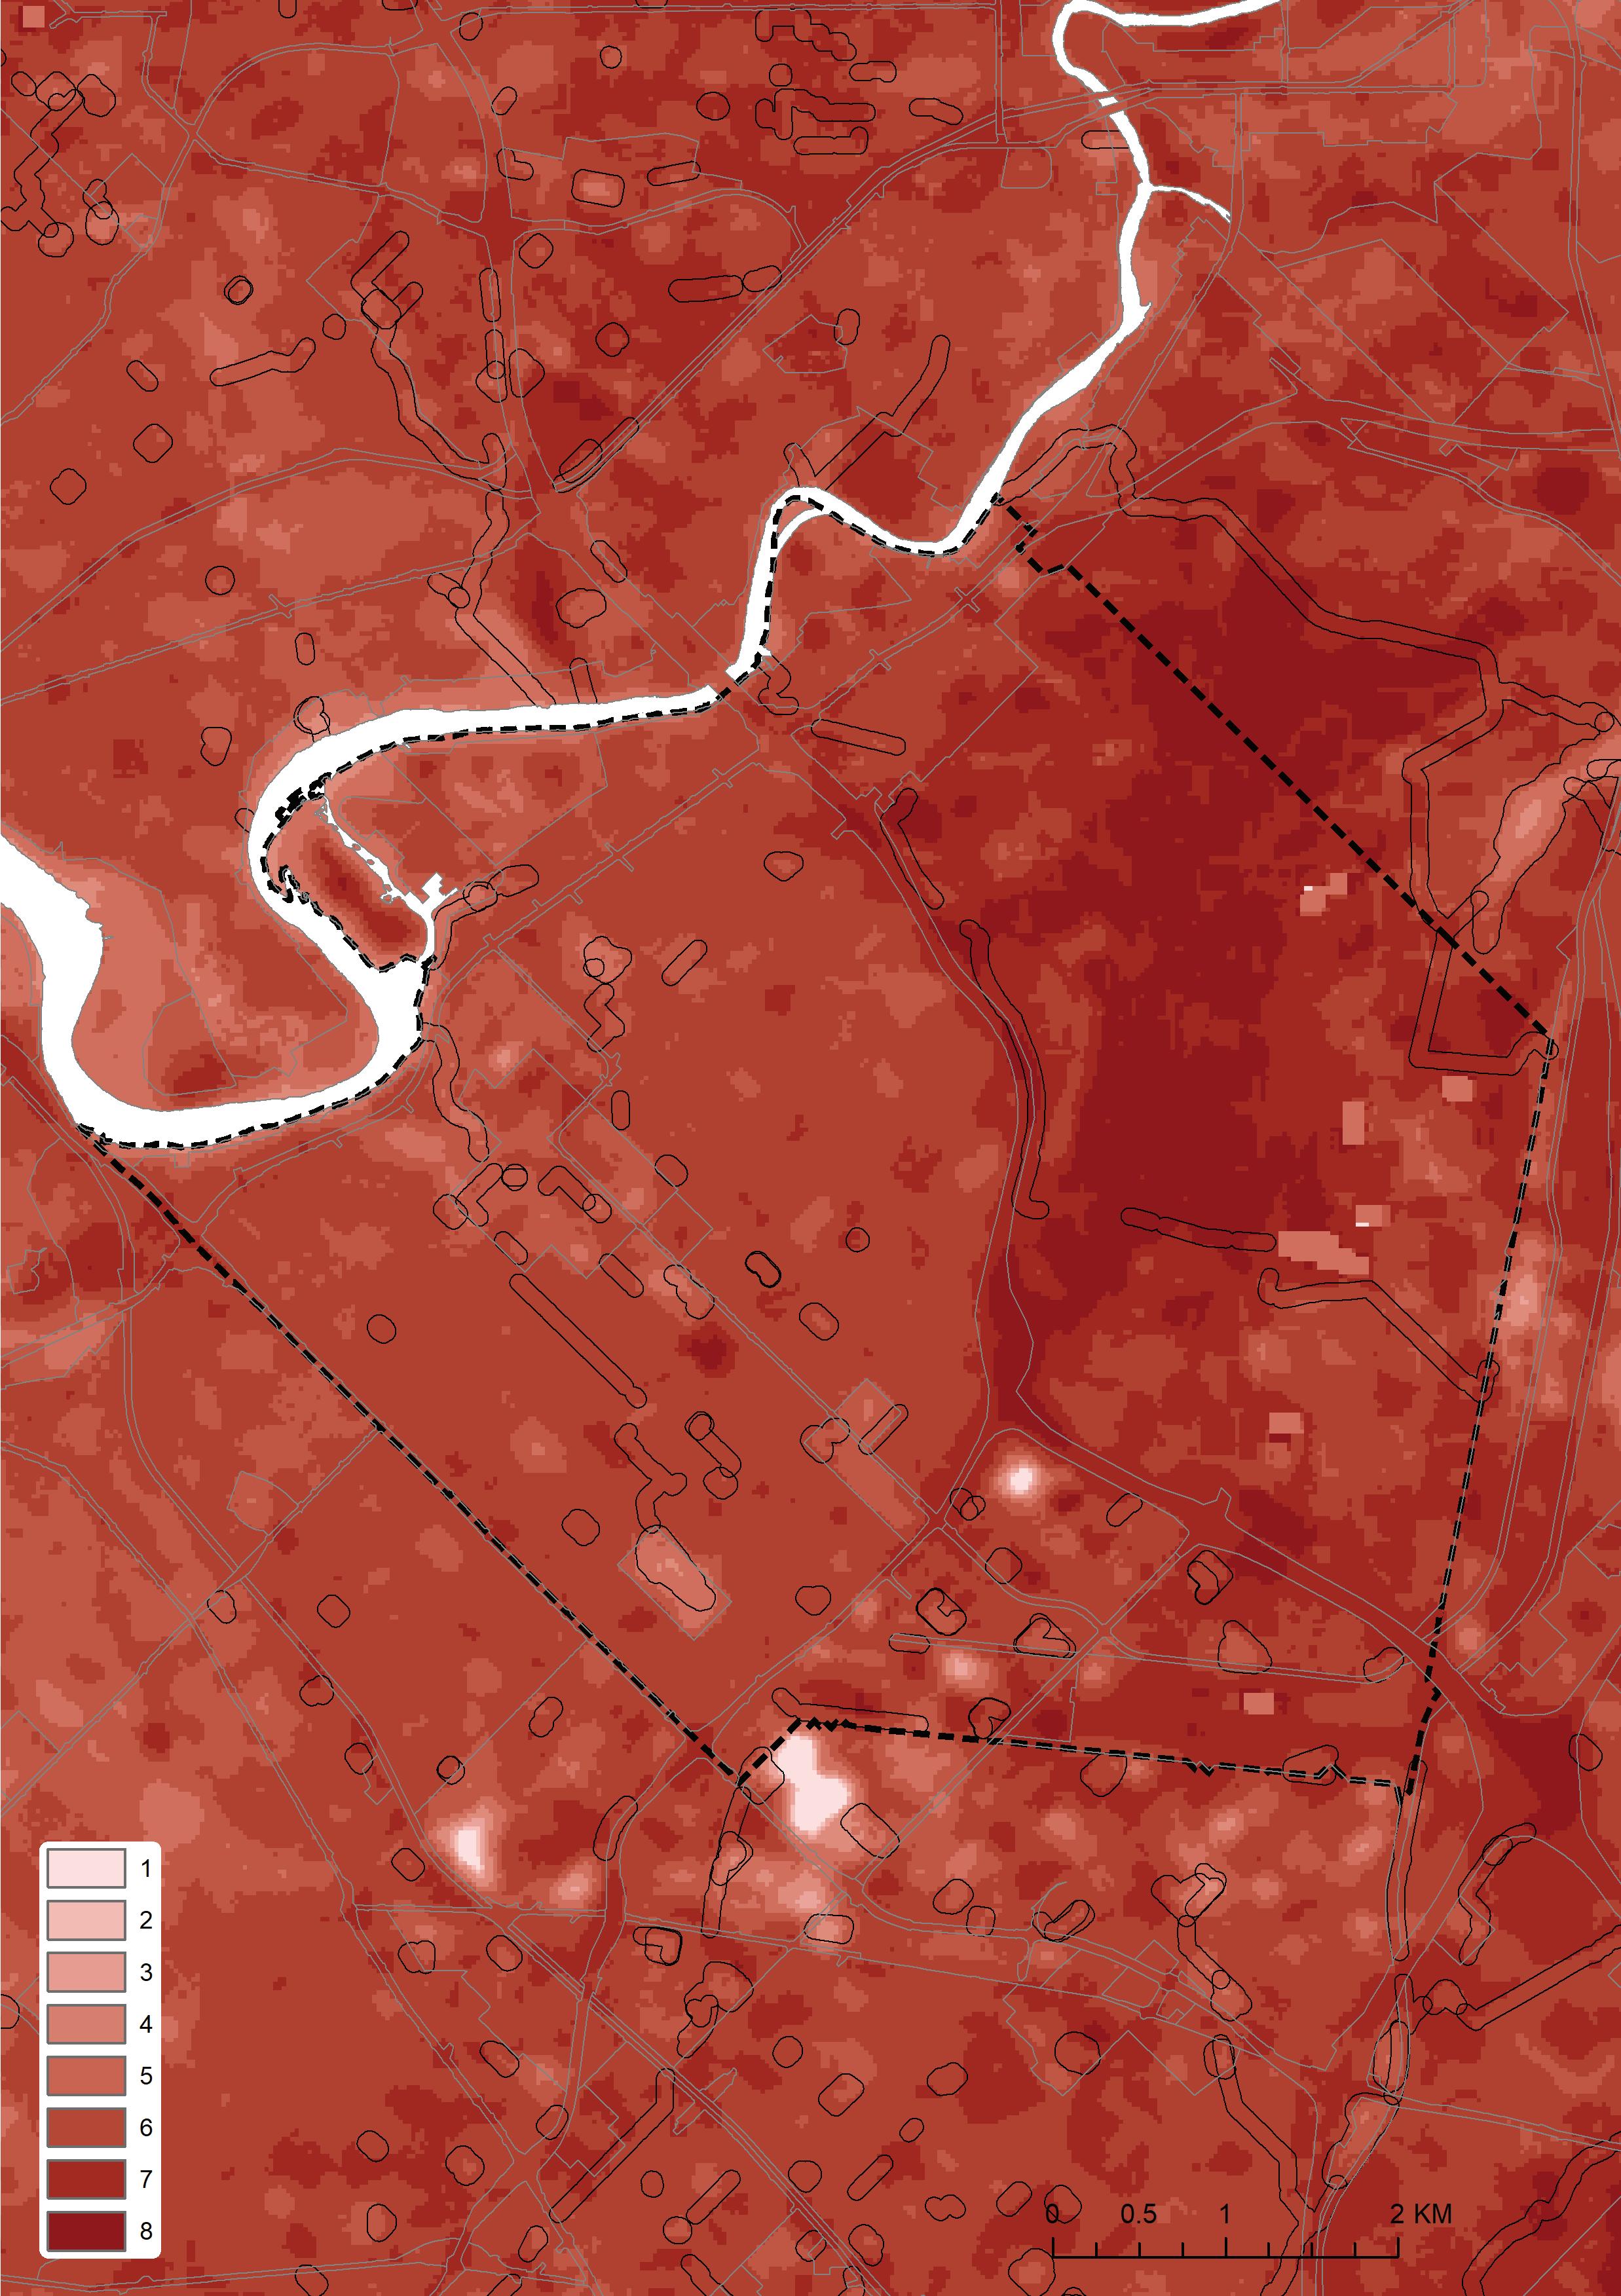
Climate sub-model mapping
City of Stirling

Land surface temperature (CSIRO: Caccetta, Peter , Devereux, Andrew , Amati, Marco , Boruff, Bryan , Kaspar, Joseph , Phelan, Kath , Saunders, Alex)
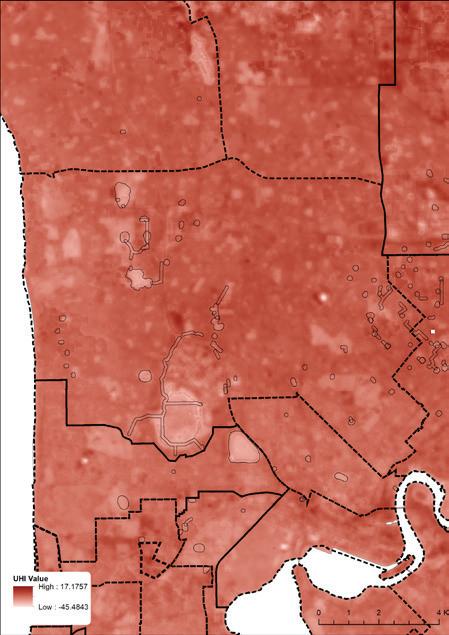
Urban Heat Island (CSIRO: Caccetta, Peter , Devereux, Andrew , Amati, Marco , Boruff, Bryan , Kaspar, Joseph , Phelan, Kath , Saunders, Alex)
An overlay of the geospatial layers in the climate submodel. This map shows the drainage land that most require investment and upgrading (with higher scores) according to the areas that experience the highest land surface temperatures and Urban Heat Island effects.
 City of Stirling
Herdsman Lake
City of Stirling
Herdsman Lake
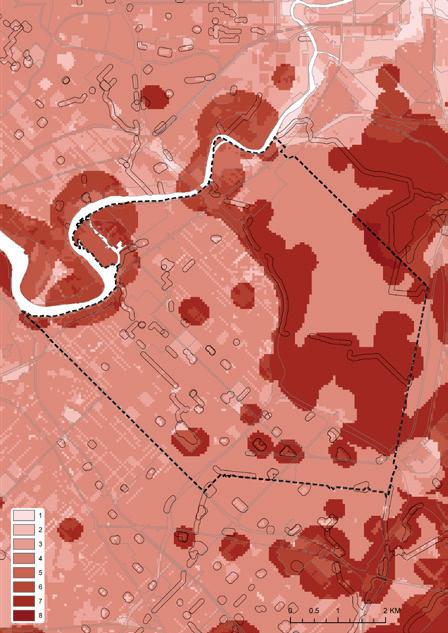
Combined sub-model mapping
City of Stirling
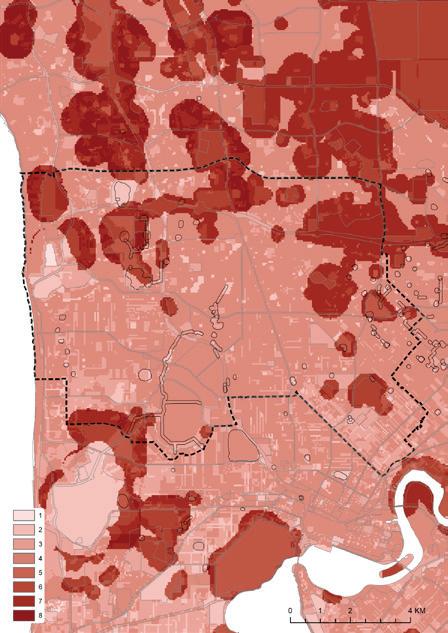
Environment sub-model
Society sub-model
Planning sub-model
Hydrology sub-model
Climate sub-model
An overlay of the sub-model maps. This map shows a composite of the environment, societal, planning, hydrology and climatic sub-models.
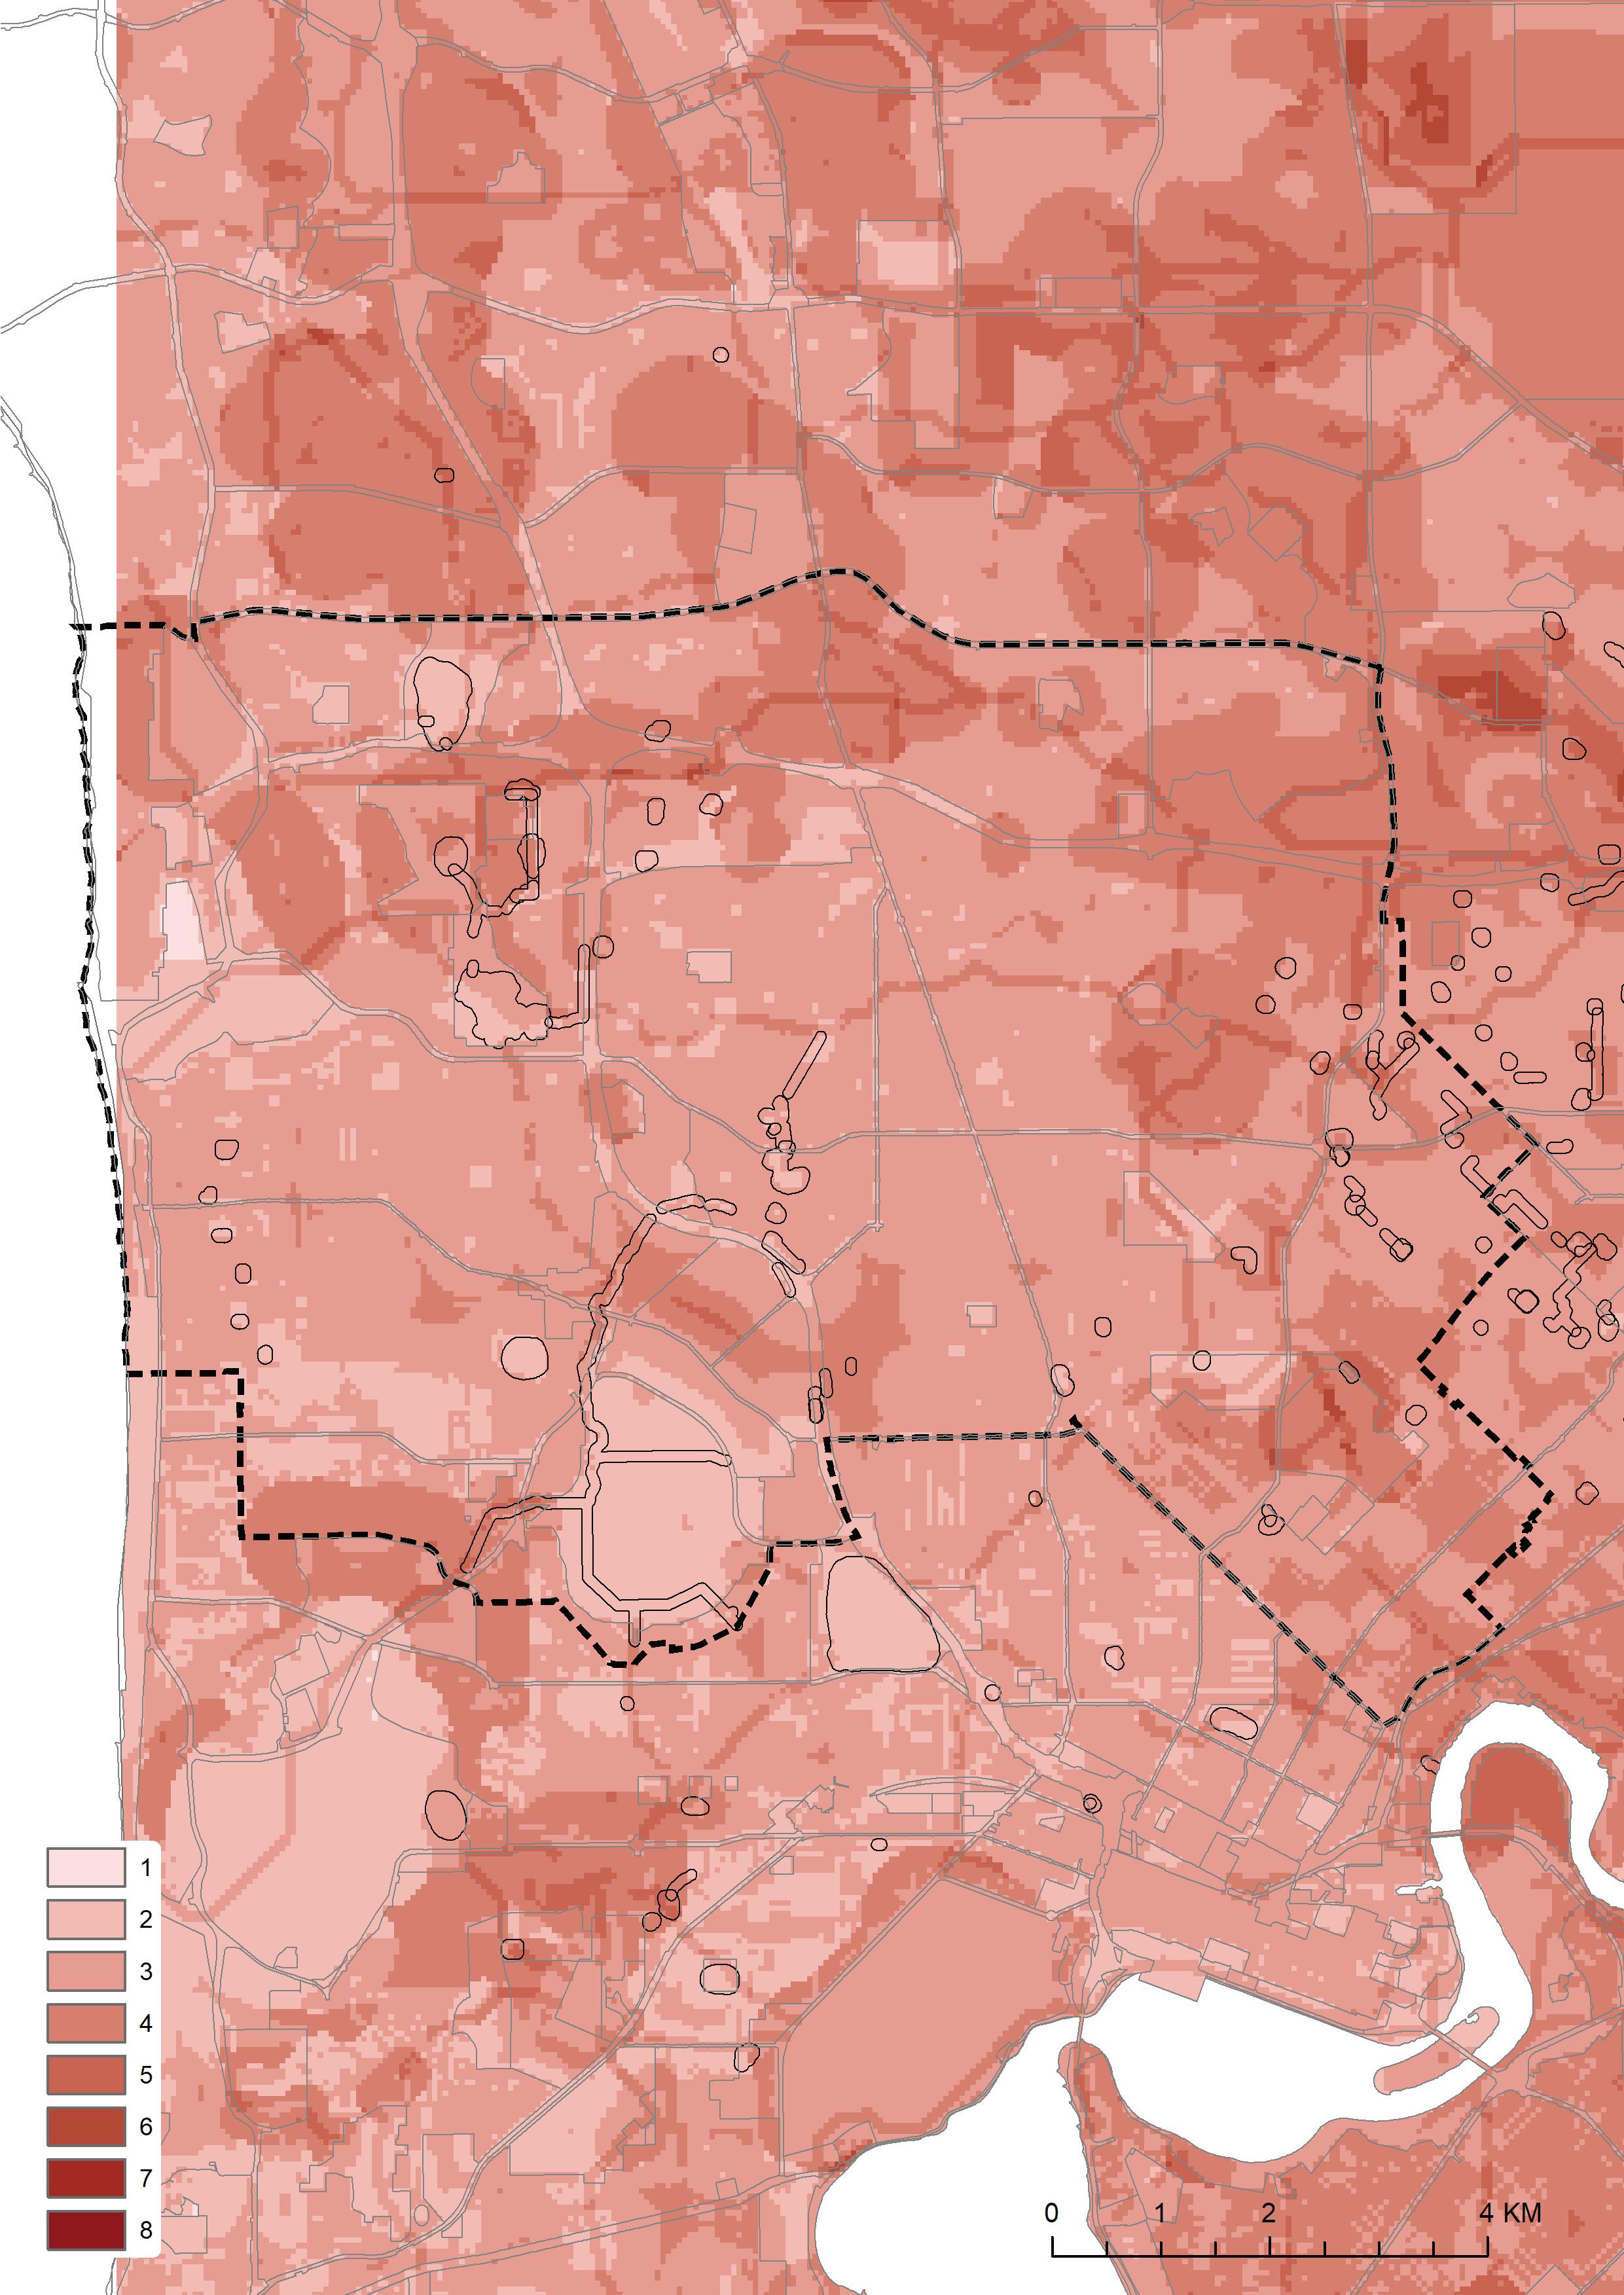 Herdsman Lake
City of Stirling
Herdsman Lake
City of Stirling
Environment sub-model mapping
City of Belmont
Threatened ecological communities (DCBA)
Bushfire prone areas (FES)
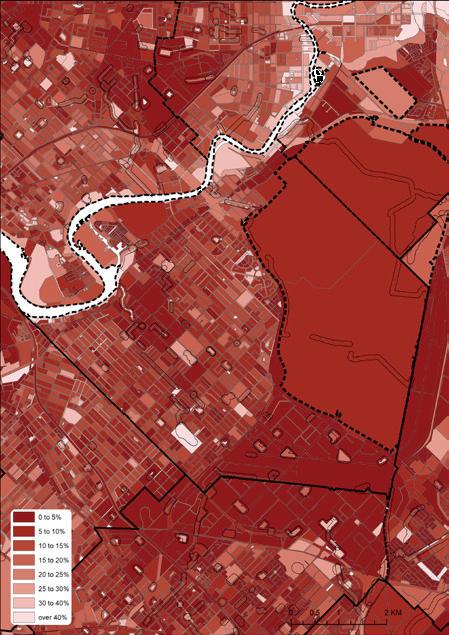
Urban forest cover % (DPLH)
An overlay of the geospatial layers in the environment sub-model. This map shows the drainage land that most require investment and upgrading (with higher scores) according to the presence of Threatened Ecological Species and minimal urban forest cover.
Airport
City of Belmont
Society sub-model mapping
City of Belmont
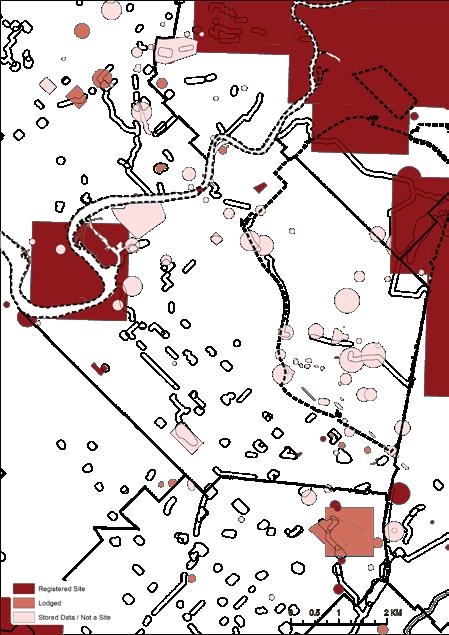
Aboriginal heritage places (Aboriginal Heritage)
Socio-Economic Indexes for Areas – SEIFA (ABS)
Psychological distress per 100 people (PHIDU/ Torrens University)
No/ little exercise last week per 100 people (PHIDU/ Torrens University)
An overlay of the geospatial layers in the society submodel. This map shows the drainage land that most require investment and upgrading (with higher scores) according to the presence of areas where high numbers of residents are undertaking little or no exercise or places of particular significance to Indigenous culture.
Airport
City of Belmont
Planning sub-model mapping
City of Belmont
Public Open Space (AUDRC)
Naturelink corridors (NatureLink Perth)
Land use MRS (DPLH)
An overlay of the geospatial layers in the planning sub-model. This map shows the drainage land that most requires investment and upgrading (with higher scores) according to areas with a shortage of open space and areas of planned high density.
Airport
City of Belmont
Hydrology sub-model mapping
City of Belmont
Required nitrogen reduction by catchment (DBCA)
Required phosphorous reduction by catchment (DBCA)
An overlay of the geospatial layers in the hydrology sub-model. This map shows the drainage land that most require investment and upgrading (with higher scores) according to the presence of areas where stormwater flows have high nitrogen and phosphorous levels.
Airport
City of Belmont
Climate sub-model mapping
City of Belmont
Land surface temperature (CSIRO: Caccetta, Peter , Devereux, Andrew , Amati, Marco , Boruff, Bryan , Kaspar, Joseph , Phelan, Kath , Saunders, Alex)
Urban Heat Island (CSIRO: Caccetta, Peter , Devereux, Andrew , Amati, Marco , Boruff, Bryan , Kaspar, Joseph , Phelan, Kath , Saunders, Alex)
An overlay of the geospatial layers in the climate submodel. This map shows the drainage land that most require investment and upgrading (with higher scores) according to the areas that experience the highest land surface temperatures and Urban Heat Island effects.
 Airport
City of Belmont
Airport
City of Belmont
Combined sub-model mapping
City of Belmont
Environment sub-model
Society sub-model
Planning sub-model
Hydrology sub-model
Climate sub-model
An overlay of the sub-model maps. This map shows a composite of the environment, societal, planning, hydrology and climatic sub-models.
Airport
City of Belmont
Contributors
42
AUDRC Co-Director

AUDRC Co-Director
43
Dr Julian Bolleter
Dr Paula Hooper
