Future Climate, Future Home
Evidence-based adaptive urban design strategies for Western Australia
Precinct climate performance in future conditions
Acknowledgement
This research is supported by the Western Australian Planning Commission (WAPC), the Department of Planning, Lands and Heritage (DPLH), Development WA, the Department of Housing and Works (DHW) and the Water Corporation. The research is also supported by WA Local Governments - the City of Karratha, the City of Greater Geraldton, the Shire of Toodyay, the City of Wanneroo, the City of Cockburn, the City of Vincent, and the City of Perth.
1. Executive summary
This Phase 2 report identifies changes between the current and likely future performance of urban precinct case studies due to climate change-induced variations in weather conditions. In this research SSP2-4.5 (Intermediate) and SSP3-7.0 (High) Shared Socio-economic Pathways (SSPs) have been used to evaluate potential climate conditions in Western Australia to 2100. SSP2-4.5 would result in Global Mean Surface Air Temperature (GSAT) reaching around 2.5°C by 2100, stabilising at more than 3°C by 2300 SSP3-7.0 is projected to result in around 4°C by 2100, reaching 7.5°C by 2300 and continuing to rise thereafter.
In Western Australia, the impact of climate change is likely to vary significantly in respect of increased temperature. Inland areas will warm much more than coastal areas. The southwest corner, which is influenced by the ocean to the west and the south, will warm less than other regions. Projections for 2050 are similar between the SSPs with significant differences developing post 2050.
Rainfall in the interior of the state is projected to increase marginally. Larger increases of around 4% in the tropical north by 2050 and 6-11% by 2100 are projected. Coastal regions south of the Pilbara are projected to see significant reductions in annual rainfall during the century. The coastal southwest is projected to dry by 9% by 2050 and 14-24% by 2100.
The case studies selected for this research are Broome (Broome North, Broome central), Karratha (Bulgarra and Karratha town centre), Geraldton (Maitland Park), Toodyay (River Hills Estate) and Perth (Jindalee, Nollamara, Leederville town centre, Karawara, Cockburn Central and Salt Lane. ENVI-met software was used to model the projected microclimatic conditions for each study site. ENVI-met is a three-dimensional microclimate simulation software incorporating various scientific disciplines – from fluid dynamics and thermodynamics to plant physiology and soil science. ENVI-met simulates a specific meteorological situation for a specific planning scenario (generally the size of a neighbourhood). ENVI-met modelling was undertaken for SSP2-4.5 (2080) and SSP3-7.0 (2050 and 2080), noting that the two scenarios produce similar output for 2050.
This study used the Physiological Equivalent Temperature (PET) index as a proxy for human thermal comfort in outdoor environments. ENVI-met produces PET results derived from simulated weather conditions. The macroclimate changes under SSP2-4.5 and SSP3-7.0 are projected to be similar in 2050 and 2080 for the case study precincts, with average summer wet bulb temperatures increasing by 3-5°C. Conditions under SSP3-7.0 are projected to worsen beyond 2080.
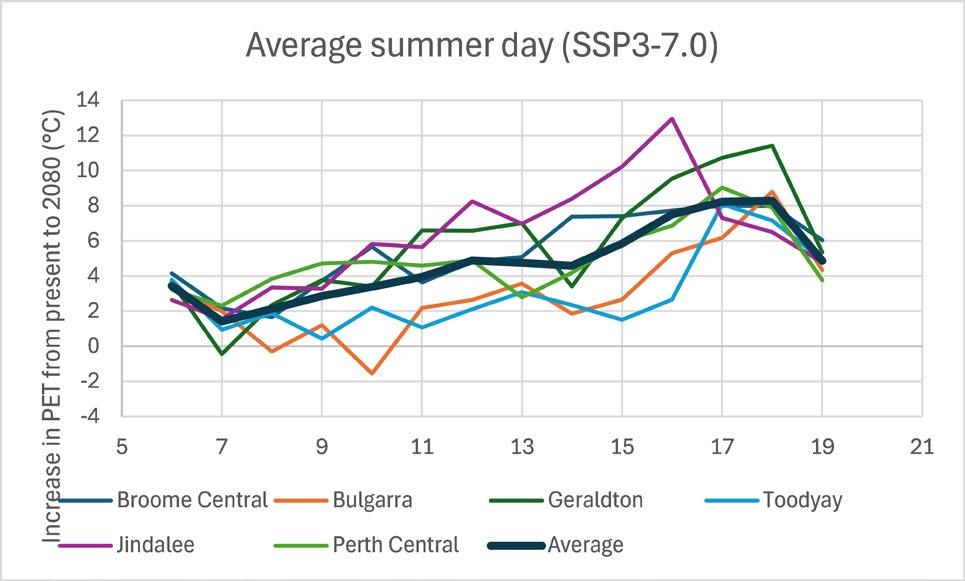
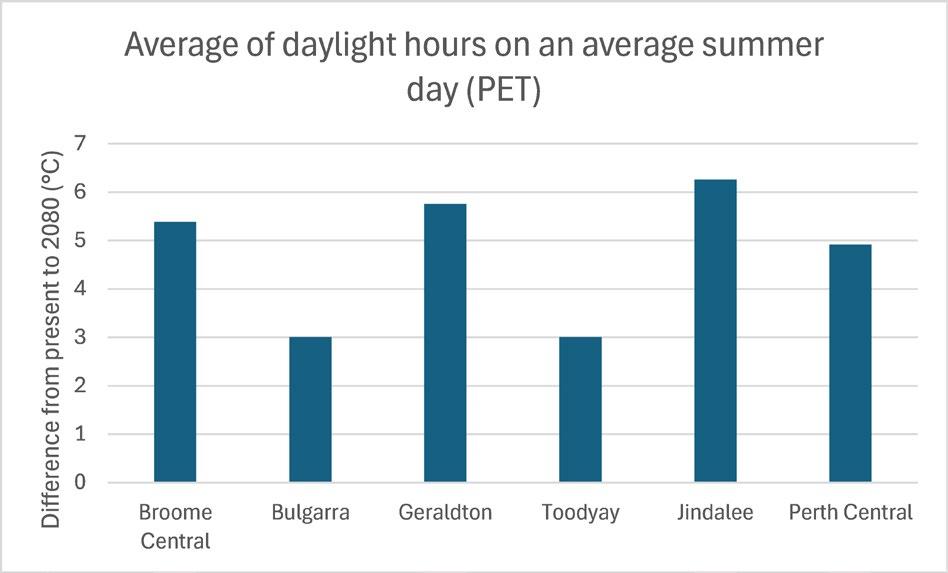
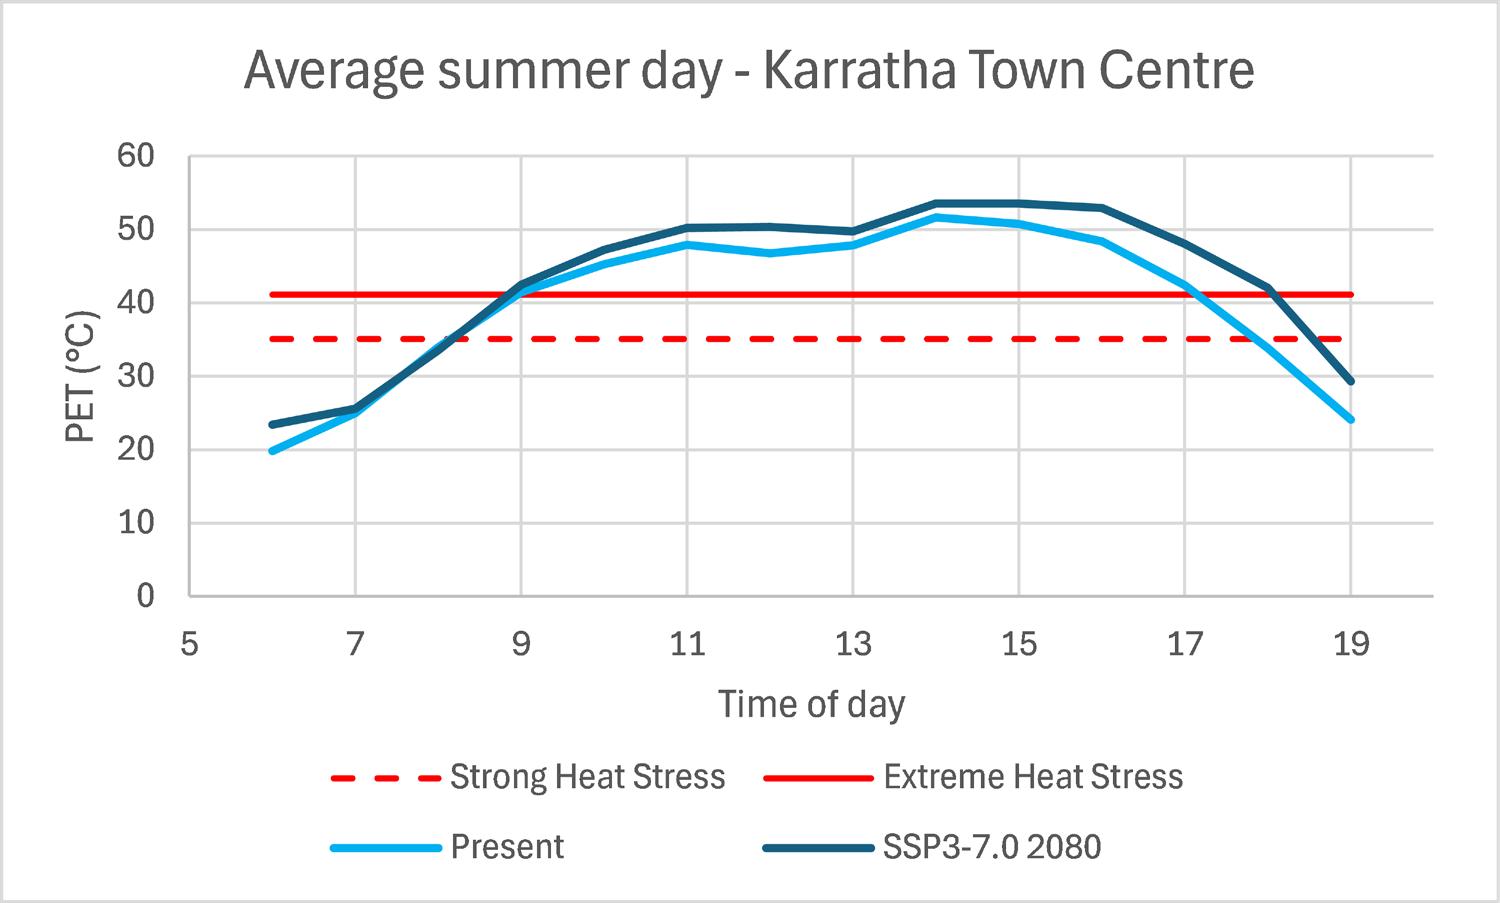
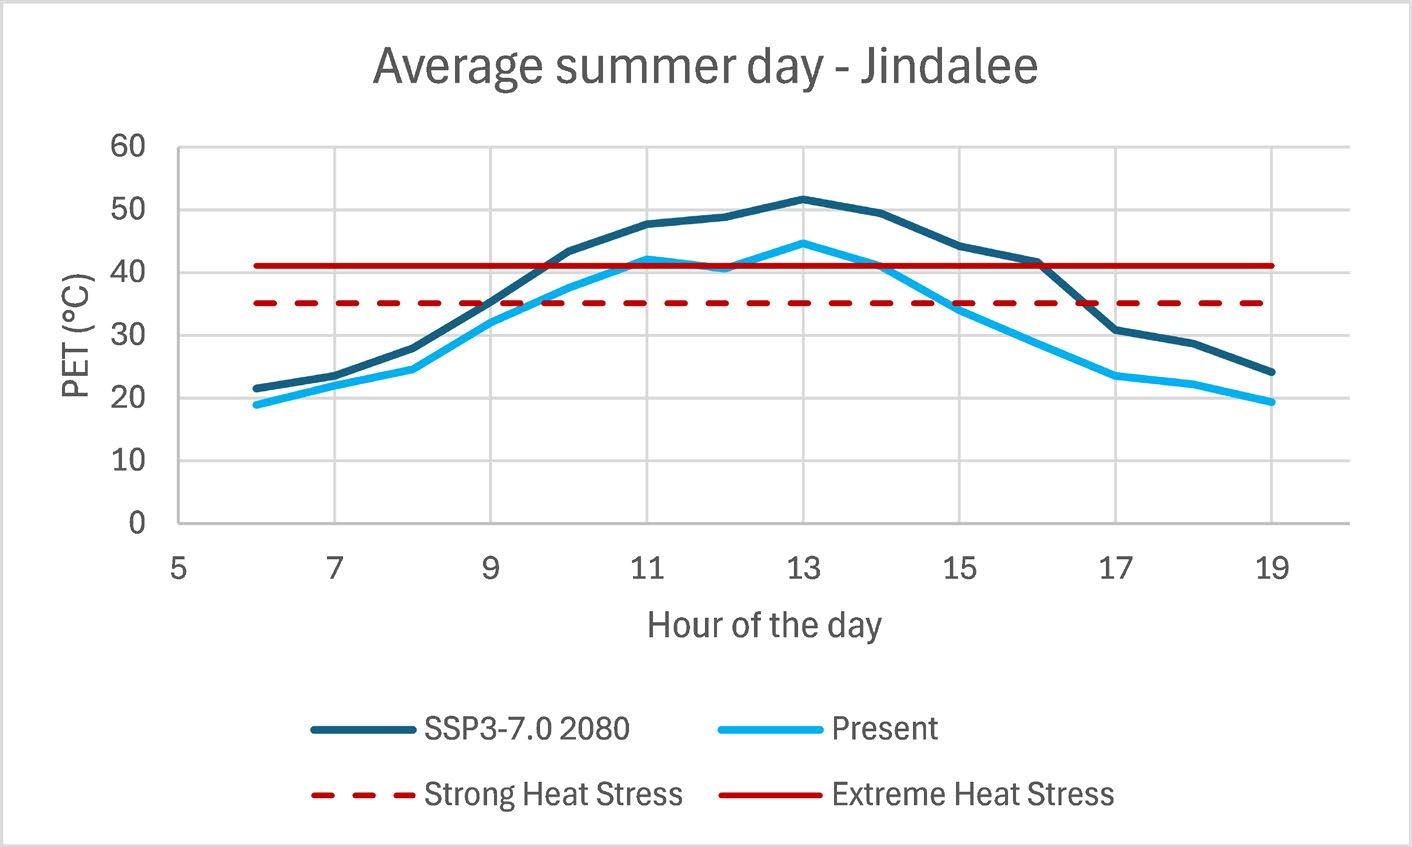
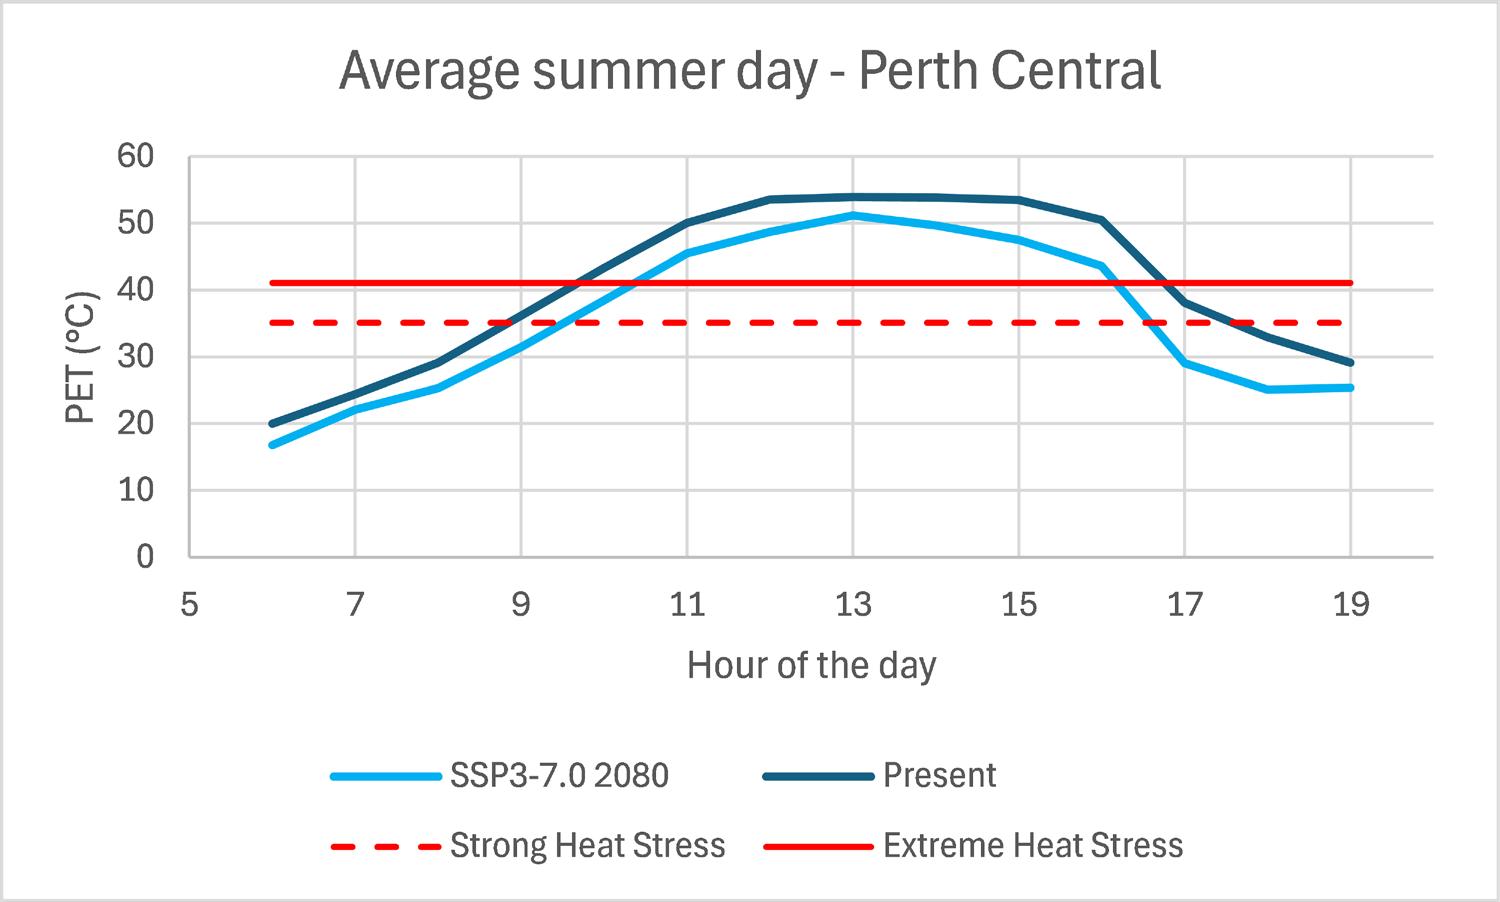
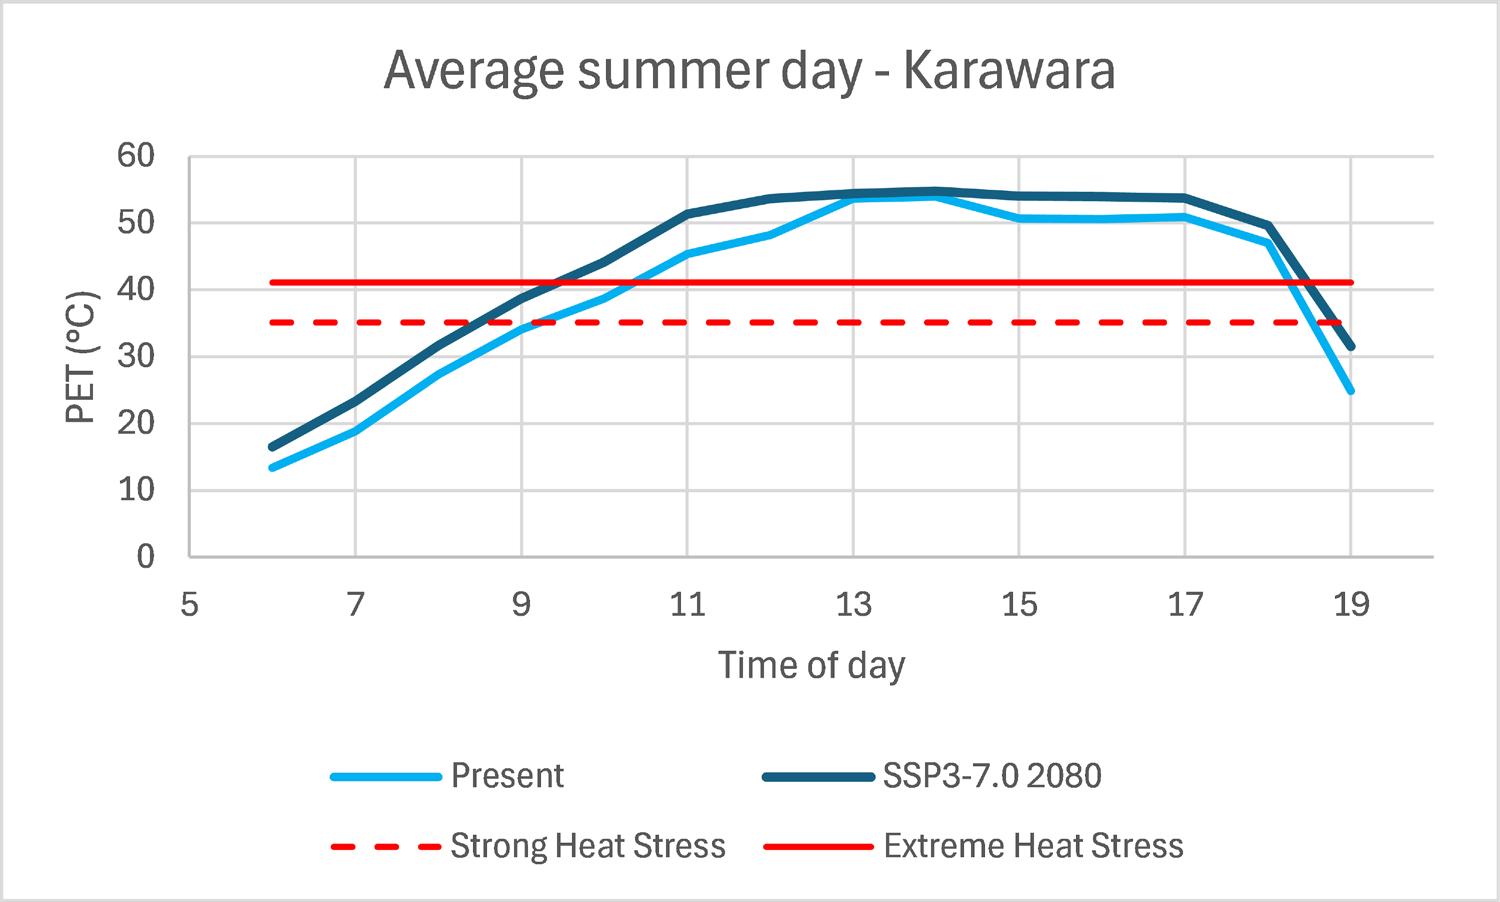
What the report reinforces is that projected increases in Global Mean Surface Air Temperatures during this century will be experienced very differently across the state and even within urban precincts. The outdoor thermal comfort performance of the case studies as measured by PET is set to worsen across the state under the climate scenarios considered in this study. Figure 1a) depicts PET changes in a typical streetscape in an average summer day in a selection of case study precincts. This illustrates worsening conditions across the day in line with the progression of air temperatures. Figure 1b) shows the average increases from 6am-7pm in those same locations.
(a) (b)
Figure 1 Projected increases in PET by 2080 (SSP3-7.0) a) diurnal variation b) average of daylight hours.
By 2080 under SSP3-7.0 average summer middle of the day heat stress will reach extreme levels (40°C) and approach 50°C in all case study areas. Conditions will be worse on hotter than average days and in respect of SSP3-7.0 will be worse after 2080. The percentage of hours on an average summer day now and in 2080 exhibiting extreme heat stress (i.e. PET ≥ 40°C) are shown in Table 1 for a selection of case study sites. The largest change is predicted for Geraldton, Jindalee, and Broome Central with other locations retaining similar durations.
Table 1: Percentage of daylight hours in extreme heat stress on an average summer day (SSP3-7.0) Present
The study shows that it is the increase in specific humidity (as distinct from relative humidity) that will increase the most over the coming decades (ranging from 15-22%) over the daylight hours of an average summer day. Specific humidity will increase because the warmer atmosphere can hold more moisture. In turn a higher moisture content can absorb more heat, resulting in reinforcing feedback. Both air temperature and mean radiant temperature (MRT) also contribute to changes in PET. MRT is locally influenced by the absorption of heat in adjacent surfaces from the warmer atmosphere. Changes to wind speeds are not significant between the scenarios.
The trapping of heat by greenhouse gases in the atmosphere is leading to an increased absorption of longwave radiation which is the cause of global warming. It is projected that direct solar radiation reaching the earth’s surface will diminish due to increased atmospheric water vapour but diffuse solar radiation (i.e. that which is scattered by atmospheric particles) will increase for the same reason. Unlike direct solar radiation (short wave radiation), diffuse radiation comes from all directions. This has implications for the benefits provided by shade from tree canopy. The ENVI-met results illustrate that the increase in PET to 2080 under canopy is (typically) up to several °C greater than in adjacent exposed locations during the afternoons. This means that the benefit of shade from tree canopy is likely to diminish somewhat as the climate changes.
These findings reinforce the importance of the subsequent research phase which will develop and evaluate the performance of design proposals to adapt urban precinct and housing case studies to projected climate change using micro-climatic, building energy, and water modelling and community engagement
2. Introduction
According to the International Panel for Climate Change (IPCC), the assessed climate response to Green House Gas (GHG) emissions scenarios results in a best estimate of warming for 2081–2100 that spans a range from 1.4°C for a very low GHG emissions scenario (SSP1-1.9) to 2.7°C for an intermediate GHG emissions scenario (SSP2-4.5) and 4.4°C for a very high GHG emissions scenario (SSP5-8.5) (Lee et al., 2024). Analysis by Climate Action Tracker suggests that the current trajectory based on “real world action” is a temperature increase by 2100 of 2.2-3.4 °C (Climate Action Tracker, 2024) What do these global projections mean for heat stress in Australia? Extreme temperatures are likely to increase nationwide, with the greatest increases over northern Australia and in desert regions. Severe and extreme heatwave events are projected to double if global warming reaches +2.0ºC and more than quadruple under +3.0ºC of warming (Australian Climate Service, 2025)
The relationship between increased heat and increased mortality is not linear but increases significantly from +2.0ºC to +3.0ºC. The nature of the risk varies considerably depending on factors such as socio-economic vulnerability, the local climate, and access to support. By +3.0°C, heatrelated mortality is projected to increase across Australia. For example, modelling suggests an increase in heat-related mortality of 444% for Sydney and 423% for Darwin under a +3.0°C scenario compared to current conditions (Australian Climate Service, 2025)
What is missed in large scale projections for increasing temperatures – and growing evapotranspiration and changing rainfall (Australian Climate Service, 2025) – is the effects of urban morphology (urban density, thermal mass, green infrastructure) on experiences of thermal comfort. To address this gap in our knowledge this phase 2 report identifies changes between the current and future performance of urban precinct studies due to climate change-induced variations in weather conditions. The greatest gains in well-being in urban areas can be achieved by prioritising access to finance to reduce climate risk for vulnerable areas (Lee et al., 2024) This analysis will assist in defining using these vulnerabilities through comprehensive neighbourhood scale microclimatic analysis.
2.1 Research objectives
Through a rare collaboration between experts in urban, landscape and architectural design, public health, climate science, engineering and climate, energy and water modelling, this project aims to:
Generate evidence to inform solutions and policy decisions concerning the climate change adaptation of urban precincts and housing to projected temperature and rainfall changes and foster healthy and climate-resilient communities across WA’s climate regions.
The specific objective of the previous phase (Phase 1) was to:
• Benchmark the performance of selected urban precinct and housing case studies across WA’s climate regions concerning Urban Heat Island (UHI) effects, thermal comfort of the outdoor environments, energy demand for heating and cooling within houses, and irrigation demands for public and private open spaces (Phase 1)
The related Phase 1 reports are available on the AUDRC website (https://www.audrc.org/researchpublications). The objective of this Phase 2 research is to:
• Identify changes between the current and likely future performance of urban precinct and housing case studies due to climate change-induced variations in temperature and rainfall.
Subsequent phases will:
• Develop and evaluate the performance of design proposals to adapt urban precinct and housing case studies to projected climate change using micro-climatic, building energy, and water modelling and community engagement (Phase 3)
• Develop CSUD principles for adaptation of WA urban precincts and housing to temperature and rainfall changes for inclusion in the revision of future state and local government policies and design guidance (Phase 4)
This report summarises Phase 2 of the project in relation to urban precinct case studies
2.2 Project governance
This project capitalises upon a long-term successful research collaboration with four partner organisations: The Western Australian Planning Commission (WAPC), the Department of Planning Lands and Heritage (DPLH), Development WA, and the Department of Housing and Works (DHW). The project also forges collaborations with CSIRO, the Water Corporation and WA Local Governments - the City of Karratha, the City of Greater Geraldton, the Shire of Toodyay, the City of Wanneroo, the City of Cockburn, the City of Vincent, and the City of Perth. Project coordination and reporting occur through biannual Partner Organisation meetings. Project updates will also be provided to AUDRC’s Advisory board, which comprises Emma Cole – Chair of the WAPC; Anthony Kannis– Chair of DPLH; Dean Mudford – CEO of Development WA, and Garrick Allen – Executive Director of Strategy Planning and Policy at the DHW and the Urban Design Research and Education Committee which includes officer level staff from the State Government Partner Organisations.
3. Methods
The objective for Phase 2 is to compare the likely future performance under climate change of selected urban precinct and housing case studies across WA’s climate regions with respect to thermal comfort of the outdoor environments, energy demand for heating and cooling within houses, and irrigation demands for public and private open spaces.
3.1 The case study precincts
3.1.1 Selection
The initial n=12 selected case study sites have been chosen with the Partner Organisations to represent cities/towns within WA’s broadscale climate regions, the ‘Monsoonal North’, ‘Rangelands’, and the South-Western Flatlands (see Table 2) The selected urban precinct case study sites have also been chosen to reflect:
• Established urban areas
• Contemporary best practice precincts developed or earmarked for development
• Areas of various area-level socio-economic disadvantage (ABS Index of Relative Socio-economic Disadvantage / IRSD) and
• Varying urban and open space morphologies (e.g., New Urbanism, Climate Sensitive Urban Design)
1 Broome North Kimberley Compact suburb Shire of Broome DevWA Established/ planned
• Broome North Waranyjarri Estate Design Guidelines
• State Planning Policy 7.3- Residential Design Codes
• The Broome North Structure Plan
• The Kimberley Vernacular Handbook
• State Planning Policy 7.0 Design of the Built Environment
2 Broome central Kimberley Traditional suburb Shire of Broome DHW
Established/ planned
• Shire of Broome Local Planning Strategy
• State Planning Policy 7.3- Residential Design Codes
• State Planning Policy 7.0 Design of the Built Environment
3 Bulgarra, Karratha Pilbara Radburn suburb City of Karratha DHW Established • State Planning Policy 7.3- Residential Design Codes
• The City of Karratha Local Planning Strategy
• The Pilbara Vernacular Handbook
• State Planning Policy 7.0 Design of the Built Environment
4 Karratha town centre Pilbara Medium density precinct City of Karratha DevWA
5 Maitland Park Geraldton Mid-West Park and schools City of Greater Geraldton
Established/ planned
• The City of Karratha Local Planning Strategy
• State Planning Policy 7.2 - Precinct Design
• State Planning Policy 7.0 Design of the Built Environment
Established/ planned
• Maitland Park Concept Masterplan report
• Broader planning for the precinct is encompassed in the City of Geraldton Local Planning Strategy.
• State Planning Policy 7.2 - Precinct Design
• State Planning Policy 7.3- Residential Design Codes
• Volume 2 - Apartments
• Public Parkland Planning & Design Guide
• State Planning Policy 7.0 Design of the Built Environment
6 Toodyay, River Hills Estate Wheatbelt Traditional main street/ suburb Shire of Toodyay DPLH/ WAPC Established/ planned • Shire of Toodyay Local Planning Strategy
• Liveable Neighbourhoods
• State Planning Policy 7.3- Residential Design Codes
• State Planning Policy 7.0 Design of the Built Environment
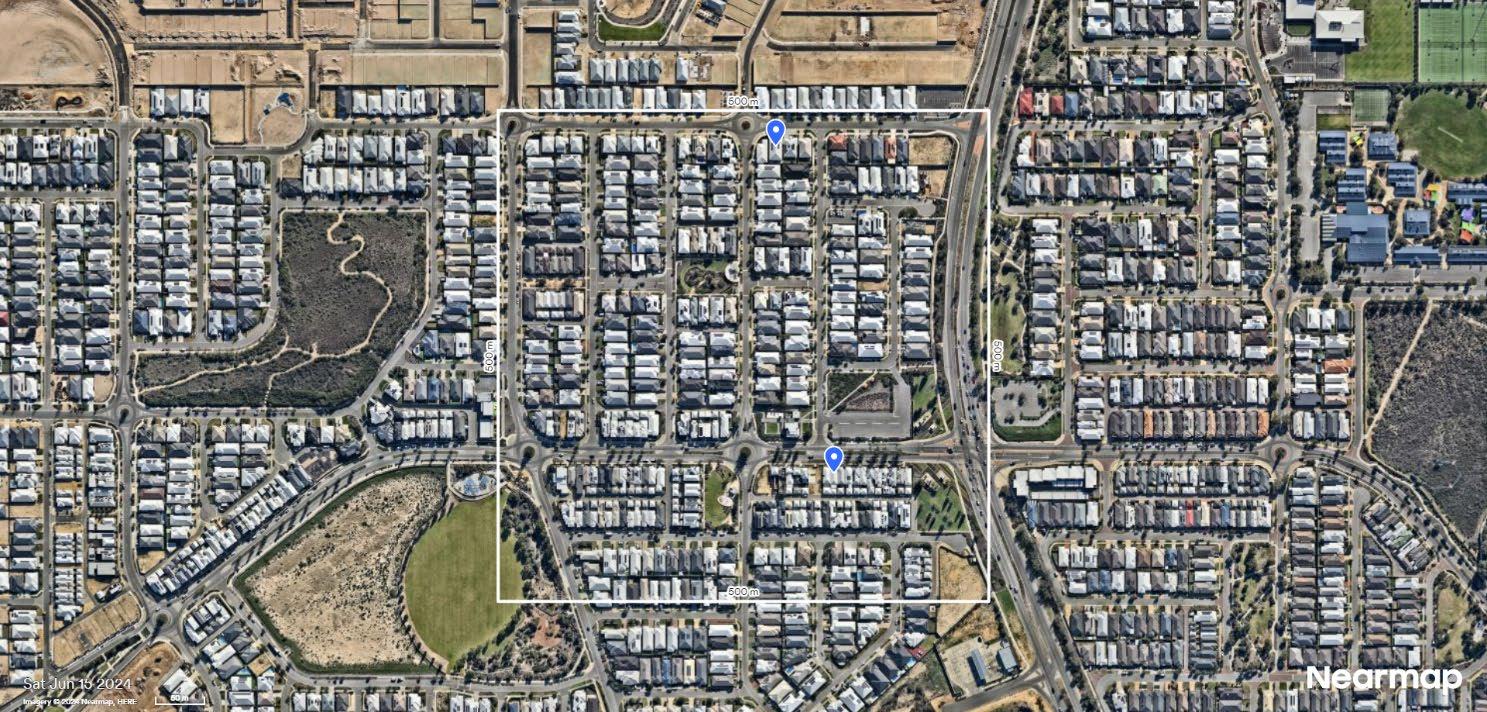
7 Jindalee Perth Compact suburb City of Wanneroo DPLH/ WAPC
Established • Liveable Neighbourhoods Policy
• Residential Design Codes Volume 1 for single houses and group dwellings below R60
• State Planning Policy 7.0 Design of the Built Environment
8 Nollamara Perth Infill suburb - DHW Established • State Planning Policy 7.3- Residential Design Codes
• The City of Stirling Planning Scheme No. 3
• State Planning Policy 7.0 Design of the Built Environment
9 Leederville town centre Perth Mediumdensity precinct/ TOD City of Vincent DPLH/ WAPC Planned
• State Planning Policy 4.2 Activity centres
• State Planning Policy 7.2 - Precinct Design
• State Planning Policy 7.0 Design of the Built Environment
10 Karawara, South Perth Perth Radburn suburb - DHW Established • Liveable Neighbourhoods policy
• State Planning Policy 7.3- Residential Design Codes
• State Planning Policy 7.0 Design of the Built Environment
11 Cockburn Central Perth Mediumdensity precinct/ TOD City of Cockburn DHW Established/ planned
• State Planning Policy 4.2 Activity centres
• State Planning Policy 7.2 - Precinct Design
• State Planning Policy 7.3- Residential Design Codes Volume 2 – Apartments
• Design guidelines for Cockburn Central West
• State Planning Policy 7.0 Design of the Built Environment
12 Salt Lane Perth Medium density precinct City of Cockburn DevWA Established/ planned
• State Planning Policy 7.2 - Precinct Design
• Cockburn Coast Design Guidelines for Robb Jetty and Emplacement
• State Planning Policy 7.0 Design of the Built Environment
3.2 Future climate conditions
3.2.1
Global climate change
The most recent report of the International Panel on Climate Change (IPCC) is Assessment Report 6 (IPCC, 2023) Working Group 1 (WGI) assessed five illustrative greenhouse gas (GHG) emissions scenarios based on the so-called “Shared Socio-economic Pathways (SSPs)” which are narratives about potential future socio-economic scenarios, summarised as follows:
SSP1: Sustainability:
• Emphasizes a shift towards sustainability, with inclusive development, low inequality, and strong global cooperation.
SSP2: Middle of the Road:
• Assumes a continuation of current trends, with moderate development and environmental challenges.
SSP3: Regional Rivalry:
• Presents a fragmented world with increased nationalism, limited cooperation, and slow technological progress.
SSP4: Inequality:
• Describes a world with widening inequalities between regions, with some focused-on technology and low-emissions while others face significant challenges.
SSP5: Fossil-fuelled Development:
• Focuses on rapid economic growth fuelled by fossil fuels and intensive resource use.
High and very high GHG emissions scenarios (SSP3-7.0 and SSP5-8.5) have CO2 emissions that approximately double from current levels by 2100 and 2050, respectively. The intermediate GHG emissions scenario (SSP2-4.5) has CO2 emissions remaining around current levels until the middle of the century. The very low and low GHG emissions scenarios (SSP1-1.9 and SSP1-2.6) have CO2 emissions declining to net zero around 2050 and 2070, respectively, followed by varying levels of net negative CO2 emissions.
A summary of the scenarios is set out in Table 3
Table 3 SSP GHG emissions scenarios
Scenario Emissions Limits warming to (by 2100): Likelihood
SSP1-1.9 Very low 1.5°C with no or limited overshoot >50% SSP1-2.6 Low 2°C >67%
SSP2-4.5 Intermediate 3°C >50%
SSP3-7.0 High 4°C >50%
SSP5-8.5 Very high Exceeds 4°C
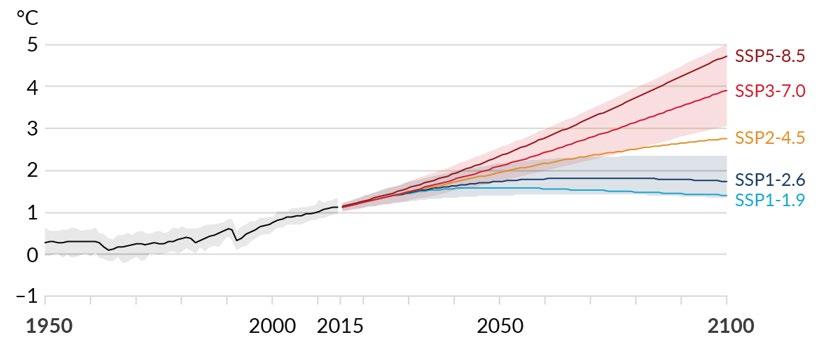
Figure 2 illustrates the surface temperature trajectory of each of the SSP scenarios. It should be noted that it is only SSP1-1.9 and SSP1-2.6 that achieve declining temperature by 2100. All other scenarios illustrate increasing warming beyond 2100.
Figure 2 Global surface temperature changes relative to 1850-1900. [Source: WG1 SPM Figure 8]
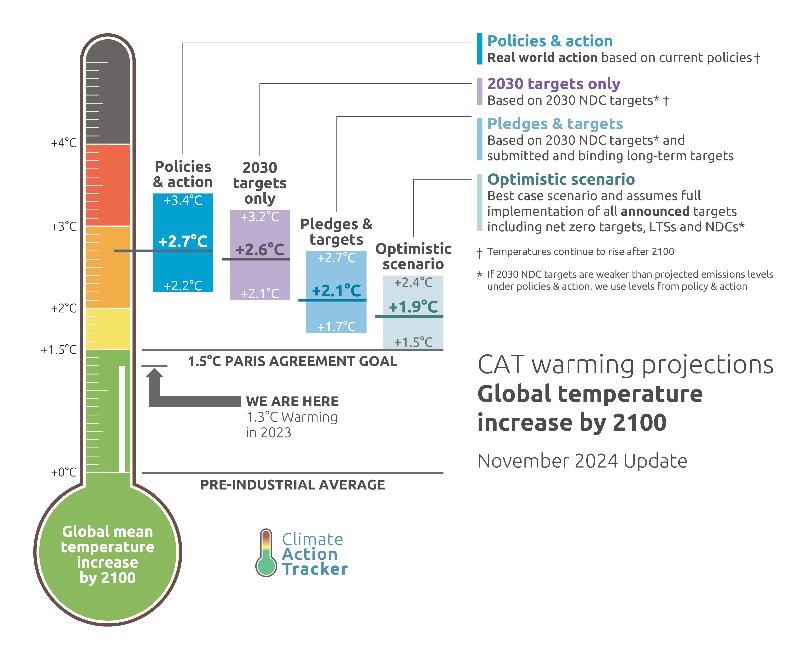
The Climate Action Tracker is an independent research project that monitors progress against the Paris agreement which aims to keep temperature increases " well below 2°C, and pursuing efforts to limit warming to 1.5°C" (Climate Action Tracker, 2024) Their most recent update is shown in Figure 3
Figure 3 Climate Action Tracker Nov 2024 Update
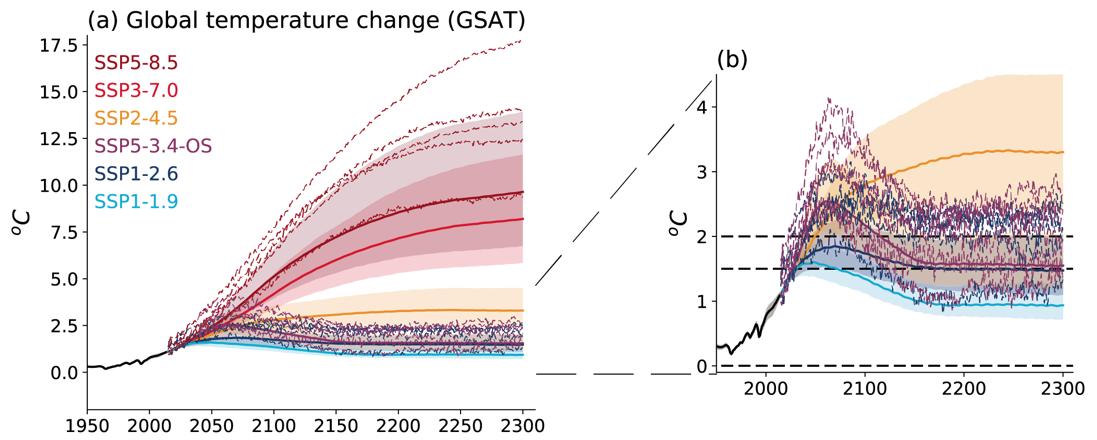
This analysis suggests that the current trajectory based on “real world action” is a temperature increase by 2100 of 2.2-3.4 °C, which reflects scenarios SSP1-4.5 and SSP3-7.0. As illustrated in Figure 4, SSP1-4.5 would result in Global Mean Surface Air Temperature (GSAT) stabilising at more than 3°C by 2300 and SSP3-7.0 reaching 7.5°C by 2300 and continuing to rise thereafter (Climate Action Tracker, 2024)
Figure 4 Global temperature change to 2300.
[Source: AR6 WG1 Figure 4.40]
In this research SSP1-4.5 and SSP3-7.0 have been used to evaluate potential climate conditions in Western Australia to 2100.
3.2.2 Climate models
The SSP scenarios are based on global climate models which were produced by the Coupled Model Intercomparison Project (CMIP), an international scientific collaboration. The CMIP project phase 6 (CMIP6) ensemble of model simulations was the key input to the IPCC Sixth Assessment Report. It involves many models contributed from numerous countries around the world.
Global climate models typically use a grid cell size of 100–200 km and therefore cannot reflect local conditions affected by variables such as altitudinal differences, topography, and distance from the coast. The Western Australian government’s Climate Science Initiative (CSI) has prepared a better resolution projection of the global climate models using “dynamical downscaling” to generate projections at a 20 km grid resolution. These improved projections were not available at the time of our Phase 2 research, and so alternative approaches have been used to inform the research reported here.
SimClim is a software product that facilitates analysis of the climate implications arising from the CMIP6 datasets at both a global and local scale for a number of climate variables including: Minimum, Mean and Maximum Temperature, Precipitation, Solar Radiation, Relative Humidity, Wind speed and direction, Sea Surface Temperature and Sea-level rise (Clim Systems, 2025). SimClim has been used in this research to illustrate the basic projected effects of the selected climate scenarios for the selected case studies in this research.
The microclimate modelling in this study uses so-called typical meteorological year weather files. CSIRO has produced a dataset of ‘Typical meteorological year weather files in epw format’, which comprise one year of weather data in hourly intervals for one of 83 Australian locations. The dataset is based on weather files developed for the Nationwide House Energy Rating Scheme (NatHERS) residential building simulation tools. The typical meteorological year weather dataset is based on historical weather data drawn from 1990 to 2015 using the method described by the New Zealand National Institute of Water and Atmospheric Research (NIWA). These files were used for this study's
Phase 1 modelling. CSIRO has also produced a set of files representing future weather, but these are based on the CMIP5 global climate models, rather than the latest CMIP6 models. Accordingly, for this research we have used the Future Weather Generator software developed by the ”Energy for Sustainability Initiative” at the University of Coimbra (Portugal) (Rodrigues, Fernandes, & Carvalho, 2023). The software produces weather files based on the CMIP6 models including for the SSP scenarios selected for this study.
3.3 Microclimate modelling
3.3.1
ENVI-met simulations
ENVI-met software (ENVI-met, 2021) was used to model the projected microclimatic conditions for each study site (metropolitan and regional). ENVI-met is a three-dimensional microclimate simulation software incorporating various scientific disciplines – from fluid dynamics and thermodynamics to plant physiology and soil science. ENVI-met simulates a specific meteorological situation for a specific planning scenario (generally the size of a neighbourhood). The horizontal resolution is typically 1-10 m, with simulated periods ranging from 1 to 5 days. The model domain size is typically between 50×50 and 500×500 grid cells horizontally and 20-50 grid cells vertically. ENVI-met comprises several sub-programs that collectively include:
• Short- and long-wave radiation fluxes considering shading multiple reflections from surfaces, buildings, and vegetation. Advanced modelling of radiative processes in plant canopies, including scatter and diffuse reflections
• Three-dimensional representation of trees using skeletal models to simulate biomechanical loads and deformations due to wind forces. Dynamic adjustment of seasonal effects (leafless to full canopy), including detailed simulation of radiation processes within the canopy.
• Determination of evapotranspiration and sensible heat fluxes to and from plants, including full simulation of all plant physical parameters (e.g. photosynthetic rate). Simulation of feedback processes between soil moisture and plant water stress.
• Dynamic calculation of surface and wall temperatures for each facade and roof element with up to three material layers and seven dynamic calculation points in the wall. Detailed data output for advanced analysis and generation of input data for use in building energy simulation software such as Energy Plus.
• Consideration of façade and roof greening in relation to all energy flows. Detailed simulation of greening systems, including construction type, substrate, and plant cover properties, considers complex processes such as radiation transmission and reflection or evaporation from plants and substrate.
• Simulation of water and heat exchange within the soil system. Three-dimensional heat transfer simulation as a function of soil material and water content. Advanced calculation of hydraulic water exchange in the soil, including root water uptake and plant water supply.
• Dispersion of gases and particles, considering both particulate and gaseous components. For particles, sedimentation and deposition processes on leaves and surfaces are included. Gaseous pollutants can be simulated, including photochemical transformation in the NO-NO₂ozone reaction cycle.
• The BIO-met post-processor can simulate various static comfort indices, such as the Physiological Equivalent Temperature (PET) or Universal Thermal Climate Index (UTCI).
• Simulation of Dynamic Thermal Comfort Calculation of transient biometeorological processes of virtual pedestrians walking through the ENVI-met model (ENVI-met, 2021).
ENVI-met software version 5.6.1 was employed for microclimatic modelling to benchmark the performance of all study sites. All buildings, surfaces, and vegetation were digitised in ArcMap 10.8.2. This involved identifying the material properties for roofs, walls, and surfaces, comparing them with the software’s default options, and creating required materials. The assigned IDs for the created materials were used during the digitisation process in ArcMap, resulting in the identification and creation of 17 different roof types, seven different wall types, and 11 different surface types in the project library (refer to the Digitisation Details Table in Appendix A of the Phase 1 report).
Vegetation modelling included the digitisation of grass, shrubs, and trees. As the default software library does not contain southern hemisphere trees, these were classified and created using the ENVI-met Albero program based on specific attributes such as height, crown height and width, trunk height, tree calendar, and leaf type and positioning. The model was then exported through QGIS version 3.34.8. The simulation was run using the future weather files (see section 3.2.2 for an average summer day, and the thermal comfort index, specifically the Physiological Equivalent Temperature (PET), was calculated using the detailed microclimate output for the study precincts.
The purpose of the Phase 2 modelling is to evaluate the impact of future climate change in comparison to the findings from Phase 1. The ENVI-met modelling was undertaken for SSP2-4.5 (2080) and SSP3-7.0 (2050 and 2080), noting that the two scenarios produce similar output for 2050.
The ENVI-met modelling was undertaken for a 14-hour period on an average summer day for each precinct. The average day was identified by comparing the hourly dry bulb temperature, relative humidity, and wind speed with the median hourly values of those variables. The graphs depicting this analysis are set out in the Appendices
The complete set of ENVI-met outputs for each precinct is included in the Appendices. These comprise:
• an aerial image of the precinct
• weather file input data for the selected day
• perspective images of the precinct depicting the modelled built form and vegetation
• a map illustrating the model surface materials
• Output maps illustrating conditions at the hottest hour of the day in respect of surface temperature, PET, air temperature, wind speed and direction, and specific humidity.
3.3.2
The PET index
This study used the Physiological Equivalent Temperature (PET) index as a proxy for human thermal comfort in outdoor environments. The Physiological Equivalent Temperature is defined as the air temperature at which, in a typical indoor setting (without wind and solar radiation), the heat budget of the human body is balanced with the same core and skin temperature under the complex outdoor conditions to be assessed
ENVI-met explains the PET calculation as follows:
• Define all incoming and outgoing fluxes in the human body
• Calculate a skin and a core temperature that matches all the calculated fluxes
• Transpose the person into an indoor environment
• Reset all data that are not available in an indoor environment (direct solar radiation, forced wind movement)
• Search for an indoor air temperature (as the only parameter) that results in the same skin temperature and core temperature as the outdoor setting.
• This theoretically calculated indoor temperature is called PET (ENVI-met, 2021).
3.4 Building performance
This research element aims to establish typical housing typologies' thermal performance and energy demand using building energy modelling (BEM) software.
Energy Plus is a whole-building energy simulation program that models the response of buildings to climatic conditions, including the calculation of internal thermal conditions and energy consumption (EnergyPlus, 2024) EnergyPlus is funded by the U.S. Department of Energy’s (DOE) Building Technologies Office (BTO) and managed by the National Renewable Energy Laboratory (NREL).
EnergyPlus models were developed for the selected housing typologies in each case study precinct and the simulation results for the existing climate were reported in the Phase 1 Housing Performance report. In this Phase 2 study the same models were run with the future weather files for SSP2-4.5 (2080) and SSP3-7.0 (2050 and 2080). The results of these simulations are set out in the companion Housing Climate Performance – Phase 2 report.
3.5 Irrigation demand
The irrigation requirements of various vegetation types depend on the location's evapotranspiration characteristics. Evapotranspiration is the combined process of evaporation from soil and plant surfaces and transpiration through plant surfaces (Burman & Pochop, 1994)
These have been derived from the Bureau of Meteorology datasets for daily reference evapotranspiration (ETo) from automatic weather station records and satellite measurements ETo is a theoretical measure based on a standardized vegetated surface. A grass crop with a uniform height of 0.12 m, an albedo of 0.23 and a fixed surface resistance of 70 sm-1 applies to a moderately dry soil surface with an approximately weekly irrigation frequency.
The irrigation requirements of various plant types have been taken from ‘Water Use Efficiency for Irrigated Turf and Landscape’ (Connellan, 2013)
Changes in evapotranspiration due to climate change have been derived from The Australian Water Outlook's National Hydrological Projections (Bureau of Meteorology, 2025a)
4. Results
4.1
Statewide climate projections
The following graphs are generated by SimClim AR6 and incorporate an ensemble of all the global climate models (GCMs) from CMIP6.
4.1.1 Air temperature
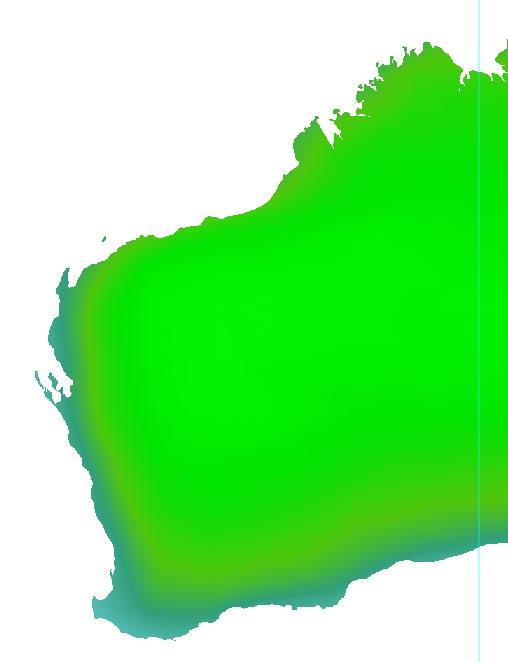
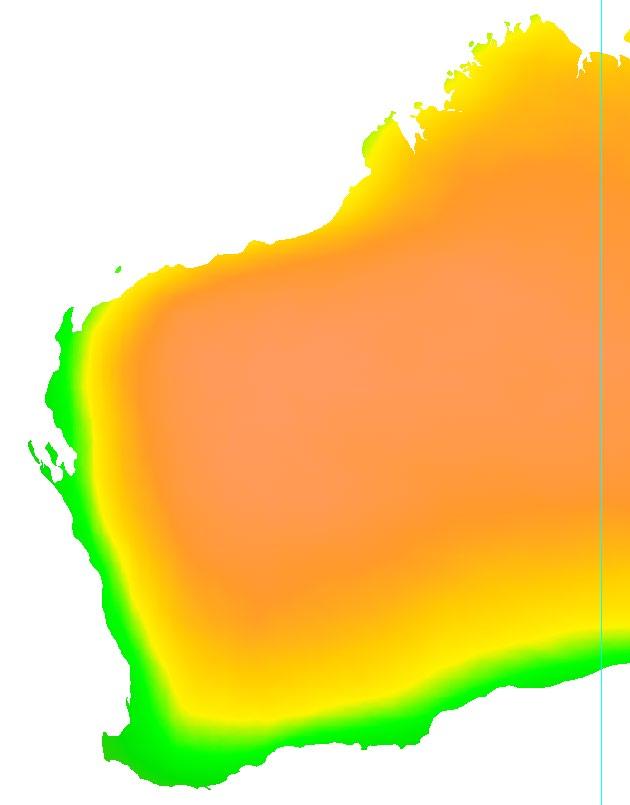
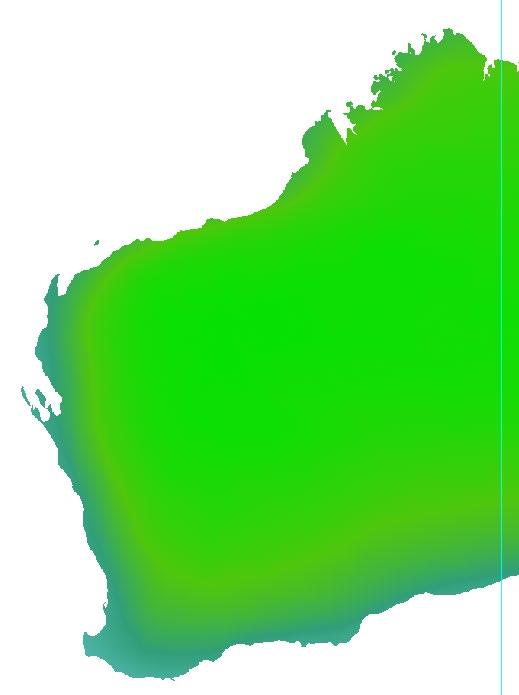
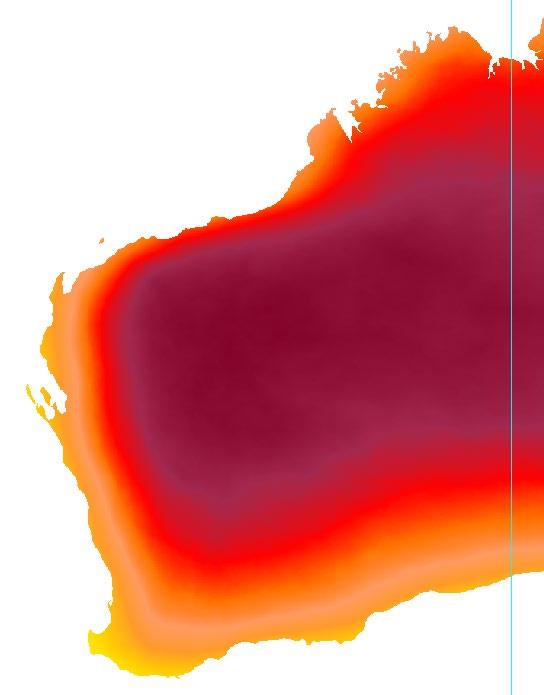
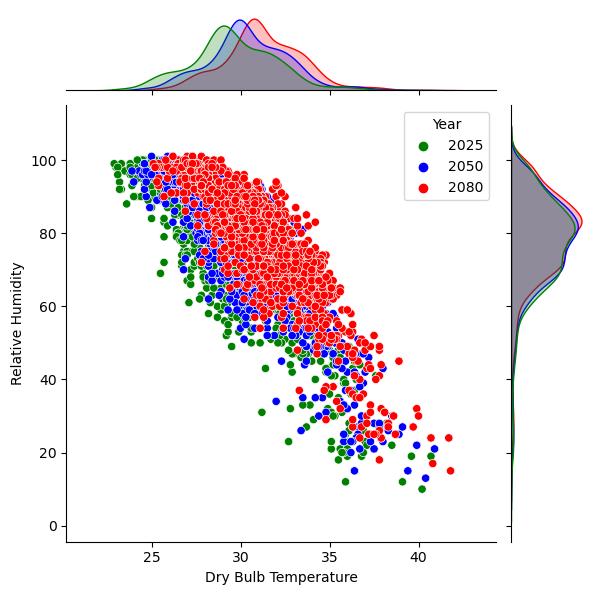
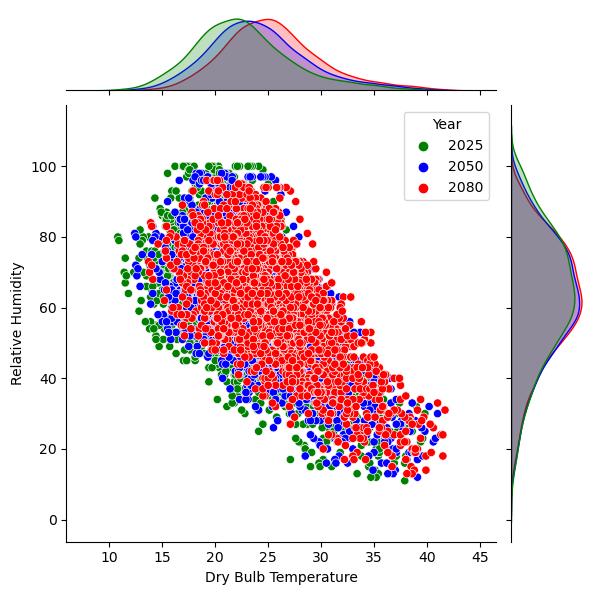
The impact of climate change is likely to vary significantly in respect of increased temperature. Inland areas will warm much more than coastal areas (see Figure 5). The southwest corner, which is influenced by the ocean to the west and the south, will warm less than other regions. Projections for 2050 are similar between the SSPs with significant differences developing post 2050. 2050
SSP2-4.5
SSP3-7.0
Figure 5 Mean annual temperature difference (C°) compared to 2005 base
4.1.2
Rainfall
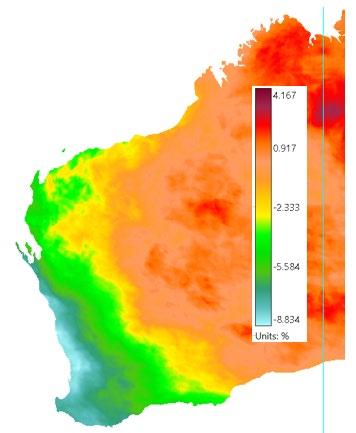
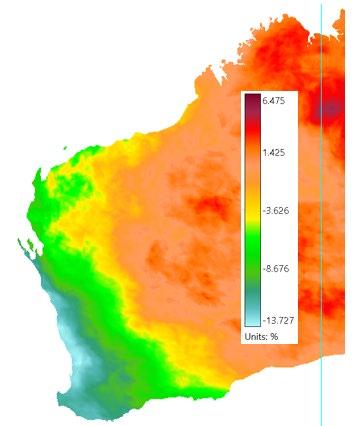
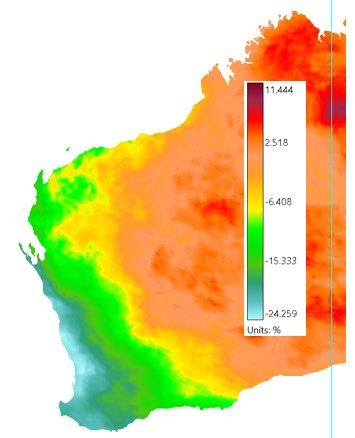
The projected changes in precipitation pattern spatially across the state (see Figure 6) are the same for each of the SSPs and timeframes, albeit with significant differences in magnitude of change. Rainfall in the interior of the state is projected to increase marginally. Larger increases of around 4% in the tropical north by 2050 and 6-11% by 2100 are projected. Coastal regions south of the Pilbara are projected to see significant reductions in annual rainfall during the century. The coastal southwest is projected to dry by 9% by 2050 and 14-24% by 2100.
SSP2-4.5
SSP3-7.0
Figure 6 Mean annual precipitation difference (%) compared to 1991-2020
4.1.3
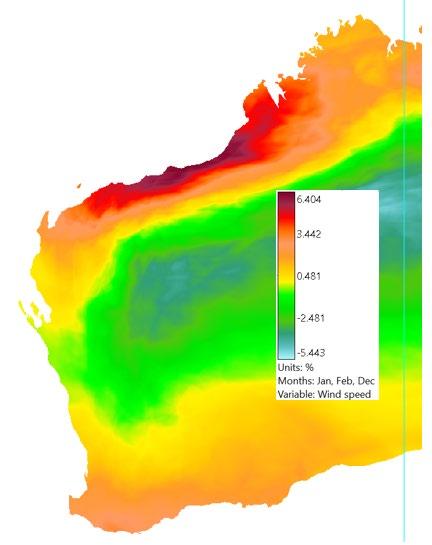
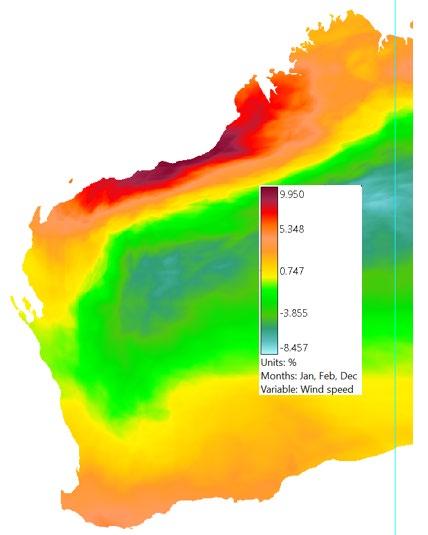
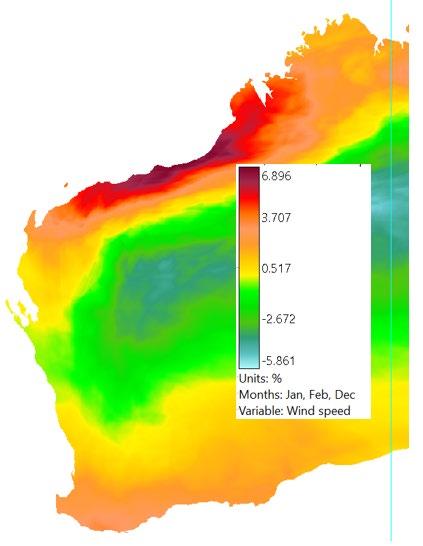
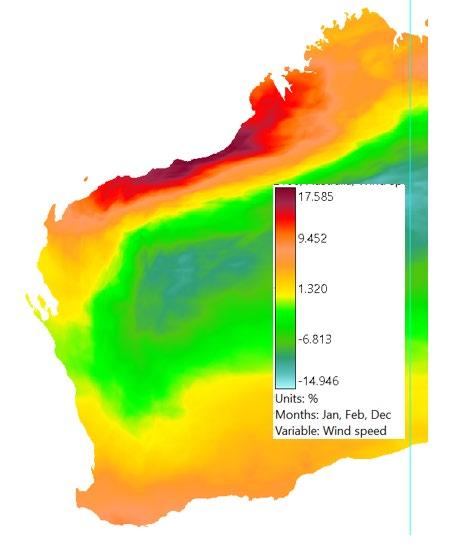
Wind speed
Changes to summer wind speeds for the scenarios are set out in Figure 7. The projected patterns are the same in all cases, but the relative changes vary. Average summer wind speeds are projected to increase along the Pilbara coast by around 6% by 2050 and 11-18% by 2080. Smaller increases are
predicted for the Broome area. Summer wind speeds in the Midwest including Geraldton and in the Perth, region are not projected to change significantly. 2050
SSP2-4.5
SSP3-7.0
Figure 7 Mean summer wind speed difference (%) compared to 1991-2020
The following temperature and humidity datasets are derived from the Future Weather Generator produced epw files, which represent each hour of a typical year. Each of the climate variables in the original (existing climate) file are “morphed” and so the changes over time reflect incremental changes to each variable. The precipitation projections are from SimClim AR6.
4.2
Macroclimate projections
4.2.1 Broome case studies (Climate Zone 33)
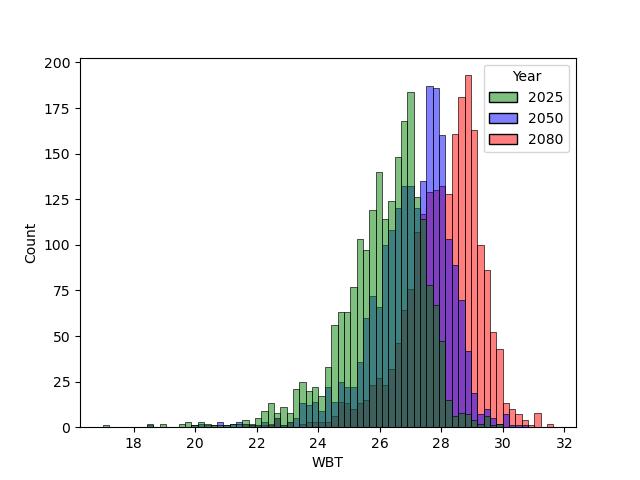
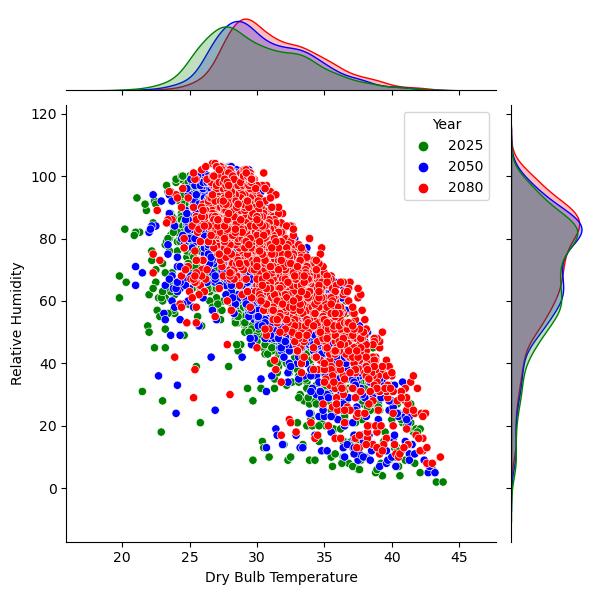
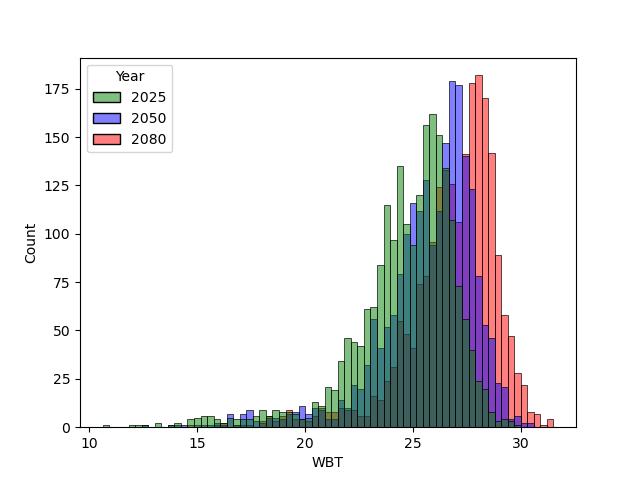
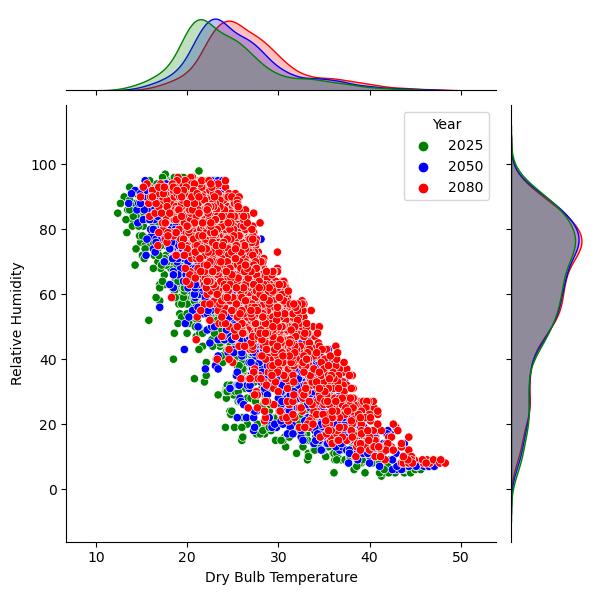
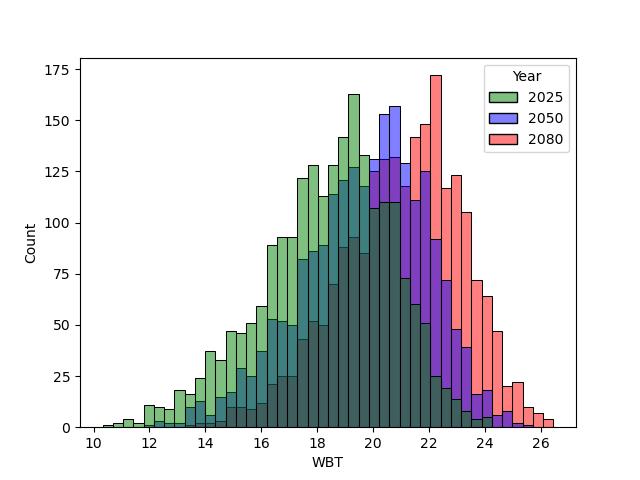
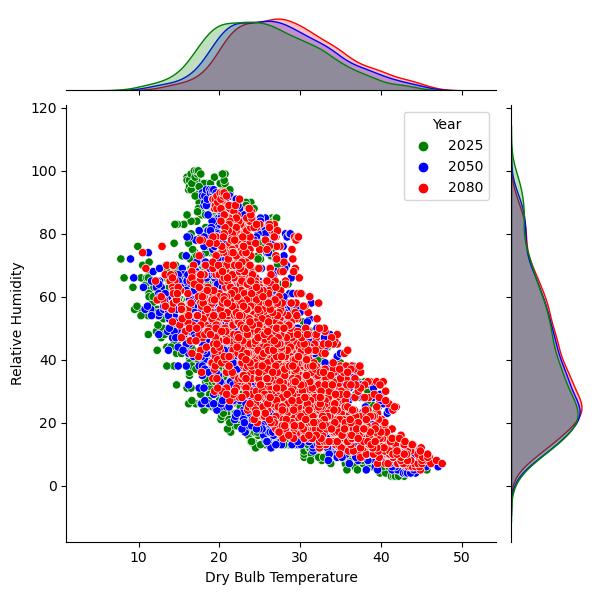
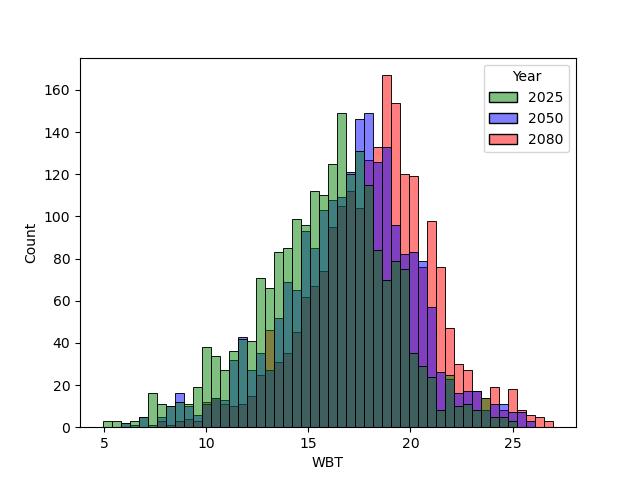
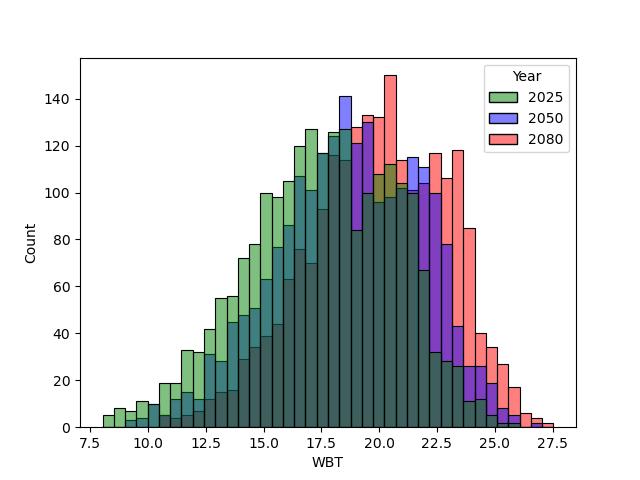
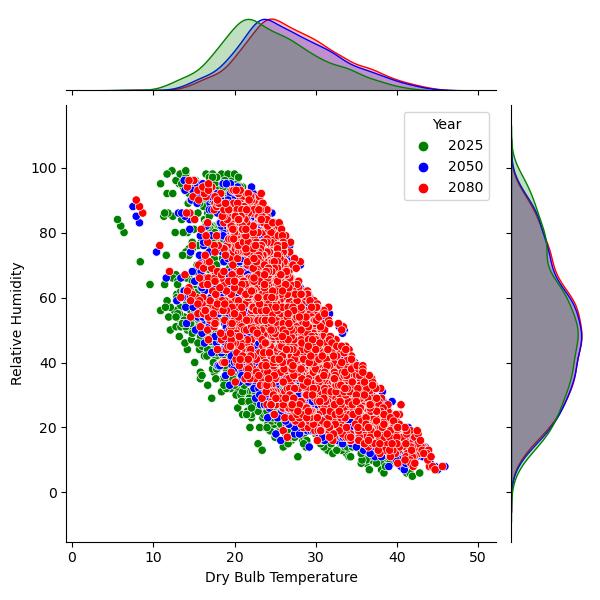
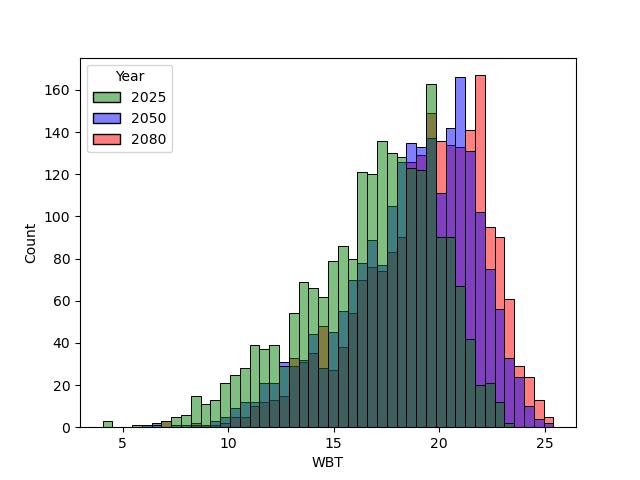
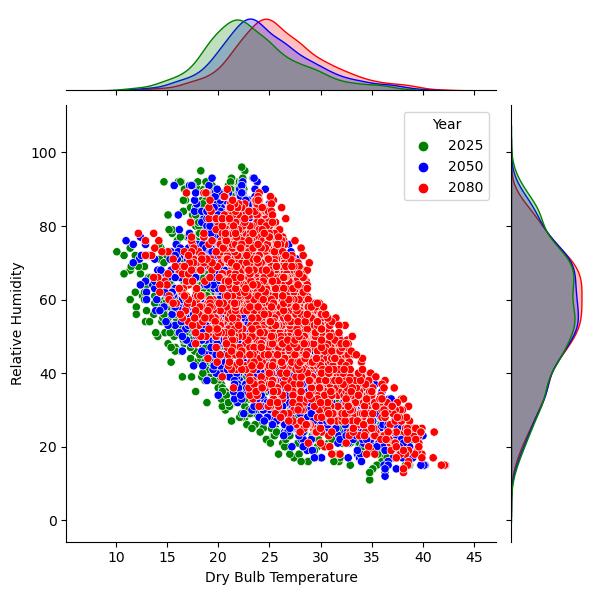
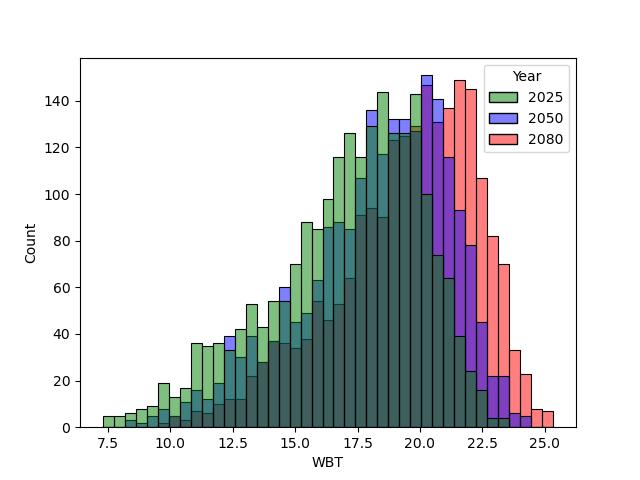
Figure 8 a) illustrates the likely progression of summer months temperature and relative humidity in Broome based on the NatHERS climate file for the region (CZ333) morphed in accordance with SSP3-
7.0 (high emissions scenario). Dry bulb temperatures are projected to increase and relative humidity to retain existing levels meaning wet bulb temperature (Figure 8b) will increase substantially over the century.
Figure 8 Broome - projected temperature and humidity (a) and wet bulb temperature (b) for CZ33 under SSP3-7.0 (summer months)
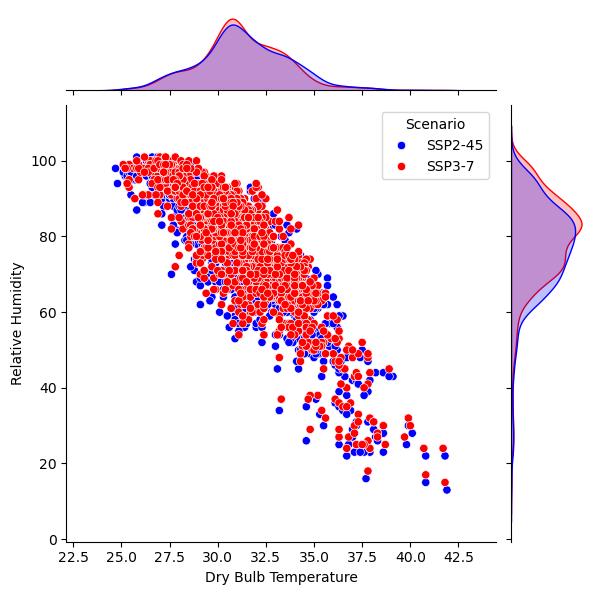
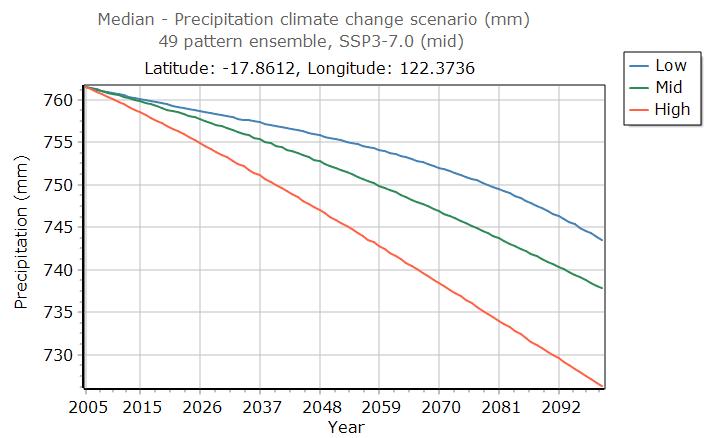
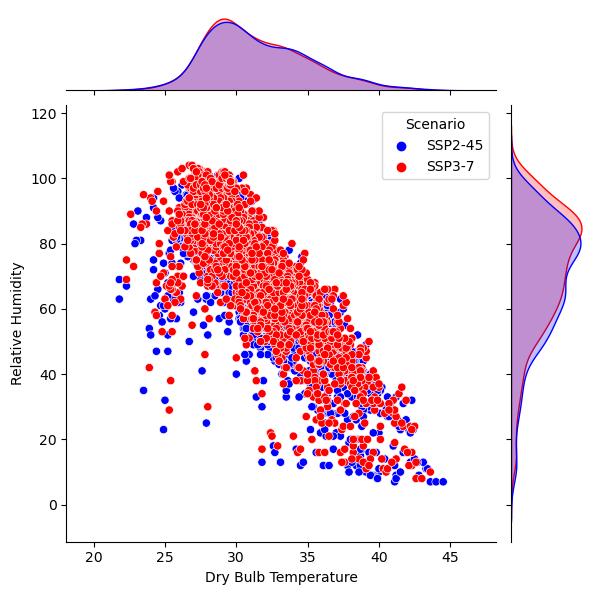
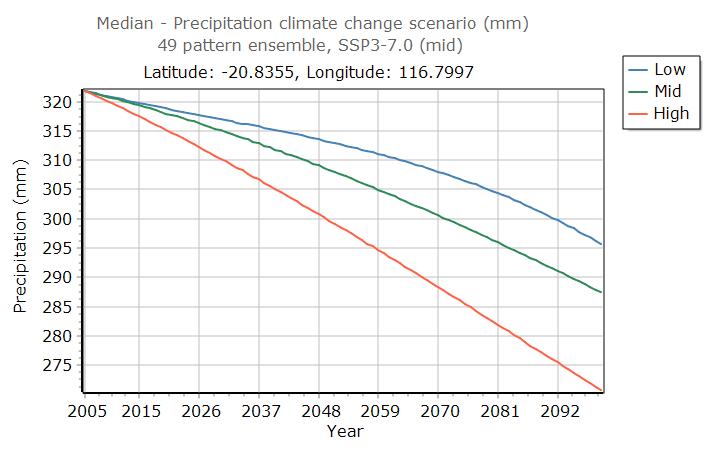
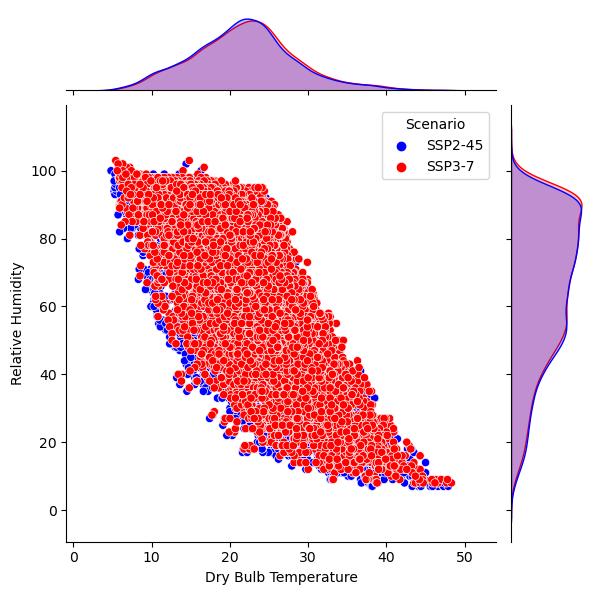
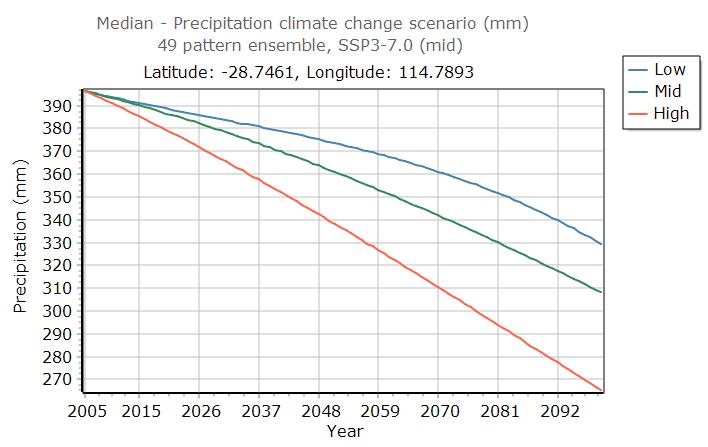
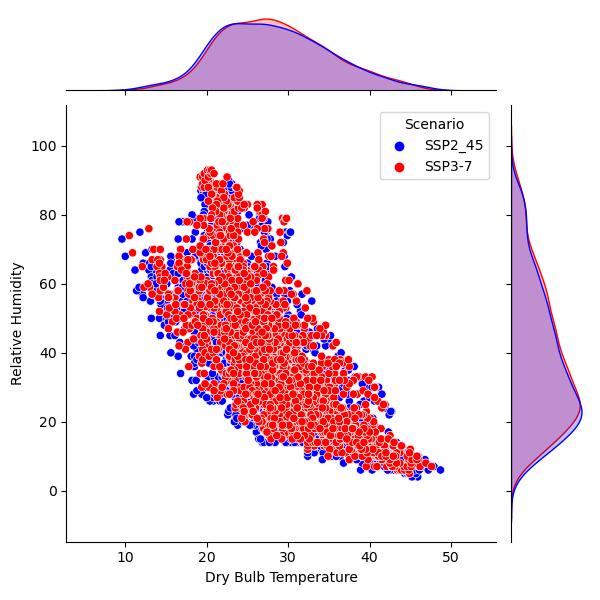
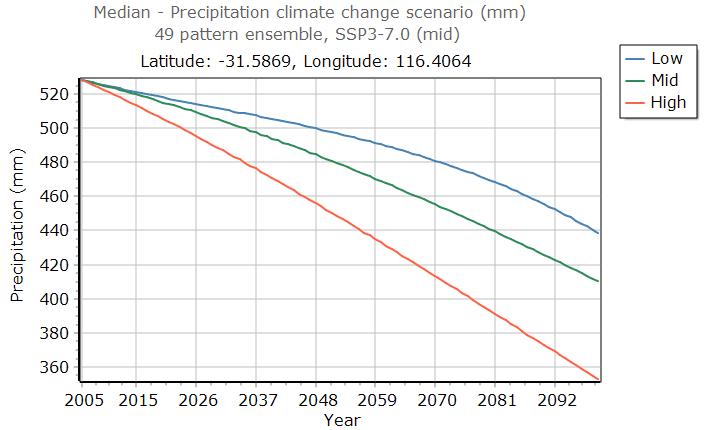
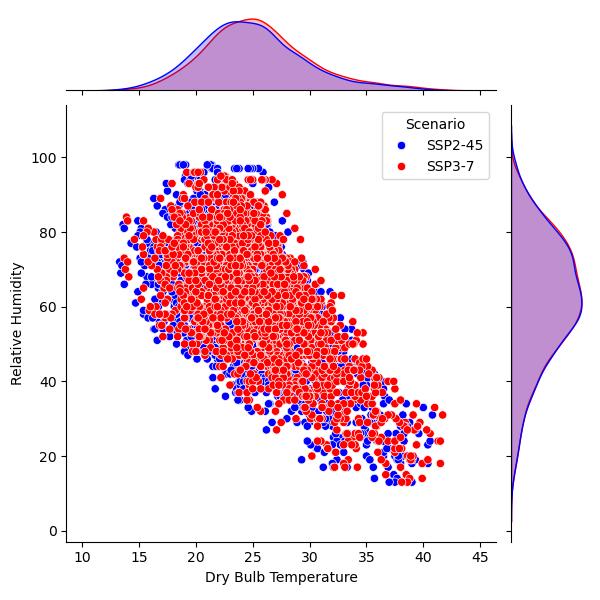
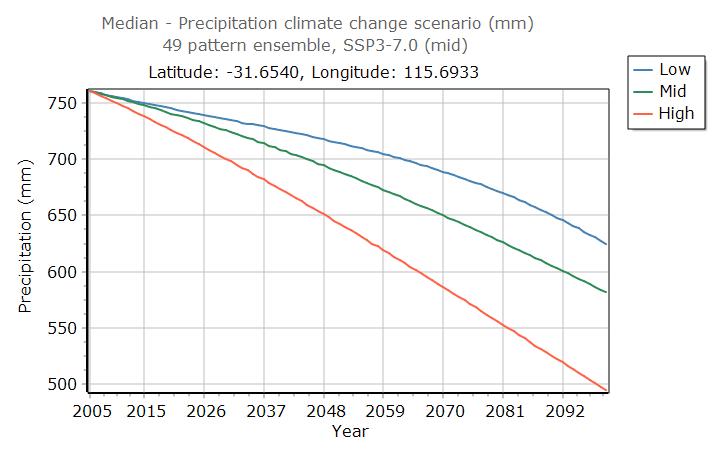
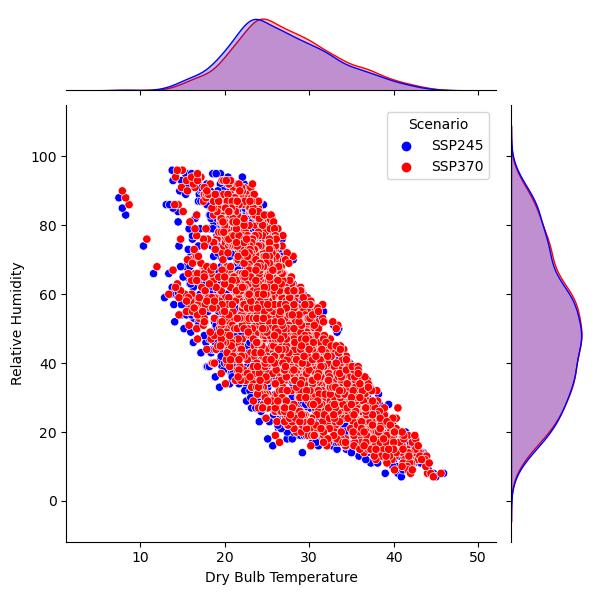
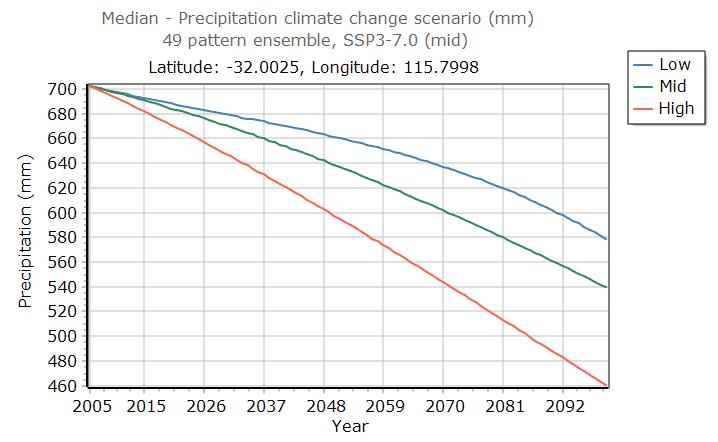
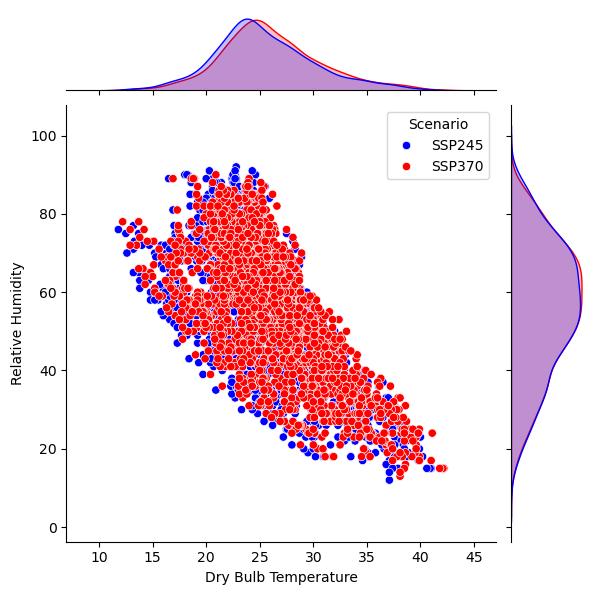
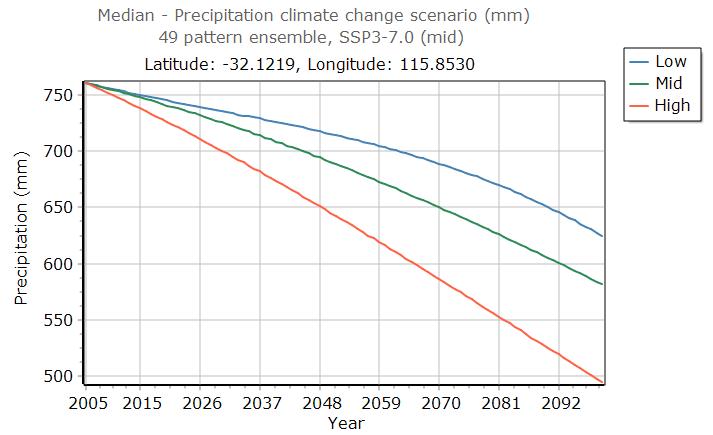
Projected changes in temperature and humidity by 2080 (Figure 9) are similar for SSP2-4.5 and SSP37.0 in CZ33 reflecting the coastal effect identified in Figure 5 Annual rainfall (Figure 10) is projected to decrease marginally by around 3% by 2100.
Figure 9 Broome - projected temperature and humidity for CZ33 under SSP2-4.5 and SSP3-7.0 (2080 summer)
Figure 10 Broome - projected rainfall under SSP37.0
4.2.2 Karratha case studies (Climate Zone 2)
Dry bulb temperatures are projected to increase and relative humidity to retain existing levels (Figure 11a) meaning wet bulb temperature (Figure 11b) will increase substantially over the century.
a) b)
Figure 11 Karratha - projected temperature and humidity (a) and wet bulb temperature (b) for CZ2 under SSP3-7.0 (summer months)
Projected changes in temperature and humidity by 2080 (Figure 12) are similar for SSP2-4.5 and SSP37.0 in CZ2. Annual rainfall (Figure 13) is projected to decrease by 8-16% by 2100.
Figure 12 Karratha - projected temperature and humidity for CZ2 under SSP2-4.5 and SSP3-7.0 (2080 summer)
Figure 13 Karratha - projected rainfall under SSP37.0
4.2.3 Geraldton case study (Climate Zone 12)
Dry bulb temperatures are projected to increase and relative humidity to retain existing levels (Figure 14a) meaning wet bulb temperature (Figure 14b) will increase substantially over the century. a) b)
Figure 14 Geraldton - projected temperature and humidity (a) and wet bulb temperature (b) for CZ12 under SSP3-7.0 (summer months)
Projected changes in temperature and humidity by 2080 (Figure 15) are similar for SSP2-4.5 and SSP37.0 in CZ12. Annual rainfall (Figure 16) is projected to decrease by 17-33% by 2100.
Figure 15 Geraldton - projected temperature and humidity for CZ12 under SSP2-4.5 and SSP3-7.0 (2080 summer)
Figure 16 Geraldton - projected rainfall under SSP37.0
4.2.4 Toodyay case study (Climate Zone 44)
Dry bulb temperatures are projected to increase and relative humidity to retain existing levels (Figure 17a) meaning wet bulb temperature (Figure 17b) will increase over the century. a) b)
Figure 17 Toodyay - projected temperature and humidity (a) and wet bulb temperature (b) for CZ44 under SSP3-7.0 (summer months)
Projected changes in temperature and humidity by 2080 (Figure 18) are similar for SSP2-4.5 and SSP37.0 in CZ44. Annual rainfall (Figure 19) is projected to decrease by 17-33% by 2100.
Figure 18 Toodyay - projected temperature and humidity for CZ44 under SSP2-4.5 and SSP3-7.0 (2080 summer)
Figure 19 Toodyay - projected rainfall under SSP37.0
4.2.5 Jindalee case study (Climate Zone 52)
Dry bulb temperatures are projected to increase and relative humidity to retain existing levels (Figure 20a) in Perth’s coastal north meaning wet bulb temperature (Figure 20b) will increase over the century.
a)
b)
Figure 20 Jindalee - projected temperature and humidity (a) and wet bulb temperature (b) for CZ52 under SSP3-7.0 (summer months)
Projected changes in temperature and humidity by 2080 (Figure 21) are similar for SSP2-4.5 and SSP37.0 in CZ52. Annual rainfall (Figure 22) is projected to decrease by 18-34% by 2100.
Figure 21 Jindalee - projected temperature and humidity for CZ52 under SSP2-4.5 and SSP3-7.0 (2080 summer)
Figure 22 Jindalee - projected rainfall under SSP3-7.0
4.2.6 Leederville, Perth, Nollamara, and Karawara case studies (Climate Zone 13)
Dry bulb temperatures are projected to increase and relative humidity to retain existing levels (Figure 23a) in Perth’s central and eastern regions meaning wet bulb temperature (Figure 23b) will increase over the century. a) b)
Figure 23 Perth central - projected temperature and humidity (a) and wet bulb temperature (b) for CZ13 under SSP3-7.0 (summer months)
Projected changes in temperature and humidity by 2080 (Figure 24) are similar for SSP2-4.5 and SSP37.0 in CZ13. Annual rainfall (Figure 25) is projected to decrease by 18-35% by 2100.
Figure 24 Perth central - projected temperature and humidity for CZ13 under SSP2-4.5 and SSP37.0 (2080 summer)
Figure 25 Perth central - projected rainfall under SSP3-7.0
4.2.7 Cockburn Central and Salt Lane case studies (Climate Zone 54)
Dry bulb temperatures are projected to increase and relative humidity to retain existing levels (Figure 26a) in Perth’s south western regions meaning wet bulb temperature (Figure 26b) will increase over the century.
a)
b)
Figure 26 Perth southwest - projected temperature and humidity (a) and wet bulb temperature (b) for CZ54 under SSP3-7.0 (summer months)
Projected changes in temperature and humidity by 2080 (Figure 27) are similar for SSP2-4.5 and SSP37.0 in CZ13. Annual rainfall (Figure 28) is projected to decrease by 18-35% by 2100.
Figure 27 Perth southwest - projected temperature and humidity for CZ54 under SSP2-4.5 and SSP3-7.0 (2080 summer)
4.2.8 Irrigation demand
Figure 28 Perth southwest - projected rainfall under SSP3-7.0
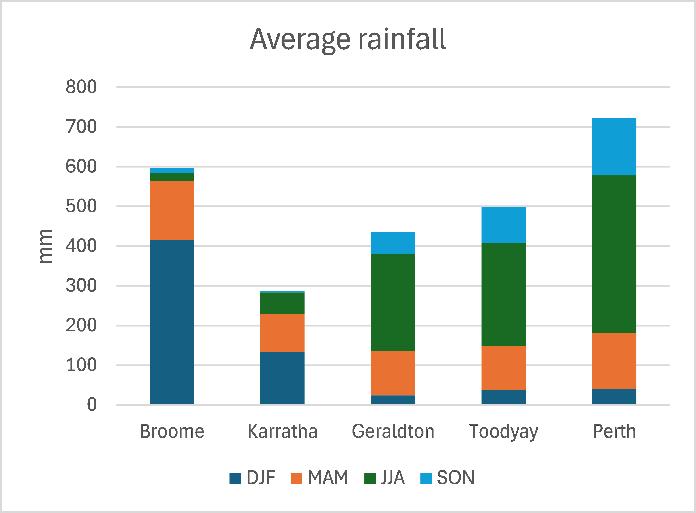
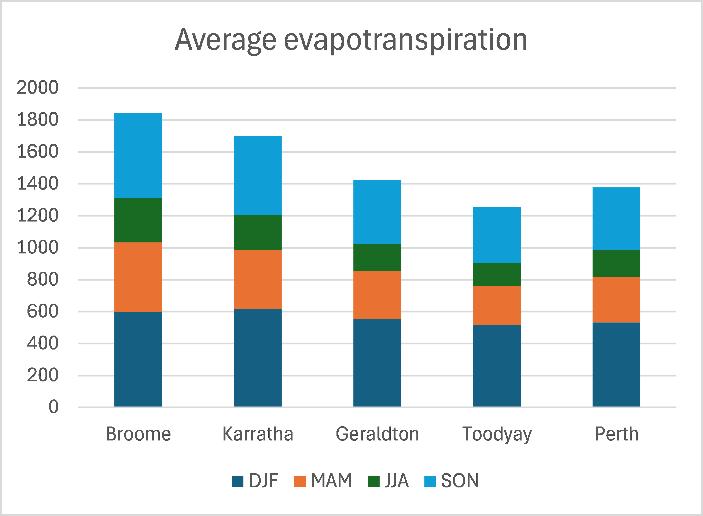
Save for Broome, all other case study areas are projected to have significantly declining annual rainfall due to climate change, with the magnitude increasing with latitude. Historical rainfall in the summer months (Figure 29) is negligible in the south of the state when reference evapotranspiration 1 (ETo) is seasonally highest (Figure 30).
The Bureau of Meteorology (BOM) has published National Hydrological Projections Assessment reports 2 for Australia’s climate regions which provide an indication of likely future evapotranspiration,
1 Reference evapotranspiration (ETo) is a standardized measure of the amount of water evaporated from a hypothetical reference surface of well-watered grass, with a fixed height of 0.12 m, uniform coverage, and a specific albedo and surface resistance.
2 https://awo.bom.gov.au/about/overview/assessment-reports
Figure 29 Historical seasonal rainfall in WA
Figure 30 Historical seasonal ET in WA
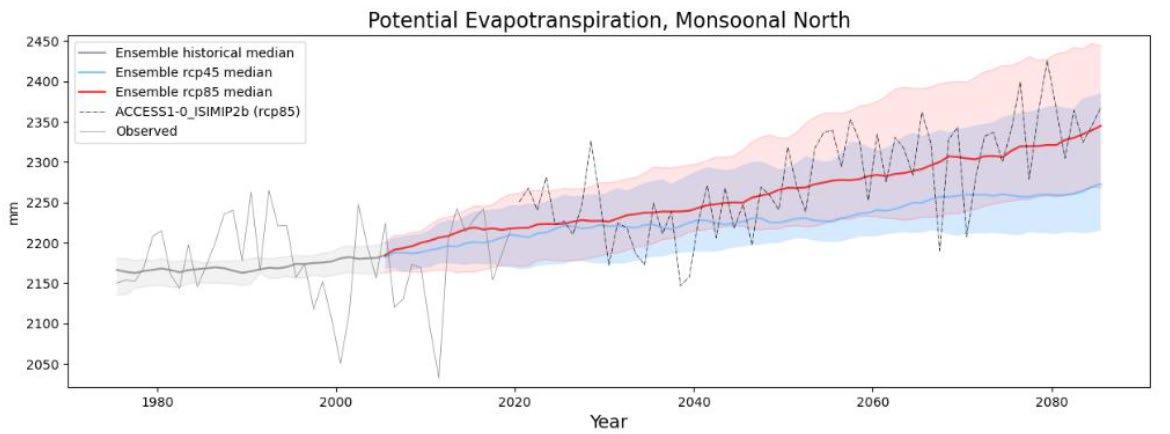
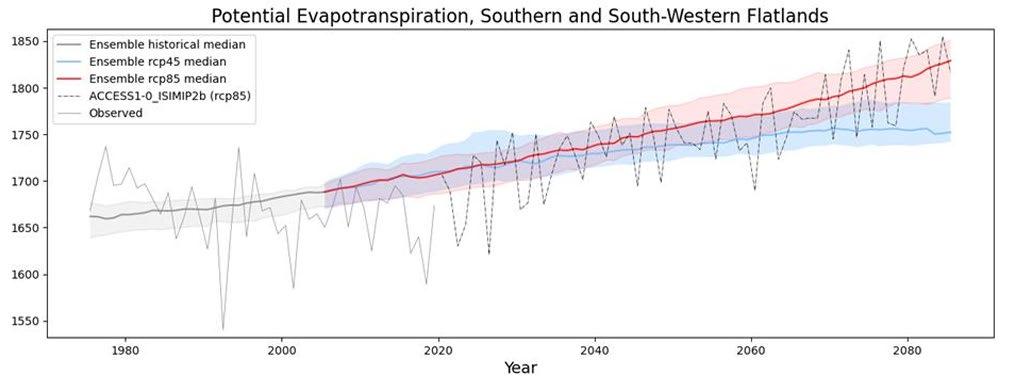
which together with summer rainfall illustrate the potential future pressures on irrigation demand in urban settings such as private and public open space (Bureau of Meteorology, 2025b) Figure 31 identifies the modelled changes in Potential Evapotranspiration 3 in the Monsoonal North under RCP4.5 (similar to SSP2-4.5) and RCP 8.5 (higher emissions than SSP3-7.0). Changes in Potential Evapotranspiration cannot be directly related to changes in Eto but illustrate an increase in irrigation demand given that summer rainfall and relative humidity is projected to be similar to historical levels
Figure 31 Monsoonal north - projected potential evapotranspiration.
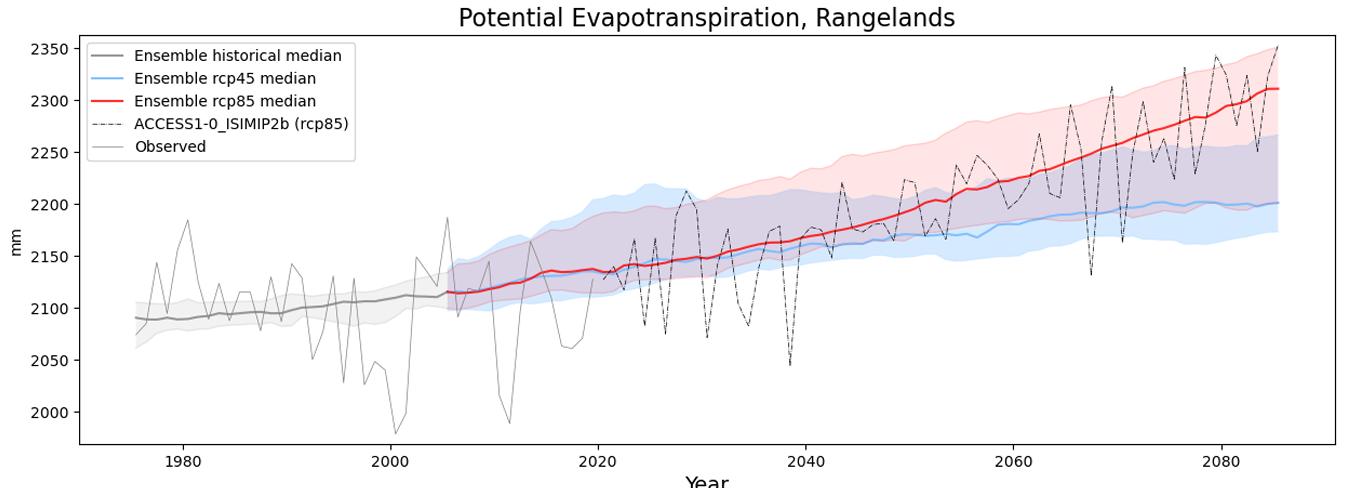
Similar projections are made for the Rangelands (Figure 32), incorporating Karratha and the SouthWestern Flatlands (Figure 33) which includes Geraldton, Toodyay and Perth.
Figure 32 Rangelands - projected potential evapotranspiration.
3 Potential Evapotranspiration (PET) is the maximum amount of water that would be transferred to the atmosphere from a land surface if there were an unlimited supply of water available for evaporation and plant transpiration.
Figure 33 South-Western Flatlands - projected potential evapotranspiration.
4.3 Microclimate modelling
SSP2-4.5 and SSP3-7.0 are projected to lead to very similar climate conditions in 2050, so ENVI-met simulations have been run for each of the case study precincts for the following scenarios:
• SSP3-7.0 (2050 and 2080)
• SSP2-4.5 (2080)
Maps have been produced for the same ‘average summer day’ as in the Phase 1 report for each scenario, including:
• Surface temperature
• Physiological Equivalent Temperature (PET)
• Wind speed and direction.
These maps are included in Appendix A, together with details of the selected day for simulation and maps of the tree canopy coverage and model surfaces. Maps that compare the PET results for each scenario are set out in the following sections for a representative case study in each location.
The Phase 1 report includes a detailed description of each case study site and associated climate zone.
4.3.1 Broome case studies
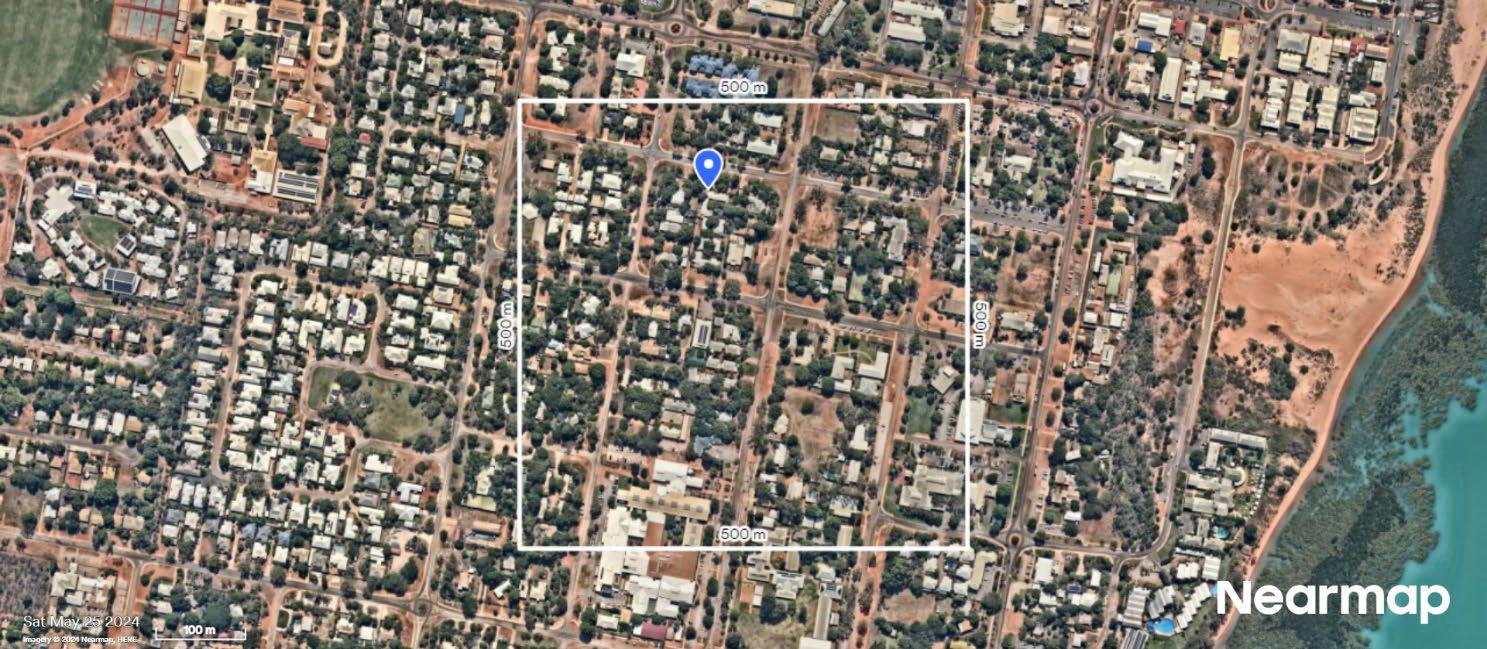
Broome central
34: The Broome central case study precinct.
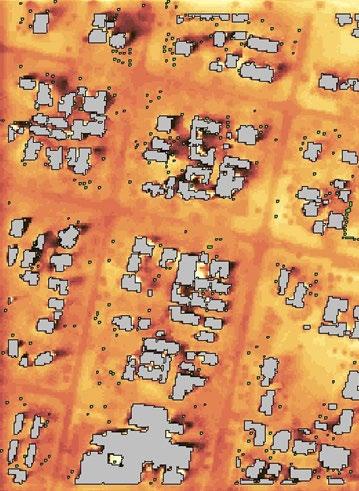
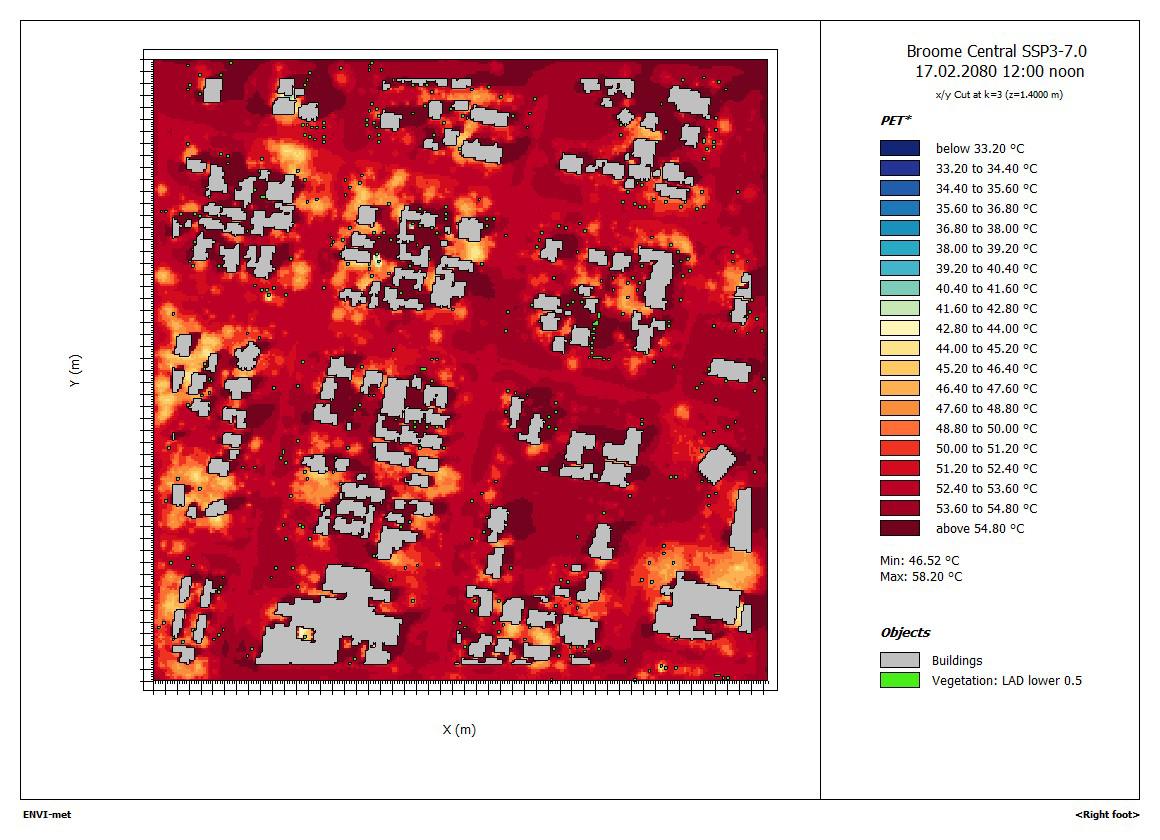
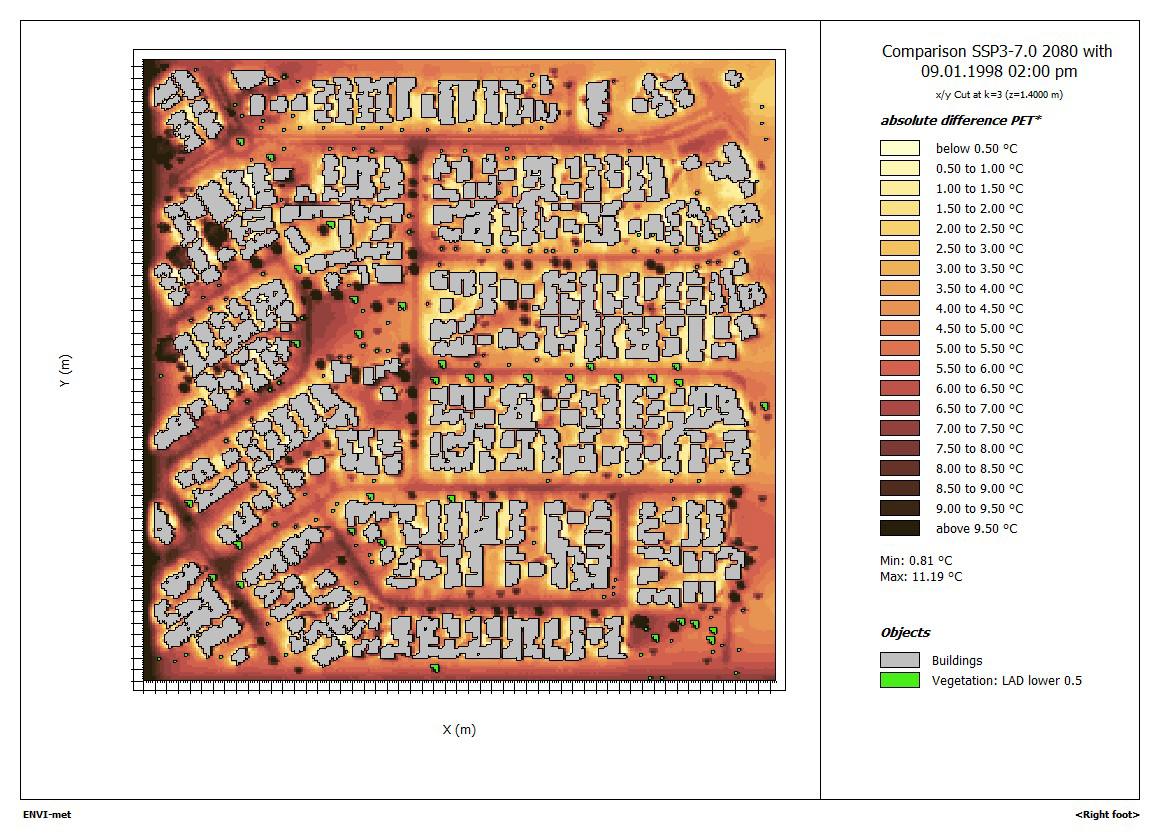
The ENVI-met map below shows the outdoor thermal comfort conditions (PET) at the hottest time (midday) of an average summer day in 2080 under SSP3-7.0 (Figure 35).
Figure 35 Broome Central - PET in 2080 (SSP3-7.0) Strong heat stress equates to PET ≥ 35°C and extreme heat stress equates to PET ≥ 40°C.
Figure
The ENVI-met maps below indicate the change in outdoor thermal comfort conditions (PET) at the hottest time (midday) of an average summer day under SSP2-4.5 and SSP3-7.0 compared to the present climate (Figure 37, Figure 38, and Figure 38)
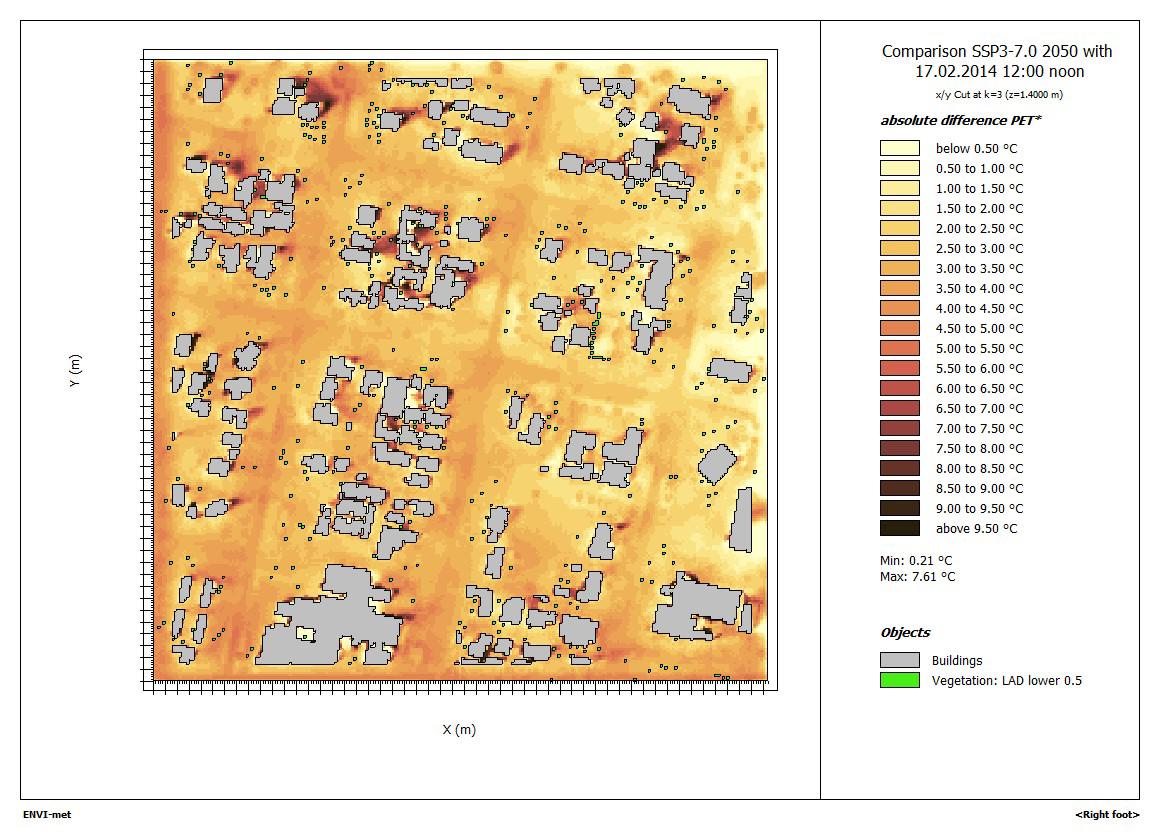
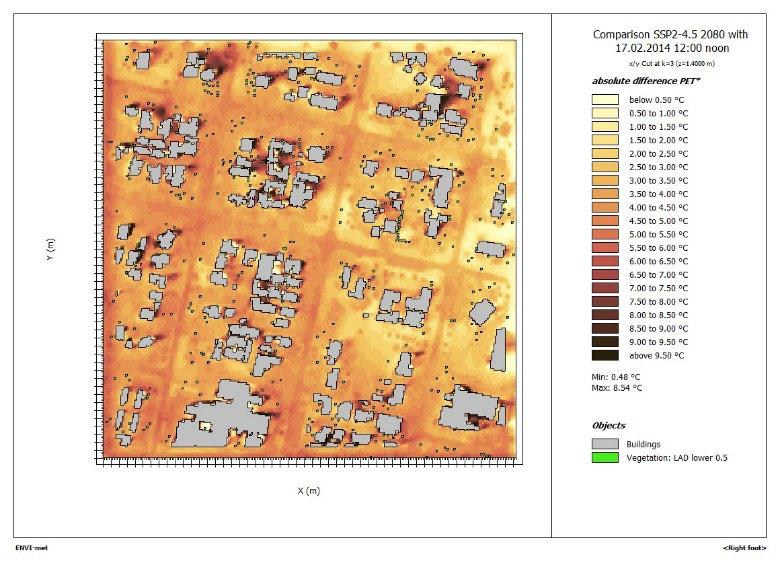
Figure 36 Broome Central - Difference in PET 2050-Present (SSP3-7.0)
PET 2080-Present (SSP3-7.0)
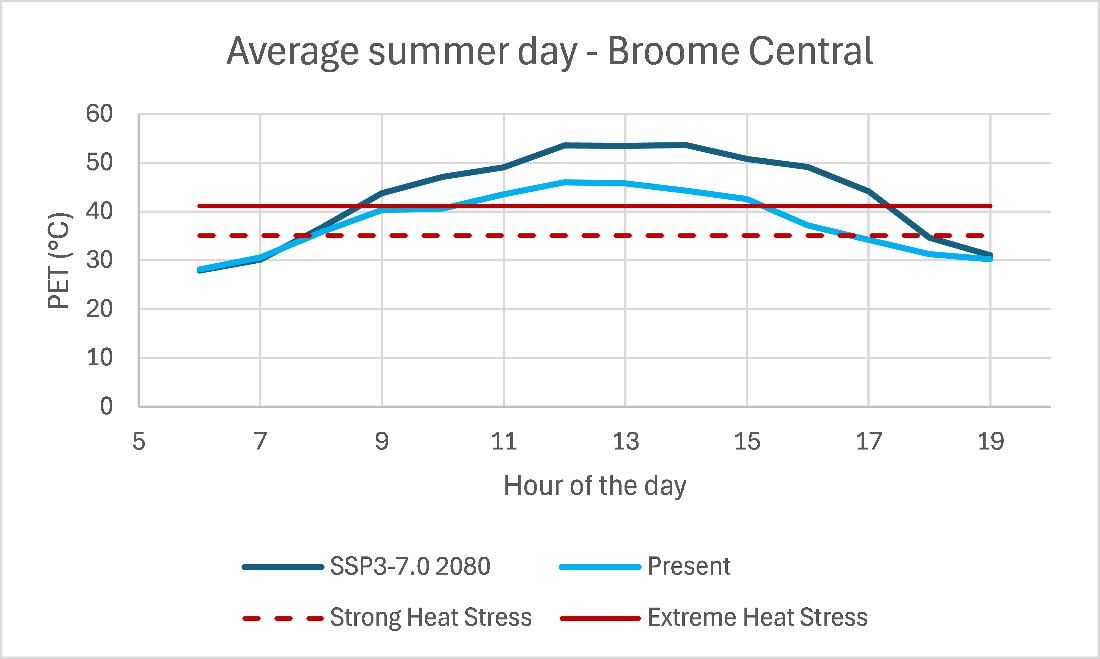
The comparison of present and future PET in a typical streetscape is set out in Figure 39 and the daylight hours in which the PET exceeds heat stress thresholds is in Table 4.
Figure 37 Broome Central - Difference in PET 2080-Present (SSP2-4.5)
Figure 38 Broome Central - Difference in
Figure 39 Broome Central - PET in typical streetscape.
Table 4 Broome Central - exceedance of PET thresholds
SSP3-7.0 2080
The results indicate that by 2080 71% of hours of the day give rise to strong heat stress and 64% extreme heat stress
Broome north
The ENVI-met map below shows the outdoor thermal comfort conditions (PET) at the hottest time (midday) of an average summer day in 2080 under SSP3-7.0 (Figure 40).
Figure 40 Broome North - PET in 2080 (SSP3-7.0). Strong heat stress equates to PET ≥ 35°C and extreme heat stress equates to PET ≥ 40°C.
ENVI-met difference maps are not available for this case study as the model geometry was modified in the future climate runs to reflect future development. However, the changes are similar to those in Broome Central.
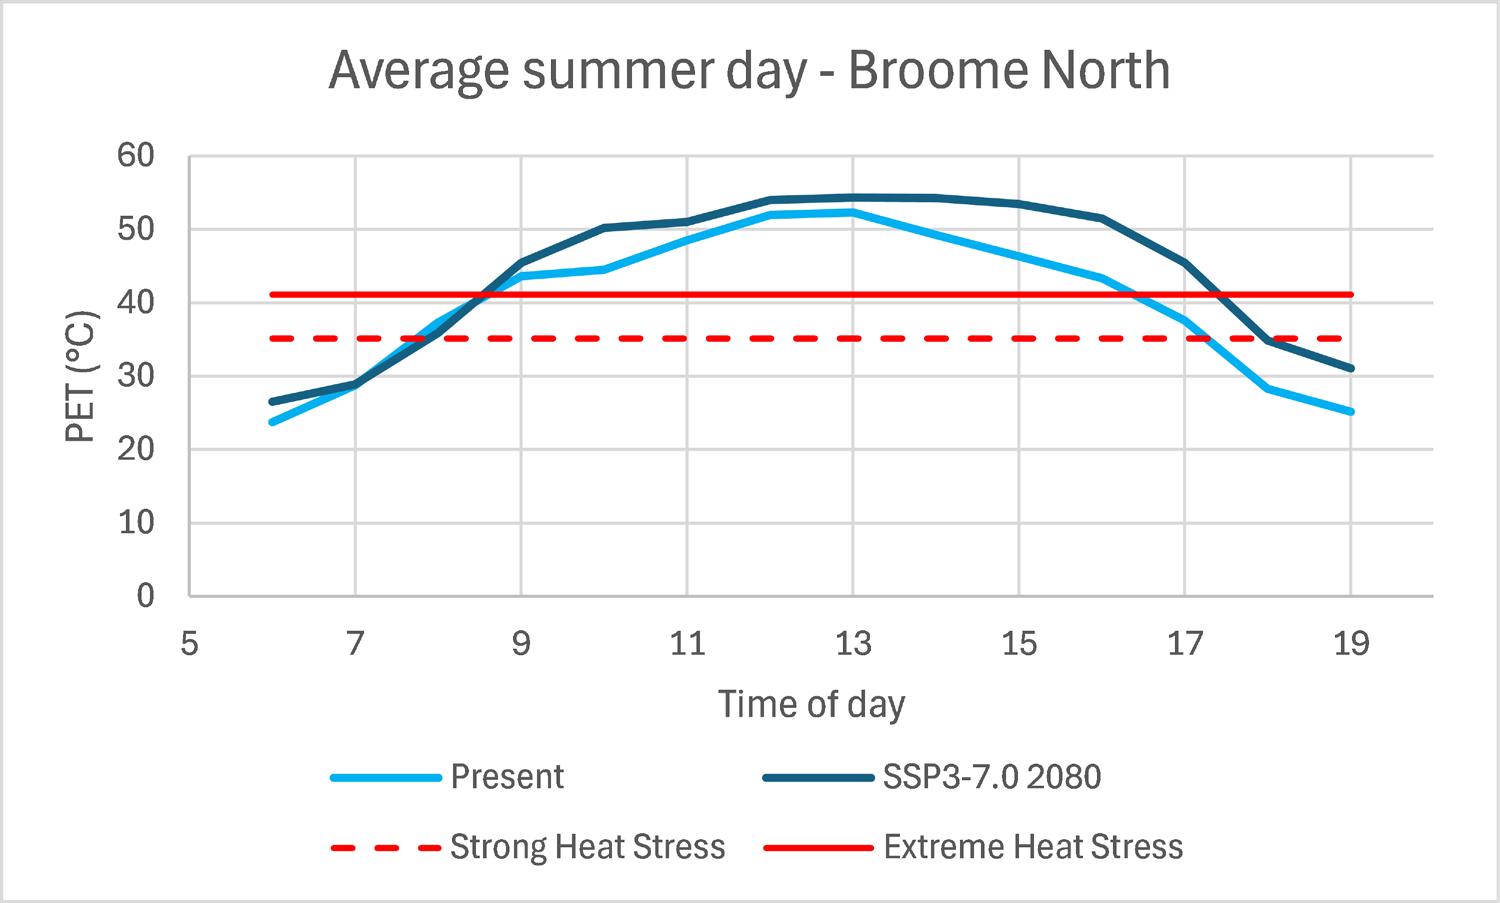
The comparison of present and future PET in a typical streetscape is set out in Figure 41 and the daylight hours in which the PET exceeds heat stress thresholds is in Table 5.
41
Figure
Broome North - PET in typical streetscape.
Table 5 Broome North - exceedance of PET thresholds
The results indicate that by 2080 71% of hours of the day give rise to strong heat stress and 64% extreme heat stress.
4.3.2 Karratha case studies Bulgarra
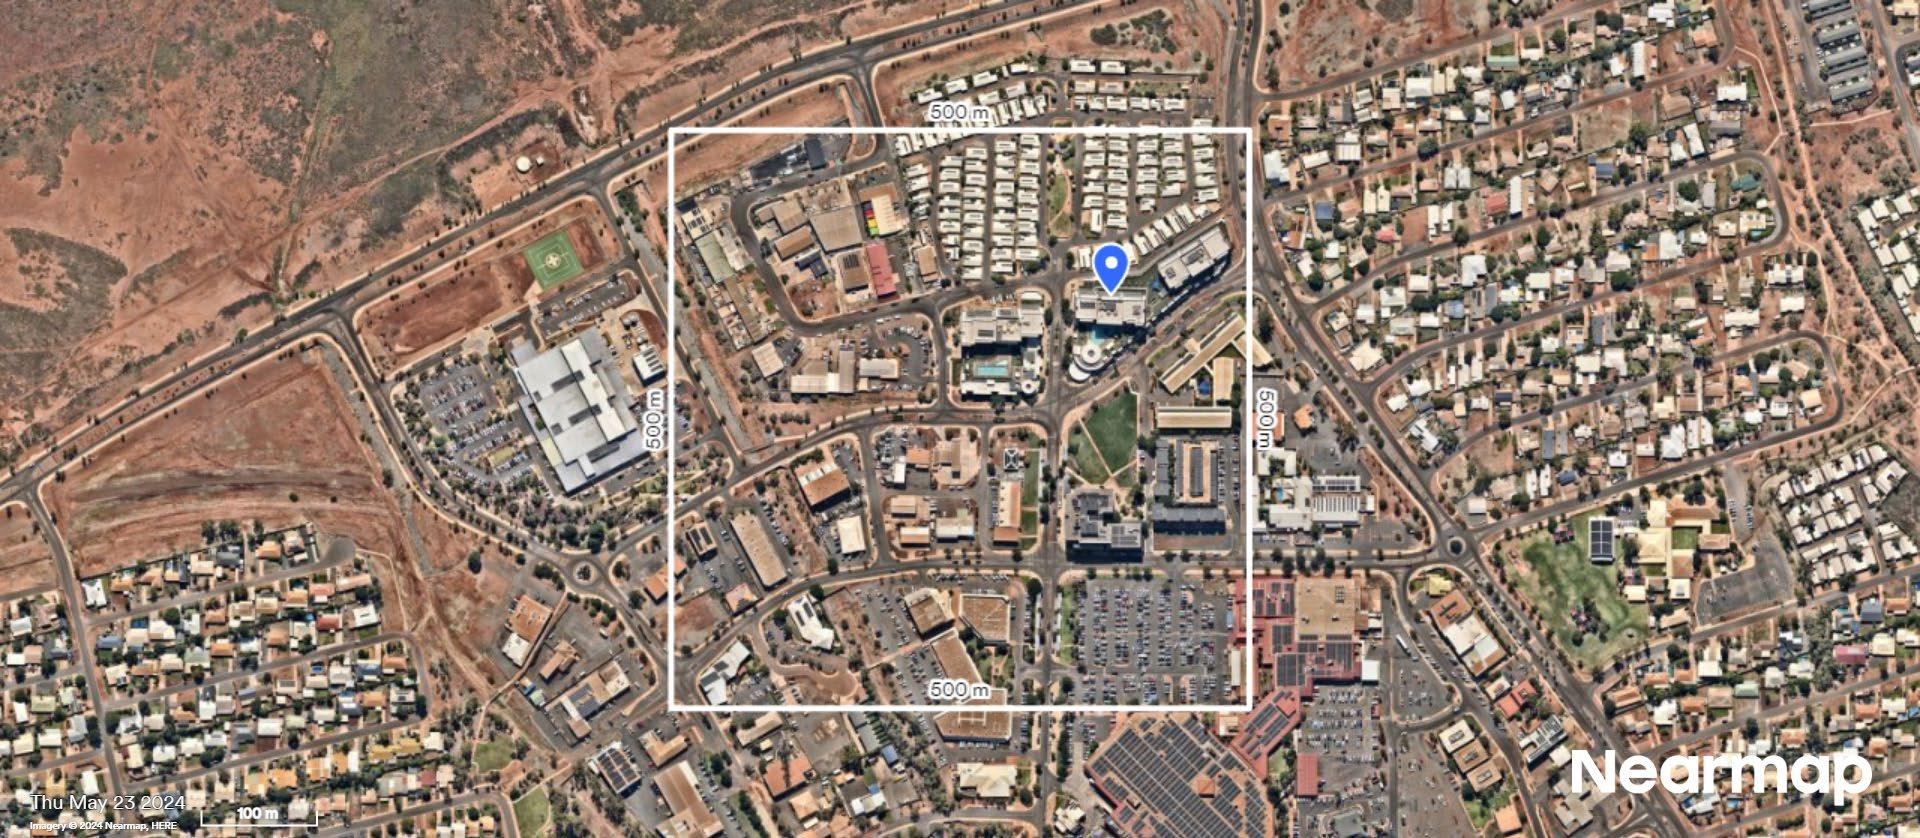
Figure 42: The Bulgarra case study precinct.
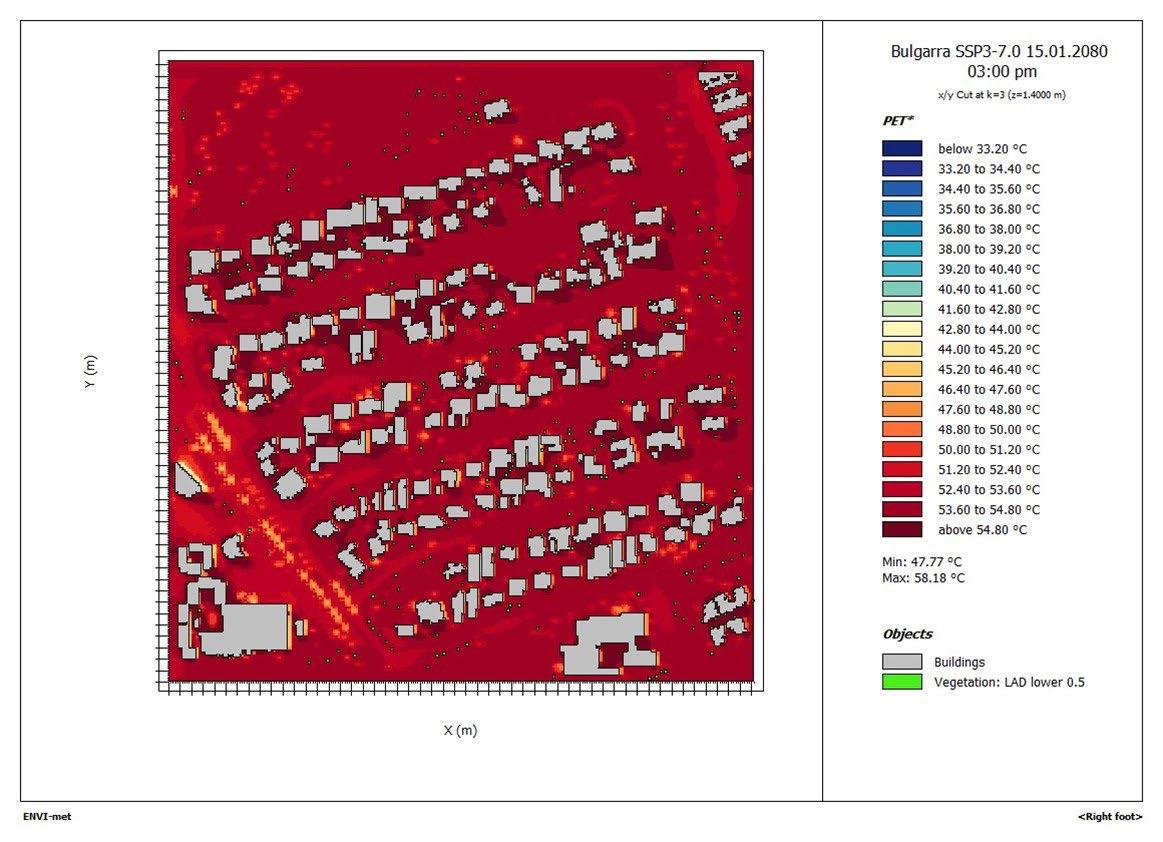
The ENVI-met map below shows the outdoor thermal comfort conditions (PET) at the hottest time (midday) of an average summer day in 2080 under SSP3-7.0 (Figure 43).
Figure 43 Bulgarra - PET in 2080 (SSP3-7.0). Strong heat stress equates to PET ≥ 35°C and extreme heat stress equates to PET ≥ 40°C.
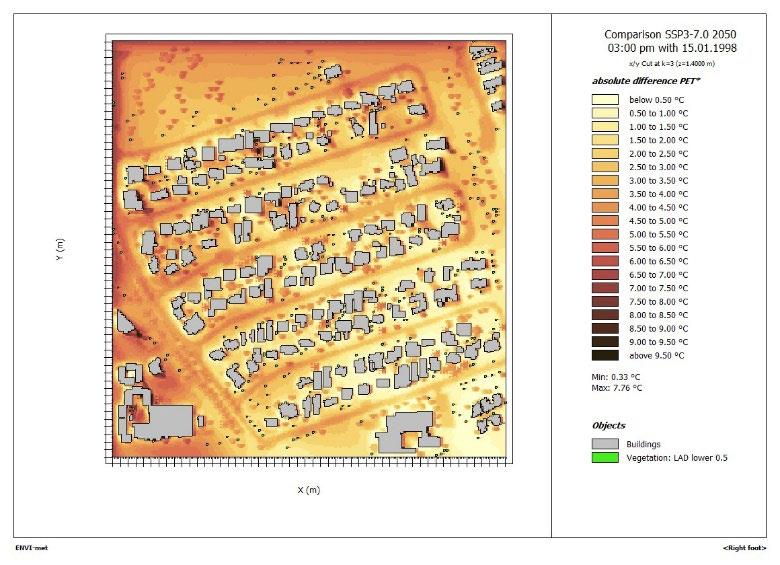
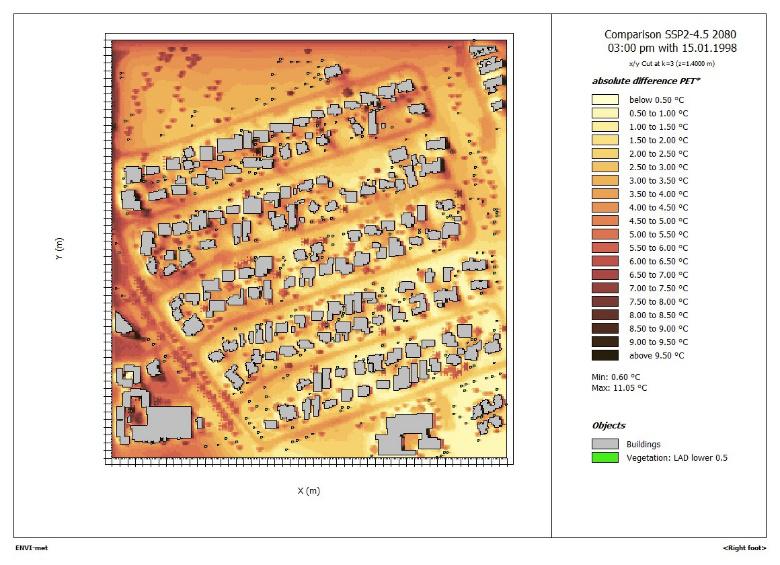
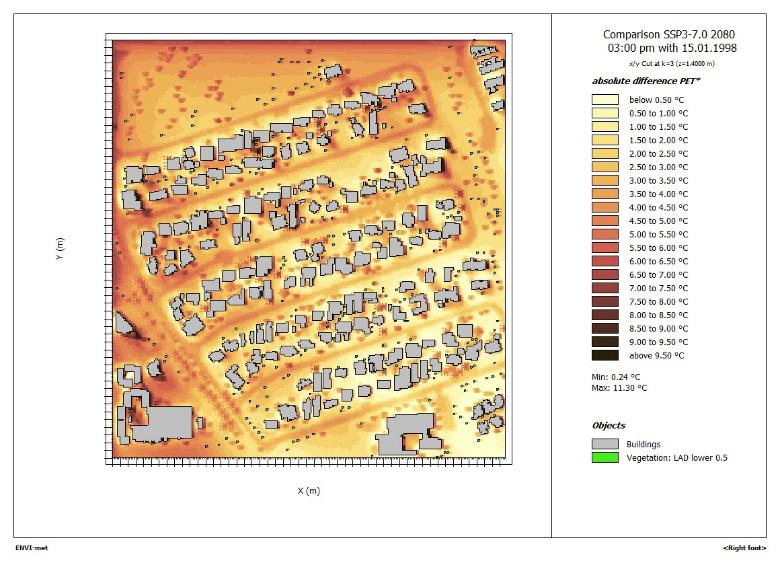
The ENVI-met maps below indicate the change in outdoor thermal comfort conditions (PET) at the hottest time (midday) of an average summer day under SSP2-4.5 and SSP3-7.0 compared to the present climate (Figure 44 to Figure 46).
44 Bulgarra - Difference in PET 2050-Present (SSP3-7.0)
45 Bulgarra - Difference in PET 2080-Present (SSP2-4.5)
Figure
Figure
Figure 46 Bulgarra - Difference in PET 2080-Present (SSP3-7.0)
The comparison of present and future PET in a typical streetscape is set out in Figure 47 and the daylight hours in which the PET exceeds heat stress thresholds is in Table 6.
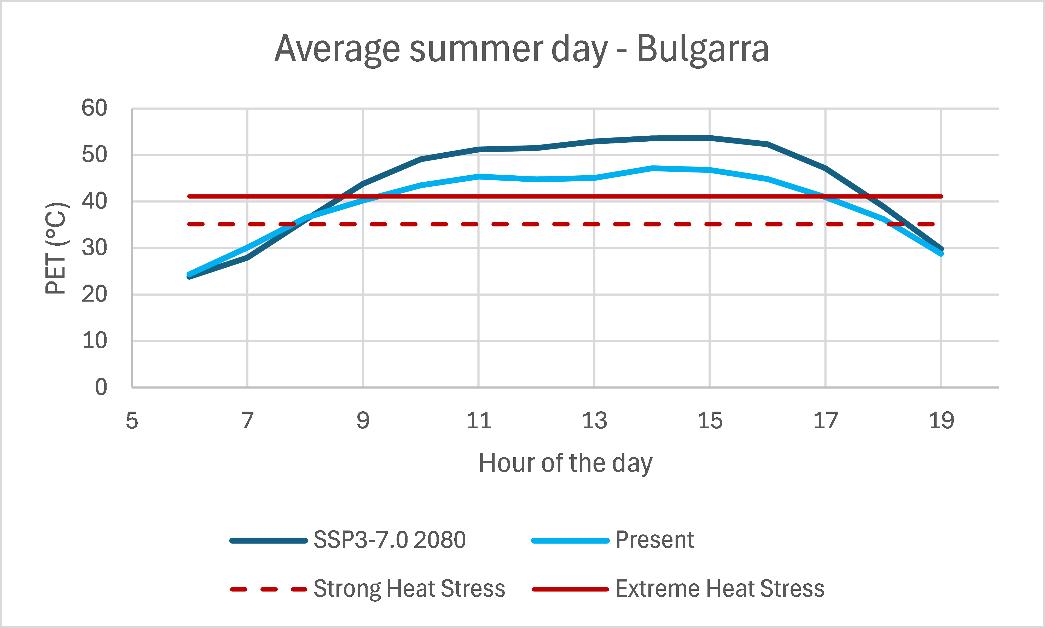
Figure 47 Bulgarra - PET in typical streetscape.
Table 6 Bulgarra - exceedance of PET thresholds
The results indicate that by 2080 the number of hours of the day that give rise to strong heat stress will remain at 79% and 64% at extreme heat stress
Karratha Town Centre
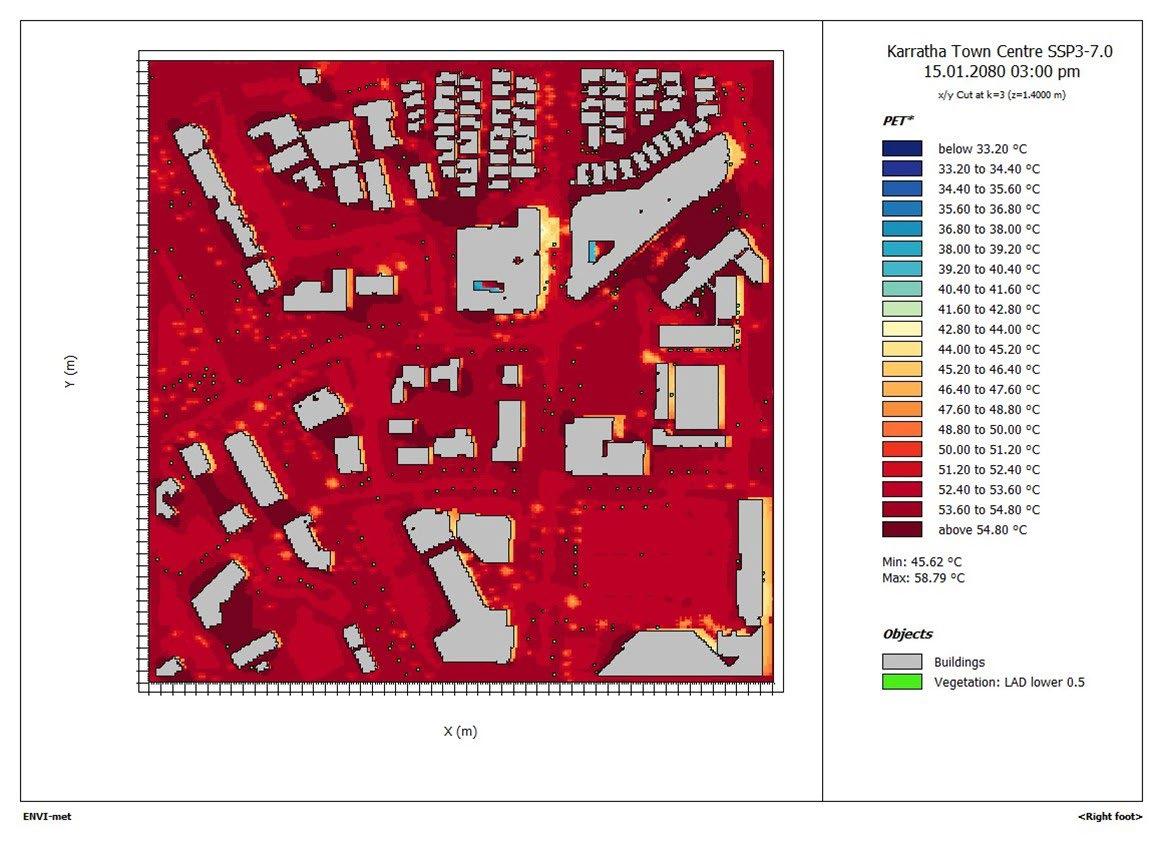
The ENVI-met map below shows the outdoor thermal comfort conditions (PET) at the hottest time (midday) of an average summer day in 2080 under SSP3-7.0 (Figure 49).
equates to PET ≥ 35°C and extreme heat stress equates to PET ≥ 40°C.
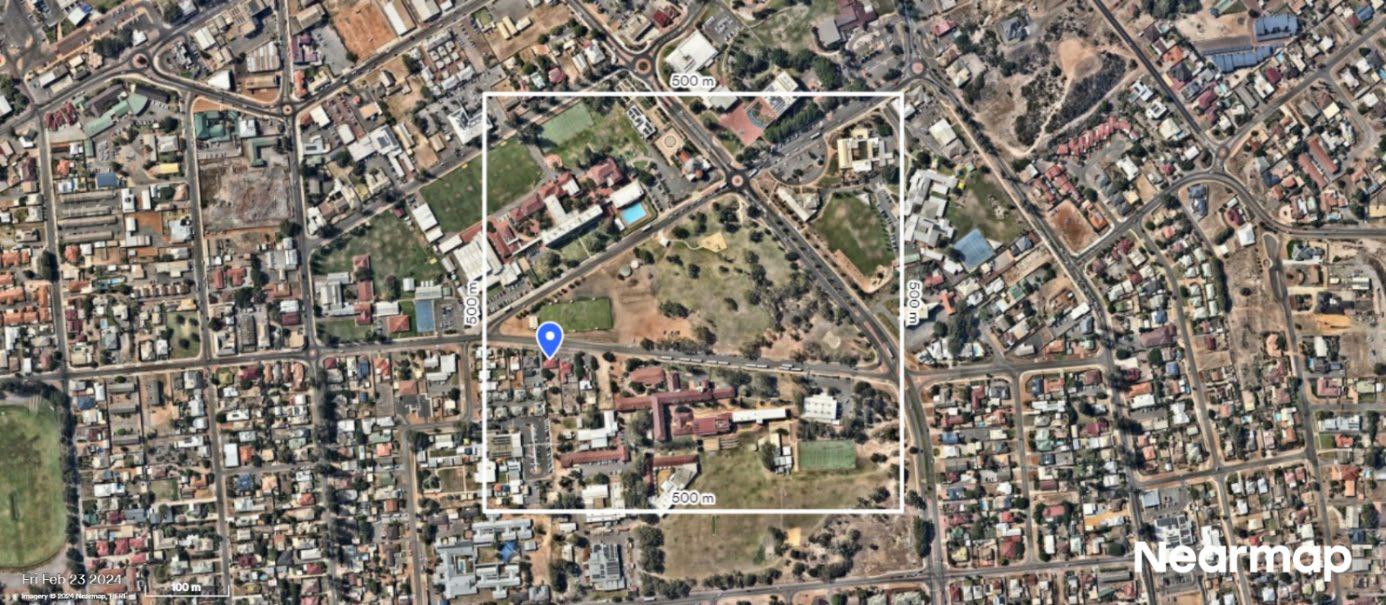
Figure 48 Karratha Town Centre case study precinct.
Figure 49 Karratha town centre - PET in 2080 (SSP3-7.0). Strong heat stress
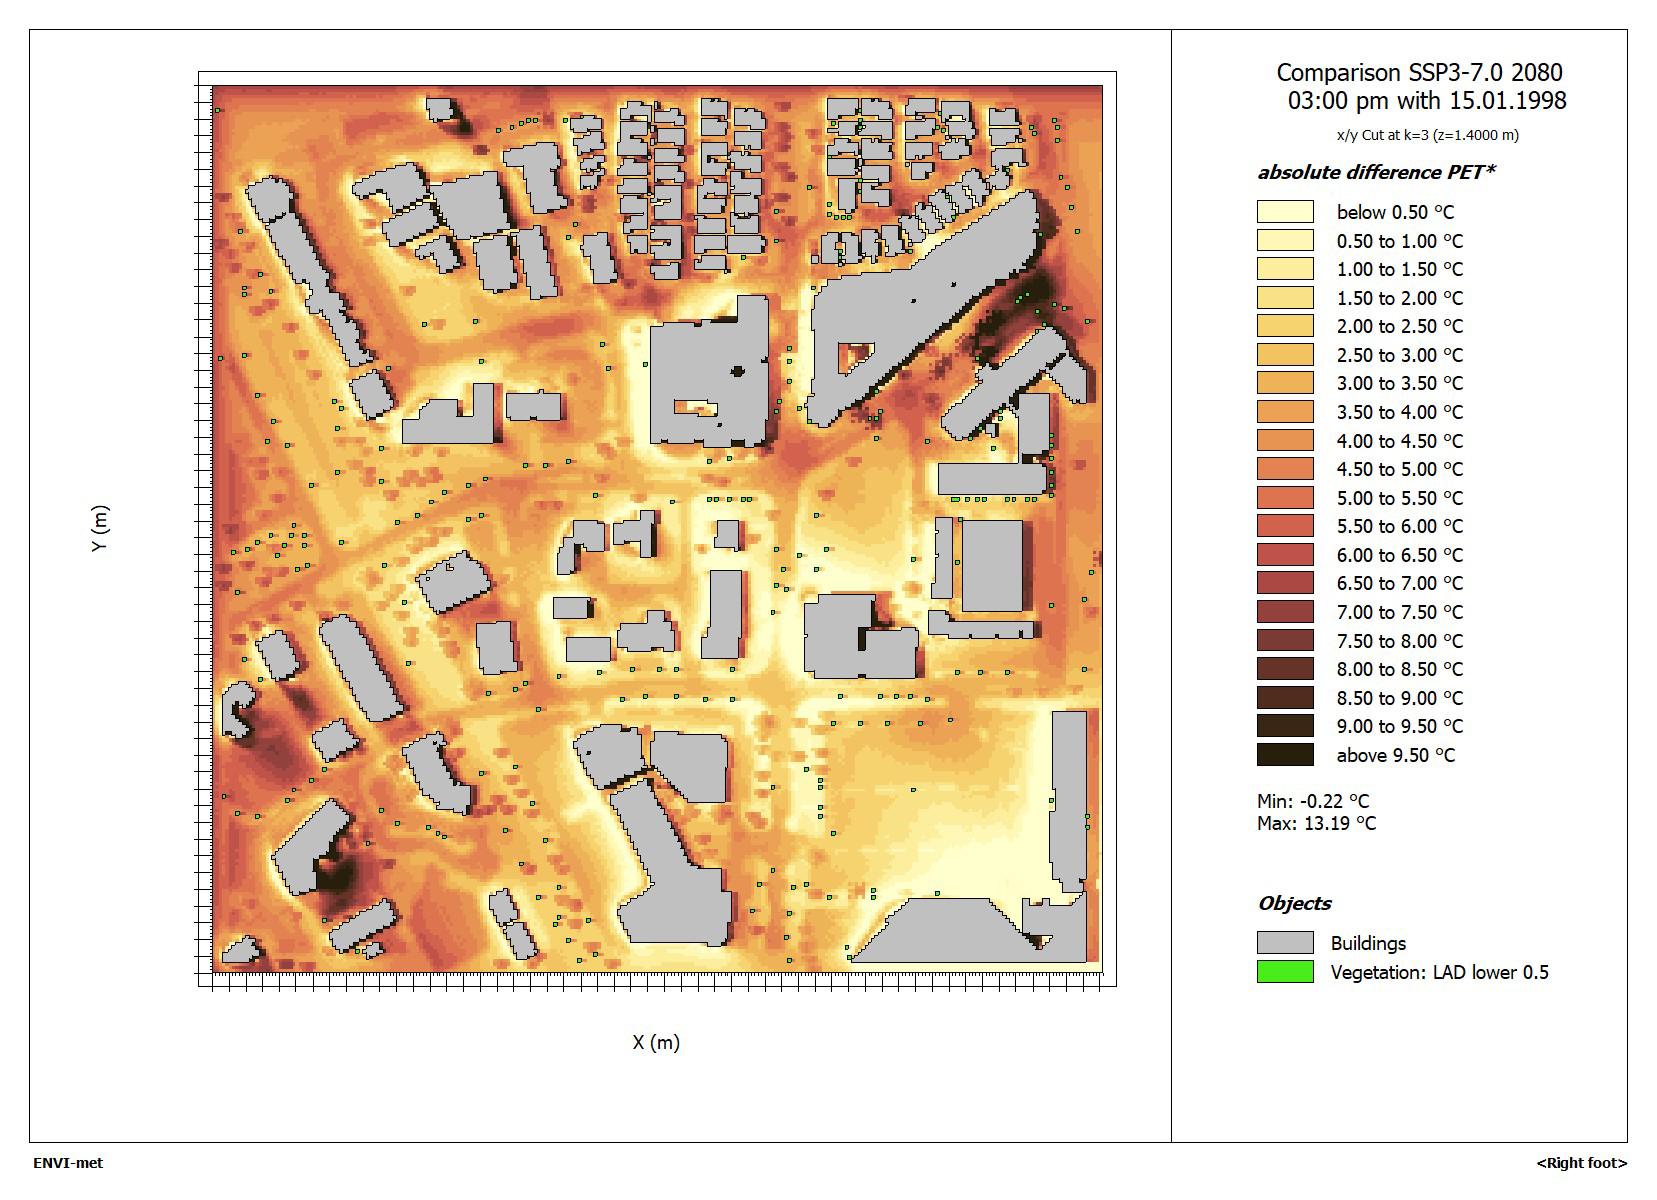
The ENVI-met map below indicates the change in outdoor thermal comfort conditions (PET) at the hottest time (3pm) of an average summer day under SSP3-7.0 in 2080 compared to the present climate (Figure 50).
50 Karratha Town Centre - Difference in PET 2080-Present (SSP3-7.0)
The comparison of present and future PET in a typical streetscape is set out in Figure 51 and the daylight hour in which the PET exceeds heat stress thresholds is in Table 7
Figure
Figure 51 Karratha Town Centre - PET in typical streetscape.
Table 7 Karratha Town Centre - exceedance of PET thresholds
The results indicate that by 2080 the number of hours of the day that give rise to strong heat stress will remain at 71% and 71% at extreme heat stress.
4.3.3 Geraldton case study
Figure 52: The Maitland Park case study precinct.
The ENVI-met map below shows the outdoor thermal comfort conditions (PET) at the hottest time (midday) of an average summer day in 2080 under SSP3-7.0 (Figure 53).
Figure 53 Maitland Park - PET in 2080 (SSP3-7.0). Strong heat stress equates to PET ≥ 35°C and extreme heat stress equates to PET ≥ 40°C.
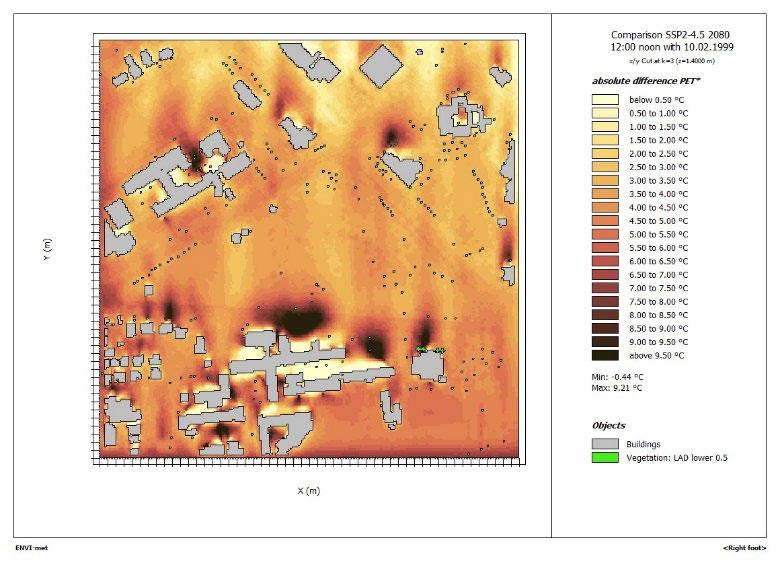
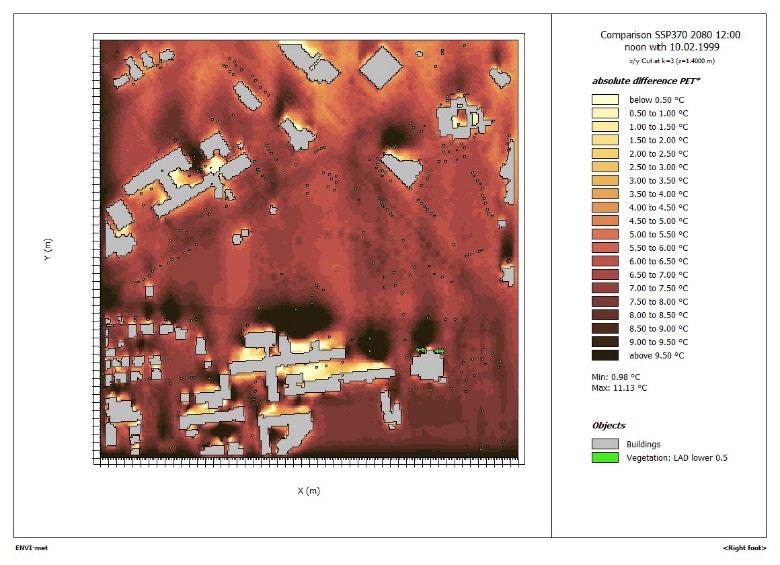
The ENVI-met maps below indicate the change in outdoor thermal comfort conditions (PET) at the hottest time (midday) of an average summer day under SSP2-4.5 and SSP3-7.0 compared to the present climate (Figure 54 to Figure 56).
54 Maitland Park - Difference in PET 2050-Present (SSP3-7.0)
55 Maitland Park - Difference in PET 2080-Present (SSP2-4.5)
Figure
Figure
Figure 56 Maitland Park - Difference in PET 2080-Present (SSP3-7.0)
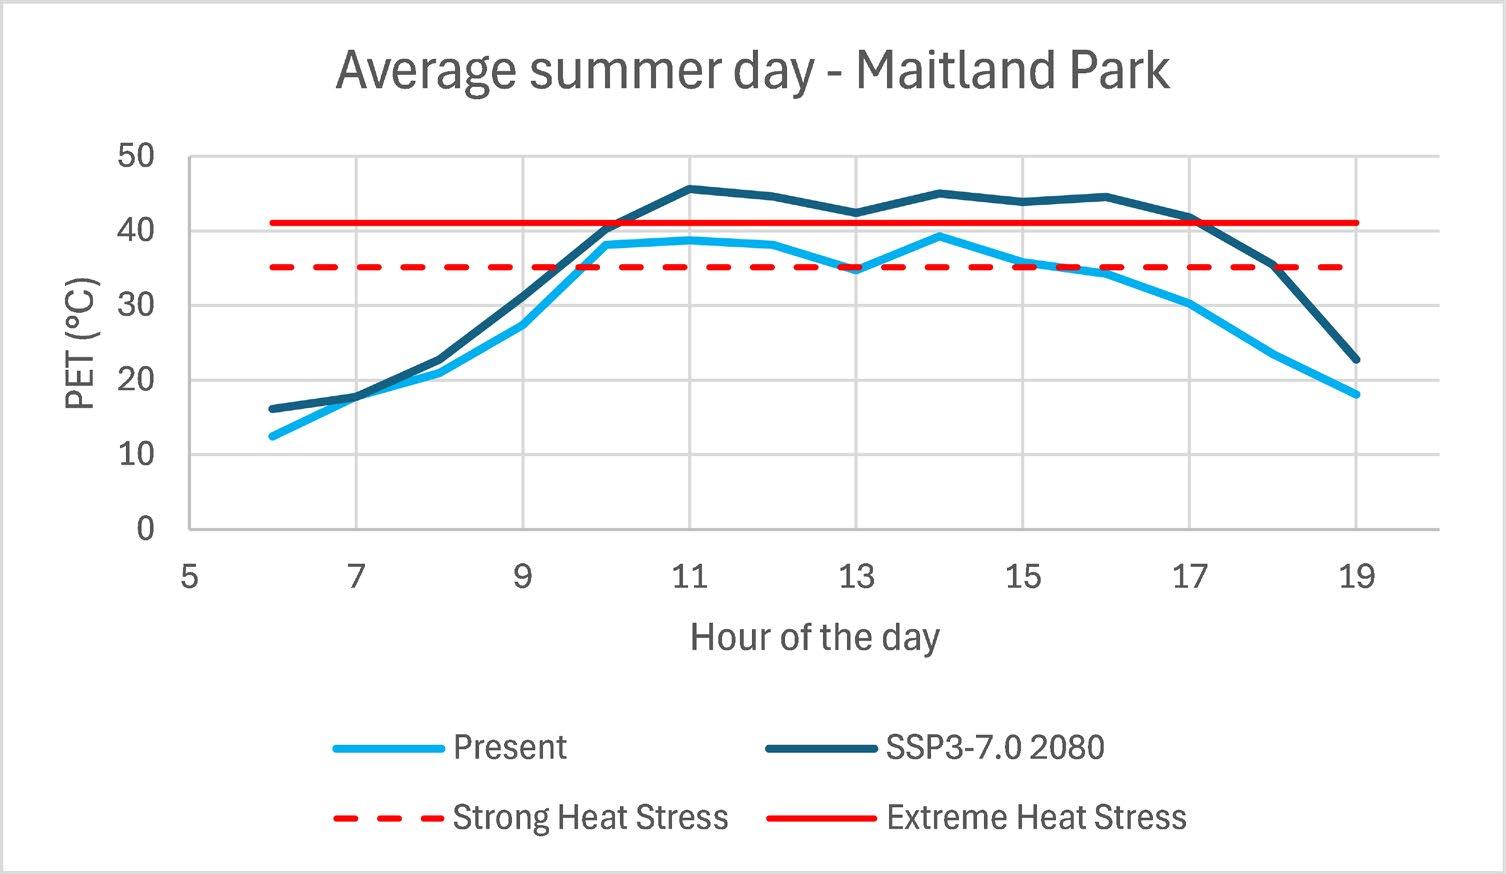
The comparison of present and future PET in a typical streetscape is set out in Figure 57 and the daylight hour in which the PET exceeds heat stress thresholds is in Table 8.
Figure 57 Maitland Park - PET in typical location.
Table 8 Maitland Park - exceedance of PET thresholds
The results indicate that by 2080 64% of hours of the day give rise to strong heat stress and 50% extreme heat stress.
4.3.4 Toodyay case study
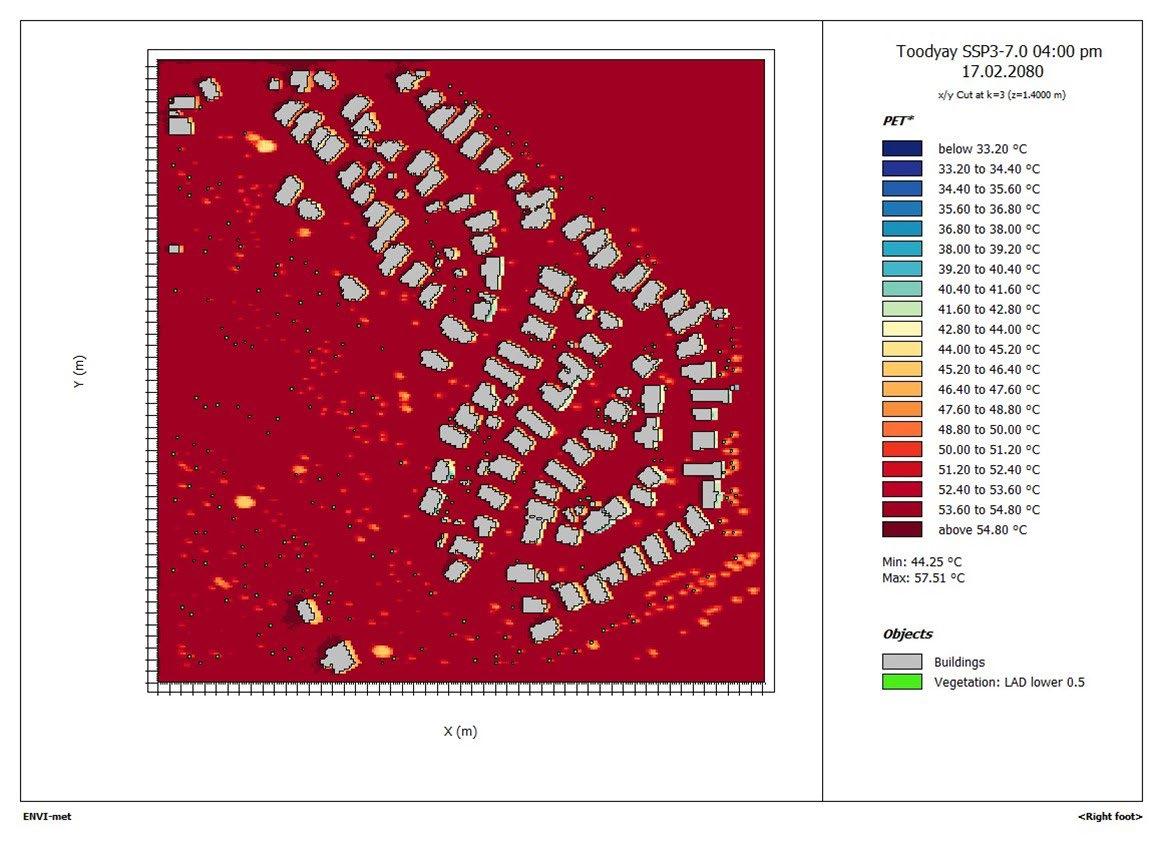
The ENVI-met map below shows the outdoor thermal comfort conditions (PET) at the hottest time (midday) of an average summer day in 2080 under SSP3-7.0 (Figure 59).
59 River
(SSP3-
Strong heat stress equates to PET ≥ 35°C and extreme heat stress equates to PET ≥ 40°C.
Figure 58: The River Hills Estate case study precinct.
Figure
Hills - PET in 2080
7.0).
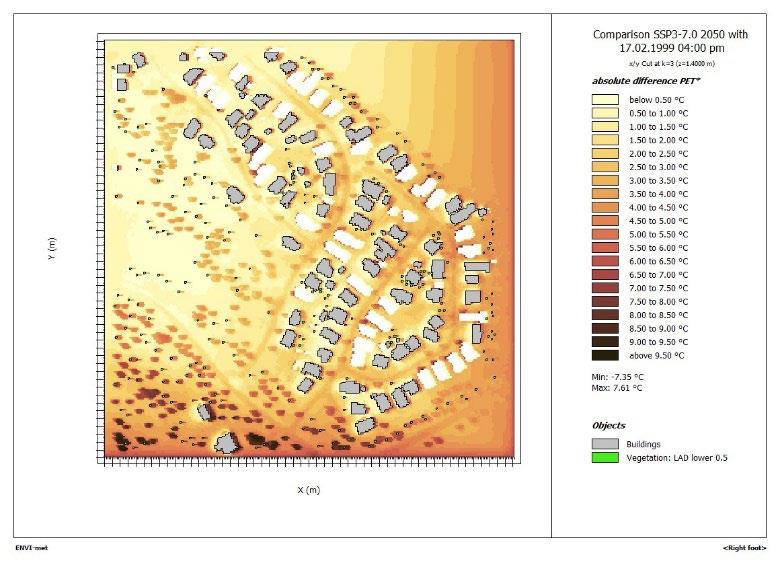
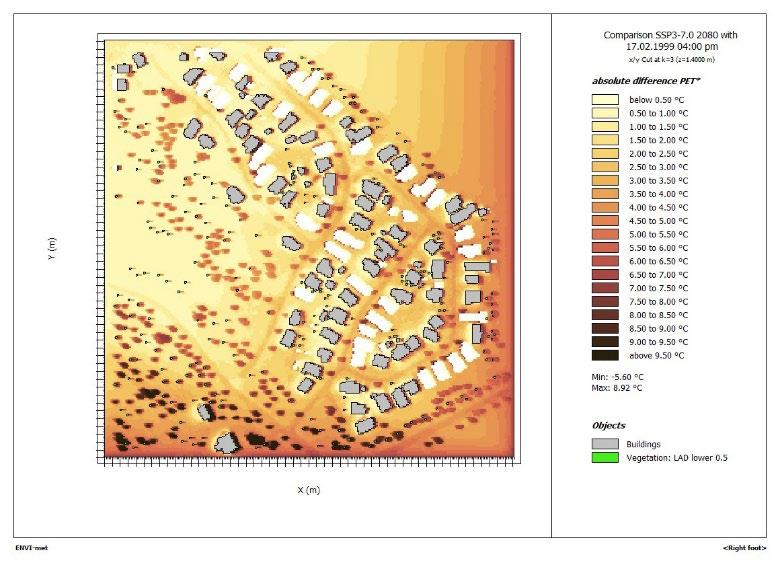
The ENVI-met maps below indicate the change in outdoor thermal comfort conditions (PET) at the hottest time (midday) of an average summer day under SSP2-4.5 and SSP3-7.0 compared to the present climate (Figure 60 to Figure 62).
Figure 60 River Hills - Difference in PET 2050-Present (SSP3-7.0)
62 River
- Difference in PET 2080-Present (SSP3-7.0)
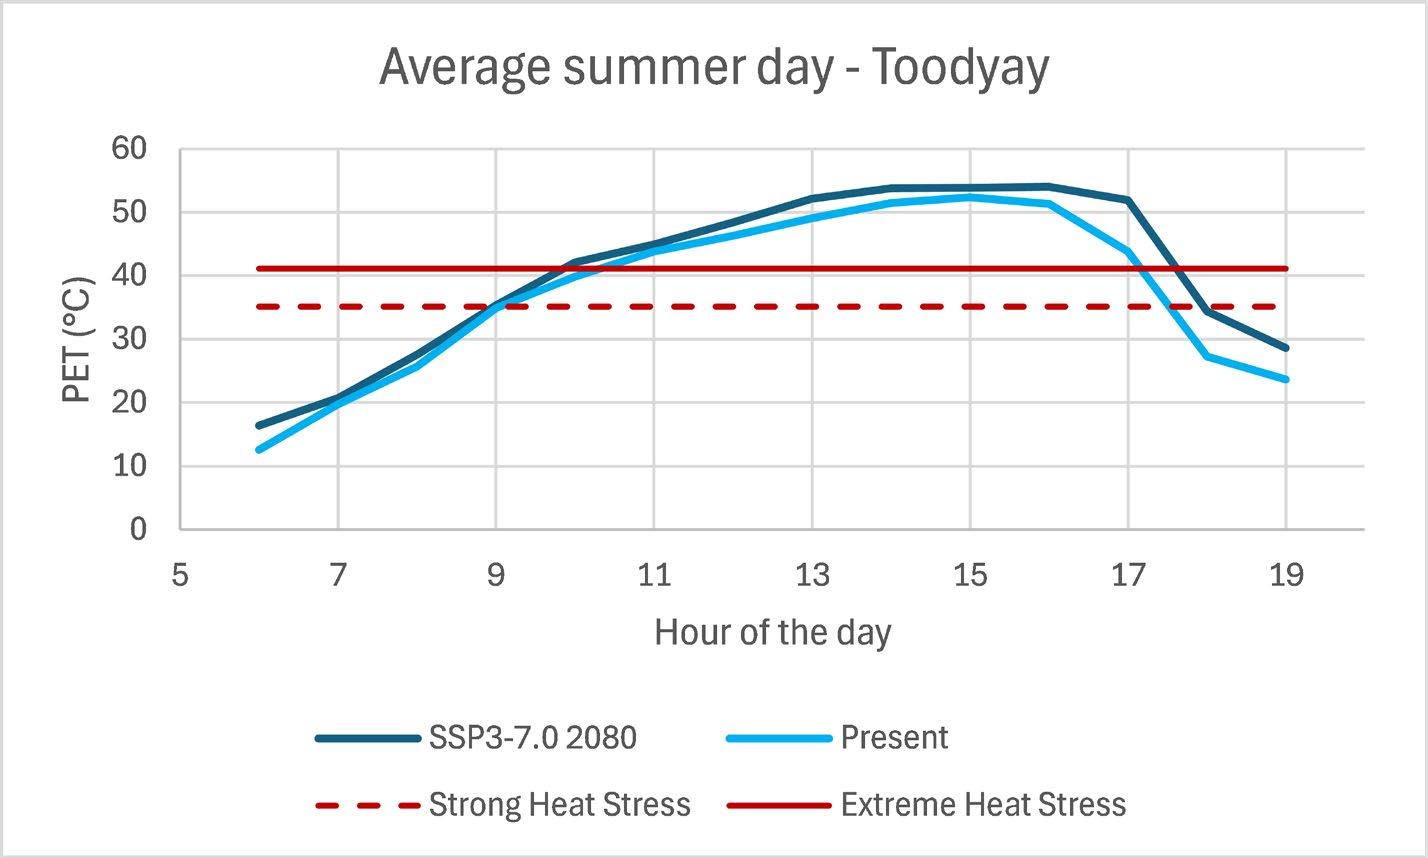
The comparison of present and future PET in a typical streetscape is set out in Figure 63 and the daylight hour in which the PET exceeds heat stress thresholds is in Table 9.
Figure 61 River Hills - Difference in PET 2080-Present (SSP2-4.5)
Figure
Hills
Figure 63 River Hills - PET in typical streetscape.
Table 9 River Hills - exceedance of PET thresholds
SSP3-7.0 2080
The results indicate that by 2080 64% of hours of the day give rise to strong heat stress and 57% to extreme heat stress
4.3.5 Perth case studies
Jindalee
Figure 64 The Jindalee case study precinct.
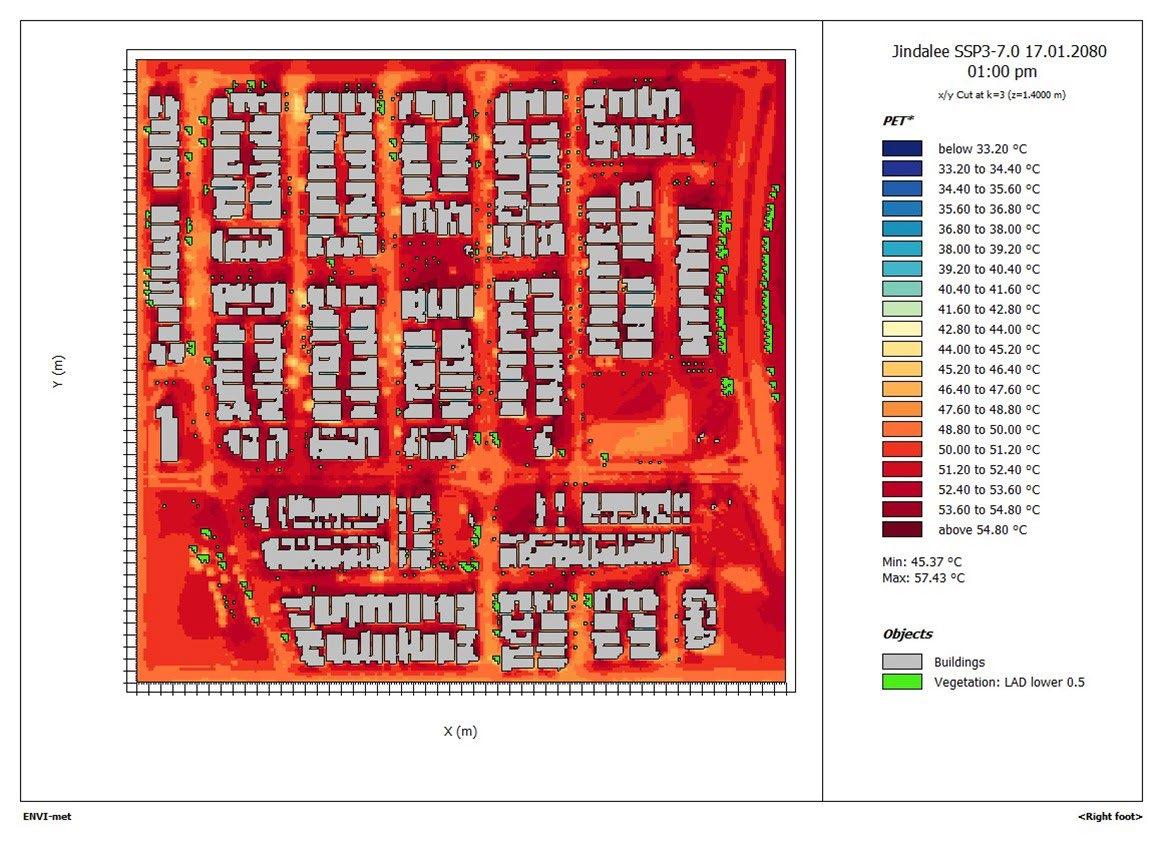
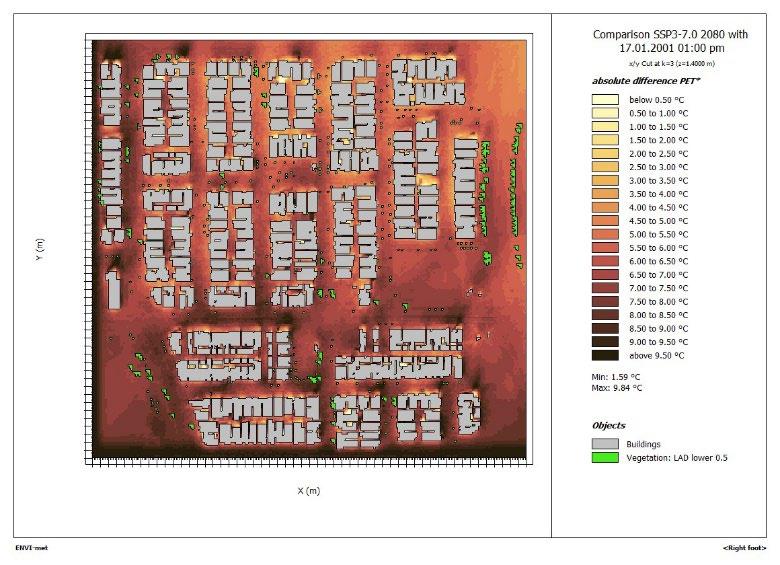
The ENVI-met map below shows the outdoor thermal comfort conditions (PET) at the hottest time (midday) of an average summer day in 2080 under SSP3-7.0 (Figure 65).
Figure 65 Jindalee - PET in 2080 (SSP3-7.0). Strong heat stress equates to PET ≥ 35°C and extreme heat stress equates to PET ≥ 40°C.
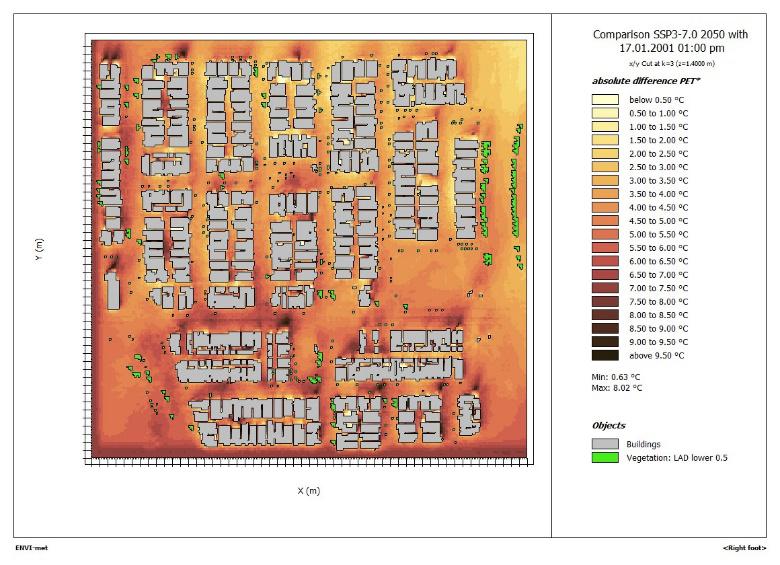
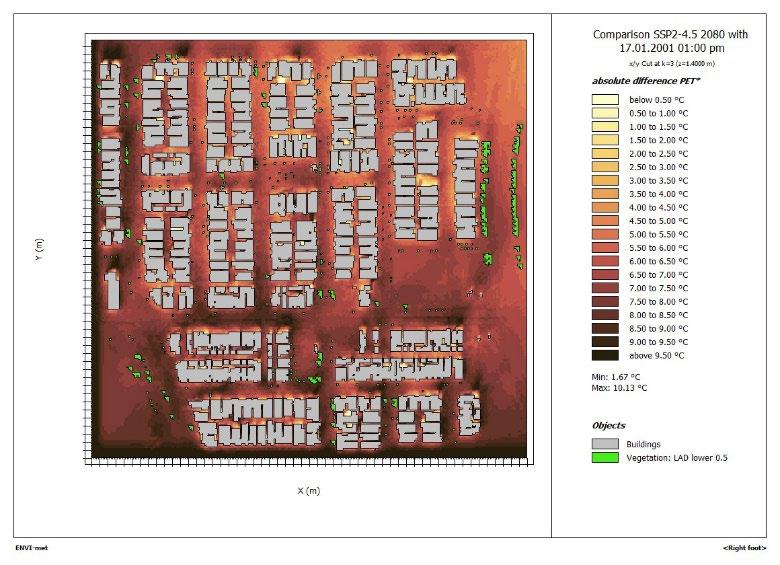
The ENVI-met maps below indicate the change in outdoor thermal comfort conditions (PET) at the hottest time (midday) of an average summer day under SSP2-4.5 and SSP3-7.0 compared to the present climate (Figure 66 to Figure 68).
PET 2050-Present (SSP3-7.0)
PET 2080-Present (SSP2-4.5)
Figure 66 Jindalee - Difference in
Figure 67 Jindalee - Difference in
Figure 68 Jindalee - Difference in PET 2080-Present (SSP3-7.0)
The comparison of present and future PET in a typical streetscape is set out in Figure 69 and the daylight hour in which the PET exceeds heat stress thresholds is in Table 10.
Figure 69 Jindalee - PET in typical streetscape.
Table 10 Jindalee - exceedance of PET thresholds
The results indicate that by 2080 57% of the hours give rise to strong heat stress and 50% extreme heat stress (around midday)
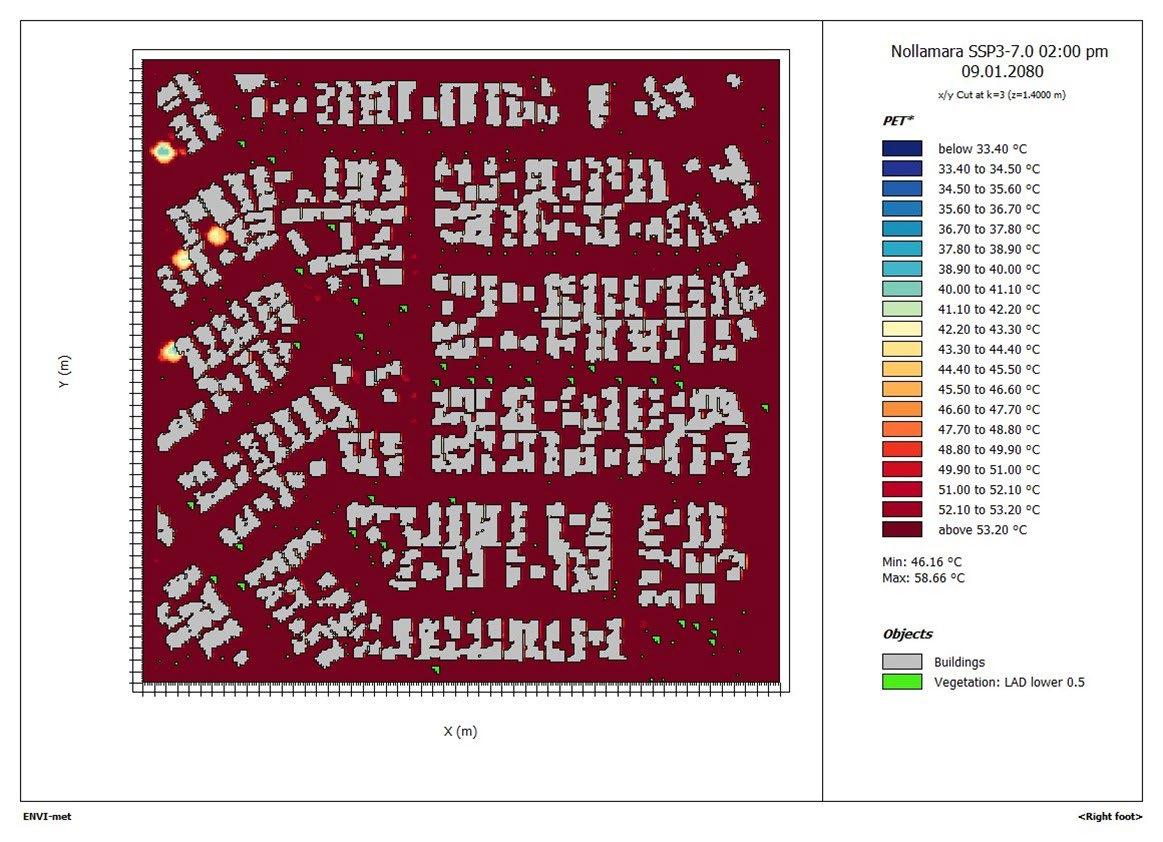
Nollamara
Figure 70 The Nollamara case study precinct.
The ENVI-met map below shows the outdoor thermal comfort conditions (PET) at the hottest time (midday) of an average summer day in 2080 under SSP3-7.0 (Figure 71).
Figure 71 Nollamara - PET in 2080 (SSP3-7.0). Strong heat stress equates to PET ≥ 35°C and extreme heat stress equates to PET ≥ 40°C.
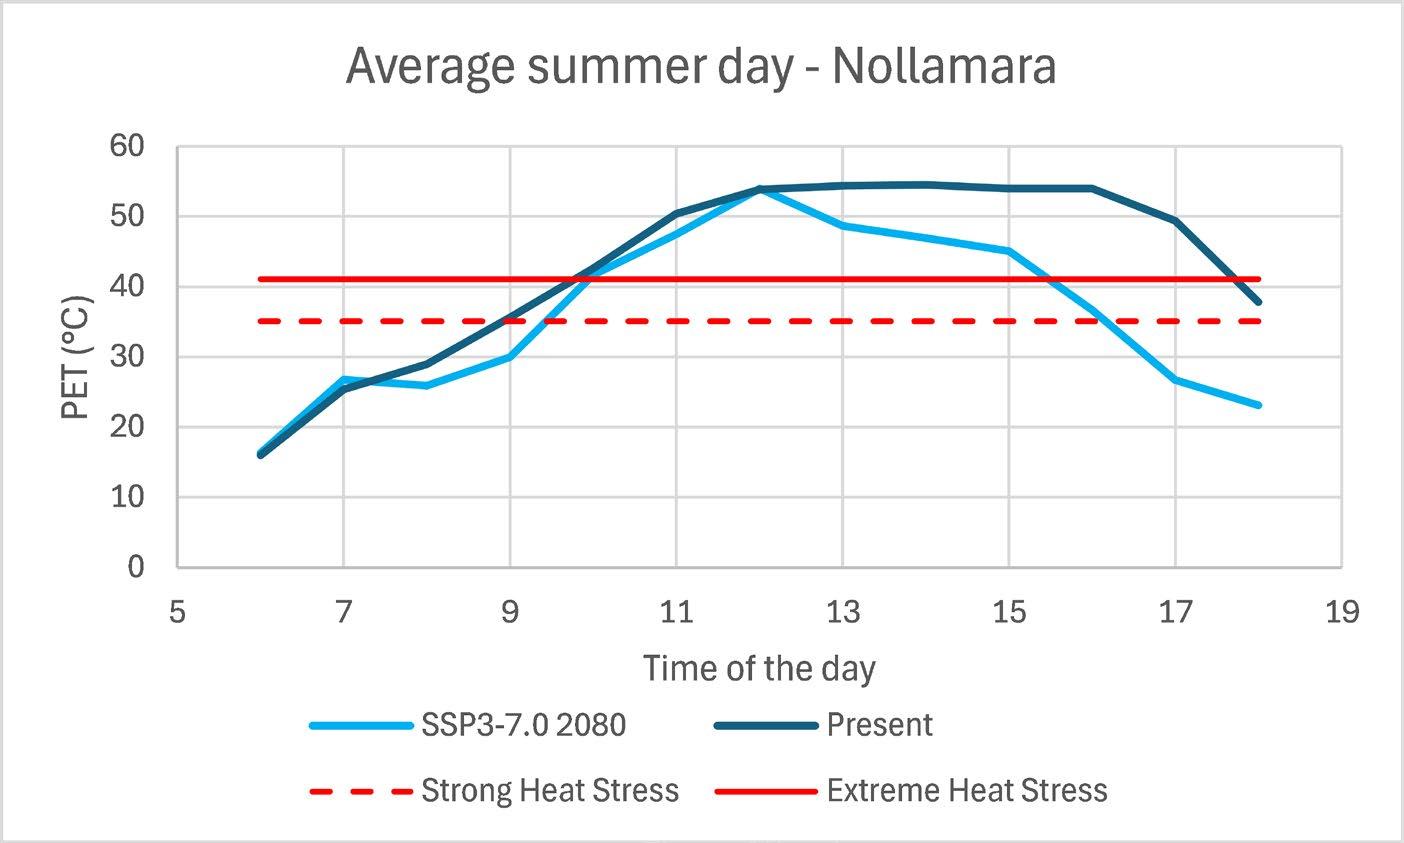
The ENVI-met map below indicates the change in outdoor thermal comfort conditions (PET) at the hottest time (2pm) of an average summer day under SSP3-7.0 by 2080 compared to the present climate (Figure 72).
Figure 72 Nollamara - Difference in PET 2080-Present (SSP3-7.0)
The comparison of present and future PET in a typical streetscape is set out in Figure 73 and the daylight hour in which the PET exceeds heat stress thresholds is in
Table 11
Figure 73 Nollamara - PET in typical streetscape.
Table 11 Nollamara - exceedance of PET thresholds
Daylight hours
Present SSP3-7.0 2080
The results indicate that by 2080 77% of hours of the day give rise to strong heat stress and 62% to extreme heat stress.
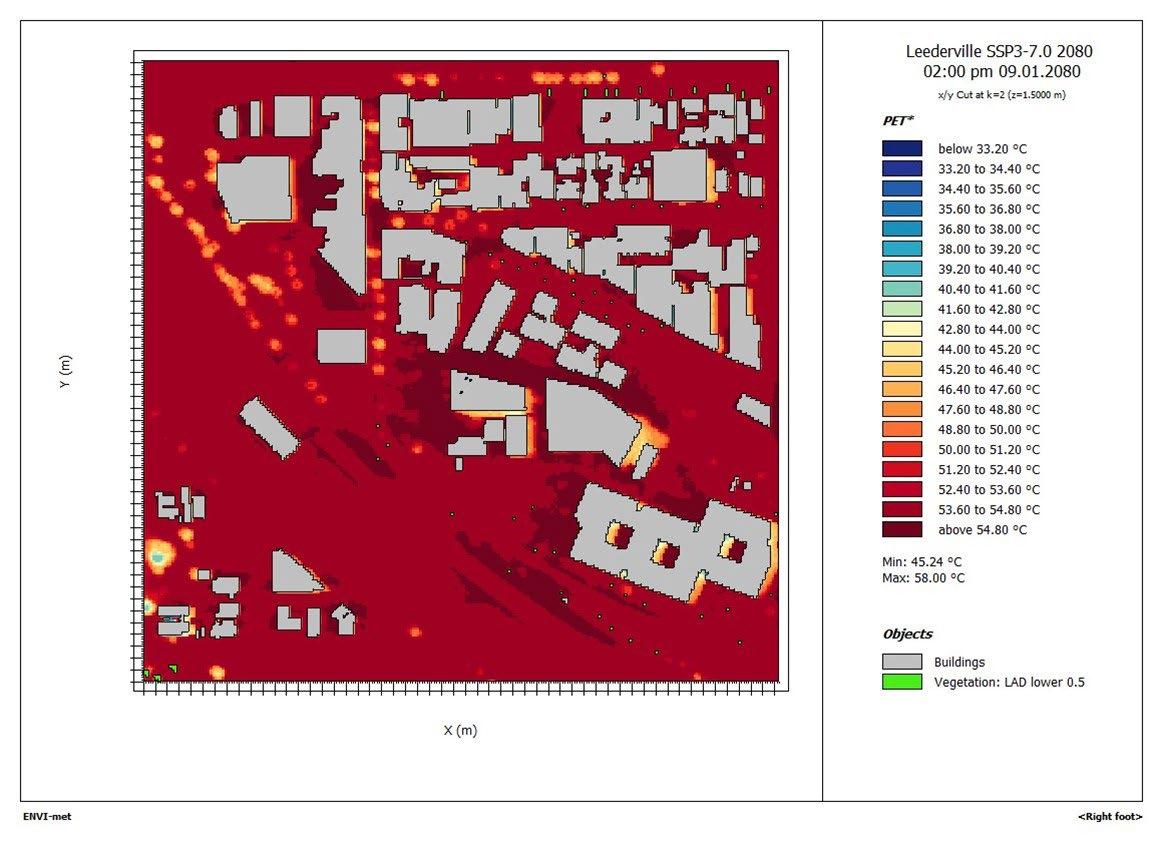
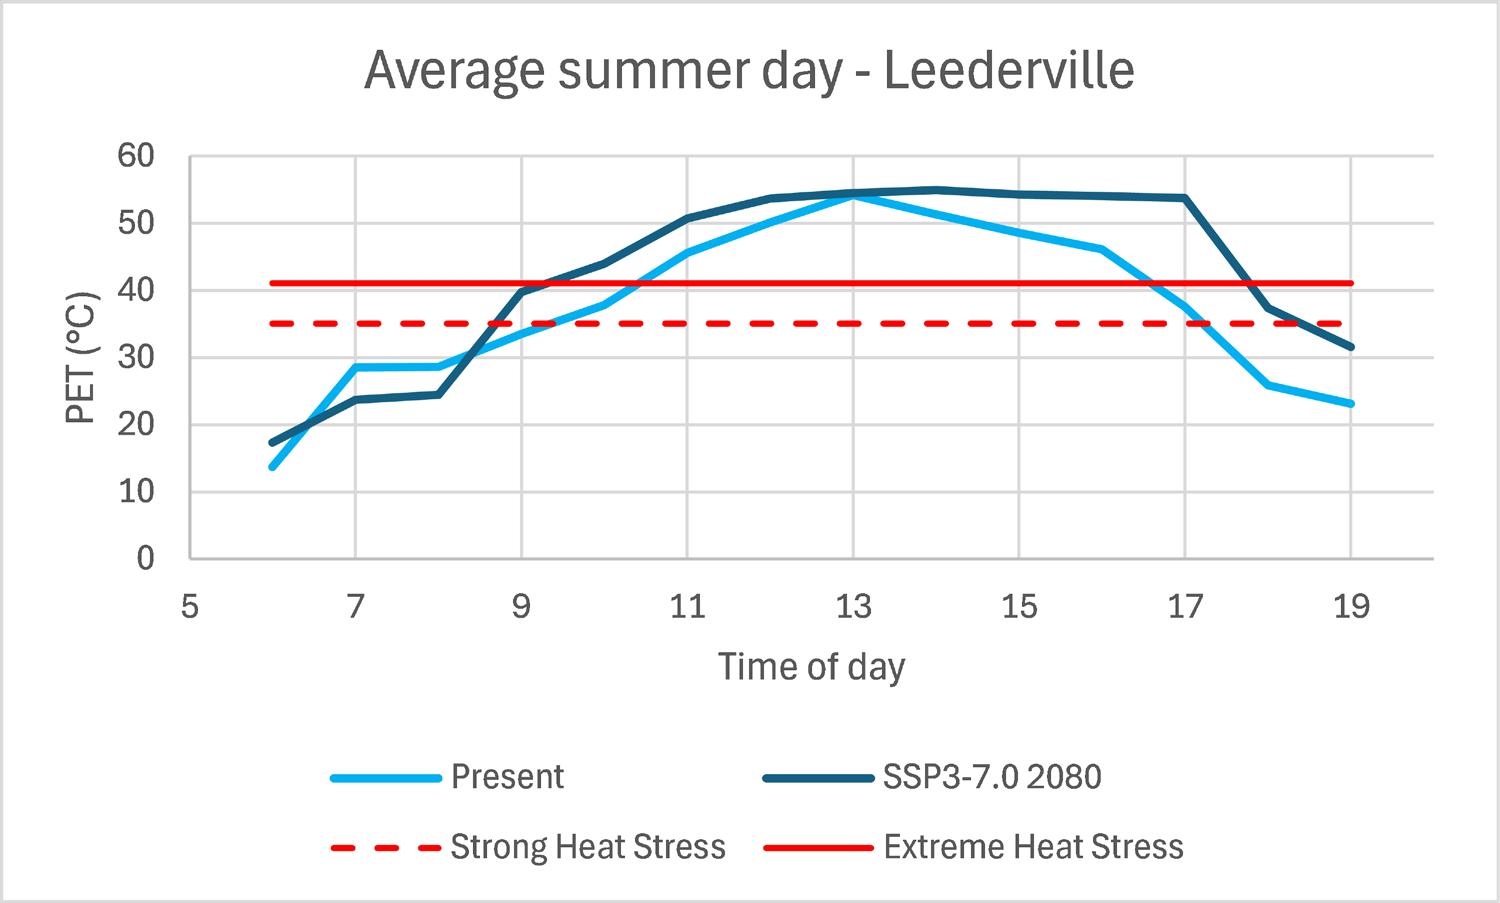
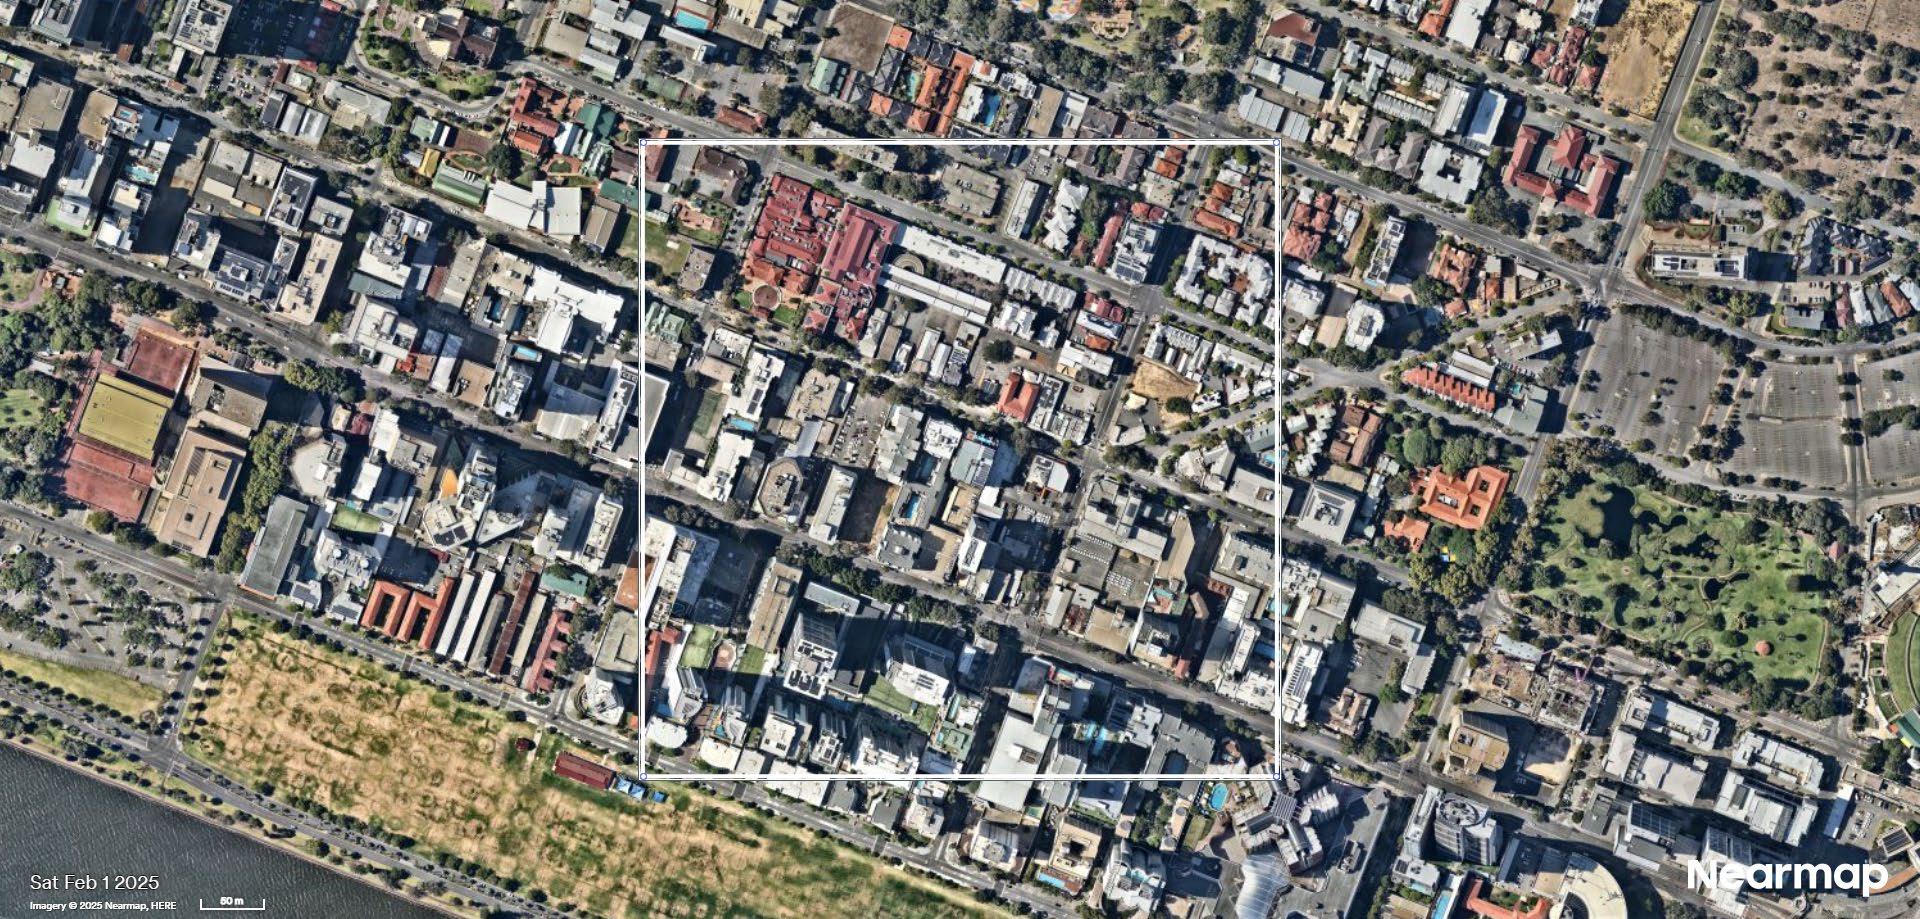
Leederville town centre
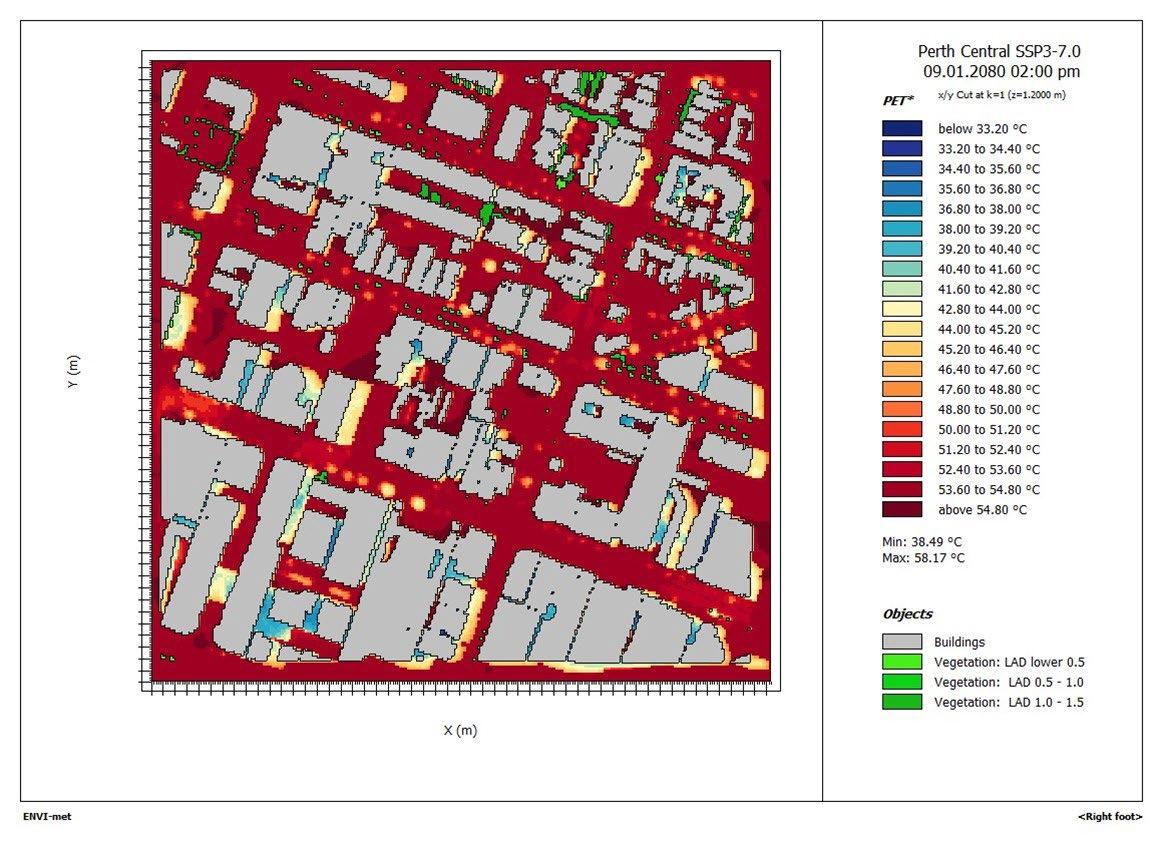
The ENVI-met map below shows the outdoor thermal comfort conditions (PET) at the hottest time (midday) of an average summer day in 2080 under SSP3-7.0 (Figure 75).
Figure 74: The Leederville case study precinct.
Figure 75 Leederville - PET in 2080 (SSP3-7.0). Strong heat stress equates to PET ≥ 35°C and extreme heat stress equates to PET ≥ 40°C.
ENVI-met difference maps are not available for this case study as the model geometry was modified in the future climate runs to reflect future development. However, the changes are similar to those in Nollamara.
The comparison of present and future PET in a typical streetscape is set out in Figure 76 and the daylight hour in which the PET exceeds heat stress thresholds is in Table 12.
76
Figure
Leederville Town Centre - PET in typical streetscape.
Table 12 Leederville Town Centre - exceedance of PET thresholds
The results indicate that by 2080 71% of hours of the day give rise to strong heat stress and 57% extreme heat stress.
Central Perth
The ENVI-met map below shows the outdoor thermal comfort conditions (PET) at the hottest time (midday) of an average summer day in 2080 under SSP3-7.0 (Figure 78).
Figure 77 The Central Perth case study precinct.
Figure 78 Central Perth - PET in 2080 (SSP3-7.0). Strong heat stress equates to PET ≥ 35°C and extreme heat stress equates to PET ≥ 40°C.
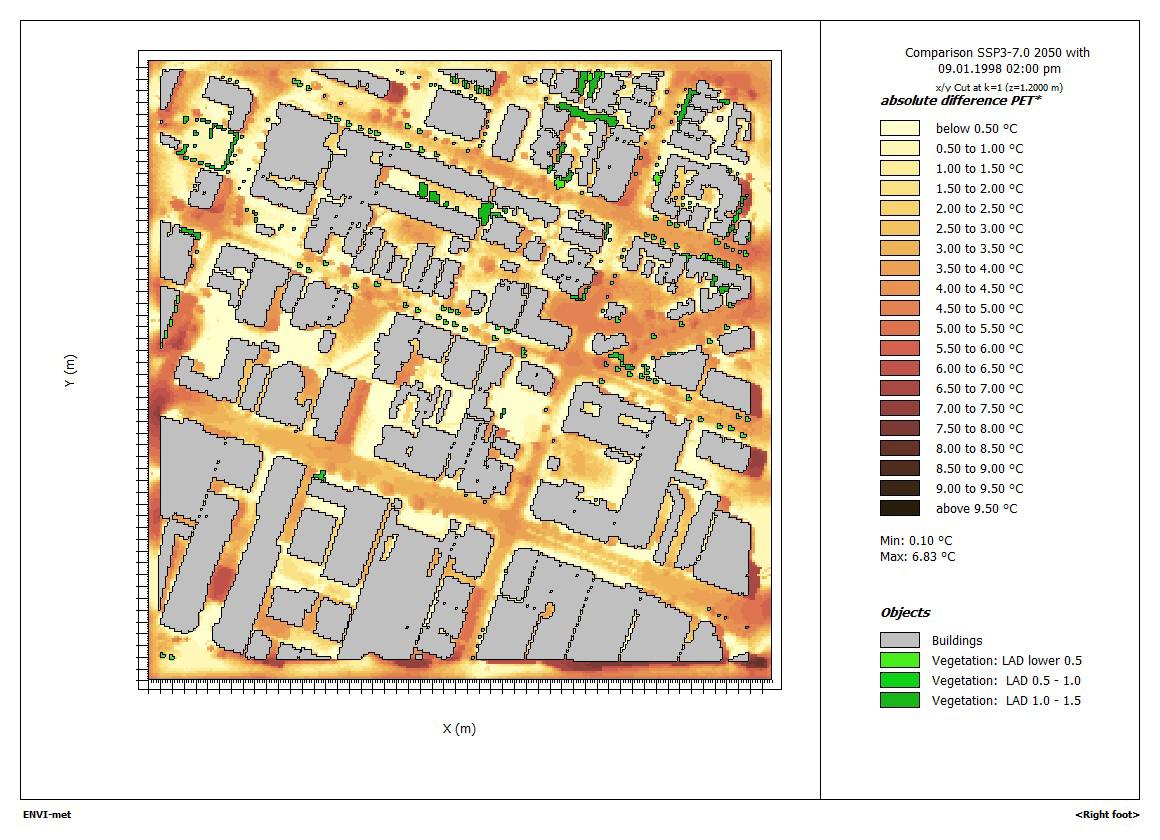
The ENVI-met maps below indicate the change in outdoor thermal comfort conditions (PET) at the hottest time (2pm) of an average summer day under SSP3-7.0 compared to the present climate (Figure 79 and Figure 80).
Figure 79 Central Perth - Difference in PET 2050-Present (SSP3-7.0)
Figure 80 Central Perth - Difference in PET 2080-Present (SSP3-7.0)
The comparison of present and future PET in a typical streetscape is set out in Figure 81 and the daylight hour in which the PET exceeds heat stress thresholds is in
Figure 81 Central Perth - PET in typical streetscape
Table 13 Central Perth - exceedance of PET thresholds
The results indicate that by 2080 64% of hours of the day give rise to strong heat stress and 50% extreme heat stress.
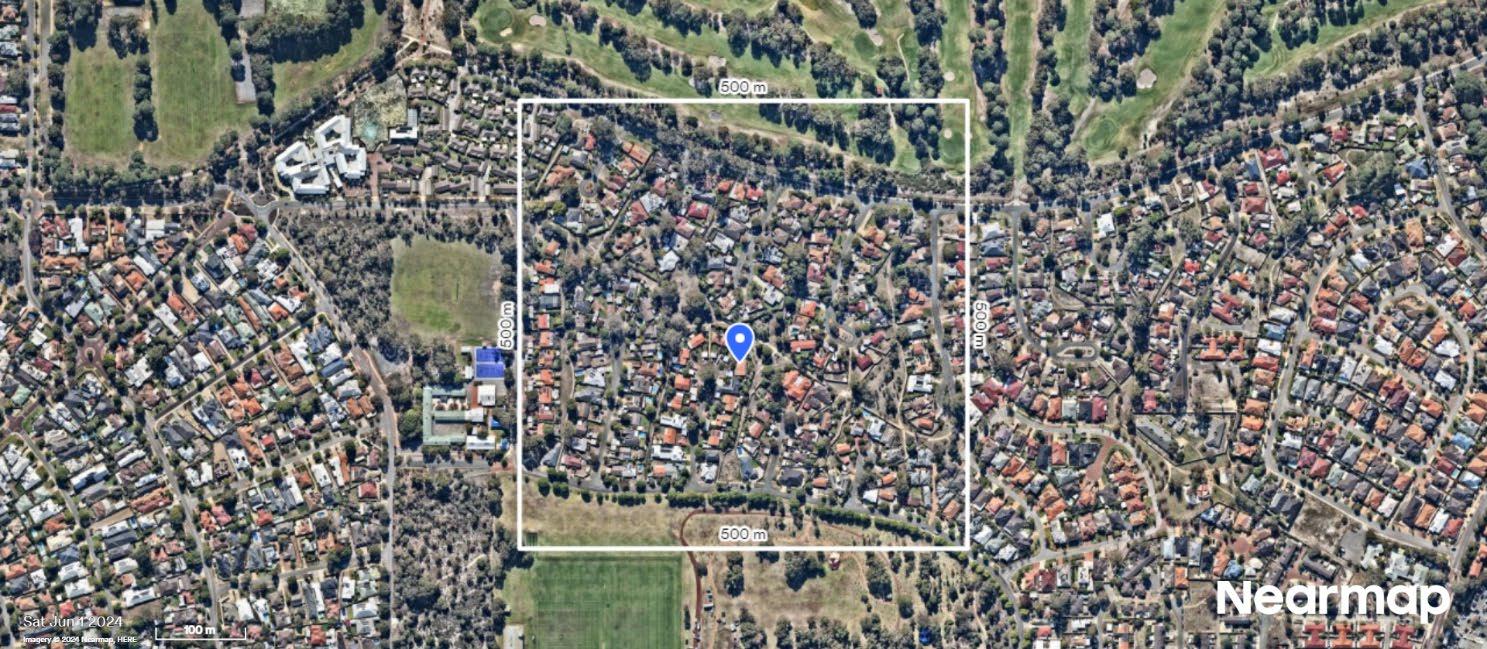
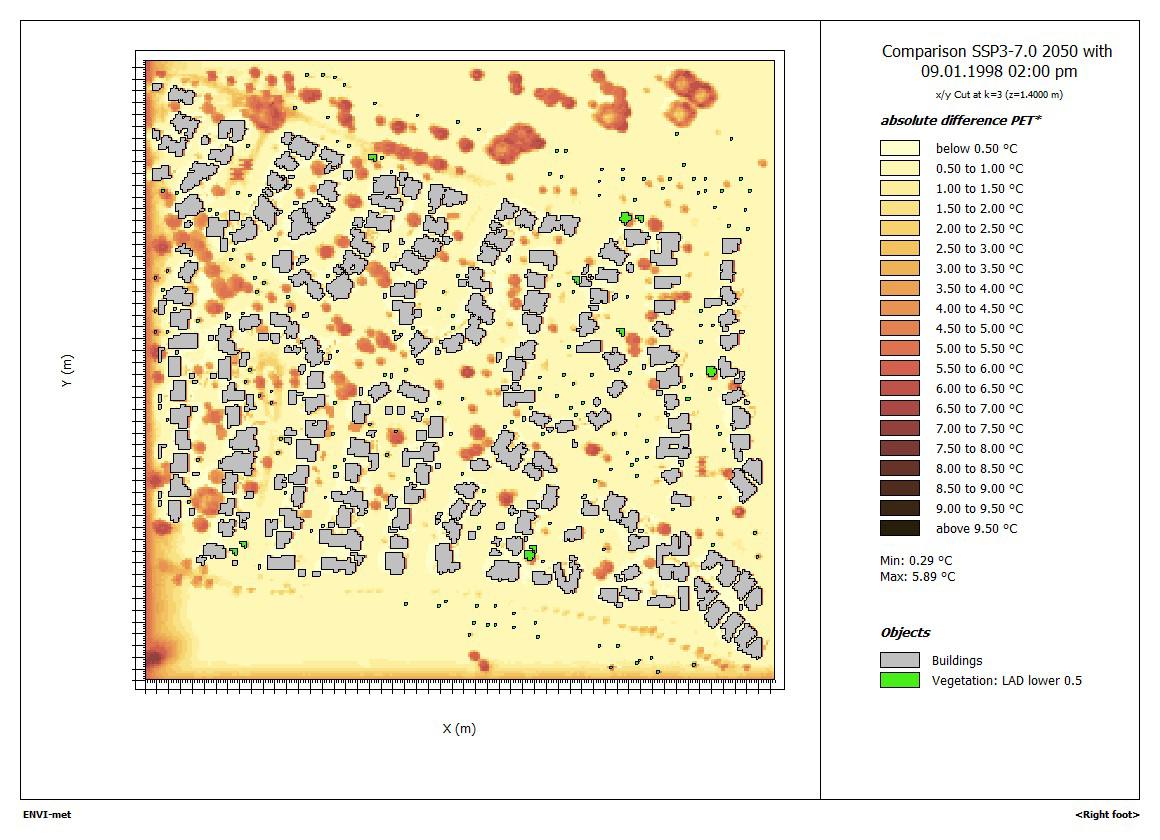
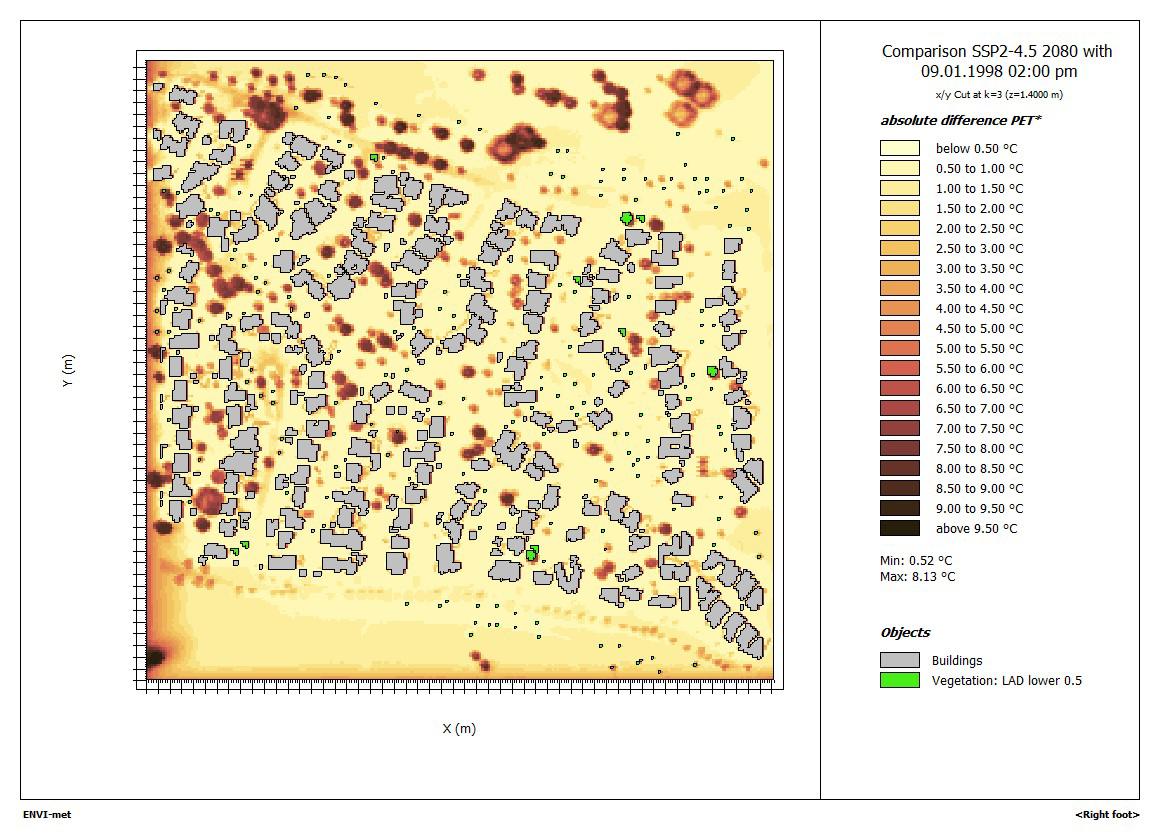
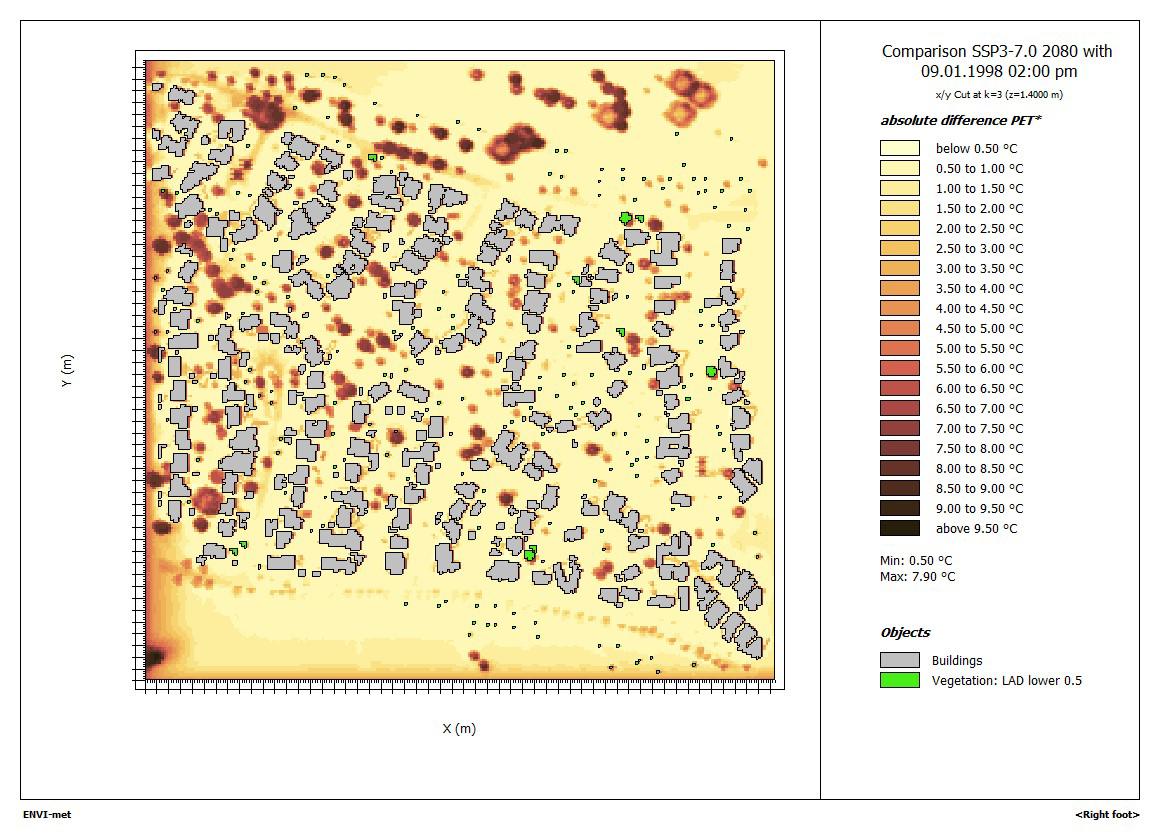
Karawara
Figure 82: The Karawara case study precinct.
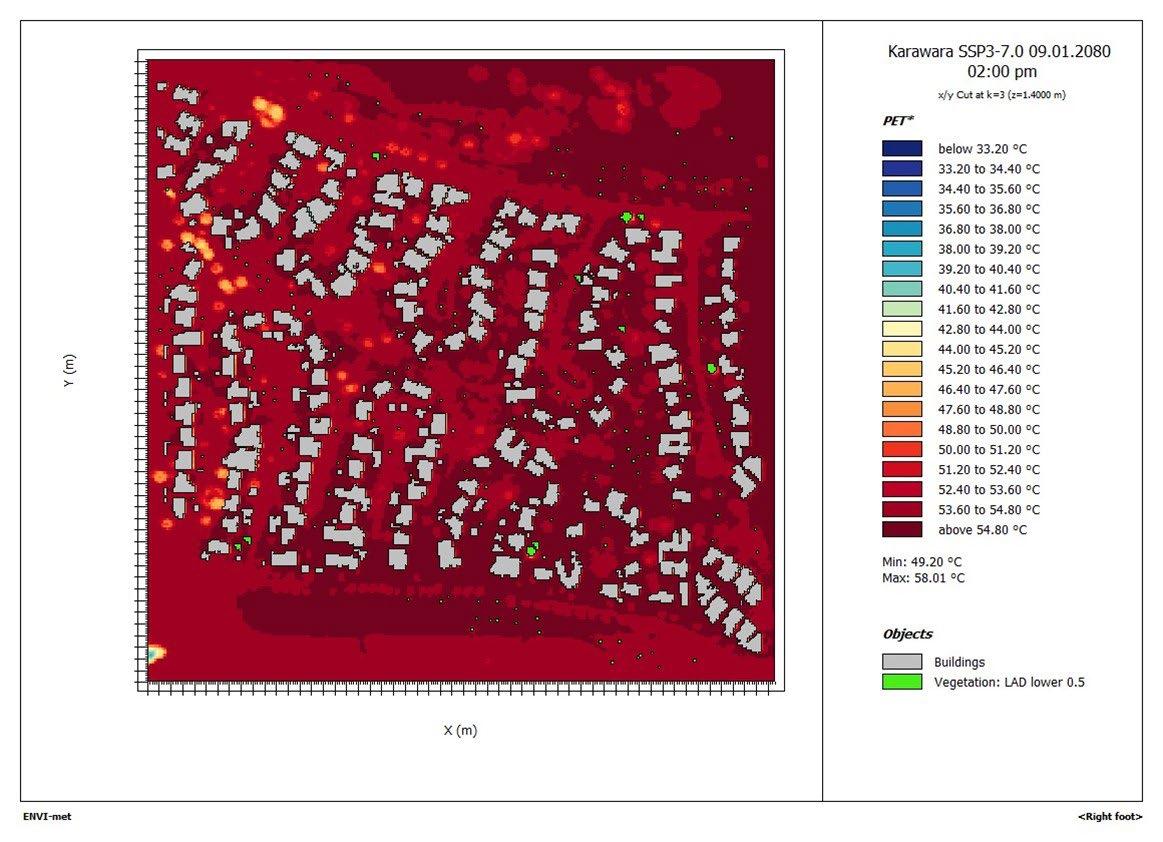
The ENVI-met map below shows the outdoor thermal comfort conditions (PET) at the hottest time (midday) of an average summer day in 2080 under SSP3-7.0 (Figure 83).
Figure 83 Karawara - PET in 2080 (SSP3-7.0). Strong heat stress equates to PET ≥ 35°C and extreme heat stress equates to PET ≥ 40°C.
The ENVI-met maps below indicate the change in outdoor thermal comfort conditions (PET) at the hottest time (midday) of an average summer day under SSP2-4.5 and SSP3-7.0 compared to the present climate (Figure 84 - Figure 86).
Figure 84 Karawara - Difference in PET 2050-Present (SSP3-7.0)
Figure 85 Karawara - Difference in PET 2080-Present (SSP2-4.5)
Figure 86 Karawara - Difference in PET 2080-Present (SSP3-7.0)
The comparison of present and future PET in a typical streetscape is set out in Figure 87 and the daylight hour in which the PET exceeds heat stress thresholds is in Table 14
Figure 87 Karawara - PET in typical streetscape.
Table 14 Karawara - exceedance of PET thresholds
The results indicate that by 2080 71% of hours of the day give rise to strong heat stress and 64% extreme heat stress.
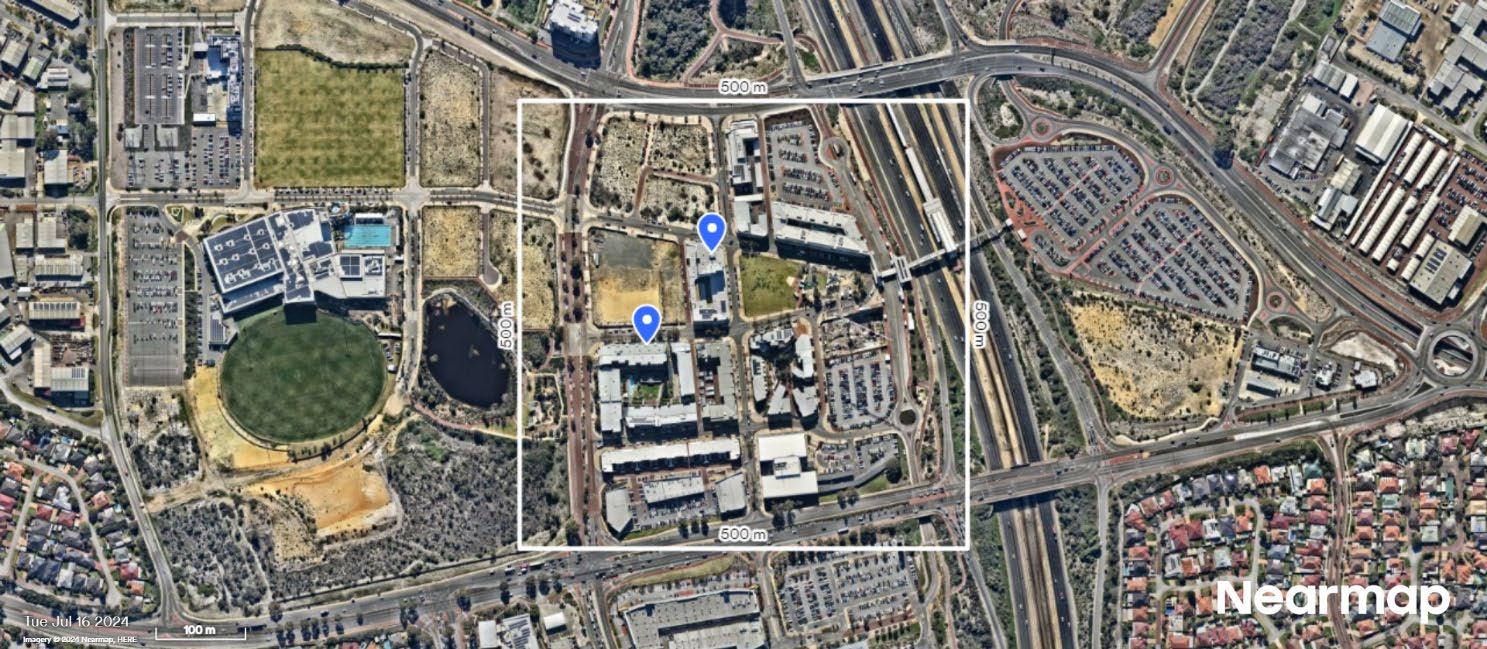
Cockburn Central
Figure 88 The Cockburn Central case study precinct.
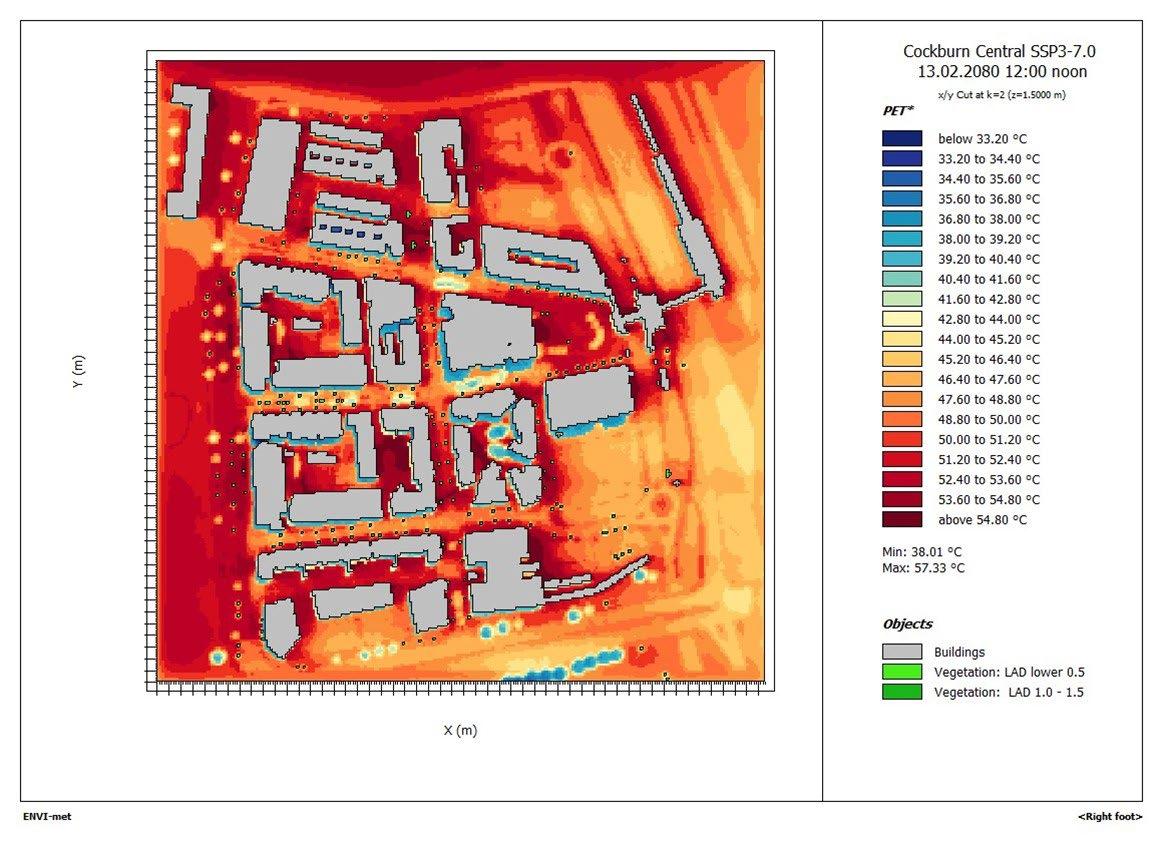
The ENVI-met map below shows the outdoor thermal comfort conditions (PET) at the hottest time (midday) of an average summer day in 2080 under SSP3-7.0 (Figure 89).
Figure 89 Cockburn Central - PET in 2080 (SSP3-7.0). Strong heat stress equates to PET ≥ 35°C and extreme heat stress equates to PET ≥ 40°C.
ENVI-met difference maps are not available for this case study as the model geometry was modified in the future climate runs to reflect future development.
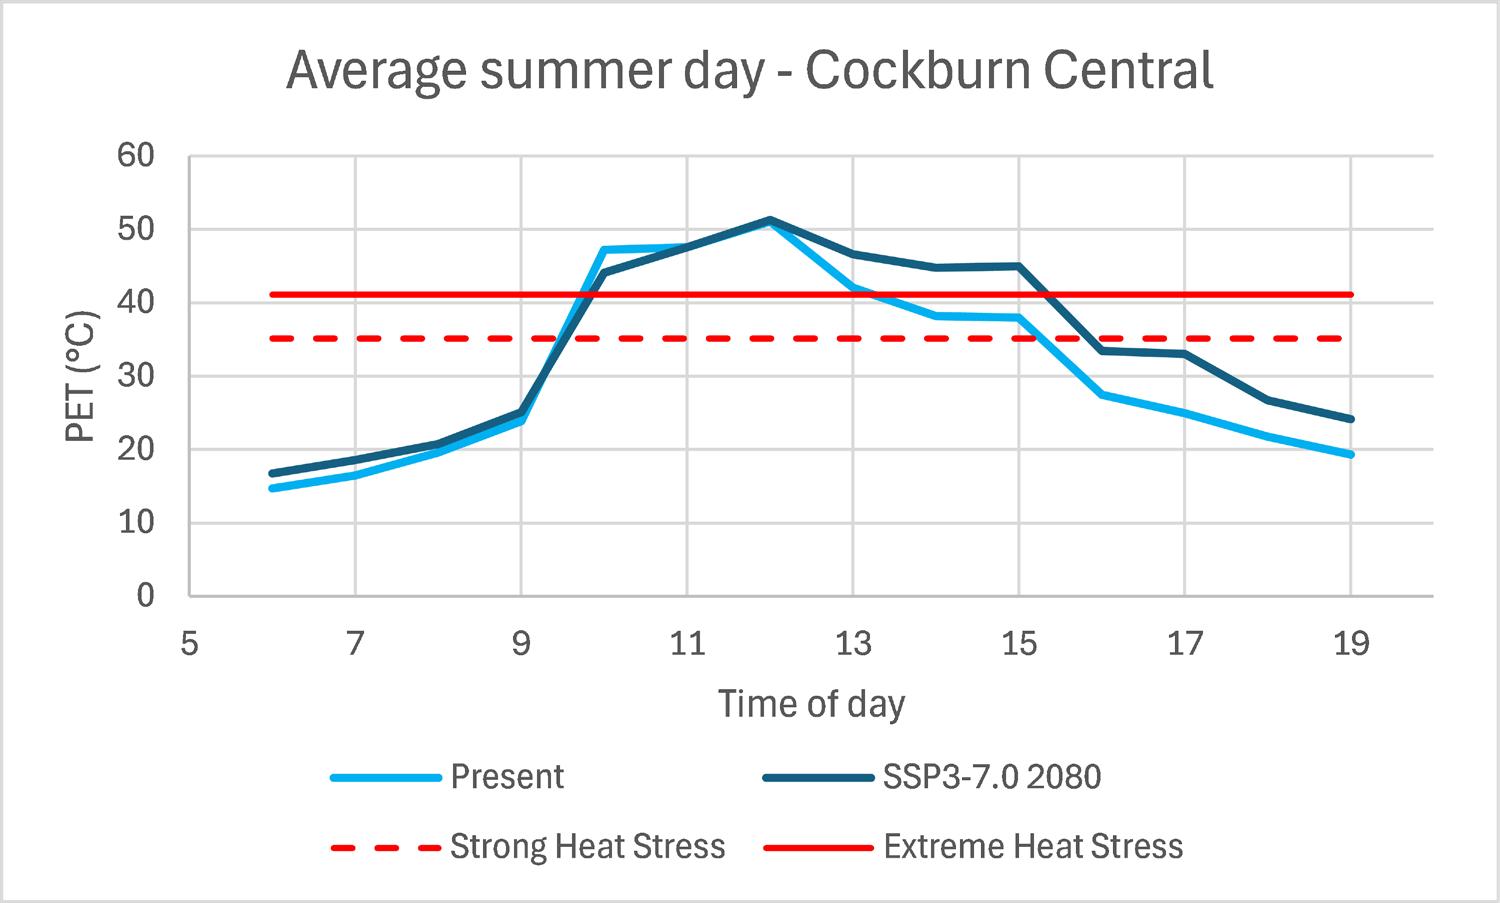
The comparison of present and future PET in a typical streetscape is set out in Figure 90 and the daylight hour in which the PET exceeds heat stress thresholds is in Table 15
Figure 90 Cockburn Central - PET in typical streetscape.
Table 15 Cockburn Central - exceedance of PET thresholds
The results indicate that by 2080 the percentage of hours give rise to strong heat stress will remain at 43% but extreme heat stress will rise from 29 to 43% of hours of the day.
The ENVI-met map below shows the outdoor thermal comfort conditions (PET) at the hottest time (midday) of an average summer day in 2080 under SSP3-7.0 (Figure 92).
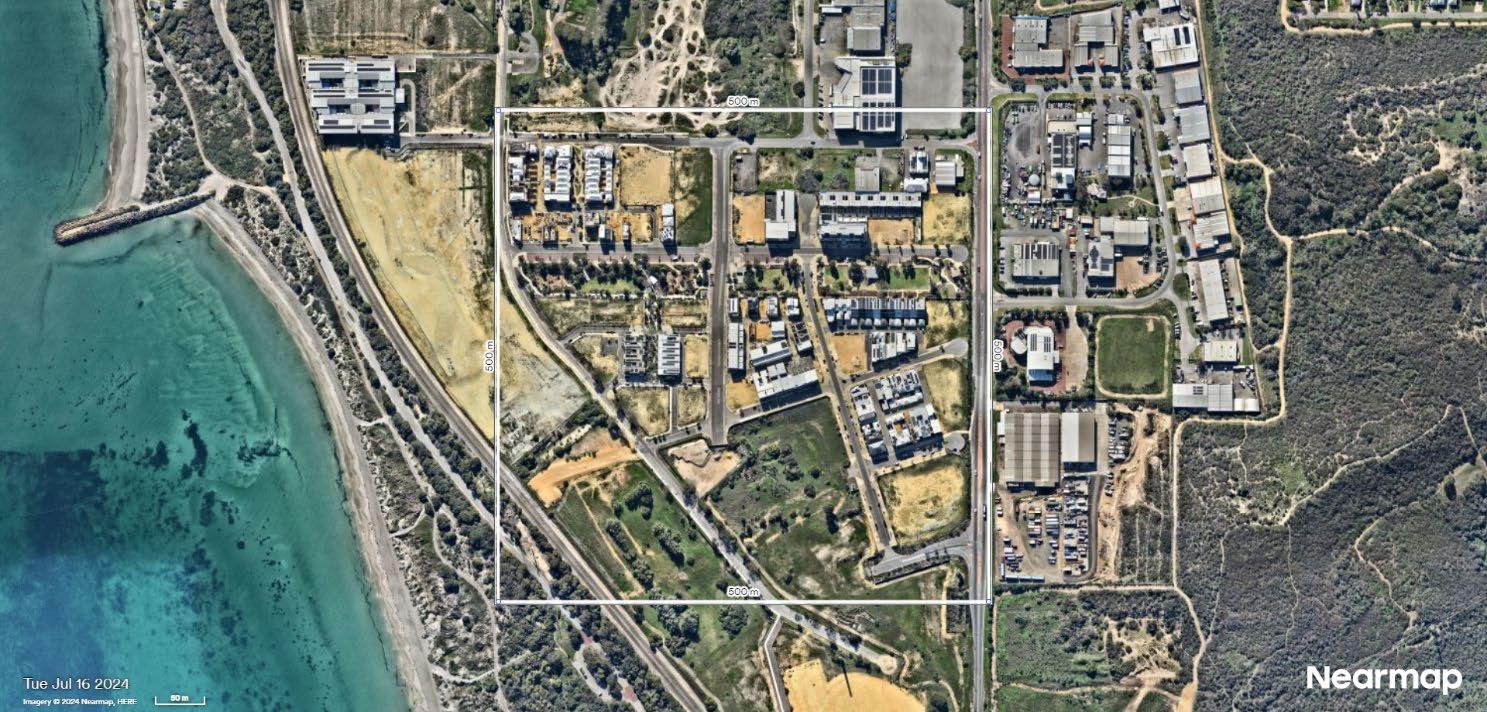
Salt Lane
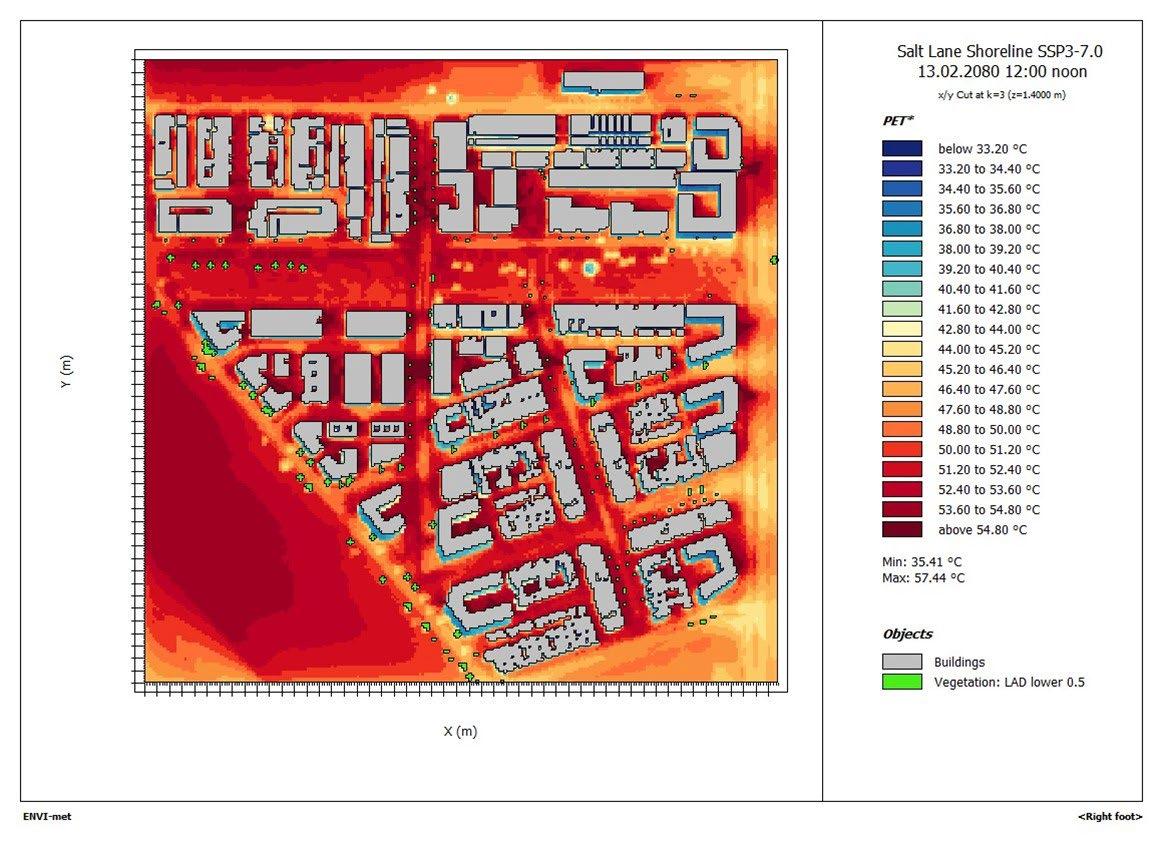
Figure 91 The Salt Lane case study precinct.
Figure 92 Salt Lane - PET in 2080 (SSP3-7.0). Strong heat stress equates to PET ≥ 35°C and extreme heat stress equates to PET ≥ 40°C.
ENVI-met difference maps are not available for this case study as the model geometry was modified in the future climate runs to reflect future development.
The comparison of present and future PET in a typical streetscape is set out in Figure 93 and the daylight hour in which the PET exceeds heat stress thresholds is in Table 16
Figure 93 Salt Lane - PET in typical streetscape.
Table 16 Salt Lane - exceedance of PET thresholds
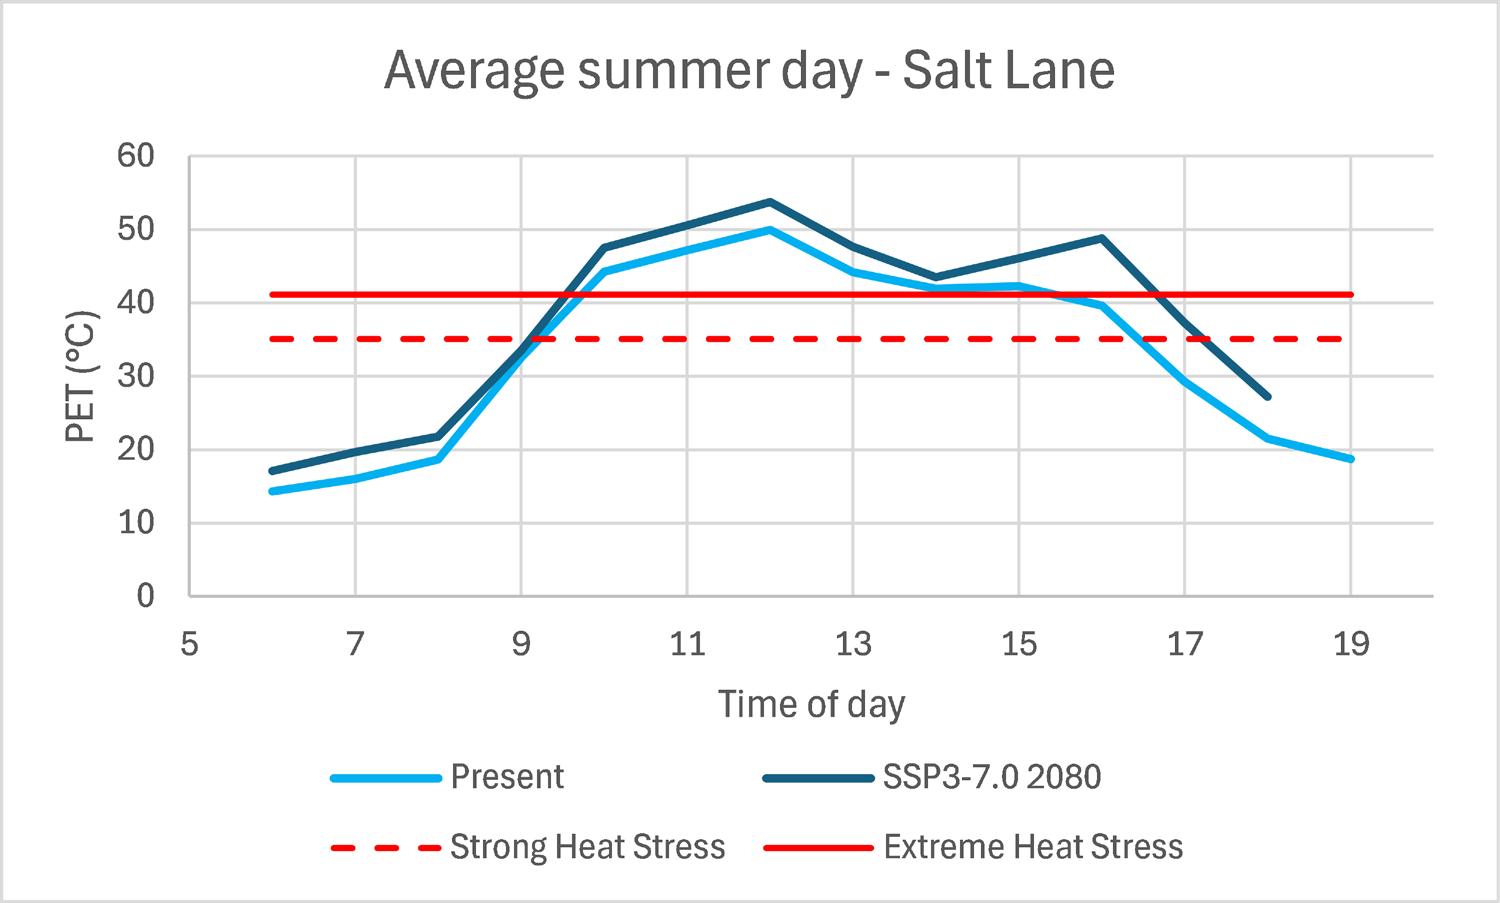
The results indicate that by 2080 62% of hours of the day give rise to strong heat stress and 54% extreme heat stress.
5. Discussion
5.1
Climate conditions
The macroclimate changes under SSP2-4.5 and SSP3-7.0 are projected to be similar at 2050 and 2080 for the case study precincts, with average summer wet bulb temperatures increasing from 3-5°C. Conditions under SSP3-7.0 are projected to worsen beyond 2080 (see Figure 5).
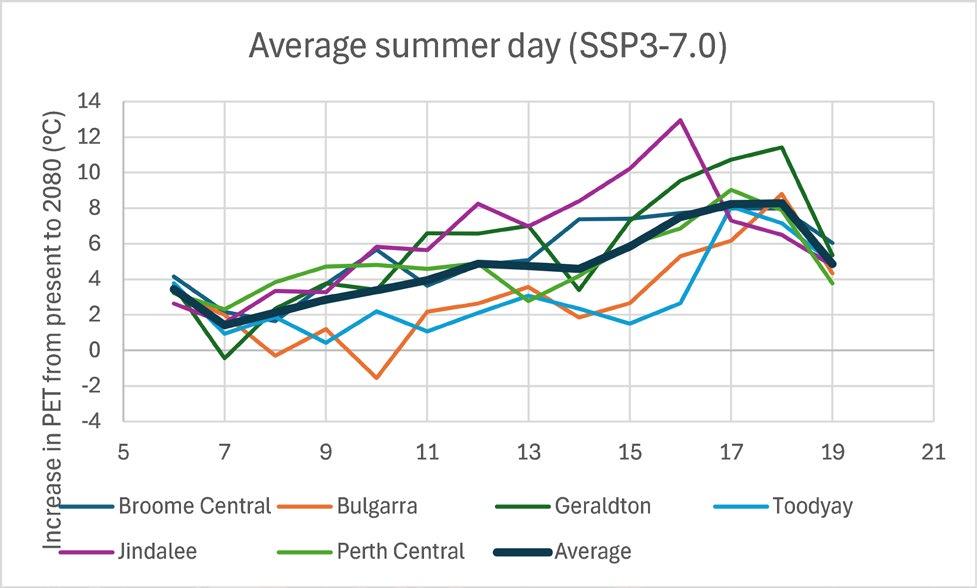
The outdoor thermal comfort performance of the case studies as measured by PET is set to worsen across the state under the climate scenarios considered in this study. Figure 94 a) depicts PET changes in a typical streetscape in an average summer day in a selection of case study precincts. This illustrates worsening conditions across the day in line with the progression of air temperatures. Figure 94 b) shows the average increases from 6am-7pm in those same locations.
By 2080 under SSP3-7.0 average summer middle of the day heat stress will reach extreme levels (40°C) and approach 50°C in all case study areas. Conditions will be worse on hotter than average days and in respect of SSP3-7.0 will be worse after 2080.
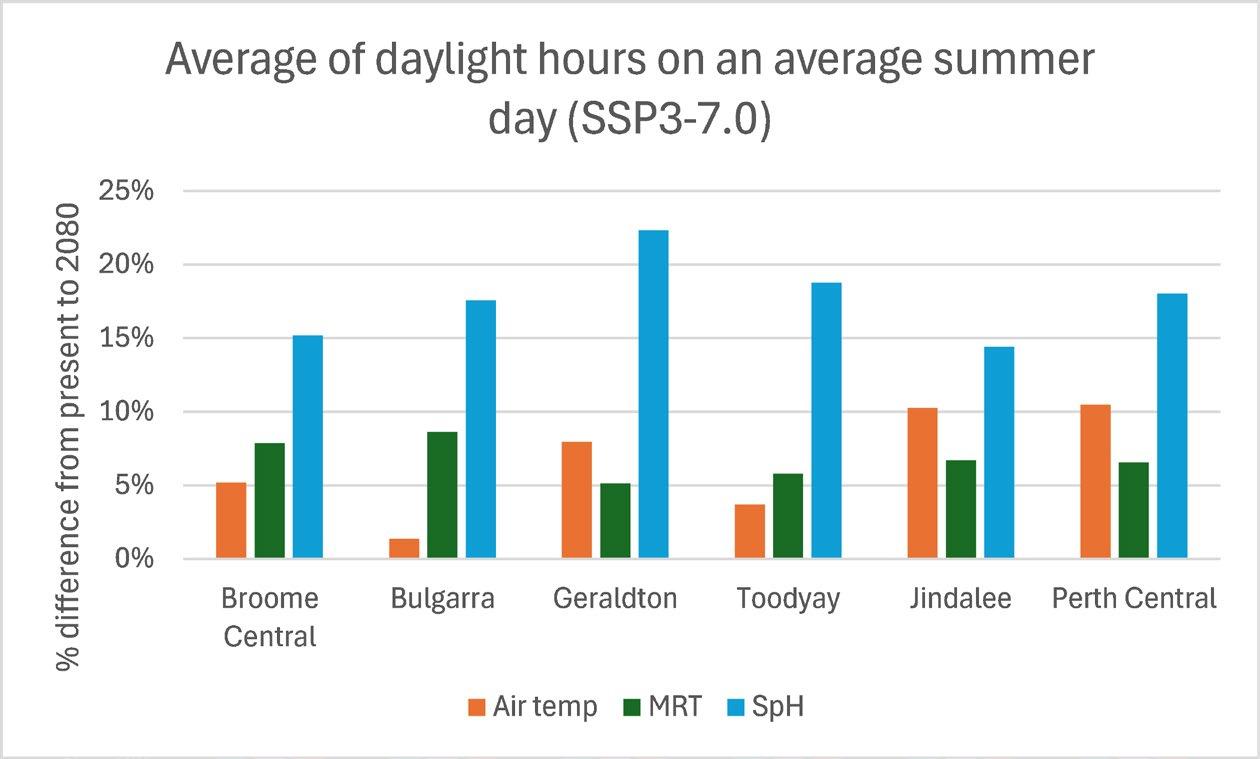
The increase in PET arises from the synergistic effects of mean radiant temperature, air temperature, humidity, and wind speeds at near ground level. The relative increase of these variables from the present to 2050 is illustrated in Figure 95
Figure 94 Projected increases in PET by 2080 (SSP3-7.0) a) diurnal variation b) average of daylight hours.
Figure 95 Relative changes in outdoor thermal comfort variables.
This shows that it is the increase in specific humidity (as distinct from relative humidity) that will increase the most over the coming decades (ranging from 15-22%) over the daylight hours of an average summer day. This reflects the increase in wet bulb temperatures set out in the macroclimate summaries in Section 4.2 and is a global phenomenon (Yang, Zhao, & Oleson, 2023) Specific humidity will increase because the warmer atmosphere can hold more moisture. In turn a higher moisture content can absorb more heat, resulting in reinforcing feedback
Both air temperature and mean radiant temperature (MRT) also contribute to changes in PET. MRT is locally influenced by the absorption of heat in adjacent surfaces from the warmer atmosphere. Changes to wind speeds are not significant between the scenarios.
The percentage of hours on an average summer day now and in 2080 exhibiting extreme heat stress (i.e. PET ≥ 40°C) are shown in Table 17. The largest change is predicted for Geraldton, Jindalee, and Broome Central with other locations retaining similar durations.
Table 17 Percentage of daylight hours in extreme heat stress on an average summer day (SSP3-7.0)
5.2 The cooling benefit of parks and canopy
As noted in the Phase 1 report the parks in our case study areas provide little cooling (as assessed through PET), and certainly, no cooling effects extended any significant distance outside of the park itself. This finding has spurred additional research which is reported elsewhere (Barghchi, Grace, Edwards, Bolleter, & Hooper, 2024) that confirms those findings. The most significant benefit derives from the shade provided by canopy cover which shields the direct (and partially indirect) effects of solar radiation. The benefits of cooling from evapotranspiration from trees is a secondary benefit but is limited in hot conditions as leaf stomata close to retain moisture, and of course hot conditions will increase in frequency. This leaves shade as the primary protection from heat in hot summer conditions.
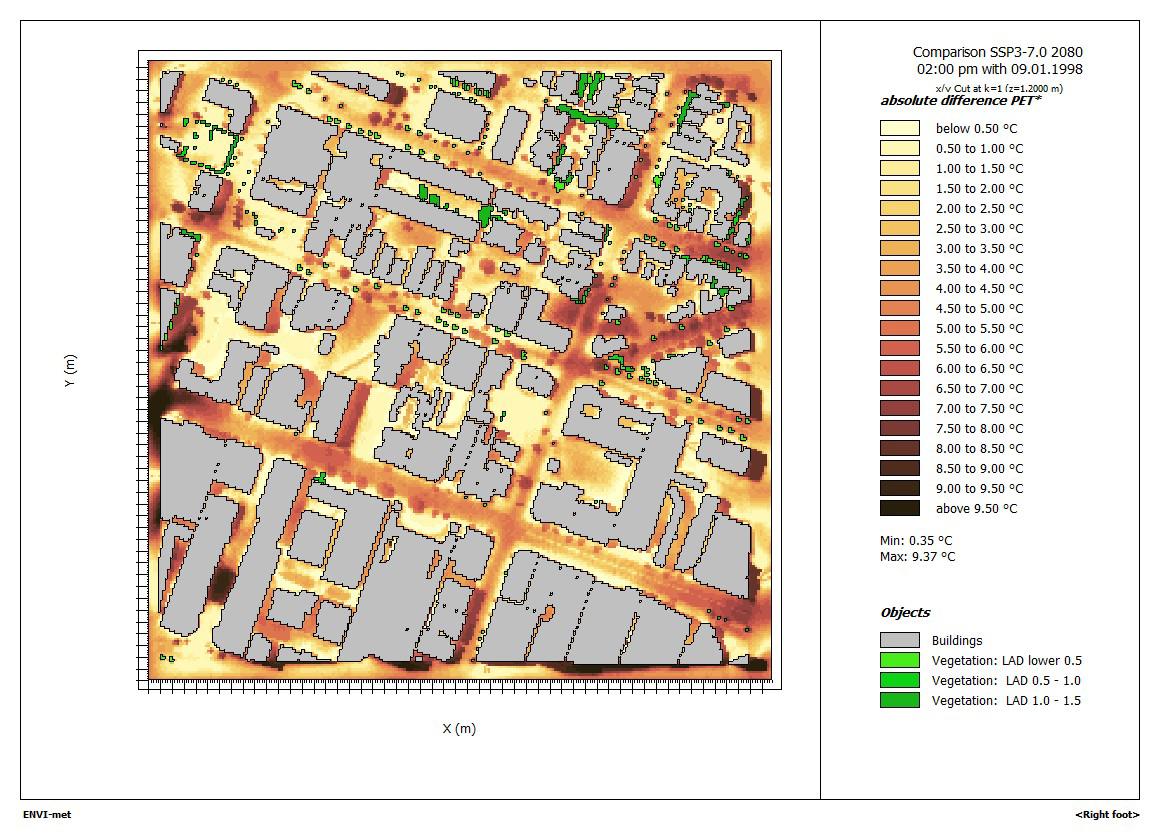
The case study precinct with the most urban canopy in this study is Karawara, a mature suburb with more shade than most Perth suburbs (Figure 82) While the ENVI-met modelling confirms that shade from trees like this continue to result in lower PET than adjacent exposed locations, the benefit (i.e. difference in PET) appears to be diminishing with climate change. This is apparent in all the difference maps in Section 4.3, which illustrate that the increase in PET to 2080 is (typically) up to several °C greater than in adjacent exposed locations during the afternoons. The explanation for this effect seems to be related to changes in solar radiation projected to occur with climate change.
The trapping of heat by greenhouse gases in the atmosphere is leading to an increased absorption of longwave radiation which is the cause of global warming. It is projected that direct solar radiation reaching the earth’s surface will diminish due to increased atmospheric water vapour (Song et al.,
2025) but diffuse solar radiation (i.e. that which is scattered by atmospheric particles) will increase for the same reason. Unlike direct solar radiation, diffuse radiation comes from all directions.
The net result of these changes means that the received net solar radiation will marginally increase with climate change under canopy while marginally reducing in adjacent exposed locations. This net increase leads to higher relative mean radiant temperature and PET. This is a significant finding from this research.
6. Next steps
Subsequent phases of the project will:
• Develop and evaluate the performance of design proposals to adapt urban precinct and housing case studies to projected climate change using micro-climatic, building energy, and water modelling and community engagement (Phase 3)
• Develop CSUD principles for adaptation of WA urban precincts and housing to temperature and rainfall changes for inclusion in the revision of future state and local government policies and design guidance (Phase 4)
7. References
Australian Climate Service. (2025). Australia’s National Climate Risk Assessment: An Overview. Retrieved from https://www.acs.gov.au/pages/national-climate-risk-assessment
Barghchi, M., Grace, B., Edwards, N., Bolleter, J., & Hooper, P. (2024). Park Thermal Comfort and Cooling Mechanisms in Present and Future Climate Scenarios. Urban Forestry & Urban Greening, 128533. 10.1016/j.ufug.2024.128533
Bureau of Meteorology. (2025a). Australian Water Outlook: Assessment Reports. Retrieved from https://awo.bom.gov.au/about/overview/assessment-reports#regionsandreports Bureau of Meteorology. (2025b). Australian Water Outlook: Projections. Retrieved from https://awo.bom.gov.au/about/overview/projections
Burman, R., & Pochop, L. O. (1994). Evaporation, evapotranspiration and climatic data. Amsterdam ;: Elsevier. Clim Systems. (2025). SimClim AR6. Retrieved from https://climsystems.com/simclim/ Climate Action Tracker. (2024). Warming Projections Global Update. Retrieved from https://climateactiontracker.org/documents/1277/CAT_2024-1114_GlobalUpdate_COP29.pdf
Connellan, G. (2013). Water use efficiency for irrigated turf and landscape. CSIRO Publishing. EnergyPlus. (2024). EnergyPlus. Retrieved from https://energyplus.net/ ENVI-met. (2021). ENVI-met: decoding urban nature. Retrieved from https://www.envi-met.com/ IPCC. (2023). Climate Change 2023: Synthesis Report. Contribution of Working Groups I, II and III to the Sixth Assessment Report of the Intergovernmental Panel on Climate Change In IPCC (Ed.). Geneva: International Panel on Climate Change. Lee, H., Calvin, K., Dasgupta, D., Krinner, G., Mukherji, A., Thorne, P., . . . Ruane, A. C. (2024). Climate change 2023 synthesis report summary for policymakers. CLIMATE CHANGE 2023 Synthesis Report: Summary for Policymakers
Rodrigues, E., Fernandes, M. S., & Carvalho, D. (2023). Future weather generator for building performance research: An open-source morphing tool and an application. Building and Environment, 233, 110104. 10.1016/j.buildenv.2023.110104
Song, S., Zhu, M., Tao, Z., Xu, D., Jiao, S., Yang, W., . . . Zhao, G. (2025). All-Weather Precipitable Water Vapor Retrieval over Land Using Integrated Near-Infrared and Microwave Satellite Observations. Remote Sensing, 17(15), 2730.
Yang, J., Zhao, L., & Oleson, K. (2023). Large humidity effects on urban heat exposure and cooling challenges under climate change. Environmental Research Letters, 18(4), 044024. 10.1088/1748-9326/acc475