Article
Developmentofaplanning supportsystemtoevaluate transit-orienteddevelopment masterplanconceptsfor optimalhealthoutcomes
EPB:UrbanAnalyticsandCityScience 2022,Vol.49(9)2429–2450
©TheAuthor(s)2022
Articlereuseguidelines: sagepub.com/journals-permissions DOI:10.1177/23998083221092419 journals.sagepub.com/home/epb
PaulaHooper ,JulianBolleterandNicoleEdwards
AustralianUrbanDesignResearchCentre,SchoolofDesign,TheUniversityofWesternAustralia,Crawley,Australia
Abstract
Thereisgrowingconsensusthatplanningprofessionalsneedclearerguidanceonfeaturesofthe builtenvironmentthatpromotehealthbenefits.Concomitantly,thesmartcitymovementhas createdrenewedopportunityandinterestindata-drivenurbanmodellingtosupportlanduse planning.PlanningSupportSystems(PSS)arespatiallyenabledcomputer-basedanalyticaltools incorporatinghealth-relatedmetricsthatapplyempiricalevidenceonbuiltenvironmentrelationshipswithhealth-relatedoutcomestoinformreal-worldurbandesign,urbanplanningand transportationplanningdecisions.ThispaperpresentsthedevelopmentoftheUrbanHealthCheck PSStouselocalempiricaldatatoexploreandpredictrelativehealthimpactsassociatedwith proposedurbandesignplanningchangesfromalternativenewstationprecinctmasterplanconcepts. Wepresentacasestudywherewecompareabaselinescenariowithalternativedesignconceptsfor anewtrainstationprecinctinPerth,WesternAustralia,thatincorporatedpossiblebuiltenvironmentinterventions.Subsequently,wediscusspotentialfutureapplicationsofhealthimpactPSS forthetranslationandapplicationofhealthevidenceintopractice.
Keywords
Planningsupportsystem,scenarioplanning,healthimpact,participatoryplanning,landuseplanning, health,healthimpact,builtenvironment,geographicinformationsystems,transit-orienteddesign
Introduction
PopulationprojectionsestimateAustralia’spopulationwilldoubleby2066(AustralianBureauof Statistics,2017),withthemajorityexpectedtoliveinexistingurbanareas(AustralianBureauof Statistics,2017).Oneofthebiggestchallengesisensuringthisurbanisationfacilitatesphysicaland mentalhealth.
Correspondingauthor:
PaulaHooper,AustralianUrbanDesignResearchCentre,SchoolofDesign,TheUniversityofWesternAustralia, Crawley,Perth,6009,WA,Australia.
Email: paula.hooper@uwa.edu.au
Walkabilityandhealth
Theconceptofwalkabilityisconcernedwiththeextenttowhichthebuiltenvironmentfacilitatesor hinderswalkingforthepurposesofdailylivingandhasrepresentedanimportantareaofenquiryin publichealth,planningandtransportation fields.Alargevolumeofresearchhasfocusedonthe walkabilityofthebuiltenvironmentanditsrelationshiptoarangeofhealth-promotingbehaviours andoutcomes(Baobeidetal.,2021).TheapplicationofGeographicInformationSystems(GIS) (Pearceetal.,2006)hasenabledthecreationofobjectiveenvironmentalexposuremeasuresto evaluatethepresenceandqualityofdesirablefeaturesthatcreateenvironmentsconduciveto encouragingandenablingwalkingandpositivehealthbehavioursandoutcomes(ButzandTorrey, 2006).Measuresincludewalkabilityindices(residentialdensity;connectivity;andlandusemix), access(distance)andtraveltimestodailydestinations,publictransportinfrastructureandparks;and theamountofgreenspace
Transit-orienteddevelopmentasawalkableantidotetosprawl
Whilethehealthbenefitsofwalkableneighbourhoodsarewellestablished,thesprawling,low density,mostlymono-functionalresidentialdevelopmentthatdominatesAustraliancities – and thoseinNorthAmericalimitpeople’sabilitytowalkorcyclefortheirdailytravelrequirements (Duanyetal.,2000),andhasbeenassociatedwithadversehealtheffectssuchashigherratesof obesity,highbloodpressure,hypertensionandchronicdiseases(Ewing,2008).Sprawlisalso correlatedwithincreasedenergyuse,pollution,trafficcongestion,lossofnaturallandandwildlife habitat(Ritchieetal.,2021).Thisformofcontinuedsuburbangrowthisunsustainableand unhealthy(Duanyetal.,2000; Ewingetal.,2003; Ewing,2008; Frumkinetal.,2004)andhas spurredthepursuitofinfilltargetsbyAustralianstategovernmentstoconsolidatenewdevelopment inexistingurbanareasandintegrationwithpublictransportationthatsupportsamodeshiftaway fromprivatemotorvehiclestowardswalking,cyclingandpublictransportuse(Stevensonetal., 2016).
Therecurringspatialplanningstrategythatmostnotablyintegratesthesegoalsis Transit-OrientedDevelopment(TOD) – whichaimstoencouragepublictransportusagebyplacing residentialandcommercialareaswithinwalkingdistanceofmasstransithubs.Walkabilityisthusa coreelementofTODanddeliversmanybenefitsincludingreducedcardependencyandCO2 emissions,andhigherpublictransportpatronage.TODsalsoaimtoimproveaccesstolocalservices andjobs – creatingconditionsconduciveforincreasedactivetravelbehavioursandassociated physical,socialandmentalhealthbenefits(Ibraevaetal.,2020),Science-basedgeo-designand planningsupportsystemsfordesigninghealthycities.
Despiteanexpandingevidencebase,andagrowingacceptanceoftheneedforhealth-enhancing planninginterventions,planningprofessionalsneedclearerguidanceonthefeaturesthatarelikely toproduceoptimalcommunity-widehealthimpacts(Allenderetal.,2009; BrownsonandJones, 2009; Giles-Cortietal.,2015; Oliveretal.,2014).Urbanplanningprofessionalsneedtoolsthat provideevidence-baseddatatoenablethemtoreviewthepotentialimpactsofspatialplansand explorealternativesinaniterativeandinteractivewaytomakeinformed,evidence-baseddecisions (Batty,2012; Miller,2012; Corburn,2004).
ThissentimentisechoedintheUnitedNations ’ NewUrbanAgenda(UnitedNations,2017), whichemphasisestheneedforincreaseddataanalysisinspatialplanning(Pettitetal.,2018).The ‘smartcities’ movementhasalsocreatedinterestindata-drivenurbanmodellingtosupportlanduse planning(Batty,2012).Itisthustimelytodevelopandtestinnovativeevidence-baseddigitaltools tosupportthetranslationandapplicationofhealthevidenceintoplanningpractice,topositively influencethedesignoffuturehealthy,liveablecommunities.
‘Geo-design’ infusesgeographyandurbanplanningwithablendofscience-basedinformation, analyticaltoolsandscenarioplanningprinciplestohelpdesigners,plannersandstakeholdersmake informed,evidence-baseddecisions(Miller,2012).Itischaracterisedbytheintegrationofgeographicinformationsystems(GIS),sciencemethodsandinformationcommunicationtechnology toolstotransformspatialdataintorelevantknowledgetotestalternativedesignscenariostoinform democraticplanningandspatialdecision-making(Campagna,2016).
PlanningSupportSystems(PSSs)areafamilyofcomputer-basedinstruments(geo-designtools) specificallydesignedtosupportplannersinmakingcomplexdecisions(Br ¨ ommelstroet,2013). PSSsaredesignedtomeasure,spatiallyanalyse,visualiseandtestorevaluateimpactsthatarise fromalternativeurbandevelopmentdesignscenarios(ArciniegasandJanssen,2012; Geertmanand Stillwell,2004, 2020; Pettitetal.,2020).
HealthImpactAssessment(HIA)isatechniquethatallowsthoseresponsibleforplanningdecisionstomakeinformedchoicesinordertomaximisethehealthbenefitsofanyproposeddevelopmentandtominimiseanynegativeimpacts(Wong,etal.,2011).PSSsthataredesignedtofacilitate HIAareknownashealthimpactdecisionsupportsystems(Ulmeretal.,2015).Apreviousreview (Hooperetal.,2021)ofPSSincorporatinghealth-relatedmetricsfoundtheseprovideanopportunity toapplyempiricalevidenceonbuiltenvironmentrelationshipswithhealth-relatedoutcomestoinform real-worldlanduseandtransportationplanningdecisions(Hooperetal.,2021).Thesetoolsallowthe explorationandpotentialimpact/sofdifferentdesignconceptsonselectedhealthandwell-being outcomes(Boulangeetal.,2017, 2018; Hooperetal.,2021; Schoneretal.,2018).
PlanningforMetronet-Perth
’stransformativeblueprintfortransit-orienteddevelopment
MetronetistheStateGovernmentofWesternAustralia’slong-termblueprinttomeetPerth’sfuture transportandplanningneedsandisthesinglelargestinvestmentinpublictransportinthestate’s history.Theprojectplanstoinstall72kmofnewpassengerraillines,18newtrainstationsand upgradestoexistingstations.Itwillalsobeacatalystforthetransformationofover5,000hectares oflandwithinthestationprecinctstocreateliveablecommunitieswithincreasedresidentialand employmentopportunities,improvedaccessibilityandattractivenessofpublictransport,and provisionofarangeoffacilitiesandservices(GovernmentofWesternAustralia,2021b).Thestation precinctmasterplanswillsetthedesignvisionandlong-termplanningoftheareasaroundthe stations.Itisimportantthesedesignsmustcreatebuiltenvironmentsthatwillenableoptimal outcomesforthecommunityforcurrentandfuturegenerations.
ThecommencementofthedevelopmentofmasterplanconceptsforthenewMetronetstation precinctsmotivatedthedevelopmentoftheUrbanHealthCheckPSS. Theaimwastouselocalempirical datatoexploreandpredictrelativehealthimpactsassociatedwithurbandesignchangesresultingfrom differentmasterplandesignconcepts.ThispaperpresentsthedevelopmentoftheUrbanHealthCheck PSS,theanalyticalmodelsdevelopedtoprovidelocally-derivedrelationshipsbetweenthebuiltenvironmentandspatial,environmentalandhealth-relatedoutcomesto: (a)benchmarkthecurrentbuilt environmentwithinaproposedstationprecinct;(b) measurepotentialbuiltenvironmentalchangesof alternativefuturemasterplanconceptsforthestationprecinct;andto(c)explorethepotentialhealth impactsassociatedwithchangestothebuiltenvironmentasaresultofthedifferentmasterplanconcepts.
Methods
Studyarea
TheMorley–EllenbrookLineistheWAStateGovernment’ssignatureMetronetprojectandis includedonInfrastructureAustralia’s ‘InfrastructurePriorityList’ (InfrastructureAustralia,2021).
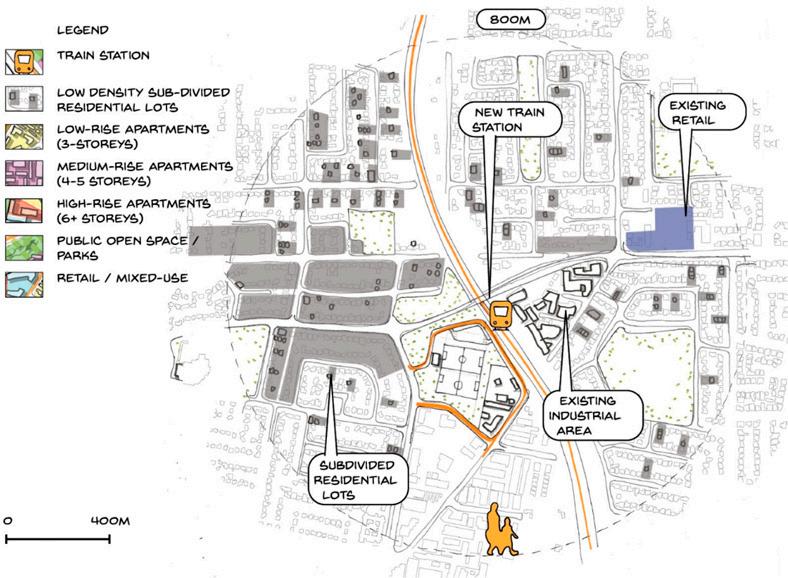
Itwillconnectthepreviouslyunlinkednorth-easternsuburbsofPerthtothebroaderrailnetwork throughtheinstallationof fivenewstationsheadingnortheastfromthePerthcentralbusinessdistrict (CBD),along21kmofnewrailline(GovernmentofWesternAustralia,2020)(Figure1).Thecase studyforthispaperisthenewMorleytrainstation,tobebuiltapproximately10kmnortheastofthe PerthCBDand3kmfromtheMorleyactivitycentreboundary,whichcontainsPerth’ssecondlargestcommercialshoppingcentre(Figure1).Thestation(Figure2)willbeinthecentralmedianof amajorfreeway.Totheeastandsouthofthestationlocationisanareaoflightindustryandtothe westisasubstantialparkthataccommodatesasportsclub.
Urbanhealthcheckmodeldevelopment
Softwareselection. TheUrbanHealthCheckwasdevelopedinGIS(ArcGISv10.7,ESRI)using ComunityViz,acommerciallyavailablePSSsoftwarepackage(CityExplainedInc,2020)that worksasanextensiontoArcGIS.CommunityVizwasselectedduetoitsversatilityinprovidinga suiteofinteractivetoolswhichcanbeusedtomodel,analyseanddynamicallyvisualisespatial information,anditscapacitytobuildcustommodelstooperationalisebuiltenvironmentvariables andrelatethemtooutcomesofinterest(e.g.healthimpacts)(Boulangeetal.,2018; Pelzeretal., 2015).Ithaspreviouslybeenappliedforbuildingcustommodelstoevaluateahealthimpactmodel thatestimatestheprobabilityofwalkingfortransportinresponsetoplanningforanewactivity centreinVictoria,Australia(Boulangeetal.,2018).
Indicatorselection. Twotypesofindicatorsweredevelopedtoevaluatethemasterplanconceptsfor thestationprecinct:(1)builtenvironmentmetricsand(2)healthandenvironmentalimpactindicators.Alimitedsuiteofindicatorswerecreatedtomatchthemasterplanningphaseforthisstudy. Moreover,therationalewastocreatearelativelysimplemodelthatwouldbetransparentand understandableforcommunitiesandurbandesigners/planners.
Builtenvironmentmetrics. Aconceptmasterplansetsthegeneralframetoguideanarea’slong-term development.Itoutlinesthevision,principlesandmacro-scalerecommendationsforproposed spatiallayouts,movementnetworksandconnections,landusesandopenspaceprovisionand indicativeresidentialdensitiesandbuildingheights(GovernmentofWesternAustralia,2021a).The builtenvironmentmetricsprovidedquantitativespatialmeasuresoftheurbanformwithinthe stationprecinctandcorrespondedtofeaturesthatwerepartofthemasterplanningprocess.
AgeodatabasewascreatedinArcGISandloadedwiththespatiallayers,croppedtotheboundary ofthestationprecinctstudyarea(Figure1),requiredforcalculatingthebuiltenvironmentvariables. Table1 outlinesthetwentybuiltenvironmentmetricsprogrammedintothePSS.Thesewere selectedastheyarewidelyrecognisedashavingassociationswithwalkingfortransportandpositive physical,mentalhealthandwell-beingoutcomes(Hooperetal.,2020).Theyalsorepresent five variablescommonlyusedtomodeltravelbehaviourandwalking(CerveroandKockelman,1997): (1)distancetopublictransport;(2)diversityoflanduses;(3)destinationaccessibility;(4)density andhousingmix;and(5)design.CommunityVizwasprogrammedsothatautomaticcalculations generatedthebuiltenvironmentmetricsanddisplayedtheindicatorsindynamicchartsonthe interactiveinterface.
Healthandenvironmentalimpactindicators. StatisticalformulaewereprogrammedintoCommunityVizusingcoefficientsderivedfromlocalempiricalresearch(Table2)tomodelandestimatethe potentialhealthandenvironmentaloutcomesassociatedwiththevaluesofthebuiltenvironmental metrics.Thissubsequentlyallowedustotestthepotentialimpactsofthemasterplandesign scenariosandchangestothebuiltenvironmentagainstthefollowingoutcomes:(1)walkingfor

Figure1. ThenewMetronetraillinesandlocationoftheMorleystationcasestudyarea.

GovernmentofWesternAustralia, 2021a).
transport,(2)mentalhealthand(3)landsurfacetemperatureandcooling.Thefollowingsections detailthespecificresearchevidenceandstatisticalformulaeunderpinningthecomputationand couplingofthebuiltenvironmentmetricstoeachoutcome.
Walkingfortransport. EarlierworkfromtheRESIDEprojecthasestimatedtherelationshipsbetweenfeaturesofthebuiltenvironmentandarangeofhealth-supportivebehavioursandwell-being outcomesforparticipantslivingacrossmetropolitanPerth(Hooperetal.,2020) – includingwalking fortransport.Regressioncoefficientsfromfully-adjustedmodels(thataccountedfordemographics andknowncovariatesoftheoutcomevariablessuchasage,gender,educationandincome)were identifiedforassociationswithundertakingwalkingfortransport(i.e.oneormoretrips)inausual week,andthebuiltenvironmentmetrics(Table2).Then,thefollowingalgorithmwasprogrammed intoCommunityViztoestimatetheprobabilitythatanindividualundertakes(any)walkingfor transportthattakesinthevaluesforeachbuiltenvironmentspatialindicatormultipliedbythe correspondingcoefficients
whereP(y=1)istheprobabilityofthedependentvariableytakingonthevalue1(y=1),ifa participantundertakesatleastoneormorewalkingfortransporttrips;xk(k=1,2,...,p)arethe independentvariablesrelatingtothebuiltenvironmentandsocio-demographicvariables;aisthe constantandbk(k=1,2,...,p)istheestimatedregressioncoefficients.Inthismodel,theeffectof eachbuiltenvironmentvariable(xk)is ‘weighted’ byitsregressioncoefficient(bk)tomeasurethe probabilitythatthedependentvariableytakingonthevalue.Theformulaindicatesthatadultsliving inaneighbourhoodavarietyofdestinationsandpublicopenspaces,shorterdistancestopublic transportInfrastructureandtree-coveredstreetscapeshavegreateroddsofwalkingfortransport.
Table1. UrbanHealthCheckbuiltenvironmentmetrics.
Distancetopublictransport
1)DistancetotrainstationAveragedistancetotheclosesttrainstationfromalldwellings
2)AccesstoatrainstationPercentageofdwellingswithin800mwalktoatrainstation
3)DistancetoabusstopAveragedistancetotheclosestbusstopfromalldwellings
4)AccesstoabusstopPercentagedwellingswithin400mwalktoabusstop Destinationaccessibilityandmix
5)LandusemixAreaoflanddevotedto ‘retail’ , ‘industrial’ or ‘publicopenspace’ .
6)AccesstomixeduseAveragedistancetotheclosestmixed-usedestination/landuse/ precinctfromalldwellings
7)AccesstomixedusePercentageofdwellingswithin800mwalktoamixed-use destination/landuse/precinct Densityandhousingmix
8)SingledwellingsNumberofsingleresidentialdwellingunits(areaoflandzonedsingle residential÷666m2)
9)GroupeddwellingsNumberofgroupresidentialdwellingunits(areaoflandzonedgroup residential÷300m2)
10)Low-riseapartmentsNumberoflow-riseapartmentdwellingunits(arealandzonedlowriseapartments÷200m2)
11)Medium-riseapartmentsNumberofmedium-riseapartmentdwellingunits(arealandzoned mediumriseapartments÷120m2)
12)High-riseapartmentsNumberofhigh-riseapartmentdwellingunits(arealandzonedhighriseapartments/80m2)
13)TotalnumberofdwellingsThenumberofresidentialdwellingswithinthestationprecinct 14)NetresidentialdensityNumberofresidentialdwellings÷areaoftheresidentialland 15)GrossresidentialdensityNumberofresidentialdwellings÷areaofthestationprecinct
16)AreaofpublicopenspaceSum(ha)ofallPOSwithinthestationprecinct
17)AccesstoPublicopenspaceAveragedistancetotheclosestPOSfromalldwellings
18)AccesstoPublicopenspacePercentageofdwellingswithinthestationprecinctwithin400mwalk toaPOS
19)POSgrassarea(km2)Assumethat85%ofthegrosslandareaofeachparkisdevotedto grass/turf
Design – Treecanopycover
20)Percentagetreecanopycoverin POS Averagepercentageoftreecanopycoverwithinparks.
21)Percentagetreecanopycoverin publicrealm/roads Averagepercentageoftreecanopycoverwithinallroadcadastre
Mentalhealth. TheRESIDEstudyalsoidentifiedassociationsbetweenthequantityofparksand mentalhealth(Woodetal.,2017).Thenumberofparkswaspositivelyassociatedwithpositive mentalhealth,where,foreveryadditionalparkWEMWBSscoresincreasedby0.11(p <0.05). Additionally,witheveryadditionalhectareofparklandwithin1.6kmofthehome,WEMWBS increasedby0.07(p <0.05).ThemeanWEMWBSscorefortheRESIDEpopulationwasidentified (BLINDEDFORREVIEW,2020)andaformulaprogrammedintoCommunityViztoestimatethe potentialchangetoWEMWBSscore(i.e.positivementalwell-beingbenefit)withchangestothe numberandareaofparksprovided.
Urbanheatislandeffects. ArecentstudyinPerth,identifiedcoefficientestimatesoftheaverage coolingeffectofdifferenturbanvegetationtypes(i.e.grass,shrubsandtreecanopy)onlandsurface
Table2. Regressioncoefficientsforwalkingfortransport,mentalhealth(WEMWBS)andlandsurface temperatureusedintheurbanhealthcheckPSSmodel.
Builtenvironmentalvariable/indicatorOutcomeCoefficient %ofresidentiallotswithin800mofatrainstationTransportwalking0.0224*a %ofresidentiallotswithin400mofabusstopTransportwalking0.0296*a %ofresidentiallotswithin400mofaretaildestinationofmixedlanduseTransportwalking0.0405*a HousingdiversityTransportwalking0.0945*a NetresidentialdwellingdensityTransportwalking0.0668*a Treedensity(numberperkmofroad)Transportwalking0.017*a Area(Ha)ofparksMentalhealth0.007b NumberofparksMentalhealth0.11b
1km2 increaseingrass(i.e.parkarea)Cooling
1km2 increaseintreecanopycoverCooling
*Selectedcoefficientsfrommultivariatemodelsadjustedfordemographics;Oddsratioswereconvertedtocoefficientsby computingthelogarithmoftheoddsratio(=log(OR));Source. aBLINDEDFORREVIEW(2020). bWoodetal.(2017) cDuncanetal.(2019)
temperature(Duncanetal.,2019).Thecoefficientestimatesindicatedtheeffectonurbanmonthly average(daytime)landsurfacetemperaturesfora1km2 increaseingrass( 1.589°C)andtree canopy( 10.080°C)(Duncanetal.,2019).Thesecoefficientswereprogrammedintoaformulain CommunityViztoestimatethepotentialcoolingimpactwithchangesintreecanopycoverandthe areaofgreenopenspaces(perkm2)(Table2).
Designreview – testingstationprecinctmasterplanconcepts
Aspatialrepresentationofthecurrentbuiltenvironment(i.e.baseline)withinthestationprecinct areawasconstructedinArcGISandCommunityViz(Figure3)usingacadastralparceldatasetand thelocalplanningschemefortheareathatidentifiedthecurrentlanduseclassifications.The creationofnewland-usescenariosreflectingthealternativemasterplanconceptswithinthestation precinctweremodelledintotheCommunityViz(ArcGIS)interfacebyeditingthecadastralparcel polygonextents(i.e.cutting,adding,deletingandalteringboundaries)andassigningalternative landusesusingapainttoolofpossiblelandusesclassifications.Changestothelanduseand respectivespatiallayers(andtheirattributevalues),werethenusedasinputstoexecutethemodels andformulaetocomputethebuiltenvironmentmetricsandpotentialwalkingfortransport,mental healthandcoolingoutcomes.Dynamicchartswereprogrammedtodisplaythecomputedvaluesfor allindicatorsthatautomaticallyupdatedwhenalternativemasterplanconceptsweremodelled,and changesweremadetothespatiallayers.
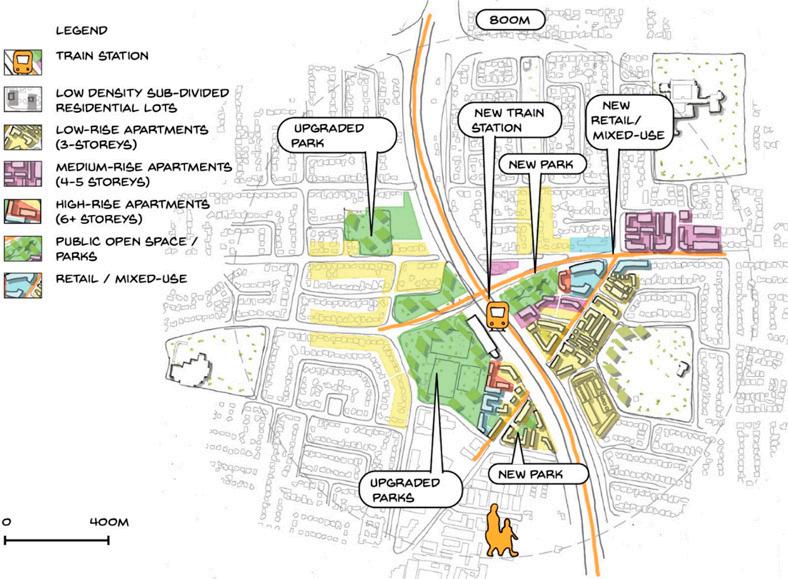
Theauthorsdevelopedthreepropositionalconceptmasterplansthatwereinformedbygovernmentpoliciesforurbanconsolidation(DepartmentofPlanning,2018):(1)atraditionalTOD;(2) AGreenOrientedDevelopment(GOD);and(3)aTODCorridor(Table3).Afourth ‘businessas usual’ conceptplanwasdevelopedtoreflectpotentialoutcomeswithouttheinterventionofa masterplanforthesite,with ‘backgroundinfilldevelopmentthroughcomparativelylow-medium densitythroughthesubdivisionofexistingresidentiallots(Table3).TwofurtherconceptmasterplansweredevelopedwiththeMetronetteam:(1)acommunityconcept,developedthrougha collaborativedesignworkshopusingphysical,scaledinteractivemodels,withtheCommunity WorkingGroupthatcapturedtheiraspirationsforthestationprecinct(Table3);and(2)aninitial
Table3. StationprecinctmasterplanconceptsmodelledandevaluatedintheUrbanHealthCheckPSS.
Master-planconcept
TheTOD Includesmixedusedand mediumtohighrise residentialdensity developmentimmediately aroundthestationand framestheexistingsoccer pitcheswithurbanform.

TheGOD
Correlatesurban densificationaround upgradedparkswithin thestationprecinct.
Thedensifiedpark precinctsare connectedtothetrain stationbyupgraded streetscapeswith significantstreettree plantings.

(continued)
Table3. (continued)
Master-planconcept
TheTODCorridor Correlatesurban densificationwith activatedstreet precincts.
Substantialmediumto high-risedensification islocatedalongan arterialroadleadingto thestation – the predominantfocusof existingcommercial activityinthearea.
TheBAU
Low–mediumdensity, dispersed, ‘background infill’ isenabled throughthe subdivisionofexisting residentiallots targetedalongthetwo maincorridors(roads) leadingtothenew station.Noother changestolanduseare proposedwithinthe stationprecinct.


(continued)
Table3. (continued)
Master-planconcept
CommunityCo-designed UrbanVillage Transformationofthe industrialareato createanewurban villageprovidingmixed useandemployment opportunities supportedbyhigh-rise andmedium-rise apartments. Regeneratingthe drainagesumpto createauseablepark. Greeningthestreets withadditionaltree canopy.

InitialDraftConcept Masterplan
Creationofanewurban ‘village’ intheindustrial areawithretail,mixed useandlow-,mediumandhigh-rise apartments. Convertsanexisting drainagesumpintoa useablepark.
Increasestreecanopycover onthestreetsleading tothestation.


TheUrbanHealthCheckPSSscenariodevelopmentprocessanddevelopmentinArcGISand CommunityViz.
draftconceptmasterplandevelopedbyaplanningconsultant(Table3).Eachofthesixconcepts weremodelledintheUrbanHealthCheck.UsingtheCommunityVizreporttool,summaryresults weregeneratedtocomparethedifferentmasterplanconcepts.
Results
Table4 outlinestheresultscalculatedbytheUrbanHealthCheckmodels,comparingthebuilt environmentmetricsinthebaselinescenariotothesixmasterplanconcepts.Allincludetheadditionalnewtrainstation,plusvariedchangestothelandusesandtreecanopycoverwithinthe stationprecinct.Theadditionofthenewstationsignificantlyimprovedtheaccessibilitytopublic transportforallresidentialdwellings – decreasingtheaveragedistancetoatrainstationby1.7km andresultingin17%oftheresidencesbeingwithinan800mwalkingdistanceofthestation.Under allmasterplanconcepts,thenumberofresidentialdwellingsincreased,butthetypeanddistribution acrosstheprecinctvaried.Allconceptsincreasedresidentialdensitybyaround30%.Underthe alternativeconcepts,mediumandhigherresidentialapartmentswereintroducedthatincreasedthe potentialdwellingyield.TheGODandTODscenariosintensifiedtheresidentialdevelopment aroundthenewstationandonexistingunderutilisedpublicopenspaceandborrowingfromthe currentindustrialland,resultinginanincrease>30%ofnewresidentialdwellings.UndertheTOD Corridorscenario,theincreaseddensitywasdistributedalongamainarterialrouteleadingtothe station.Thelandusemixchangedunderthevariousalternativeconcepts:theGODconcepts increasedtheareaofparkswhilstthedraftmasterplanresultedinthehighestmixofretailland.
Table5 presentstheestimatedvaluesfortheoutcomeindicators.Underallalternativemasterplan scenarios,theprobabilitythatadultsdidsometransport-walkingtripsincreasedabovetheestimated 50%atbaseline(Table5).TheBAUapproachsawnocoolingormentalhealthbenefit.TheGOD
Table4. DesignmetricsandresultsbydesignconceptfortheMorleyStationPrecinct.
Draftmasterplan concept
CommunityCo- designedurbanvillage concept
(
IndicatorBaselineTheTODTheGOD
Distancetopublictransport
Averagedistanceto closesttrainstation
( 10.35ha)
( 12.08ha)
( 0.00ha)
( 4.81ha)
Areaofindustrialland383.35ha376.67ha ( 6.76ha) 373.97ha ( 9.46ha)
Landusemix:%land area=residential
Landusemix:%land area=retail
Landusemix:%land area=industrial
Landusemix:%land area=POS
( 123.43m)
( 6.84m)
( 0.00m)
Averagedistanceto closestmixeduse/ retaildestination 962.18m962.18m ( 0.00m) 811.58m ( 150.60m) 709.65m ( 252.53m)
(+0.00%) 10.96% (+2.90%) 17.35% (+8.75%) 8.06% (+0.00%)
%ofdwellings ≤ 400m ofmixeduse/retail destination
Densityandhousingmix (continued)
Table4. (continued)
(+784= 28.58% : )
(+899=32.77% : )
(+550= 20.05% : )
(+669= 24.39% : )
(+943= 34.38% : )
(+856= 31.21% : )
TotalNo.ofresidential dwellings
No.ofsingleresidential dwellings
No.ofgrouped residentialdwellings
No.oflow-rise apartmentdwellings
No.ofmedium-rise apartmentdwellings
No.ofhigh-rise apartmentdwellings
No.ofdwellingtypes (1-5)
residentialdwellings
apartmentdwellings
apartmentdwellings
apartmentdwellings
(continued)
density (dwellingsper ha)
Table4. (continued)
Parenthesesanditalicsindicatethechangefrombaselinescenario. %landuse=(areaof[res/retail/industrial/pos]/ P res+retail+industrial+pos))x100.
Table5. KeyperformanceindicatorsandresultsbydesignconceptfortheMorleyStationPrecinct.
Potentialchangein population-level positivementalhealth
Potentiallandsurface temperaturecooling impact(°C)with changestothe provisionofPOS (grass)andtree canopycoverinPOS androads
conceptmasterplanperformedbest,withthegreatestprobabilityofundertakingtransportwalking (79%)andincreaseinpopulationWEMWBSmentalhealthscoresandgreatestpotentialcooling effectsduetothegreeningthroughtreecanopyandpublicopenspace.
Discussion
Thestudydevelopedandtrialledacustomised,evidence-based,healthimpactPSSto:(1)provide evidenceontheconnectionbetweenbuiltenvironmentalfeaturesandhealthoutcomesand(2) evaluatethepotentialspatial,environmentalandhealthimpactsthatmightresultfromproposednew stationprecinctdesignconceptsinPerth,WesternAustralia.
Likethehealth-impactPSSdevelopedby Schooneretal.(2018) and Boulangeetal.(2018),we havedemonstratedthatempiricalmodelsoftherelationshipbetweenthebuiltenvironmentand health-relatedoutcomescanbeincorporatedintoPSSs.ThehealthimpactcomponentofourPSS wasunderpinnedbylocalrigorousempiricalanalysesandmodellingtoidentifycoefficientsdescribingthestrengthofassociationbetweenmultiplebuiltenvironmentalfeaturesandwalkingfor transportandmentalhealth(BLINDEDFORREVIEW.,2020).Thismovesbeyondconventional researchtranslationapproachesfromthepublichealth fieldthroughitsabilitytointroducean academicevidence-basetotheworldofplanningprofessionalswholackevidenceinpractice (Allenderetal.,2009;BLINDEDFORREVIEW.,2019; Russoetal.,2018)andtoprovide decision-makerswiththeopportunitytotrialdifferentscenariosofpotentialinterventionsandto assessthemagainsthealth-orientedindicators.Moreover,becausetheUrbanHealthCheckPSSwas builtonacustomisablesystem(CommunityViz),theproposedmethodologycanbeappliedto constructfurtherhealth-impactPSSapplicabletootherprojects,contextsandlocations.
Inthisstudy,wedemonstratedthatinstallinganewtrainstationwouldhaveconsiderablebenefits onthelocalcommunity’saccesstopublictransport.Themaster-plannedstationprecinctsitewas somewhatconstrainedinthelandavailablewithinthestationprecinctthatcouldrealisticallybe altered.However,allscenarios,barthe ‘businessasusual’ concept,offerednoticeableimprovementsagainstthebaselinescenario(andtheBAUscenario),withthelandusemixandresidential densityincreasedbyconvertingcurrentlightindustrialareastoavarietyofresidentialdwellings,
mixed-useandretailofferingsandupgradingpublicopenspace.Thealternativemasterplan scenariosprovidednoticeablehealth(walkingandmentalhealth)andenvironmental(cooling) improvementsoverthecurrentbaselineenvironmentandthe ‘businessasusual’ approachto backgroundinfillinthestudyarea,typicalofthegrowth/infillpatternthatmightbeexpectedto occurInabsenceoftheMetronetstationintervention(BLINDEDFORREVIEW).Thissituation suggeststheunderlyingmodel,evenwithabasicsetofbuiltenvironmentalfactors,wassensitive enoughtodetecttherelativelysmallchangesandmodeldifferentialpotentialwalkingoutcomesasa result.
Walkingfortransport
Includinganewtrainstation,supermarketandprovidingproximateaccesstomixed-useareasalso increasedtheprobabilityofwalkingfortransportbyprovidingdestinationstowhichresidentscould walk.Increasingaccesstodestinationsiswellestablishedinthebuiltenvironmentliteratureto increaselocalwalking(Hajnaetal.,2015).Interestingly,theTODscenariorankedcomparatively lowlyconcerningwalkingfortransport.This findingisincontrasttotheliteratureclaimingthat compacturbanformco-locatedwithpublictransportnodeswillreduceautomobiledependency, encouragingwalking.Perhapsthisreflectsthepresenceofthemajorfreeway,whichsplitstheTOD precinctinhalf.Incontrast,theTODCorridorscenariorankedhighlyforwalkability,which resonateswiththeliteratureoncorridordensification,whichsupports ‘localactivitiesandpedestrian environment’ andprovidesaplace ‘wherecafes,smallbusinesses,apartments,transit,parkingand throughtrafficallmingleinasimpleandtime-testedhierarchy’ (Calthorpe,2011).Finally,The BAUscenariounsurprisinglyrankedlowestforwalkability,a findingwhichresonateswiththe literatureaboutad-hoc,dispersedmethodsforachievingurbaninfilldevelopment,whichistypicallyvehiculardependent(BLINDEDFORREVIEW,2020).
Mentalhealth. TheinclusionofamodelledmentalhealthoutcomeindicatorinourUrbanHealth CheckPSSisunique.ThehealthoutcomesincludedinprevioushealthimpactPSShavefocussed onphysicalhealthbehaviouraloutcomes(BLINDEDFORREVIEW,2021).Therewaslittle variationbetweentheschemes,reflectingthemultitudeoffactorsthatinfluencementalhealthand well-being.Nonetheless,TheGODscenario,whichcorrelatesdensificationwithPOS,ranked highly.This findingresonateswiththeliterature,whichhighlightsthatthementalhealthbenefitsof accesstonature(McDonald,2015)areachievedthroughreducingexposuretostressfactorsand providinganenvironmentforphysiologicalandmentalrecoverythatdeliverscopingresourcesto dealwithlifestressors.Conversely,theTOD,TODcorridorandBAUscenarios – noneofwhich focusexplicitlyongreen-spaceprovision – rankedcomparativelylow.Thissituationreinforcesthe needtoaddressurbandensificationinconcertwithgreen-spaceprovision.
Landsurfacetemperature. Thelandsurfacetemperatureresults,showsubstantialvariationbetween theTODandGODconcepts,reflectingthepotentialofurbandesigntoheavilyinfluenceland surfacetemperatures(Couttsetal.,2016).TheabilityoftheGODscenariotoreducetemperature significantlyconformstotheliteraturethatindicateshightreecanopycoverinparksandstreetscan coolthemicroclimateandimprovethermalcomfort(Couttsetal.,2016).Theroleoftreesin microclimaticregulationandthermalcomfortisbecomingparticularlyrelevantinthecontextof increasedtemperaturesincitiesduetothecombinedeffectsofclimatechangeandUrbanHeat Island(Couttsetal.,2016; KovatsandHajat,2008).
ThevalueoftheUrbanHealthCheckPSSandourcontributiontothe field. Previousreviewsintotheuse ofPSSintheplanningprofessionhaveconcludedthatPSSresearchstillhastoproveitsaddedvalue
toplanningpractice(Vonketal.,2005, 2007)throughempiricalresearchthatmovesawayfromthe experimentalcasestudiesthathavepredominatedintheliterature,towardsreal-worldplanning problemsandapplications(Russoetal.,2018; Vonketal.,2005).Thiscasestudyprovidesaunique exampleofaPSSbeingdevelopedanddeployedtoasignificantlarge-scalereal-worldpublic transportInfrastructureprojecttoensureproposeddesignconceptscreatebuiltenvironmentsthat willenableoptimaloutcomesforthecommunityforfuturegenerations.Importantly,theUrban HealthCheckPSSwasdevelopedincollaborationwithourindustrypartnertoensureitwassuited totheplanningtasksrequired.Furthermore,thespatialandhealthindicatorswerechosentoaddress theproject’sspecificdesignprinciplesandcommunityconcerns,thusensuringtheirrelevanceand fitnessforpurposeandprovidingdecision-makerswithhealthevidence.
Limitationsandfuturedirections. Whilstthehealthimpactmodelsweremultivariate(accountingfor changesinthecombinationofbuiltenvironmentalfeaturesincluded),arelativelylimitedsetofbuilt environmentalvariableswereincluded.Ourhealthimpactmodelincludedmacro-levelurbandesign andbuiltenvironmentalfeaturesassociatedwithwalkingandmentalhealthoutcomessuchasland usemix,accesstopublictransport,retailandotherdailyusedestinations,greenspace,amountof greenspace,dwellingmixandresidentialdensitiesthatareconsideredatthemaster-planningphase.
Inthiscasestudy,nointerventionsoralterationsweremadetothestreetnetwork.Assuch,a ‘connectivity’ metricwasnotincludedintheunderlyingwalkingfortransportmodel.Whilst connectivityisanimportantcomponentof ‘walkability’,theconstrainednatureofthestation precinctsite,becauseofexistingestablishedinfrastructure,meanttheopportunityformaking significantchangestotheroadnetworkwaslimited.Moreover,thefocusofthemasterplanning processwasconcernedwithexploringalterationstothelanduseswithinthesite.Additionally,other micro-leveldesignfeaturesrelatingtothedetailandqualityofthebuiltenvironmentthatwould enhancethewalkingexperienceandmakewalkinganattractive,safeanddesirableoption(e.g. footpathsandstreetlights)areconsideredaspartofplanningphasesandthereforewerenotincluded Inthecurrentmodel.
Themodelusedwasderivedfromquantitativeanalysesthatinevitablyignorethequalitative dimensionsandsubjectiveexperiencesofurbandesignoutcomesandbuiltenvironments.Other factorssuchassafetyconditionsandthequalityoftheenvironmentareimportantfactorsdetermining thewalkabilityofanareaandhaveimportantimpactsonthewalkingfortransportbehaviourmodelled inahealthimpactPSS.Forexample,studieshaveshownthatthequalityofpublicopenspacesmight bemoreimportantformentalhealthbenefitsthanthequantityofthesespaces(Francisetal.,2012; McDonald,2015).Inaddition,thedecisionofaresidenttowalkfortransportrestsonseveralother qualitativefactors(forexample,howcomfortableafemaleresidentmayfeelwalkinghomefromthe stationafterdark),whicharetoalargedegreenotabletobeconvertedtoaPSSalgorithm.
ThePSSmodelledthelikelihoodofparticipatinginany(atleastonetrip)ofwalkingfortransport inausualweek.Abinaryoutcomemeasurewasusedasitutilisedlocallyapplicabledatatakenfrom thePerth-basedRESIDEstudy-ofwhichthemajorityofresultswerefromlogisticmodelsfor binarybehaviouraloutcomes(suchasany/nonewalking).Futuremodelscouldbedevelopedto estimatethenumberofwalkingtripsortheduration(time)ofwalking.
Lastly,ourUrbanHealthCheckPSSandothers(Boulangeetal.,2018; Schoneretal.,2018) assesssimulatedalternativeurbandesignscenarios.However,theactualbuiltformthateventuates maybemarkedlydifferent.Despitethis,healthimpactPSShaveanimportantroleinensuringhealth isconsideredinthedesignandmasterplanningphasesofthenewTODstationprecincts.More studiesthatcanevaluateanddemonstratethebenefitsofhealthimpactPSSineducatingpolicymakersandplannersoftheimportanceandimpactoftheirdecisionsonthehealthofthe communitiestheyareplanningforisanessential firststeptoensurepoliciesandplansincludethe designfeaturesneededforoptimalon-groundoutcomestobeachieved.
Conclusions
Oursisoneoffewprojectstodeveloparobust ,empiricallybasedhealthimpactPSSspeci fi callydevelopedtoestimatebaselineandcust omscenariohealthimpactsofplanningand urbandesignconcepts.Thiscontr ibutionsupportspreviouswork( Hooperetal.,2021 ; Schooneretal.,2018 ; Boulangeetal.,2018 ),indicatingthatPSSrepresentapotentialtoolkit fortheintegration,translationandapplic ationofhealthevidenceintourbandesignand planningpractice.
Consideringthepotentialhealthandenvironmentalimpactsisessentialwhensigni ficantland developmentandtransportationinterventionscanhavelarge-scaleinfrastructural, fiscaland communityconsequences.Thisprojectissignificantinitstimingasmasterplansarecurrentlybeing developedthatwillsetthedesignvisionandlong-termplanningandtransformationofover 5,000hectaresoflandwithintheMetronetstationprecincts.OurUrbanHealthCheckPSSallows plannerstotestdifferentstationprecinctmasterplanconceptstoensurethesewillimproveaccessibilityandattractivenessofpublictransportandcreateoptimalhealthandenvironmental outcomesforthecurrentandfuturecommunity.
PSSmayprogresstobecomingvaluabletoolsforenhancingtheroleofhealthevidenceand knowledgeinplanning,therebyenablingandfacilitatingmoreevidence-basedplanningand bridgingthegapbetweenpublichealthresearchandplanningpolicyandpractice.Thisshiftcould stimulatestrategicdecisionsandprioritisedesignsolutionstailoredtooptimisingcommunities’ healthoutcomesandultimatelyproducehealthieron-groundcommunities.TheUrbanHealthCheck PSScanbeeasilyadaptedtobeappliedtothenewMetronet(andother)stationprecinctstoevaluate differentmaster-planningconcepts.
Acknowledgements
ThisstudywasundertakenincollaborationwiththeMetronetteamattheWesternAustralianDepartmentof Planning,LandsandHeritage.DrAnthonyDuckworthandGraceOliverranthecollaboratingco-design exercisewiththecommunityreferencegroup.
Declarationofconflictinginterests
Theauthor(s)declarednopotentialconflictsofinterestwithrespecttotheresearch,authorship,and/or publicationofthisarticle.
Funding
Theauthorsdisclosedreceiptofthefollowing financialsupportfortheresearch,authorship,and/orpublication ofthisarticle:ThisstudywassupportedbyaResearchFellowshipgrantfromHealthway(#32892).
ORCIDiD
PaulaHooper https://orcid.org/0000-0003-4459-2901
References
AllenderS,CavillN,ParkerM,etal(2009)`Tellussomethingwedon’talreadyknowordo!’ Theresponseof planningandtransportprofessionalstopublichealthguidanceonthebuiltenvironmentandphysical activity. JournalofPublicHealthPolicy 30:102–116. ArciniegasGandJanssenR(2012)Spatialdecisionsupportforcollaborativelanduseplanningworkshops. LandscapeandUrbanPlanning 107:332–342.
AustralianBureauofStatistics(2017) 0-PopulationProjections,Australia,2017.3222.(base)-2066. Availableat: https://www.abs.gov.au/AUSSTATS/abs@.nsf/Lookup/3222.0Main+Features12017% 20(base)%20-%202066?OpenDocument
BaobeidA,KoçMandAl-GhamdiSG(2021)Walkabilityanditsrelationshipswithhealth,sustainability,and livability:elementsofphysicalenvironmentandevaluationframeworks. FrontiersinBuiltEnvironment 7:2297–3362.
BattyM(2012)Buildingascienceofcities. Cities 29:S9–S16.
BoulangeC,PettitCandGiles-CortiB(2017)Thewalkabilityplanningsupportsystem:anevidence-based tooltodesignhealthycommunities.In:LectureNotesinGeoinformationandCartography,15thInternationalConferenceonComputersinUrbanPlanningandUrbanManagement(CUPUM2017) Adelaide – AustraliaJuly11-14,2017,pp.153–165.
BoulangeC,PettitC,GunnLD,etal(2018)Improvingplanninganalysisanddecisionmaking:thedevelopmentandapplicationofaWalkabilityPlanningSupportSystem. JournalofTransportGeography 69: 129–137.
BrommelstroetMt(2013)Performanceofplanningsupportsystems:whatisit,andhowdowereportonit? Computers,EnvironmentandUrbanSystems 41:299–308.
BrownsonRCandJonesE(2009)Bridgingthegap:translatingresearchintopolicyandpractice. Preventive Medicine 49:313–315.
ButzWPandTorreyBB(2006)Somefrontiersinsocialscience. Science 312:1898–1900.
CalthorpeP(2011)TheUrbanNetwork. UrbanismintheAgeofClimateChange.Washington,DC:Island Press.Availableat: https://doi.org/10.5822/978-1-61091-005-7_7
CampagnaM(2016)Metaplanning:aboutdesigningtheGeodesignprocess. LandscapeandUrbanPlanning 156:118–128.
CerveroRandKockelmanK(1997)Traveldemandandthe3Ds:density,diversity,anddesign. Transportation ResearchPartD:TransportandEnvironment 2(3):199–219.
CityExplainedInc(2020) CommunityViz:UrbanAnalyticsforPlanners5.1.Charlotte,NC:CityExplained Inc.
CorburnJ(2004)Confrontingthechallengesinreconnectingurbanplanningandpublichealth. American JournalofPublicHealth 94:541–546.
CouttsAM,WhiteEC,TapperNJ,etal.(2016)Temperatureandhumanthermalcomforteffectsofstreettrees acrossthreecontrastingstreetcanyonenvironments. TheoreticalandAppliedClimatology 124:55–68. DepartmentofPlanningLaH(2018) PerthandPeel@3.5Million.Perth,WesternAustralia:Departmentof PlanningLaH.
DuanyA,Plater-ZyberkEandSpeckJ(2000) SuburbanNation:TheRiseofSprawlandtheDeclineofthe AmericanDream.NewYork:NorthPointPress.
DuncanJMA,BoruffB,SaundersA,etal.(2019)Turningdowntheheat:anenhancedunderstandingofthe relationshipbetweenurbanvegetationandsurfacetemperatureatthecityscale. ScienceofTheTotal Environment 656:118–128.
EwingR,SchmidT,KillingsworthR,etal.(2003)Relationshipbetweenurbansprawlandphysicalactivity, obesityandmorbidity. AmericanJournalofHealthPromotion 18:47–57.
EwingRH(2008)Characteristics,causes,andeffectsofsprawl:aliteraturereview.In:MarzluffJM, ShulenbergerE,EndlicherW,etal.(eds) UrbanEcology:AnInternationalPerspectiveontheInteraction betweenHumansandNature.Boston,MA:SpringerUS,519–535.
FrancisJ,WoodLJ,KnuimanM,etal(2012)Qualityorquantity?Exploringtherelationshipbetweenpublic openspaceattributesandmentalhealthinPerth,WesternAustralia. SocialScience&Medicine 74(10): 1570–1577.
FrumkinH,FrankLandJacksonR(2004) UrbanSprawlandPublicHealth:Designing,Planningand BuildingforHealthyCommunities.Washington:IslandPress.
GeertmanSandStillwellJ(2004)Planningsupportsystems:aninventoryofcurrentpractice. Computers, EnvironmentandUrbanSystems 28:291–310.
GeertmanSandStillwellJ(2020)Planningsupportscience:developmentsandchallenges. Environmentand PlanningB:UrbanAnalyticsandCityScience 47(8):1326–1342.
Giles-CortiB,SallisJF,SugiyamaT,etal(2015)Translatingactivelivingresearchintopolicyandpractice:one importantpathwaytochronicdiseaseprevention. JournalofPublicHealthPolicy 36:231–243.
GovernmentofWesternAustralia(2020) Metronet:Morley-EllenbrookLineProjectDefinitionPlan(June 2020).Perth,WesternAustralia:GovernmentofWesternAustralia.
GovernmentofWesternAustralia(2021a) DraftMorleyStationPrecicntConceptMasterPlan.Perth,WA: GovernmentofWesternAustralia.
GovernmentofWesternAustralia(2021b) Metronet.Availableat: https://www.metronet.wa.gov.au/. HajnaS,RossNA,BrazeauA-S,etal.(2015)Associationsbetweenneighbourhoodwalkabilityanddailysteps inadults:asystematicreviewandmeta-analysis. BMCPublicHealth 15:768.
HooperP,BoulangeC,ArciniegasG,etal.(2021)Exploringthepotentialforplanningsupportsystemsto bridgetheresearch-translationgapbetweenpublichealthandurbanplanning? InternationalJournalof HealthGeographics 20(1):36.
HooperP,FosterS,BullF,etal(2020)Livingliveable?RESIDE’sevaluationofthe “liveableneighborhoods” planningpolicyonthehealthsupportivebehaviorsandwell-beingofresidentsinPerth,WesternAustralia. SSM-PopulationHealth 10:100538.
IbraevaA,CorreiaGHdA,SilvaC,etal.(2020)Transit-orienteddevelopment:areviewofresearch achievementsandchallenges. TransportationResearchPartA:PolicyandPractice 132:110–130. InfrastructureAustralia(2021) InfrastructurePriorityList:ProjectandInitiativeSummaries KovatsRSandHajatS(2008)Heatstressandpublichealth:acriticalreview. AnnualReviewofPublicHealth 29:41–55.
McDonaldR(2015) ConservationforCities:HowtoPlanandBuildNaturalInfrastructure.Washington: IslandPress.
MillerW(2012) IntroducingGeodesign:TheConcept.Redlands,CA:ESRI.
OliverK,InnvarS,LorencT,etal.(2014)Asystematicreviewofbarrierstoandfacilitatorsoftheuseof evidencebypolicymakers. BMCHealthServicesResearch 14:1–12.
PearceJ,WittenKandBartieP(2006)Neighbourhoodsandhealth:aGISapproachtomeasuringcommunity resourceaccessibility. JournalofEpidemiologyandCommunityHealth 60:389–395.
PelzerP,ArciniegasG,GeertmanS,etal.(2015)Planningsupportsystemsandtask-technology fit:a comparativecasestudy. AppliedSpatialAnalysisandPolicy 8:155–175.
PettitC,BakelmunA,LieskeSN,etal.(2018)Planningsupportsystemsforsmartcities. City,Cultureand Society 12:13–24.
PettitC,BiermannS,PelizaroC,etal.(2020)Adata-drivenapproachtoexploringfuturelanduseandtransport scenarios:theonlinewhatif?Tool. JournalofUrbanTechnology 27:21–44.
RitchieAL,SvejcarLN,AyreBM,etal.(2021)Athreatenedecologicalcommunity:researchadvancesand prioritiesforBanksiawoodlands. AustralianJournalofBotany 69(2):53–84.
RussoP,LanzilottiR,CostabileMF,etal.(2018)Towardssatisfyingpractitionersinusingplanningsupport systems. Computers,EnvironmentandUrbanSystems 67:9–20.
SchonerJ,ChapmanJ,BrookesA,etal.(2018)Bringinghealthintotransportationandlandusescenario planning:creatinganationalpublichealthassessmentmodel(N-PHAM). JournalofTransportand Health 10:401–418.
StevensonM,ThompsonJ,deS ´ aTH,etal.(2016)Landuse,transport,andpopulationhealth:estimatingthe healthbenefitsofcompactcities. Lancet 388(10062):2925–2935.
UlmerJM,ChapmanJE,KershawSE,etal.(2015)Applicationofanevidence-basedtooltoevaluatehealth impactsofchangestothebuiltenvironment. CanadianJournalofPublicHealth 106(1Suppl1): eS26–34.DOI: 10.17269/cjph.106.4338
UnitedNations(2017) TransformingOurWorld:The2030AgendaforSustainableDevelopmentA/RES/70/1 VonkG,GeertmanSandSchotP(2005)Bottlenecksblockingwidespreadusageofplanningsupportsystems. EnvironmentandPlanningA:EconomyandSpace 37:909–924. VonkG,GeertmanSandSchotP(2007)ASWOTanalysisofplanningsupportsystems. Environmentand PlanningA:EconomyandSpace 39:1699–1714.
WongF,StevensD,O’Connor-DuffanyK,etal.(2011)Communityhealthenvironmentscansurvey(CHESS): anoveltoolthatcapturestheimpactofthebuiltenvironmentonlifestylefactors. GlobalHealthAction 4: 5276.DOI: 10.3402/gha.v4i0.5276
WoodL,HooperP,FosterS,etal.(2017)Publicgreenspacesandpositivementalhealth – investigatingthe relationshipbetweenaccess,quantityandtypesofparksandmentalwell-being. Health&Place 48: 63–71.
