
Economic pulse of the Americas: Latin America and the Caribbean outperforms in imports of US goods
The United States’ commercial flows are going through a realignment. With attention on absolute trade deficits and commercial flows, it’s also insightful to look at the value of what countries import from and export to the United States relative to the size of their populations, as that shows the size of the market
Looking at this data, the results are clear: Countries in Latin America and the Caribbean (LAC), particularly Mexico, import more (in value) US products per capita than countries of similar income and development levels in other regions.

Analyzing US trade through the lens of this data can help foster a fuller understanding of US trade and identify partners for future US market expansion. So, which are the main importers of US products, per capita?
*In general terms, LAC is considered an upper-middle income region by the World Bank.
How does LAC compare with high-income countries in per capita trade with the United States?
The results show that, considered on a per capita basis, the value of US products imported to LAC countries is more comparable to those of countries with higher income levels:
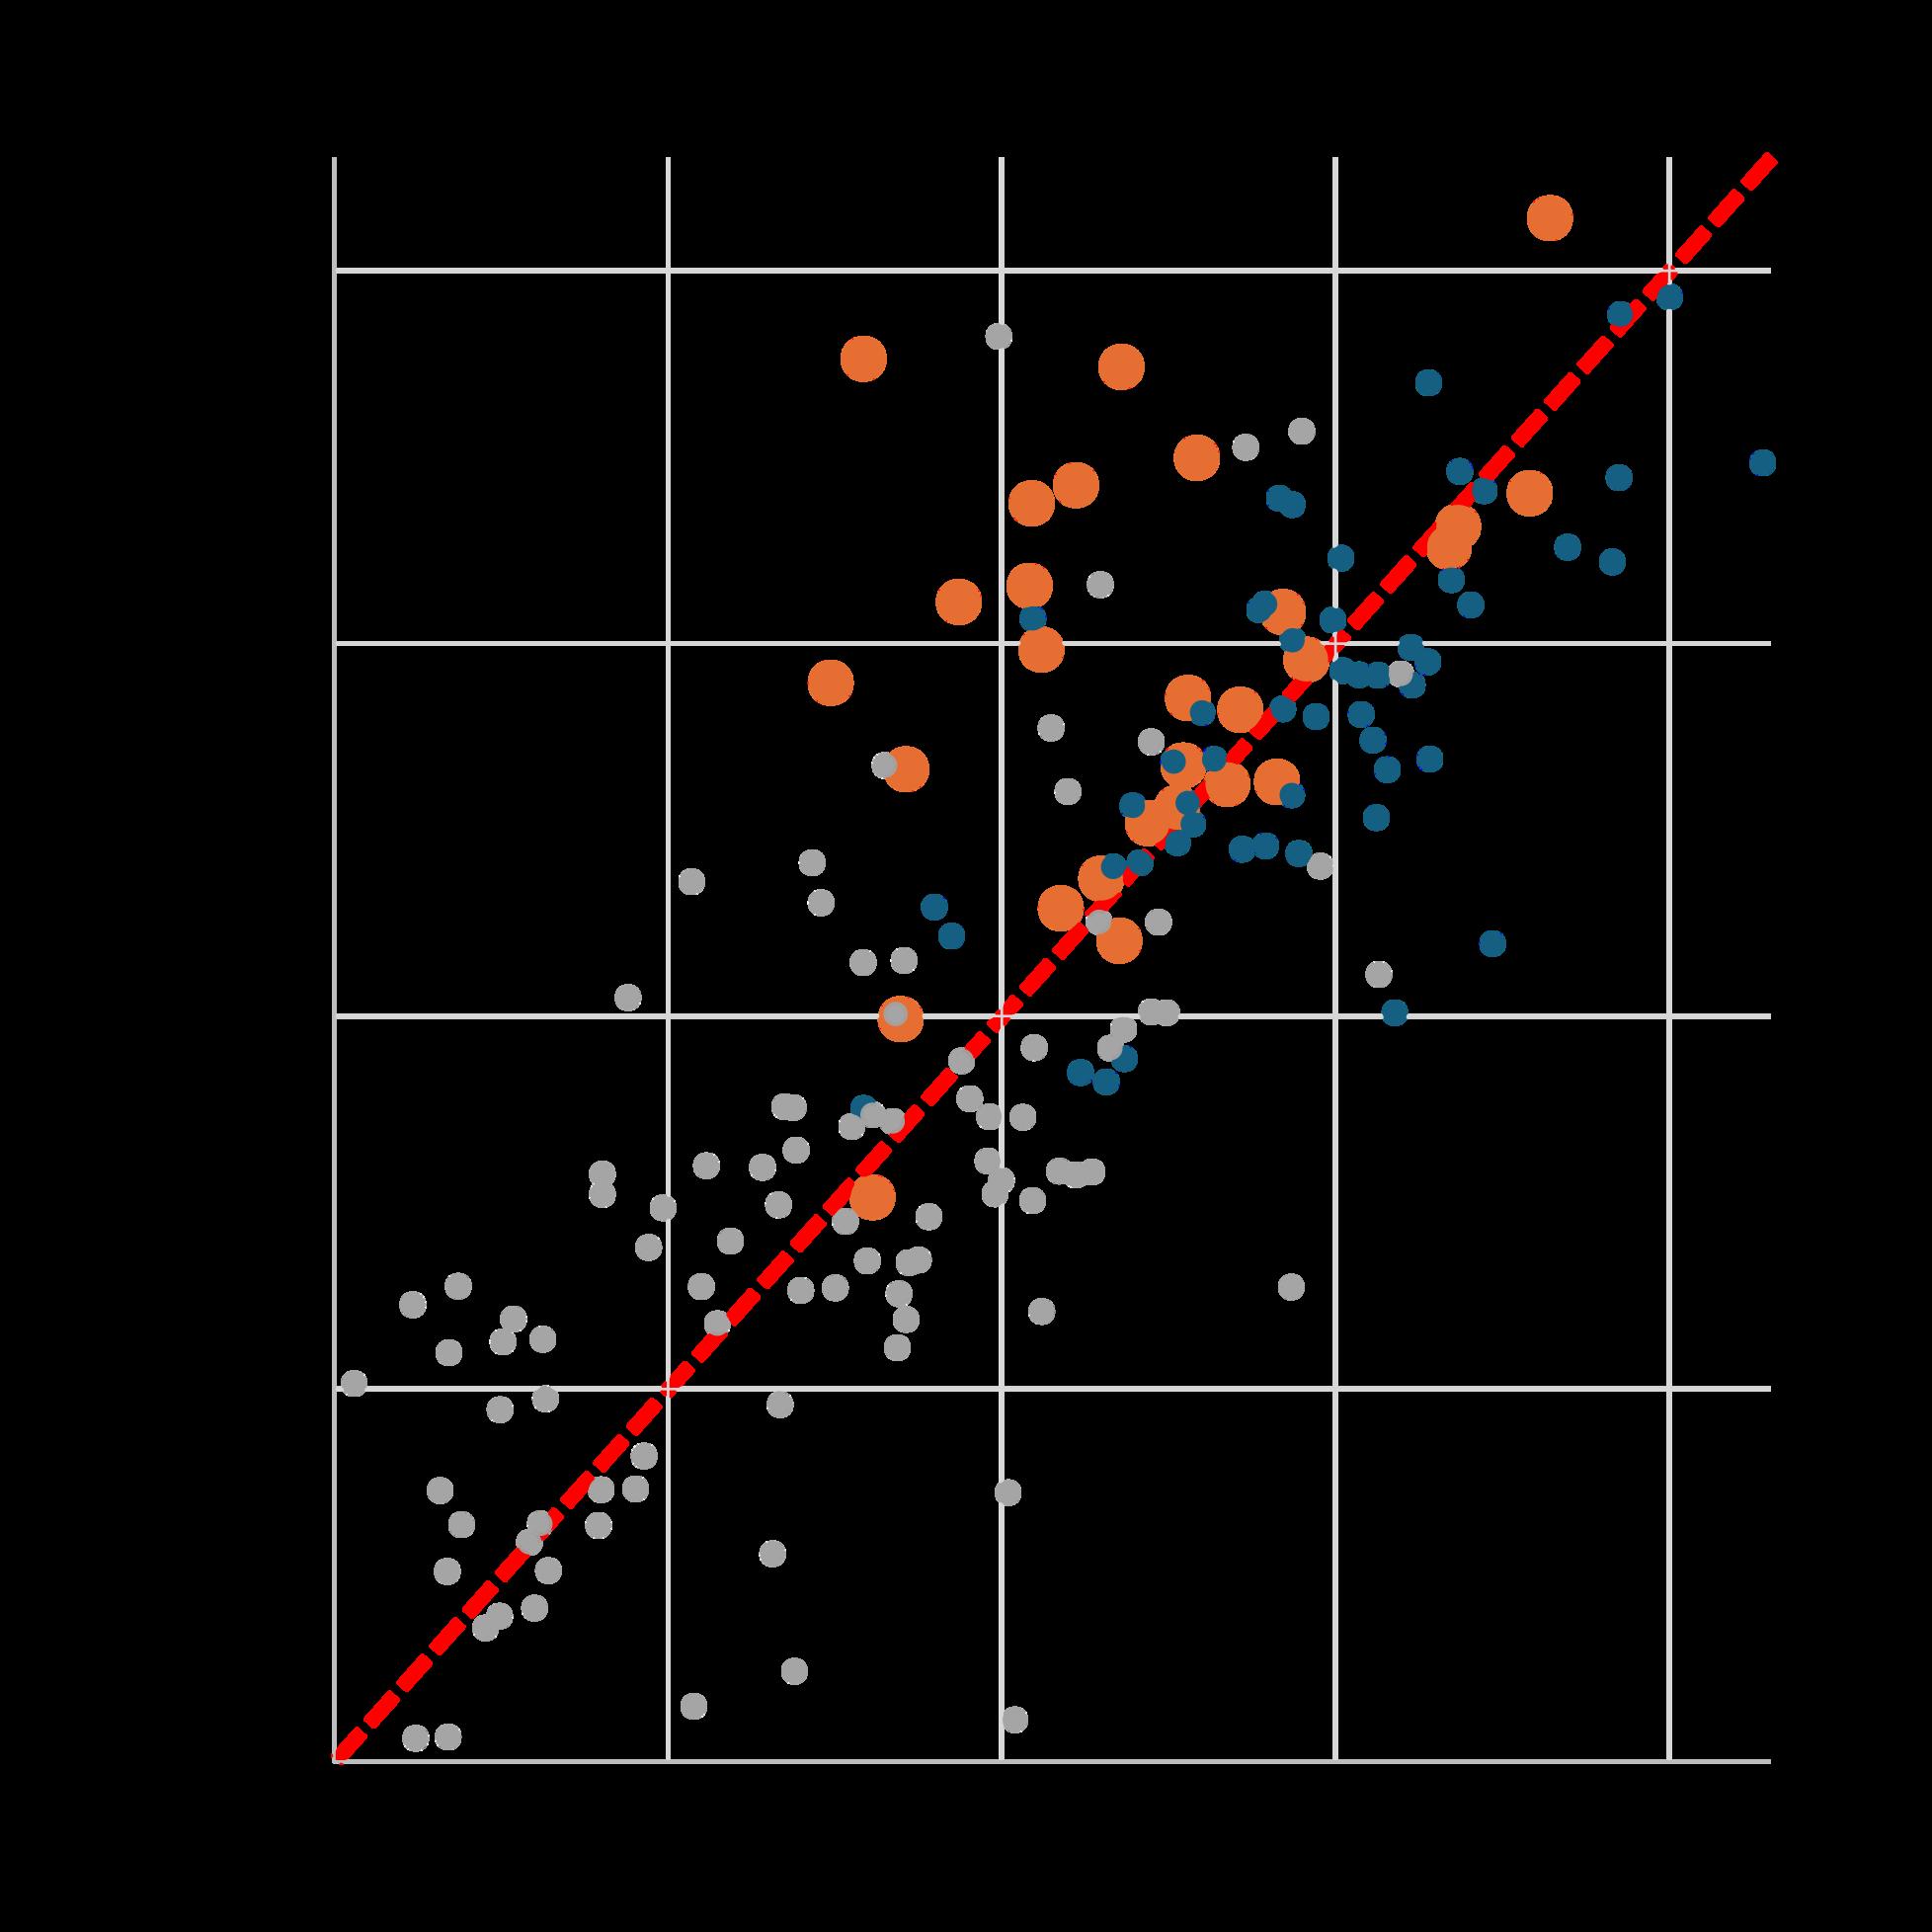
Imports of US products and exports to the US by population of partner country (2024, in US dollars)

The Bahamas
Barbados
Haiti Paraguay
Chile
Guatemala
Peru
Ecuador
Exports to US per capita
Source: Calculated with trade data from the US Census Bureau and population data from the IMF's World Economic Outlook (April 2025)
Note: Country income groups from the World Bank For ease of analysis, results are presented in base-10 logarithmic form
So, what does this all mean?
LAC countries stand out as destinations for a relatively high value of exports to the United States, when considered on a per capita basis, highlighting the region's strong trade ties and economic interdependence with the United States.
Results table: Value of imported US products per capita by country (2024, in US dollars)
Country
1,653
Other uppermiddle income
Summary chart: Mexico compared to select country groups, US exports value per capita (2024, in US dollars) European Union
High-income countries
Source: Calculated with trade data from the US Census Bureau and population data from the IMF's World Economic Outlook (April 2025)
These findings show that LAC is a central partner for US economic security where US goods are imported in high per capita values. They underscore the strategic value of US economic ties with countries in the Western Hemisphere.