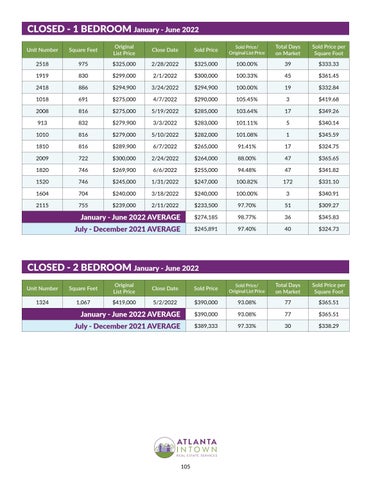
CLOSED - 1 BEDROOM January - June 2022 Unit Number
Square Feet
Original List Price
Close Date
Sold Price
Sold Price/ Original List Price
Total Days on Market
Sold Price per Square Foot
2518
975
$325,000
2/28/2022
$325,000
100.00%
39
$333.33
1919
830
$299,000
2/1/2022
$300,000
100.33%
45
$361.45
2418
886
$294,900
3/24/2022
$294,900
100.00%
19
$332.84
1018
691
$275,000
4/7/2022
$290,000
105.45%
3
$419.68
2008
816
$275,000
5/19/2022
$285,000
103.64%
17
$349.26
913
832
$279,900
3/3/2022
$283,000
101.11%
5
$340.14
1010
816
$279,000
5/10/2022
$282,000
101.08%
1
$345.59
1810
816
$289,900
6/7/2022
$265,000
91.41%
17
$324.75
2009
722
$300,000
2/24/2022
$264,000
88.00%
47
$365.65
1820
746
$269,900
6/6/2022
$255,000
94.48%
47
$341.82
1520
746
$245,000
1/31/2022
$247,000
100.82%
172
$331.10
1604
704
$240,000
3/18/2022
$240,000
100.00%
3
$340.91
2115
755
$239,000
2/11/2022
$233,500
97.70%
51
$309.27
January - June 2022 AVERAGE
$274,185
98.77%
36
$345.83
July - December 2021 AVERAGE
$245,891
97.40%
40
$324.73
CLOSED - 2 BEDROOM January - June 2022 Unit Number
Square Feet
Original List Price
Close Date
Sold Price
Sold Price/ Original List Price
Total Days on Market
Sold Price per Square Foot
1324
1,067
$419,000
5/2/2022
$390,000
93.08%
77
$365.51
January - June 2022 AVERAGE
$390,000
93.08%
77
$365.51
July - December 2021 AVERAGE
$389,333
97.33%
30
$338.29
105