Tap Water Affordability in Arizona
2025
2025
Lead Author: Grant Heminger, Policy and Research Analyst
Co-Authors: Kathryn Sorensen, Director of Research; Sarah Porter, Director; Manny Teodoro, Professor, La Folette School of Public Affairs, University of Wisconsin
Contributors: Jennifer Davidson, Senior Research Analyst; Behshad Mohajer, Research Analyst
This project was funded by the Water Infrastructure & Finance Authority of Arizona and by the Arizona Water Innovation Initiative, a multi-year partnership with the state led by Arizona State University’s Julie Ann Wrigley Global Futures Laboratory in collaboration with the Ira A. Fulton Schools of Engineering.
• Community water systems in Arizona charge an average of $41 per month for 4,000 gallons of tap water.1 Small water systems charge an average of $43 per month for 4,000 gallons of tap water while large systems charge $36.
• Median-income households in Arizona spend on average 0.92% of monthly income for 4,000 gallons of tap water. Households at the lowest quintile of income spend on average 2.2% of monthly income for 4,000 gallons of tap water.
• Average monthly water costs amount to 3.36 hours of labor at local minimum wages.
• Between 57% and 76% of community water systems in Arizona could increase the monthly cost of 4,000 gallons of tap water while still keeping rates below common thresholds of affordability for low-income households.
• Each community water system’s leaders must weigh the increase in charges to pay for water system improvements against affordability for low-income households. Water charges can be designed to maintain affordability while still realizing revenue adequate to fund water system improvements.
Access to safe, reliable water is the foundation of public health, economic opportunity and quality of life in any community. There is abundant research and vital, ongoing action to address challenges associated with the physical accessibility of safe, reliable tap water,2 but understanding the financial accessibility of water—the affordability of tap water—is also important.
In this report, the Kyl Center for Water Policy presents a comprehensive set of tap water affordability data for community water systems (CWS) in Arizona. Communities can use this study to better assess how their current and future charges for water impact low- and median-income households. Water access can be improved when water charges are designed with affordability in mind so that fewer families face the risk of disconnection due to non-payment. On the other hand, most water providers rely on fees to pay for replacing aging infrastructure and water system improvements to ensure reliability.
1 Including all relevant taxes and fees, as of date of collection, generally late 2024
2 See Karletta Chief et al., “Addressing Food-Energy-Water Insecurities of the Navajo Nation through University Community Collaboration”, Water Resources IMPACT, January 2021, https://wrrc.arizona.edu/sites/wrrc.arizona.edu/files/2022-10/Chief_et_al_WWPs_AWRA_IMPACT.pdf., Katie Meehan et al., “Geographies of insecure water access and the housing-water nexus in U.S. cities”, Proceedings of the National Academy of Sciences of the United States of America, November 2020, https://kclpure.kcl.ac.uk/portal/en/publications/geographies-of-insecure-water-access-and-the-housing-water-nexus-
By identifying the risk of water insecurity in a community. Water insecurity occurs when households do not have sufficient access to affordable and safe tap water and can result in service disconnection due to inability to pay water bills. Measuring tap water affordability allows decisionmakers to identify households and communities that are experiencing water insecurity or are at risk of falling into it. Awareness of the risk of water insecurity in a community can inform critical policies and programs to increase affordability and access to tap water.
By providing measurements of affordability that can help utilities that are seeking grants and aid. Many grant and loan programs prioritize projects that benefit low-income communities and address water access concerns. Utilities that can clearly demonstrate the tap water affordability challenges their customers face may have a better chance of securing this funding.
By informing the process of designing water rates. Rate setters design tap water rates with multiple goals in mind, including revenue sufficiency, transparency, conservation and affordability. Measures of affordability help decision makers design tap water rates to achieve the balance between these goals that best suits their communities. Measures of affordability can also help utility managers design effective customer assistance programs.
By gauging the ability to raise rates while maintaining affordability. Measures of affordability can help rate setters assess the affordability impacts of increased tap water charges to support needed investment in the rehabilitation and replacement of aging water infrastructure and other system improvements.
The goal of this study is to measure tap water affordability in community water systems in Arizona by calculating the percentage of monthly household income that is required to pay for monthly tap water costs at a base monthly volume.
A public water system provides water for human consumption through pipes or other constructed conveyances to at least 15 service connections or serves an average of at least 25 people for at least 60 days a year.3 A community water system is any public water system that serves the same 25 people on a year-round basis.4 The Arizona Department of Environmental Quality maintains a database of all 1,671 water systems in the state,5 747 of which are community water systems, and the US EPA maintains a database of Tribal community water systems in Arizona.6
Tap water affordability has no standard, universal definition, but commonly involves the cost to the user of accessing piped tap water relative to measures of the user’s financial capacity to cover that cost. Thresholds of this ratio are often deployed to determine whether water service is affordable; however, these thresholds are always subjective in that what one community determines to be affordable water service may be considered unaffordable in another.
3 US EPA, “Information about Public Water Systems”, October 30, 2024, https://www.epa.gov/dwreginfo/information-about-public-water-systems#:~:text=A%20 public%20water%20system%20may,or%20on%20an%20occasional%20basis
4 Ibid.
5 Arizona Department of Environmental Quality, “Safe Drinking Water Database”, https://azsdwis.azdeq.gov/DWW_EXT/JSP/WaterSystems.jsp.
6 US EPA, “SDWIS Search for Indian Tribes”, July 2, 2024, https://www.epa.gov/enviro/sdwis-search-indian-tribes
The Residential Indicator is a common measurement of affordability in the US, which defines water as “affordable” when total costs for water and sewer are less than 4.5% of median household income 7 The Residential Indicator measures affordability at the median household income; it does not address water affordability for the lowest income earners in a community, who are often at the highest risk of water system disconnection due to non-payment.8
This study relies upon the Household Burden as the primary metric of affordability. The Household Burden is determined by calculating the percentage of monthly income spent on tap water costs by households earning the lowest 20th percentile income.9 An alternative metric, measuring the cost of tap water in terms of the number of hours at the respective minimum wage, is provided to contextualize the Household Burden results.
The study measures monthly household water costs at 4,000 gallons of consumption, an amount generally adequate for indoor cooking and cleaning, and not usually adequate for outdoor irrigation. In doing so the study does not attempt to measure or identify current water usage levels, nor advise any specific amount of monthly usage for households in Arizona. The decision to use 4,000 gallons was informed by the range of existing estimates for indoor household water use, which generally fall between 3,000 and 6,000 gallons per month:
• Flume indoor water use data suggests between 3645 and 4347 gallons for a 3-person household in Phoenix.10
• The Arizona Department of Water Resources’ Generic Demand Calculator estimates 4,050 gallons for a 3-person household.11,12
• The US EPA cites over 6300 gallons a month for the average American family.13
The lowest estimates of monthly use were not used to avoid measuring affordability only for those with small household sizes or particularly low water use, and the highest estimates were not used so as not to create an unrealistic or overstated representation of average water costs.14
The monthly cost of water was measured assuming a standard 5∕8-inch meter connection (or smallest meter size for which a charge was listed) and included any fixed charge, usage charges and applicable taxes and fees. Tap water charges were gathered from publicly posted tariff schedules, the Arizona Corporation Commission and through direct outreach to individual systems.
7 Margaret Schneemann, “Defining & Measuring Water Affordability A Literature Review”, Illinois-Indiana Sea Grant, August, 2019, https://iiseagrant.org/wp-content/uploads/2019/08/DMWA_FINAL.pdf. The Residential Indicator was developed to help evaluate utilities’ financial capability for regulatory compliance and was not necessarily intended to guide assessments of customer-level affordability.
8 Manuel Teodoro, “Measuring Household Affordability for Water and Sewer Utilities,” American Water Works Association, February 6, 2018, https://awwa.onlinelibrary.wiley.com/doi/full/10.5942/jawwa.2018.110.0002
9 R Raucher et al., “Developing a New Framework for Household Affordability and Financial Capability Assessment in the Water Sector,” American Water Works Association, April 17, 2019, https://www.acwa-us.org/wp-content/uploads/2019/05/Developing-New-Framework-for-Affordability-Report-Final.pdf
10 Joe Fazio and Peter Mayer, “Flume Data Labs Household Water Use Index Q3 2024”, Flume Data Labs, 2024, https://flumewater.com/water-index
11 Arizona Department of Water Resources AMA Staff, “Generic Demand Calculator”, July 19, 2024, https://www.azwater.gov/aaws/aaws-forms-applications
12 3-person household used based on the Maricopa average household size of 2.6 people per U.S. Census Bureau, American Community Survey (ACS) and Puerto Rico Community Survey (PRCS), 5-Year Estimates, 2023, https://www.census.gov/quickfacts/fact/table/maricopacountyarizona#
13 U.S. Environmental Protection Agency, “How We Use Water”, September 12, 2024, https://www.epa.gov/watersense/how-we-use-water. Original data from Water Research Foundation, “Residential End Uses of Water, Version 2”, 2016, https://www.waterrf.org/research/projects/residential-end-uses-water-version-2
14 The aim of this study is to measure affordability for basic, indoor tap water use such as for drinking, cooking, cleaning, and sanitation. There is no standard definition of the amount of consumption this entails because indoor water needs vary based on household size, number and age of plumbing fixtures and appliances and many other considerations. In this study, 4,000 gallons of monthly water consumption is used as a proxy.
Where tap water rates vary by month or season, an annual average was calculated.15 Municipally owned community water systems often charge a higher tap water rate to customers that receive service from the system but live outside of municipal corporation boundaries. Results presented here are for customers who pay “inside-city” rates.
Many community water systems offer customer assistance programs through which qualifying customers pay different rates than others, are offered payment programs that differ from others or even receive bill forgiveness. Such programs may dramatically change the cost for tap water that economically disadvantaged customers pay, but collection of the data associated with these programs is beyond the scope of this study. The results presented here should be viewed in this context.
Water charges were found for 659 Community Water Systems that collectively report serving 6,992,390 customers, or about 98% of the population of Arizona.16 There are hundreds of community water systems in Arizona, each of which follows a unique schedule for updates to their water charges. Information on water charges for some systems may have changed between the date of collection and the date of publication of this study.
The costs of water hauling, informal well-sharing agreements and other non-conventional or distributed water systems, although important, are beyond the scope of this research and are not included. The cost families incur in purchasing bottled drinking water was also not included.
Measures the affordability of water at the household level in community water systems in Arizona
• Community water system = any water system that serves the same 25 people on a yearround basis.
• There are over 900 community water systems in Arizona. (747 non-Tribal, 172 Tribal)
Measures monthly water costs at 4,000 gallons of consumption
• 4,000 gallons = an amount generally adequate for indoor cooking and cleaning, and not usually adequate for outdoor irrigation.
• Falls within the middle of the existing range of household indoor water use data.
• Study does not attempt to measure or identify current water usage levels, nor advise any specific amount of monthly usage for households.
• Water cost data were collected for 72% of CWS in Arizona (659 systems) which collectively serve about 98% of the population.
• Sources for water costs: publicly posted tariff schedules, Arizona Corporation Commission and direct outreach to individual systems.
Calculates affordability of monthly water costs using the Household Burden
• Household Burden = the percentage of monthly income for a household in the 20th percentile of earners in their area that is required to pay for water monthly water costs at 4,000 gallons.
15 For low-income families large, short-term bills (such as those that are highest in the summer) can be a challenge, thus an annual average may overstate affordability for these families.
16 Using self-reported “population served” data from the ADEQ database and the US Census Bureau’s 2020 decennial Census population of 7,151,502 people.
• Provides a more accurate representation of affordability for low-income households than the more common Residential Indicator that measures water costs at the median household income level.
In Arizona, there are over 1,600 public water systems which together serve more than 7 million people17 and range in size and purpose from the City of Phoenix’s municipal water utility which serves approximately 1,700,000 people to systems that serve individual neighborhoods, businesses, parks, schools, farms, campgrounds, fire stations, hospitals and a myriad of other essential uses across the state. About half of these are community water systems.
Community water systems (systems that serve the same 25 or more people on a year-round basis) make up only half of the total number of systems in Arizona but serve roughly 97% of the state’s people. The size, structure, design, ownership, management, goals and resources of community water systems vary widely from system to system even within the same region or municipality. In Arizona there are four typical ownership characteristics: municipal, private, district and Tribal.
Community water systems range in size from those that serve major cities to individual homeowners associations, mobile home parks and cooperatives serving fewer than 30 people. Just over 75% of community water systems are categorized as “small” because they serve fewer than 1,850 people.18 Small water systems are the rule in rural Arizona. Less than 4% of systems in Gila and La Paz Counties and less than 10% of systems in Apache, Coconino, Greenlee and Yavapai Counties are considered large.
17 Statistics about the number of customers each community water system serves are self-reported.
18 Arizona Department of Water Resources, “Community Water Systems,” https://www.azwater.gov/cws/community-water-systems
Ownership characteristics and associated end-uses of community water systems in Arizona are presented below:
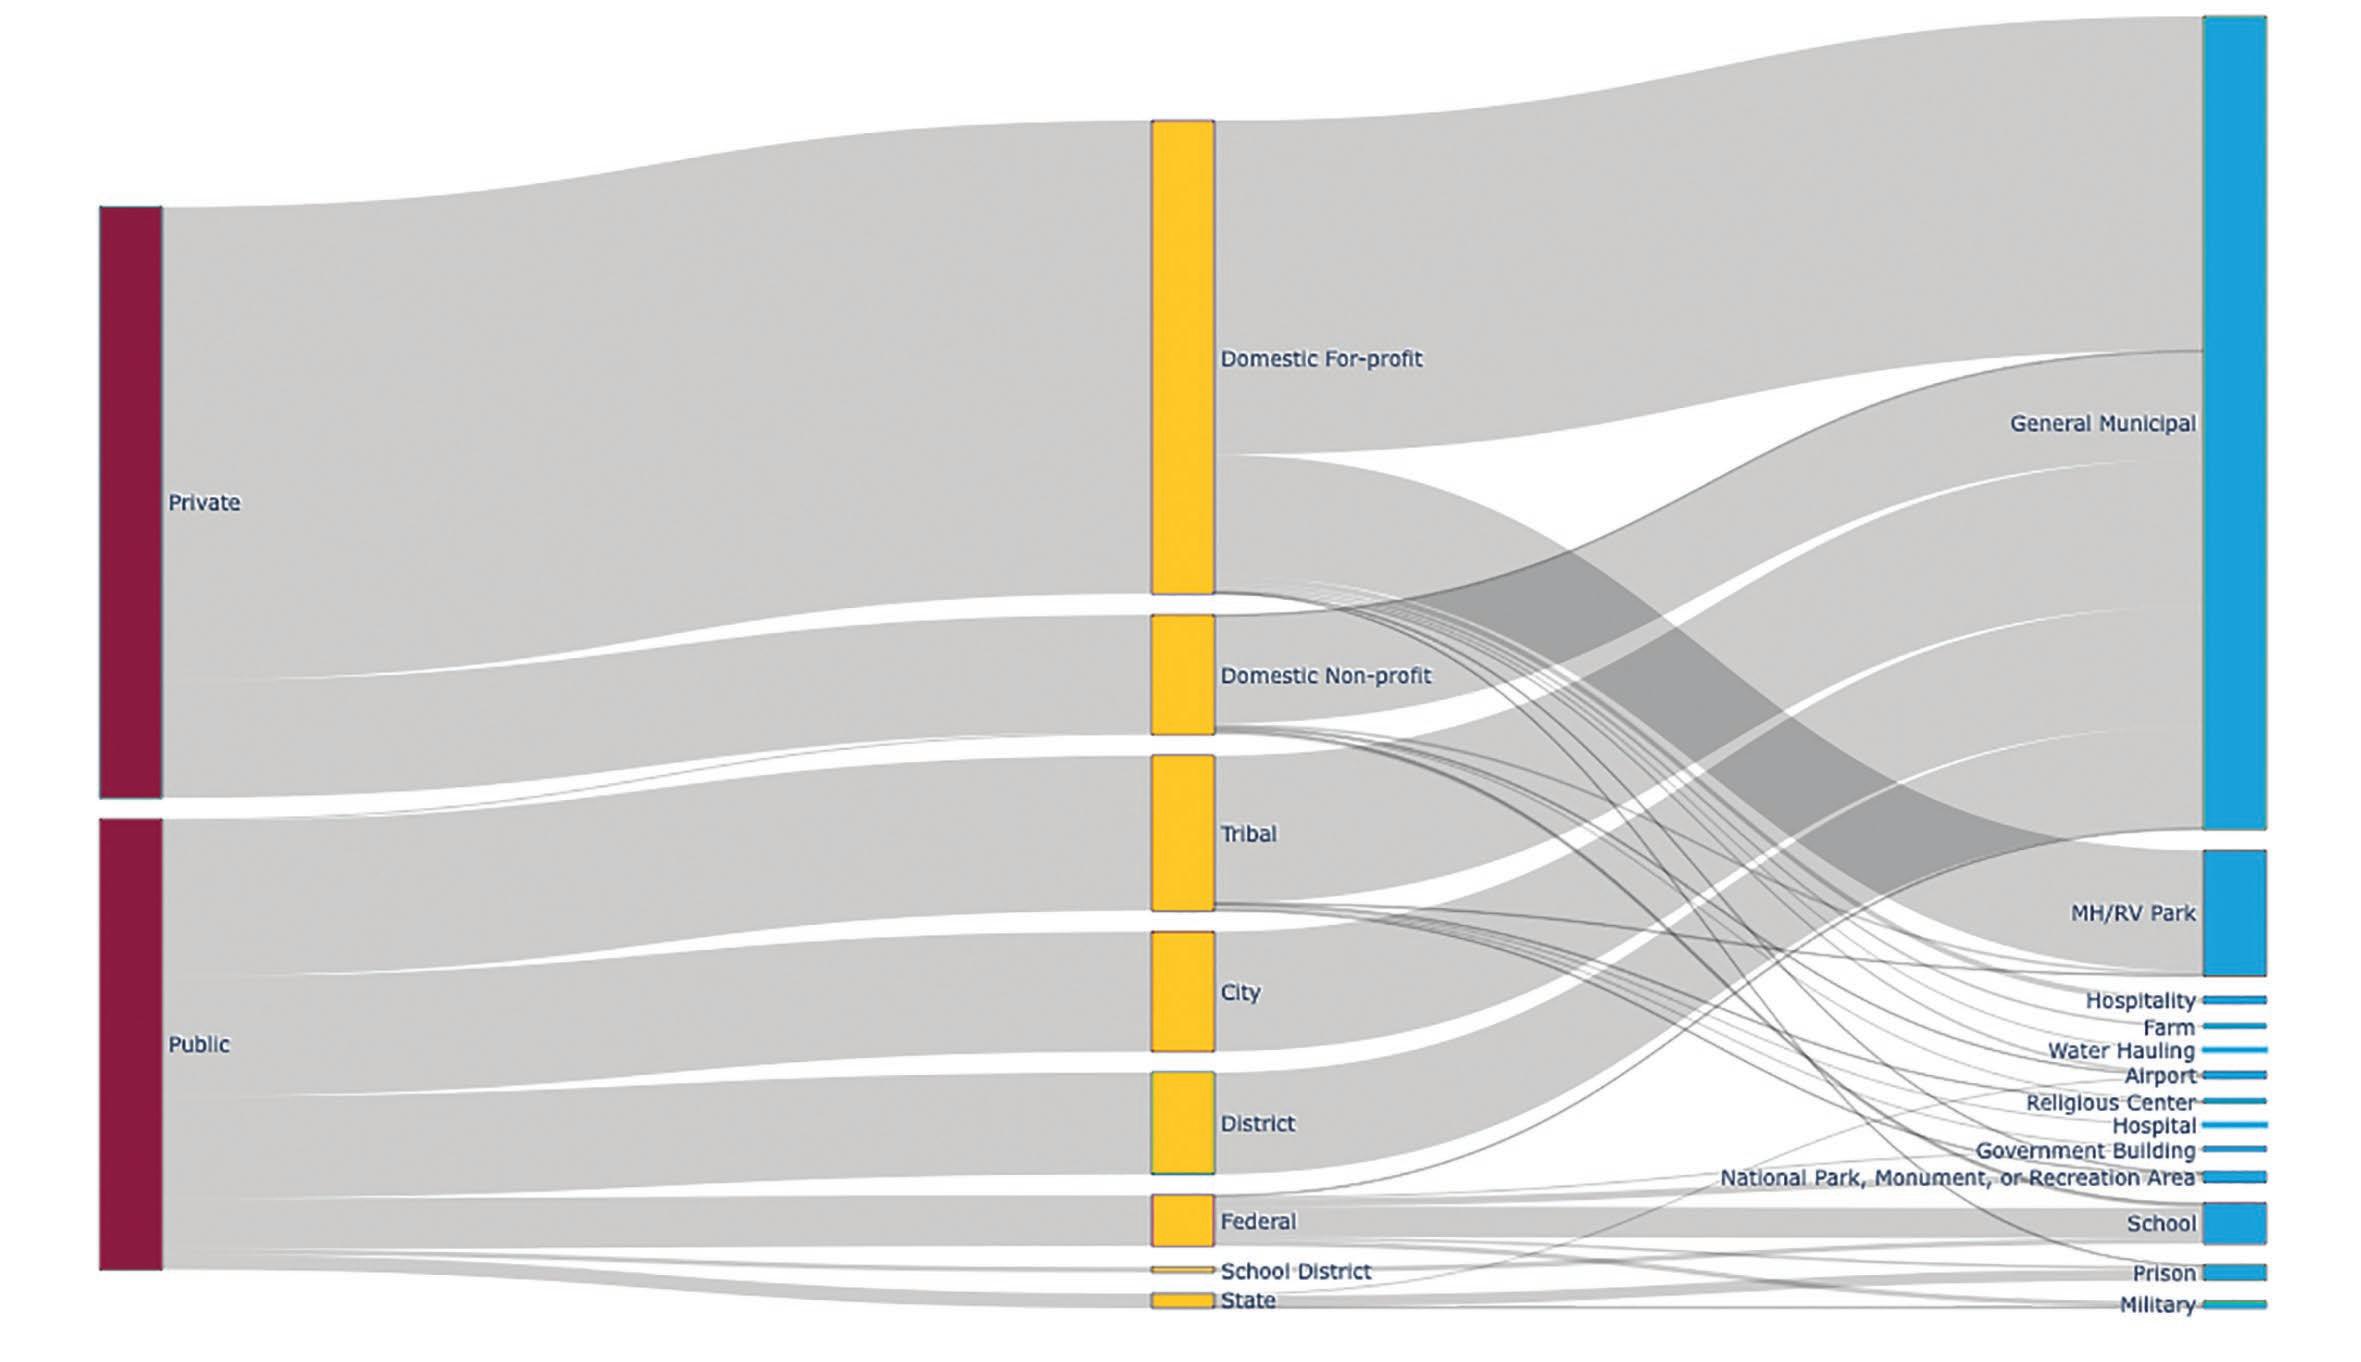
In Arizona, people living in small, rural towns are typically served by small, private water systems and those living in urban areas are typically served by large, municipally-owned water systems. The nine largest water systems in Arizona are all municipally owned and together they serve approximately 4.2 million people. In comparison, all private community water systems in the state combined serve fewer than 1.5 million people.
The provision of safe, reliable, piped water involves high capital costs for wells, reservoirs, treatment plants, pipes, pumps and other infrastructure alongside large expenses for operations and maintenance, such as for chemicals, electricity, skilled labor and components. These costs must be covered over both the short and long term or else the community water system will fail to deliver safe water either through acute operational crisis or long-term deterioration.
Occasionally some community water systems secure federal, state or non-profit funding to cover these costs via grants and subsidized loans, but such funding is generally far from adequate to fully cover costs, particularly over the long term, and its availability is normally uncertain and unreliable from year-to-year. In Tribal areas, the US government has trust responsibilities that may entail the provision of free tap water service for certain end uses (such as hospitals and schools), and some Tribal nations choose to fund community water systems out of Tribal revenues rather than from customer charges. However, as a general rule, community water systems rely on customer charges to cover the large costs of infrastructure, maintenance and operations.
Water systems commonly employ a fixed monthly charge that is usually intended to recover the cost of meter reading, billing and other activities for which cost does not vary with water consumption19 and a variable charge per unit of water consumed (typically per thousand gallons to achieve payment proportional to the benefit of the water received). Some water systems charge different rates to different customer types, such as single-family, multi-family, commercial and industrial. However, because there is no standard rate structure, rates can vary widely depending on the goals each community intends to achieve through its tap water charges, as well as the business model of the entity providing water service.20 These goals often conflict and most commonly involve balancing the competing needs of revenue adequacy and predictability, conservation, affordability, economic development, transparency and simplicity.

19 The American Water Works Association, “M1 Principals of Water Rates, Fees and Charges”, AMWWA, January 1, 2017, https://store.awwa.org/M1-Principles-of-Water-Rates-Fees-and-Charges-Seventh-Edition
20 Ibid.
Of the community water systems in the state for which rate information was available, nearly all charge a fixed monthly fee. Approximately 85% use a tiered rate structure in which the cost of water per unit increases with consumption. Around 5% employ a rate structure in which the cost per unit remains flat as consumption rises, and 6.5% charge a flat monthly fee regardless of the volume of water delivered. Flat structures are more common among small and informal systems as well as some Tribal systems. Around 12% of the water systems for which rate information could be found employ a fixed monthly fee that includes an allowance of water. A very small number of systems (0.6%) employ a rate structure in which the cost per unit decreases as more water is consumed.
Small systems face unique difficulties covering the costs associated with operations, maintenance and upgrading the aging infrastructure required for a functional system that is compliant with Safe Drinking Water Act regulations, because the pool of ratepayers shouldering these costs is much smaller relative to the fixed costs of running a water system than in larger systems. Generally, the more customers served by a community water system, the lower charges need to be per customer to achieve revenue adequacy.21
Whether publicly or privately owned, community water systems operate as monopolies; they are the sole providers of piped water service in a physical boundary and therefore oversight is necessary to prevent monopolistic (unreasonably high) water charges.
In municipally owned community water systems, which serve the vast majority of Arizonans, elected officials deliberate water charges through a public process and ultimately determine water charges by voting on whether to adopt a proposed water-charge ordinance. State statutes include requirements for public notices and hearings related to the adoption of these ordinances to help ensure adequate public involvement.22 Other than for these public notices and hearings, which at a minimum take 60 days to complete,23 there are few rules that constrain municipal governments in the rate-setting process and city councils are generally free to adopt or change water charges in any amounts and in any manner they deem necessary.
21 Teodoro, Manuel P., and Robin Rose Saywitz. 2020. “Water and Sewer Affordability in the United States: A 2019 Update.” AWWA Water Science 2(2): e1176. doi: https://doi.org/10.1002/aws2.1176
22 ARIZ. REV. STAT. ANN. § 9-499.15 (2024).
23 Ibid.
The same is largely true for publicly owned domestic water improvement districts, which are common in residential developments in rural areas. In publicly owned systems, monopolistic pricing can be mitigated or avoided through the public process and voter recourse. For this reason, it can be difficult for elected officials to advocate for an increase in water rates, and they instead often defer cost recovery to future generations.
The story is very different for privately owned utilities because voters cannot recall a private board. Instead, the state of Arizona regulates these monopolies through the Arizona Corporation Commission, which has created impactful and detailed rules for the development and alteration of water charges. Commission approval for new rates requires the submission of several substantive documents24 and the process can take well over a year. These rules prevent monopolistic pricing and ensure public input but can also be daunting for small, privatelyowned community water systems which may lack the resources to navigate them. The ACC has developed the Small Water Ombudsman Program to reduce this burden by assisting small systems in “interpreting and navigating the Corporation Commission rate case, financing, and compliance processes, and to provide evaluations of the long-term infrastructure and acquisition planning needs”.25 Additionally, in December 2024 the ACC announced its plan to allow utilities to adopt Formula Rate Plans that allow utilities to adjust their rates autonomously on an annual basis according to a “pre-established formula, which accounts for specific cost inputs”.26 This change is expected to reduce the regulatory burden for utilities while promoting gradualism in increases to water rates to facilitate utility operations and infrastructure updates.27
The results of this study show that the average “age” of tap water charges, measured as the date of the last posted rate schedule, is more than four times older in private water systems than in public water systems. On average, in small systems the age of tap water charges is more than double that in large systems; 7.4 and 3.1 years, respectively. Outdated tap water charges can exacerbate the financial difficulties and related infrastructure deficiencies small systems often face particularly in the context of new regulations and high inflation. While the impacts of outdated rates may not be immediately apparent in a short-term view, the erosion of buying power over 6 years (the state average rate age) is immense.
24 Arizona Corporation Commission, “Utilities Frequently Asked Questions”, https://www.azcc.gov/faqs/utilities-faqs/home
25 Arizona Corporation Commission, “ACC Small Water Ombudsman Program Overview”, 2019, https://www.azcc.gov/docs/default-source/utilities-files/ombudsman/ombudsman-program-overview-5-18-17.pdf?sfvrsn=f2e352d7_2
26 Nicole Garcia, ACC Adopts Formula Rate Plan Policy Statement, Arizona Corporation Commission, December 5, 2024, https://www.azcc.gov/news/home/2024/12/06/acc-adopts-formula-rate-plan-policy-statement
27 Ibid.
Cheap water is not cheap if the ultimate result is system failure. Analysis of nationally representative data shows that SDWA compliance correlates positively with water price, controlling for size, ownership, region, and water source:28
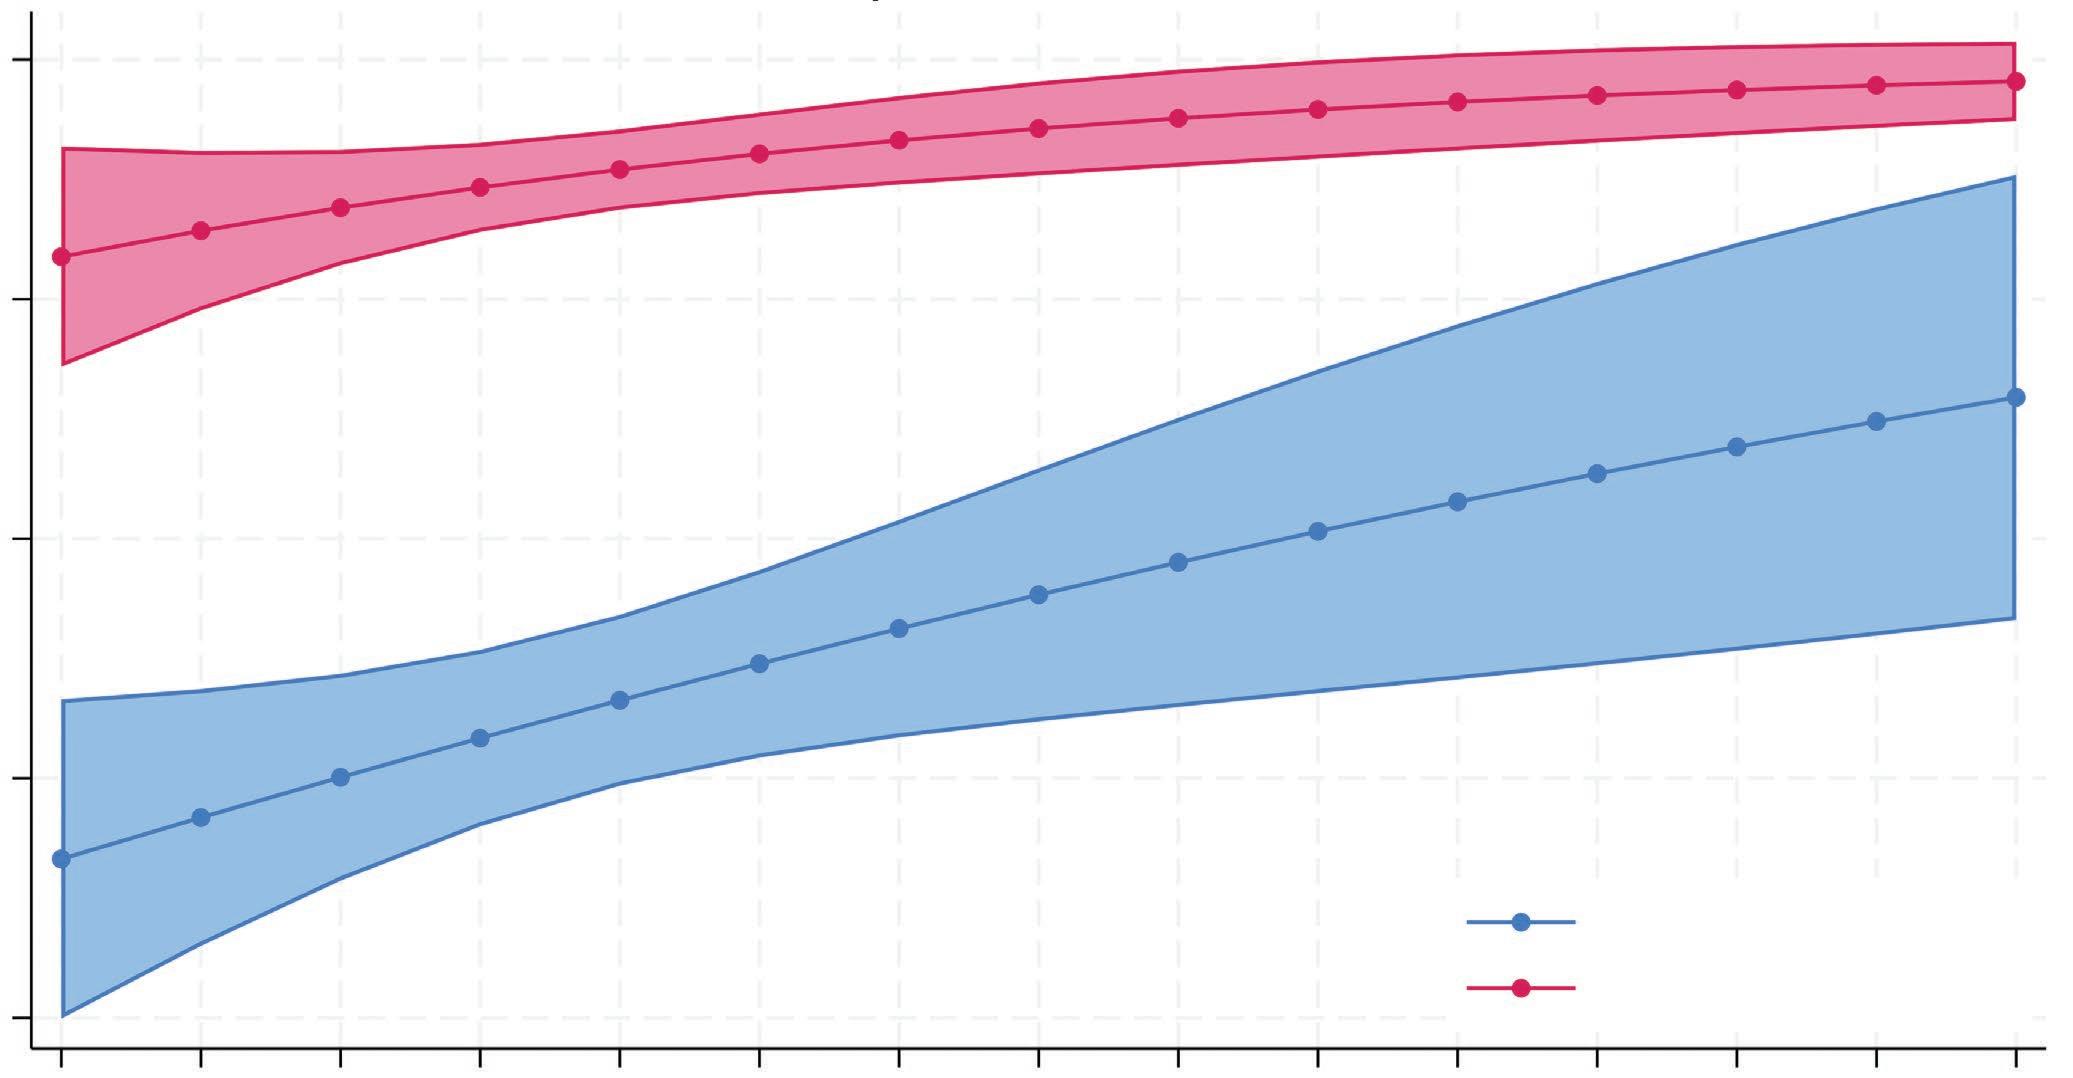
Note: Estimates produced by a logistic regression predicting full SDWA compliance in 2019 and 2020. Shaded areas represent confidence intervals. N=413.
In substantive terms, these results indicate that a utility charging $15 per month for 4,000 gallons in 2019 had a 93.9% probability of complying with SDWA’s health regulations and a 68.4% probability of complying with SDWA management regulations. For a utility that charged $75 per month, those probabilities rise to 98.9% and 85.9%, respectively. Put simply, higher average prices correlate with stronger regulatory compliance for community water systems.
Though there is no standard water rate structure, rates most commonly consist of a fixed and variable usage charge. Monthly fixed charges are just that—fixed. Ratepayers cannot avoid or reduce these charges by minimizing water use. Therefore, smaller monthly fixed costs enhance affordability; the charge that cannot be avoided is smaller and creates less of a burden on lower-income households that pay proportionately more of their income on fixed fees relative to higher-income households.
28 Original analysis by Manuel P. Teodoro using data from Teodoro & Saywitz (2020).
Variable charges depend on the amount of water used. Variable charges may be set such that the customer pays an increasing rate per unit of water or structured in a flat rate such that the customer is charged the same price per unit consumed whether they consume one or one hundred units. In Arizona, most utilities employ increasing variable charges (“tiered rates”) because they contain a price signal encouraging water conservation.29 A tiered consumption-based water charge structure helps to ensure that water users bear a share of the cost of the water system proportionate to their use but can make high water use—such as for outdoor landscape irrigation—costly.
Delivering safe, reliable water through a community water system entails many costs (for tanks, pipelines, machinery, chemicals, labor and power, among other things) and utilities have a different mix of water supplies and infrastructure which both influence the cost of providing tap water. Rate-setters must consider the revenue adequacy and stability associated with water charges, particularly as infrastructure approaches the end of its useful life30 and new regulatory standards increase costs.31
29 Vivek Vivek et al., “Combining price and non-price interventions for water conservation”, IOP Science Environmental Research Letters, September 13, 2024, https://iopscience.iop.org/article/10.1088/1748-9326/ad747b
30 American Society of Civil Engineers, “A Comprehensive Assessment of America’s Infrastructure”, 2021, https://infrastructurereportcard.org/wp-content/uploads/2020/12/National_IRC_2021-report.pdf
31 Association of Metropolitan Water Agencies et al., “Coalition Report Correcting PFAS Myths”, American Water Works Association, August 29, 2023, https://www.nacwa.org/docs/default-source/resources---public/water-coalition-fact-sheet-202307-v1-2.pdf?sfvrsn=8694c161_2
While low fixed charges are more affordable for customers, the smaller the fixed charge the more a utility’s revenues become dependent on variable charges and are therefore increasingly volatile. Reliance on variable charges combined with low fixed-charges exposes the community water system to revenue risk in the event customers use less water for any reason (e.g. heavy rainfall, economic downturn, drought, conservation). The same is true the more these variable revenues are tied to consumption volumes: The water system risks becoming dependent on high water use for a portion of overall revenues disproportionate to the actual cost.
Water systems can prioritize both affordability and revenue stability by including an allowance of a certain amount of water consumption in the fixed monthly fee. This ensures a predictable revenue stream through monthly fixed charges but enables low-income households to limit overall costs by potentially avoiding variable charges all together.
When determining water charges rate-setters must balance the need to ensure revenue sufficient to invest in the rehabilitation and replacement of aging infrastructure, maintain reliable operations, meet Safe Drinking Water Act standards, maintain an emergency fund and achieve water conservation goals against the community’s ability to pay at all income levels. This is no easy task.
Joe Olsen, General Manager of Metro Water District in Tucson described the financial challenges he confronted in the first years of his job.
Noting that other utilities faced difficulty receiving the full amount of projected revenues because only a small portion of their fixed costs were recovered by fixed charges, Olsen and his colleagues realized that continuing to focus needed rate increases on the highest usage tiers would only result in “charging more for water we are not going to sell”.
As a result, he developed a plan to recover 90% of fixed costs through fixed revenues. He accomplished this by increasing rates by 8% for two years and shifting a portion of first-tier consumption into the fixed charge.
The plan was met initially with concern that the increase in fixed charges for the sake of revenue stability would disproportionately affect low-income households. He argued, however, that by ensuring projected revenues were received in full the utility could avoid the common practice of chasing greater future rate increases to make up for planned revenues that were never collected.
This proved to be true, as annual rate increases in the 6 years following the effort were kept at or below inflation (CPI), around 2-2.5% annually, well below the 6-7% average annual increase for other utilities in the region.32
While this kind of rate increase adversely affects affordability in the short term, the resulting revenue stability may help low-income customers in the long term.
32
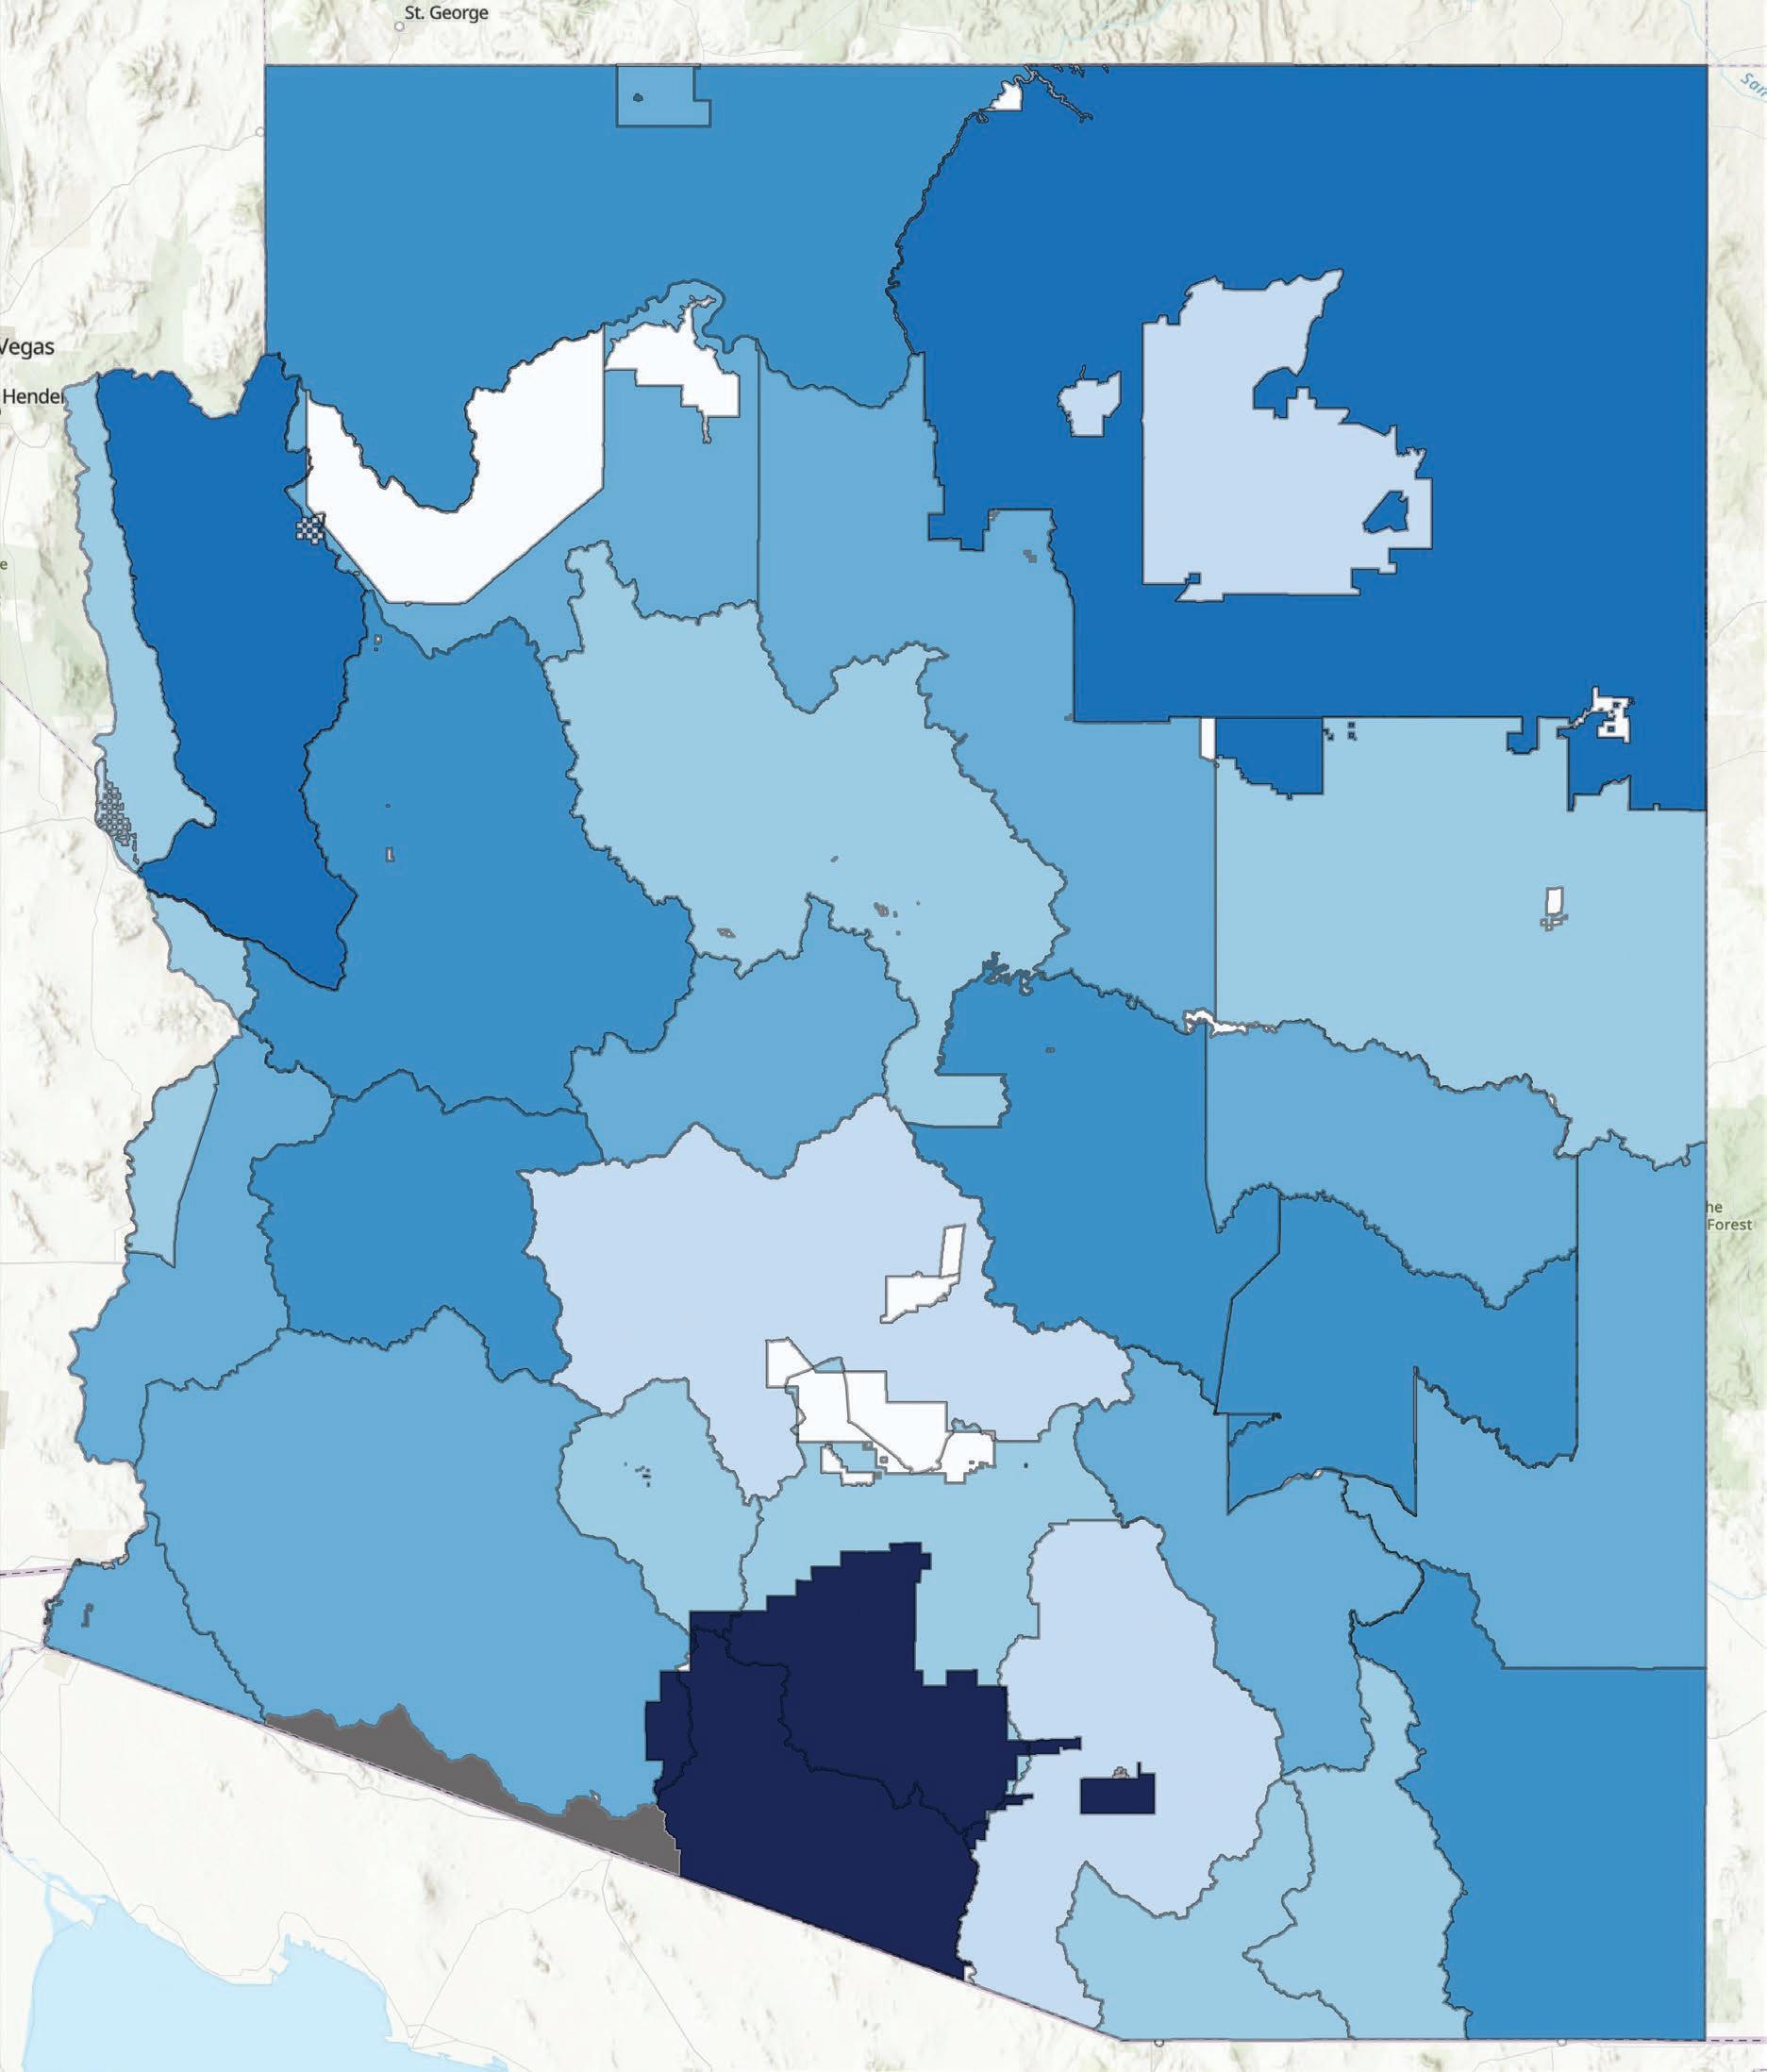
The average monthly cost for 4,000 gallons of tap water in Arizona is $41.33 Monthly costs in Arizona range from a high of over $180 in a small water company in Gila County to zero in some Tribal nations that do not charge for water at the household level. Monthly charges for 4,000 gallons in most systems fall somewhere between $4 and $78.
CityofPhoenix CityofYumaCityofFlagstaNationalCityofTucson Average
Nearly 70% of systems charge between roughly $19 and $63 for 4,000 gallons of monthly water service. For context, the average American phone bill is $141 per month.34
The size of a water system is a highly influential factor in water charges and measures of affordability.35 Small water systems charge on average roughly 20% more than large systems, likely because small systems have a comparatively smaller base of ratepayers over which to spread costs. As a case in point, the largest community water system in Arizona, the City of Phoenix’s Water Services Department which serves approximately 1.7 million people, charges among the lowest rates for 4,000 gallons of monthly tap water consumption. The community water system that charges the highest serves 66 people in Gila County.
33 As of the date of publication using water rate data last updated for this publication, generally in late 2024.
34 J.D. Power, “Wireless Purchases Through Apps Increase, Leading to Increase of Value and Affordability Perceptions, J.D. Power Finds”, February 15, 2024, https://www.jdpower.com/business/press-releases/2024-us-wireless-retail-experience-study-volume-1?srsltid=AfmBOorkQLtcMCBlGC2_ dbeCsfnUJ7wO9b_SzBIG3ktAgBDmQgBpfNX7
35 Manuel P. Teodoro, “Tariff Trends: Affordability in America, 2023 | Part 1,” January 31, 2024, https://mannyteodoro.com/?p=4473
Water affordability as measured by the Household Burden is calculated in this study as the percentage of household income at the lowest quintile required to meet the monthly costs of 4,000 gallons of tap water.
In Arizona, the average Household Burden for 4,000 gallons of tap water monthly is 2.22%, meaning that on average just over two percent of monthly household Income at the lowest quintile is necessary to pay monthly tap water costs. For comparison at the median household income level, Arizona households spend on average less than one percent (0.92%) of monthly income on 4,000 gallons tap water.
The statewide average cost of 4,000 gallons of tap water amounts to 3.36 hours of labor at minimum wage.37
36 Texas Electricity Ratings, “What States Are Expecting the Highest Household Electricity Bills in 2024?,” 2023, https://www. texaselectricityratings.com/resources/highest-household-electricitybills-2024. See also Fisher, Sheehan & Colton Public Finance and General Economics, “Home Energy Affordability Gap,” April 2023, http://homeenergyaffordabilitygap.com/03a_affordabilityData.html (Calculating household burden for households earning between 50-125% of the federal poverty level income, the range mostly closely matching this study’s 20th percentile income earner.)
37 Tribes have authority to set their own minimum wage rates, generally following the federal minimum wage of $7.25, while all other systems are subject to the state minimum wage of $14.35/hr at time of publication per Kyra O’Connor, “Minimum Wage Increases in Arizona for 2024,” 12news.com, January 1, 2024, https://www.12news.com/article/money/ minimum-wage-increases-arizona-2024/75-681d73ee-d9f6-4202-9c1bb2d81e8c3e52
While there are broad differences between electricity and water both as resources and utilities, it can be enlightening to compare their costs to consumers. In 2024, Arizona residents’ average monthly electricity bill was $134.38 in non-summer months and $234.53 in the summer.36 (Note: As discussed above, 4,000 gallons is not an average tap water consumption rate.)
Those electricity costs represent between 6% and 10% of monthly income for earners at the lowest quintile depending on the time of year. Average water costs for 4,000 gallons of tap water for comparison represent just over 2% of monthly income for households at the 20th percentile. Adjusting rates to meet a Household Burden of 6% nearly all systems (97%) could increase tap water costs for 4,000 gallons of monthly consumption by an average of about $100 and remain within this threshold.
The most comparable national study of tap water charges and affordability does not include systems serving fewer than 3,300 people.38 Because tap water charges are on average higher in small systems, the omission of systems serving fewer than 3,300 people in the national study resulted in a lower average Household Burden than found in this study, which includes systems serving fewer than 3,300 people. Adjusting Arizona results to exclude systems serving fewer than 3,300 people results in a statewide average Household Burden of 1.43%, almost exactly on par with the national average.
Approximately three quarters of Arizonans, 5.3 million people, are served by a community water system with a lower Household Burden (more affordable) than the national average. The one quarter of Arizonans served by a community water system with a Household Burden score above the national average (less affordable) tend to be served by small systems.
38 Manuel Teodoro and Ryan Thiele, “Water and Sewer Price and Affordability Trends in the United States, 2017-2023”, American Water Works Association, September 2024, https://doi.org/10.1002/awwa.2315
There are noticeable differences in nearly every measured rate and affordability statistic between large and small systems in Arizona, which include both Tribal and non-Tribal systems. In Arizona, the average large system serves about 31,000 residents and cumulatively large systems serve a total of around 6.9 million people. The average small system serves just over 300 residents and all small systems together serve a total of around 440,000 people.
In Arizona, large community water systems average rate for 4,000 gallons of tap water is $36 and the average Household Burden is 1.5%—very close to the national average of 1.44%. Approximately 5.25 million Arizonans served by large systems are served by community water systems that score as more affordable than national average. 1.52 million Arizonans are served by large community water systems that score as less affordable.
For small community water systems in Arizona, the average rate for 4,000 gallons of tap water is $43 and the average Household Burden is 2.52%. Approximately 68,000 Arizonans served by small systems are served by community water systems that score as more affordable than national average. 157,000 Arizonans are served by systems that score as less affordable.
On average, monthly costs for 4,000 gallons of tap water from a small system amount to one additional hour of pay at the non-Tribal minimum wage compared to monthly costs from a large system.
164 community water systems serve approximately 280,000 people39 on Tribal lands. Water charge data was collected for 14 of the 22 federally recognized Tribes in Arizona. Affordability metrics were calculated for 95% of all Tribal community water systems, representing roughly 98% of people served by Tribal water systems in Arizona.40 Tribes hold authority to set rates for their community water systems. The Gila River Indian Community, Ak-Chin Indian Community, Fort McDowell Yavapai Nation, Tonto Apache Tribe and Havasupai Tribe do not charge for household water service. The 19 water systems not charging for water service serve about 25% of all people served by Tribal community water systems in the state, about 69,000 people.
The average tap water charge for the Arizona Tribal systems that charge for water is $36, 24 lower than the non-Tribal state average of $44 and quite close to the national average for community water systems of $35.41
Because the lowest quintile household incomes tend to be lower on Tribal lands than on non-Tribal lands, the average Household Burden for Tribal water systems is 2.85%, higher than non-Tribal systems at 1.98%.
On average, 4,000 gallons of tap water from a Tribal community water system amounts to 4.31 hours at the applicable minimum wage compared to the 3.06 hours in a non-Tribal community water system. The disparity is largely due to differences in minimum wage rates between Tribal and non-Tribal communities as noted in footnote 34.
39 US EPA, “SDWIS Search for Indian Tribes”, July 2, 2024, https://www.epa.gov/enviro/sdwis-search-indian-tribes
40 Ibid – self reported population served data.
41 Manuel Teodoro and Ryan Thiele, “Water and Sewer Price and Affordability Trends in the United States, 2017-2023”, American Water Works Association, September 2024, https://doi.org/10.1002/awwa.2315. Data not published in study but calculated separately using same source data and communicated directly to author.
Affordability is important, but so is revenue sufficient to pay for operations and the rehabilitation and replacement of aging water infrastructure. Almost all community water systems will need to increase water charges to cover rising costs for operations and maintenance costs as well as the replacement of aging infrastructure.
Using two percent of household income as a threshold for affordability,42 at a base volume of 4,000 gallons a month,43 as of the date of this publication about 57% of systems could raise water charges and remain affordable for people earning the lowest 20th percentile income in their communities. As many as 369 systems could increase base volume charges by about $25 per month while keeping costs below two percent of monthly income at the 20th percentile.
Using three percent of household income as a threshold, around 76% of systems could increase base volume charges and remain “affordable” for people earning the lowest 20th percentile income. As many as 498 systems could increase rates on average by about $43 while keeping costs below three percent of monthly income at the 20th percentile.
When determining tap water charges decision-makers must balance the need for revenue sufficient to maintain an adequately functioning community water system against affordability for all users. Most community water systems in Arizona have room to raise water rates and remain within affordability limits.
However, tap water costs in some water systems exceed affordability limits as measured by Household Burden. For these systems, increasing tap water charges will only exacerbate affordability challenges. In these cases, rate setters might consider implementing an assistance program or increasing awareness and usage of existing programs, making changes to water charges to include water allowances in fixed costs and increasing variable charges at higher consumption levels so that less revenue needs to be earned at low-usage levels. Systems facing these challenges should explore available federal, Tribal, state and non-profit financing opportunities to potentially lessen the cost on individual ratepayers.44
42 As stated, all thresholds of tap water affordability are subjective. Thresholds of two and three percent presented here are for illustrative purposes only.
43 Data was not collected/calculations were not made at any usage level other than 4,000 and impacts on affordability will vary at different usage levels.
44 See The American Water Works Association’s “M1 Principals of Water Rates, Fees and Charges” for resources and best practices to responsibly set or increase water charges with low-income earners in mind.
For an interactive tool, visit https://asu.maps.arcgis.com/apps/dashboards/33fe4ec5113f4fe9b229257b4160ccd2
MESA - SALT RIVER PIMA-MARICOPA INDIAN COMMUNITY
Affordability – Cost at 4k Gallons
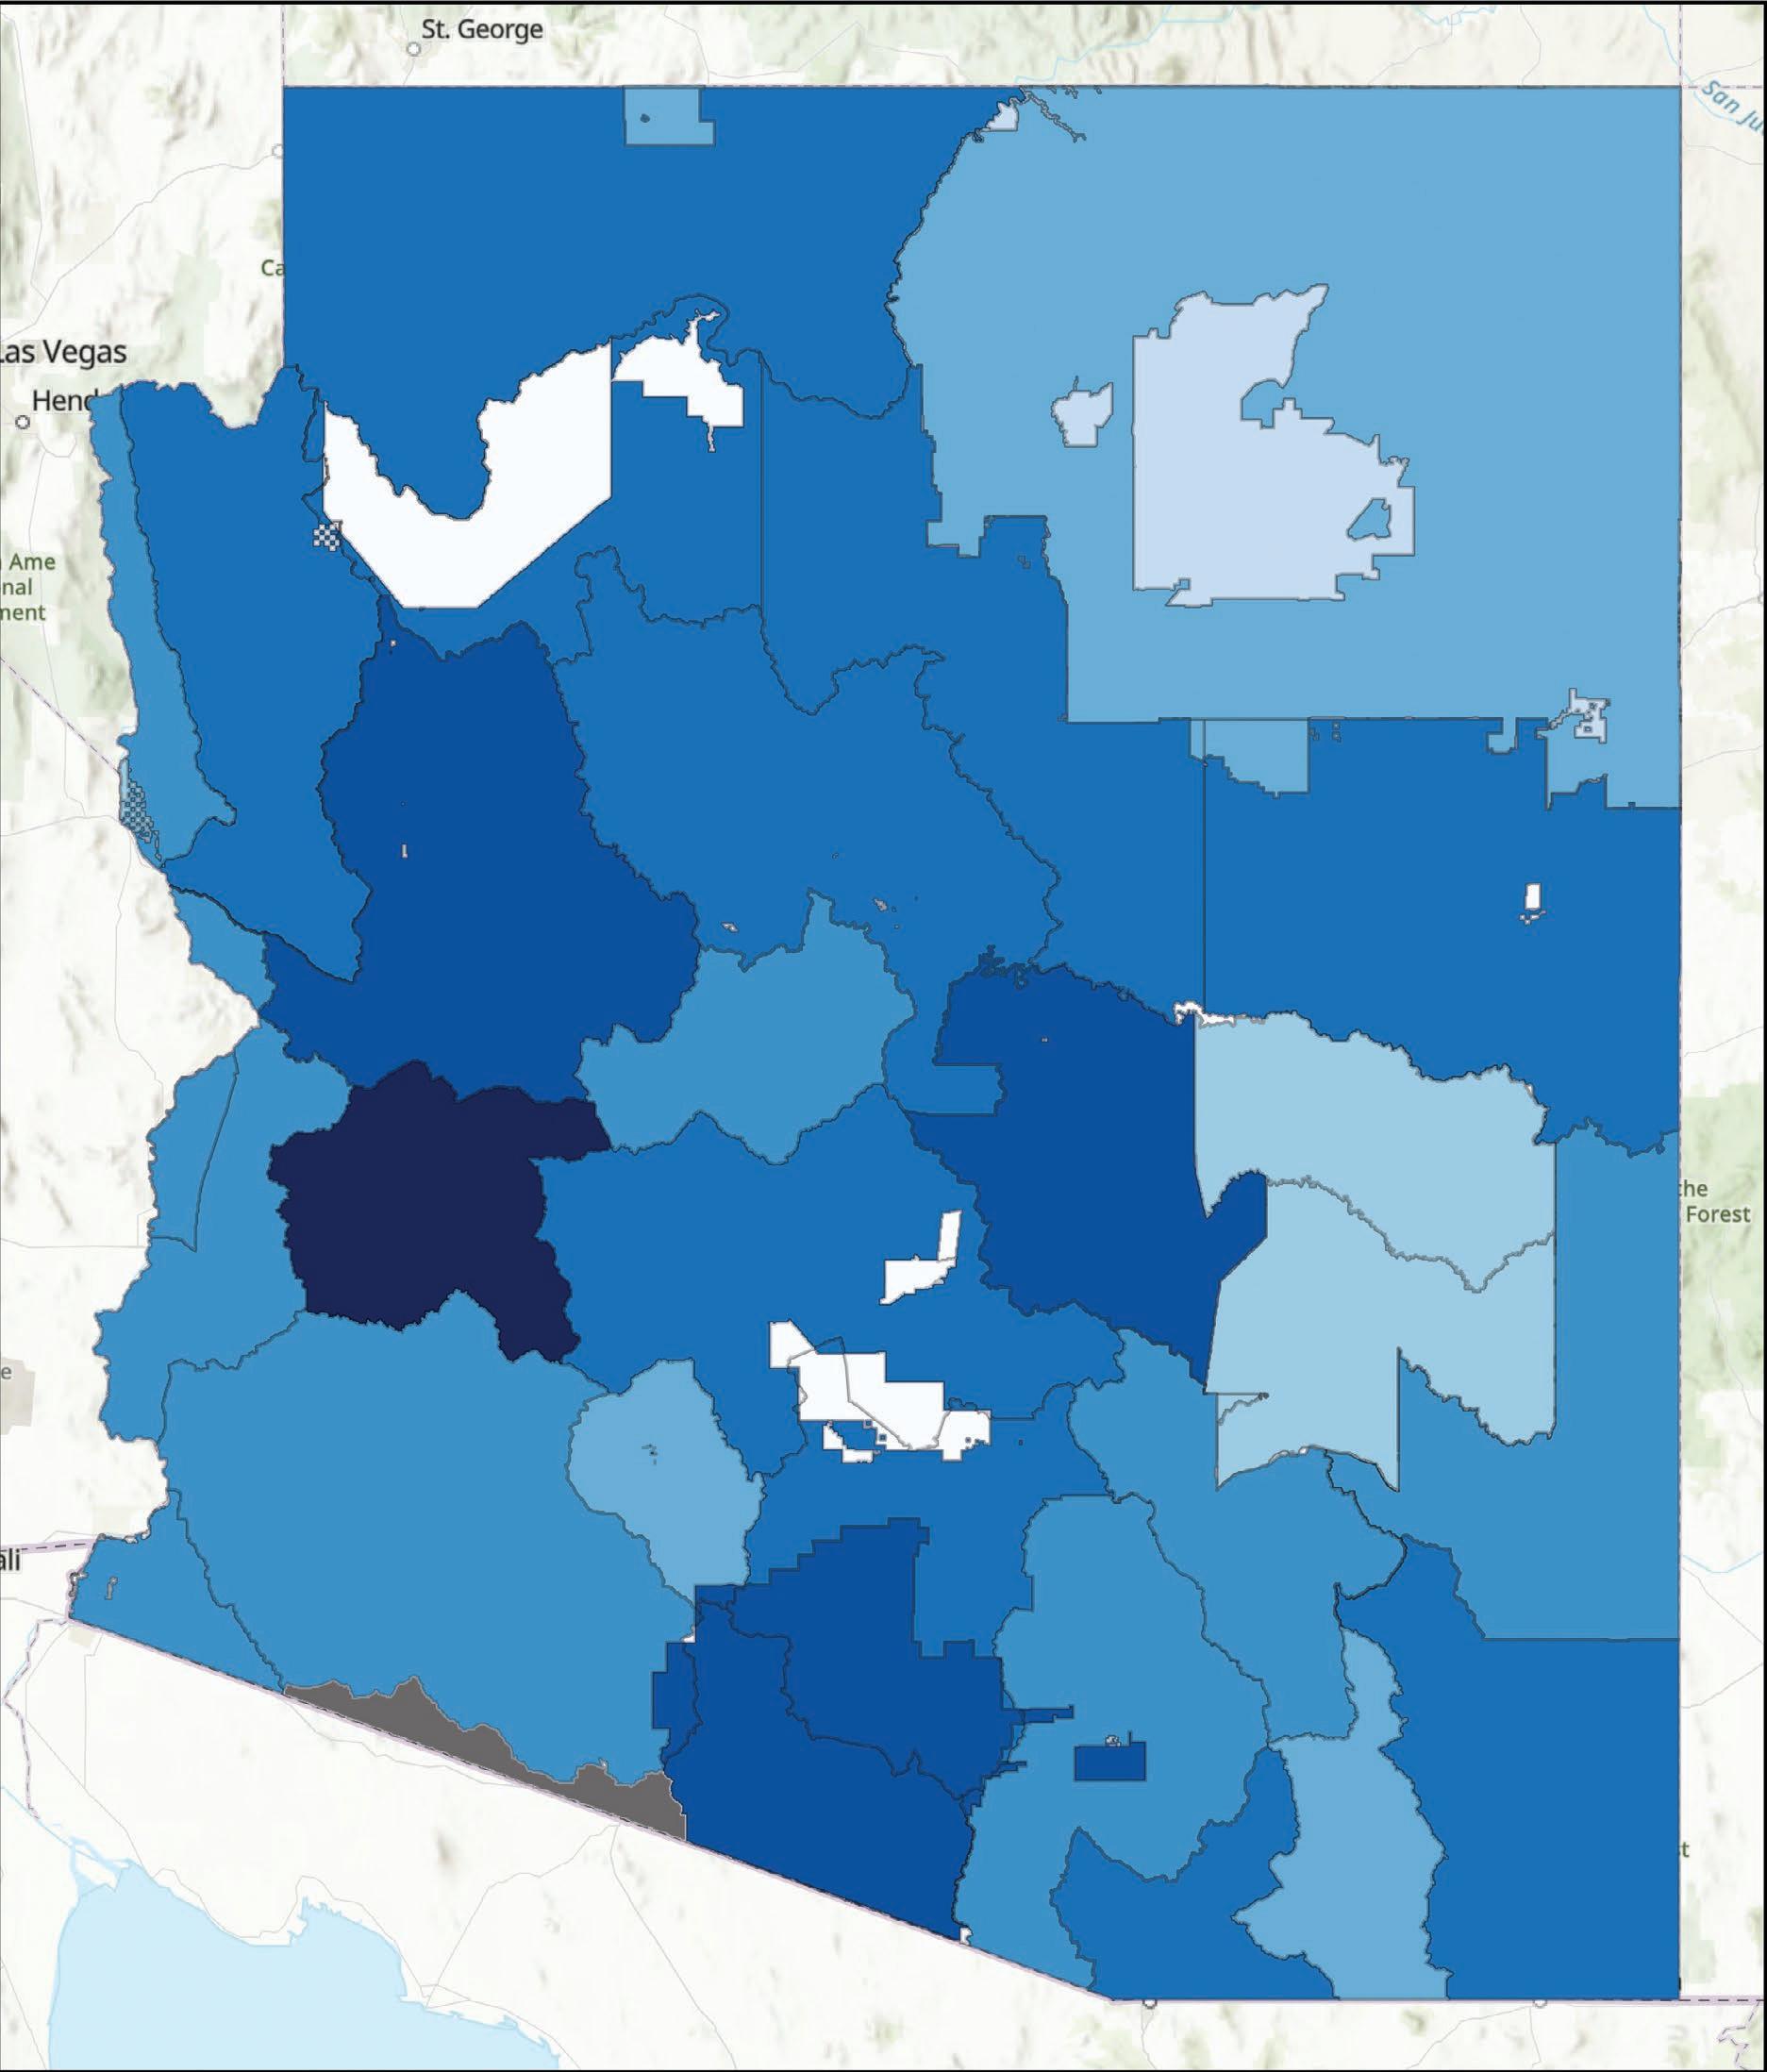
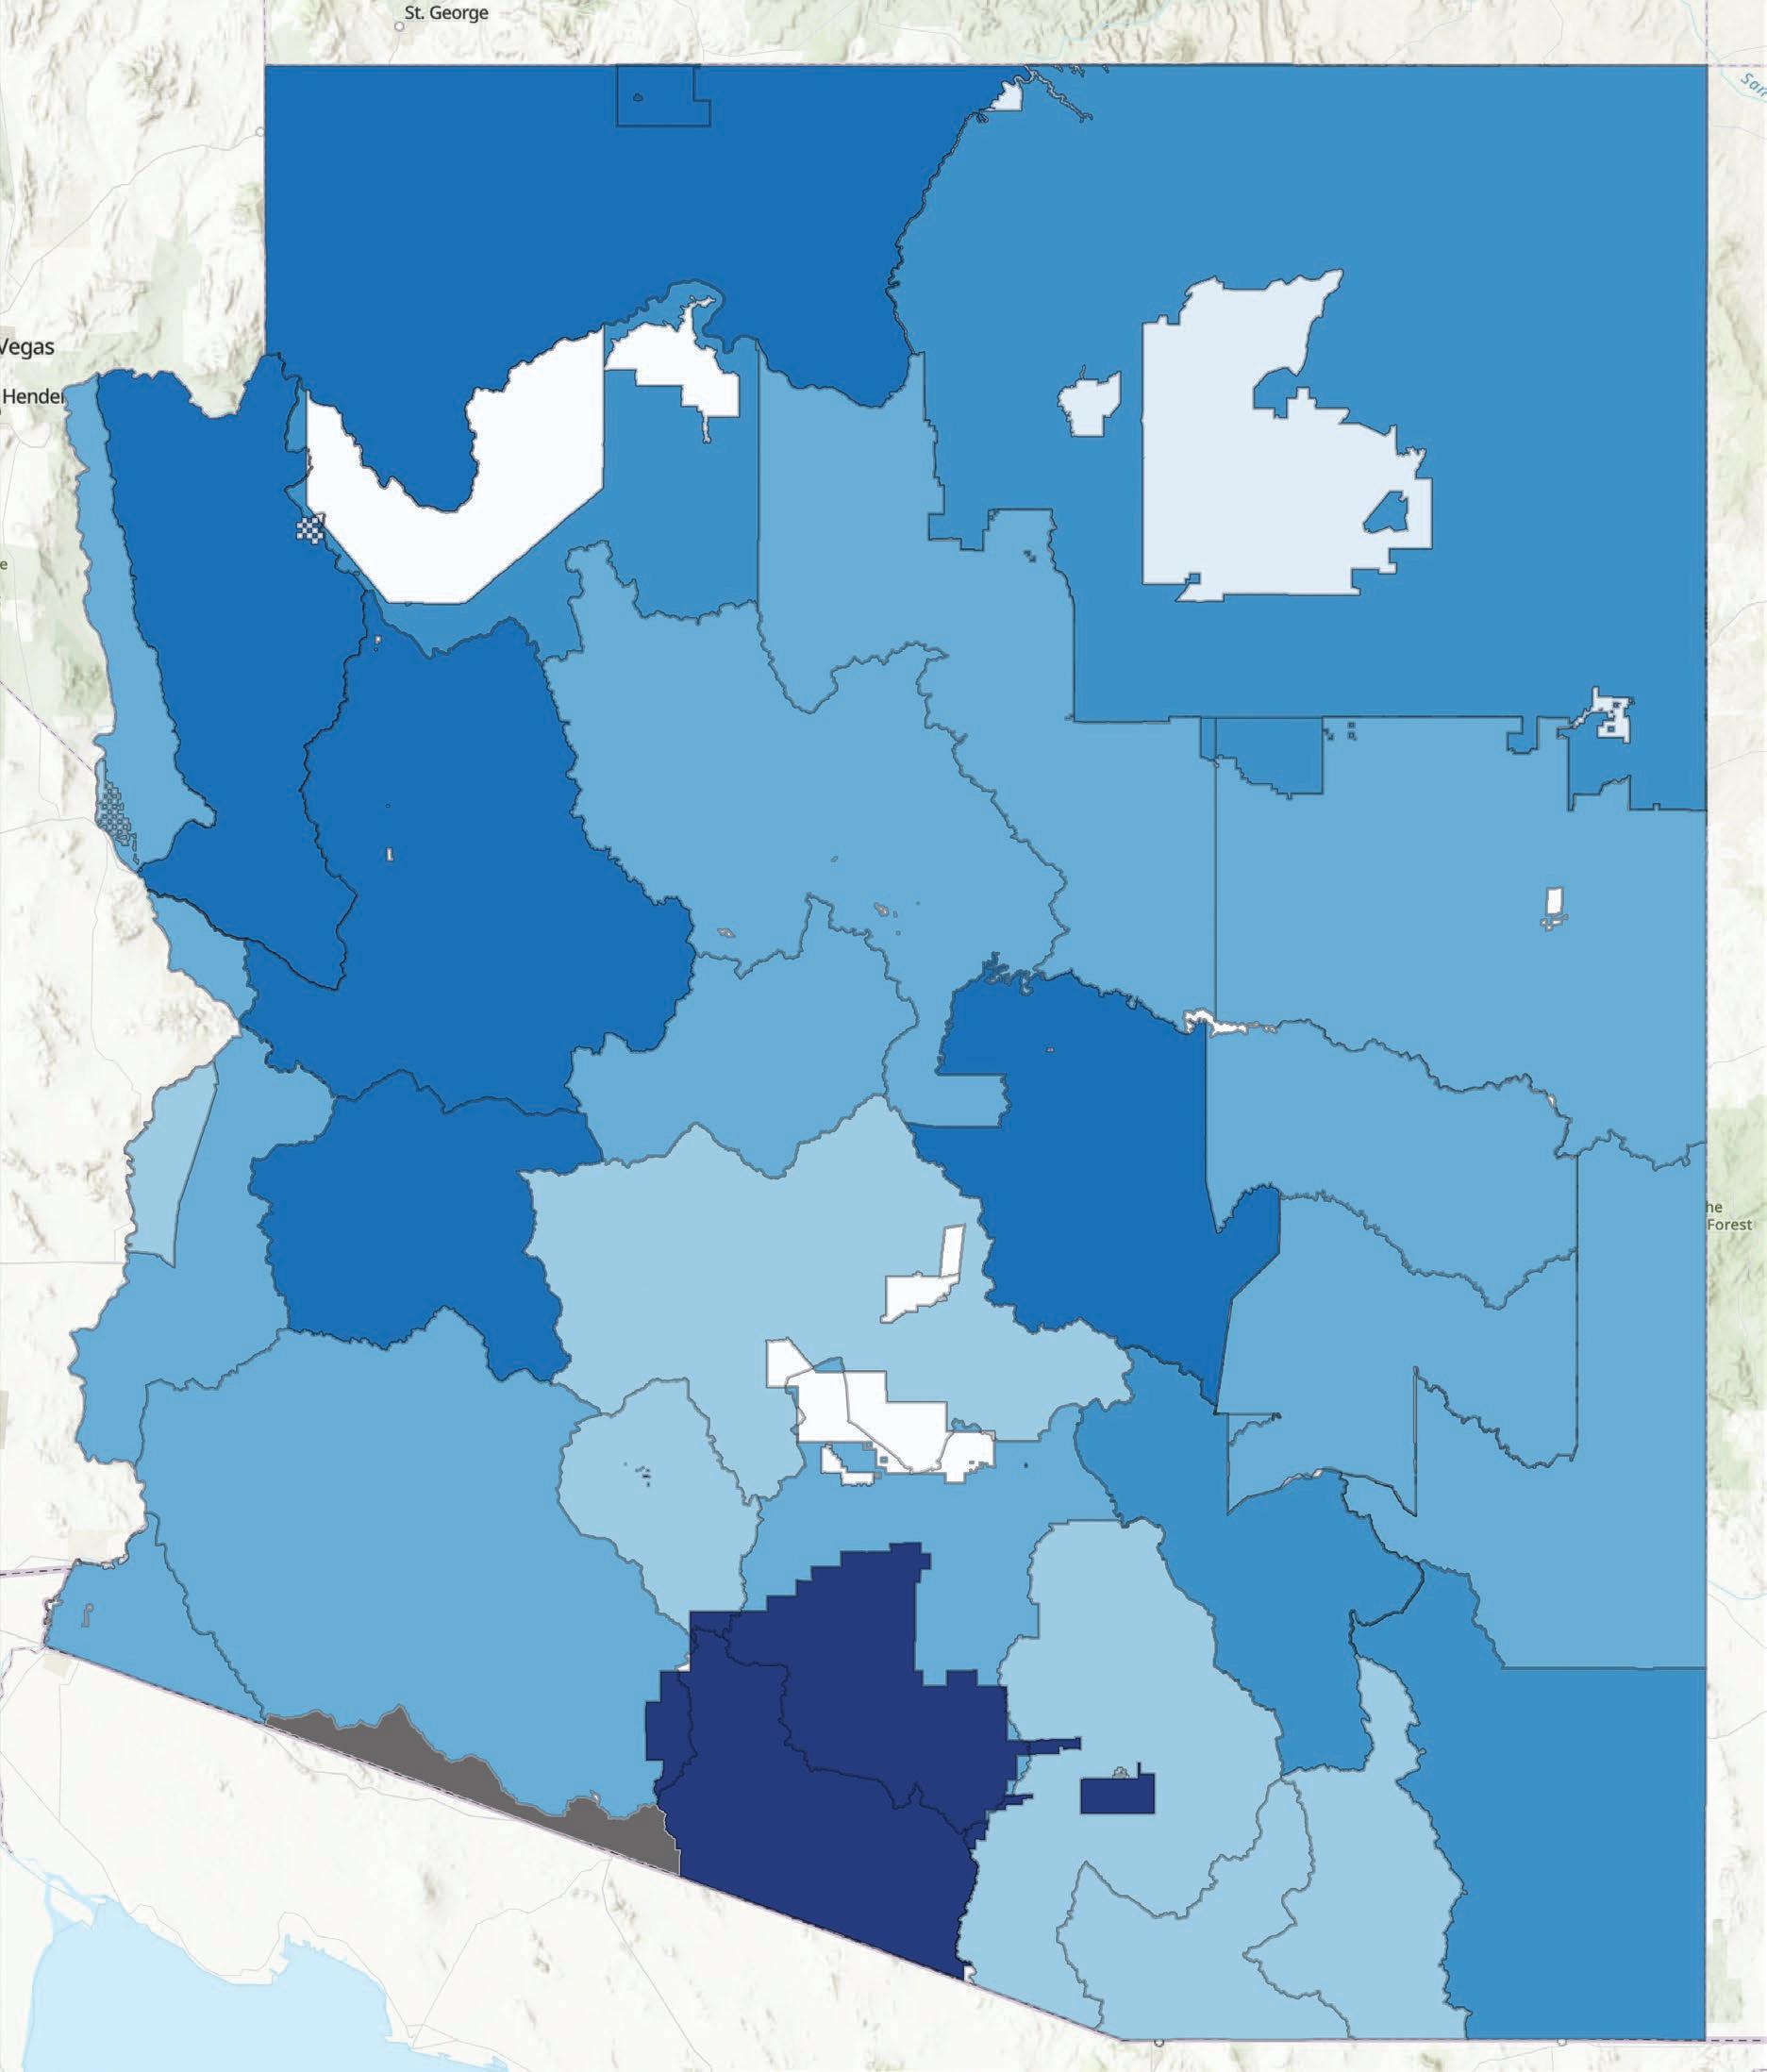
n 0 – 0.2% n 0.2 – 0.4% n 0.6 – 0.8% n 0.8 – 1% n 1 – 1.2% n 1.2 – 1.4% n 1.6 – 1.8%
No CWS
Municipalities that own and operate the community water system often combine water, wastewater, reclaimed water, solid waste, recycling, stormwater and other municipal services into one bill and commonly use the threat of disconnection from water services for nonpayment to enforce revenue collection for all of these city services. Thus, the cost of these other services is a part of the affordability of water services experienced by the customer. However, the collection of data for the cost of these other services is beyond the scope of this study. Only costs directly assessed for water service and fees assessed directly against water service (e.g. the city of Phoenix’s jail tax, taxes on the sale of water, etc.) are included.
The Arizona Corporation Commission allows some private water utilities to assess tariffs that vary year-to-year, such as those that pass the cost of power, wholesale water supplies, emergency purchases of supplemental water and public outreach programs directly through to the customer as examples. The Arizona Corporation Commission approves a methodology for the calculation of these types of tariffs but does not approve an exact tariff amount. Such tariffs are not always assessed each year, vary from year-to-year when assessed and often are not published. Thus, affordability metrics calculated in this study for private water companies that assess such tariffs may underestimate real costs to the customer and overestimate affordability. The private water companies for which the Arizona Corporation Commission has approved such tariffs, and for which the tariff amount could not be found, are highlighted for awareness.
Similarly, municipally owned community water systems and domestic water improvement districts sometimes charge fees that are listed in separate line-items than fixed and variable charges. Examples include fees for groundwater pumping, water conservation surcharges, water supply surcharges and drought surcharges among many others. Additional fees and charges directly related to monthly water costs were included for all water providers for which this information was available, however, documentation and publication of these additional costs varied widely for water providers across the state, and as a result some of the water rates presented in this study may under-represent the true cost of water in utilities that collect additional surcharges but do not specifically publish or disclose them.
There are several hundred community water systems across Arizona; the water rates of one or more are being revised nearly continuously. The rates used to calculate affordability in this study could not be collected simultaneously or instantaneously, and some may be out-of-date at the time of publication.
Community water system boundaries are not always coterminous with municipal corporation boundaries. Municipal taxes on the sale of water were included in the calculation of affordability in community water systems in which at least half of the community water system area lies within a municipal corporation boundary. In some cases, this may result in a slight over- or under-estimation of the cost of water used in the calculation of affordability for some of the customers within such community water systems.
The calculation of the 20th percentile income relied on a calculated estimate that may not be reflective of the actual 20th percentile as a result of ACS surveying limitations and the necessity to make assumptions for a “maximum income” level for calculation.
Data regarding the population served by each community water system was acquired through the Arizona Department of Environmental Quality’s Safe Drinking Water Information System. Population served in this database is self-reported and may not be consistently reported or updated and may be inaccurate.
When calculating monthly water costs at 4,000 gallons efforts were made to include all applicable tariffs, taxes, fees and surcharges levied by the water provider or relevant taxing jurisdictions. It was assumed that municipaland privately-owned water systems charge state and local taxes on the sale of water, but that districts, private water associations and Tribal utilities do not. In all cases, the Arizona state tax and applicable county tax rates were applied to the water rate unless taxes were otherwise specified by the water provider. Local utility tax rates were applied to all utilities within the boundaries of a municipality levying a local utility tax, according to 2024 data maintained by the Arizona Department of Revenue. Where community water system and city municipal boundaries were not coterminous, city taxes were included only if at least half of the boundary of the community water system was within the city municipal boundaries. This study does not include water costs that are assessed through property tax, such as membership in the Central Arizona Groundwater Replenishment District and certain water district assessments.
In many cases, water providers charge a number of fees and/or surcharges for various costs and programs of the utility or municipality. These may include fees for conservation programs, public education and outreach efforts, fees for groundwater pumping, new development, stormwater costs and even for freeway and jail taxes, among many others. A public utility’s independence in rate-setting grants it a wider range of fees and charges it can employ on a water bill, including the ability to assess fees for services and programs separate from the utility, whereas ACC-regulated private utilities are generally constrained to levying surcharges to recover costs directly associated with the operation of the utility itself.
Additional fees and charges directly related to monthly water costs were included for all water providers for which this information was available, however, documentation and publication of these additional costs varied widely for each water provider across the state, and as a result some of the water rates present in this study may under-represent the true cost of water in utilities that collect additional surcharges but do not specifically publish or disclose them. In some cases, utilities have gained approval from the Arizona Corporation Commission to levy one or several of these types of surcharges but do not specify how much they will charge rate payers if/when they do collect them.
Monthly income was calculated using household income data from the United States Census Bureau’s 2022 American Community Survey’s 5-Year Estimates. While mean and median income are reported directly from the Census Bureau, the 20th percentile income, used in the primary metric of affordability employed in this study, is not, and was calculated following the framework used in Patterson and Doyle’s 2021 “Measuring water affordability and the financial capability of utilities”.45 This involves using available Census Bureau data regarding the number of households in a specified area earning within ten income ranges and randomly generating an income for every household in the area within their respective income range. These values were then compiled into a single list, representing the incomes of all households in the area, and ordered. The lowest 20th percentile value was determined from this list. These calculations were conducted five times for each area; the average of which was then taken to avoid outliers.
45 Lauren A. Patterson and Martin W. Doyle, “Measuring water affordability and the financial capability of utilities”, American Water Works Association, November 24, 2021, https://awwa.onlinelibrary.wiley.com/doi/full/10.1002/aws2.1260. The robustness of this approach is shown in Diego S. Cardoso, Casey J. Wichman, “Water Affordability in the United States”, American Water Works Association, November 29, 2020, https://agupubs.onlinelibrary.wiley.com/doi/10.1029/2022WR032206
The minimum wage in each area was ascertained through data from the Industrial Commission of Arizona and corroborated with local sources to confirm any local minimum wage ordinances established by the respective municipality or tribe.
In cases where a water system’s service area expands to multiple census tracts, one of two methods were used to ensure reliability of data used in calculations:
• Where a multi-tract system adheres largely to the boundaries of a city, town, or similar grouping of households, ACS Census household income data was collected directly at the city, town, village or Census Designated Place (CDP) level, as opposed to the census tract, and every other subsequent process and calculation was unchanged. This helped ensure that households within the relevant census tracts but outside of the water system were not included.
• Where a system falls within multiple census tracts but is not largely consistent with the boundaries of a city town or CDP, a combination of the relevant census tract’s data was used to represent the water system. This was done by calculating the percentage of the water system’s service area contained in each census tract and using that percentage to perform a weighted average of the tracts’ median household income and 20th percentile incomes. Expenditure data for these combined tracts was informed by the income group designated by the newly calculated TPI.
In cases in which a system’s service areas falls within multiple local tax jurisdictions, the tax rate for the jurisdiction representing the largest amount of surface area within the CWS’ service territory was used.