● "The proportion of a country's population living in urban areas comparedtoruralareas"(WorldBank,2021).
Urbanisation at Global level
● According to UN in 2021 56.2% of the world's population lives in urbanareas,i.e 4.4 billion people.
● TheUNprojectsthatthistrendwillcontinue,andby 2050, two-thirds of the world's population will live in urban areas.(UnitedNations, Department of Economic and Social Affairs, Population Division (2021)."WorldUrbanizationProspects:The2021Revision".
India’s Rapidly Urbanising Top 3 Metropolitan Regions
MetropolitanRegion
NationalCapitalRegion (Delhi)
KolkataMetropolitanArea
INTRODUCTION
Source: Ministry of Housing and UrbanAffairs
Source: Ministry of Housing and UrbanAffairs
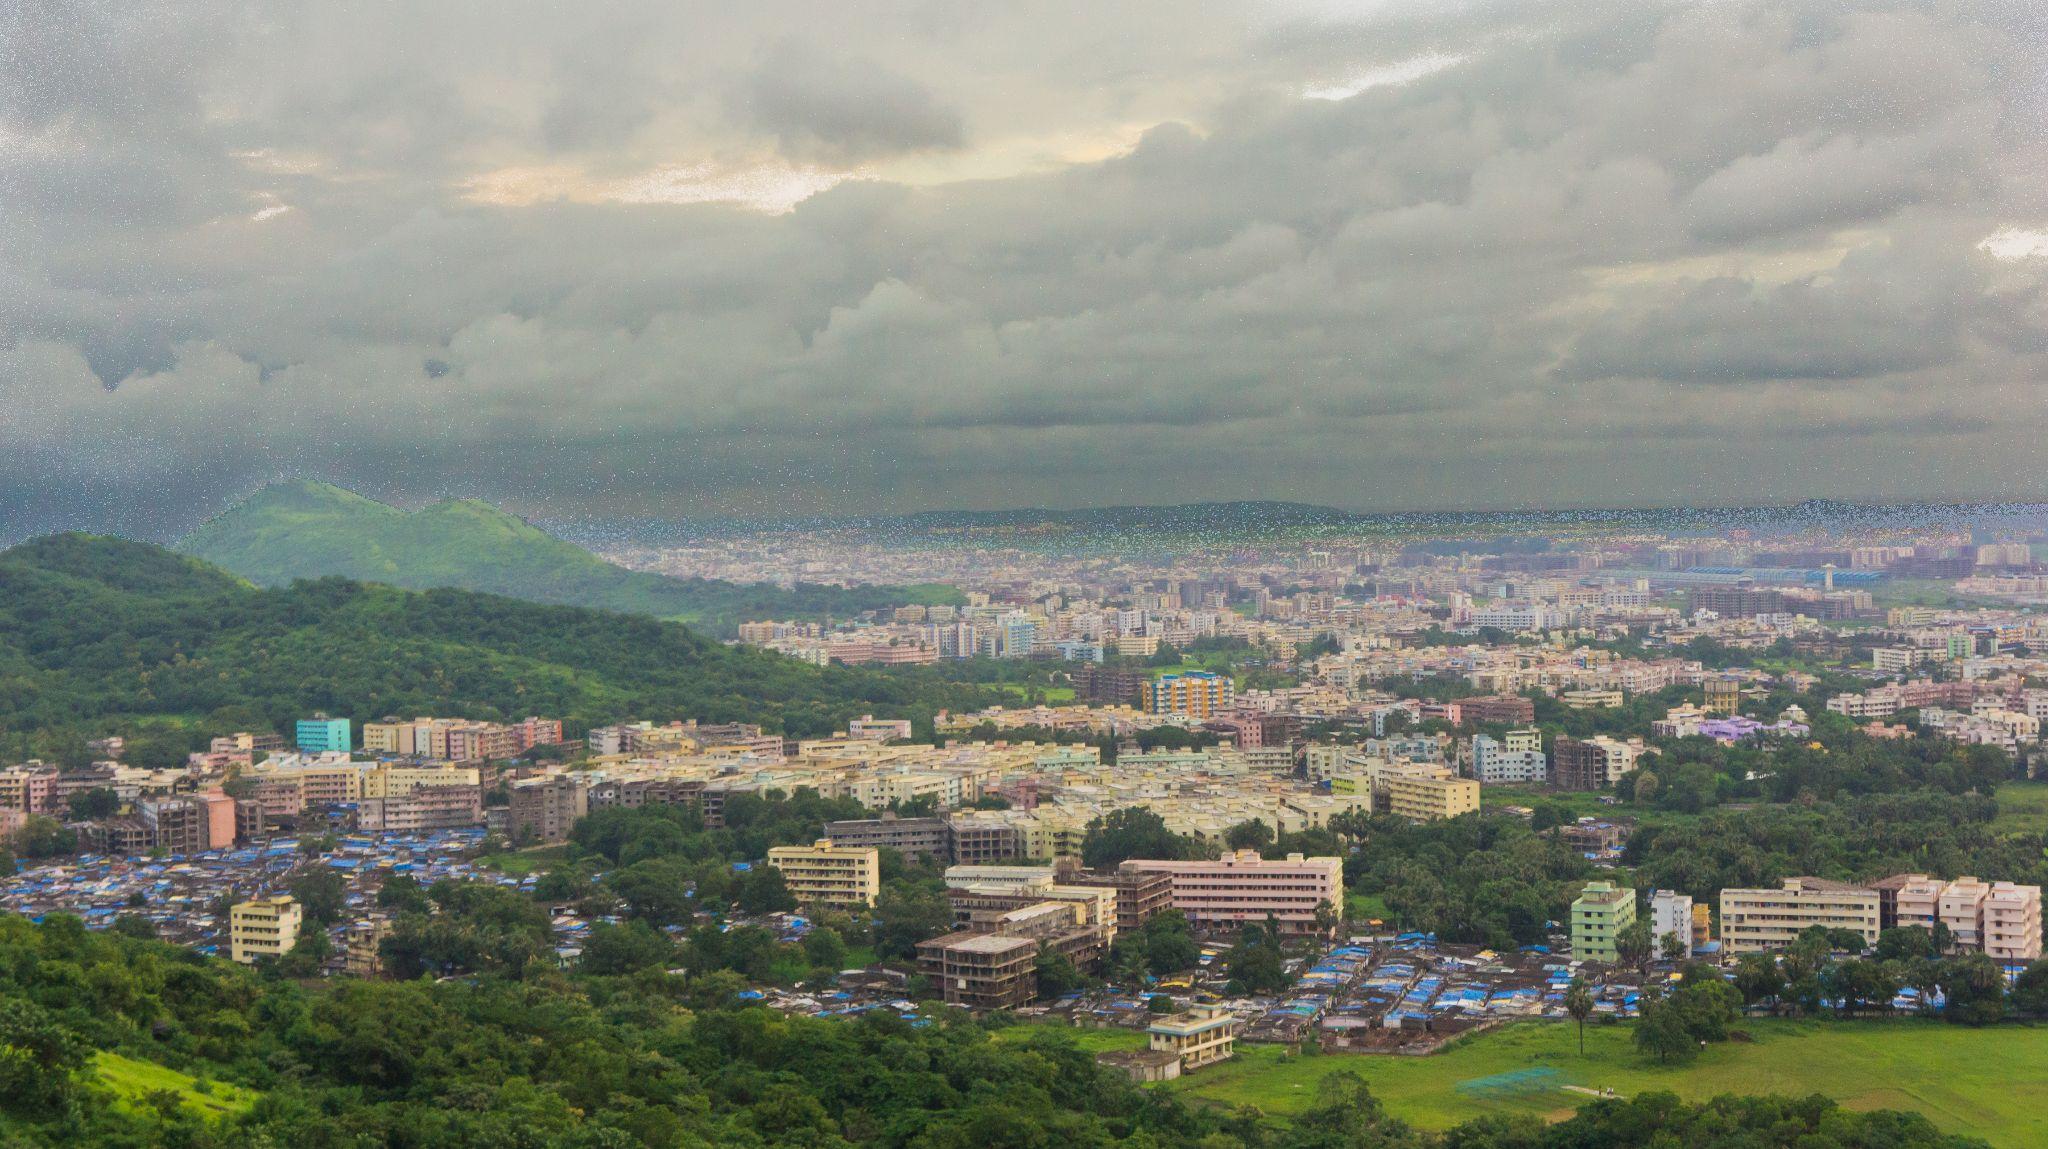
Impacts of Urbanization on City's Sustainable DevelopmentACase of Virar City, Maharashtra
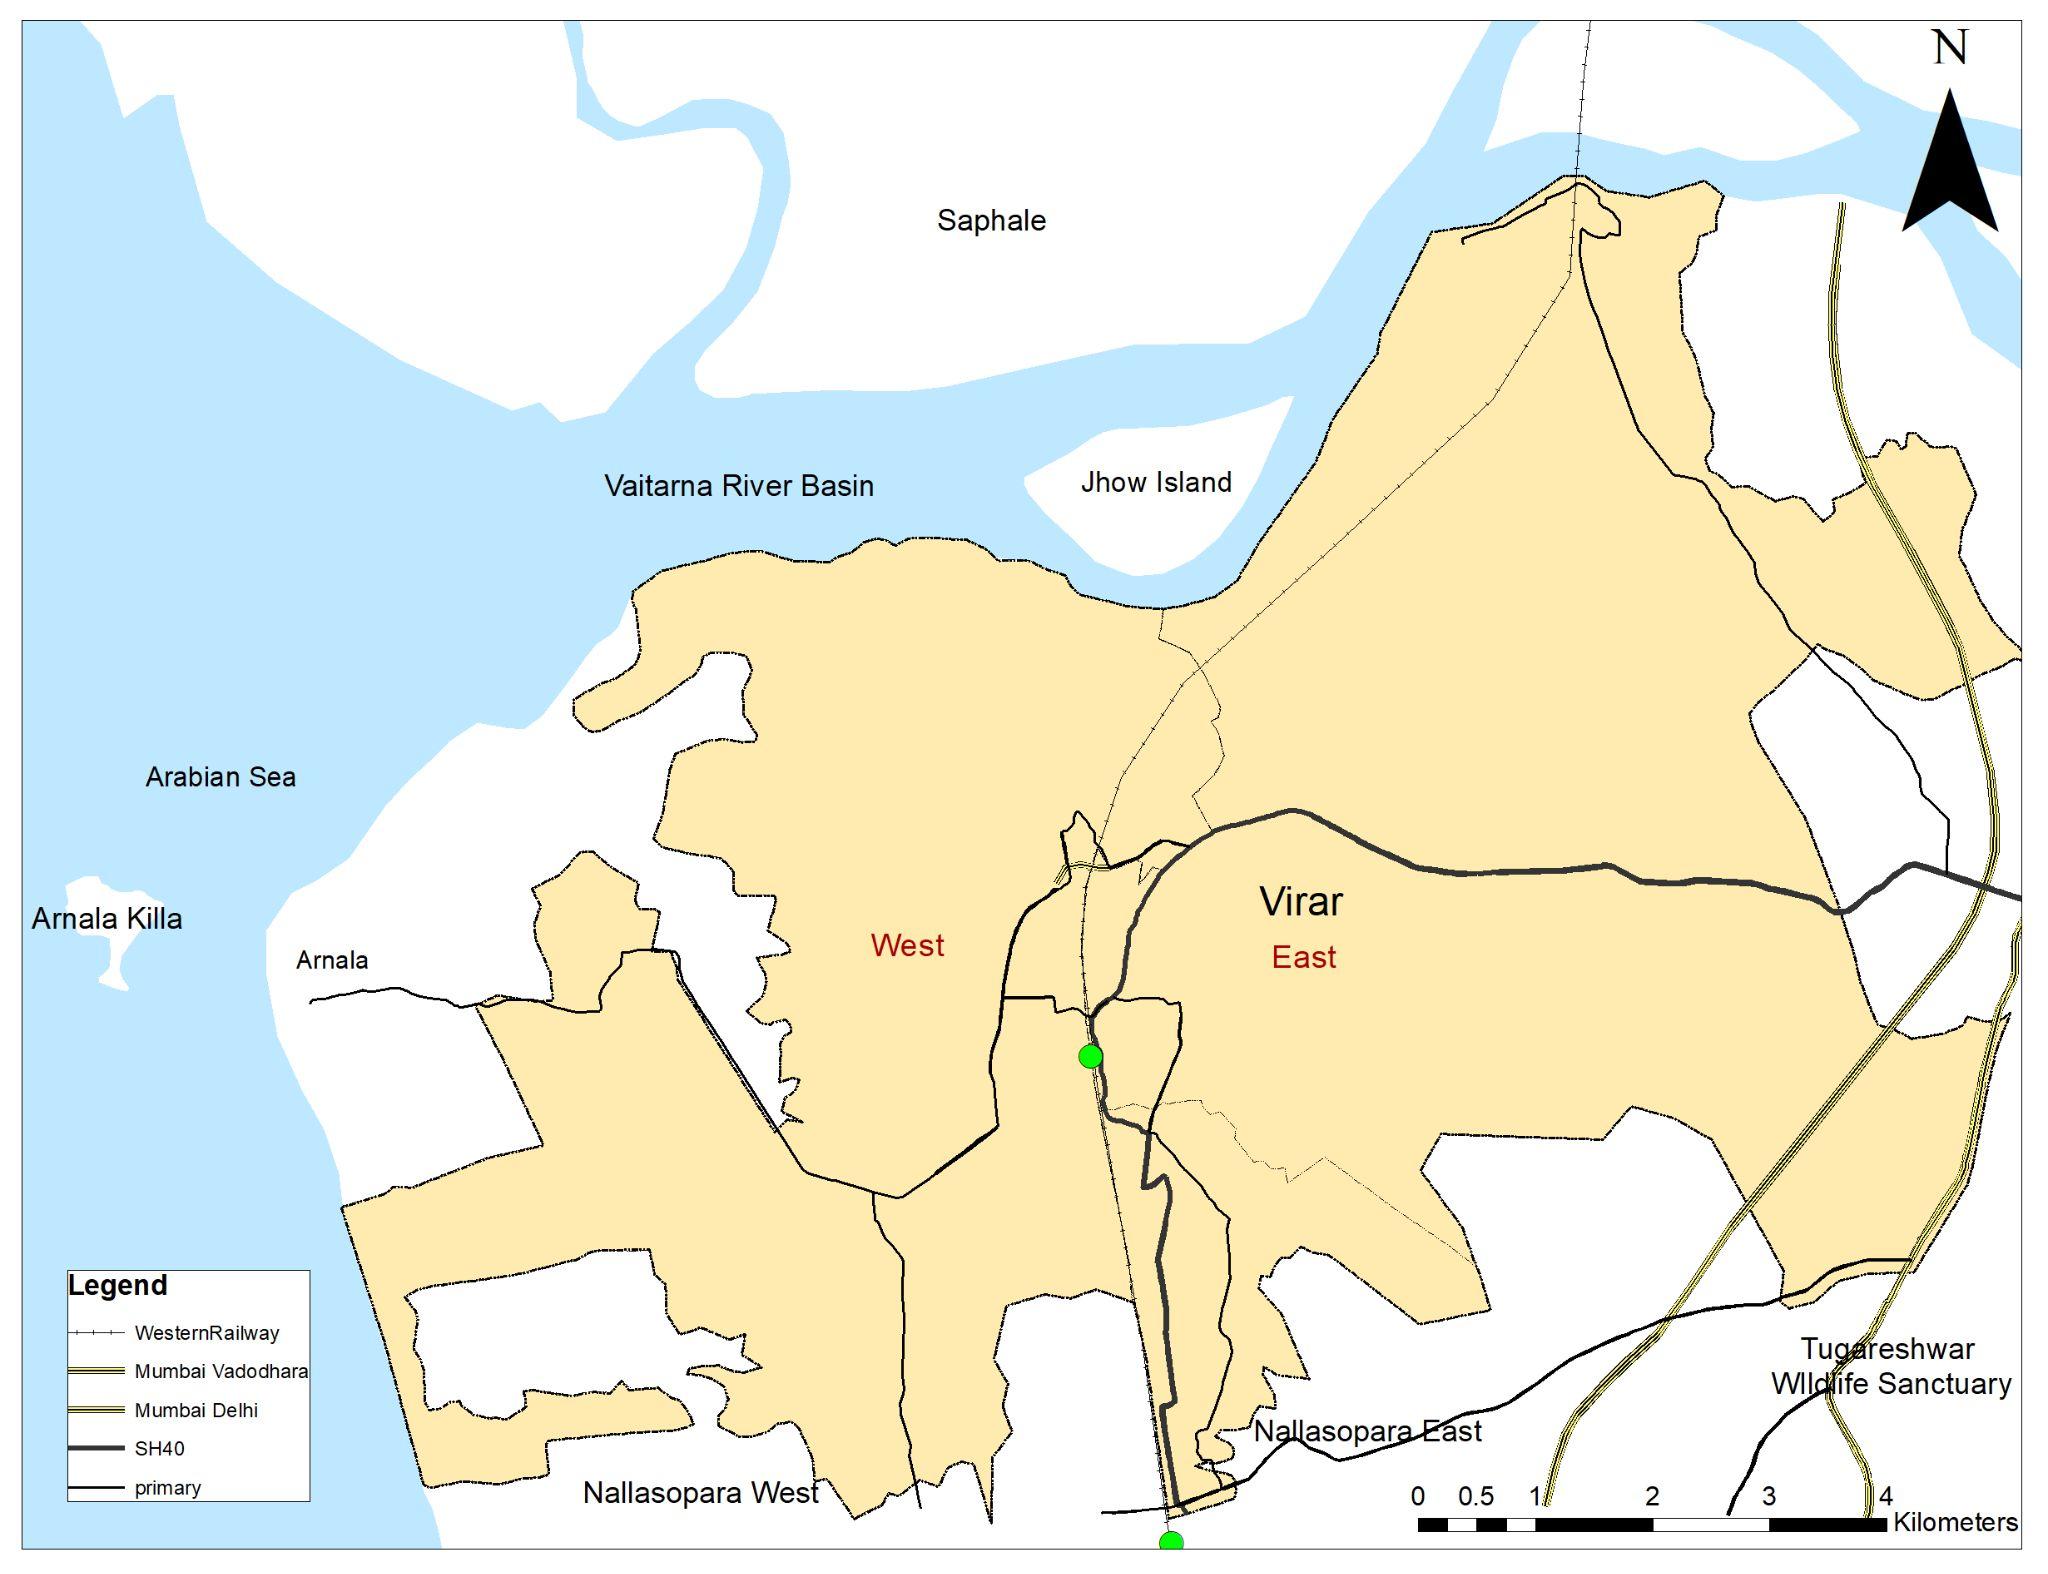
● Virar isaoneofthefourcitiespartofVasai-Virar Sub Region, situated at the north-west corner of theMumbaiMetropolitanRegion.
● The subregion is from Greater Mumbai and Mira-BhayanderbyVasaiCreek.However,dueto the development of the road and Suburban Rail network,itisstrategicallylinkedtoMumbai.
● Due to close proximity to Mumbai, Virar is experiencing rapid urban growth. With high prohibitive land prices in Mumbai, low and middle-incomehouseholdsareshiftingtoVirar.
● Thus,ithasbeenservingasagrowingdormitory town to Mumbai city with almost 60% population (CDP, VVMC) using Local Railways to commute regularlyforemploymentopportunities.
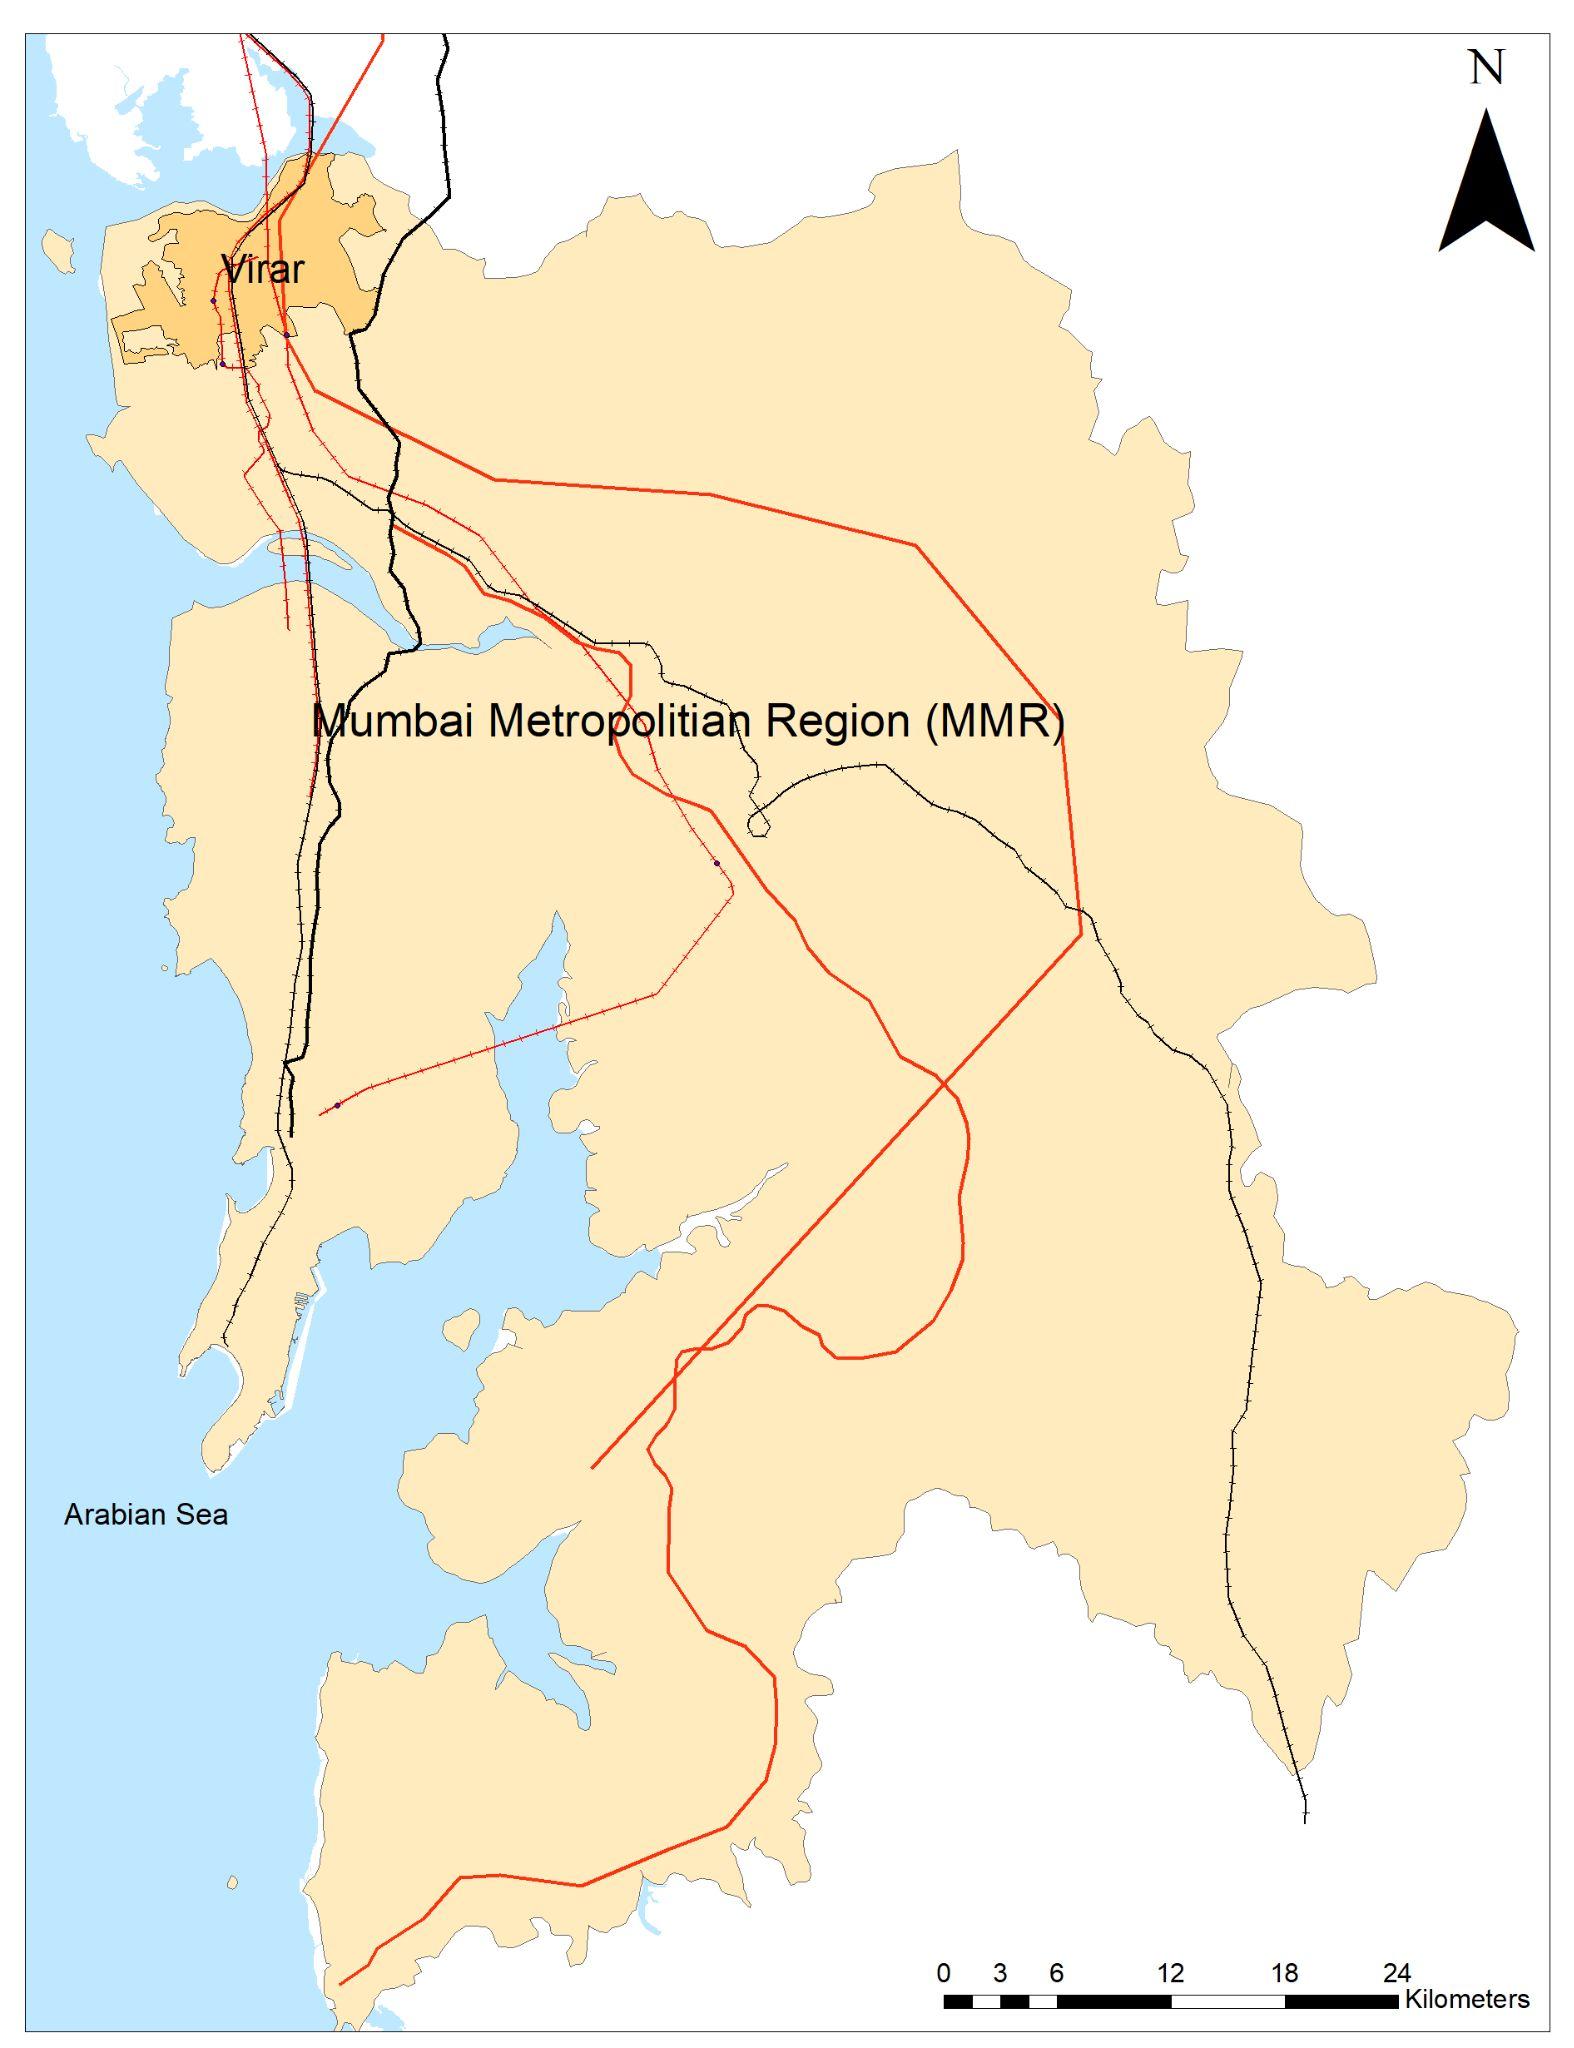
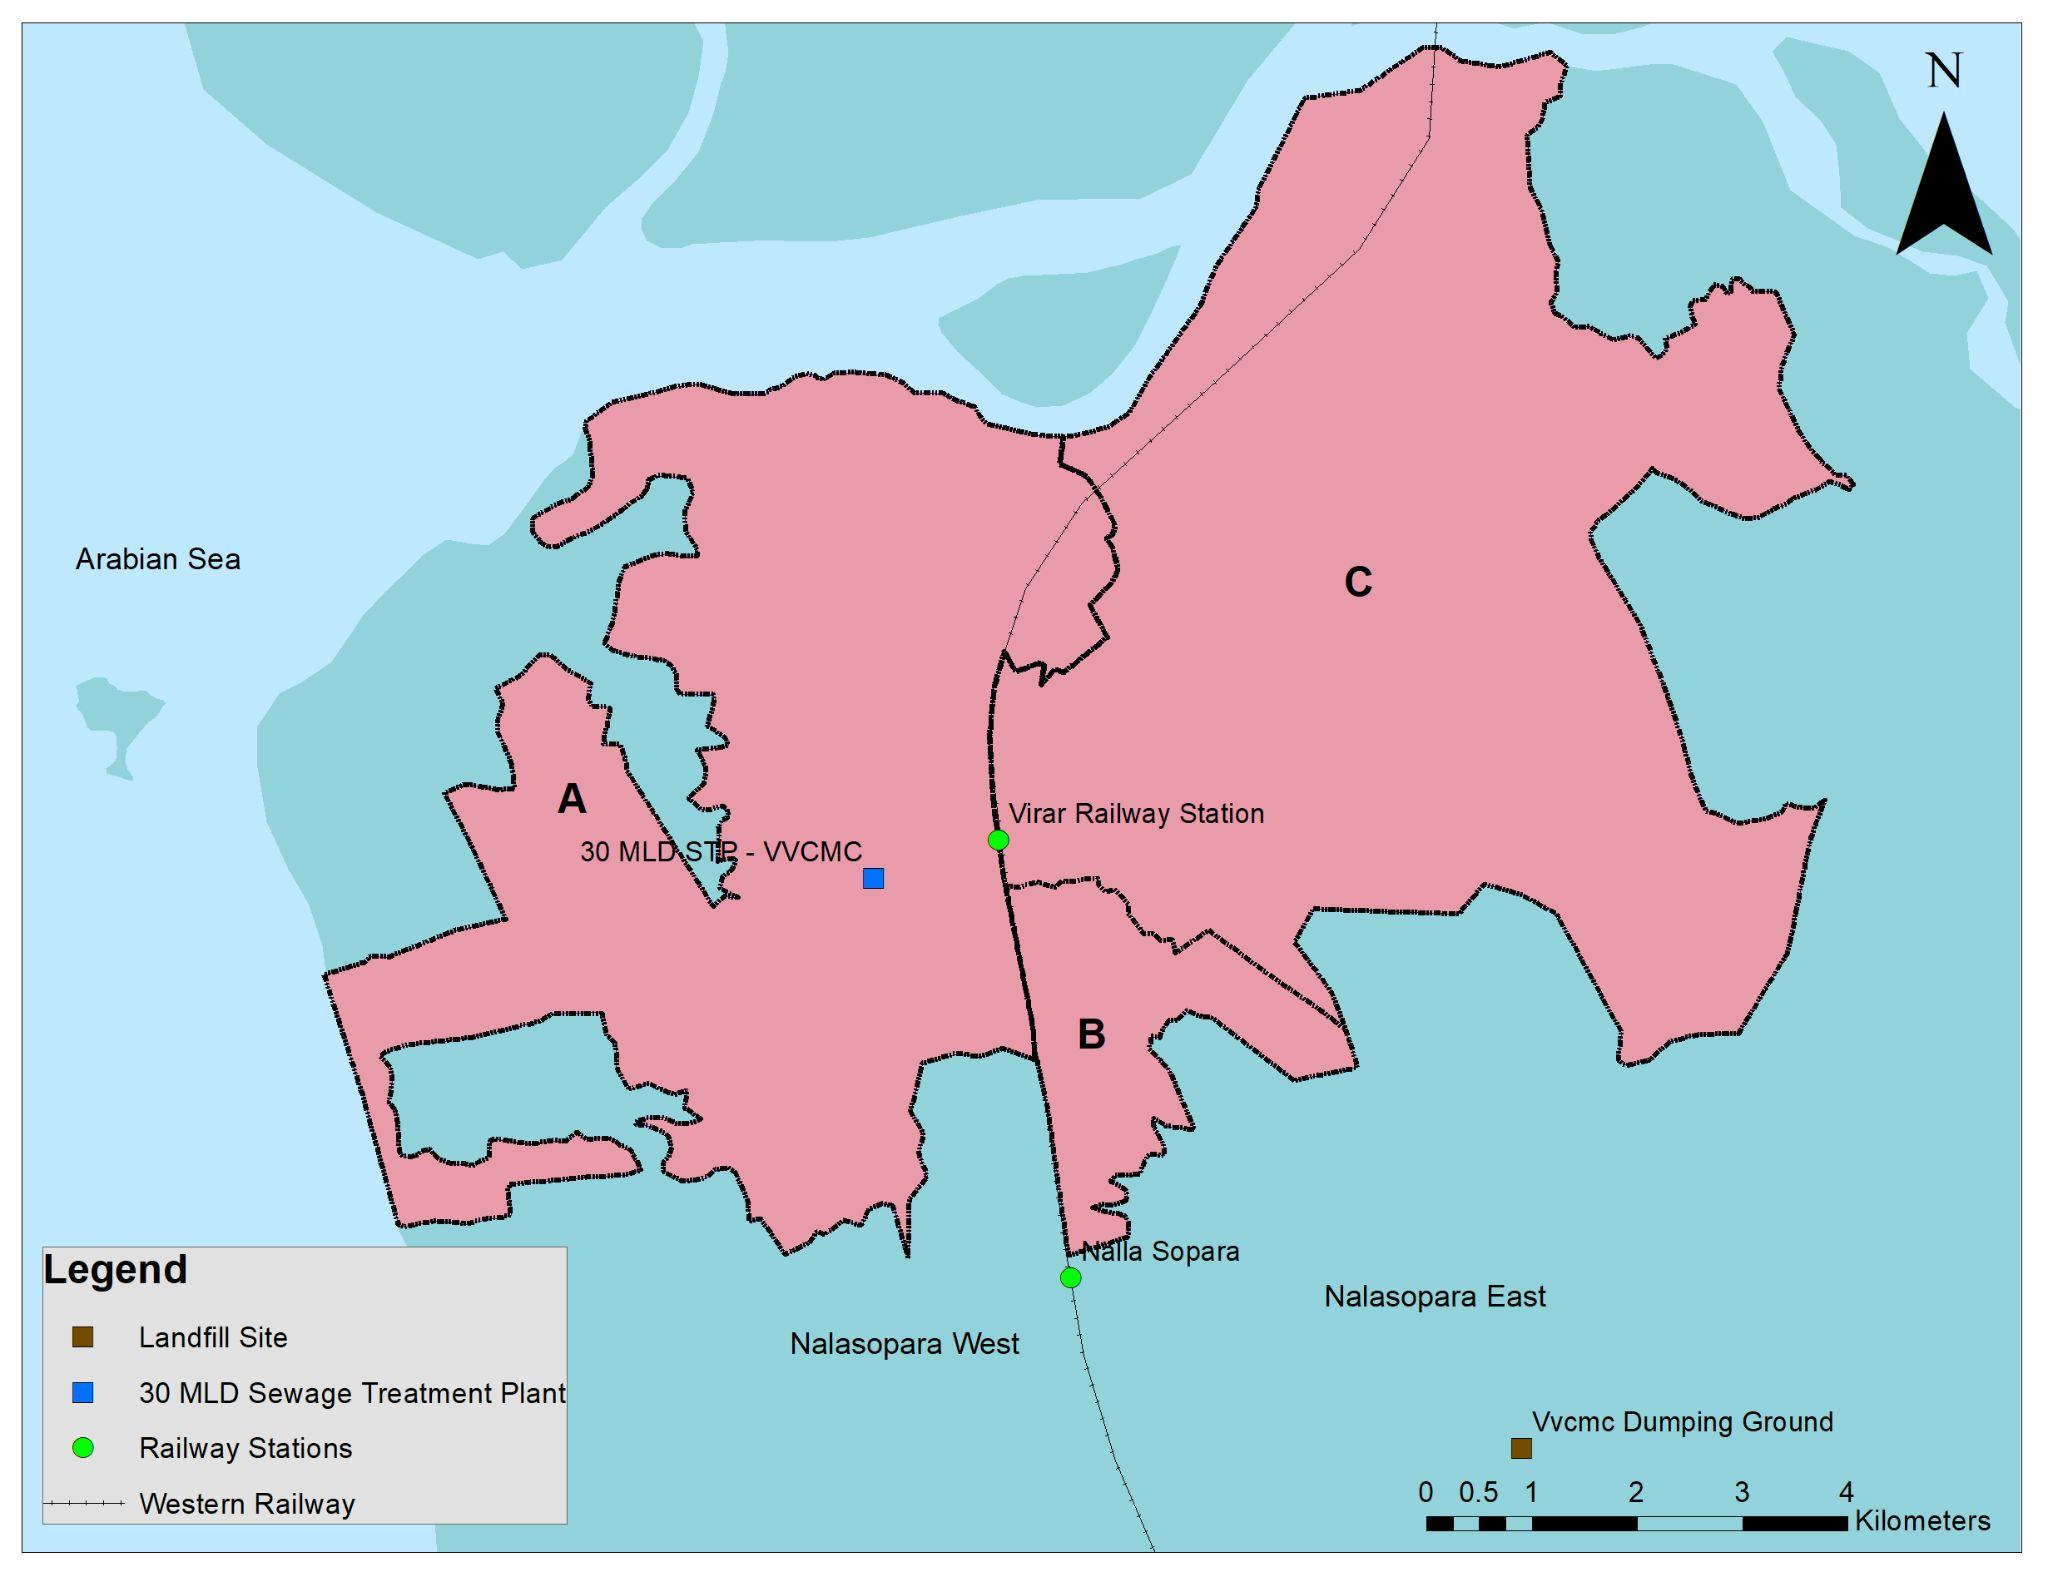
VIRAR CITYLocation & Linkages
Source: VVMC
Connectivity Road: Mumbai-Ahmedabad Highway (NH-48); Western Express Highway (NH-8) Railway: Virar station on Western Suburban Railway Airport: Chhatrapati Shivaji Maharaj InternationalAirport (60 kms)
StudyArea: Virar City, Maharashtra. HaswitnessedRapid urbanisationinpast decadesandexpecting massiveinfluxofmigrants incomingincomingyears.
Literature Review
● Urbanization: History, Theory, Causes, Consequences, Definition of Indian cities, Major Problems or Urban Areas in India ,Sustainable Urbanisation,
● Development Goals: Goal 11. Sustainable Cities and Communities, SDG Urban Index: NITI Aayog
Aim: Sustainable Planning and Development of Virar City.
PROPOSALSAND RECOMMENDATIONS
PRIORITISINGTHE CONCERNEDAREAS
1 To examine the urbanisation trends in a spatio-temporal context and responsible factors
11.3: Inclusive and SustainableUrbanisation 11.3.1 - Relating Land Consumption and PopulationGrowth
METHODOLOGY
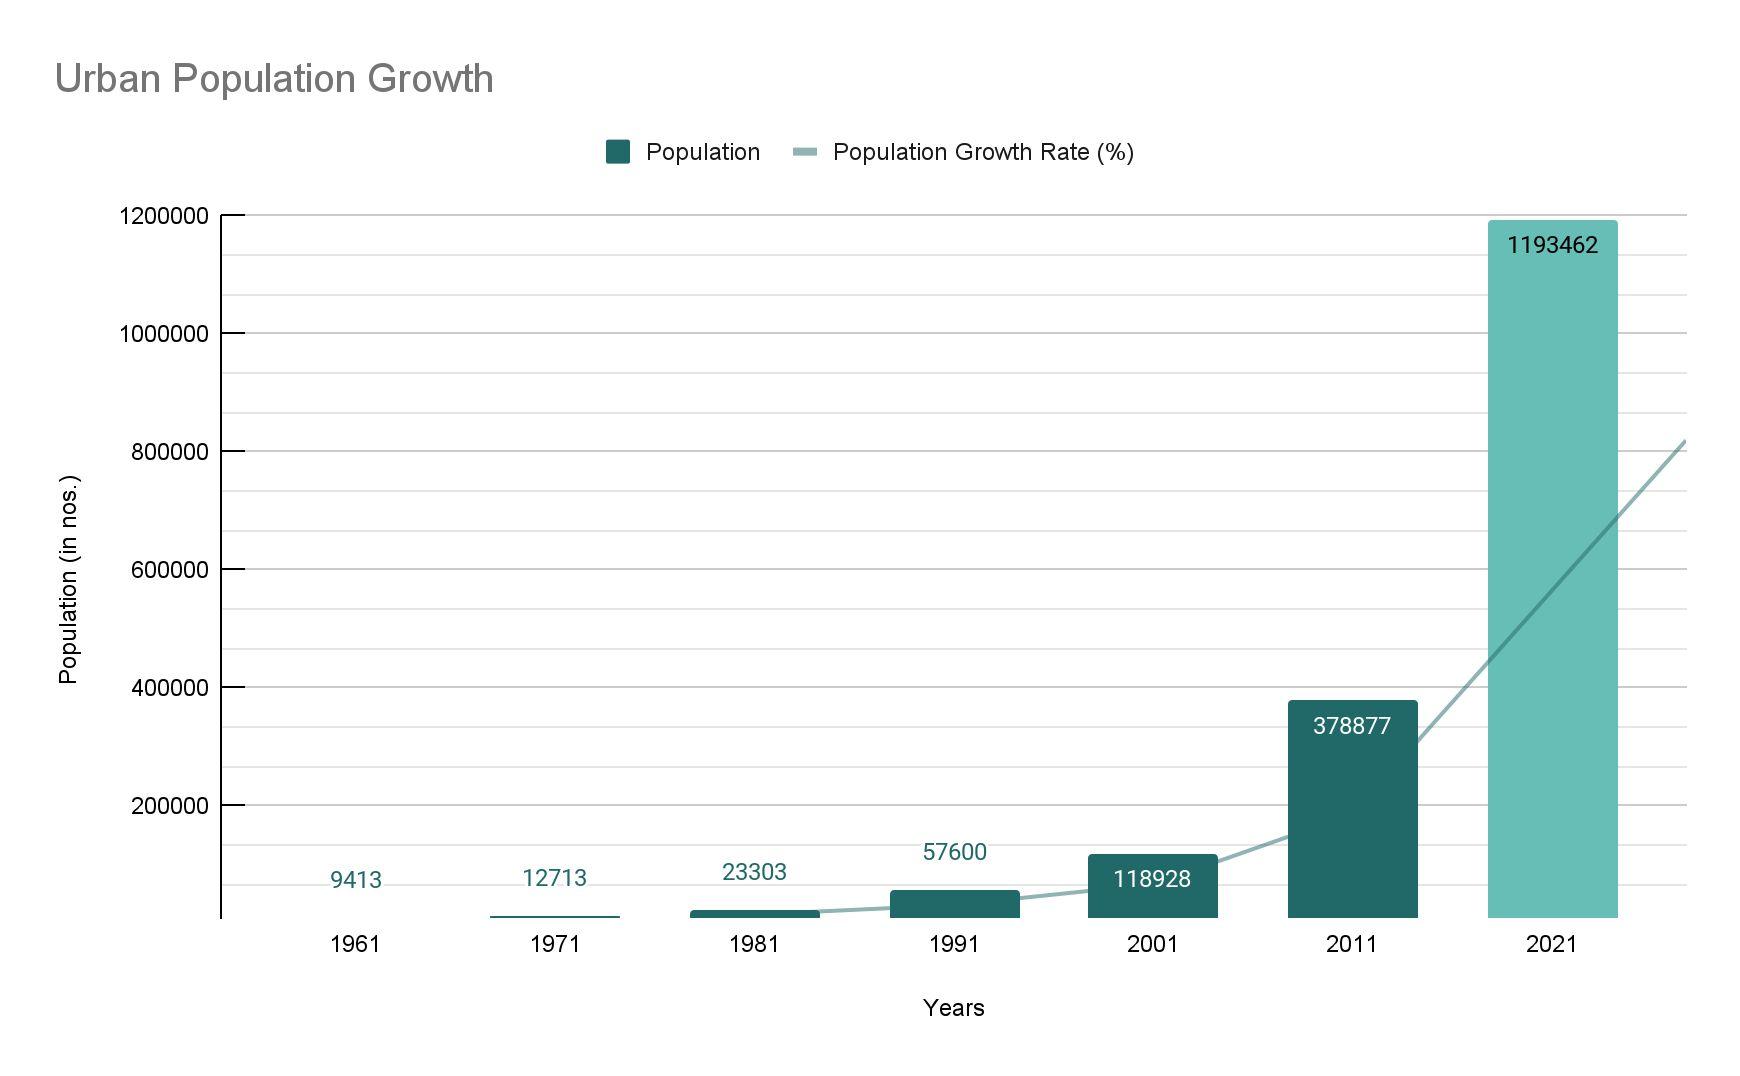
Urban Population Growth and Spatial Growth
● Events leading to urbanization.(Timeline)
● Population growth rate (%)
● Ward wise population (no.)
● Ward wise density of population (no. of persons/sq.km)
● Direction of Growth
● Factors affecting growth and growth direction
● Total change in built up area (%)
● Land consumption rate to population growth rate (%)
● Percentage Change in occupational structure. (no. and %)
●
● Employment trend in Main, Marginal and Non Working Population. (no. and %)
● Land Consumption Rate (%)
● Percentage increase in no. of PropertiesResidential and Commercial (no. and %)
● Built - up area per capita for the year 2021 (m2/person)
IDENTIFICATIONOF ISSUES
DATAANALYSIS
2 To examine the status of infrastructure with respect to the growing population.
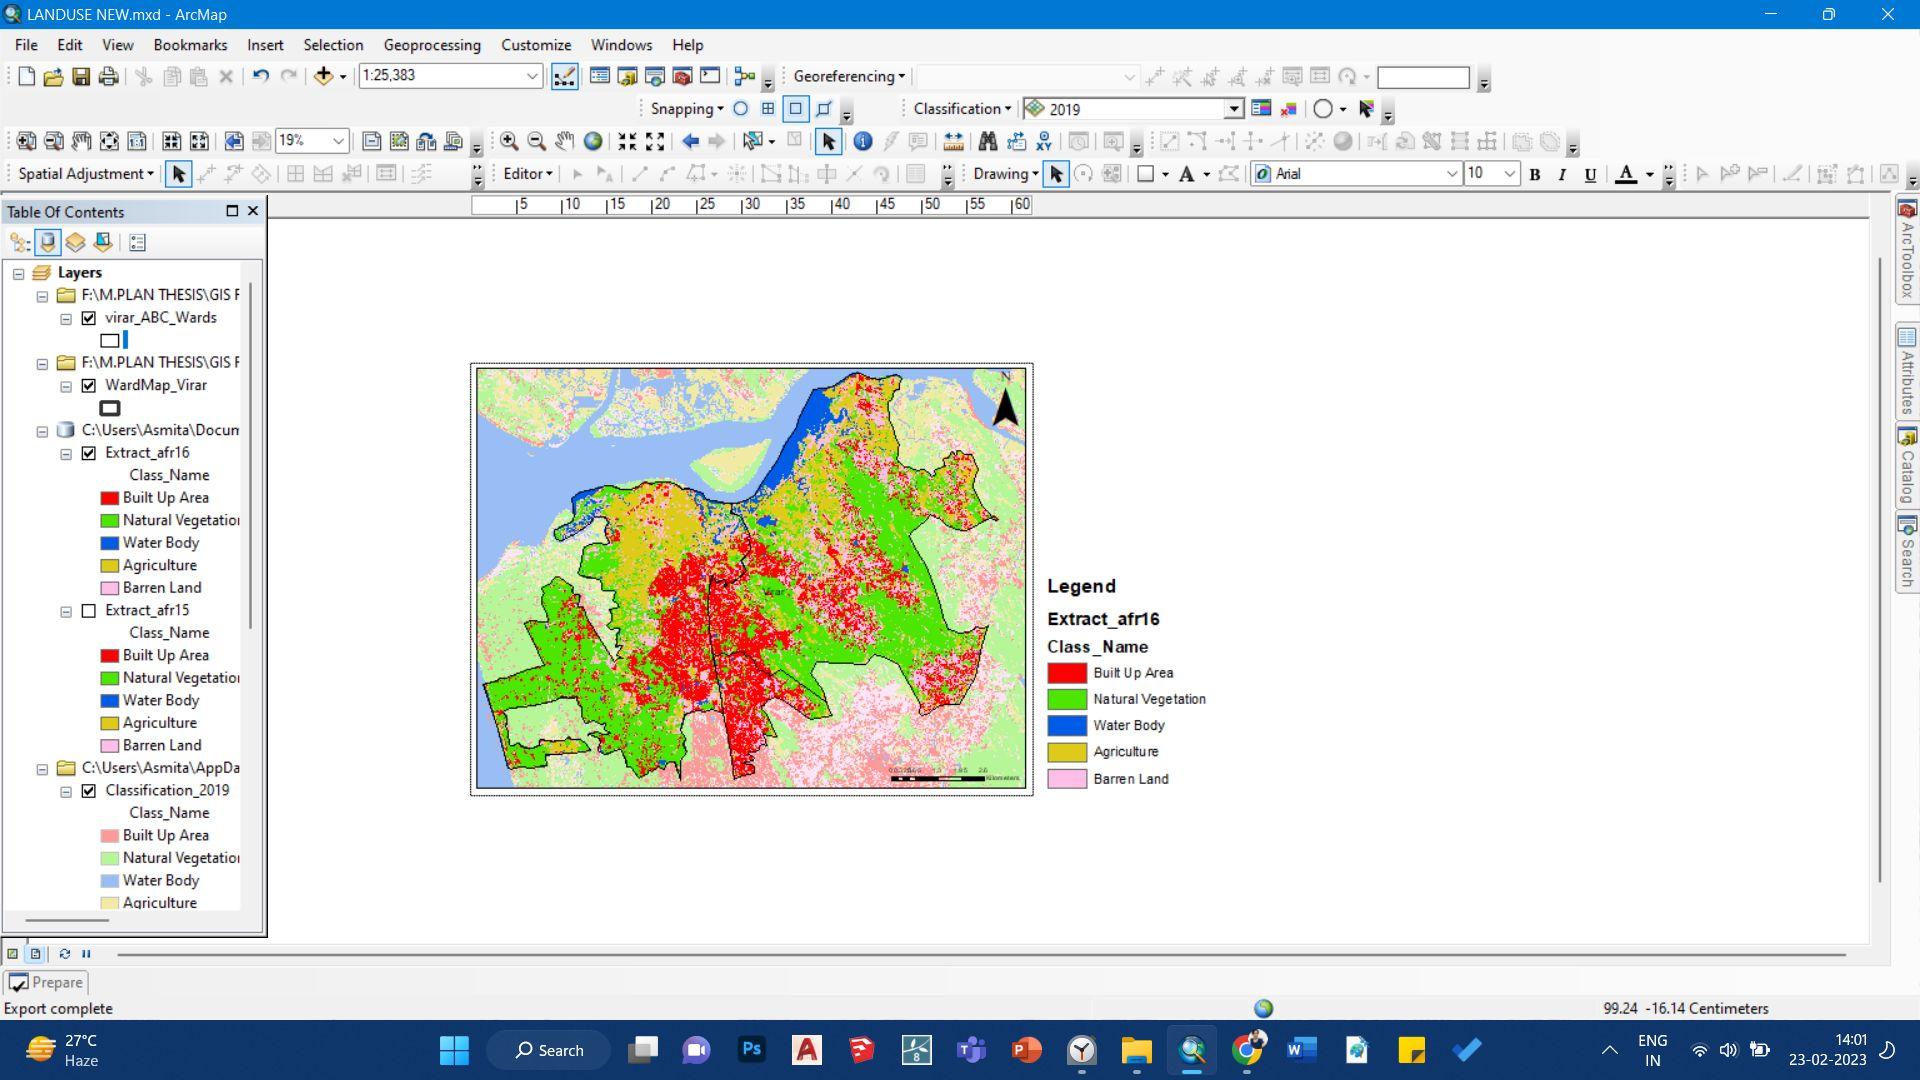
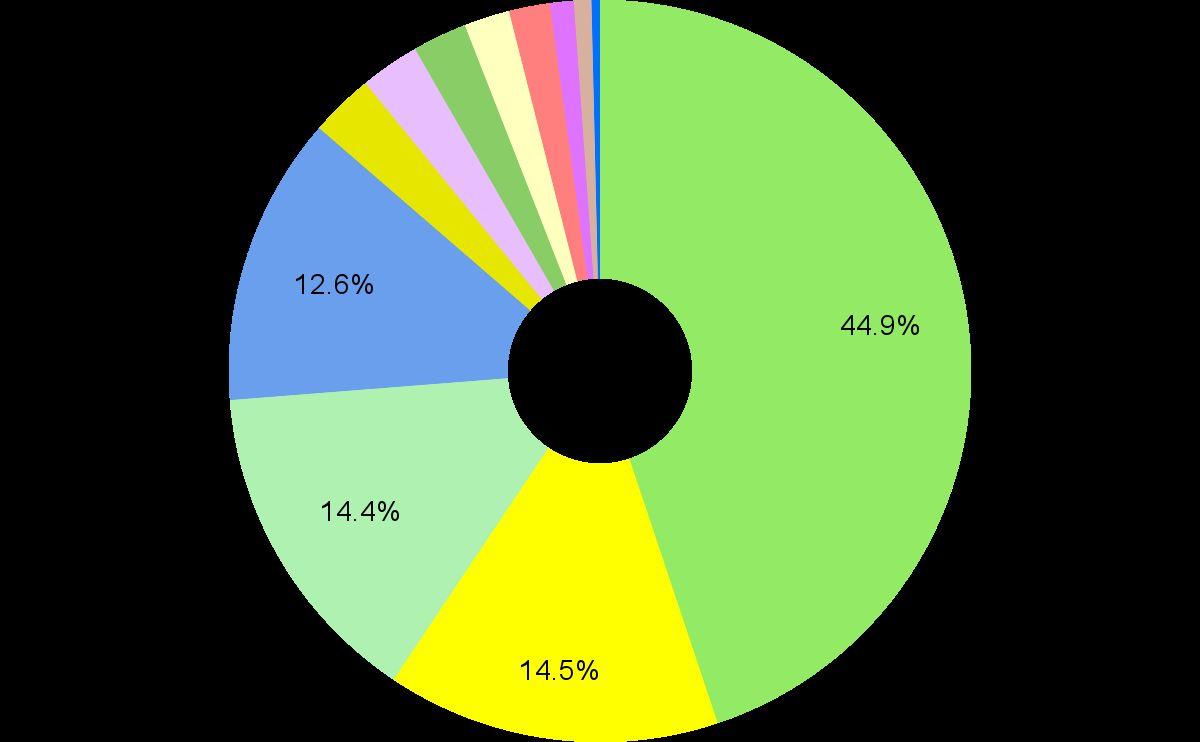
Land Use
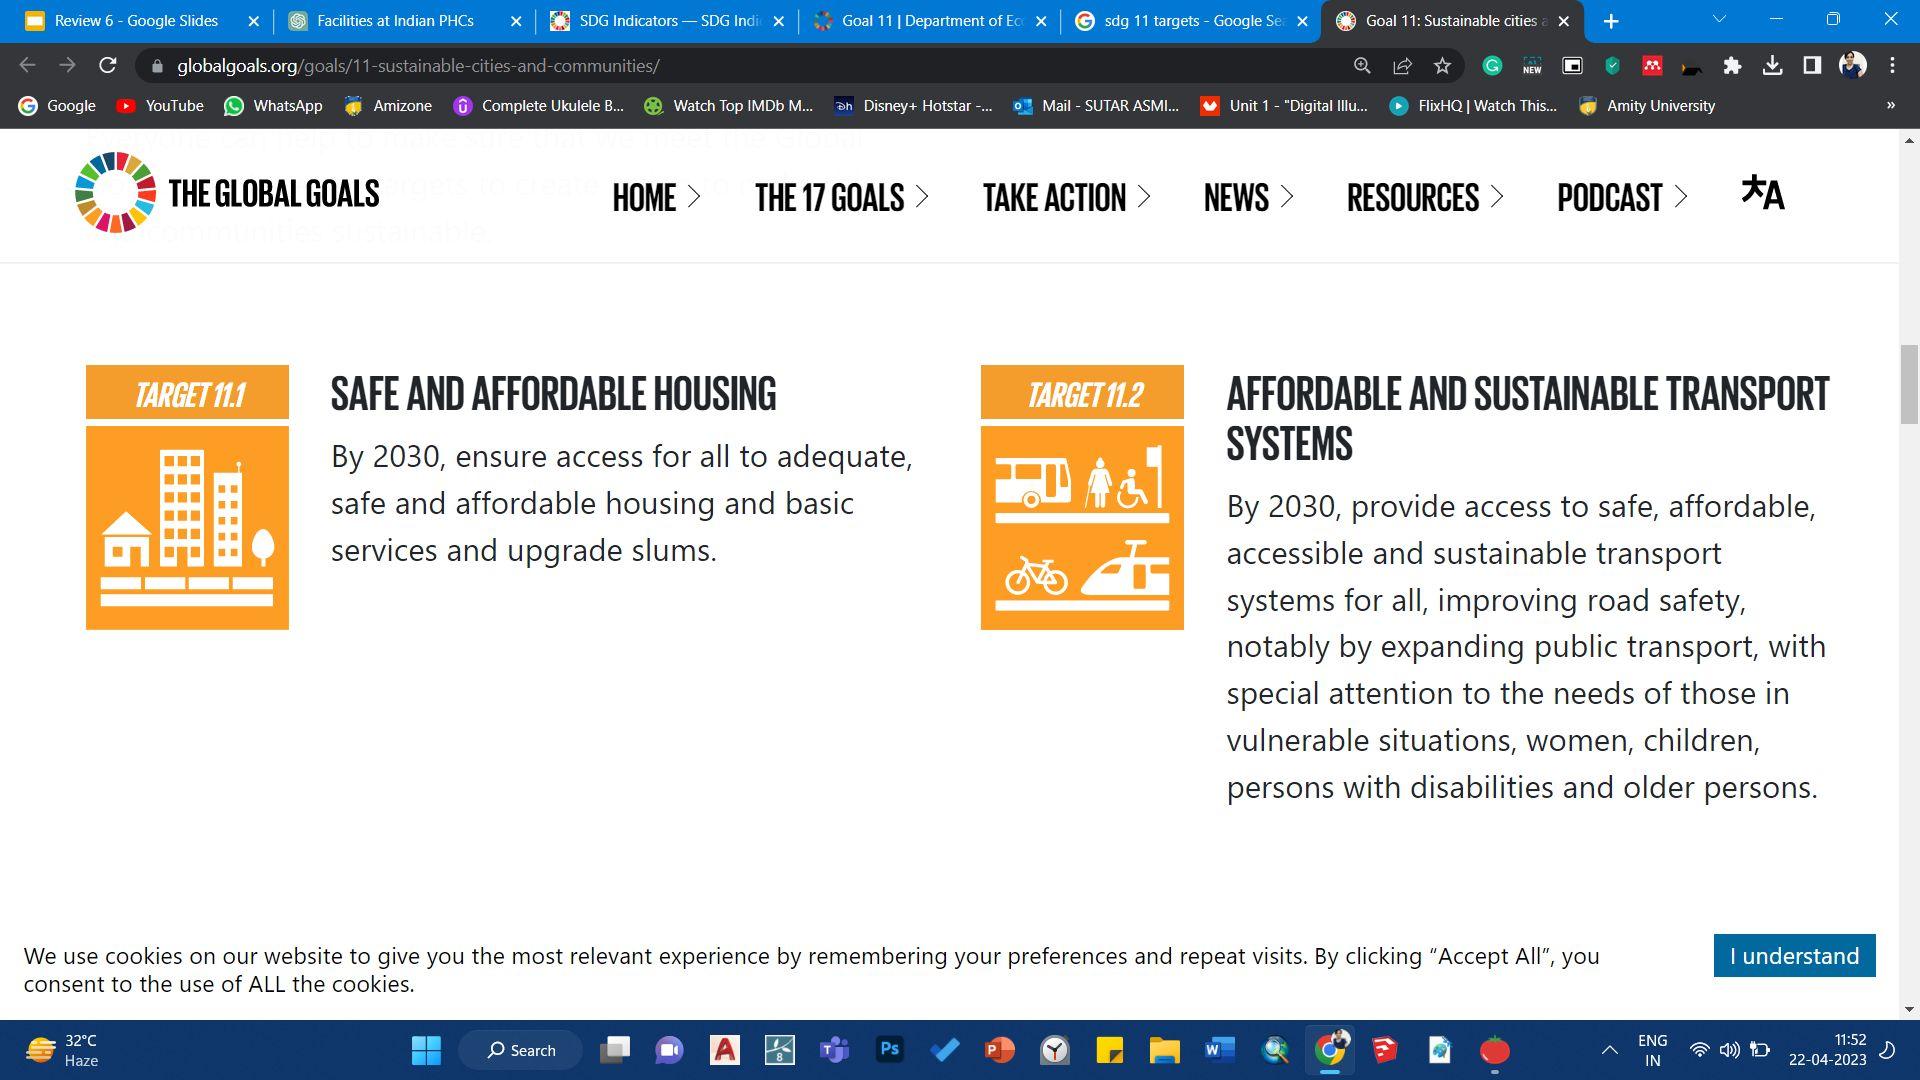
11.1:SafeandAffordable Housing Encroachment
11.2: Affordable and Sustainable TransportationSystems
Transportation
● Percentage of Proposed Land Use Categories (sq km & %)
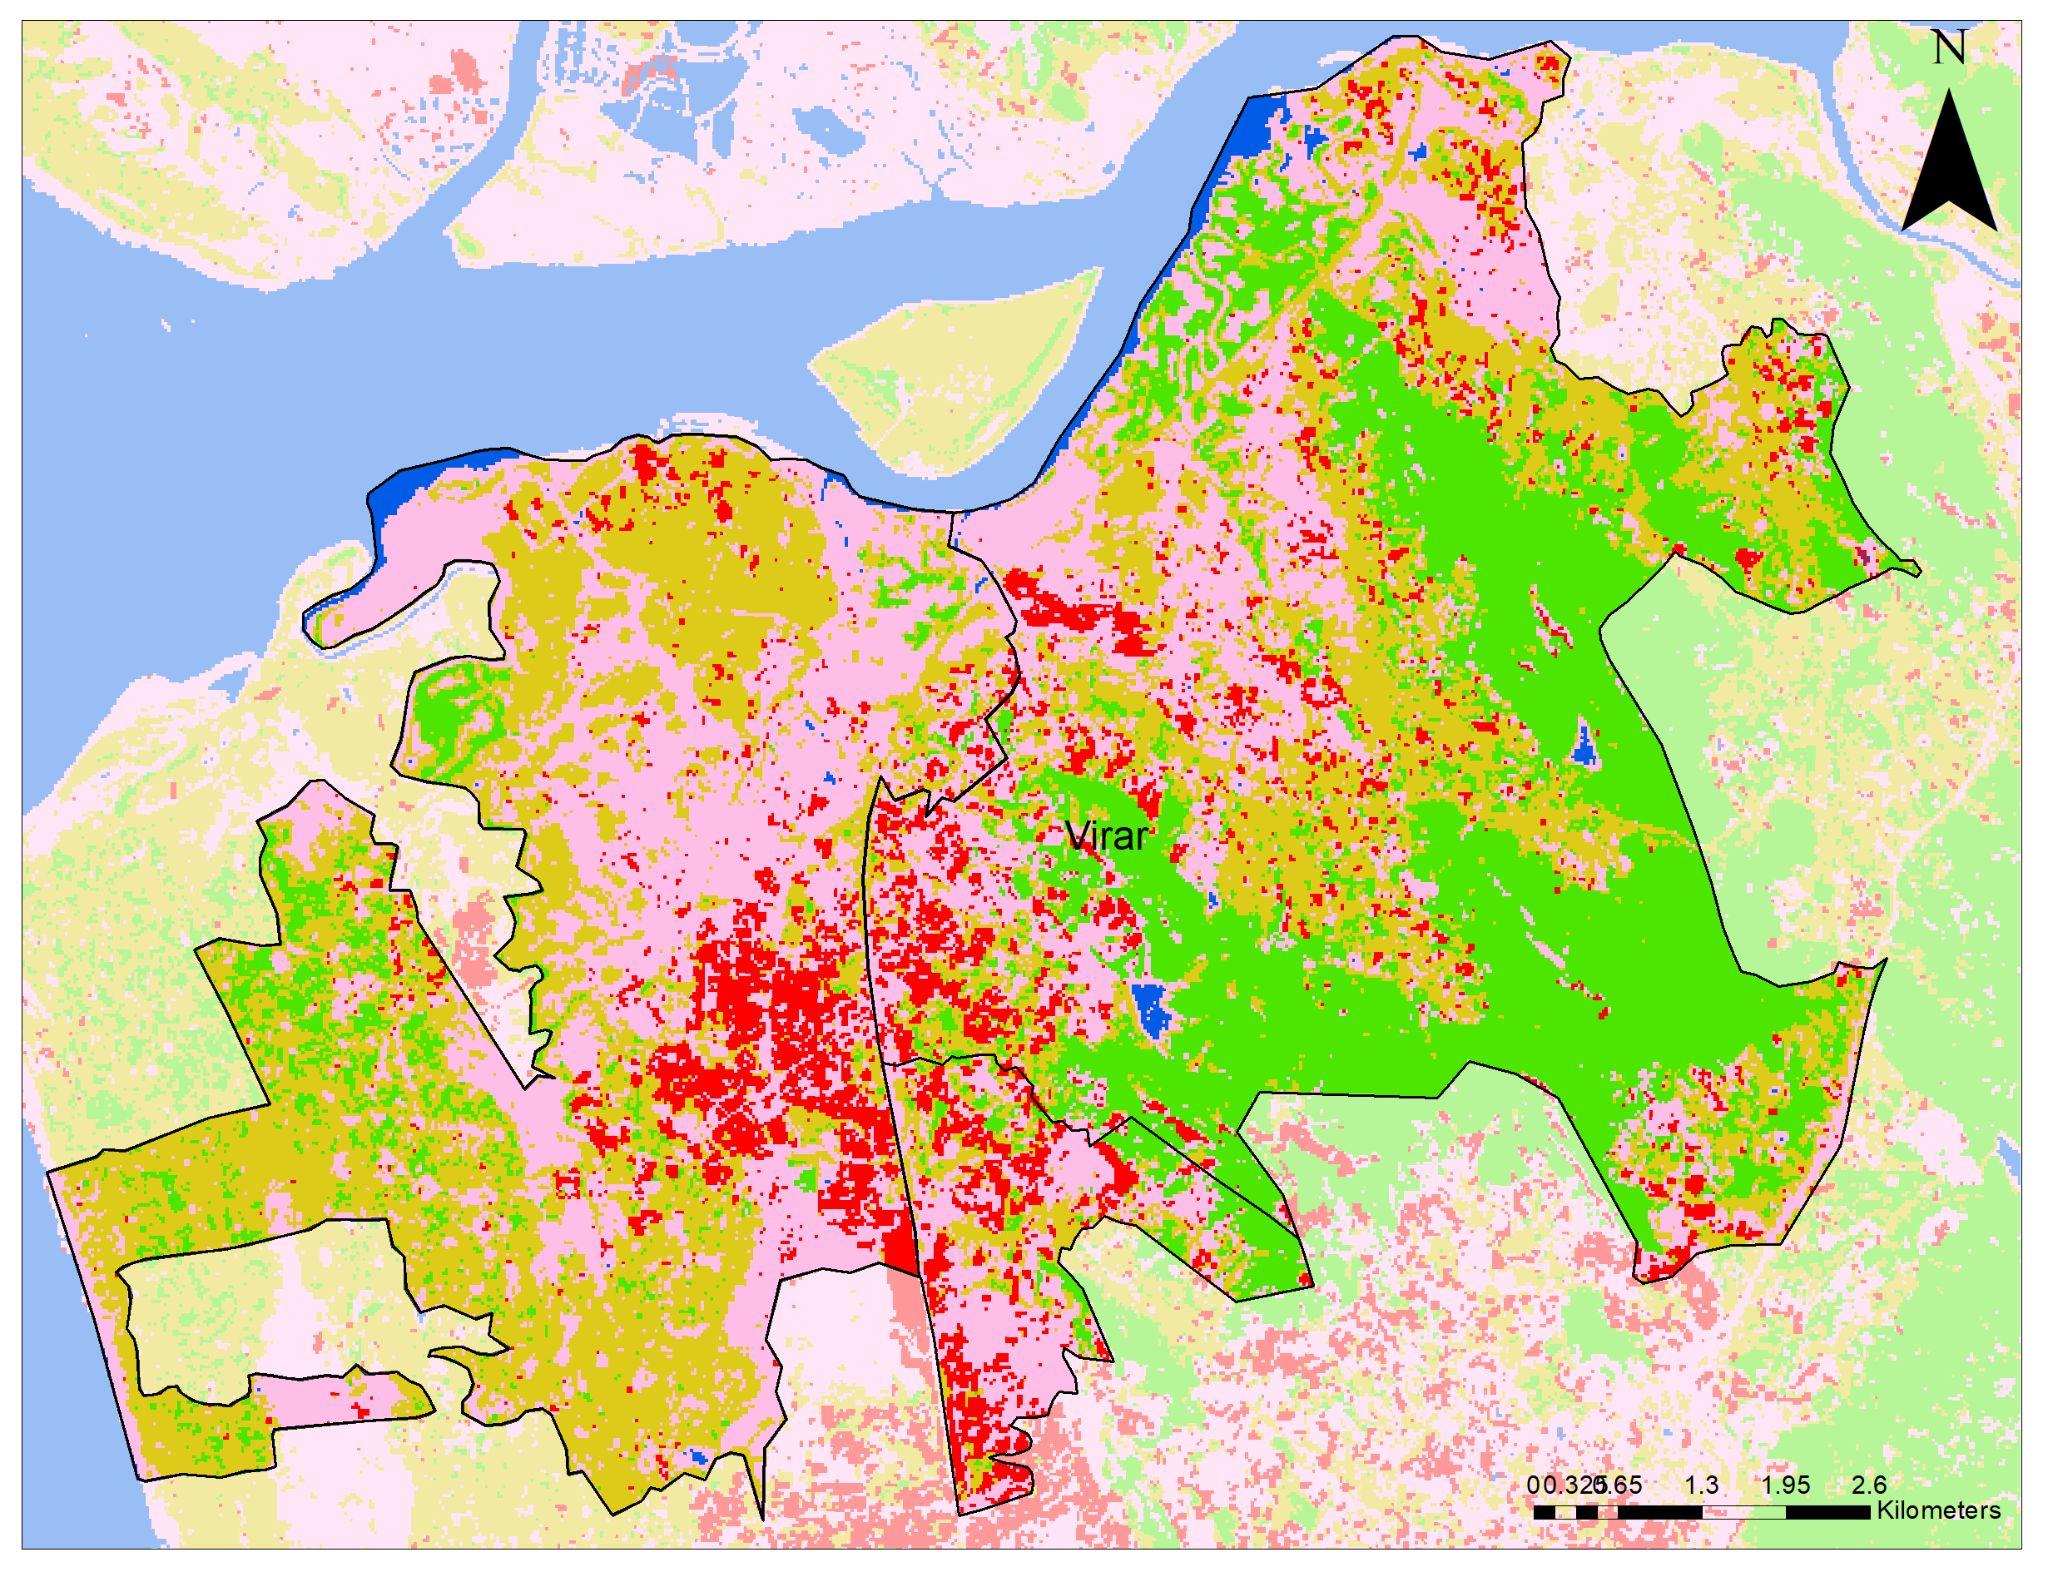
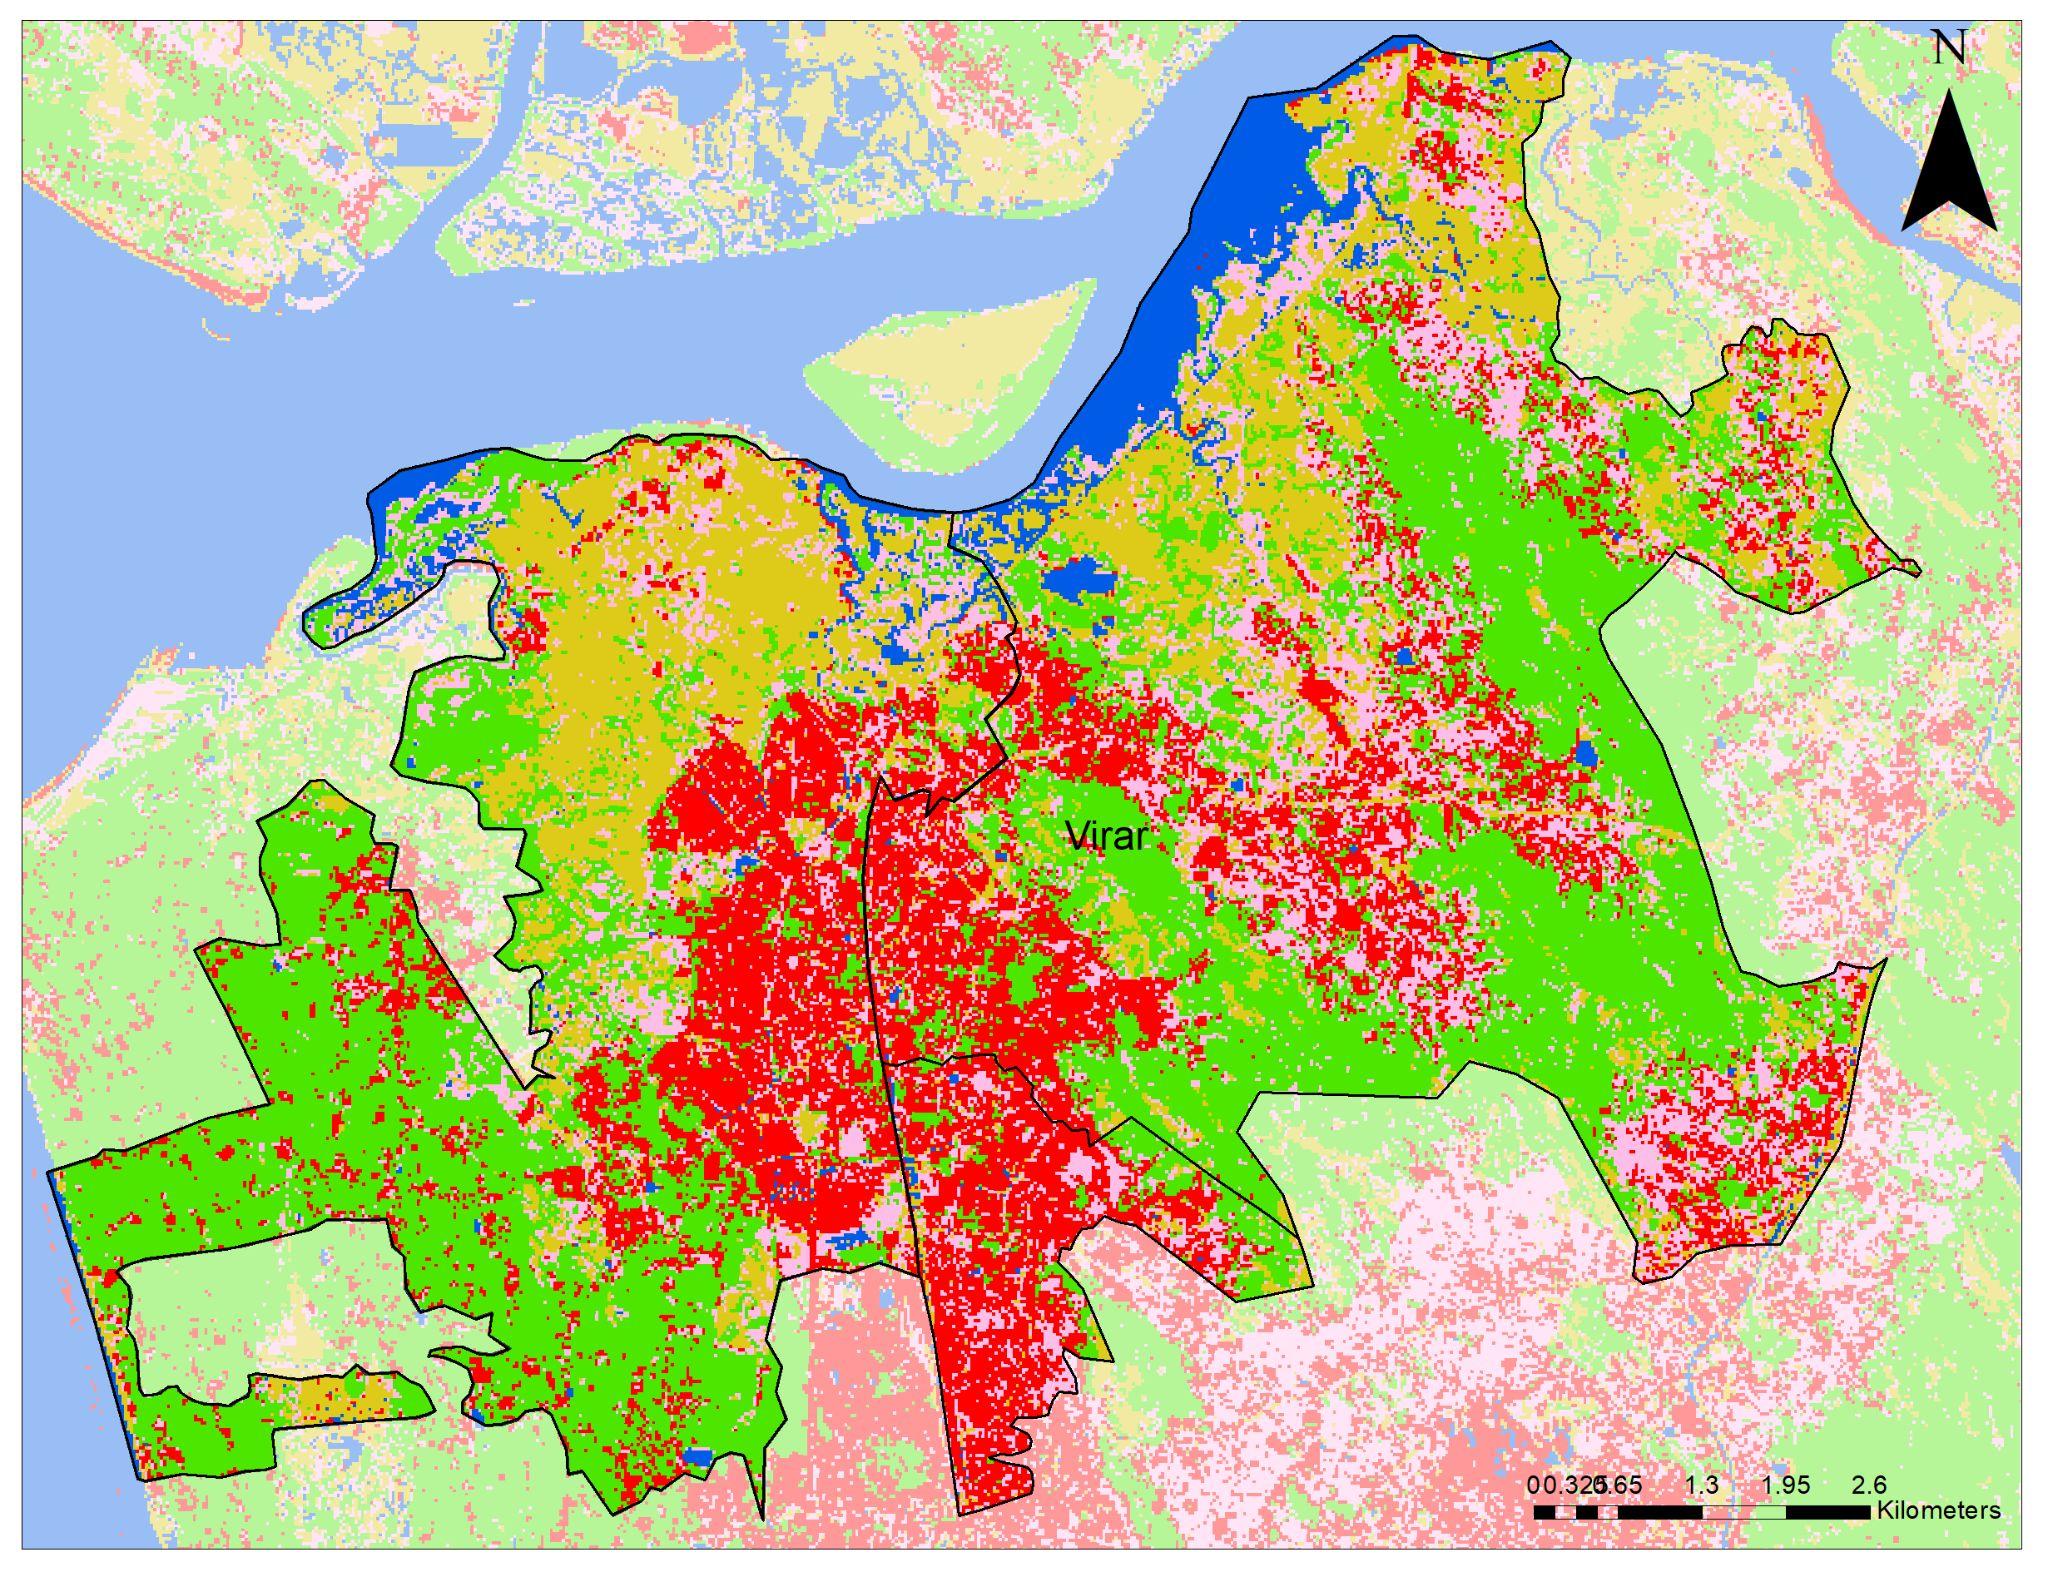
● Percentage Change in Landuse -Land Cover 2008 - 2019 (sq km & %)
● Percentage Built up in restricted areas
● Marking of the major encroachment zones
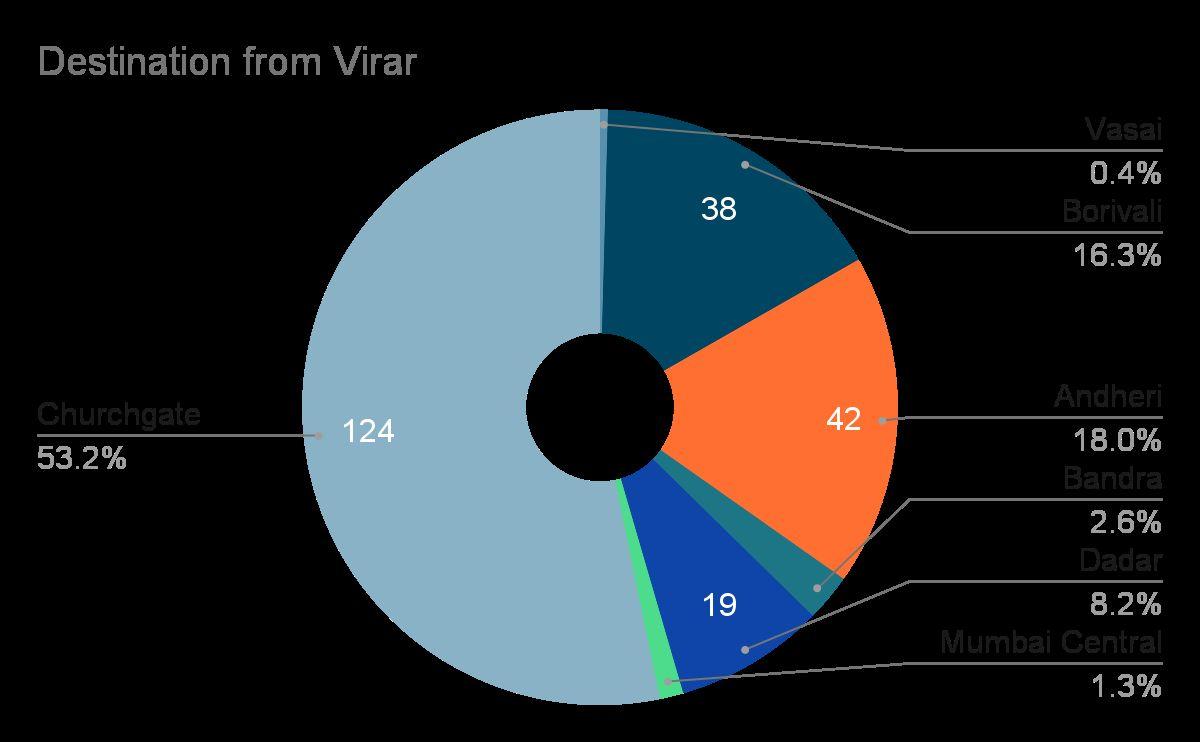
● Destination and No. of train trips from Virar (no.)
● No. of Daily commuters.(no.)
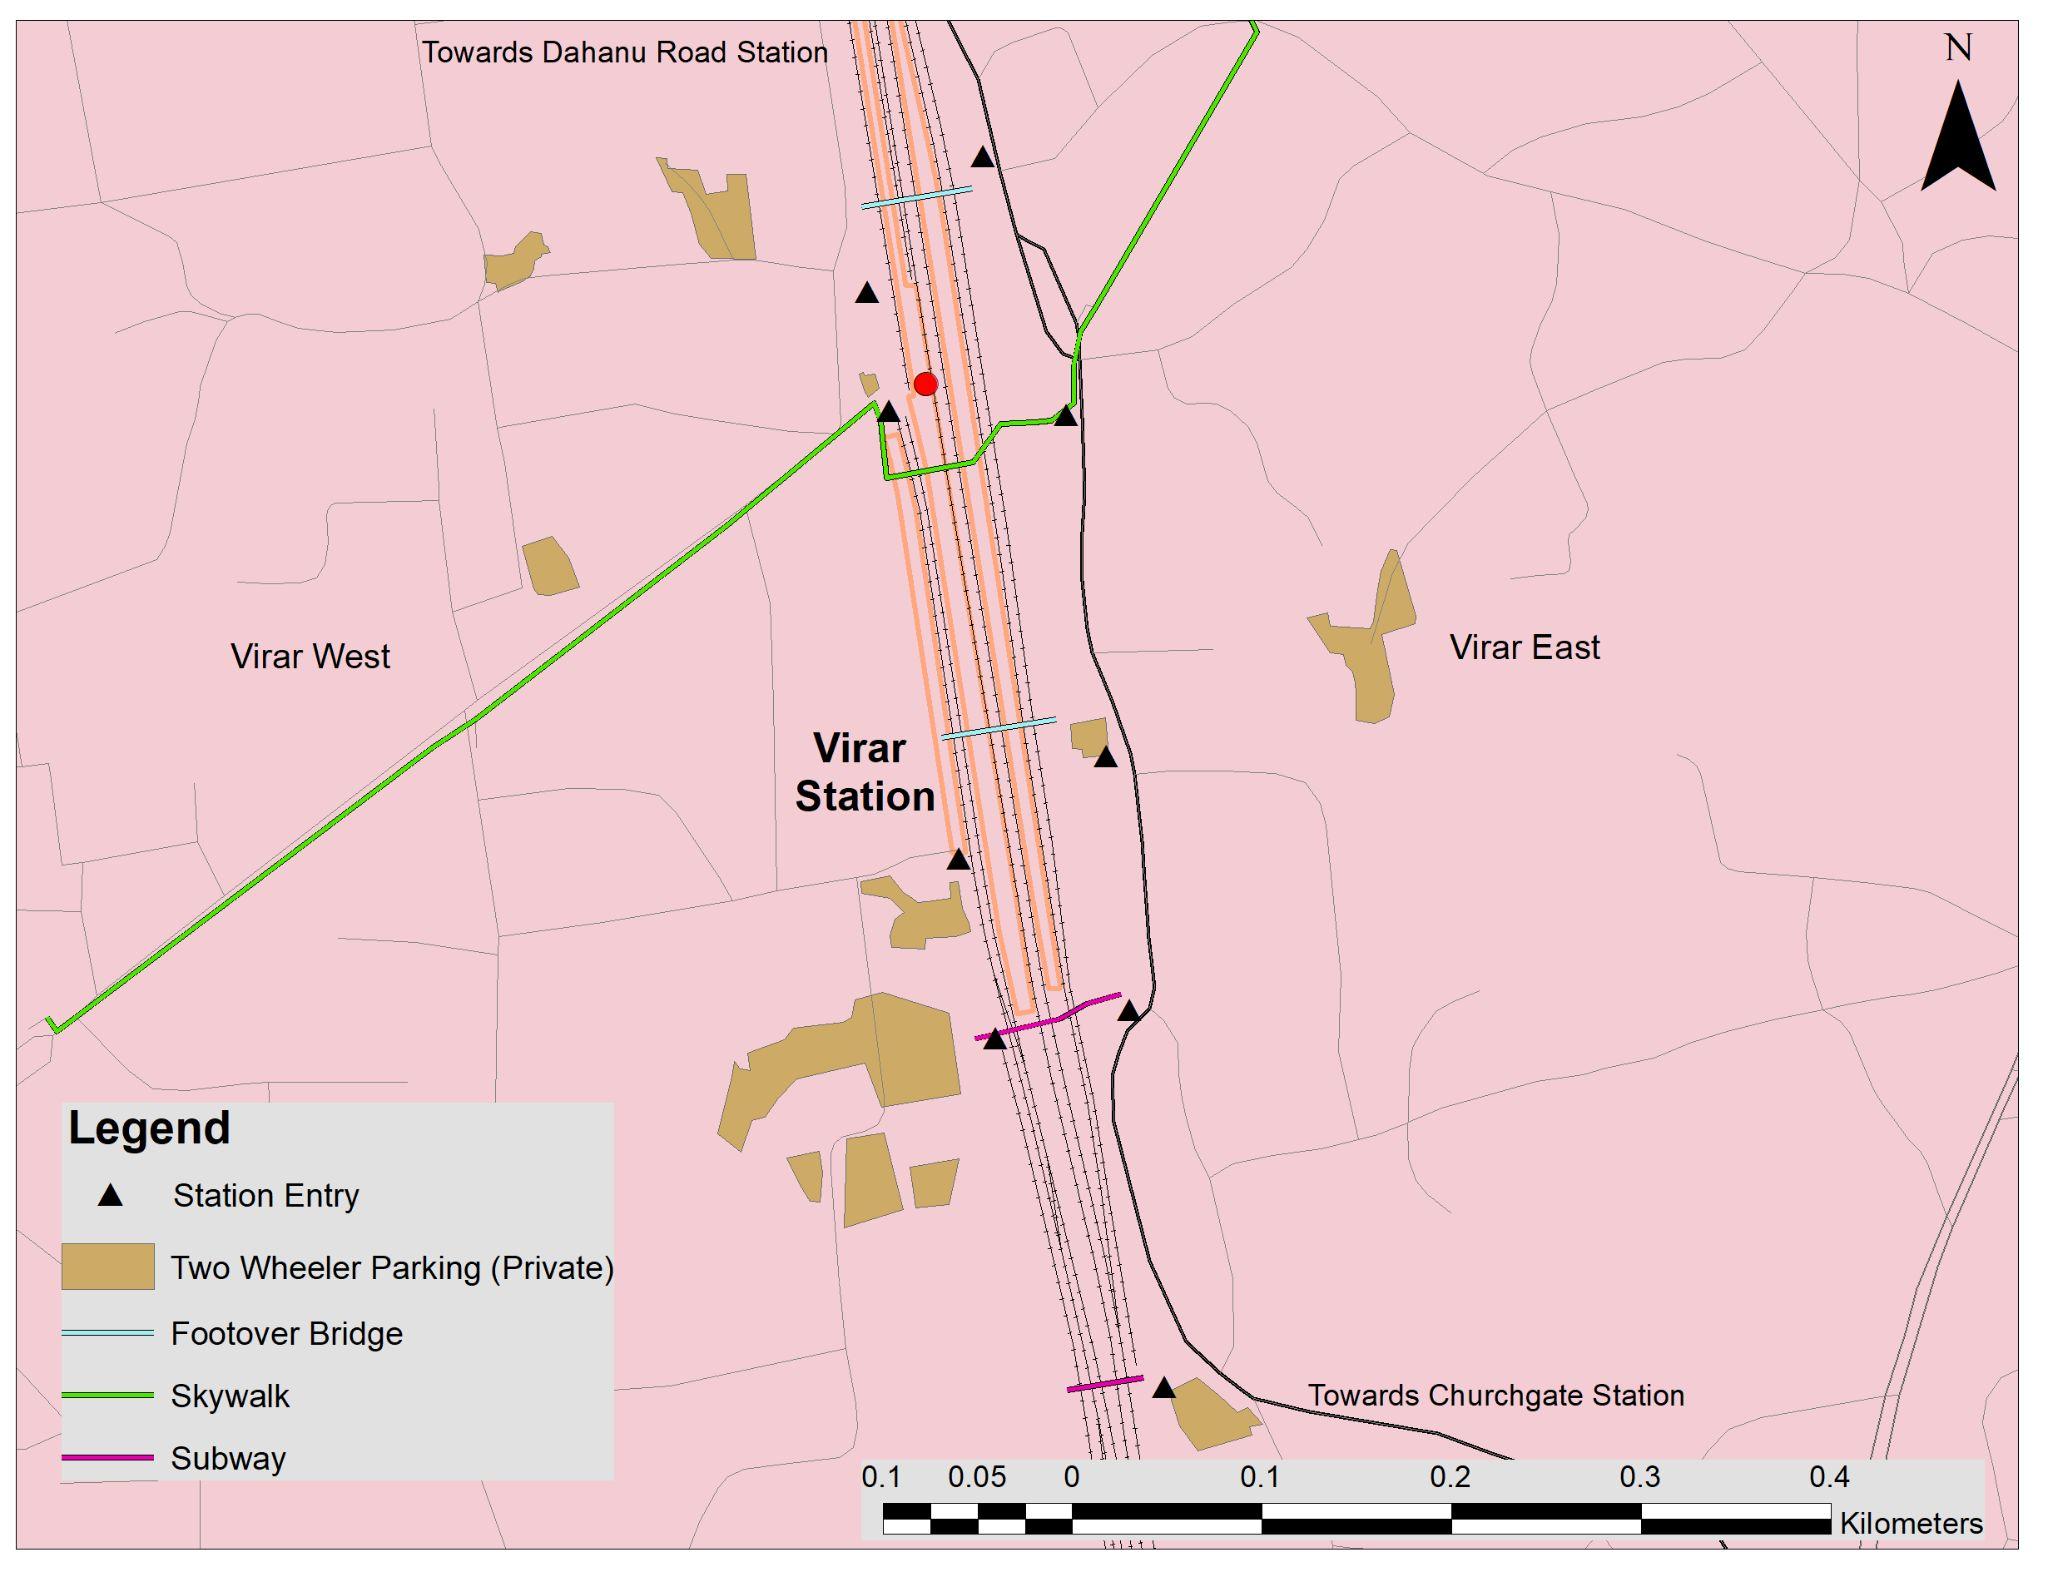
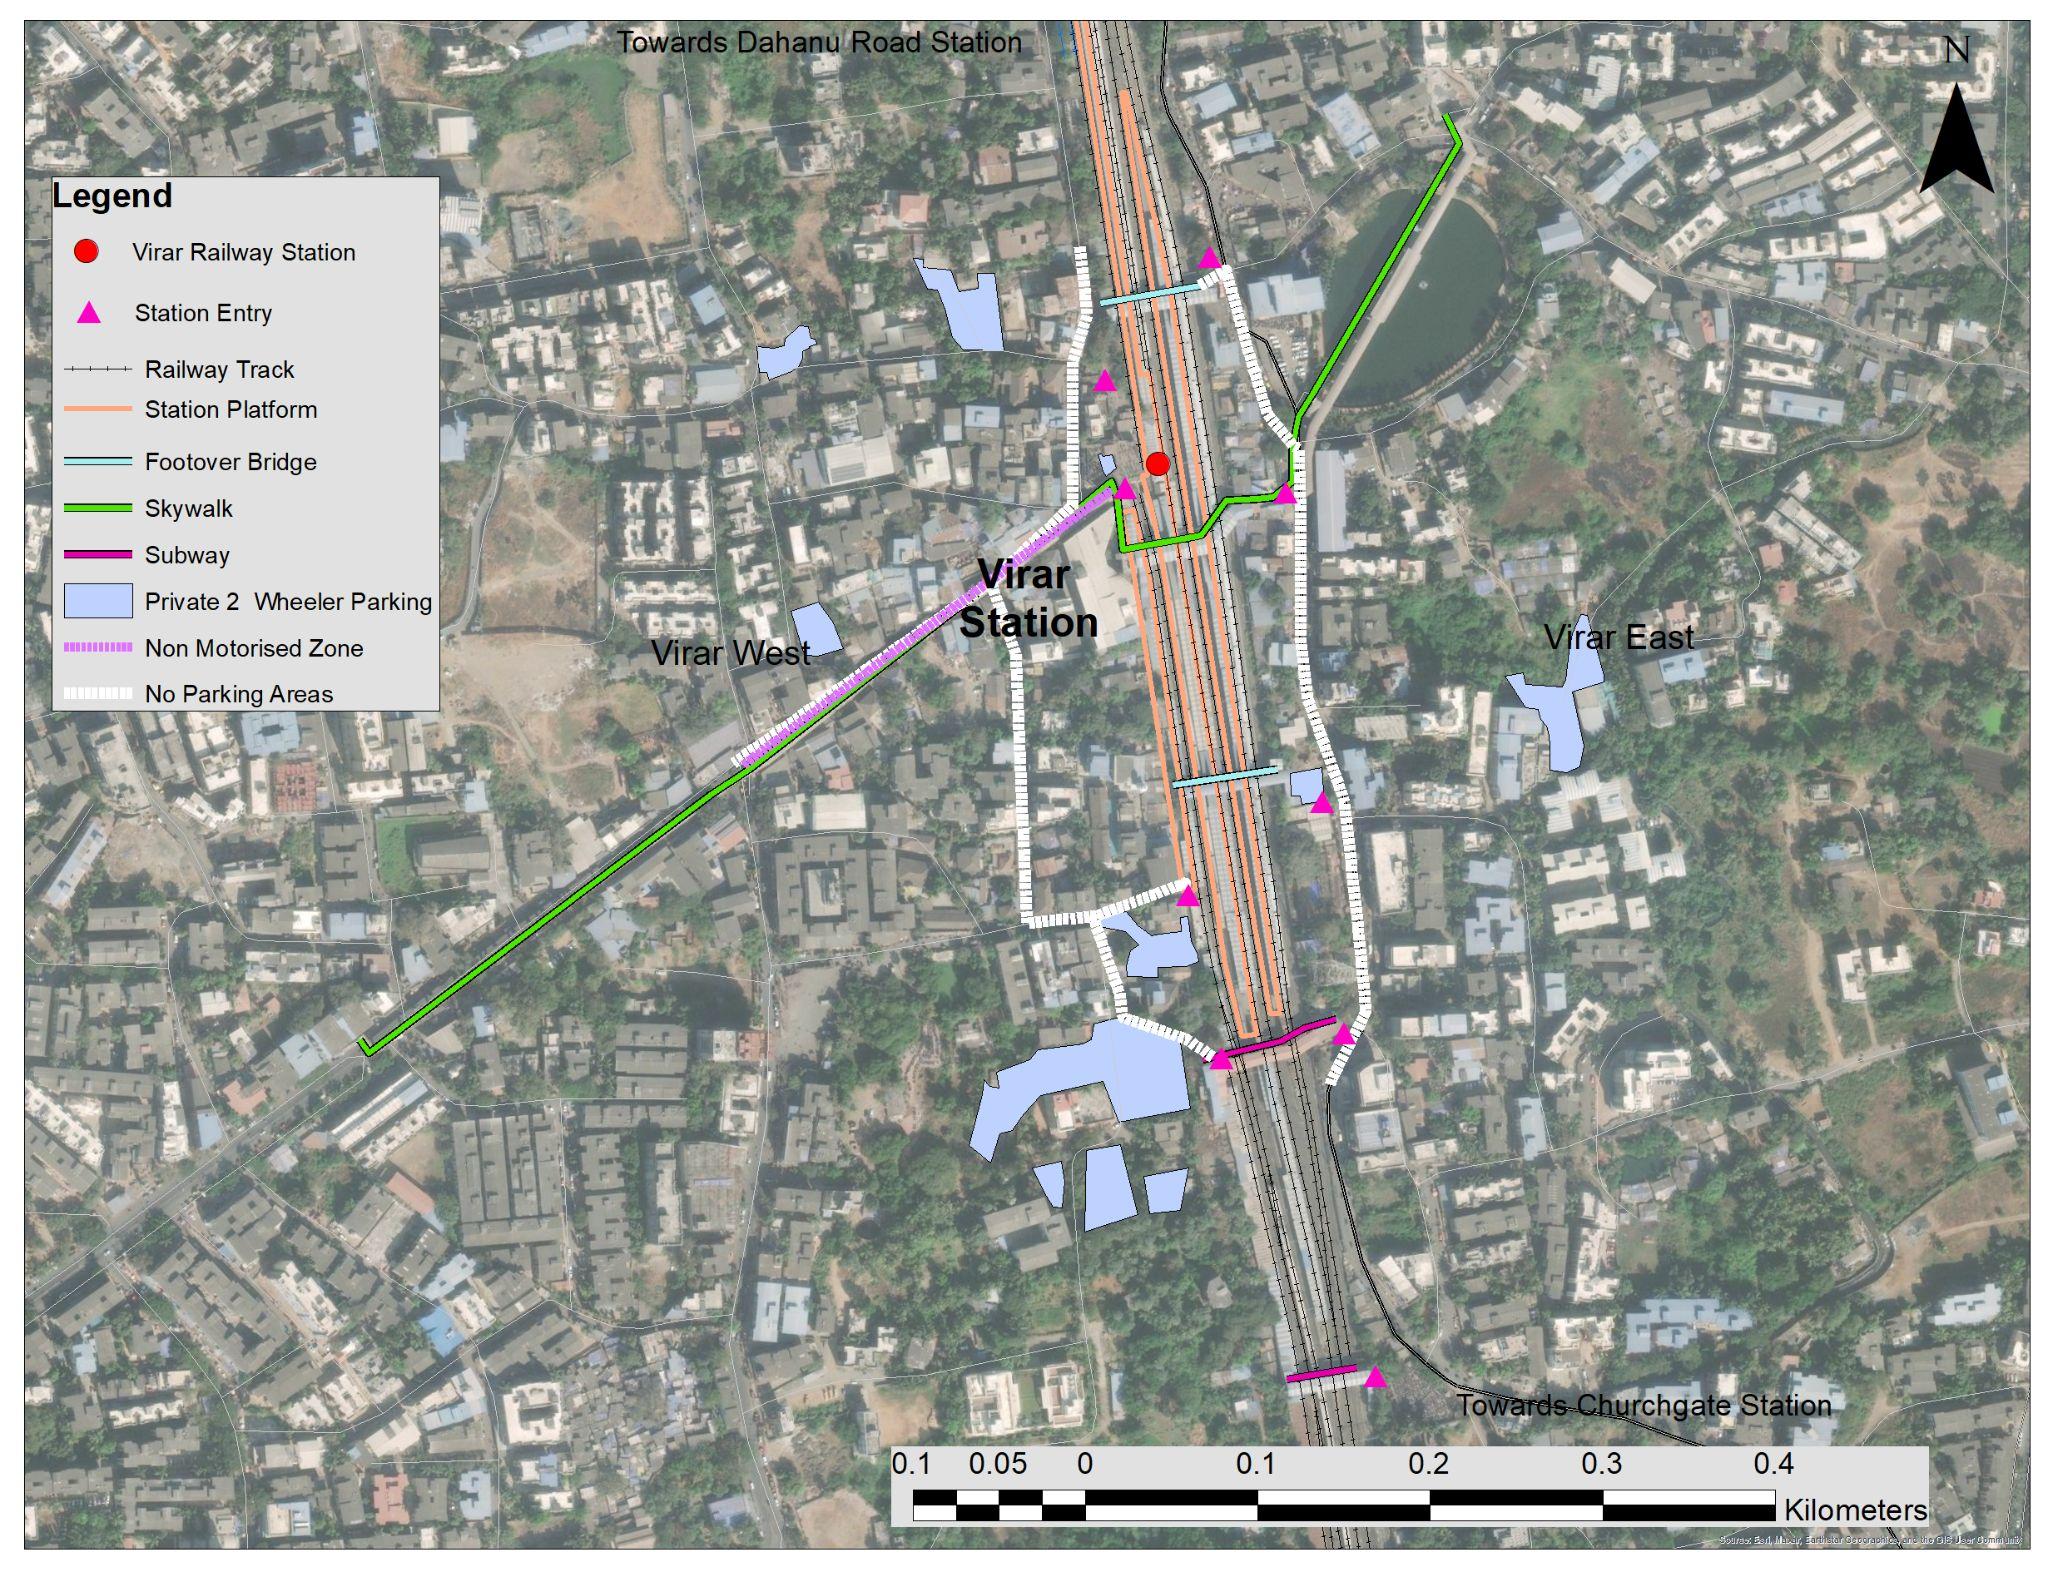
● Detail of Virar Railway Station with entries approach roads and parking.
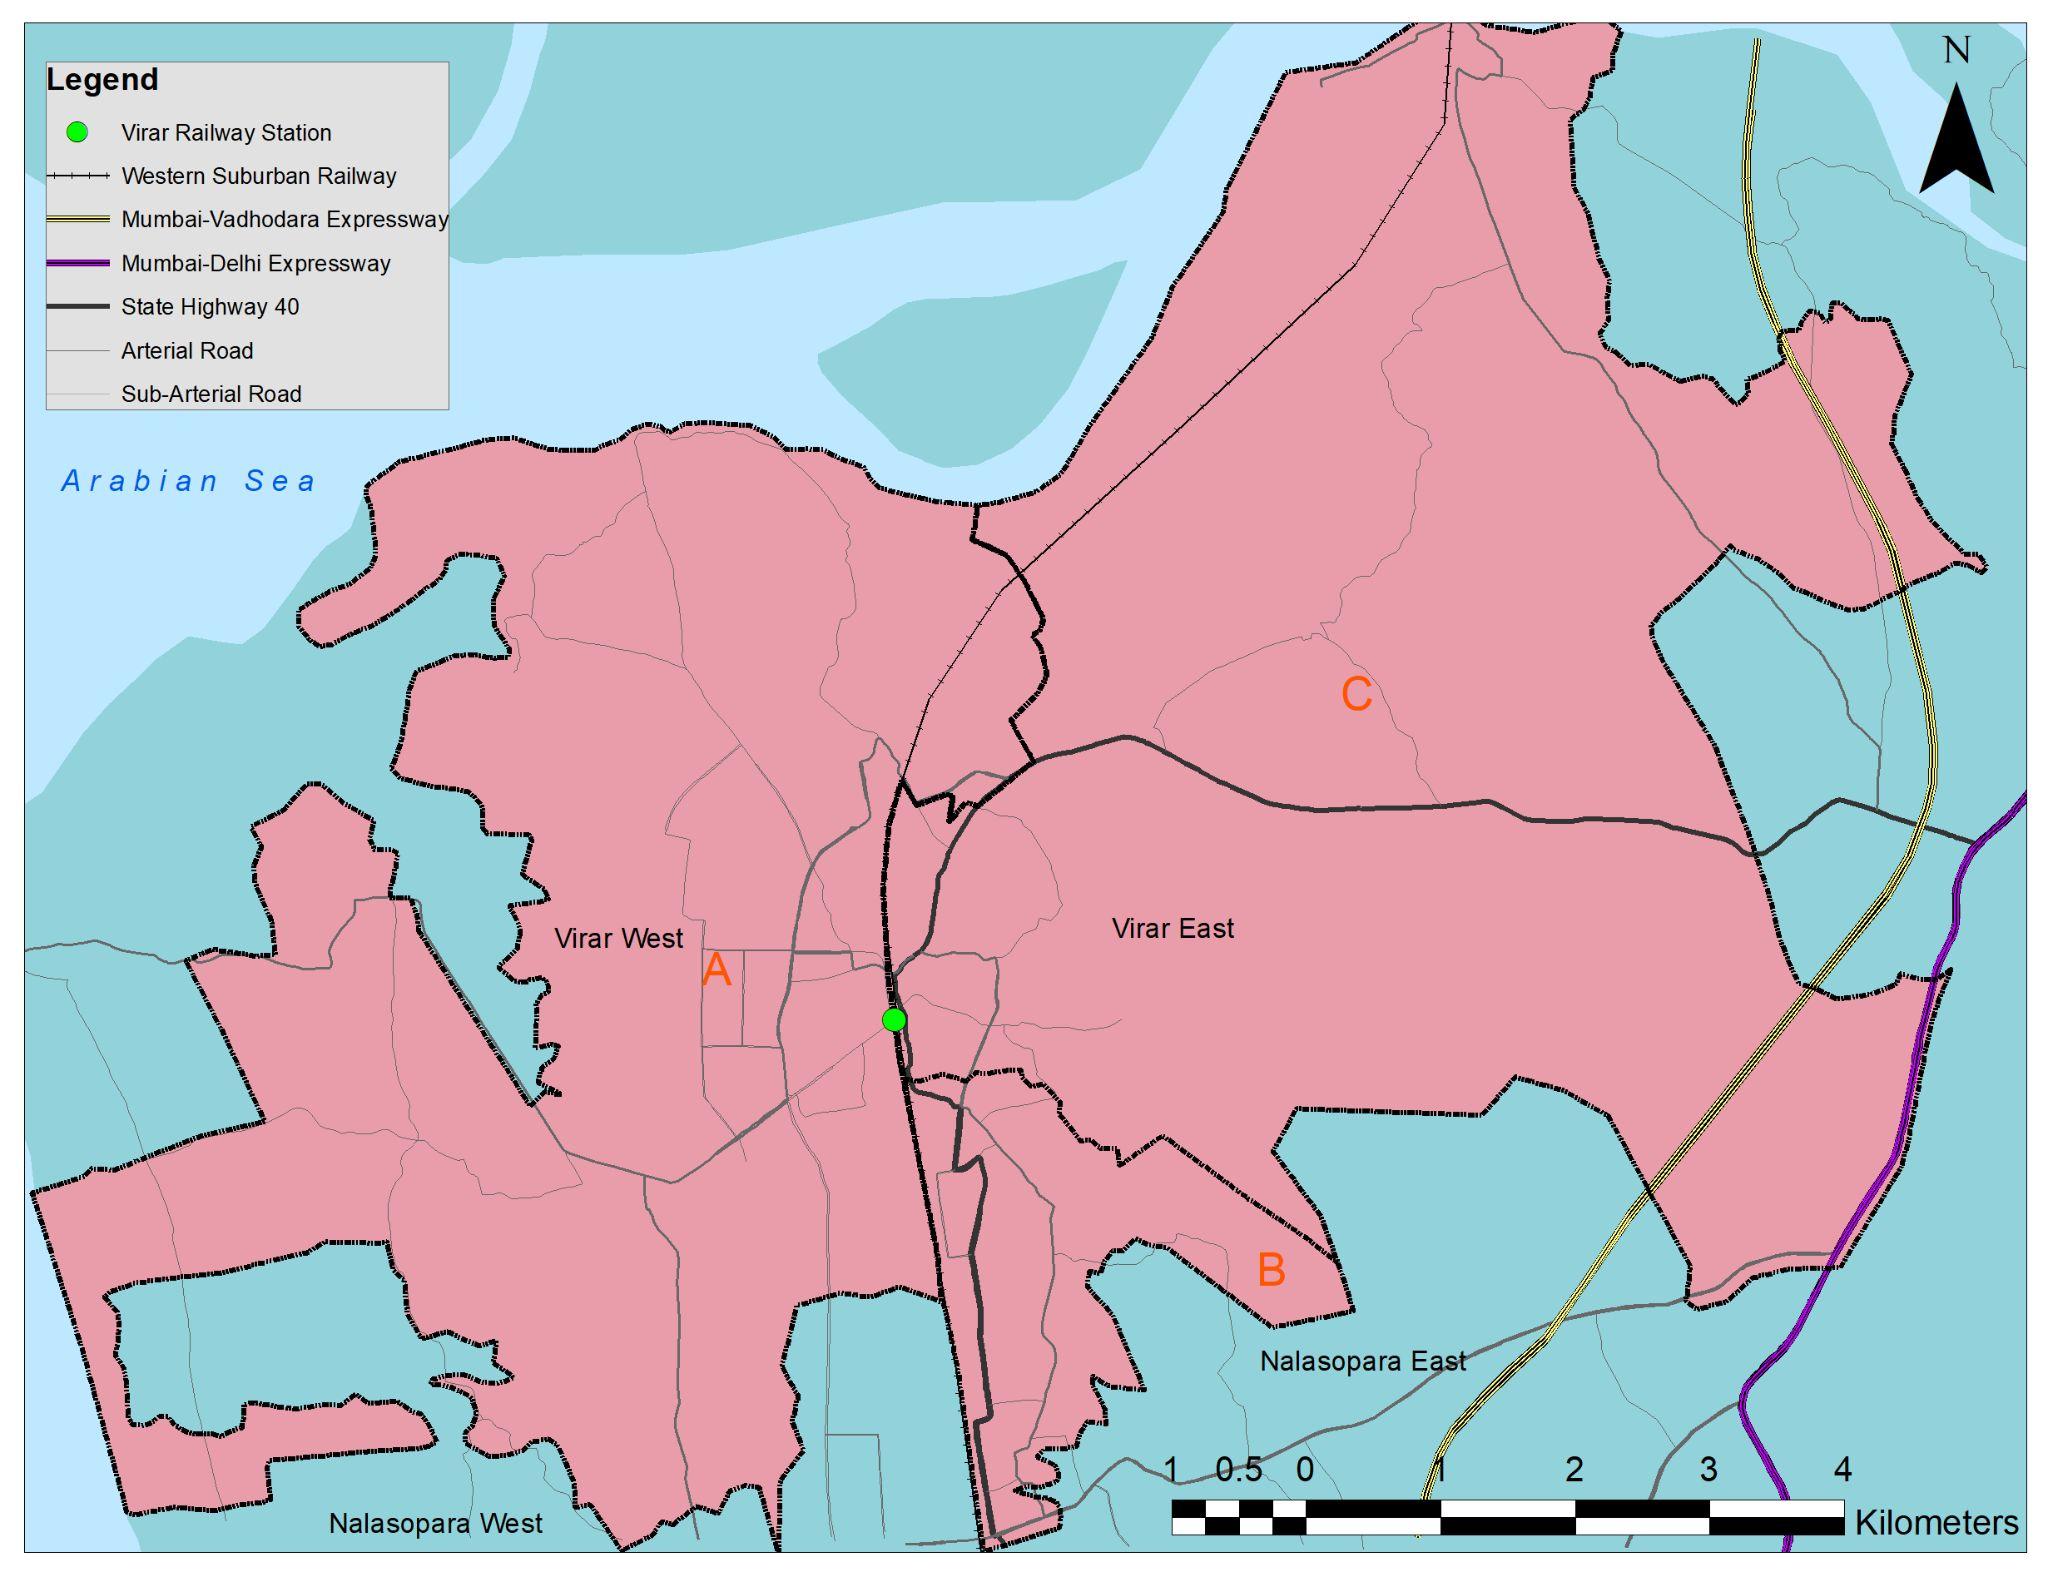
● Classifications of Roads (types and lengths in km)
● Comparison of road lengths of each category.
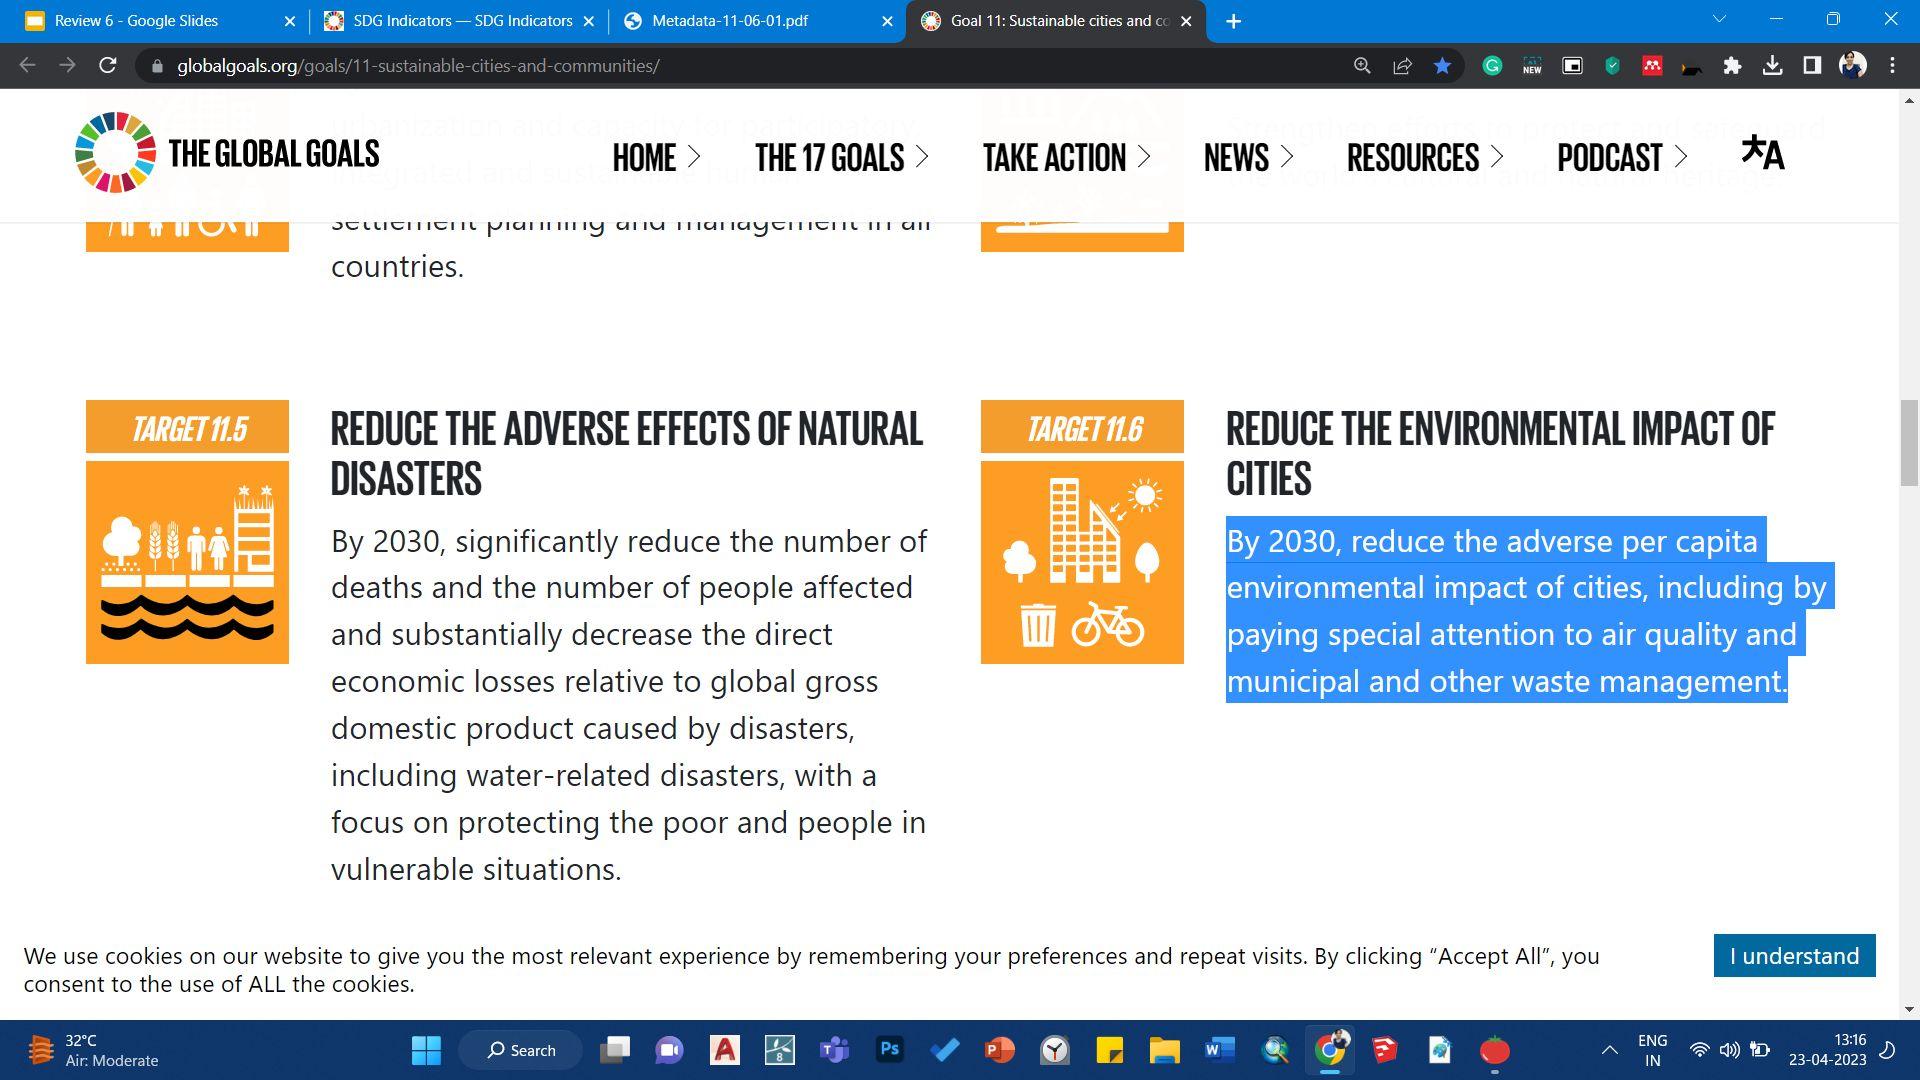
11.6.: Reduce the environmental Impact of cities-AirQuality
11.7: Provide Access to SafeandInclusiveGreen andPublicSpaces Open Public Spaces
11.6.1 Reduce the environmental Impact of cities-SWM Solid Waste Management
6.1: Safe and Affordable DrinkingWater Water Supply
3.8: Achieve Universal HealthCoverage Health Care
4.1. Free Primary and SecondaryEducation Education
3 To review the existing governance, acts and policies to monitor the growth of the city.
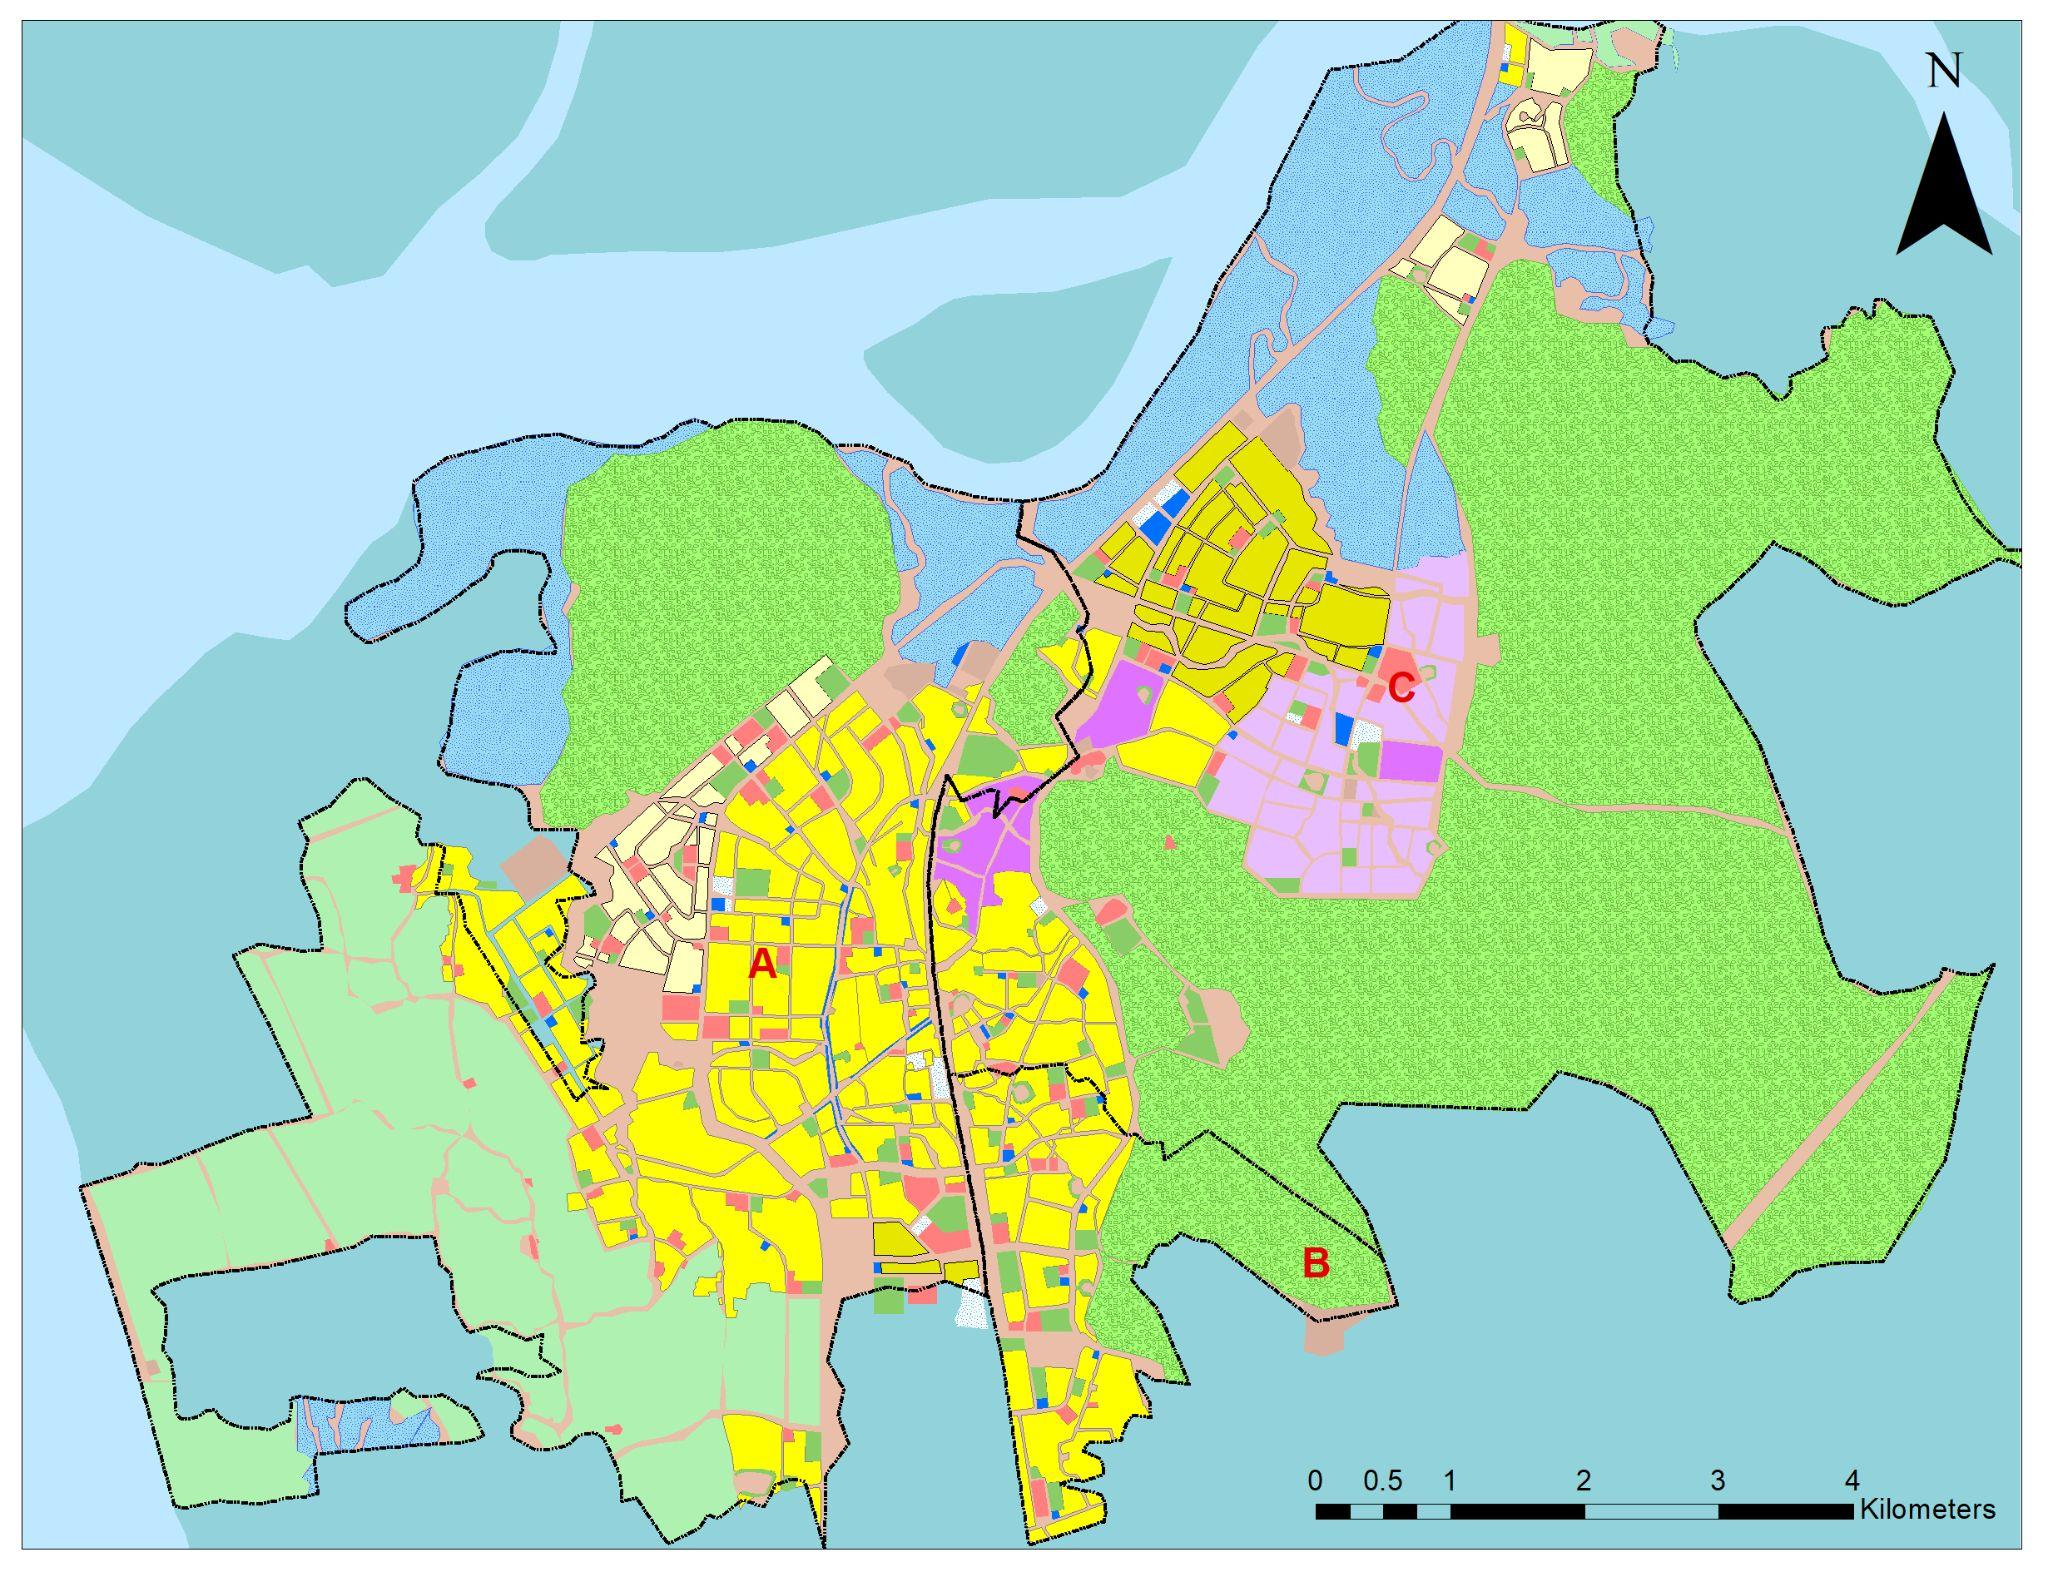
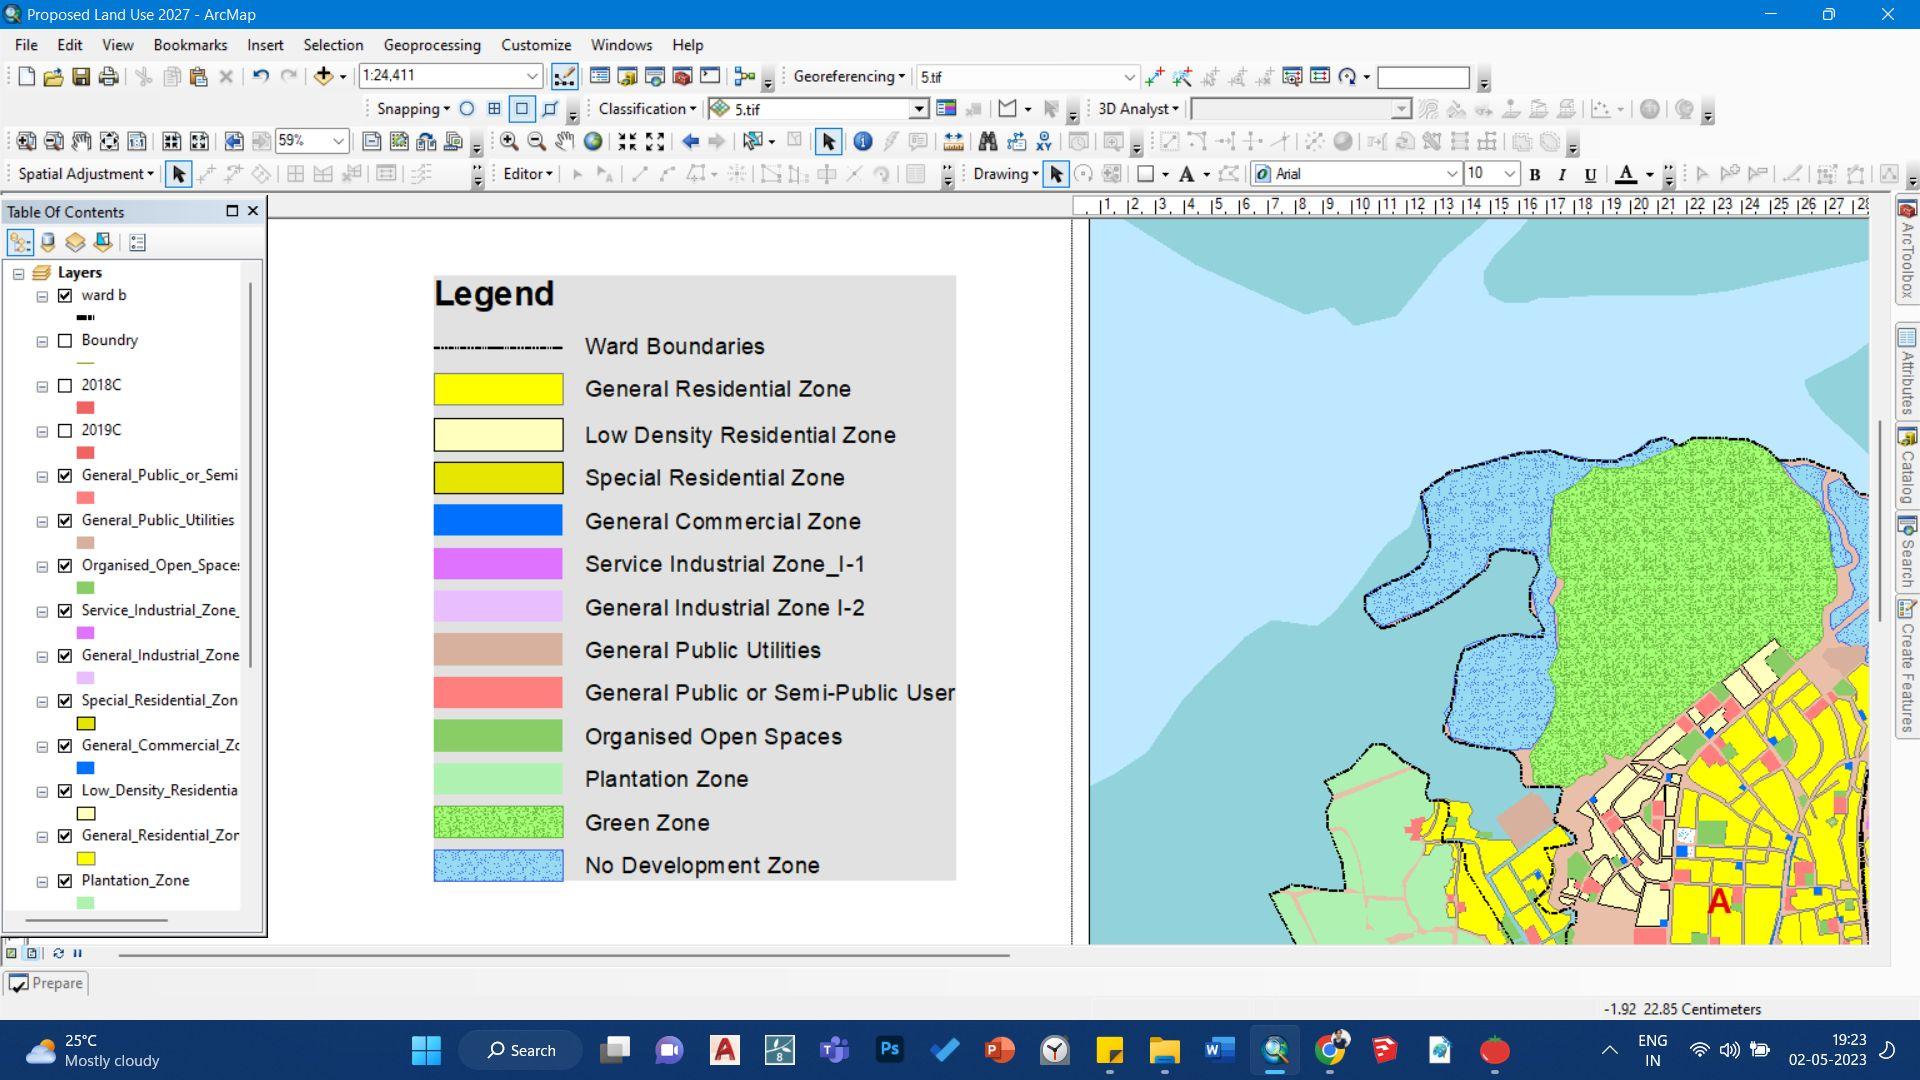
● Percentage change in Existing Land Use in comparison of the proposed Land Use map 2027 (sq km & %)
● Percentage increase in encroachment in restricted areas
● Density of Roads (km/sq km)
● Marking of Conflict points, eg Parking, Bottlenecks Traffic Areas, Hawkers, Encroachment of footpath and Streets.
● No. of Busses, trips, bus stops
● Proportion of population that has convenient access to public transport
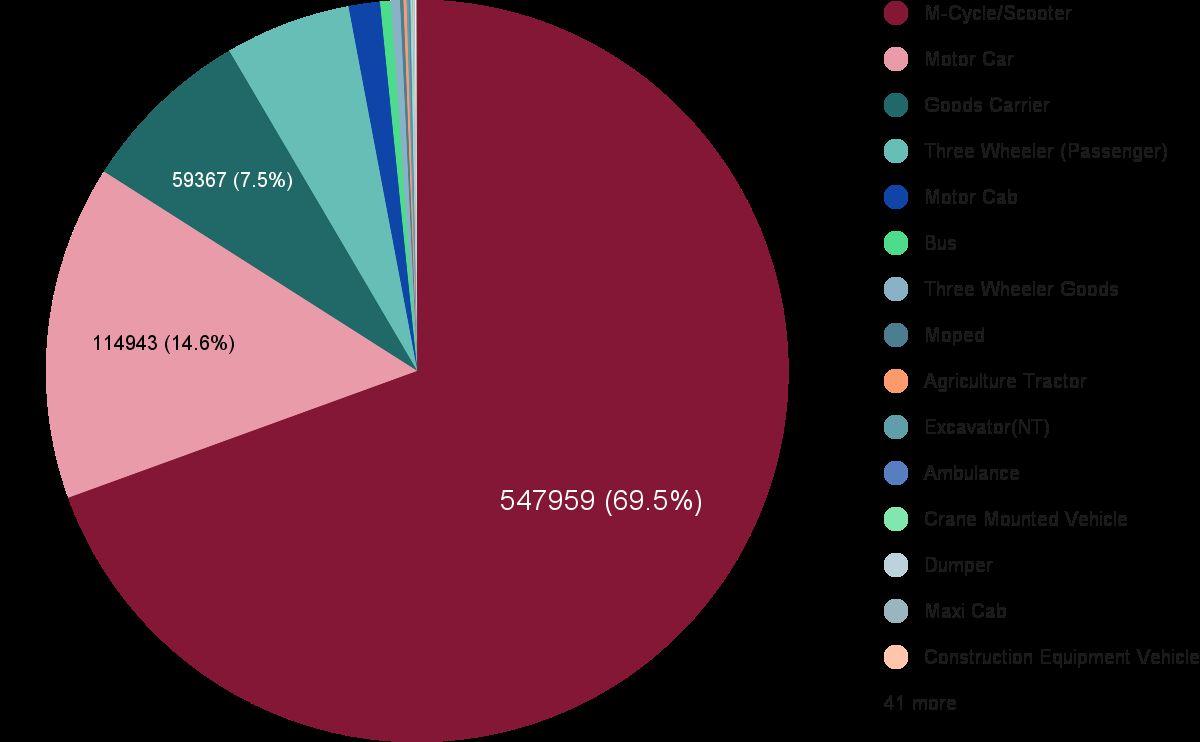
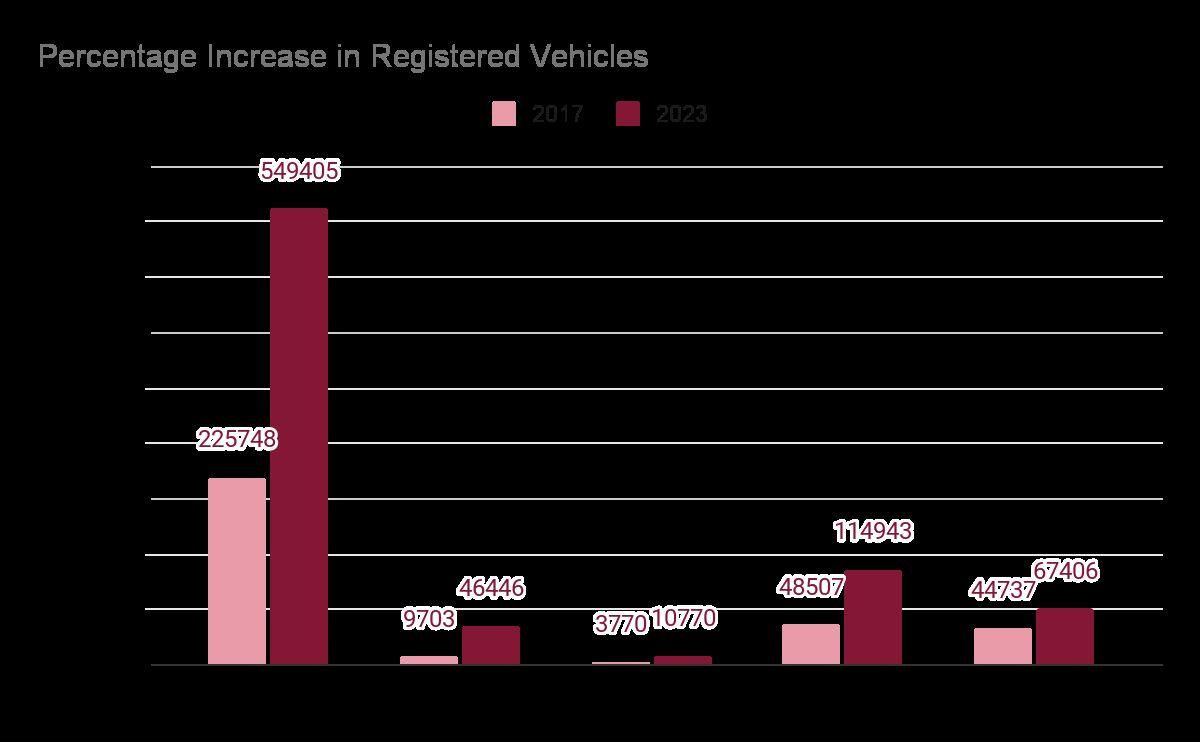
● Percentage increase in No. of Vehicles registered. (%)
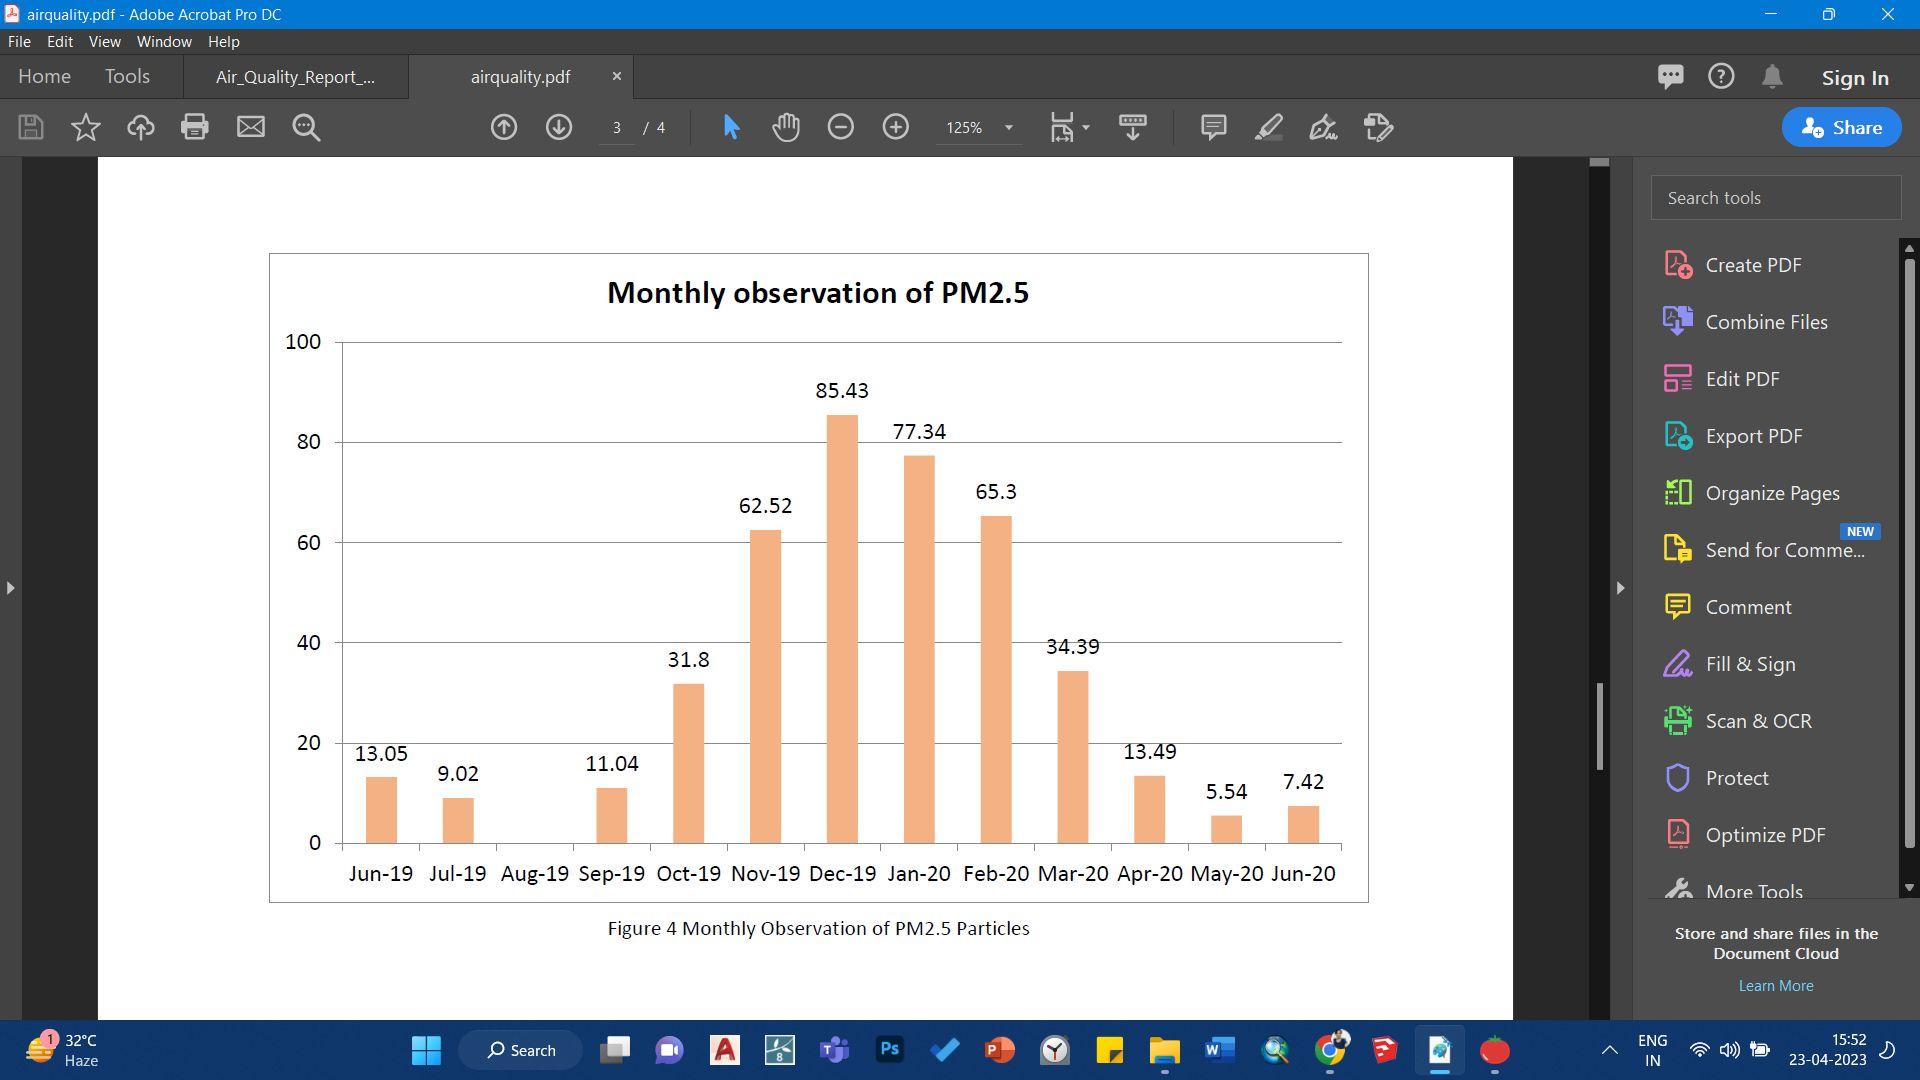
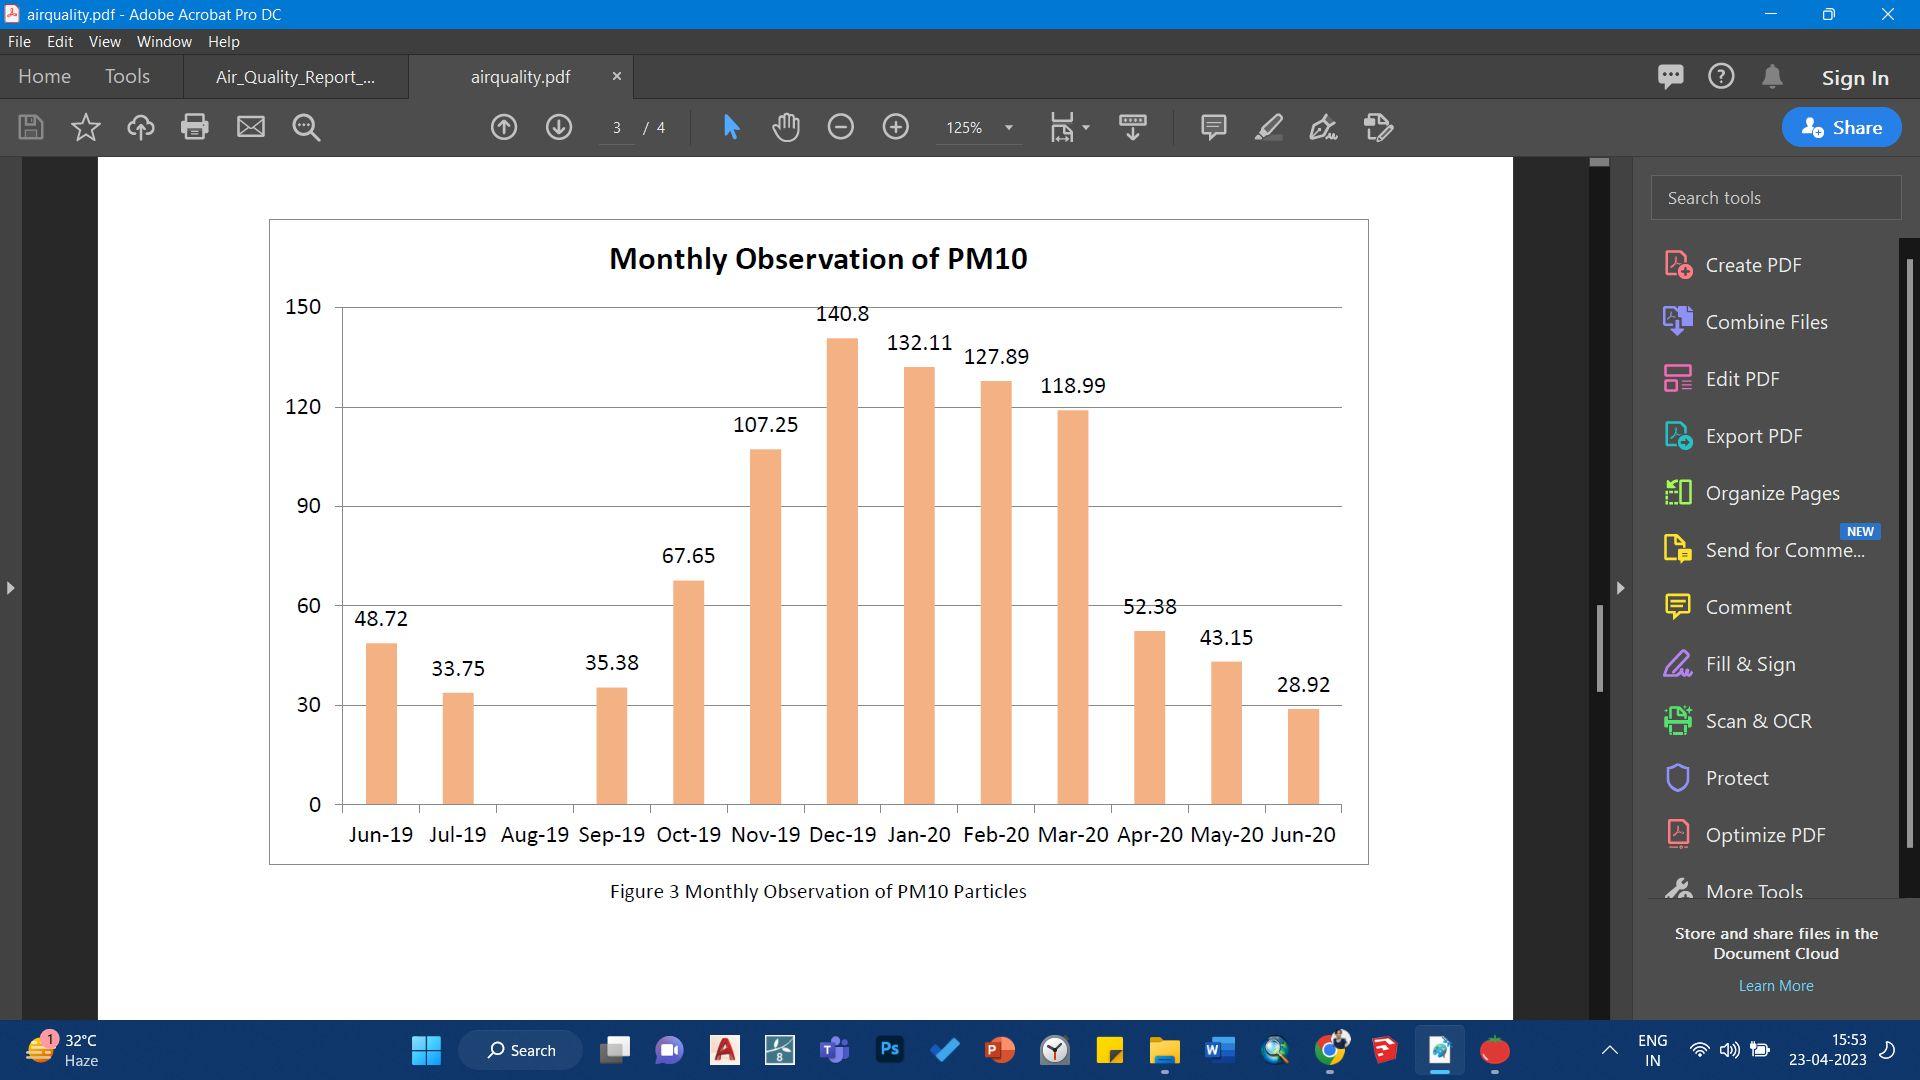
● Annual mean levels of fine particulate matter (e.g. PM2.5 and PM10) in the city.
● Air quality mapping at various monitoring centers in Virar.
● Share of occupied land by Open Public Space, existing and proposed (%)
● Share of population with access to open space in public spaces (%)
● Share of built-up area of the city that is open space in public use (%)
● Proportion of municipal solid waste collected and managed in controlled facilities out of total municipal waste generated
● MSW collected
● MSW managed in controlled facilities
● Service Level Benchmarks
● Proportion of population using safely managed drinking water services.
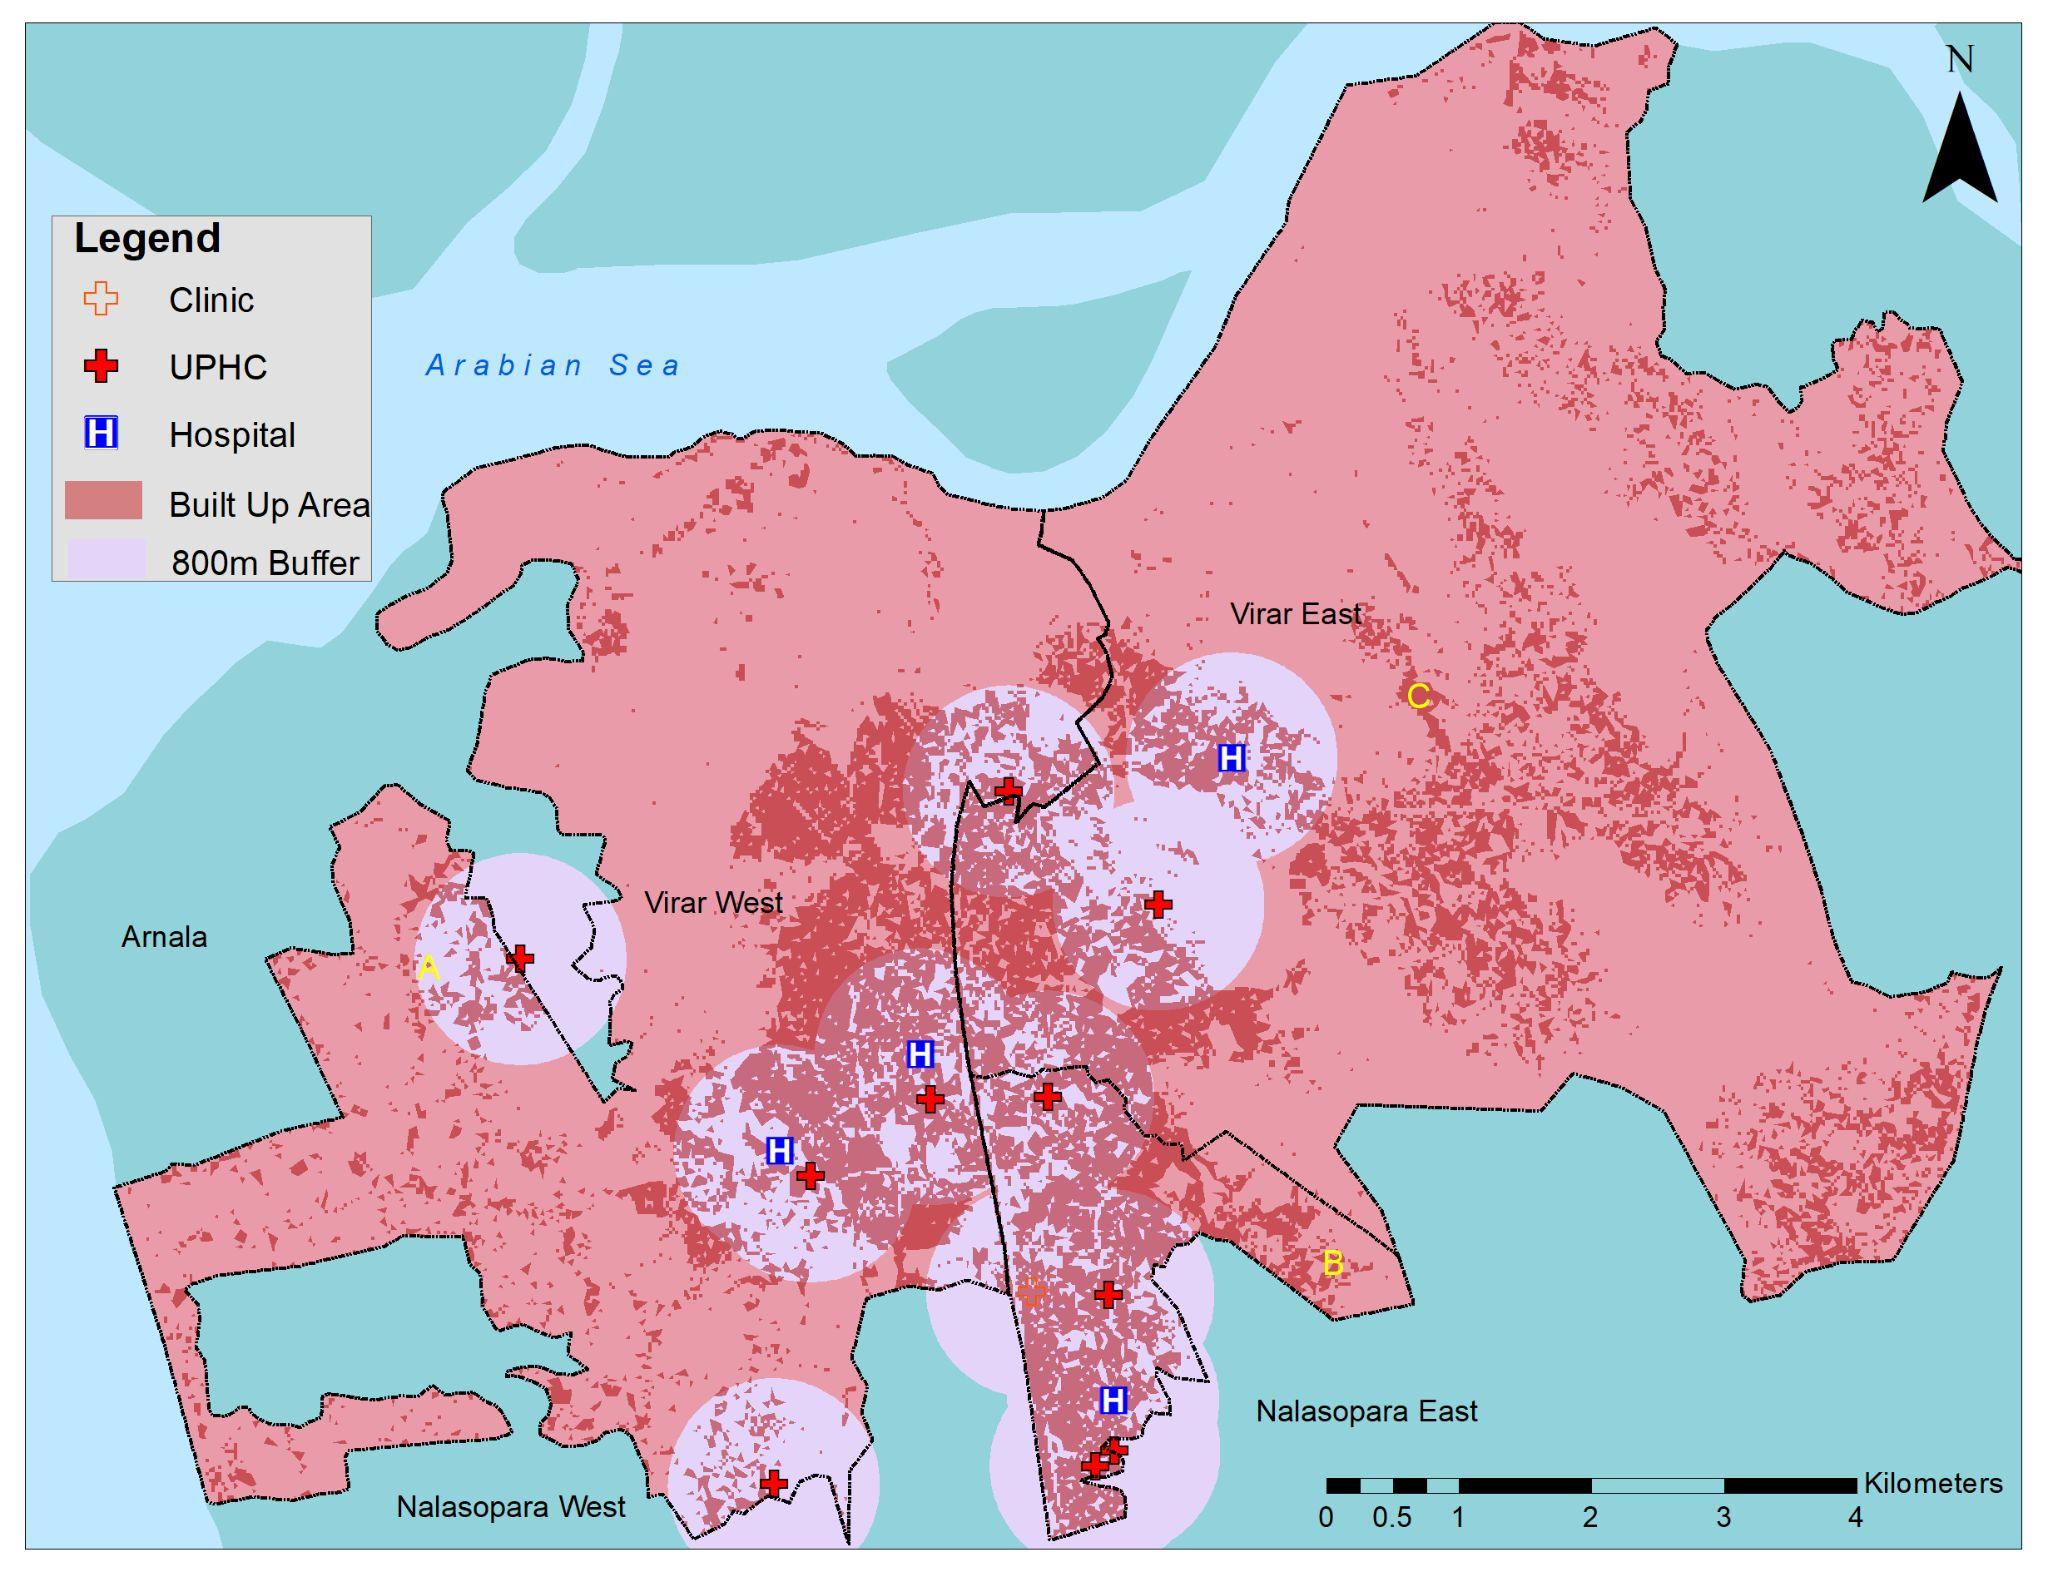
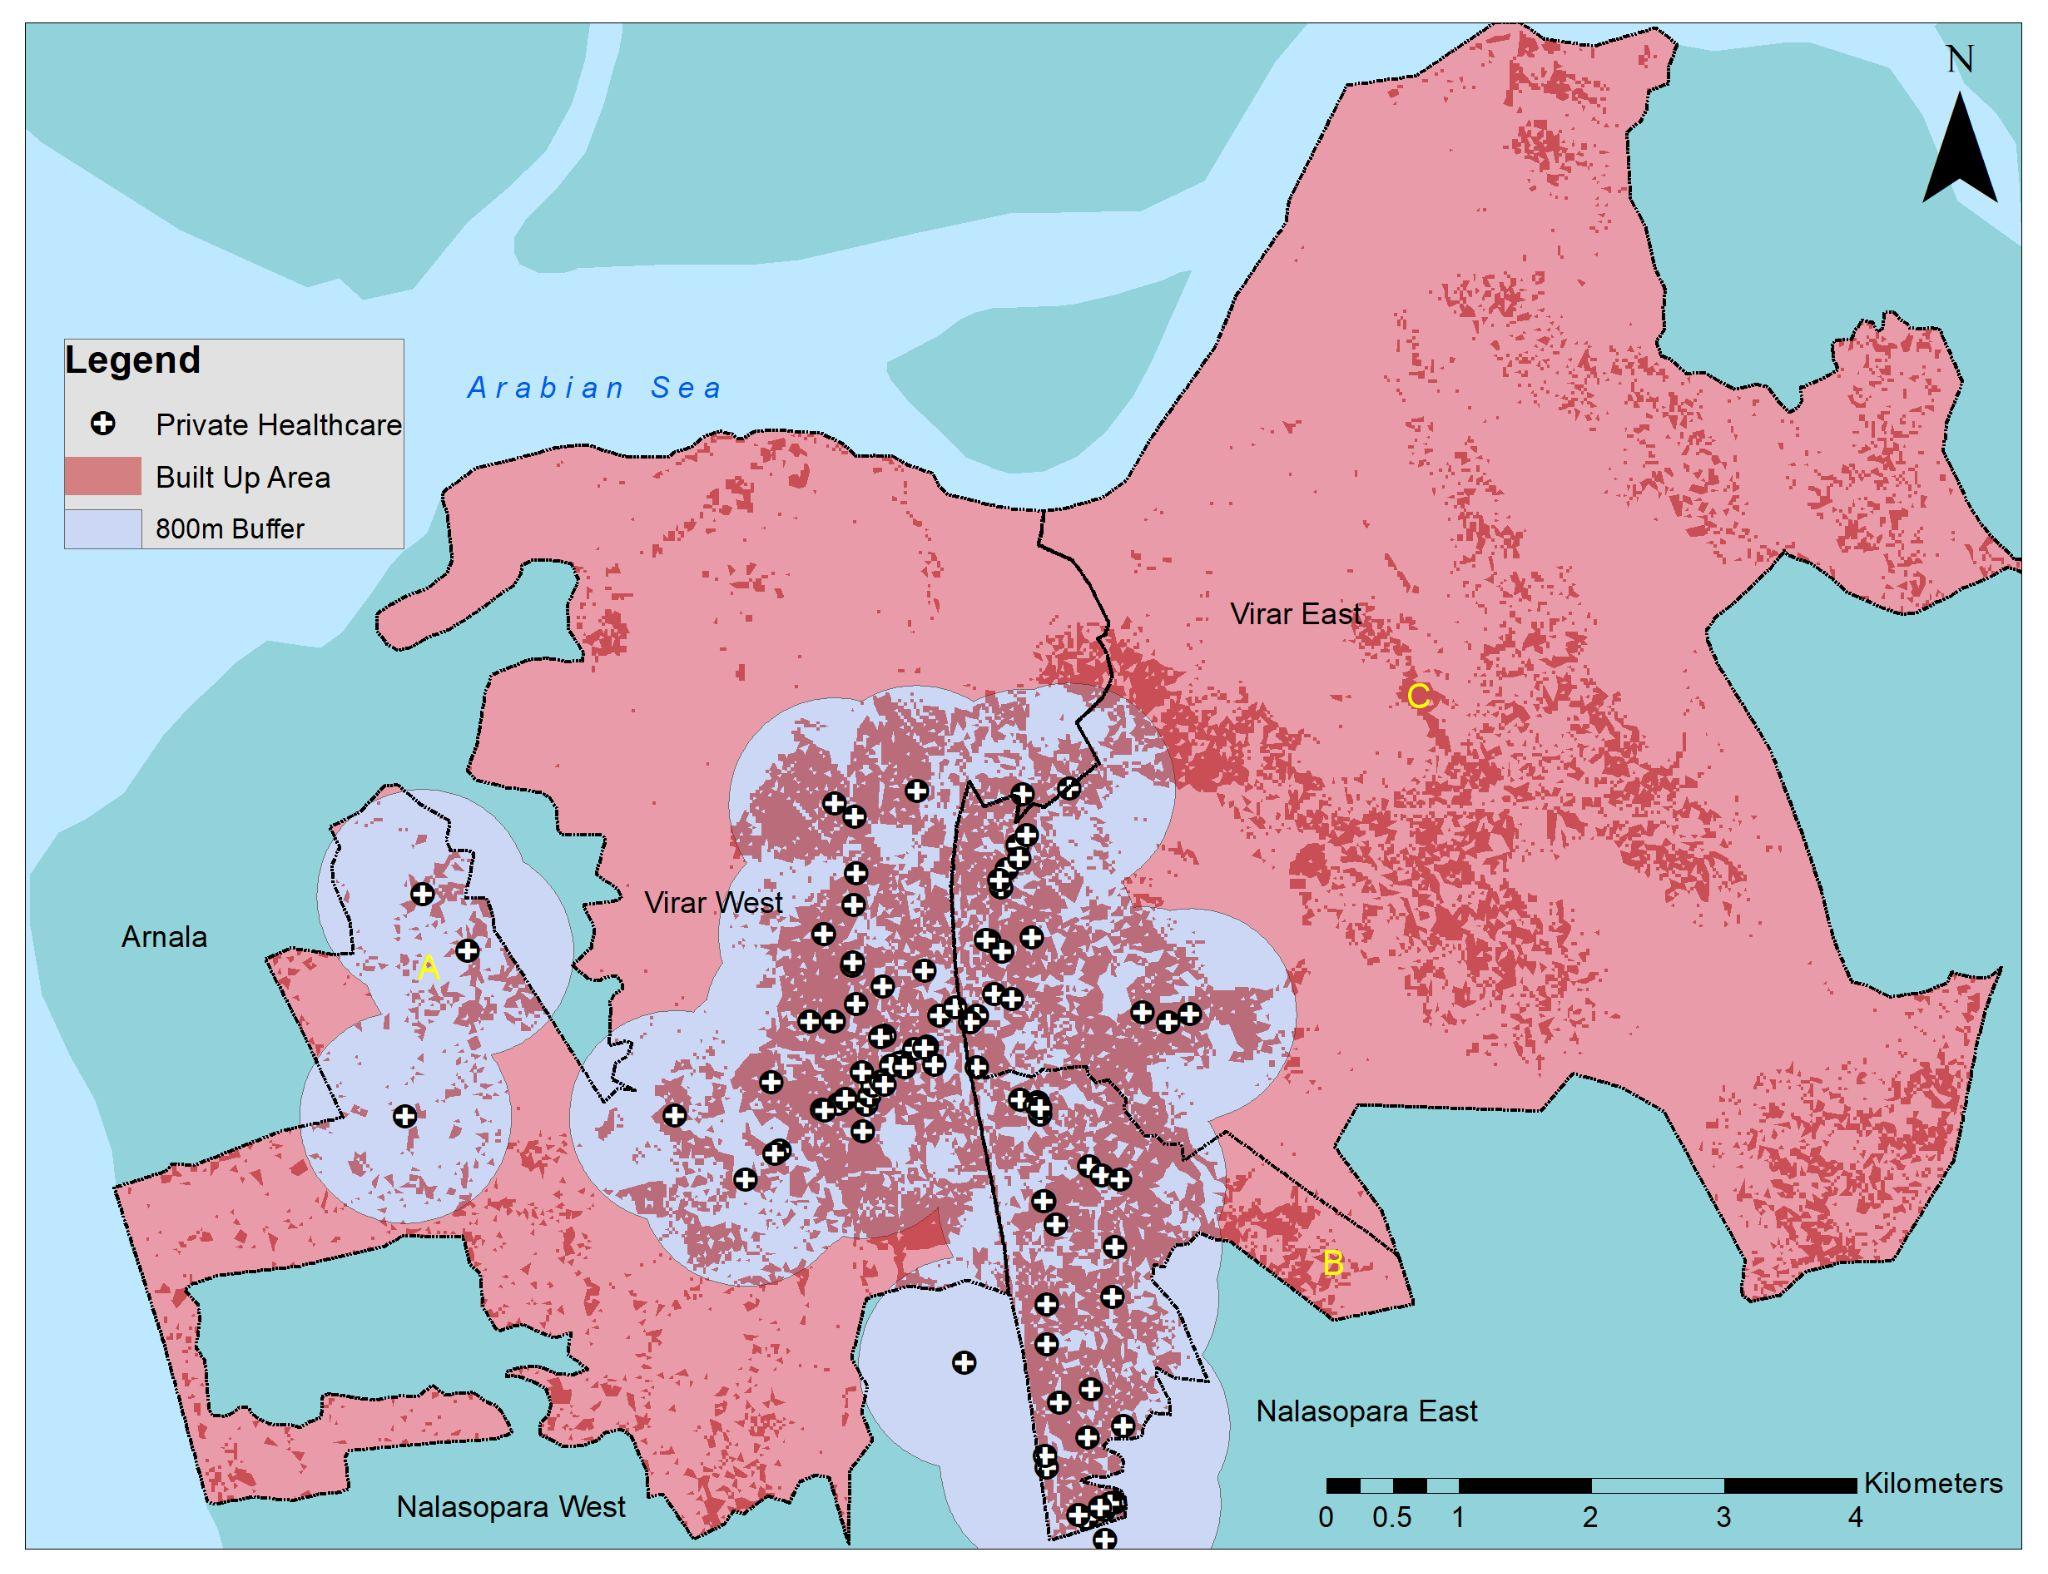
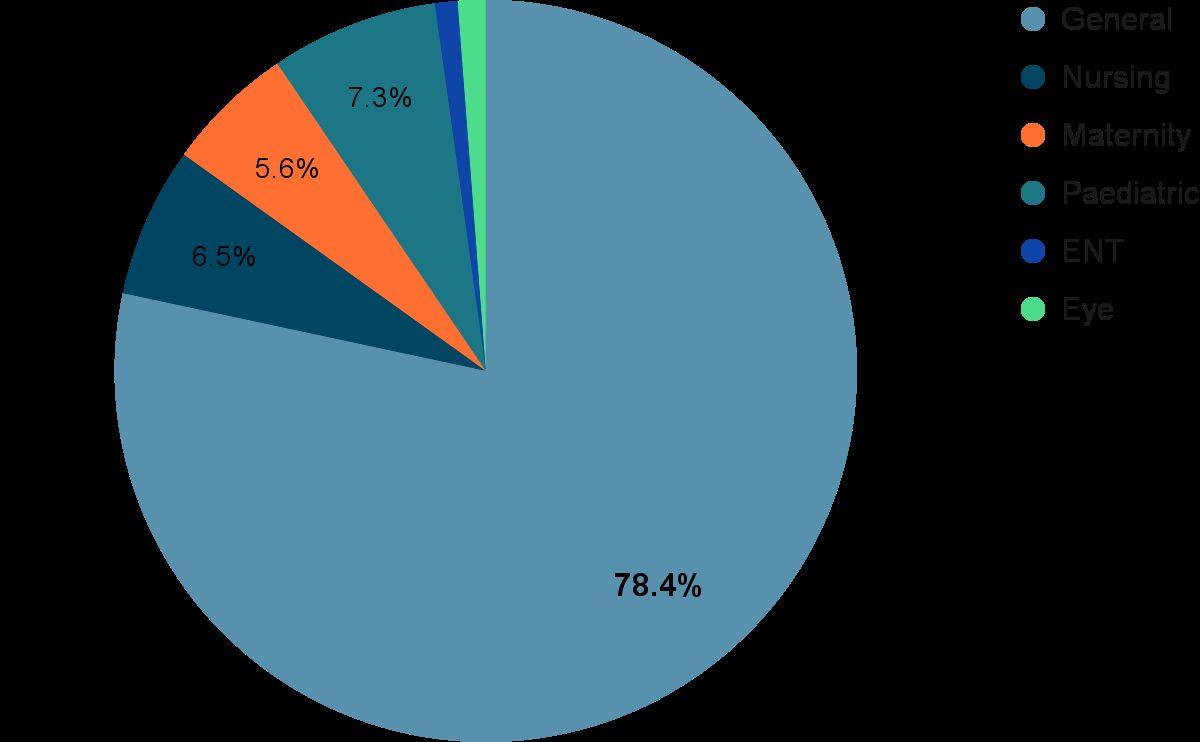
● No. and type of Healthcare public and private facilities
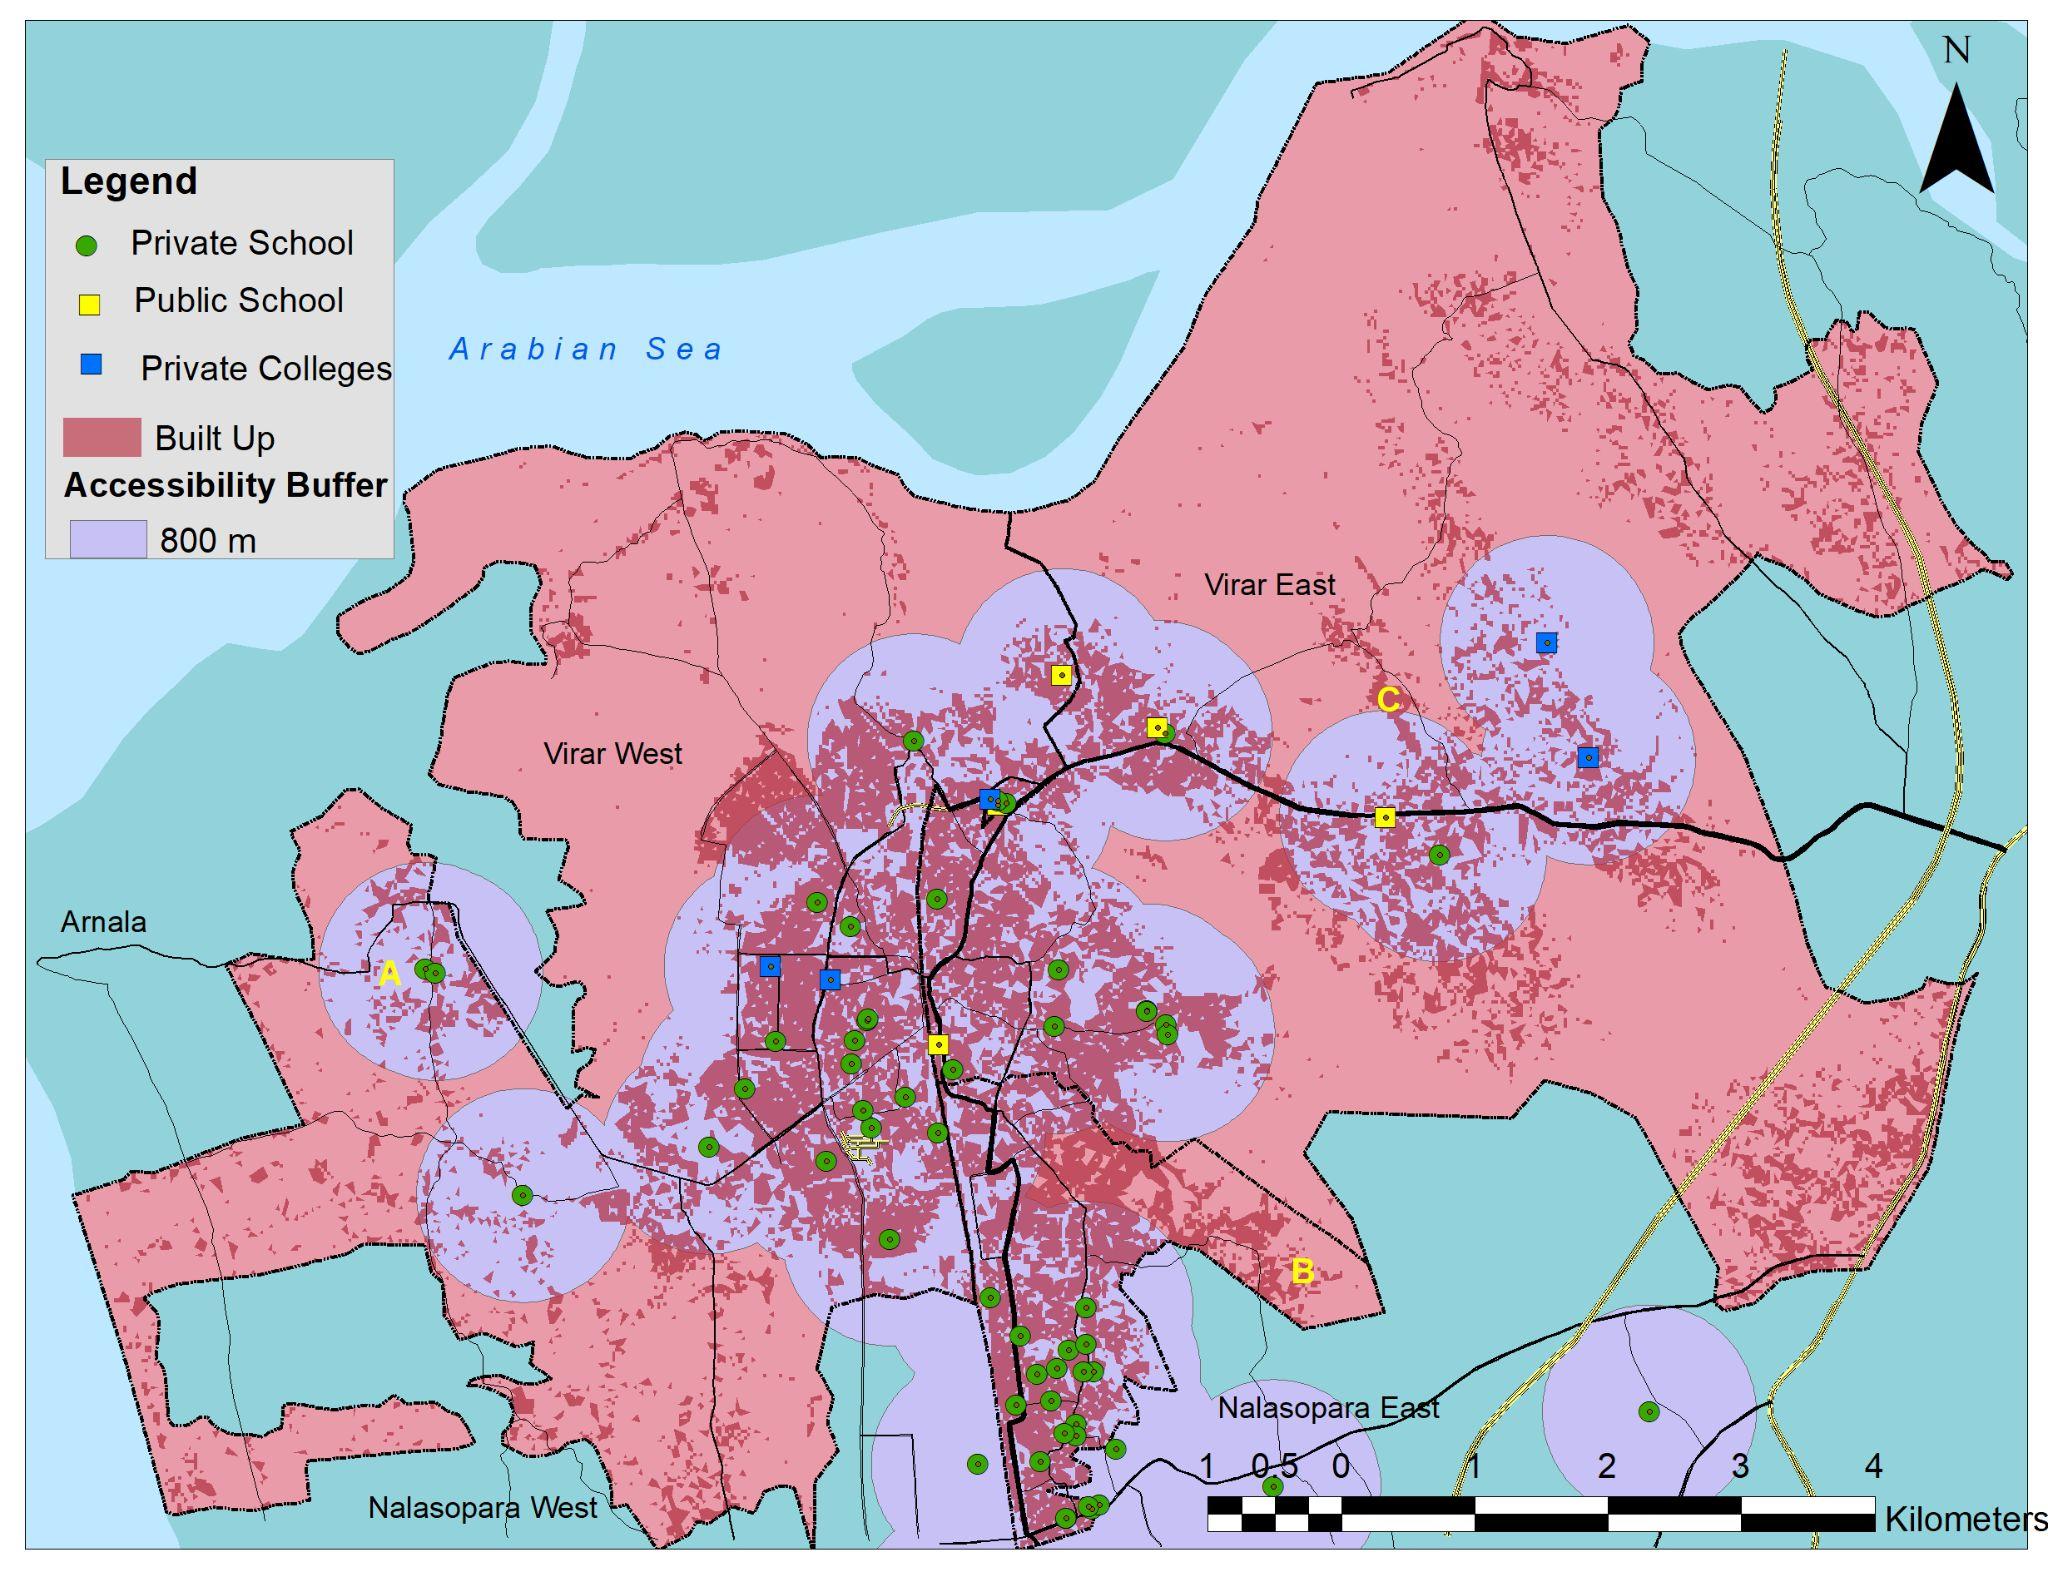
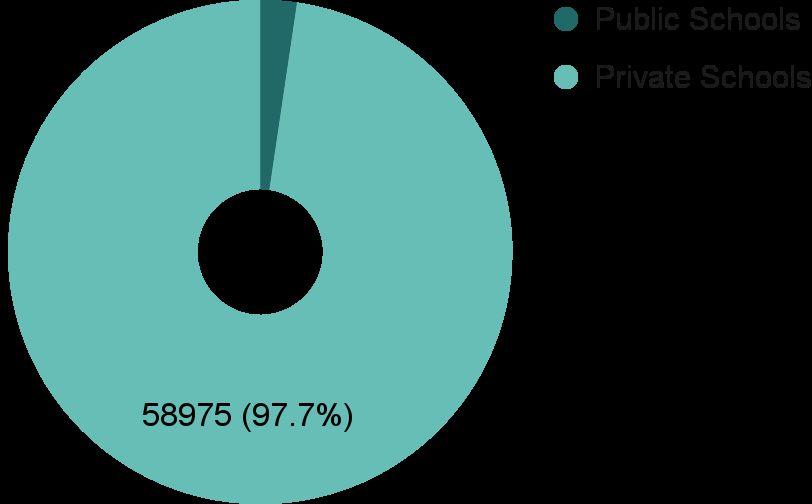
● No. of Private and Public Schools
● Coverage of Public Schools
11.3.2:urbanplanningand management that operates regularly and democratically Governance ● Hierarchy of Governance
● Departments, Roles & Responsibilities Structure and No. of Staff
● Service Level Benchmarks
● Mapping the source of water and supply to the city.
● No. of health physicians per lakh population.
● Coverage of essential health services
● No. of Degree Colleges and their accessibility.
● Schemes
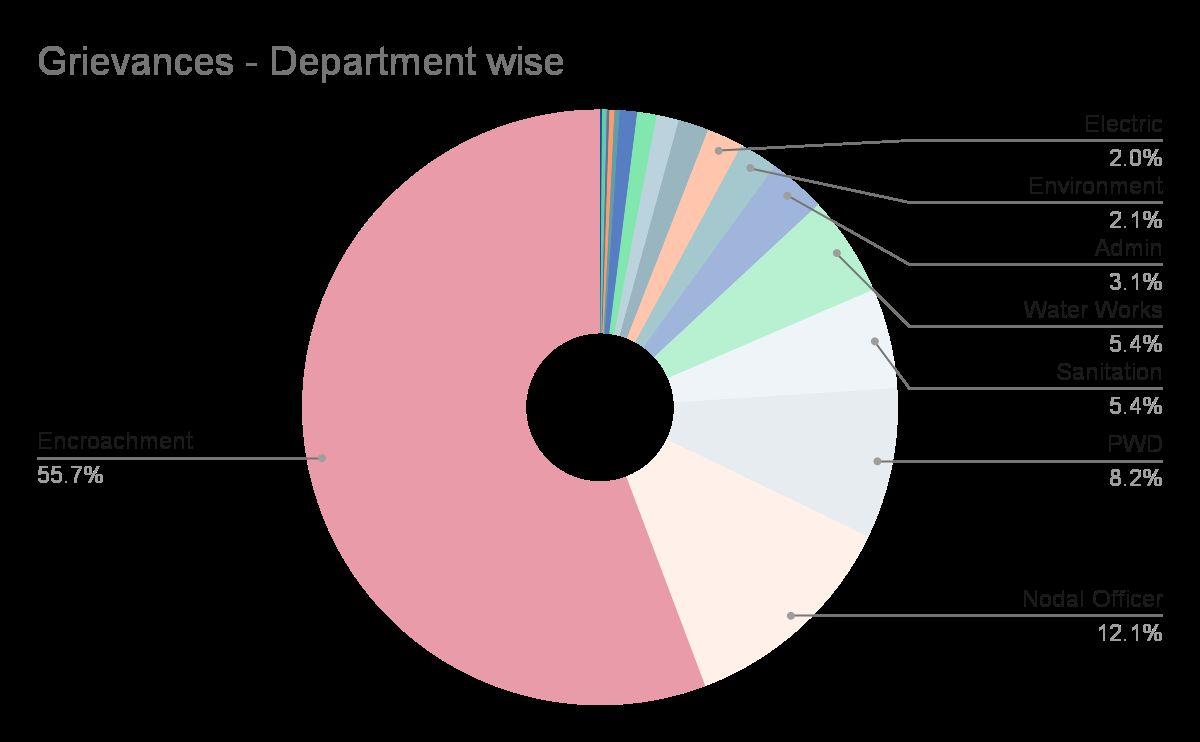
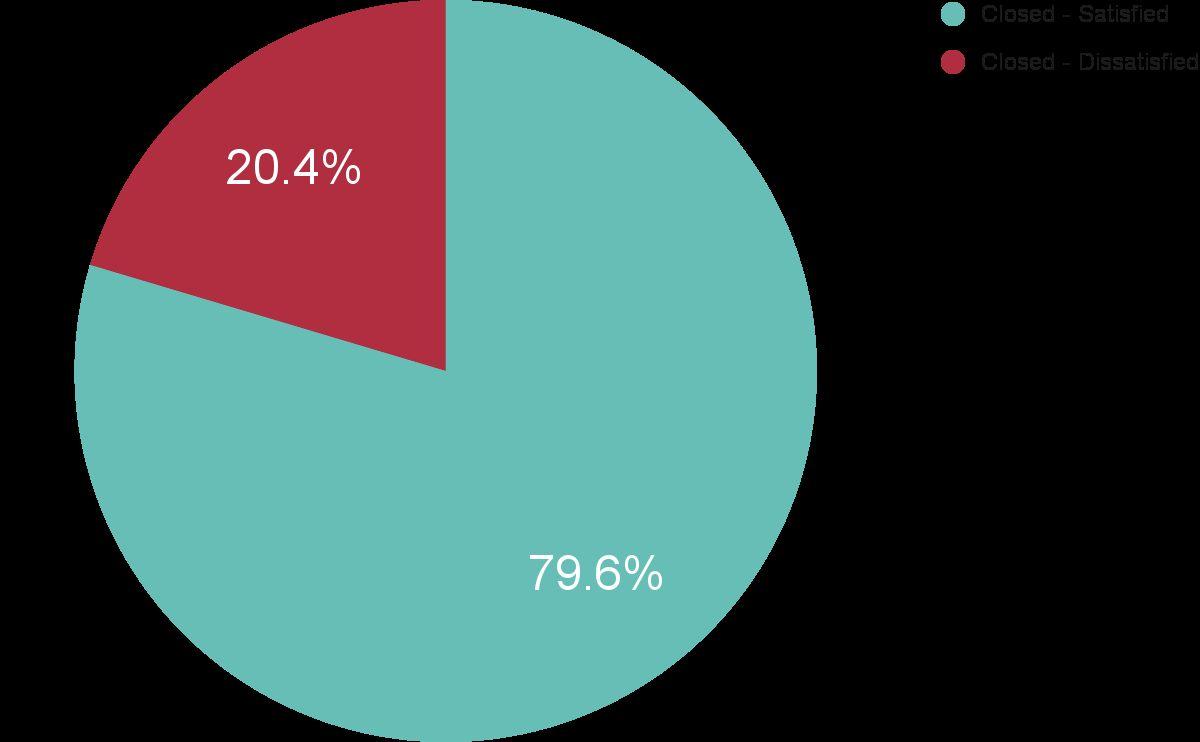
● Category wise Complaints
● Survey - Likert Scale
4 Identify the issues and provide solutions and recommendations for the same.
Data Collection Primary:FieldVisits,Surveys,InterviewwithGovernmentOfficialsand residents,SurveyForms.
Urbanpopulation<3%in1800duetofoodand transportationlimitations.In1850,only3cities had >1M inhabitants (London, Beijing, Paris).About 110 cities had >100,000 inhabitants.
The concept of sustainable urbanizationemergesasanew trendinwhichsustainable,social and environmental dynamics are prioritized by abandoning the classical economic-based developmentapproach.
The Sustainable Development Goals orGlobalGoalsarea collectionofseventeeninterlinked objectivesdesignedtoserveasa "sharedblueprintforpeaceand prosperityforpeopleandtheplanet, nowandintothefuture".
Marked a more catastrophic rapid urbanisation growthallovertheworld,ashalfofthepeoplein theworldwerenowlivinginurbanareasby2008
"Sustainable development is development that meets the needs of the present, without compromising the ability of future generations to meet their own needs."
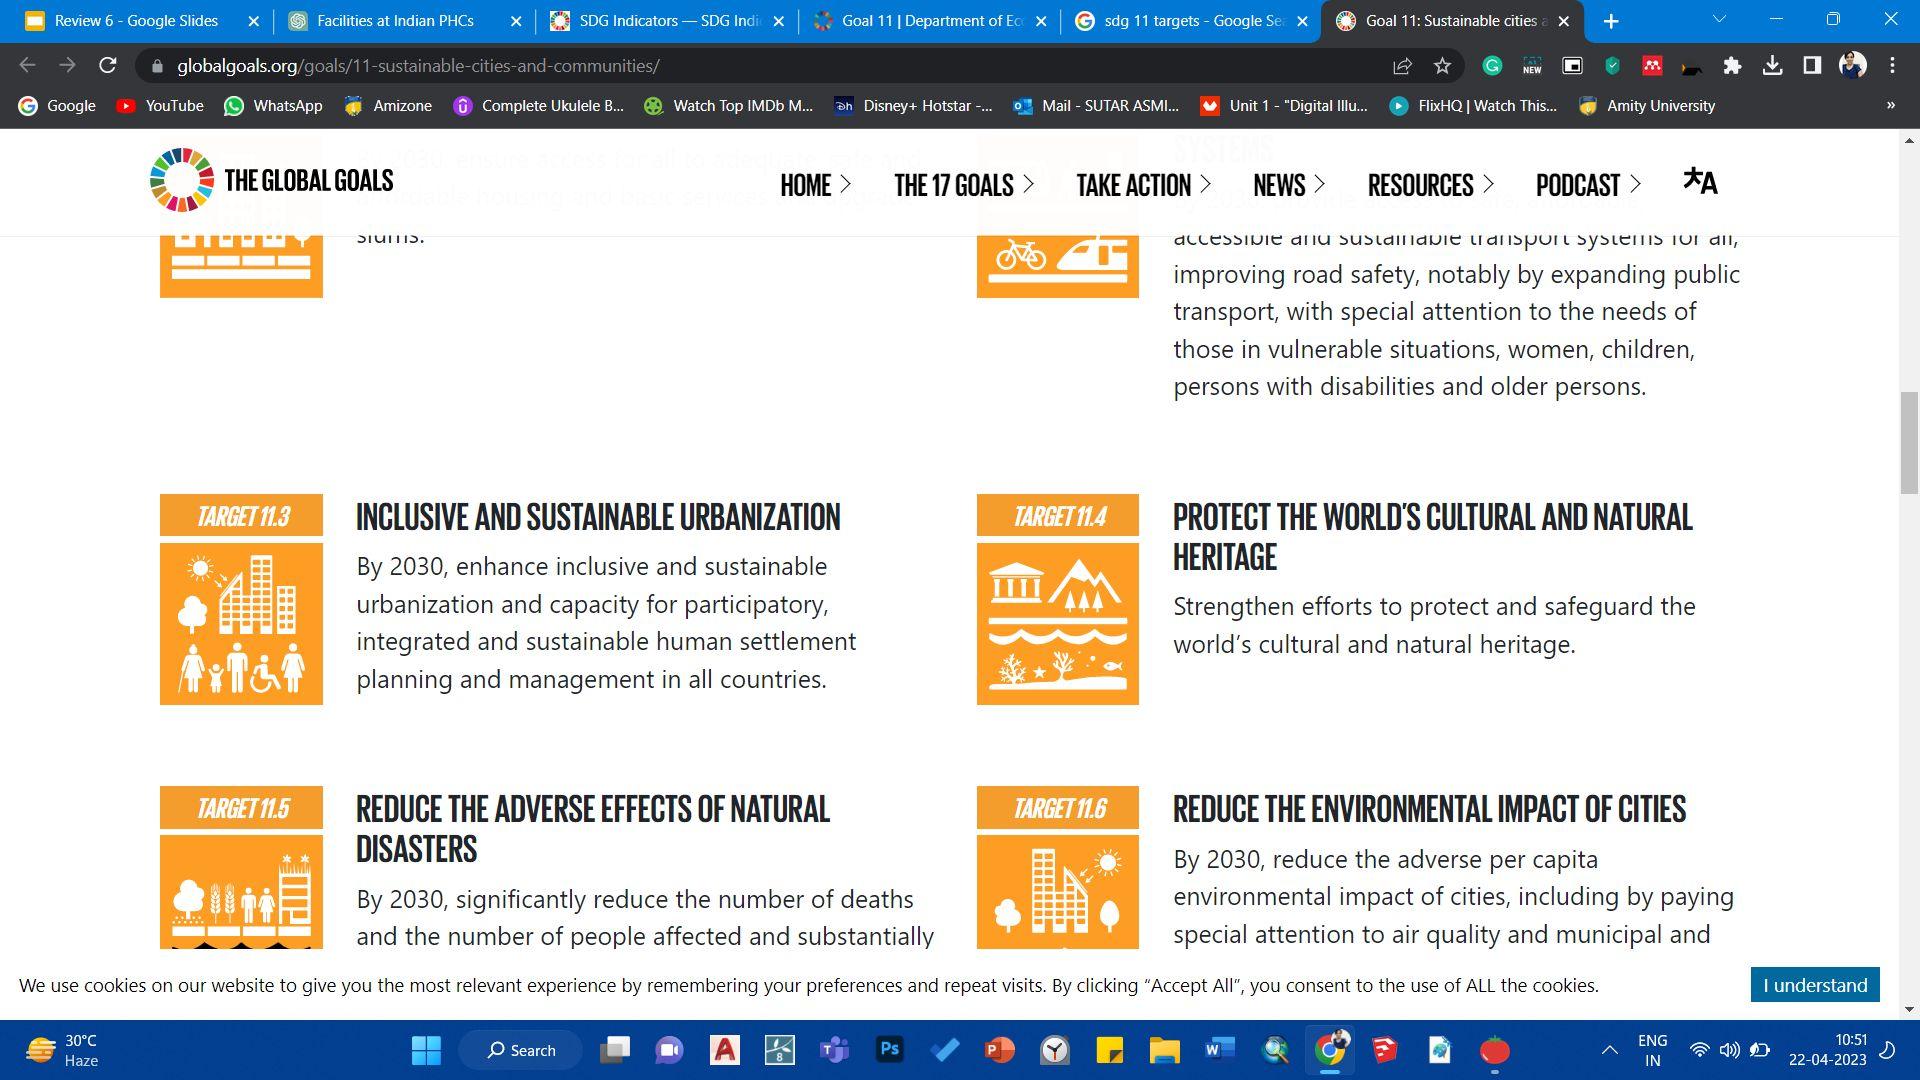
Categorizing Targets of SDG 11
11.3: InclusiveandSustainable Urbanisation 11.2: Affordable and Sustainable Transportation Systems
11.6Reducethe environmental Impactofcities
11.5: Reduce the Adverse Effects of NaturalDisasters.
11.C: Support least developed countries, including through financial and technical assistance, in building sustainable and resilient buildings utilizing localmaterials
11. A: Support positive economic, social and environmental links between urban, peri-urban and rural areas by strengthening national and regional development planning
11.1: Safe and Affordable Housing
11.4: Protect the world’s CulturalandNaturalHeritage
11.7: Provide Access to Safe and Inclusive Green and Public Spaces
<= direct relevanceto
<= direct relevanceto
7 SDGs (1, 3, 8, 9,10,11,13)
4SDGs(12,13, 14,15)
11.B: Sustainable and ResilientCities
SDG 5: Gender equality and empowerallwomenandgirls
SDG 16: Peaceful and inclusive societies & justice forall
SDG17:GlobalPartnership
Make Cities and Human Settlement Inclusive, Safe, Resilient and Sustainable.
Source:
Workshop on Implementation of SDG 11 in cities Takase, 2018
1. A Sustainable Model of Urbanization for Indian Cities, A Case Study of New Delhi
Developing model for sustainable urbanization for Indian cities, focusing on urban housing, using New Delhiasabenchmark.
➔ Urbansprawl
➔ Housingshortage
LITERATURE REVIEW
2. An Analysis of Spatio-Temporal Urbanization
Patterns in Northwest China
Explore the spatio-temporal patterns and drivers of urbanization in northwest China and identify the need for sustainable planning strategies.
➔ Squattersettlements
➔ Environmentalimpact
➔ Transportationissues
➔ Waterscarcityandpollution
➔ Wastemanagement
➔ Integratedplanning
➔ Green Urbanism (triple-zero framework)
➔ Land-UseChange
➔ UrbanizationIntensity
➔ Urbanization along the Urban–RuralGradient
➔ DriversofUrbanization
➔ Spatio-temporal analysis of Delhi's urban sprawl growth from1977topresent.
➔ Comparison of Delhi's City Development Plan provisions with published papers to assess the current status of environmental impact and provisions.
➔ Unplannedurbansprawl
➔ Housingshortage
➔ Formation of Squatter Settlements
➔ EnvironmentalConcern
➔ Transportation pollution and congestion.
➔ Waterscarcityandpollution.
➔ Trashdisposal.
➔ Multilevel logistic regression analysis.
➔ Infrastructure development leadingtourbansprawls
➔ Buffer analysis to analyse land urbanization intensity index(LUII)
➔ Regression analysis to examine the relationship between various spatial variablesandurbanization.
➔ Distantsub-centers
➔ Disregard for geographic features.
➔ Implement interlinked/integrated planning to address urban challengescomprehensively.
➔ Emphasize principles of Green Urbanism, including triple-zero frameworks of zero fossil-fuel energy, zero waste, and zero gas emissions.
3. Urban growth and transport: understanding the spatial temporal relationship Investigates the relationship between urban growth and transport in Jeddah city using spatial temporal analysis techniquestoinformpolicies.
➔ Urban trips density index (per capita,residential)
➔ Statistical analysis of the quantified indicators - The Pearson correlation analysis is implemented using SPSS 18software.
➔ Spatial proximity analysis using buffer analysis function ofGIS
➔ Strong urban-transport relationship
➔ Transport drives urban growth
➔ Imbalance in supply-demand leadingtocongestion
➔ Highwaysdrivelanduse
➔ Needforfurtherresearch
➔ Focus on preserving productive farmland considering geographicalconstraints.
➔ Policies should regulate urban expansion, protect farmlands, culturalsites.
➔ Land change simulations to exploreplanningpolicyoptions.
➔ Suggests further research using Spatial statistical analysis and Dynamic modeling to gain a better understanding of the reciprocal relationship between urbangrowthandtransport.
4. Research on satellite urban transportation and land spatial planning in big data environment
The aim of this study is to explore the use of big data in analyzing and improving the spatial and transportation planning of satellite towns, with a focus on a people-orientedapproach.
➔ Influencing factors of human settlementsinsatellitetowns.
➔ Space distance of satellite towntraffic.
➔ Time distance of satellite town traffic
➔ Categoricalanalysis
➔ Spatial Distance analysis(Evacuation theory of big cities in developing countries and Spatial structureplanningprinciples)
➔ Literature review and theoreticalanalysis
➔ Dataqualityandaccuracy
➔ Privacyandsecurity
➔ Biasanddiscrimination
➔ Technicalexpertise
➔ Publictrustandparticipation
➔ Utilizing Big data technology to improveurbantrafficplanningand decision-makingprocesses.
5. Transit Oriented Development and Its Impact on Level of Service of Roads & METRO: A Case Study of Mumbai Metro Line-I
Evaluatesthe impact of Transit Oriented Development in Mumbai by predicting mode choice behavior and evaluating indirectimpactssuchasfinancial feasibility,fuelconsumption,and traveltime.
LITERATURE REVIEW
➔ LandUseSurvey
➔ Traffic Volume Count Survey
➔ ModeChoiceModel
➔ Prediction of mode choicebehavior
➔ FuelConsumption
➔ Saving in Travel Time andValueofTime
➔ ImpactAnalysis
➔ FinancialFeasibility
ForapplyingTOD:
➔ Impact on existing infrastructure
➔ Unplanned Vertical development (FSI control)
➔ Inadequacyofmetroservices
➔ Wrongly predicting Mode shareshift
➔ Poorexistinginfrastructure.
➔ EvaluateTODimpactbeforehand.
➔ Limit vertical development based oninfrastructure.
➔ Check adequacy of metro services.
➔ Predictmodechoicebehavior.
➔ Improveexistinginfrastructure.
6. Urbanization in India –
Spatiotemporal analysis using remote sensing data
Analyze the spatial growth and future modeling of urban development in the 12 largest Indian urban agglomerations using multitemporal remote sensingandlandscapemetrics.
➔ Multitemporal remote sensing
➔ Time-series of Landsat data
➔ Absolute parameters (e.g. areal growth or built-updensity)
➔ Landscape metrics (e.g. SHAPEindex)
➔ Gradientanalysis
➔ Spatiotemporal urban footprints of the large Indian urban agglomerations.
➔ Spatiotemporal relationship analysis using the parameter built-up density.
➔ Location based structure analysis using the SHAPE parameter.
➔ No fixed urban growth patternobserved.
➔ Spatiotemporal growth can be quantified by parameters measuring dimension, pattern, and form, including absolute urban area, built-up density, landscape shape index, largest patch index, number of patches, patch density, total edge, and edgedensity.
7. Establishing Urbanization Trends in Mumbai Metropolitan Region by analysing Geospatial data sets
EvaluateMumbai'surbangrowth with Landsat images for sustainabledevelopment.
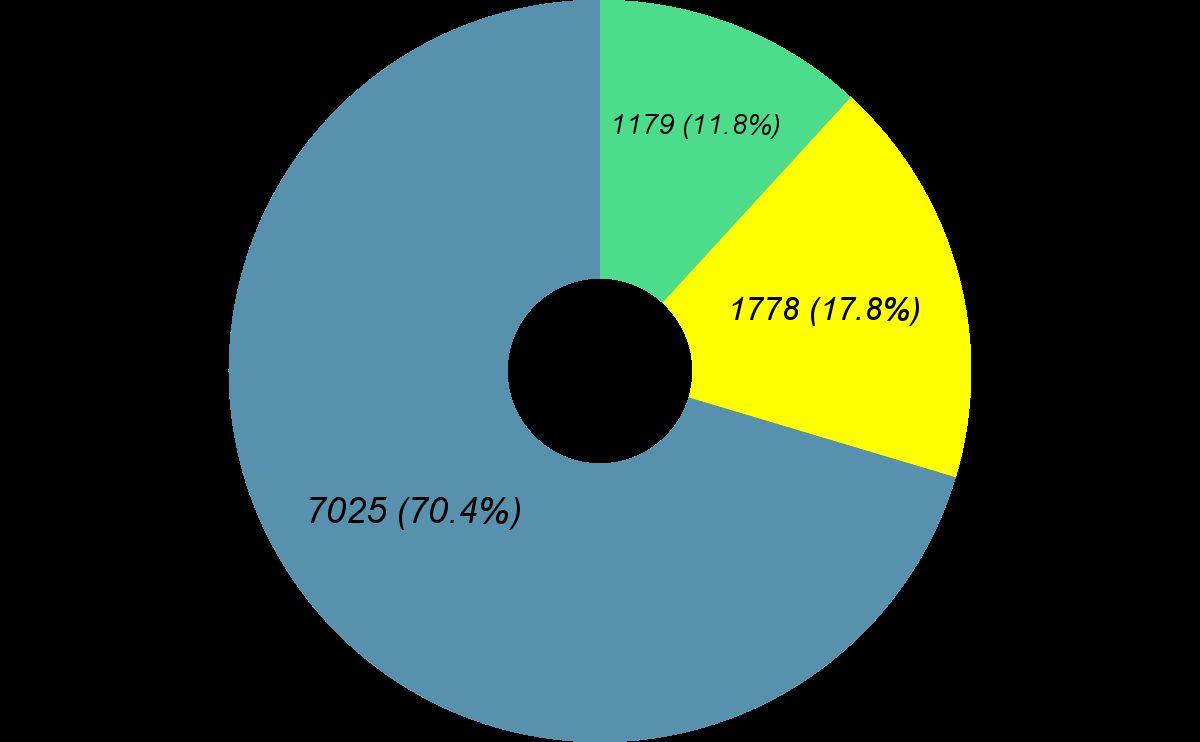
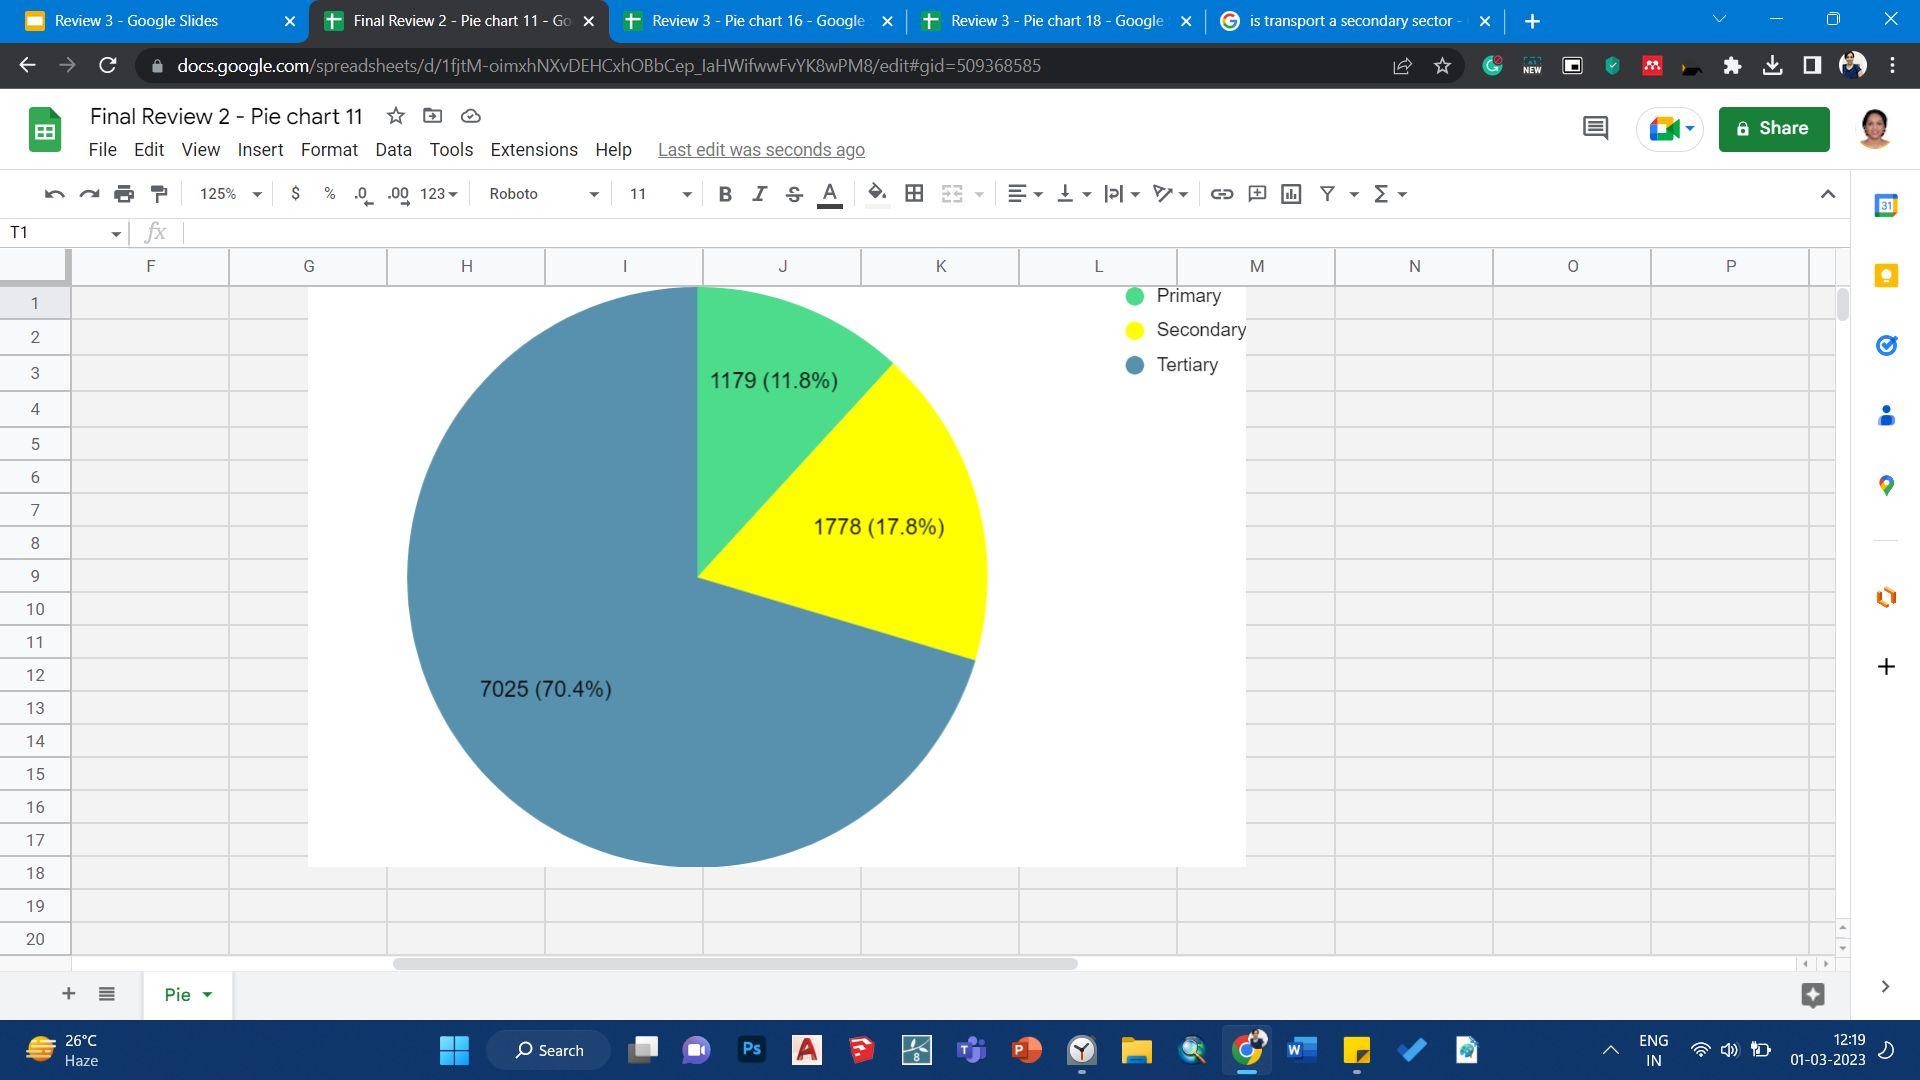
A transition from a more agriculture and manufacturing -based economy towards a service-based economy.
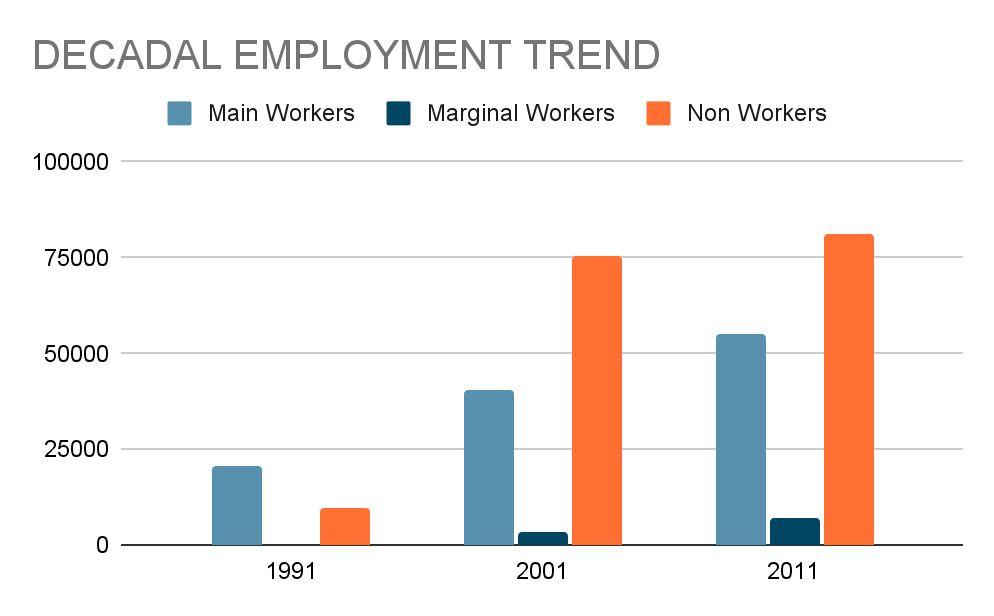
Virar has witnessed an increase in marginal workers, implying the rise of informal and low-paying work opportunities
➔ Virar has experienced a notable rise in the number of non-working individuals, with such individuals comprising 57% of the total working population in the city.
➔ This growth in the non-working population is likely due to factors such as migration, limited employment opportunities, and commuting difficulties for women.
➔ Thenumberofmainworkersinthecityhasincreasedsignificantlysince1991andhascontinuedto grow steadily in subsequent years. This indicates that Virar has been successful in attracting employmentopportunities.
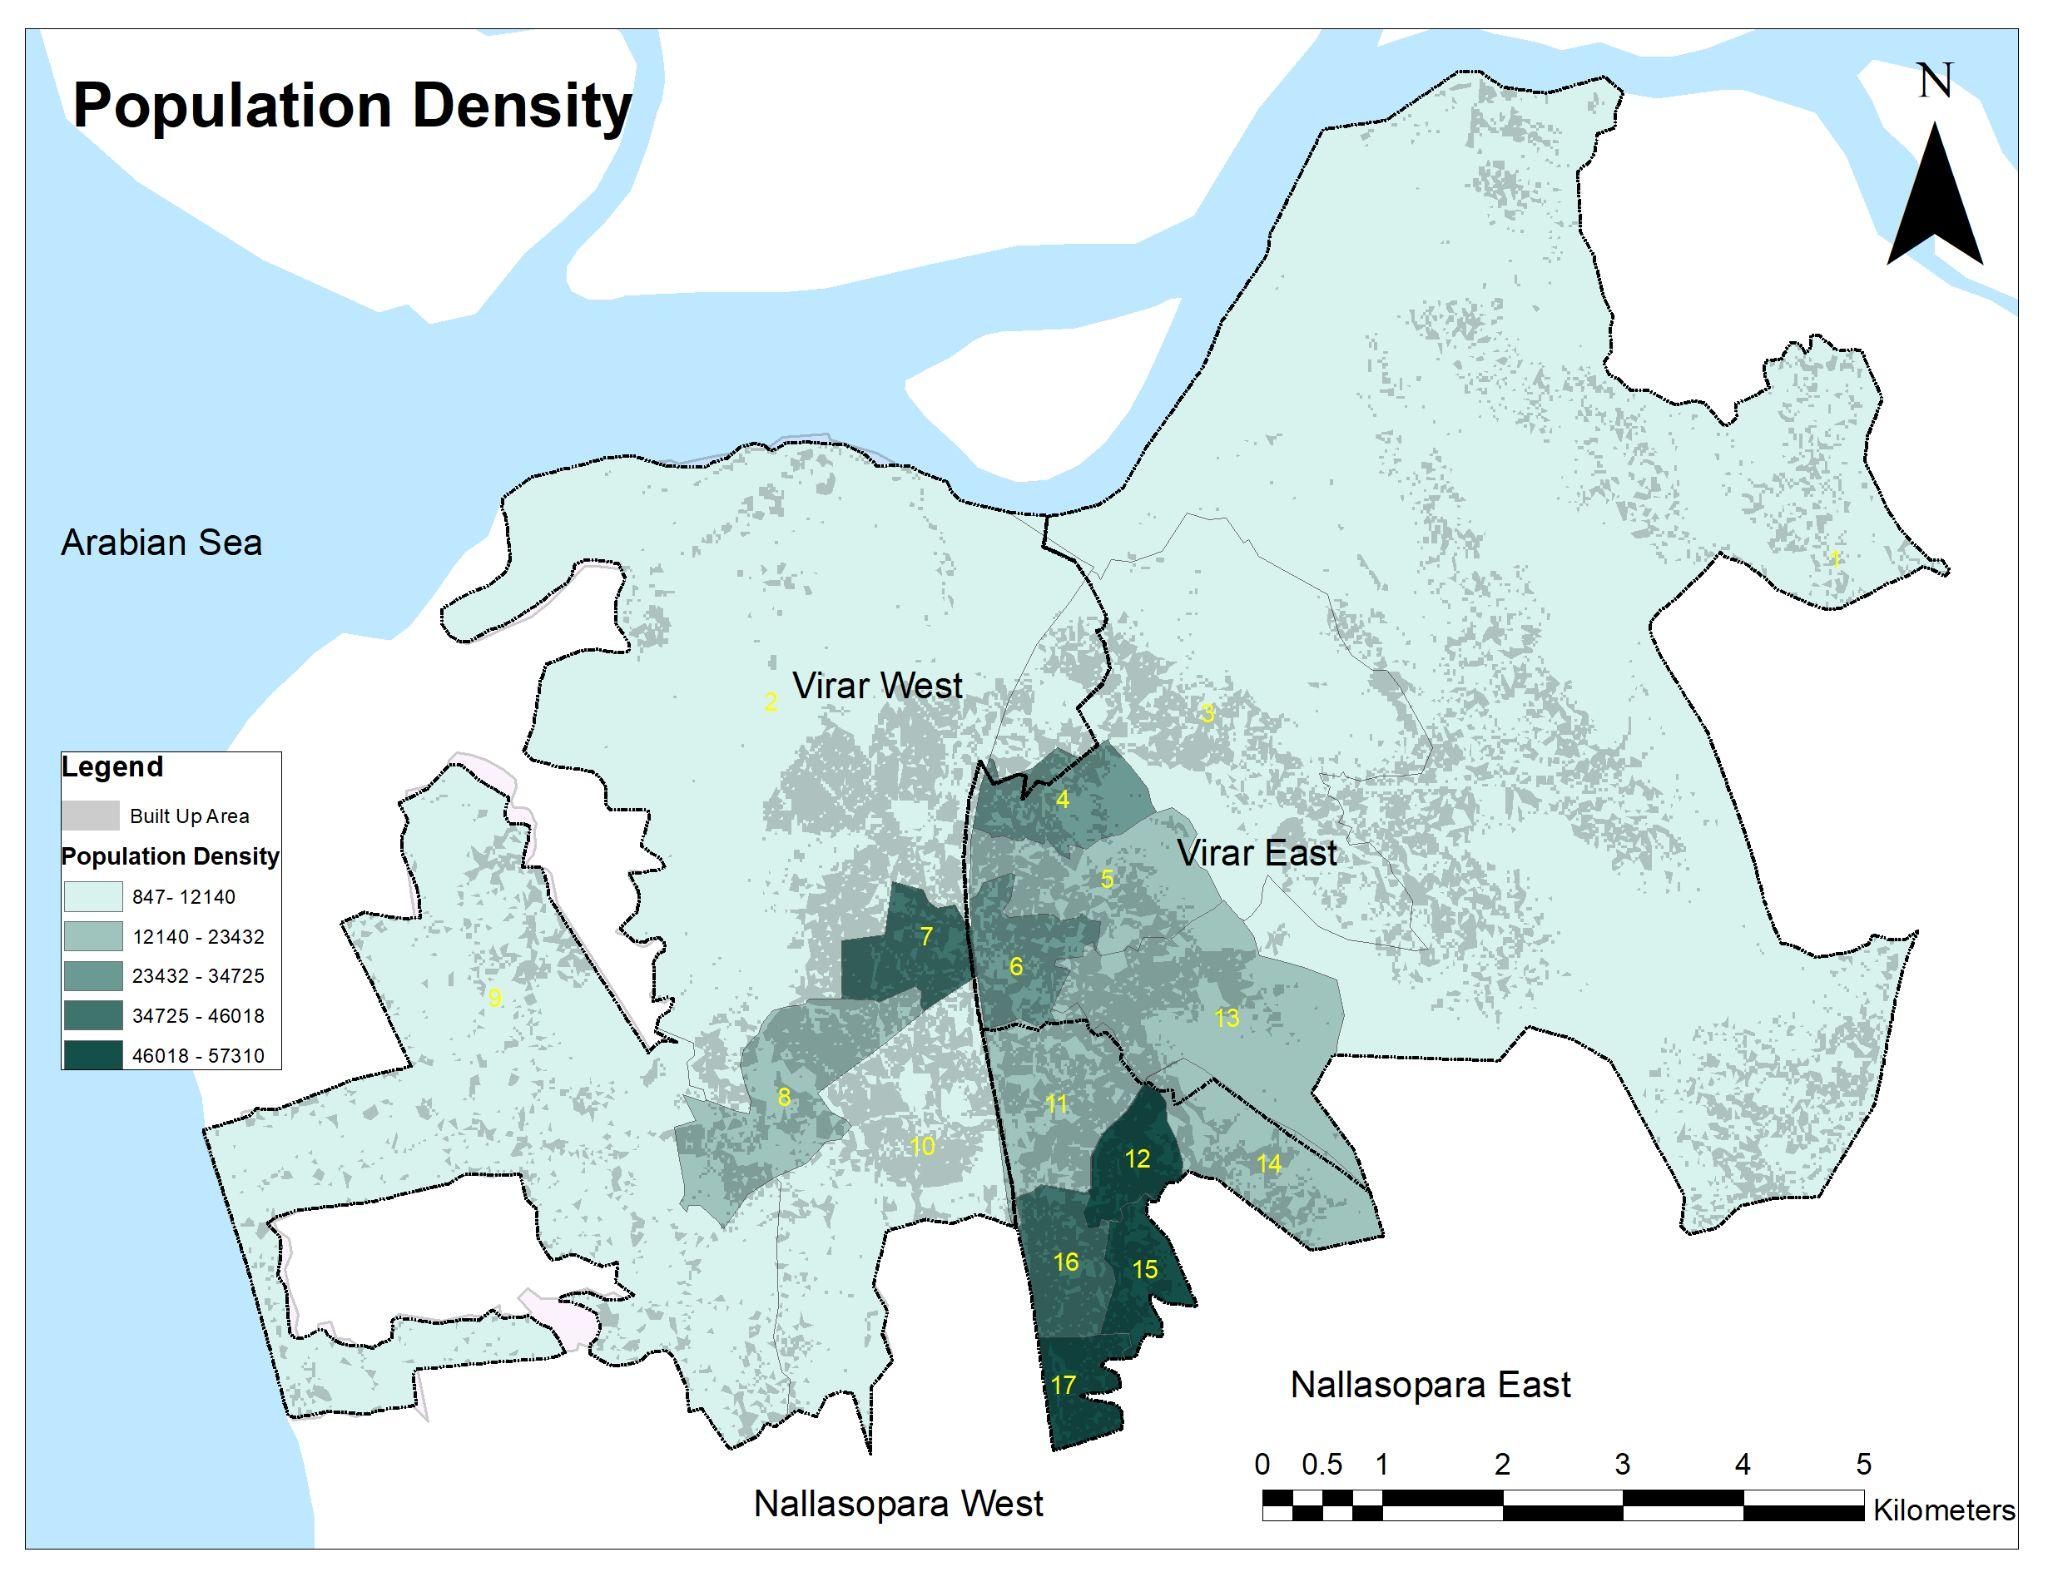
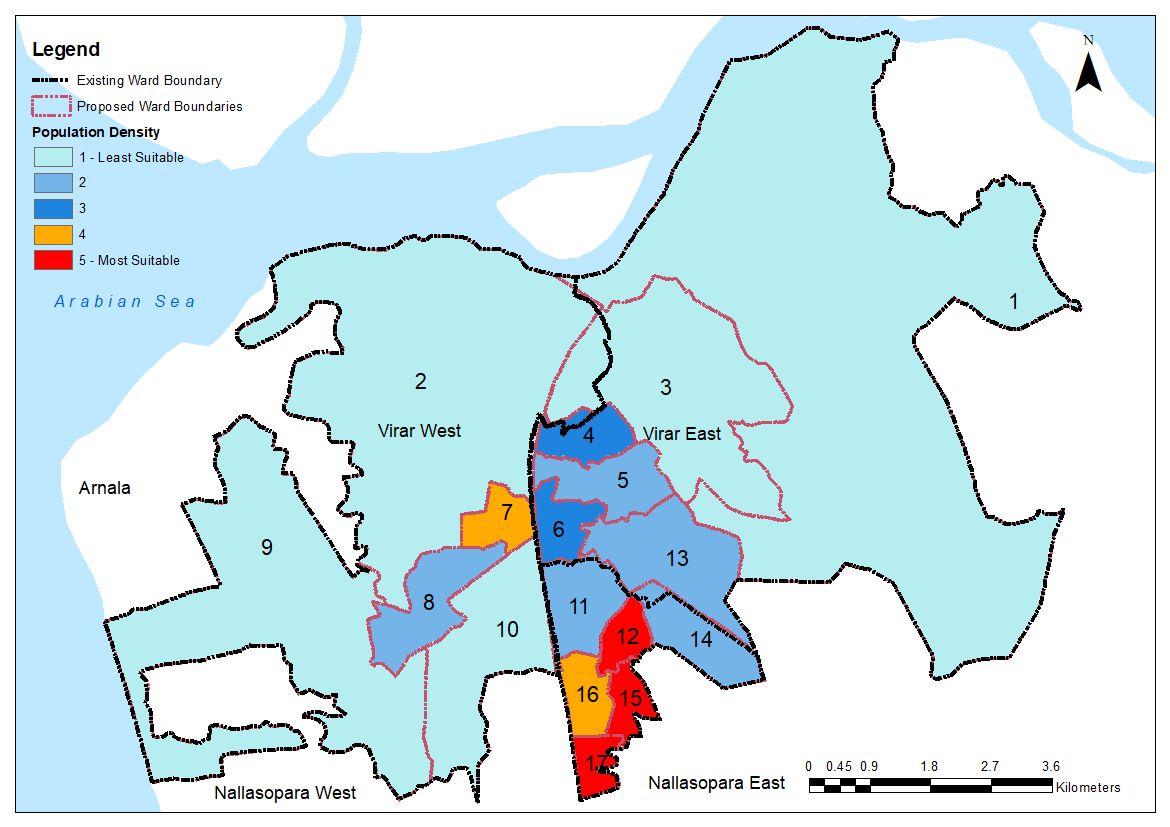
3. Ward wise Density of Population
Source: VVMC, Census 2011
Source: VVMC, Census 2011
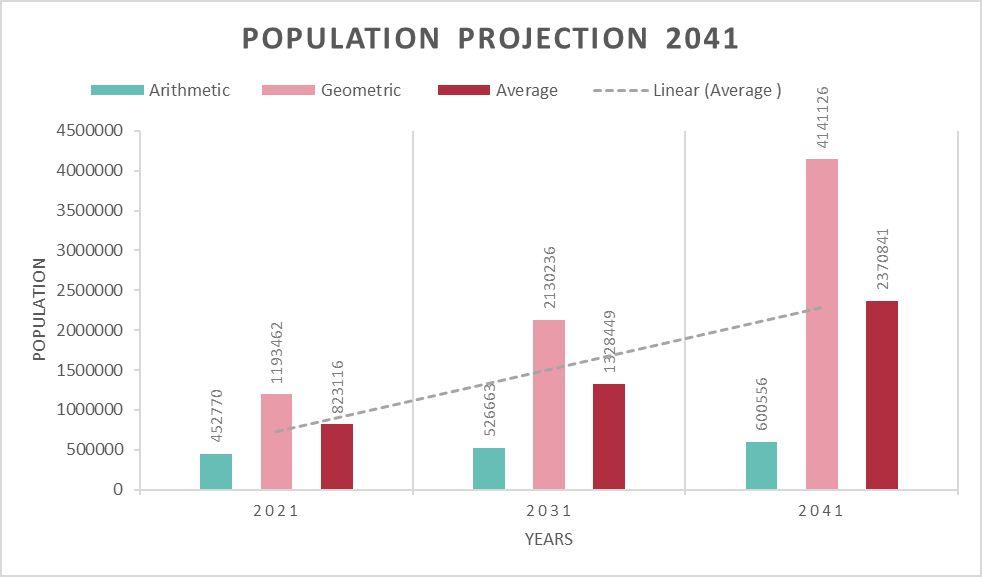
POPULATION PROJECTION
Source: PropertyTax Department, VVMC
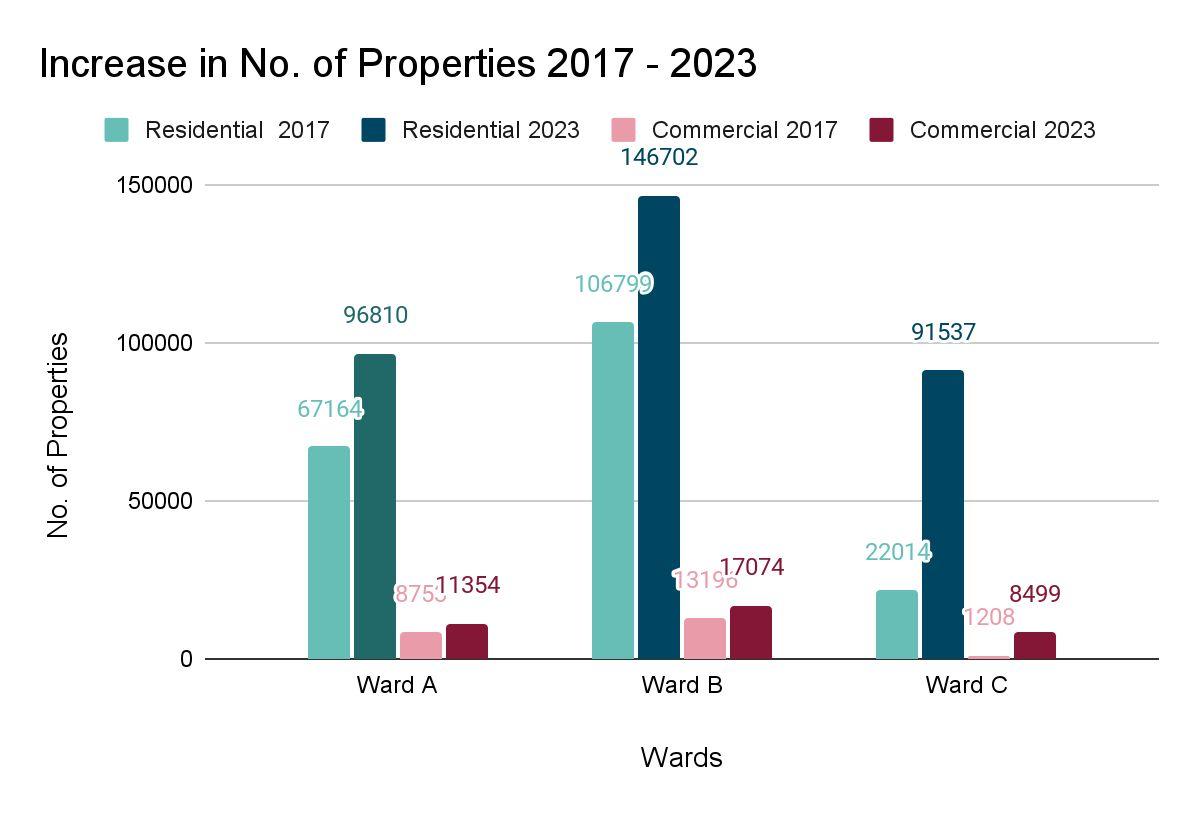
● Ward C has witnessed the most significant growth in Virar, Residential properties increased from 22,014 to 91,537, indicating a growth rate of about 316%, Commercial properties grew from 1,208 to 8,499, representing a growth rate of around604%.
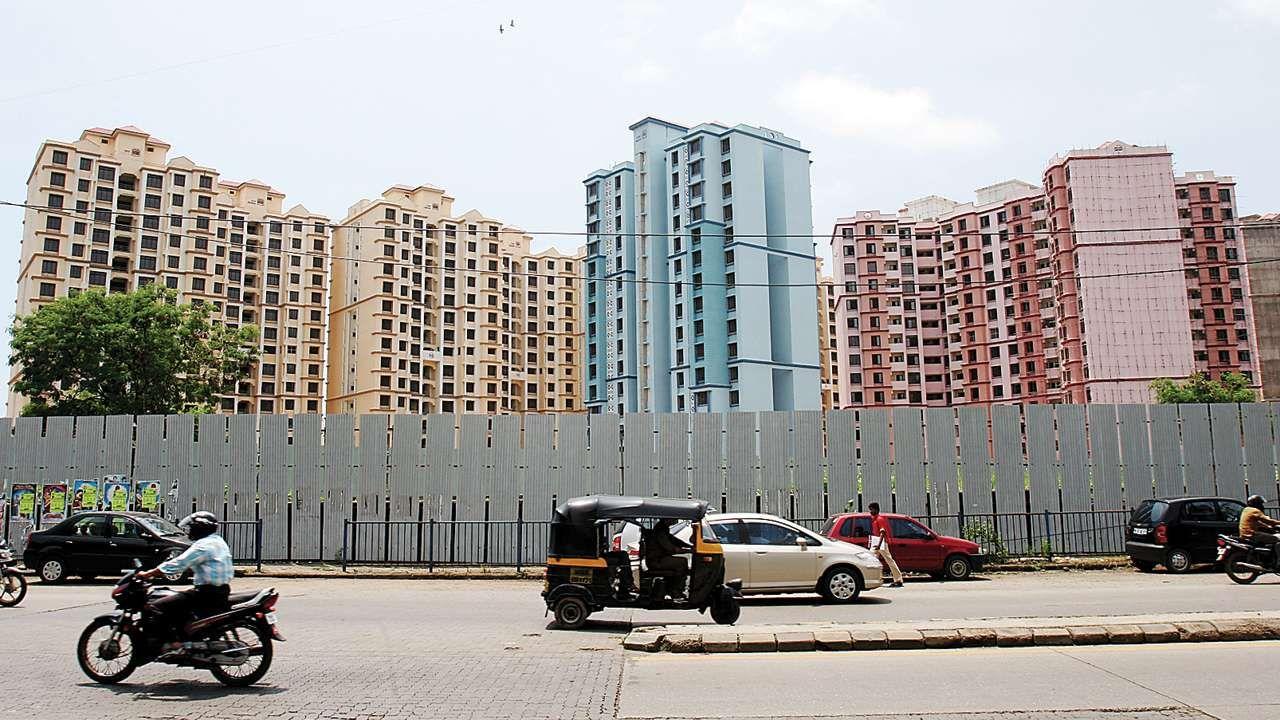
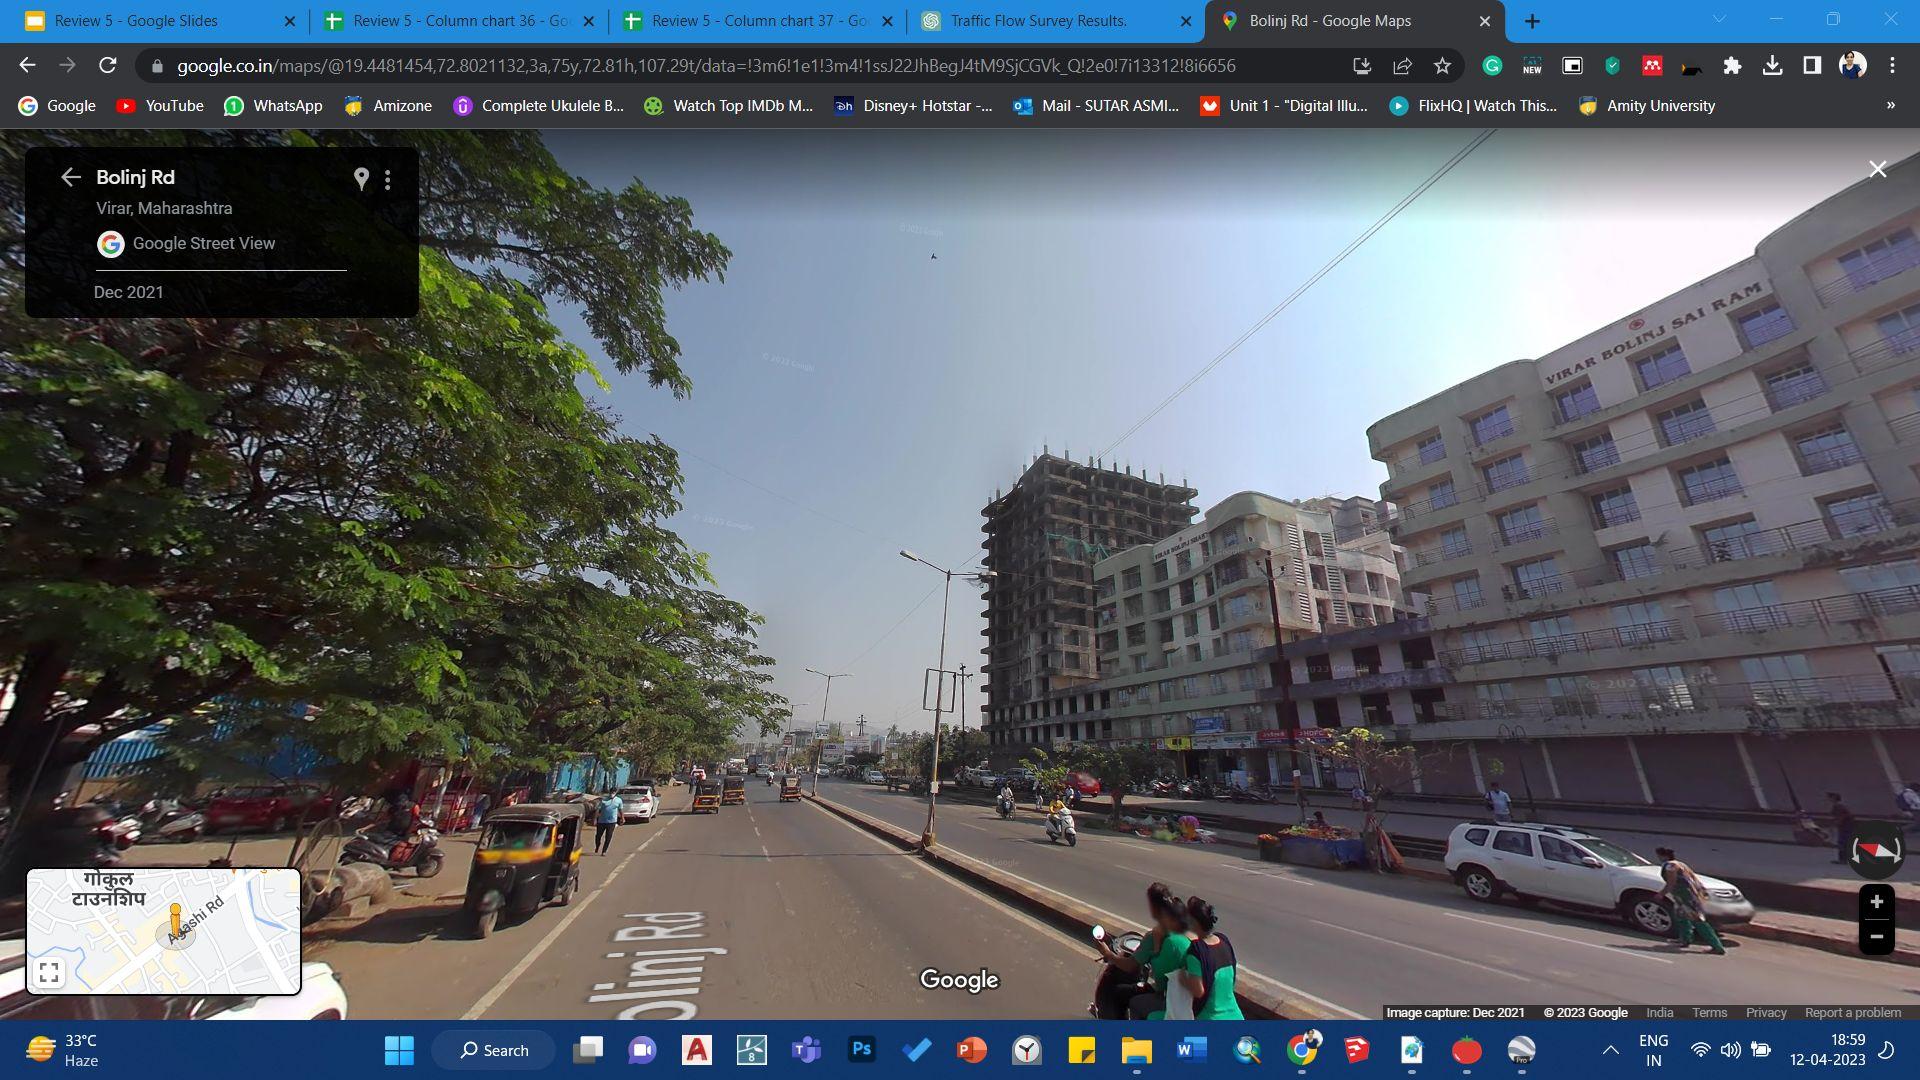
● Virar is experiencing both spatial and vertical growth this growth indicates a growingpopulationandeconomicdevelopmentinthearea
● The notable vertical growth indicates a shift towards higher-density construction, reflectingthedevelopmentofmulti-storybuildingsinthearea.
Source:District Census HandbookThane ,Census of India
➔ Accounting for Dual Nature: Averaging the projections from the Arithmetic Increase Method and Geometric Increase Method considers Virar's dual nature as an old town and a newly expanding area, providing a comprehensive outlook onpopulationgrowth. ➔ Balancing Conservatism and Optimism
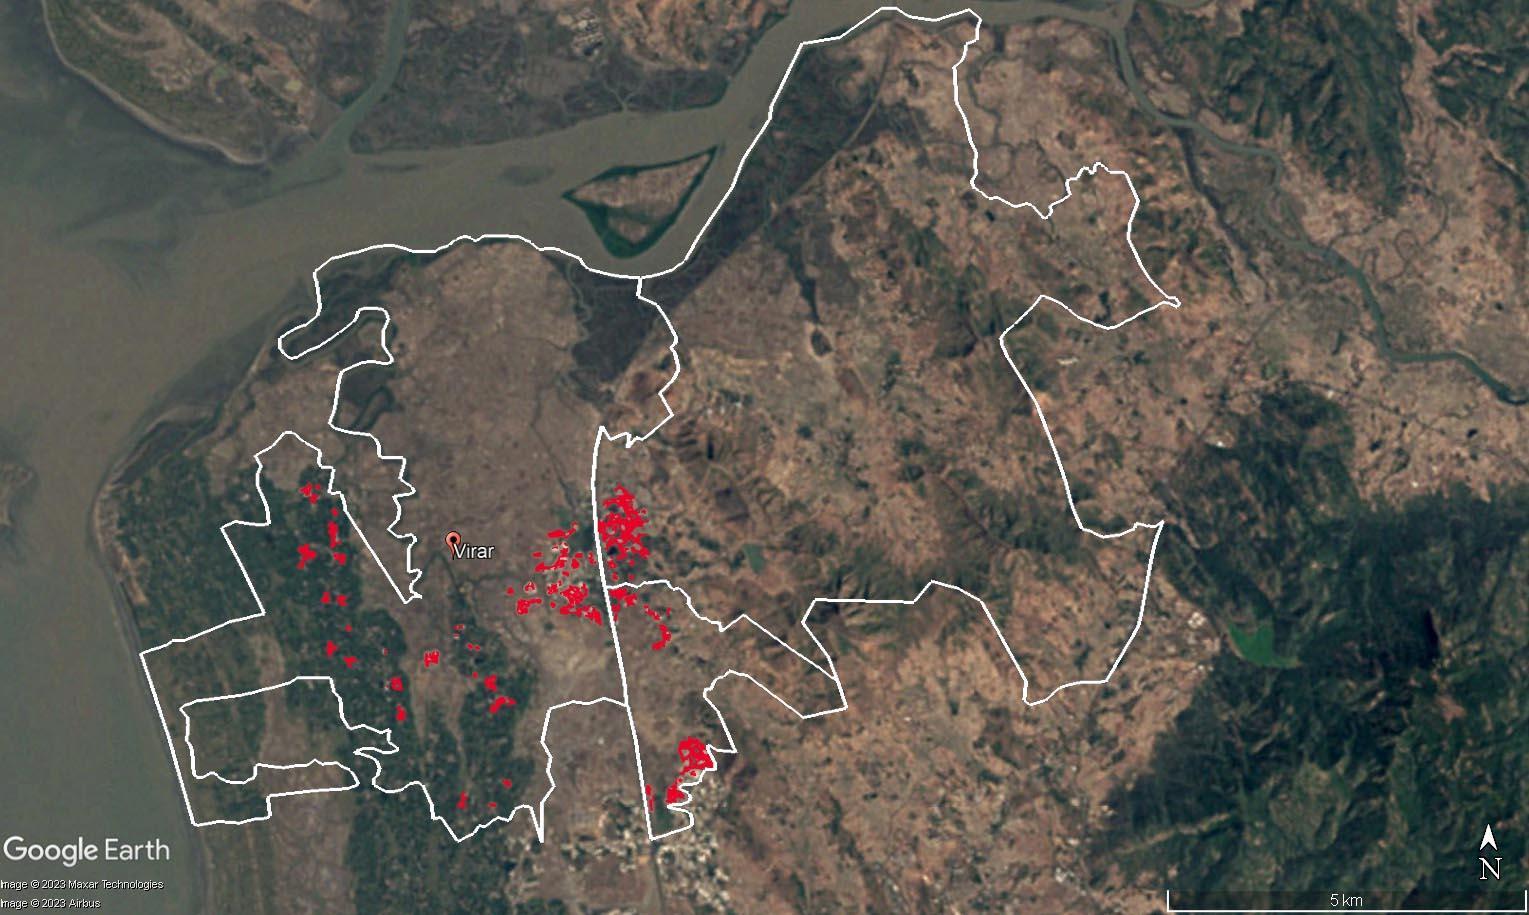
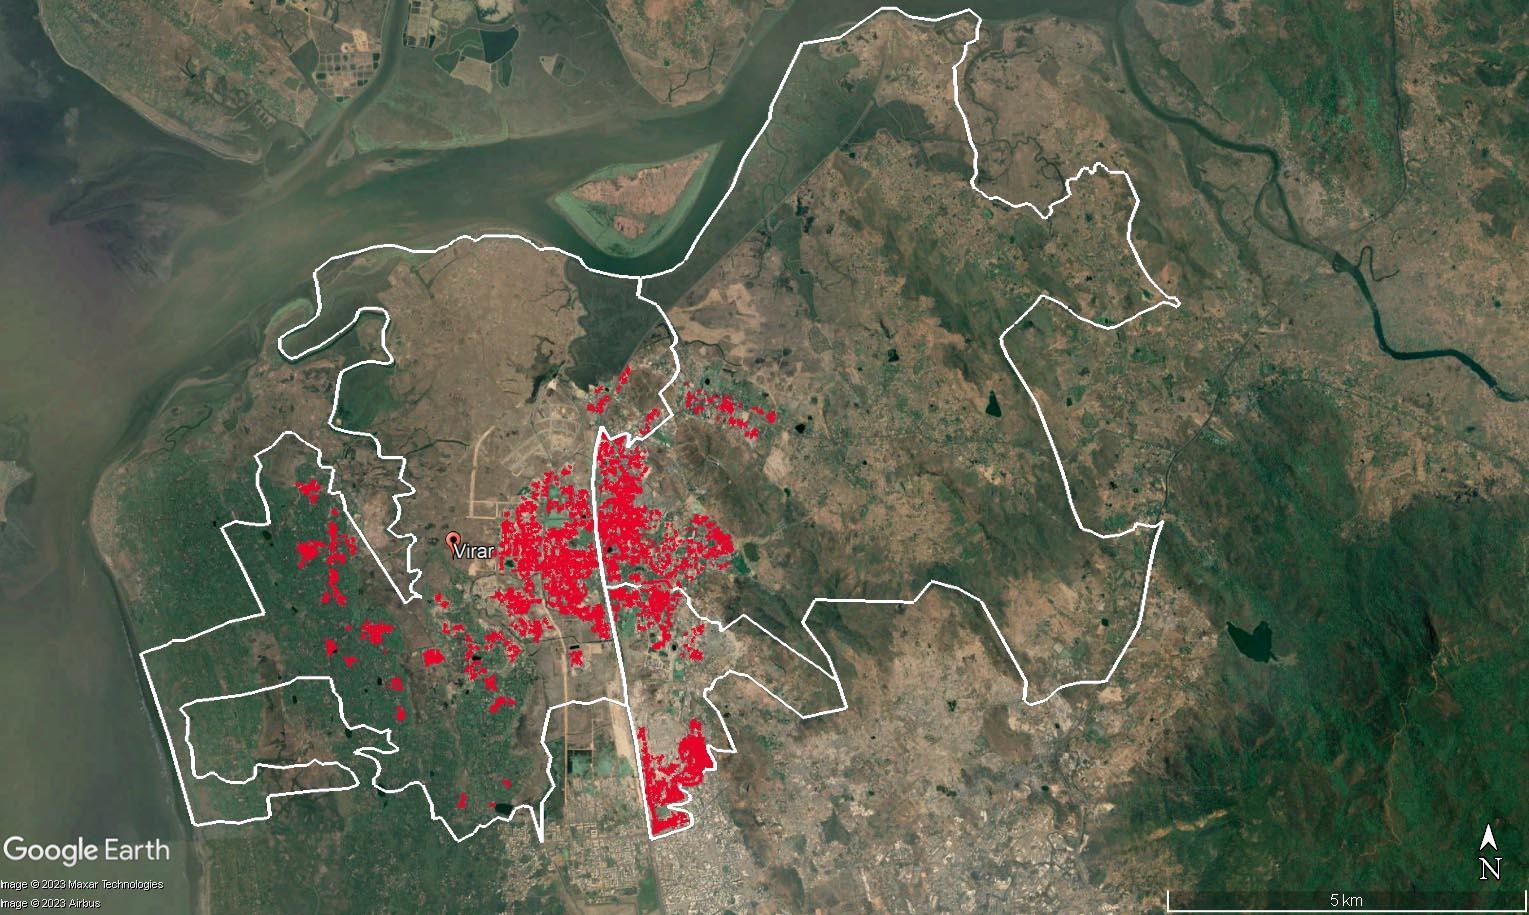
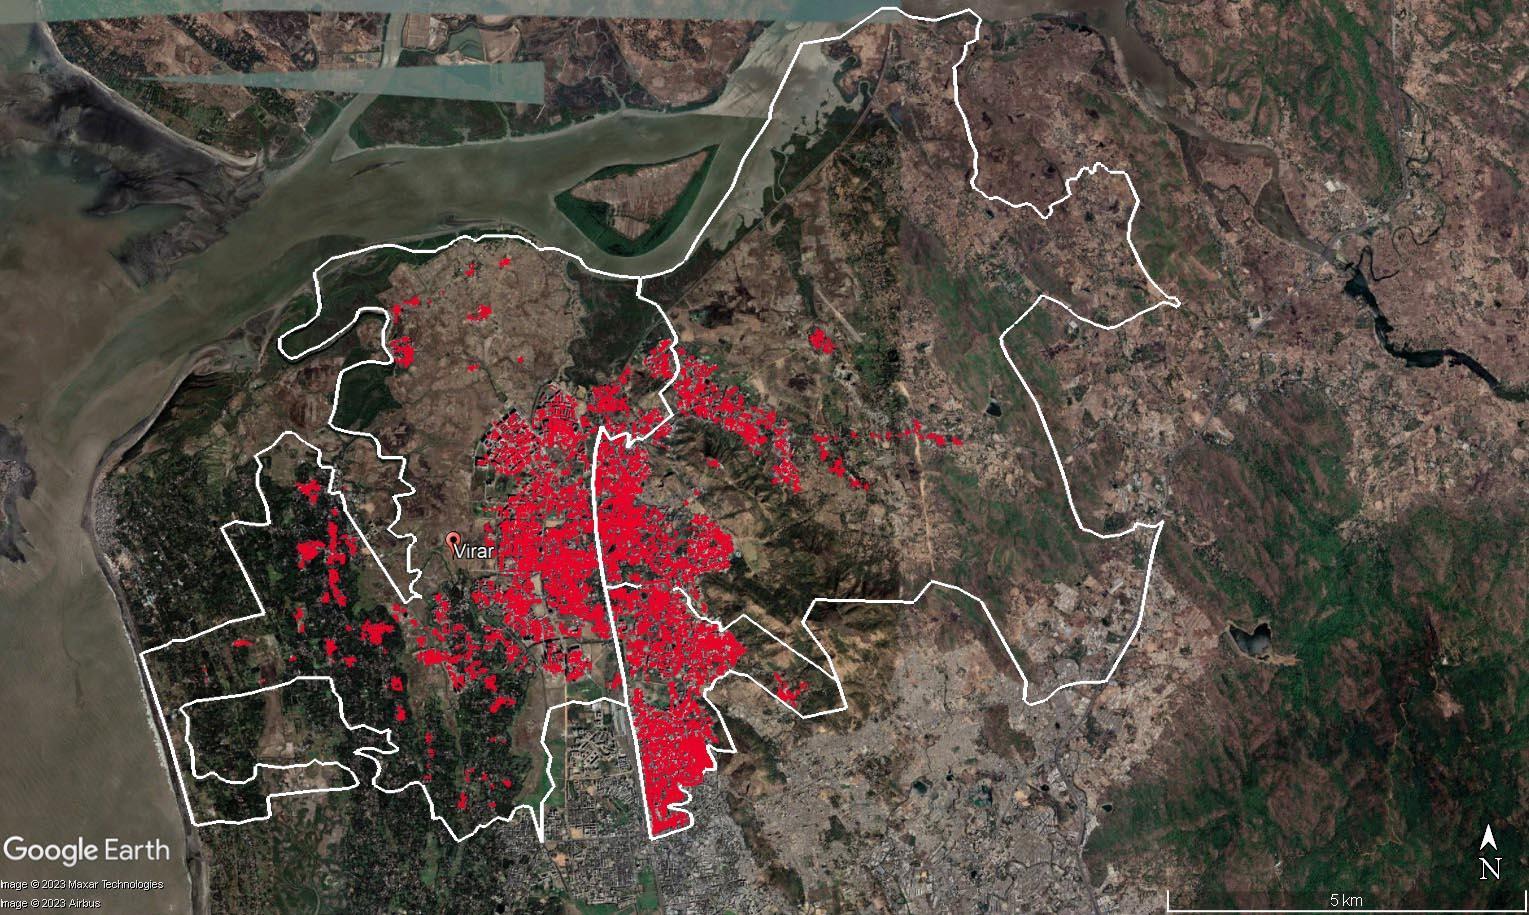
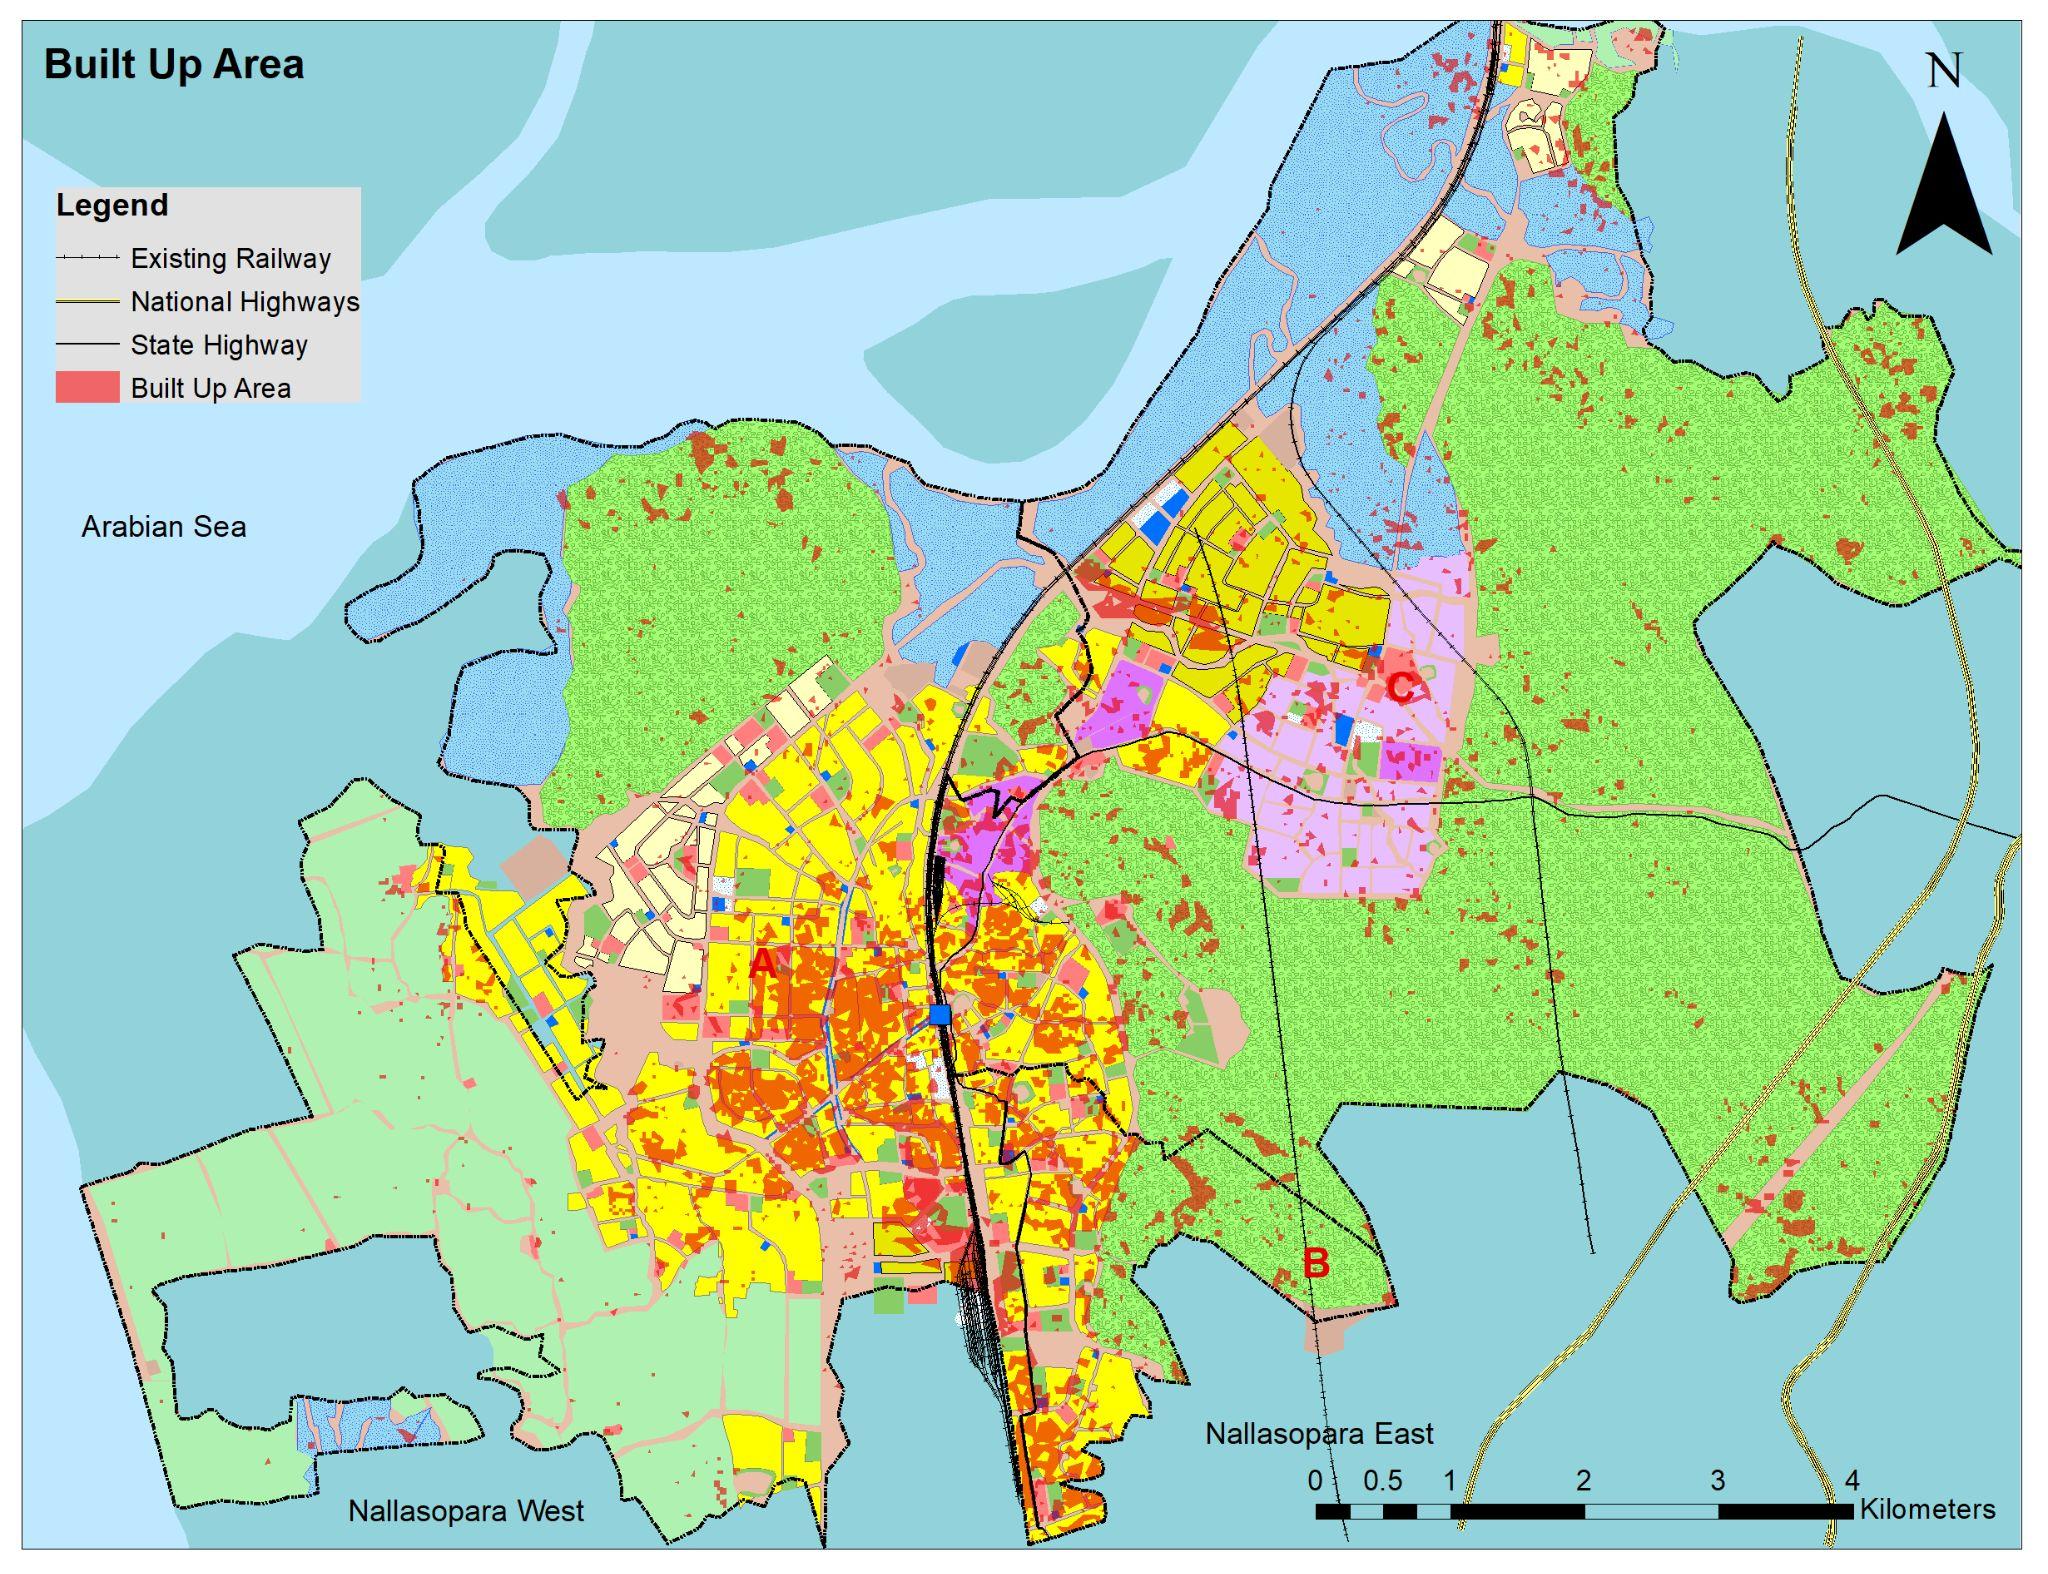
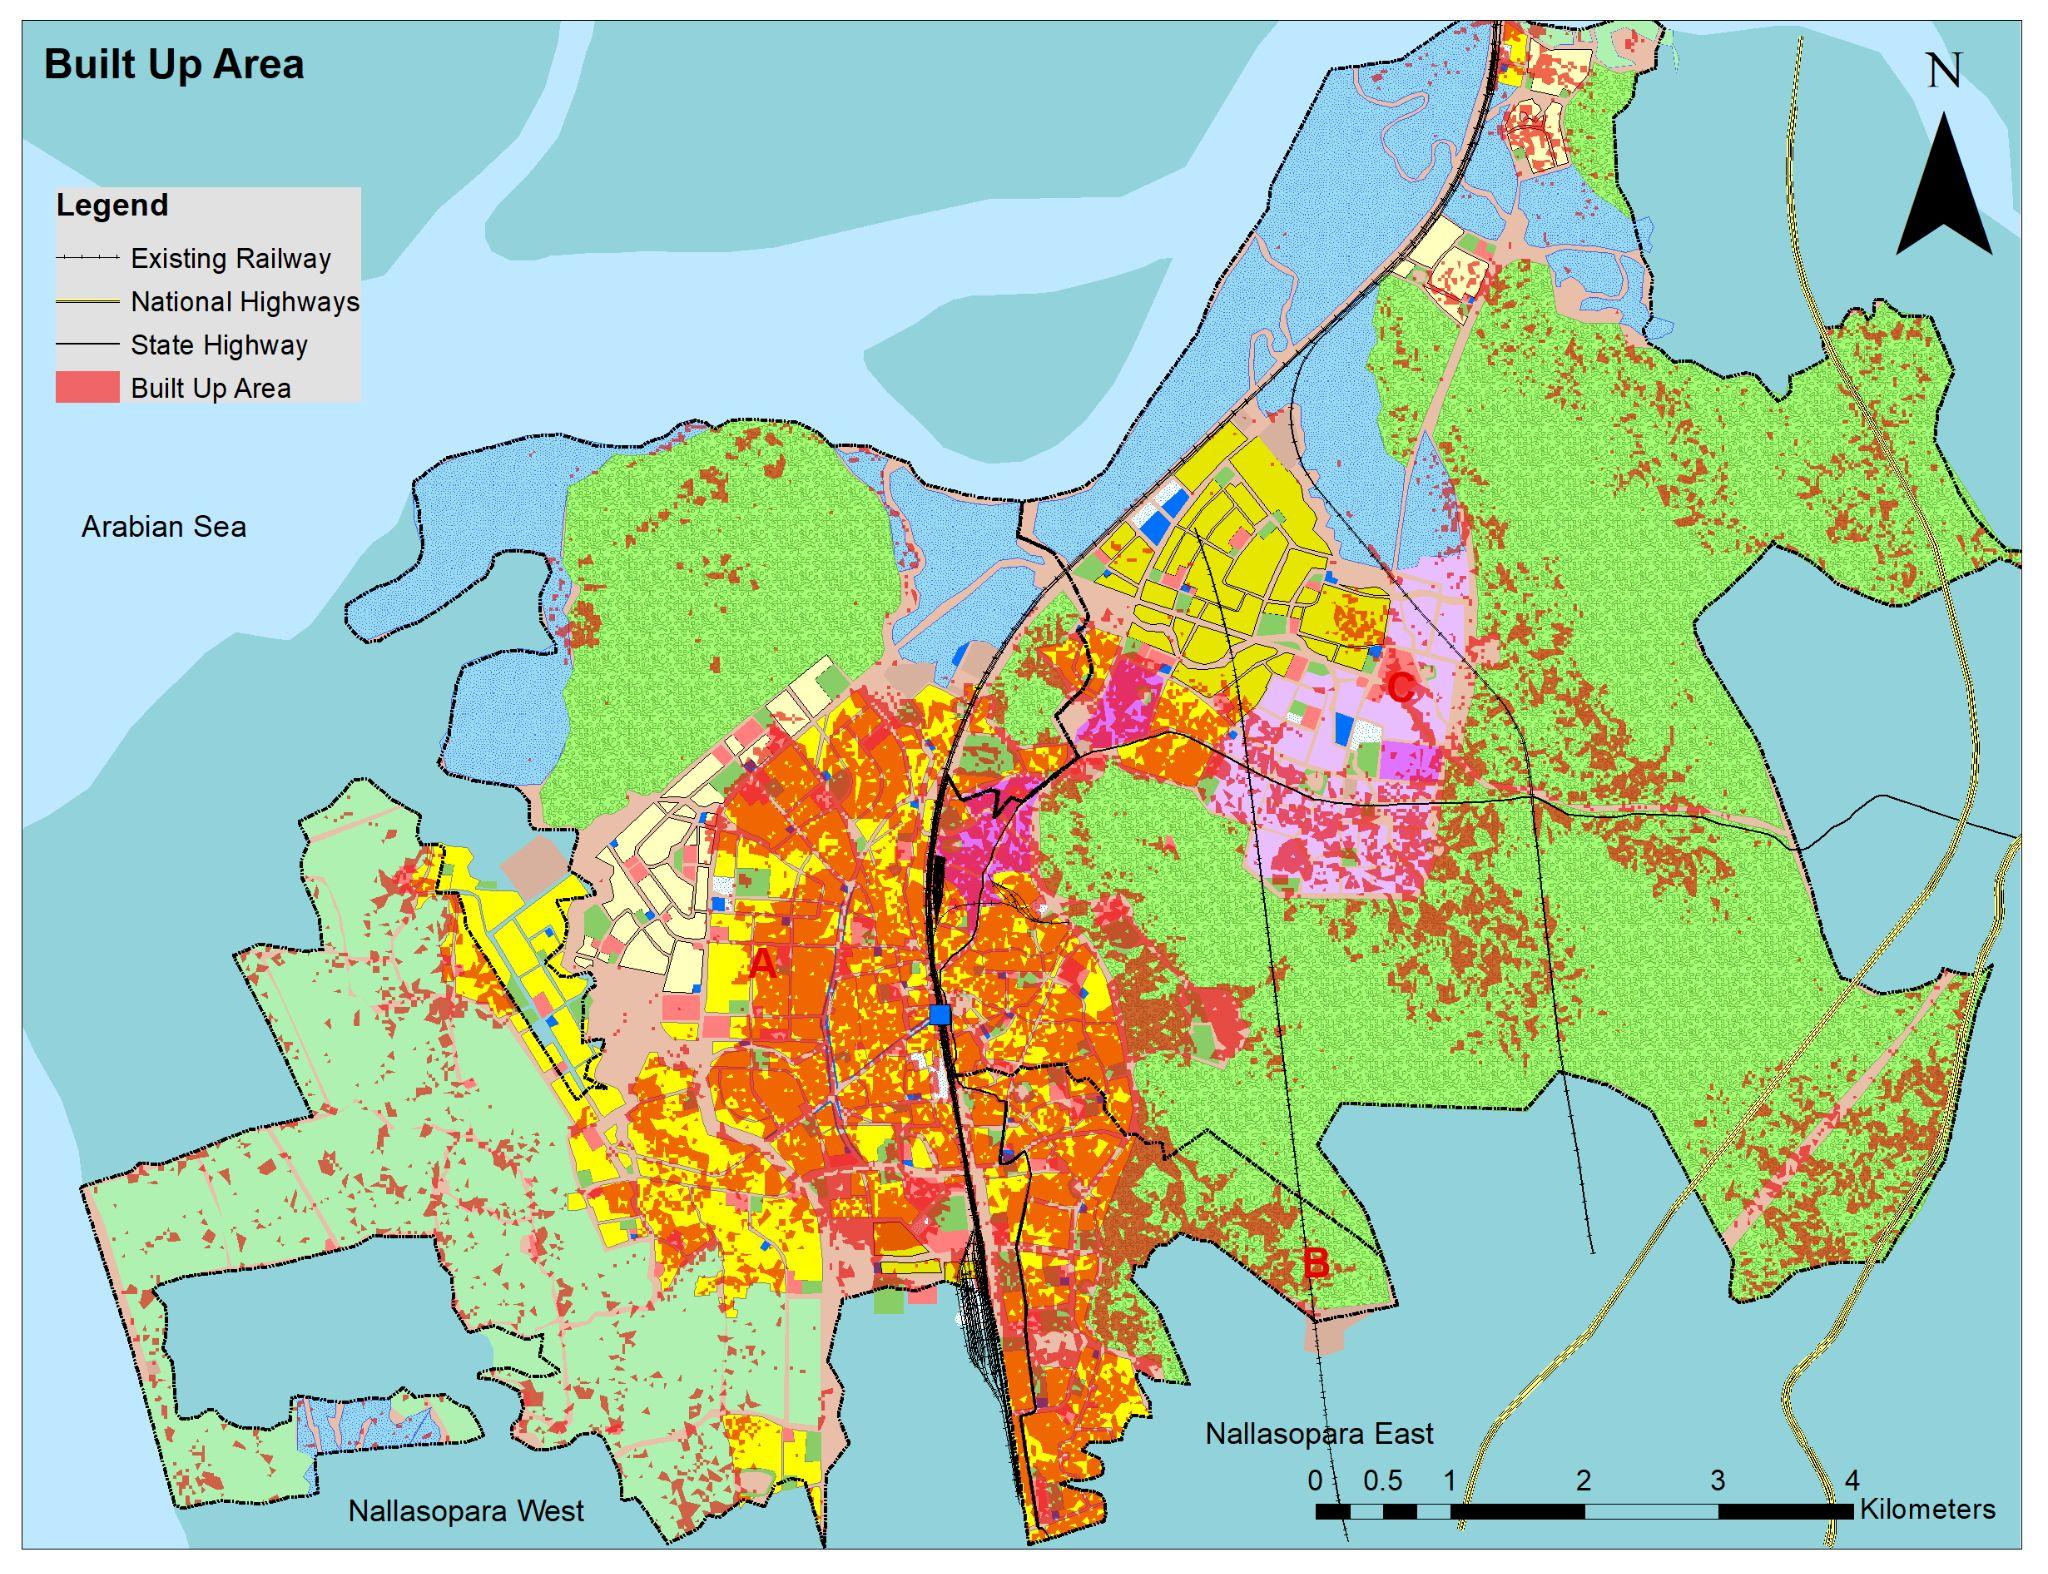
SPATIALGROWTH
1.Direction of Growth and Factors affecting Growth Direction towards Nallasopara
1990 2000 2010 2020
Rapid Urbanisation of Virar
➔ AttentiontoUrbanPlanning
➔ Improvedtransportationinfrastructure
➔ Realestatedevelopment
➔ Demographicfactors
➔ Governmentpolicies
➔ Availabilityofland
➔ Lowerpropertyprices
➔ Improvedconnectivity
Growth Towards Nallasopara
➔ Availability of large tracts of undeveloped land along the Mumbai-Ahmedabad highway
➔ Attractive destination for real estate developers
➔ Relatively lower property prices than in otherpartsofMumbai
➔ Spillover effect from rapid development of VirarCity.
Substantial increase in population, potentially impacting infrastructure,resources,andcommunitydevelopment.
➔ Built-up area has increased by 154.68%, indicating significanturbanization.
➔ Land consumption rate is 15.45%, indicating a high rate of landconsumption.
➔ High land consumption could lead to habitat loss, environmentaldegradation,andresourcedepletion.
land consumption is growing faster than the population in the area.
Impacts of Urbanization on City's Sustainable Development -
ACase of Virar City, Maharashtra
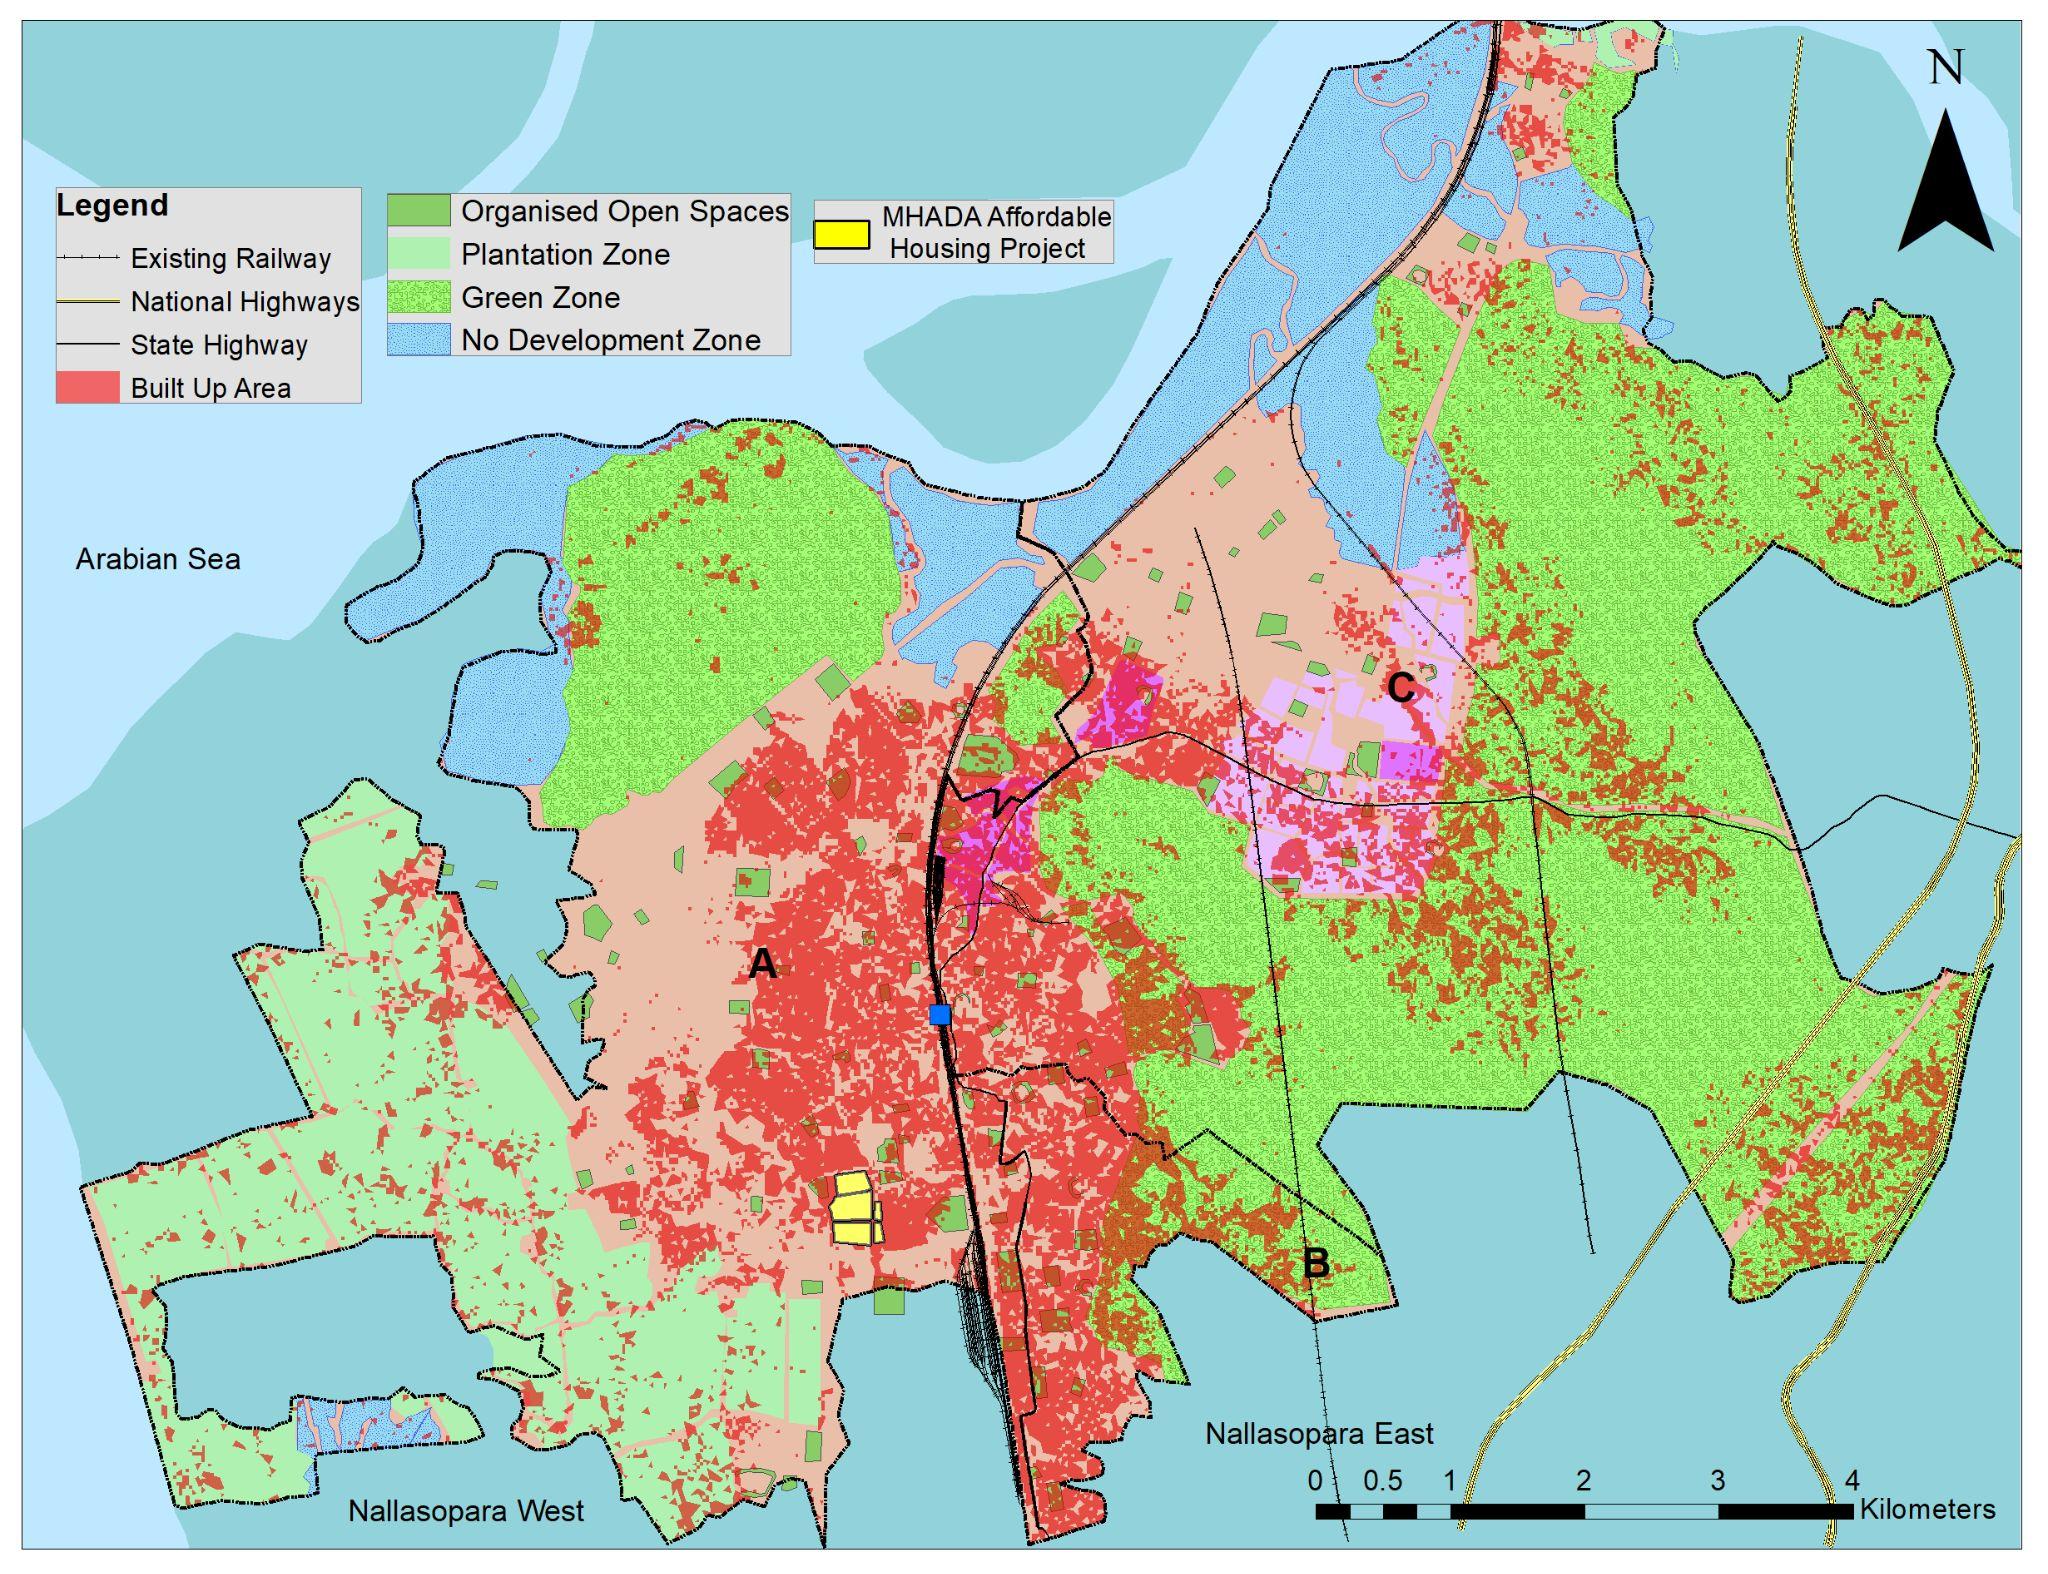
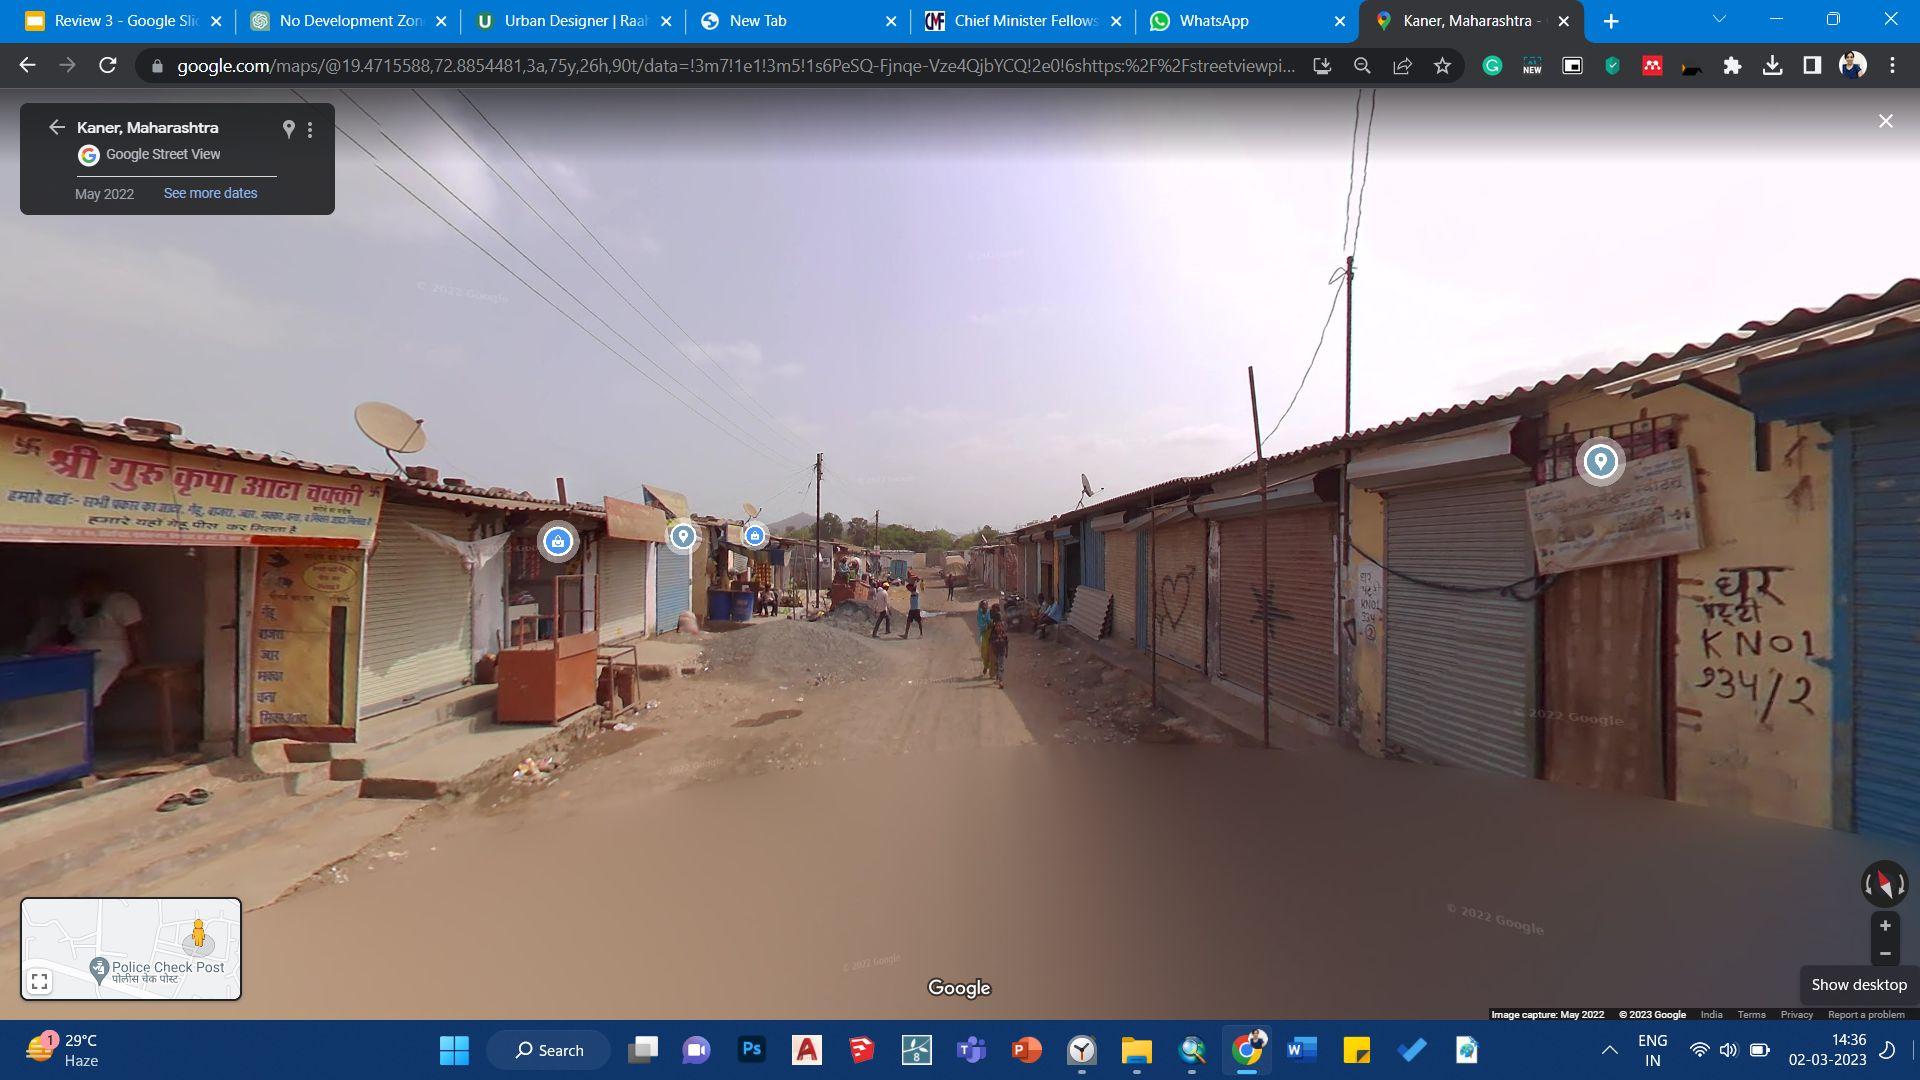
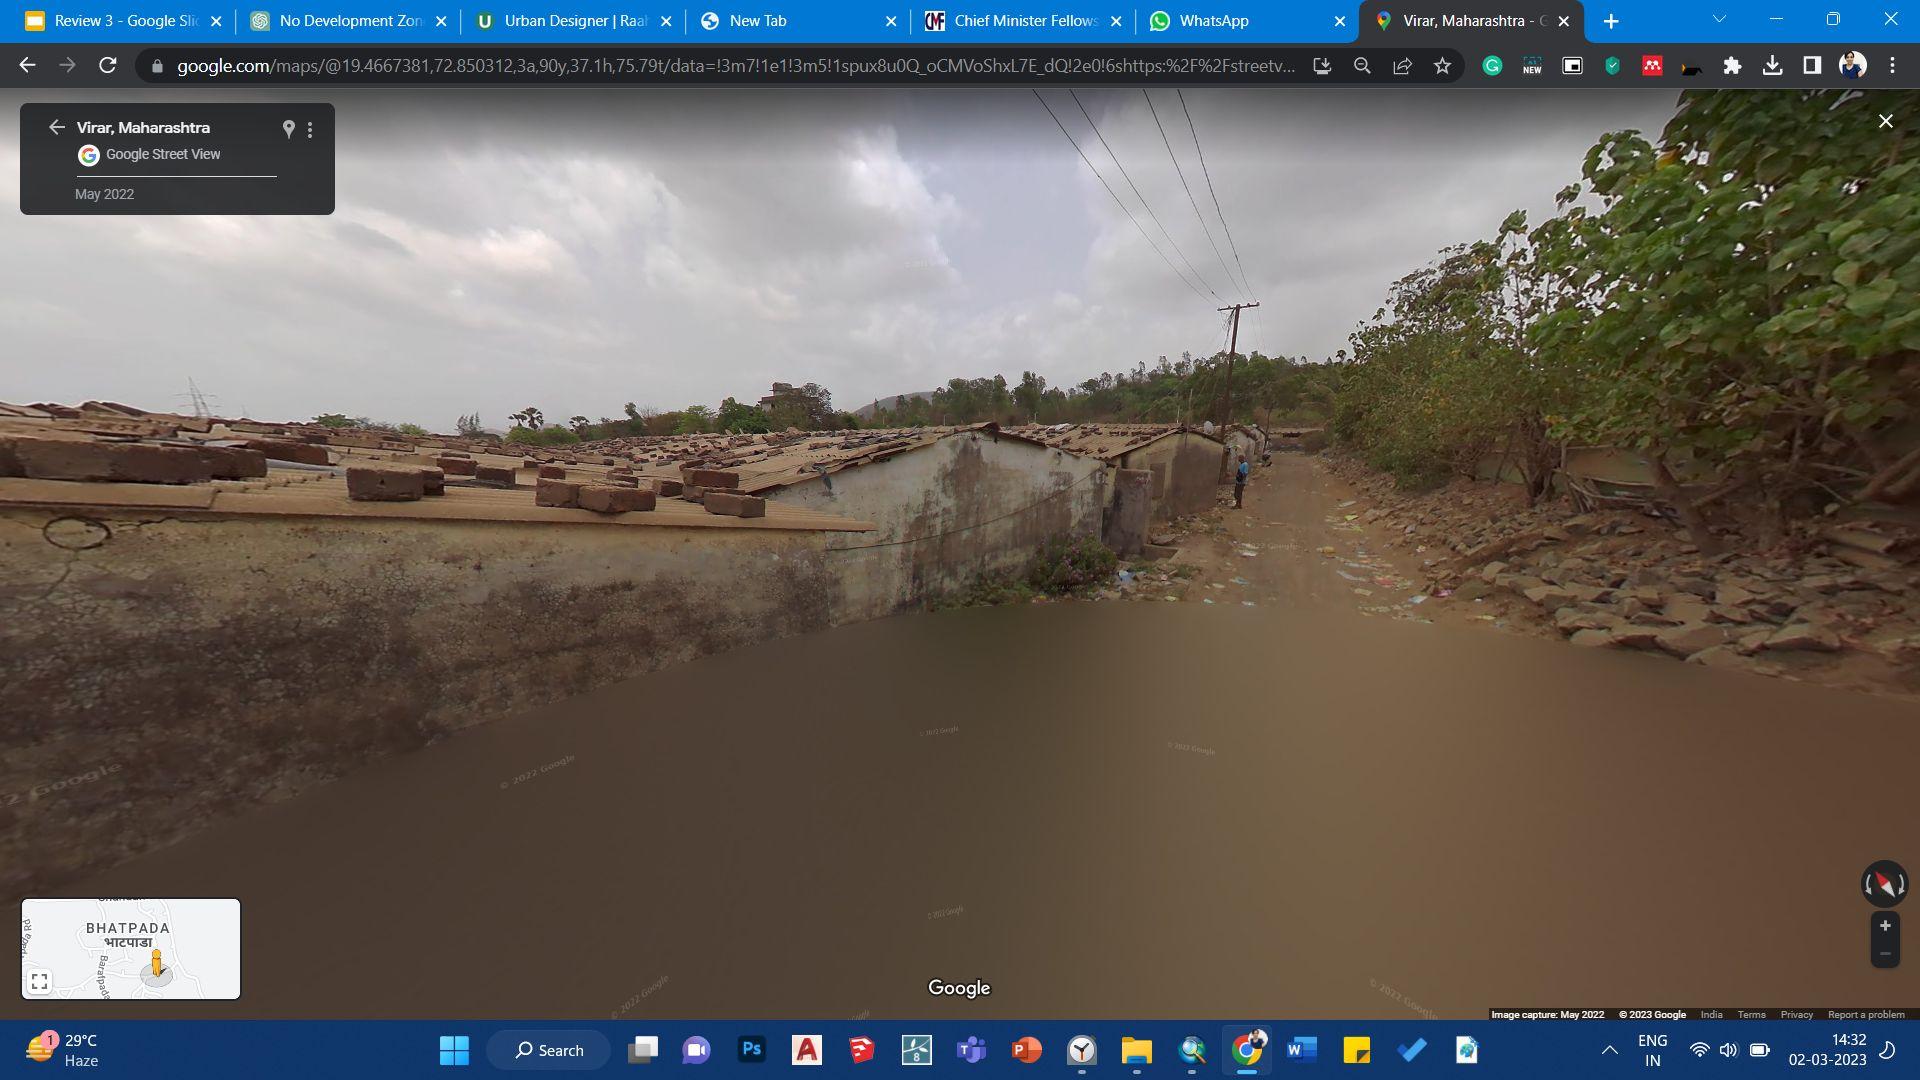
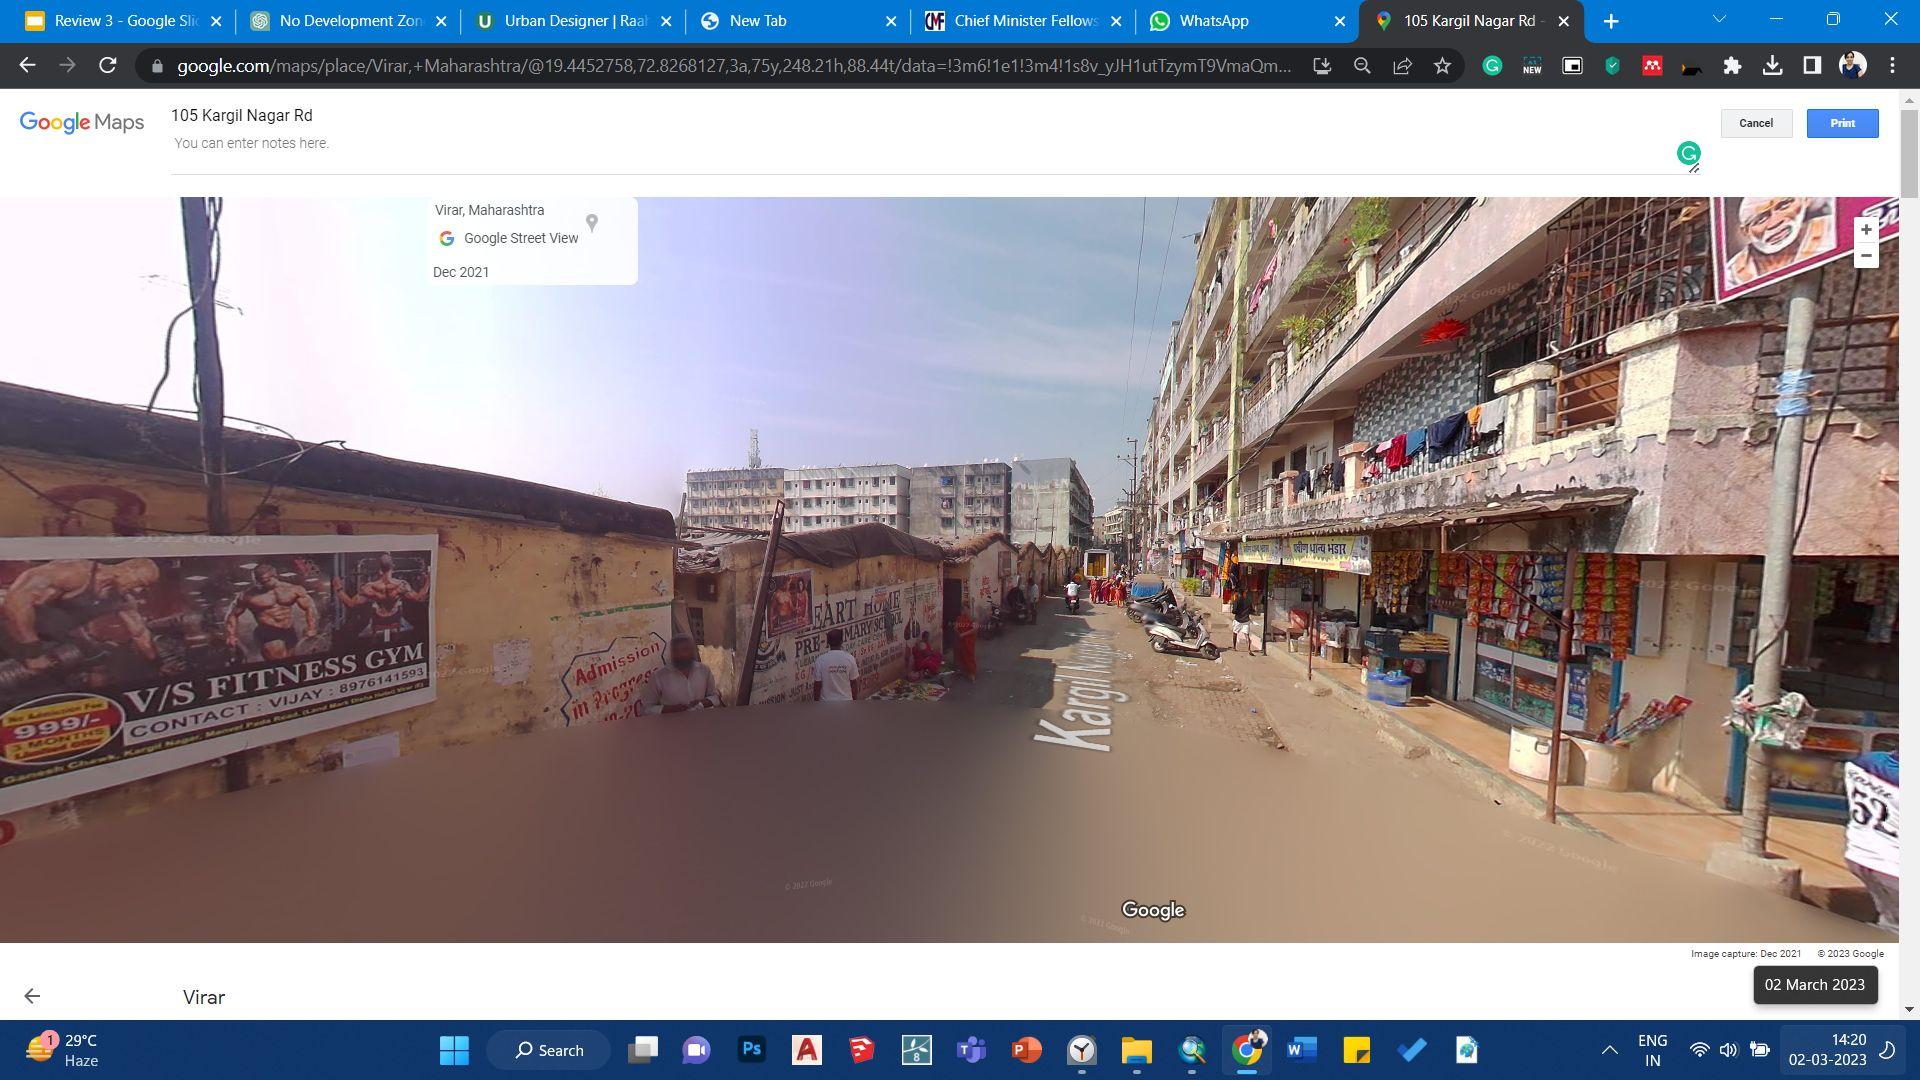
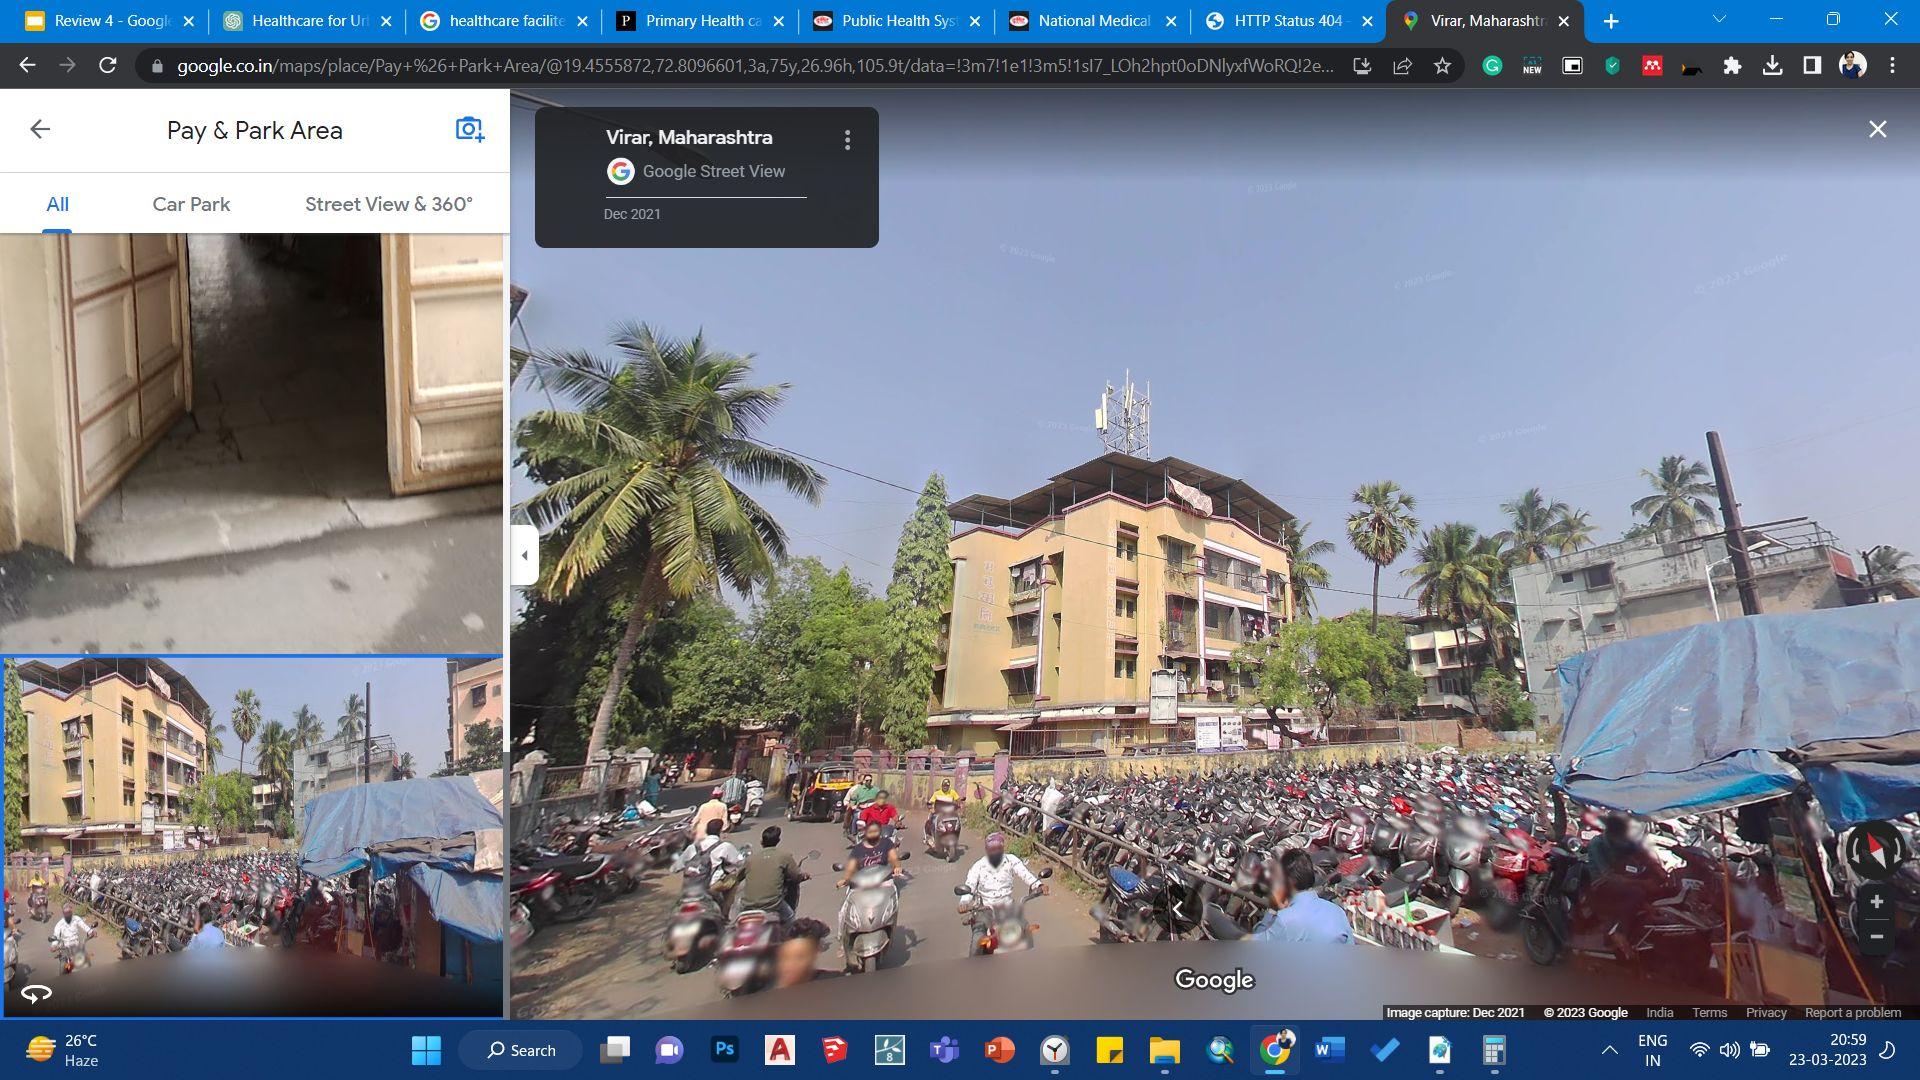
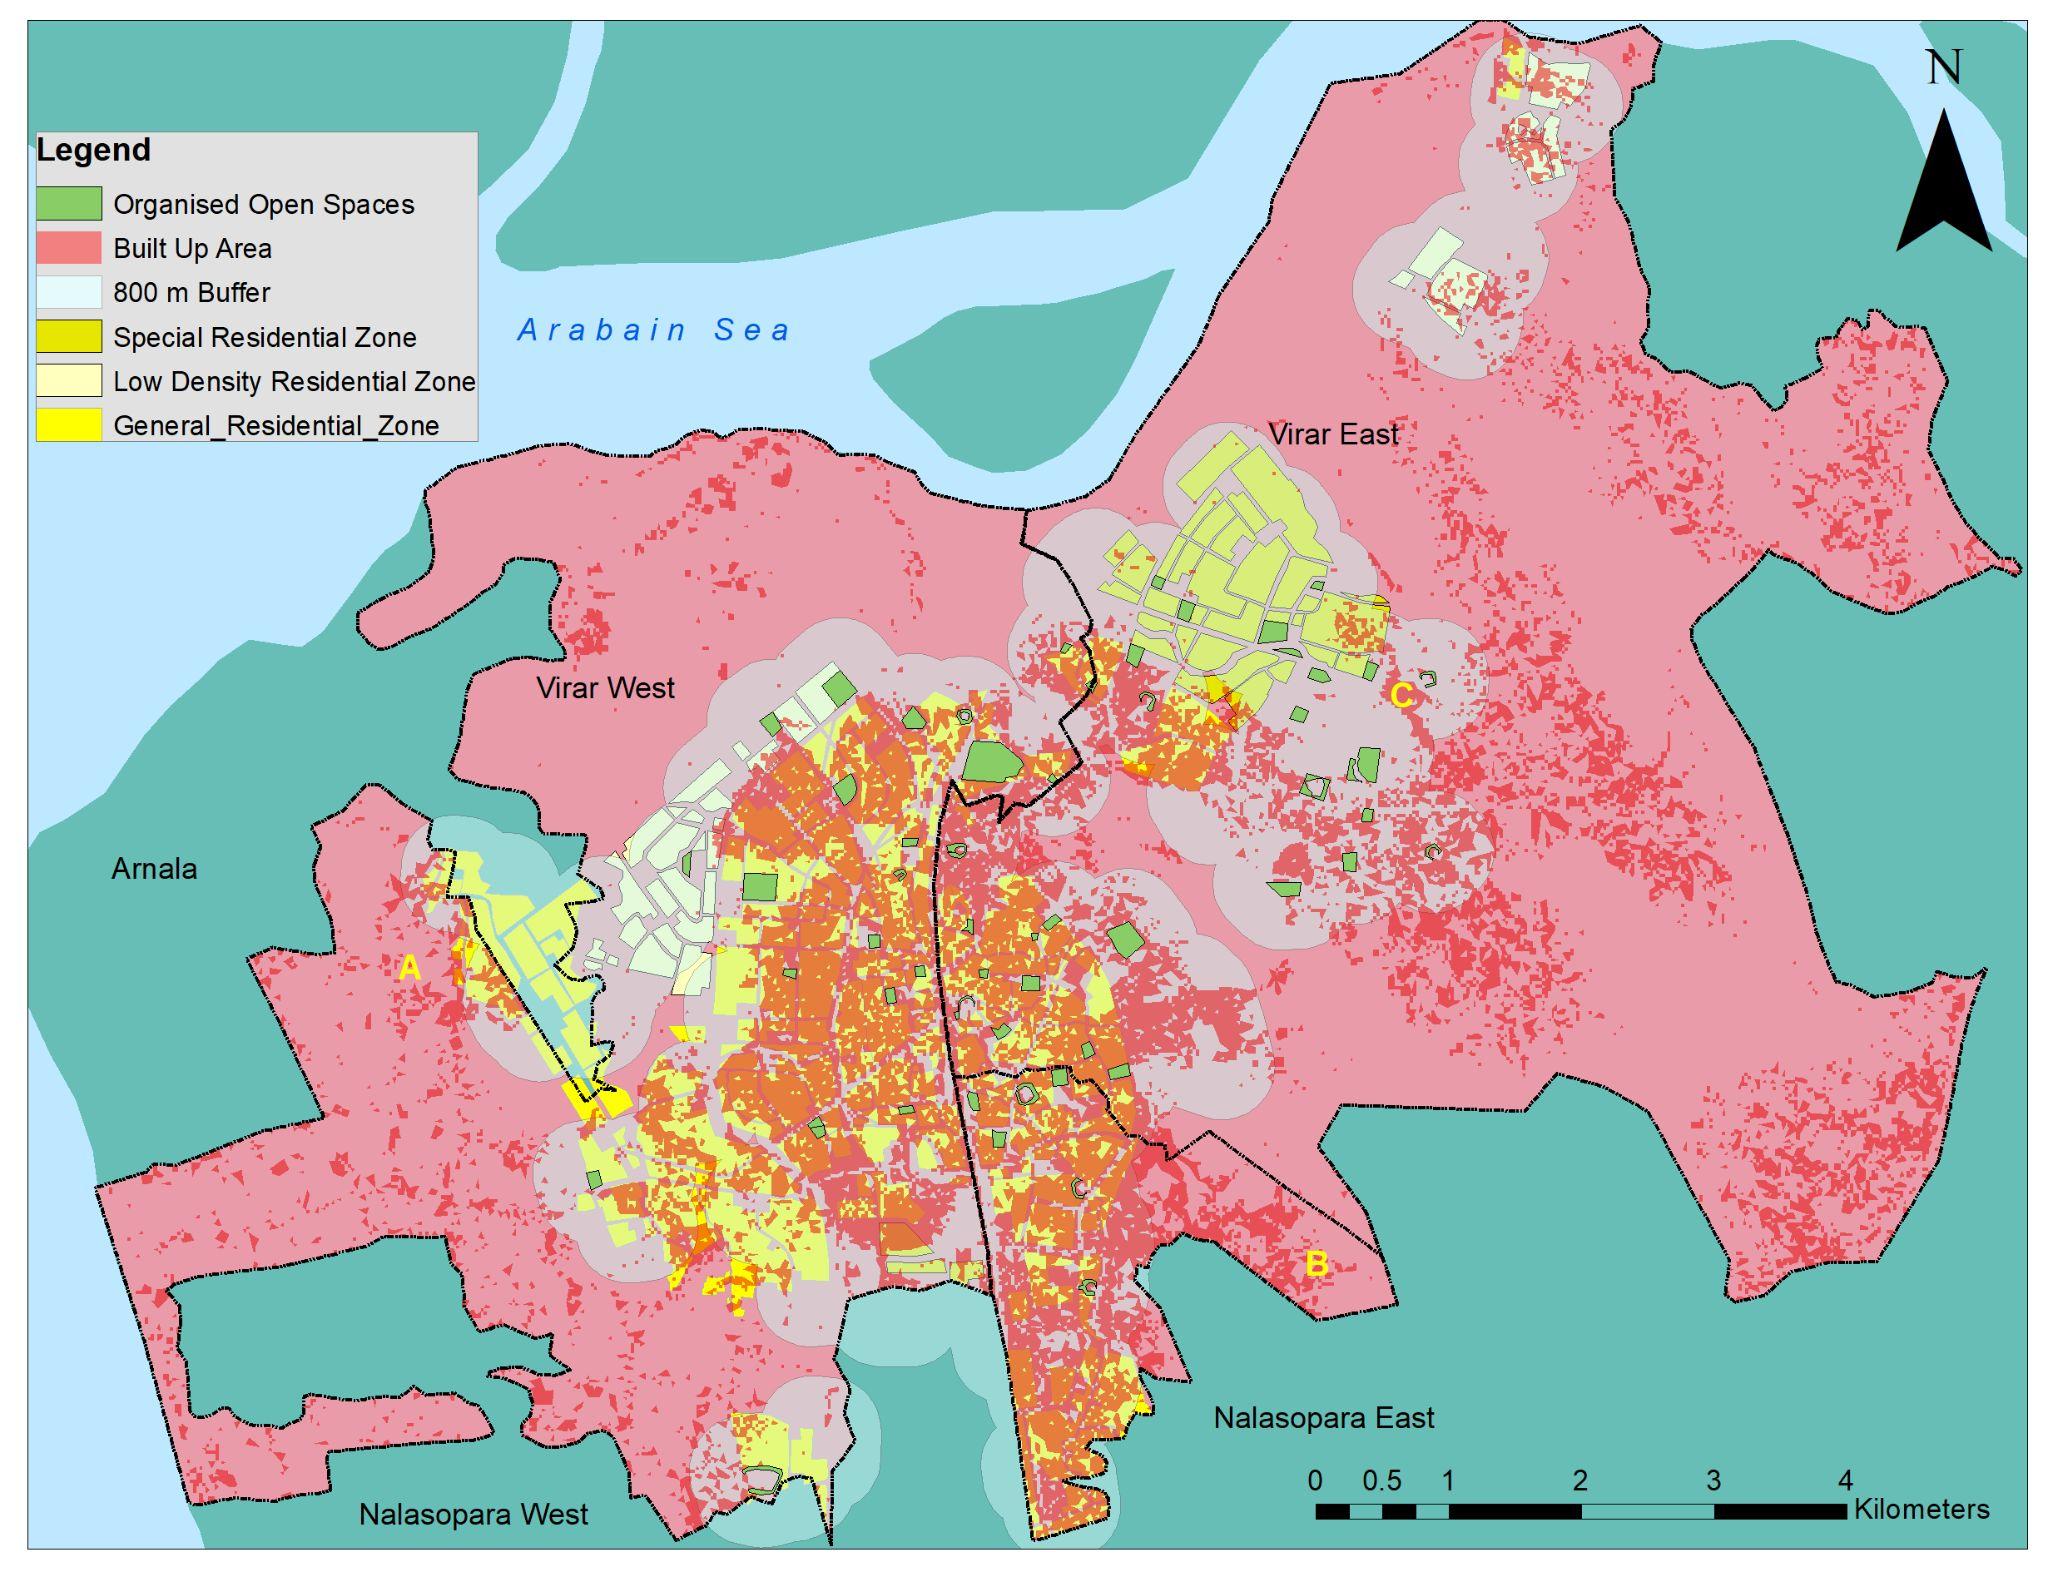
● Plantation Zone: Intended for constructionofhomes for local residents only. However, there have been reports of violations in the restriction of built-up areainthiszone.
● Green Zone: Not designated for residential use. In recent years, slum mafias have increasingly encroached upon this area, particularly along State Highway 40.
● Special Residential Zone: This zone has not seen any affordable housing projects being developed.
● Industrial Zone: Despite being reserved for industrial development, this area has been subjected to encroachment.
● Coastal Regulation Zone: The native fishing community is not following FSI (floor space index) bye-lawsinthiszone.
ENCROACHMENT &AFFORDABLE HOUSING PROJECT
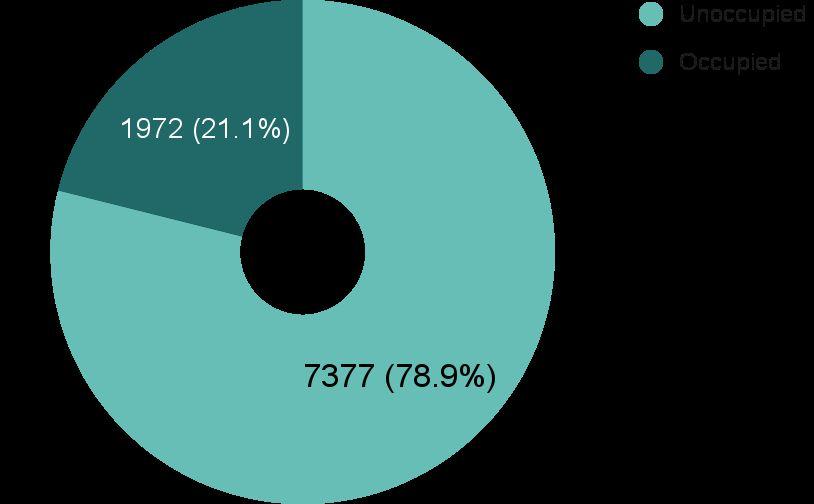
5. Occupancy in MHADAAffordable Housing
Low occupancy in MHADA buildings due to competition with similarly priced private builder properties. No choice of flats available in MHADA lottery, with allotment being the only option. Some MHADA housing scheme buildings face issues with inadequate water supply at times.
1. Percentage Built up in restricted areas 2. Marking of encroachment zones
3.
Indicator Value Comments
a) Percentage of people living in Slum/Informal Settlements households (SISH):(for VVMC) 2011
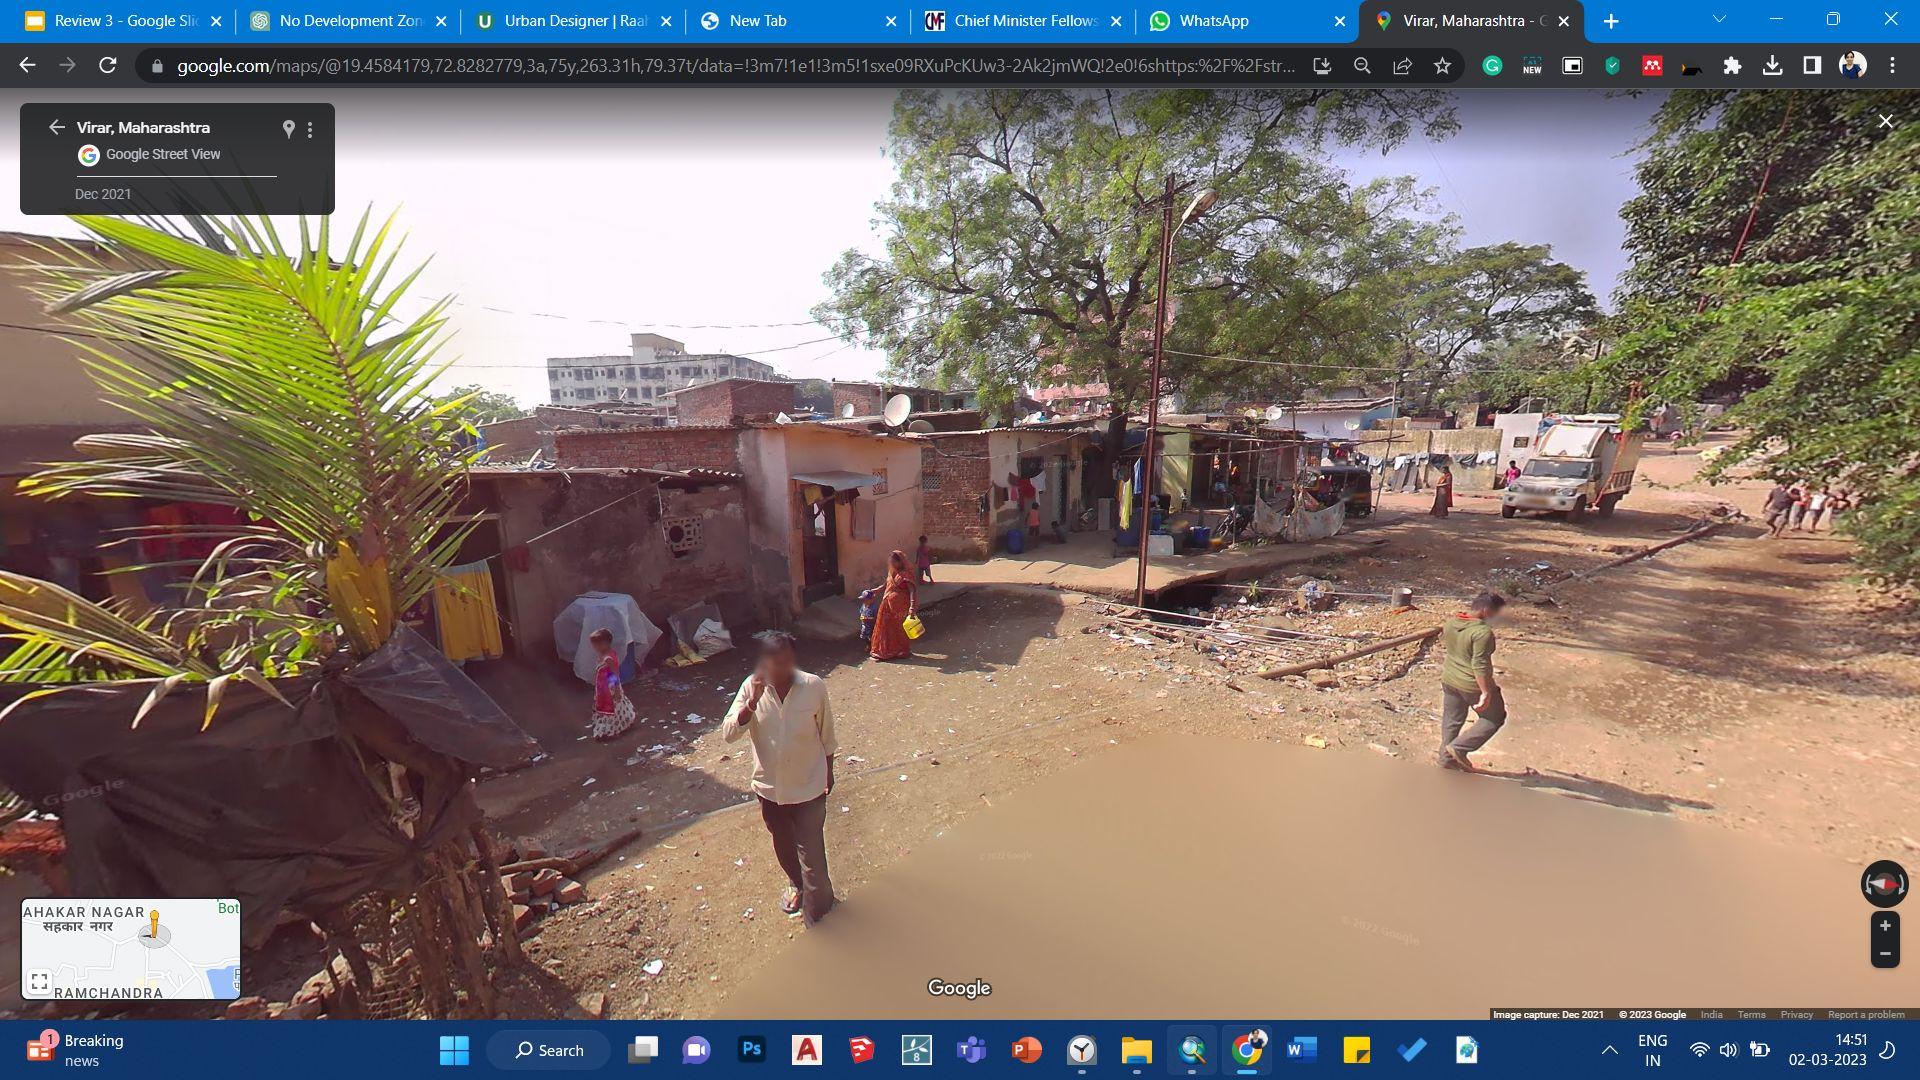
2.85% ➔ The Green Zone in Virar city has witnessed an increase in encroachment.
➔ As of 2011, there was only one non-notified slum in VVMC.
b) Percentage of land encroached for Slum/Informal Settlement 25.69% (Percentage Increase 202.08%)
Reasons for formation of slums In Virar:
● Rural to Urban Migration.
● Mumbai to Virar Migration.
● Lack of affordable housing for EWS and LIG.
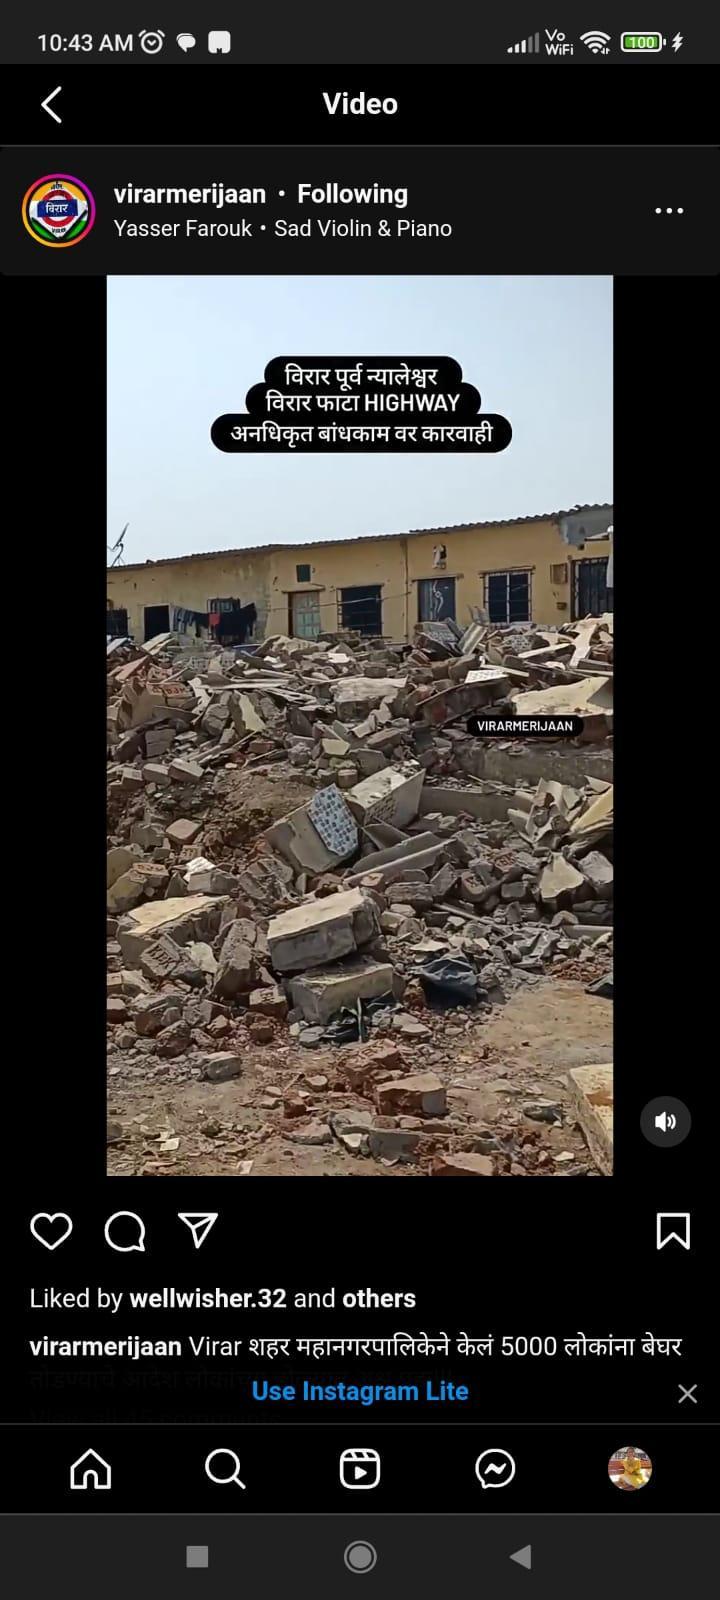
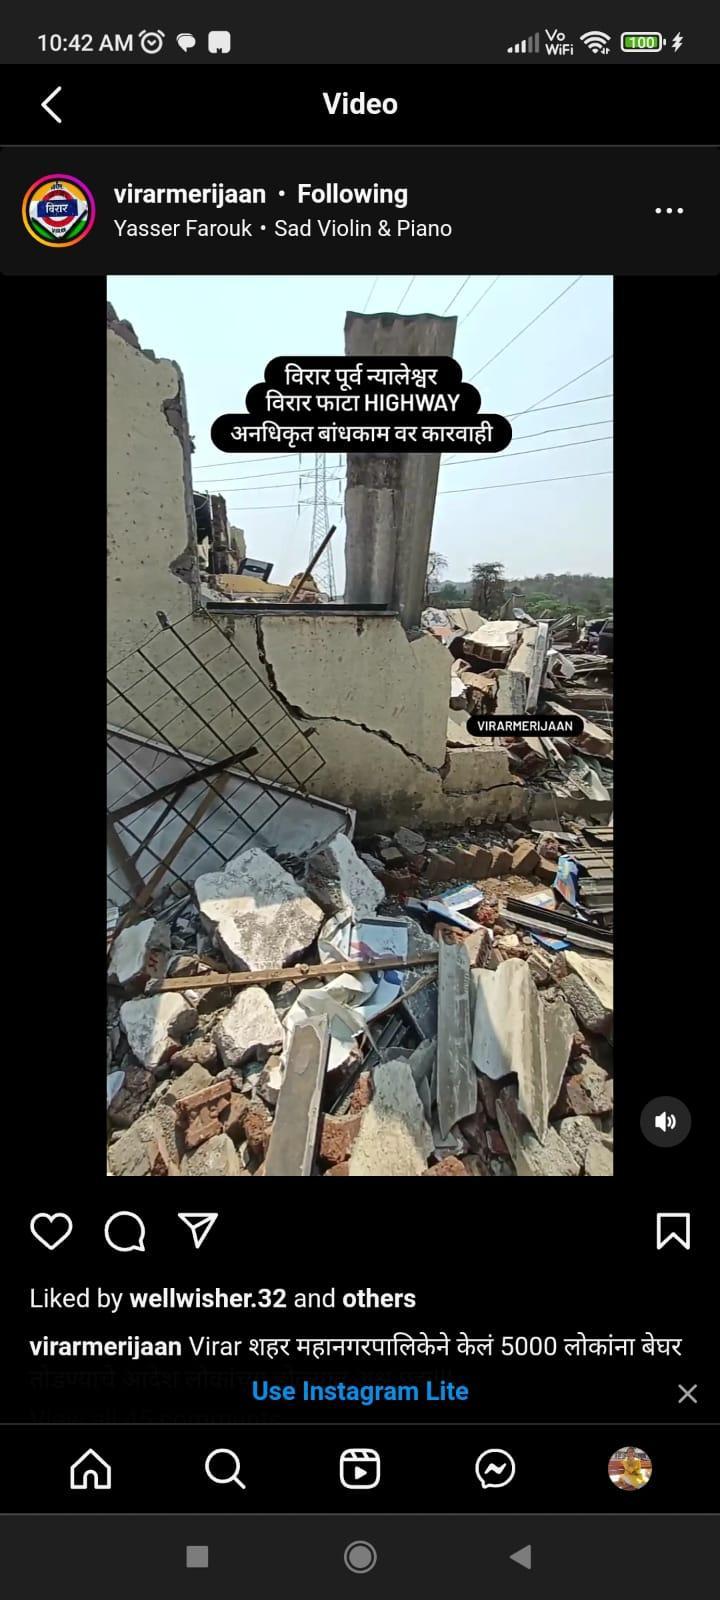
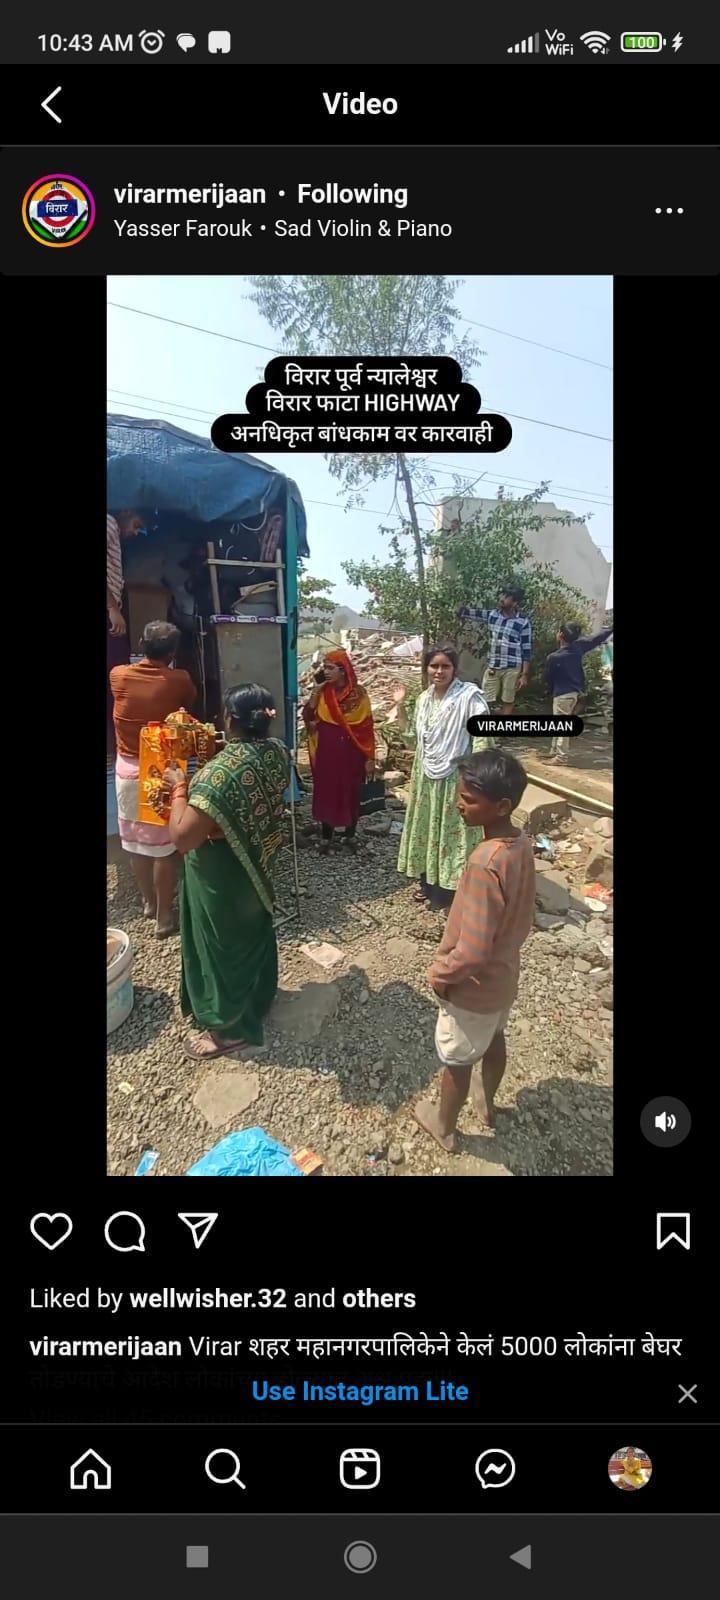
➔ Recently, 5000 people were uprooted from their informal encroachment settlement near Virar Phata.
● The provision for special housing is made in the CDP 2027. But no housing societies have been developed.
● The mispredicted growth direction has led to the formation of slums near South East direction of the city.
● Slum Mafia encroachment of Land and sale of these slum units.
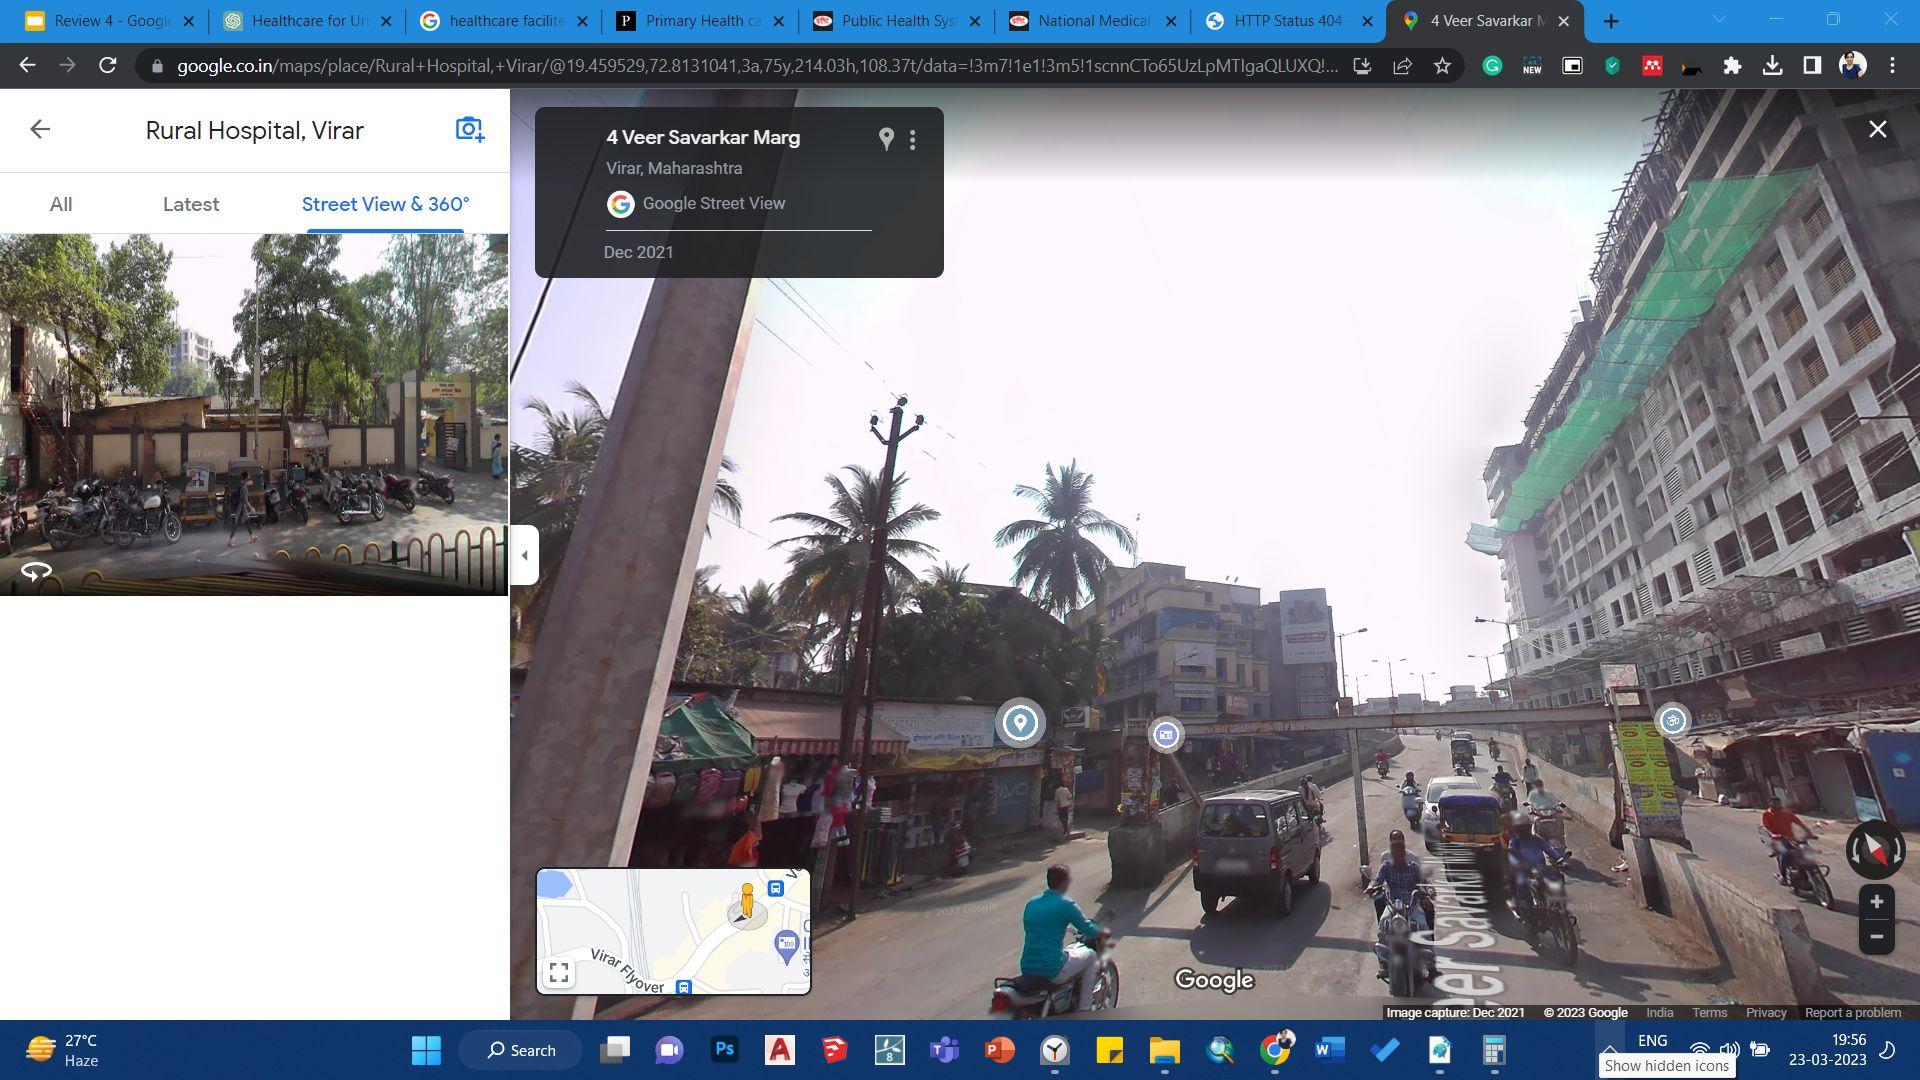
Source: VVMC Public Works Department, Google Maps
% of Land Encroached & 4. % Increase in Green Zone
Source: Google Street View
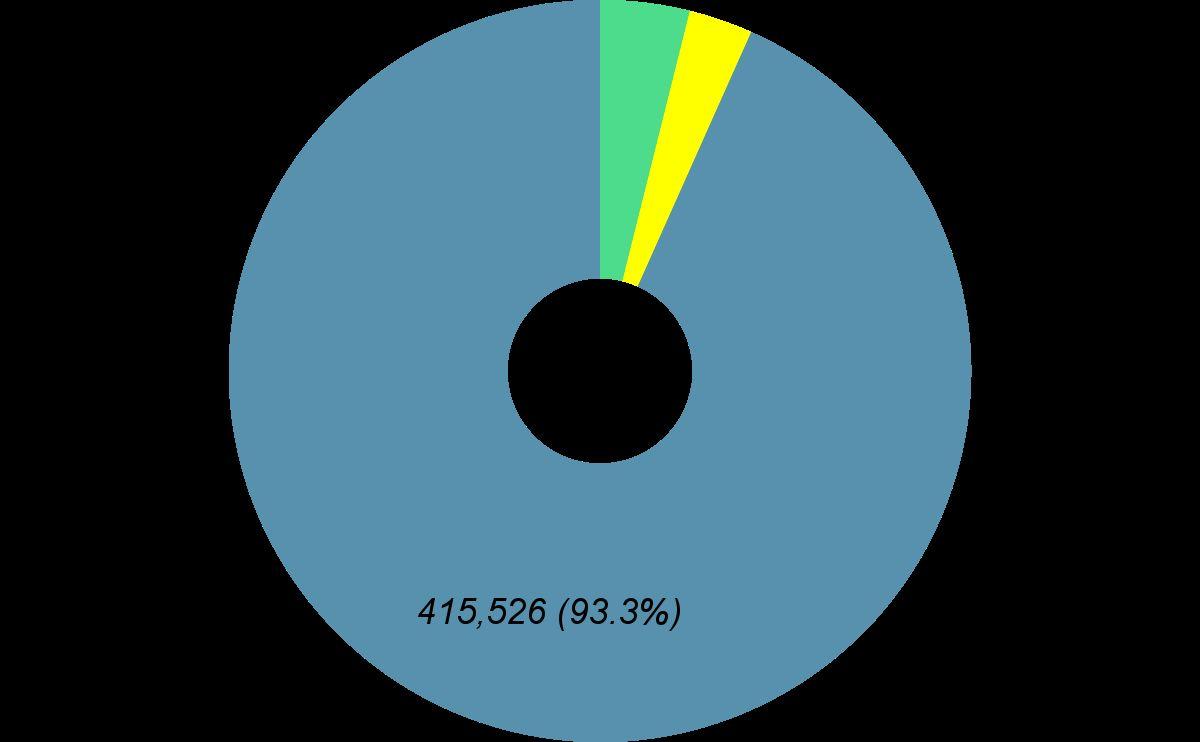
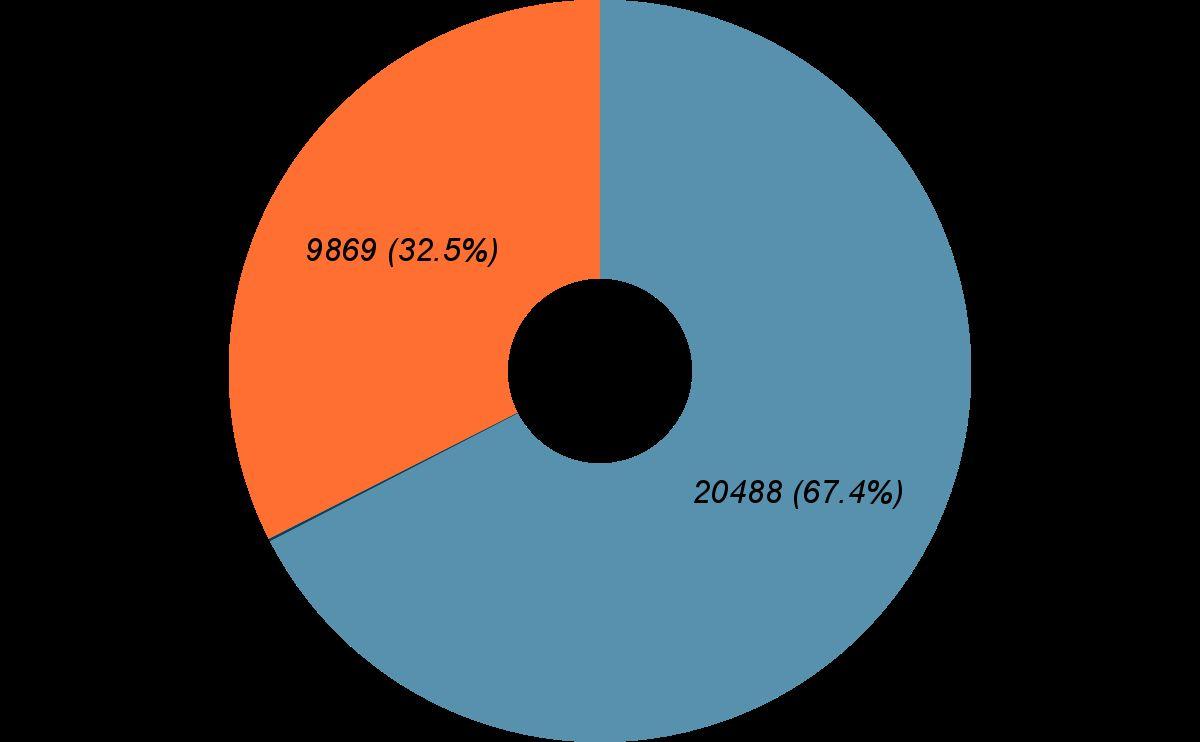
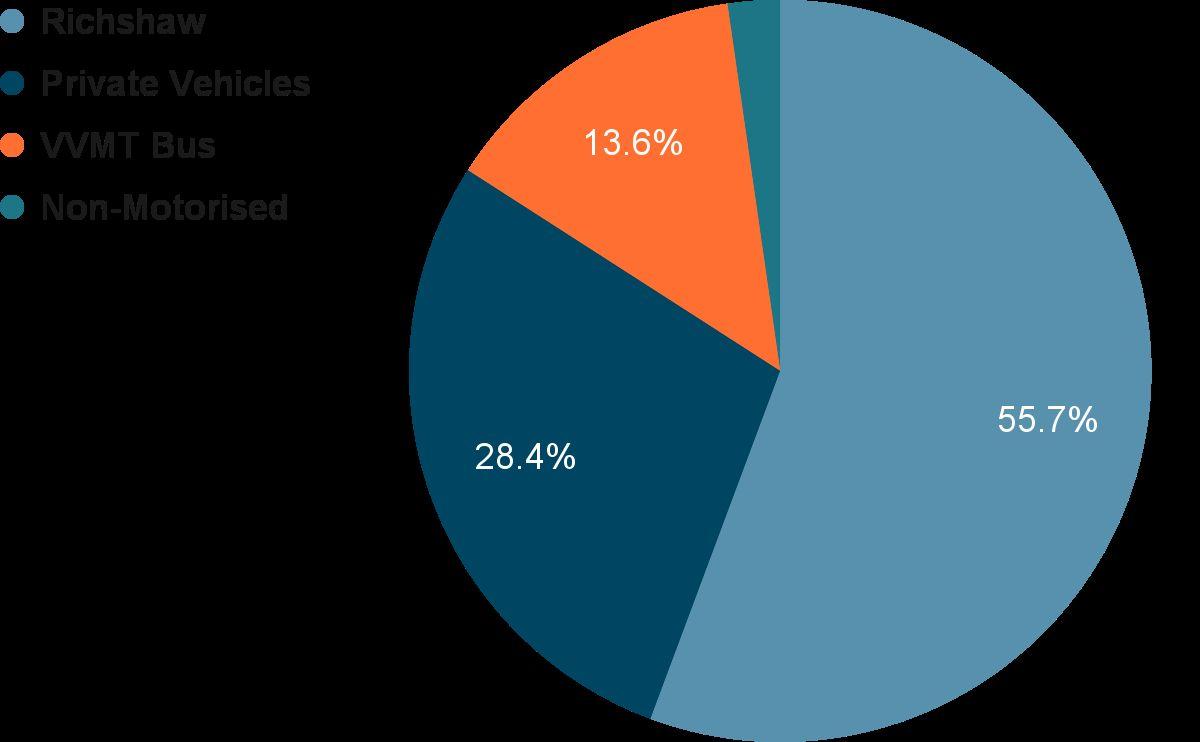
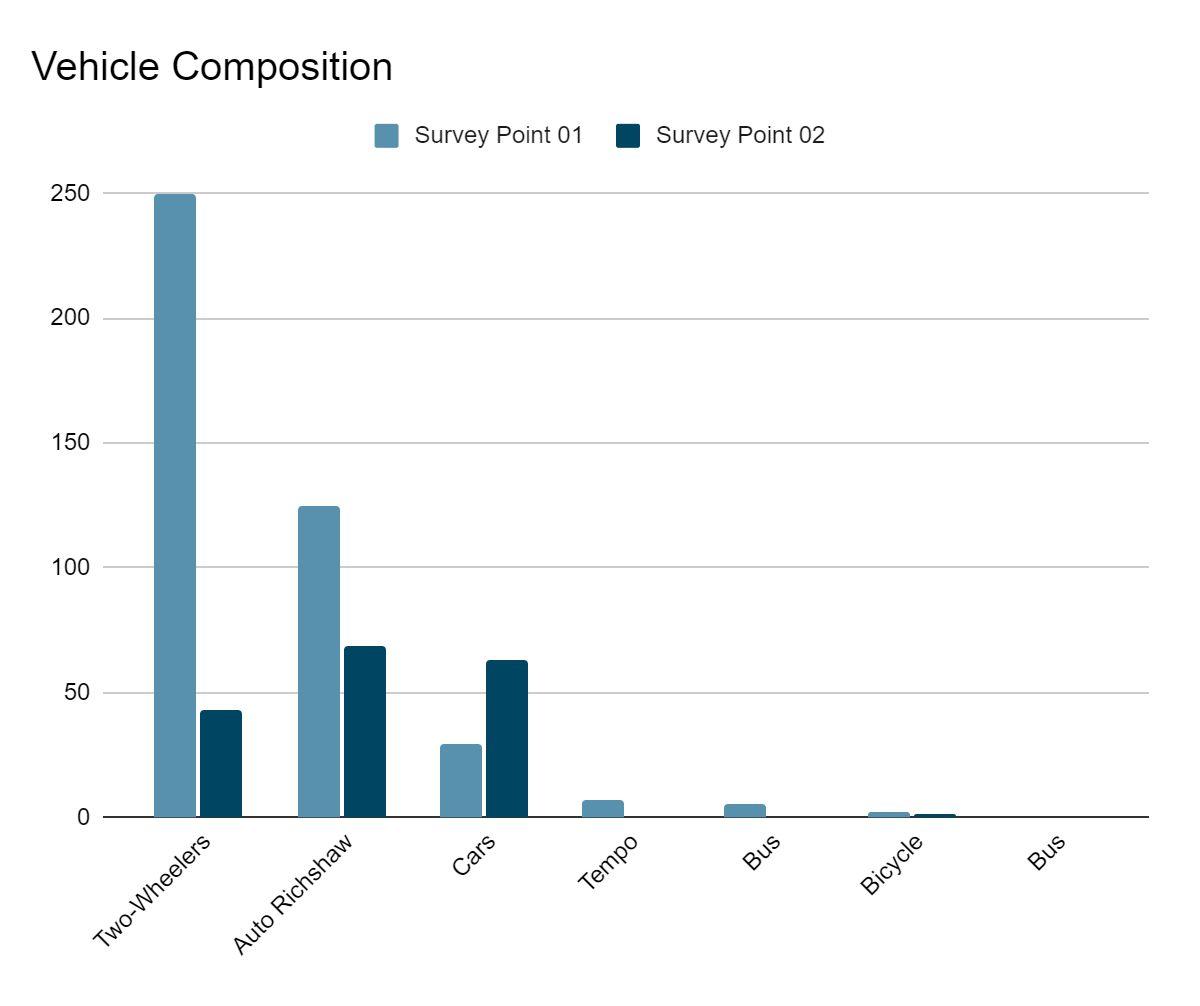
Virar city transportation system profile 2023
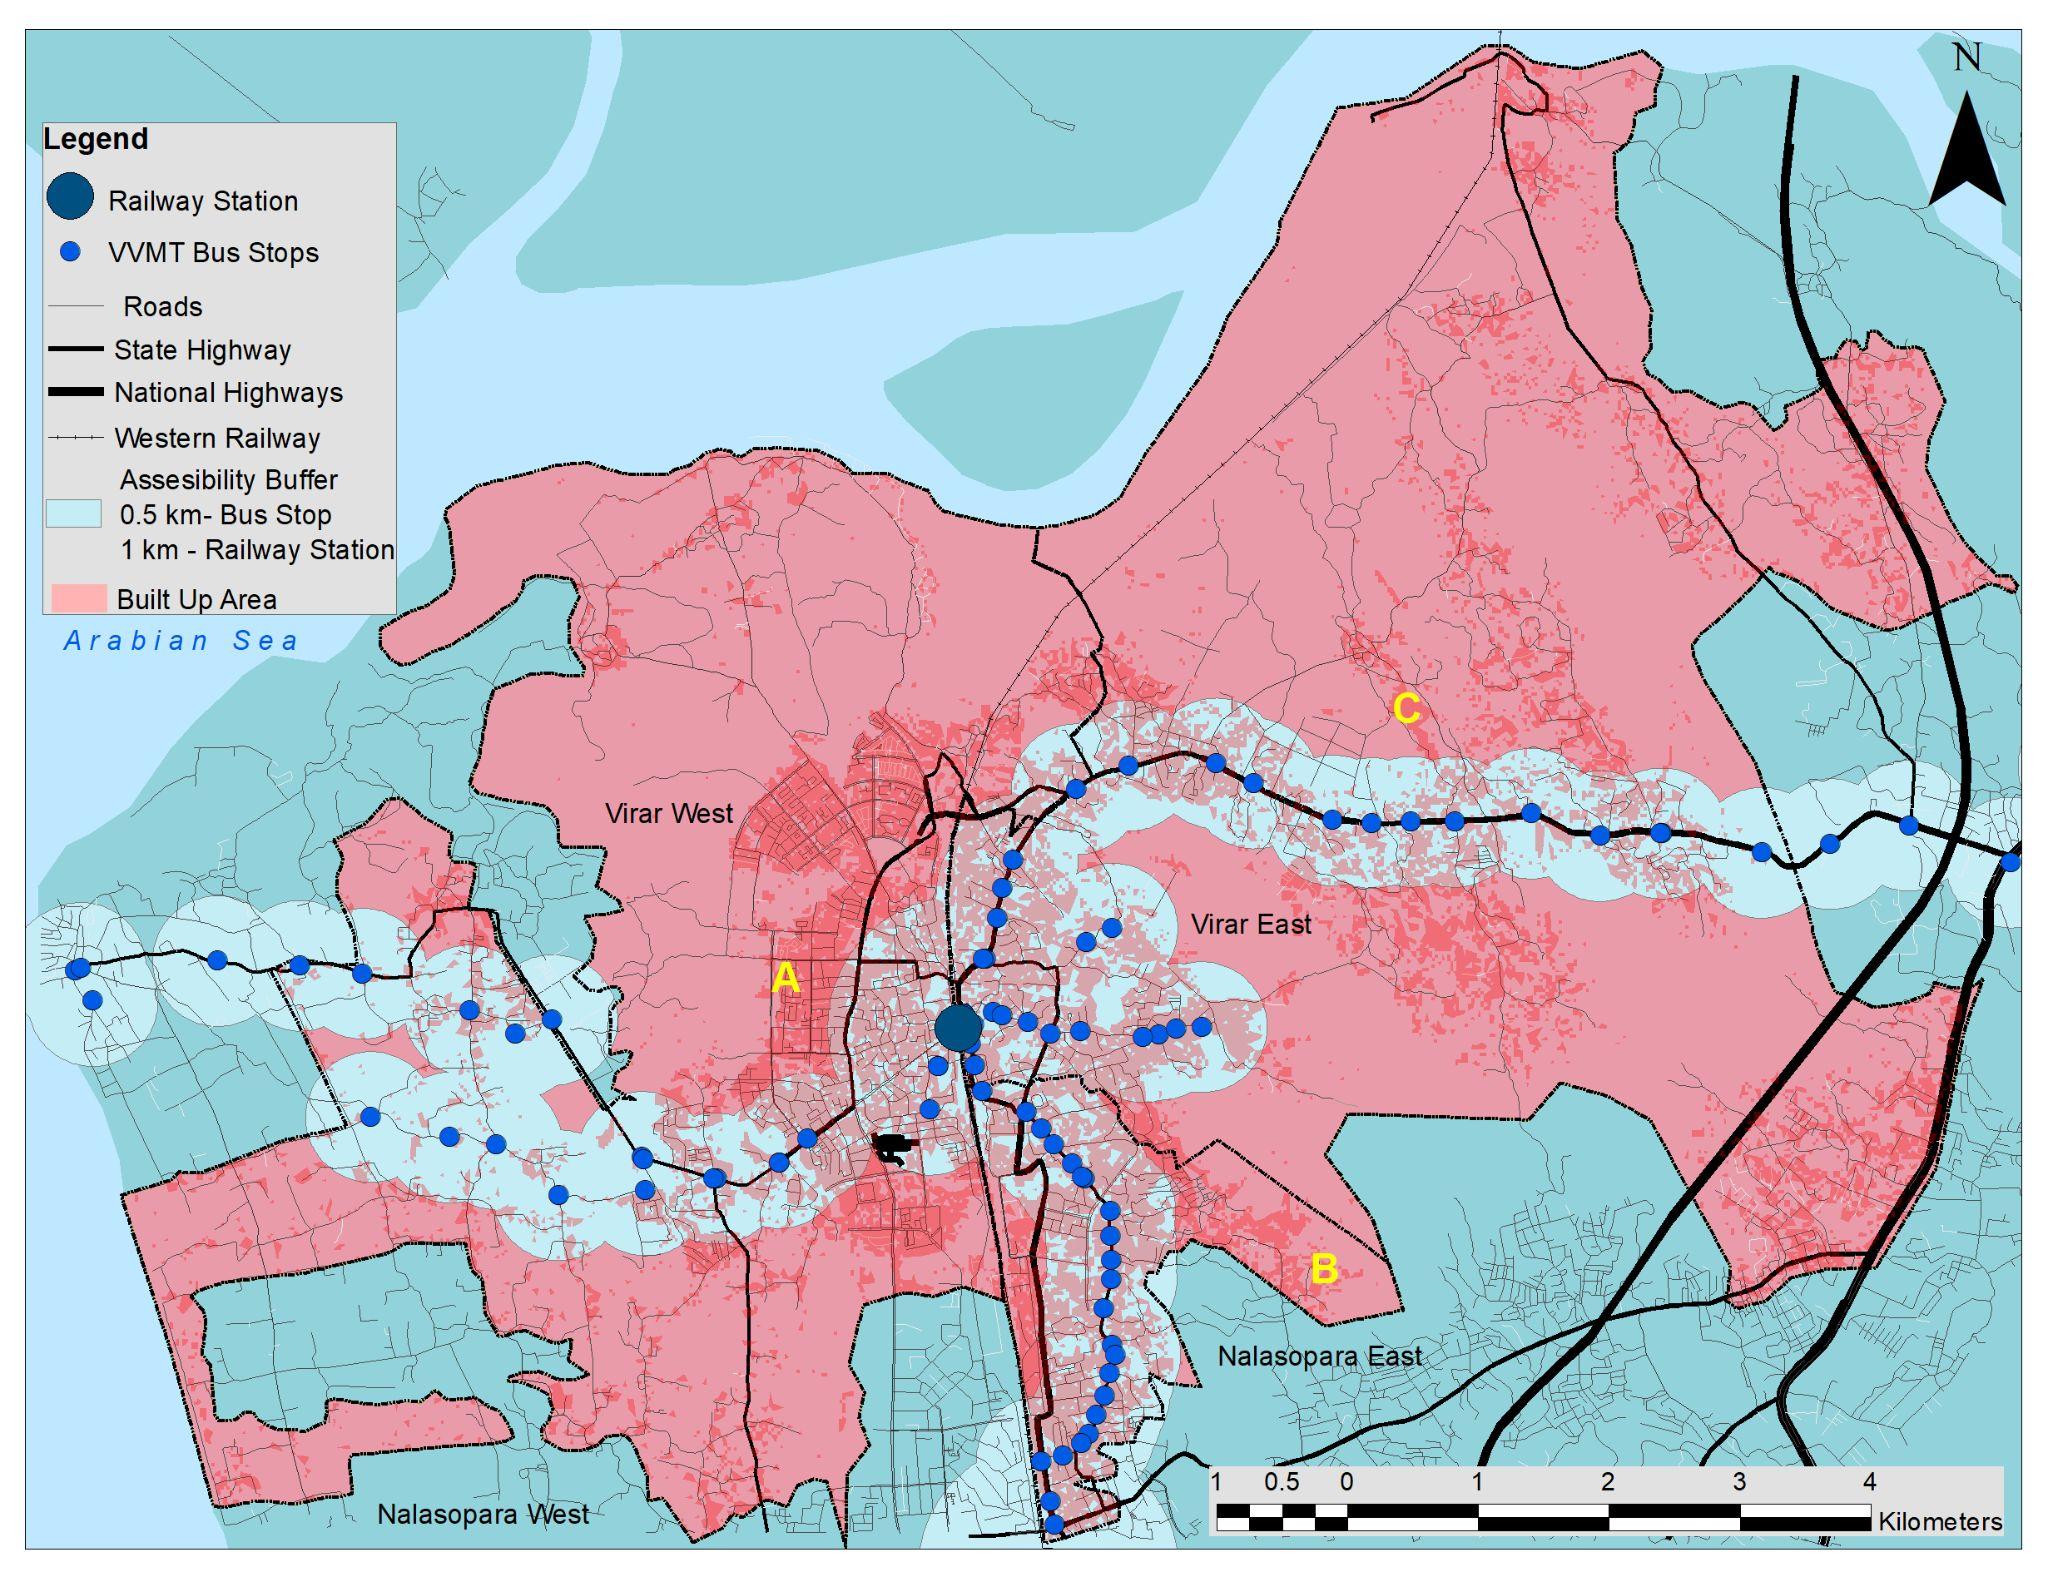
ConvenientAccess to Public Transport
Source: VVMT, Google Earth
Impacts of Urbanization on City's Sustainable DevelopmentACase of Virar City, Maharashtra
● Around 50% of the the total built up does not have access to the public transportation & Highest no. of trains are for Churchgate.
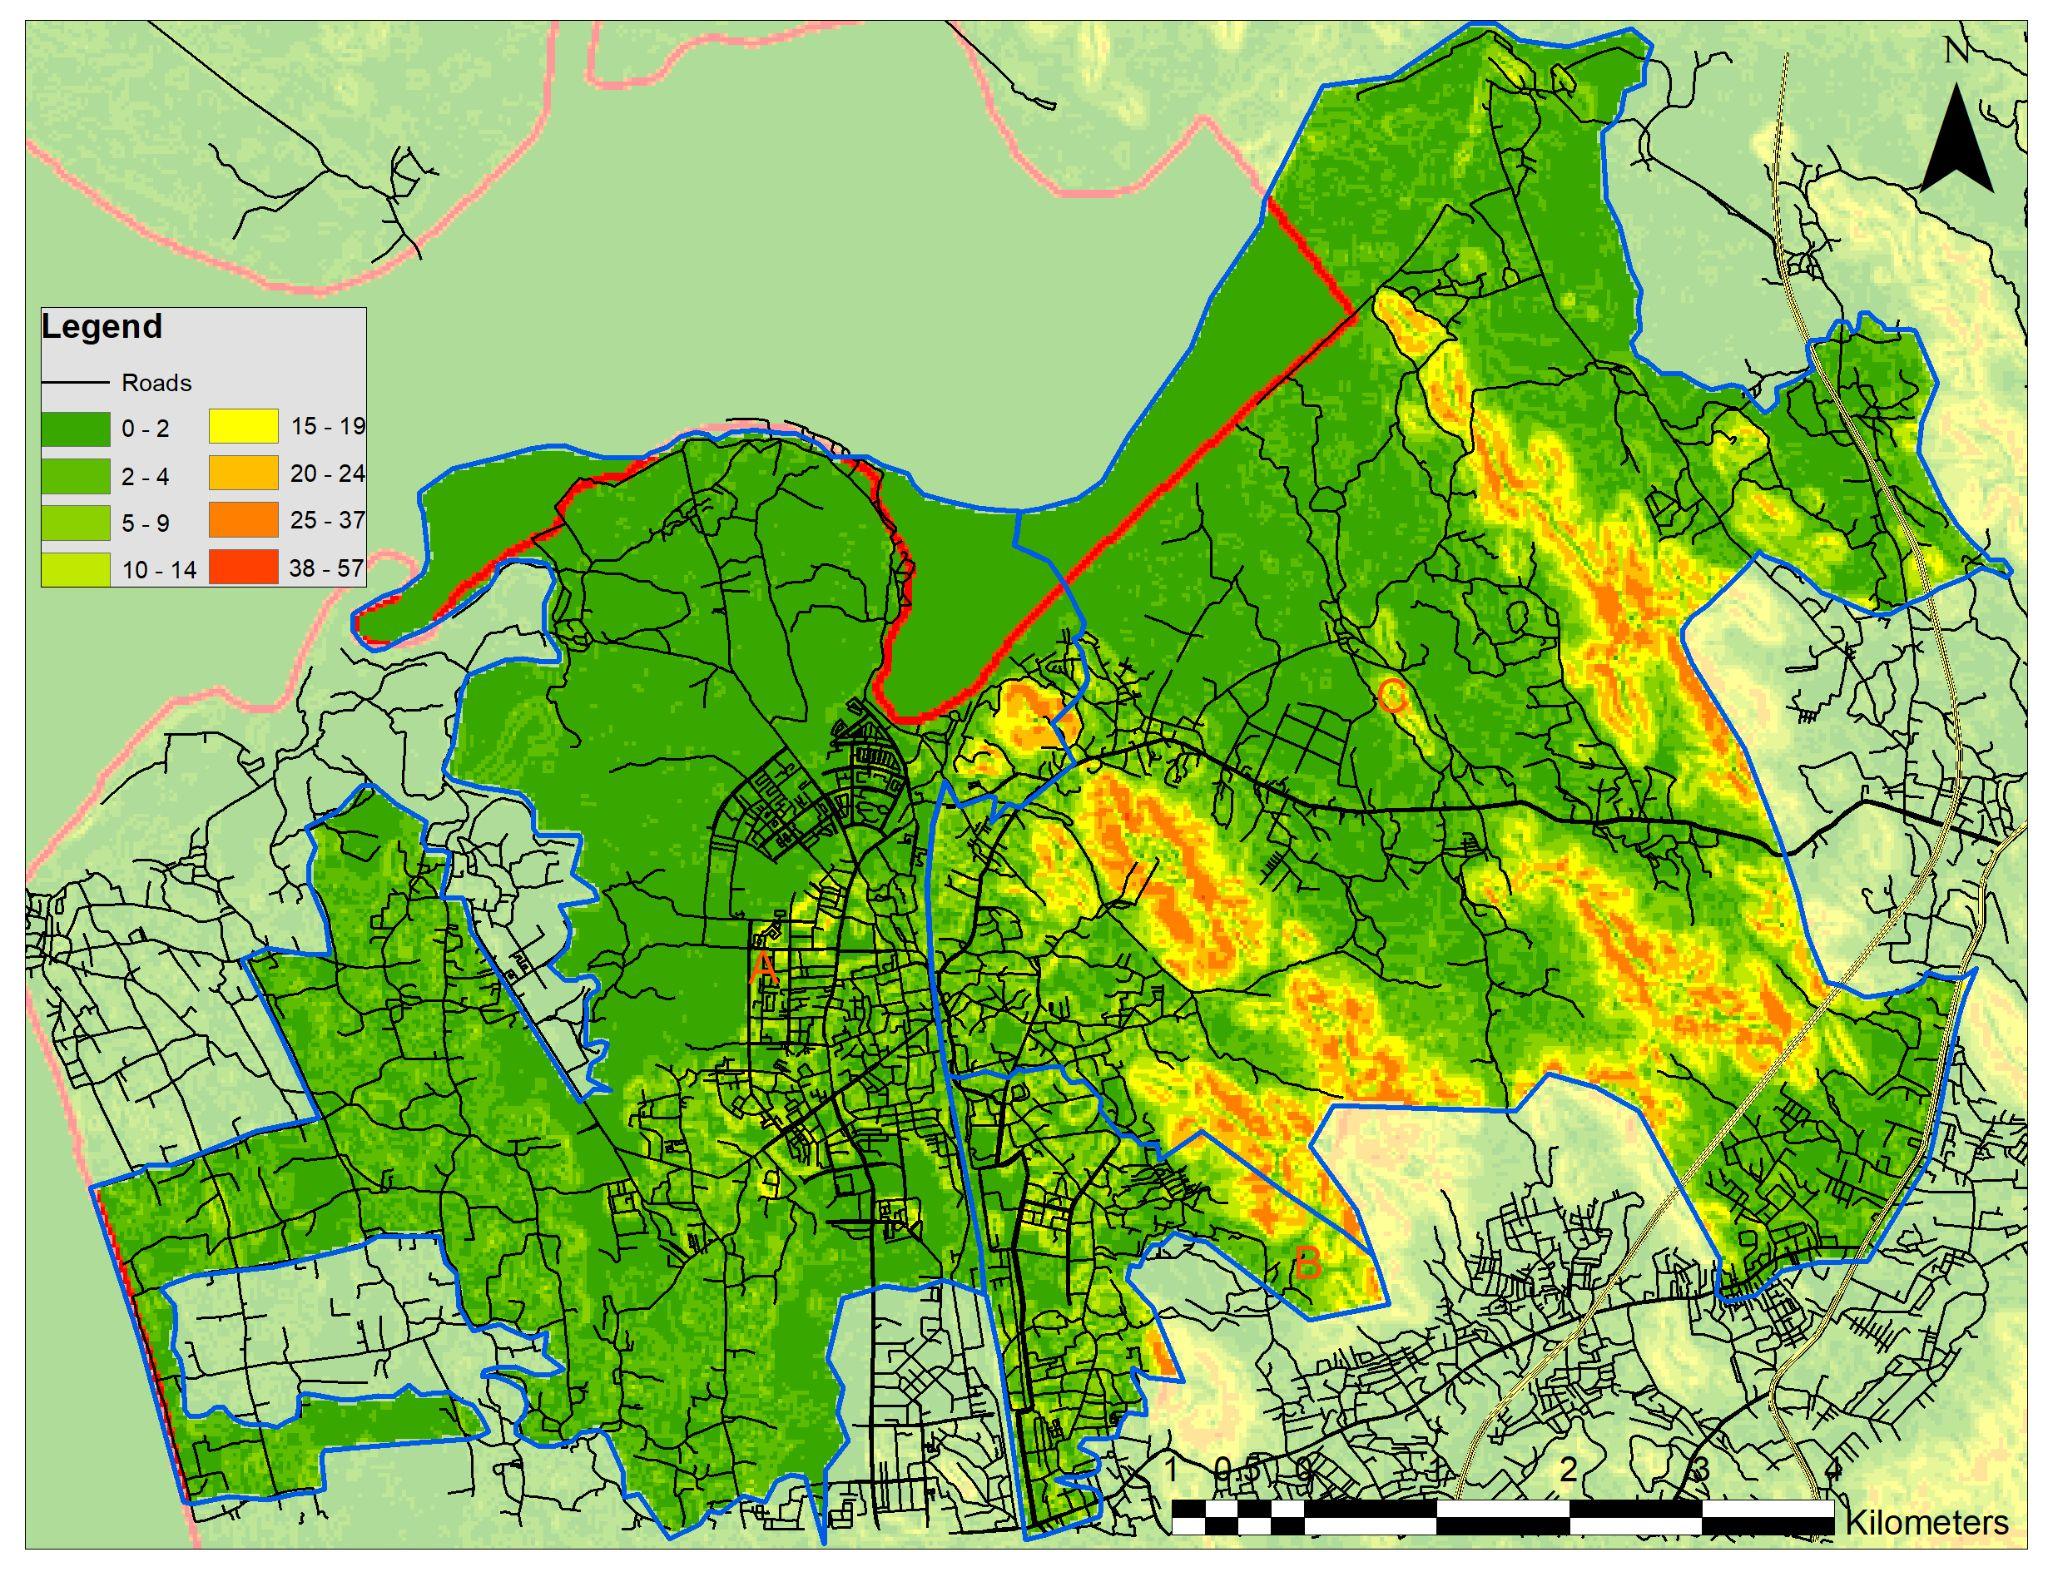
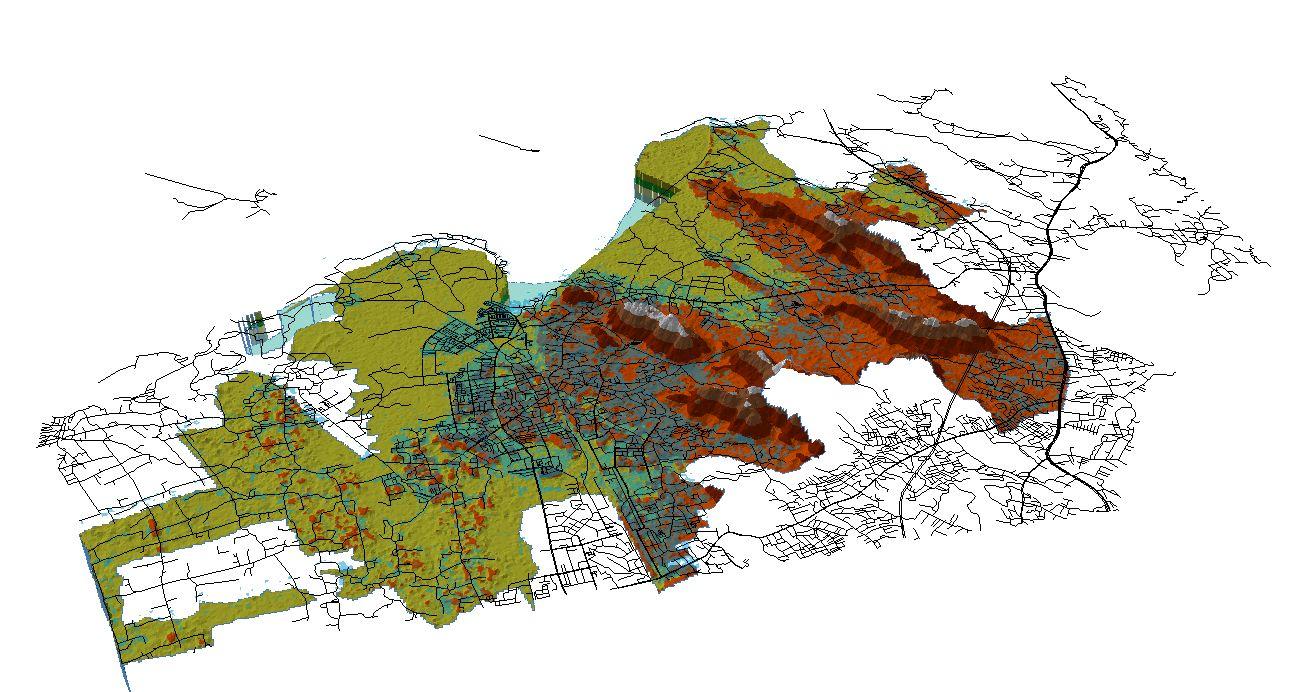
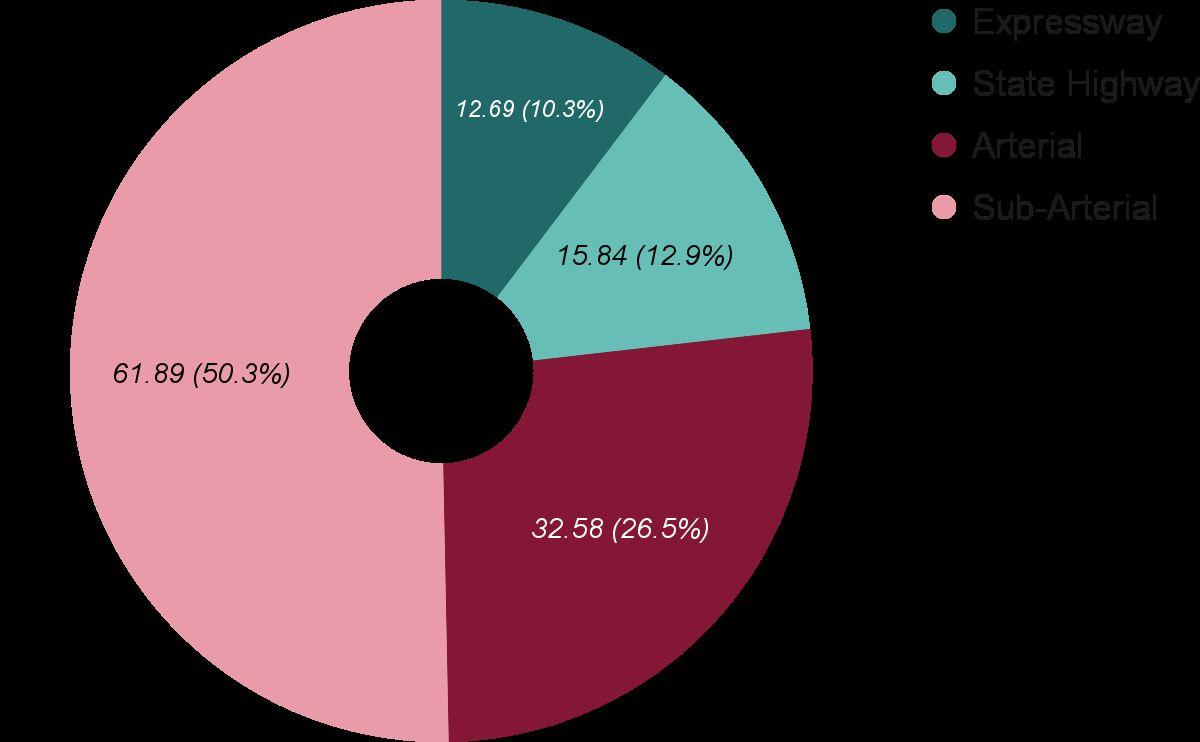
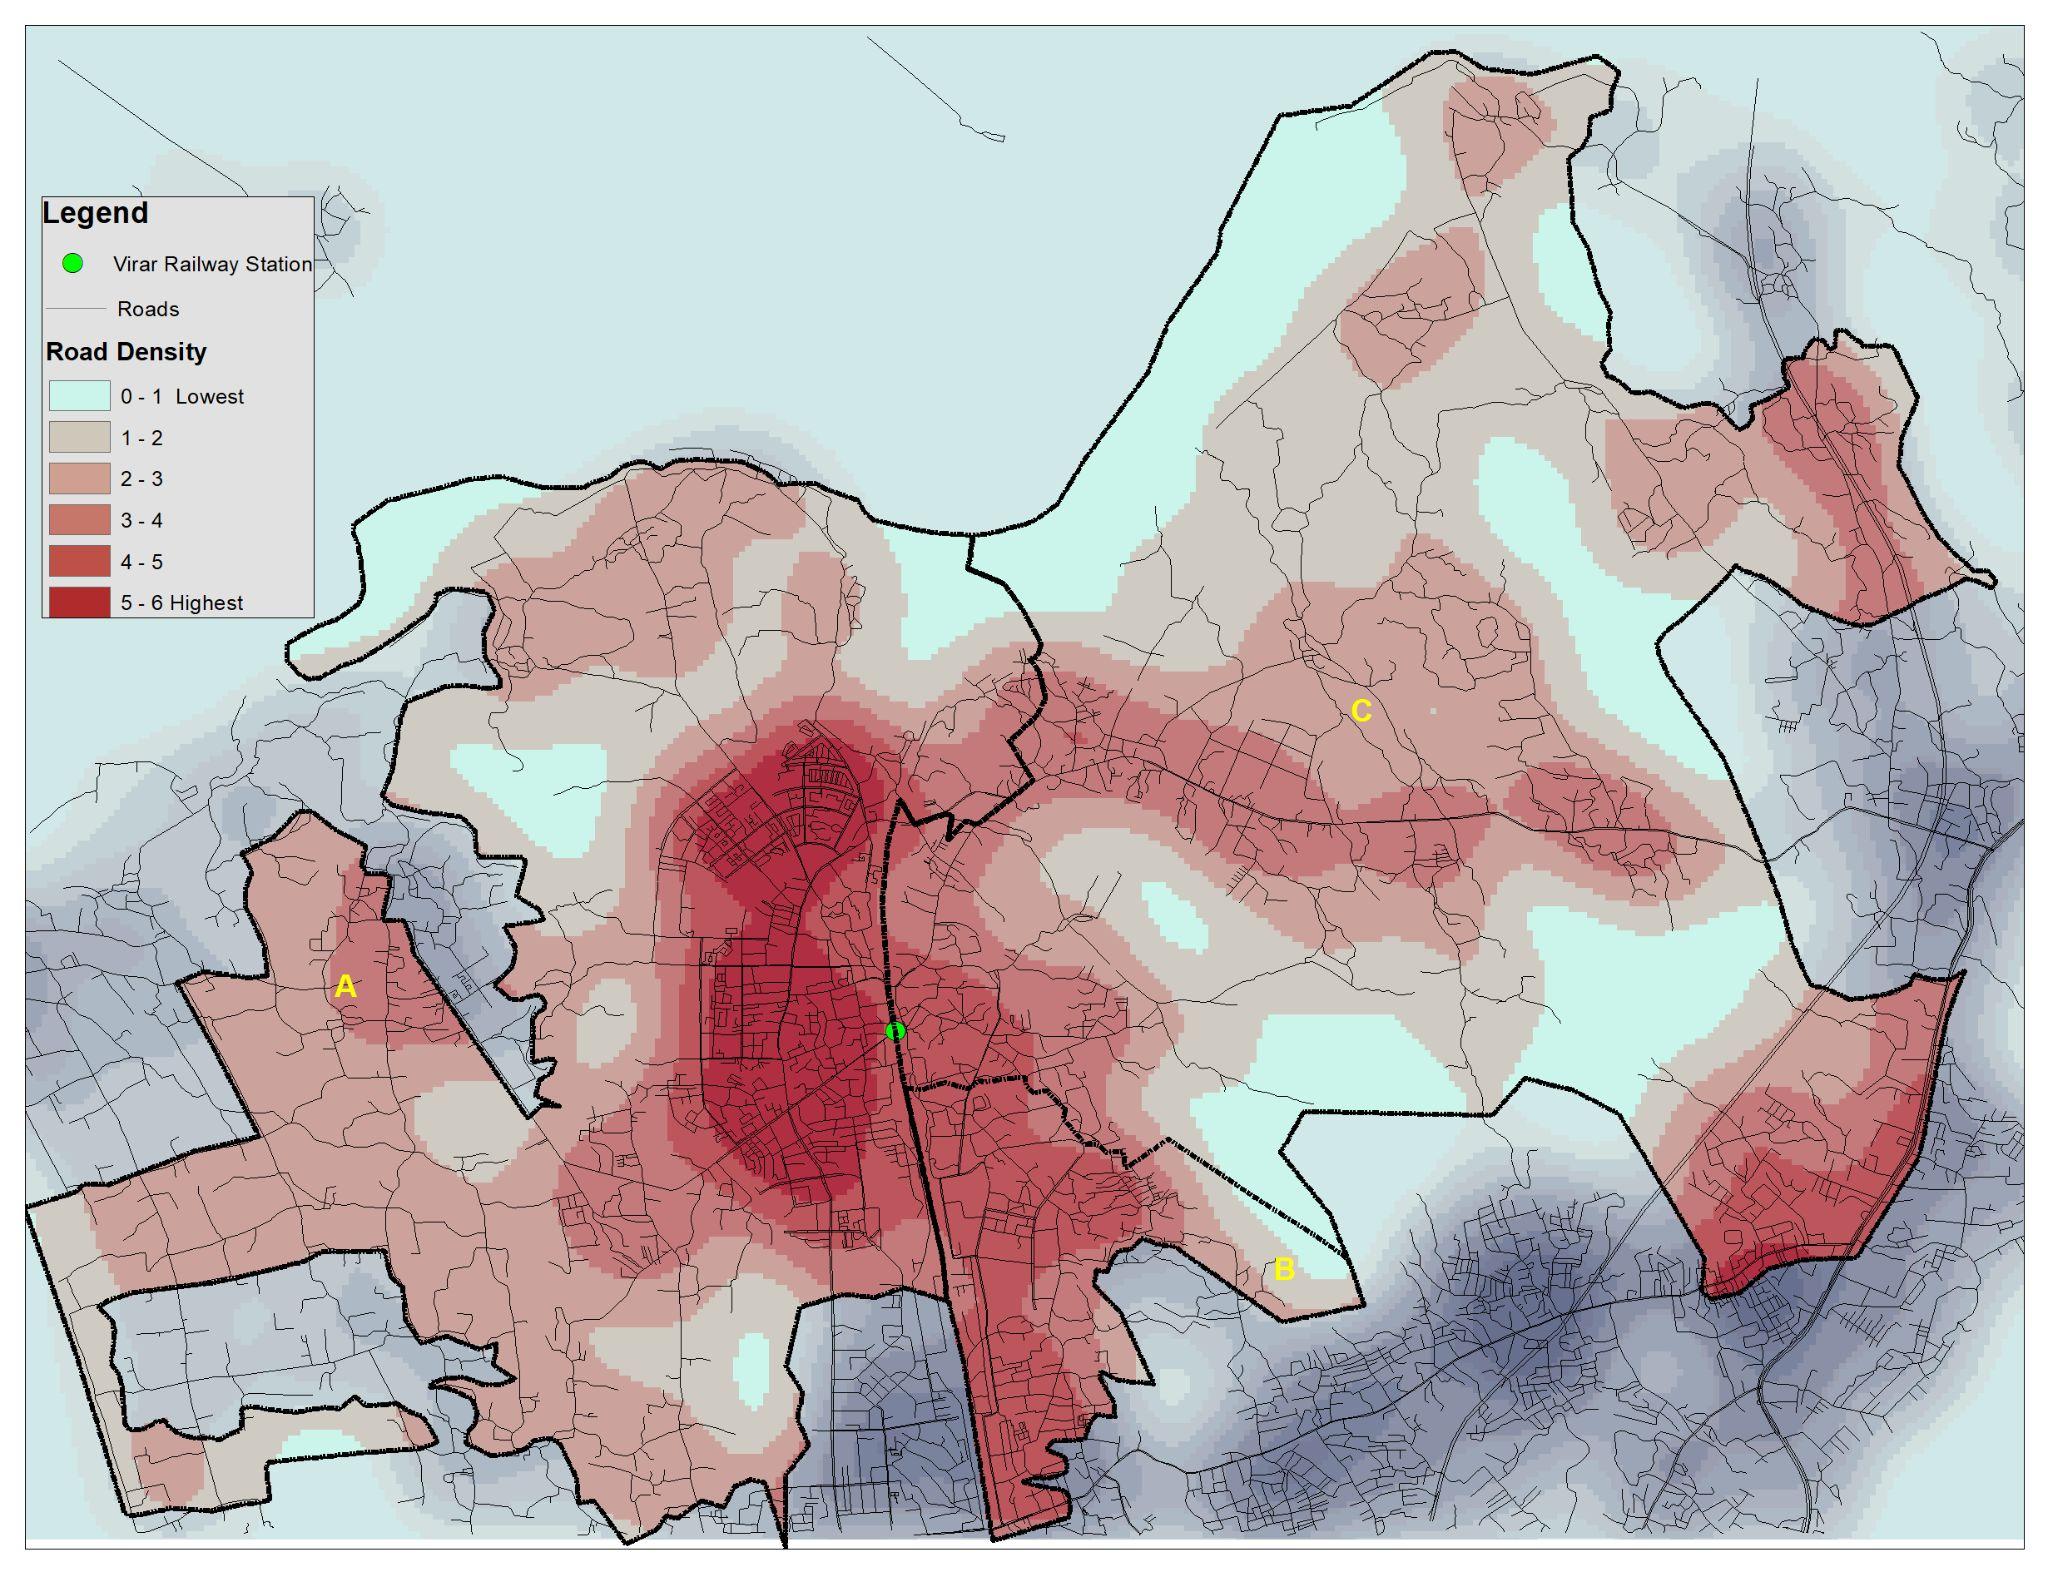
Source:SLBs for Urban Transport- MoUD, Source: Open Street Maps, 2023 NetworkAnalysis
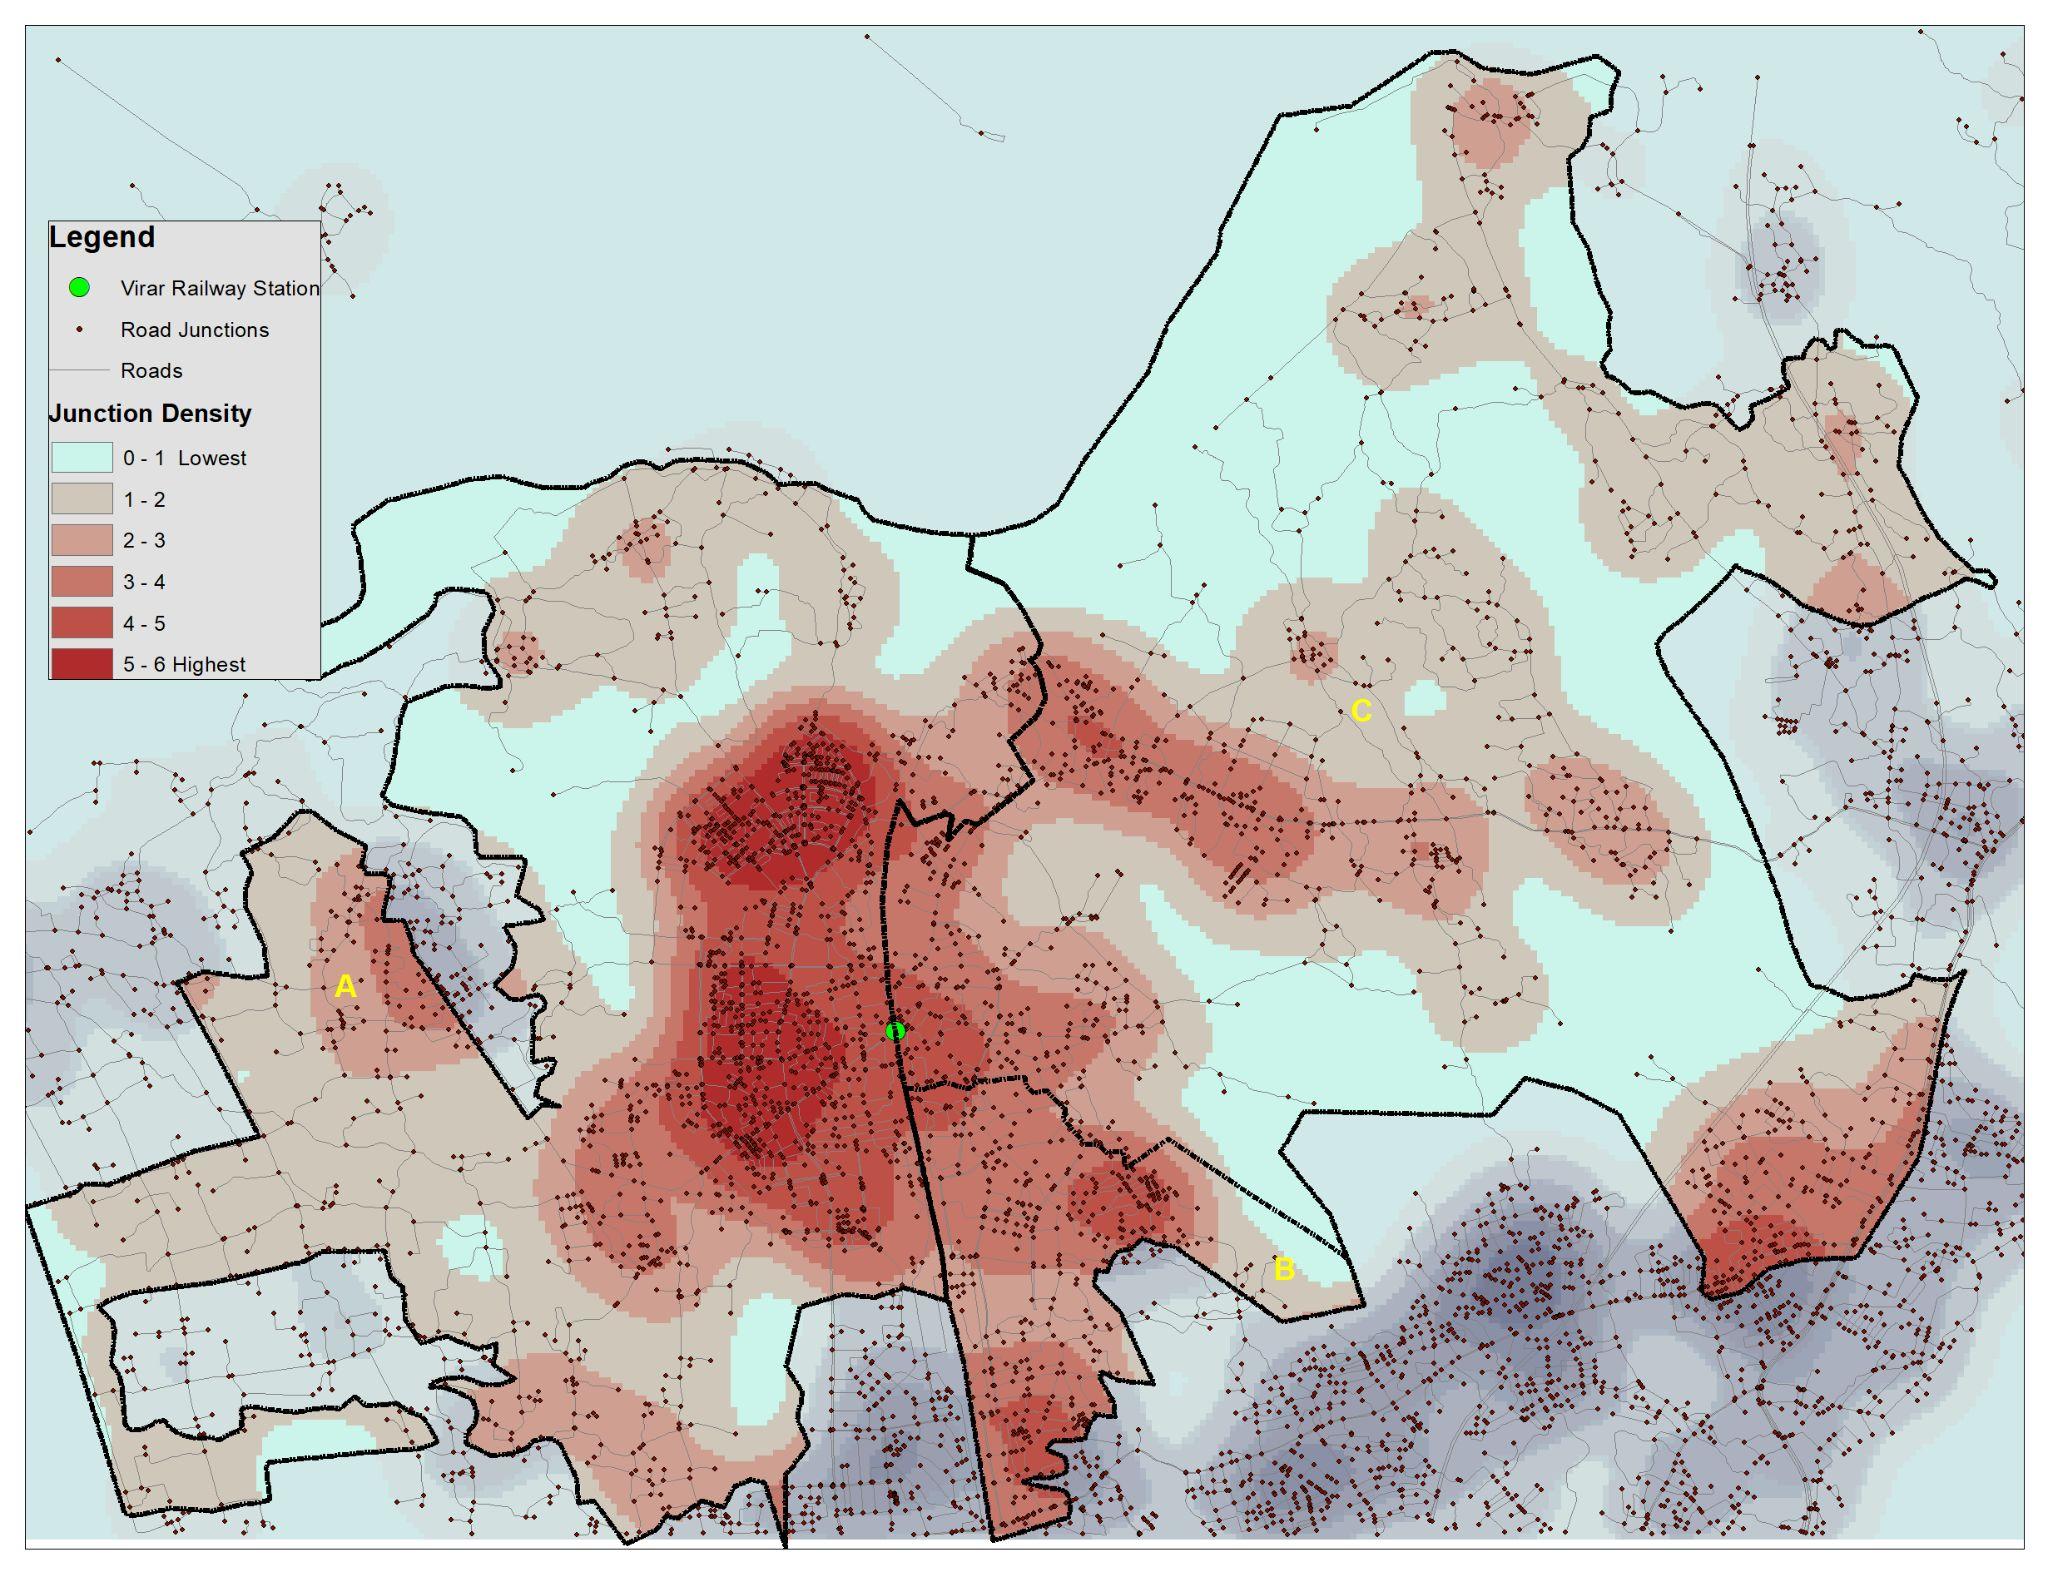
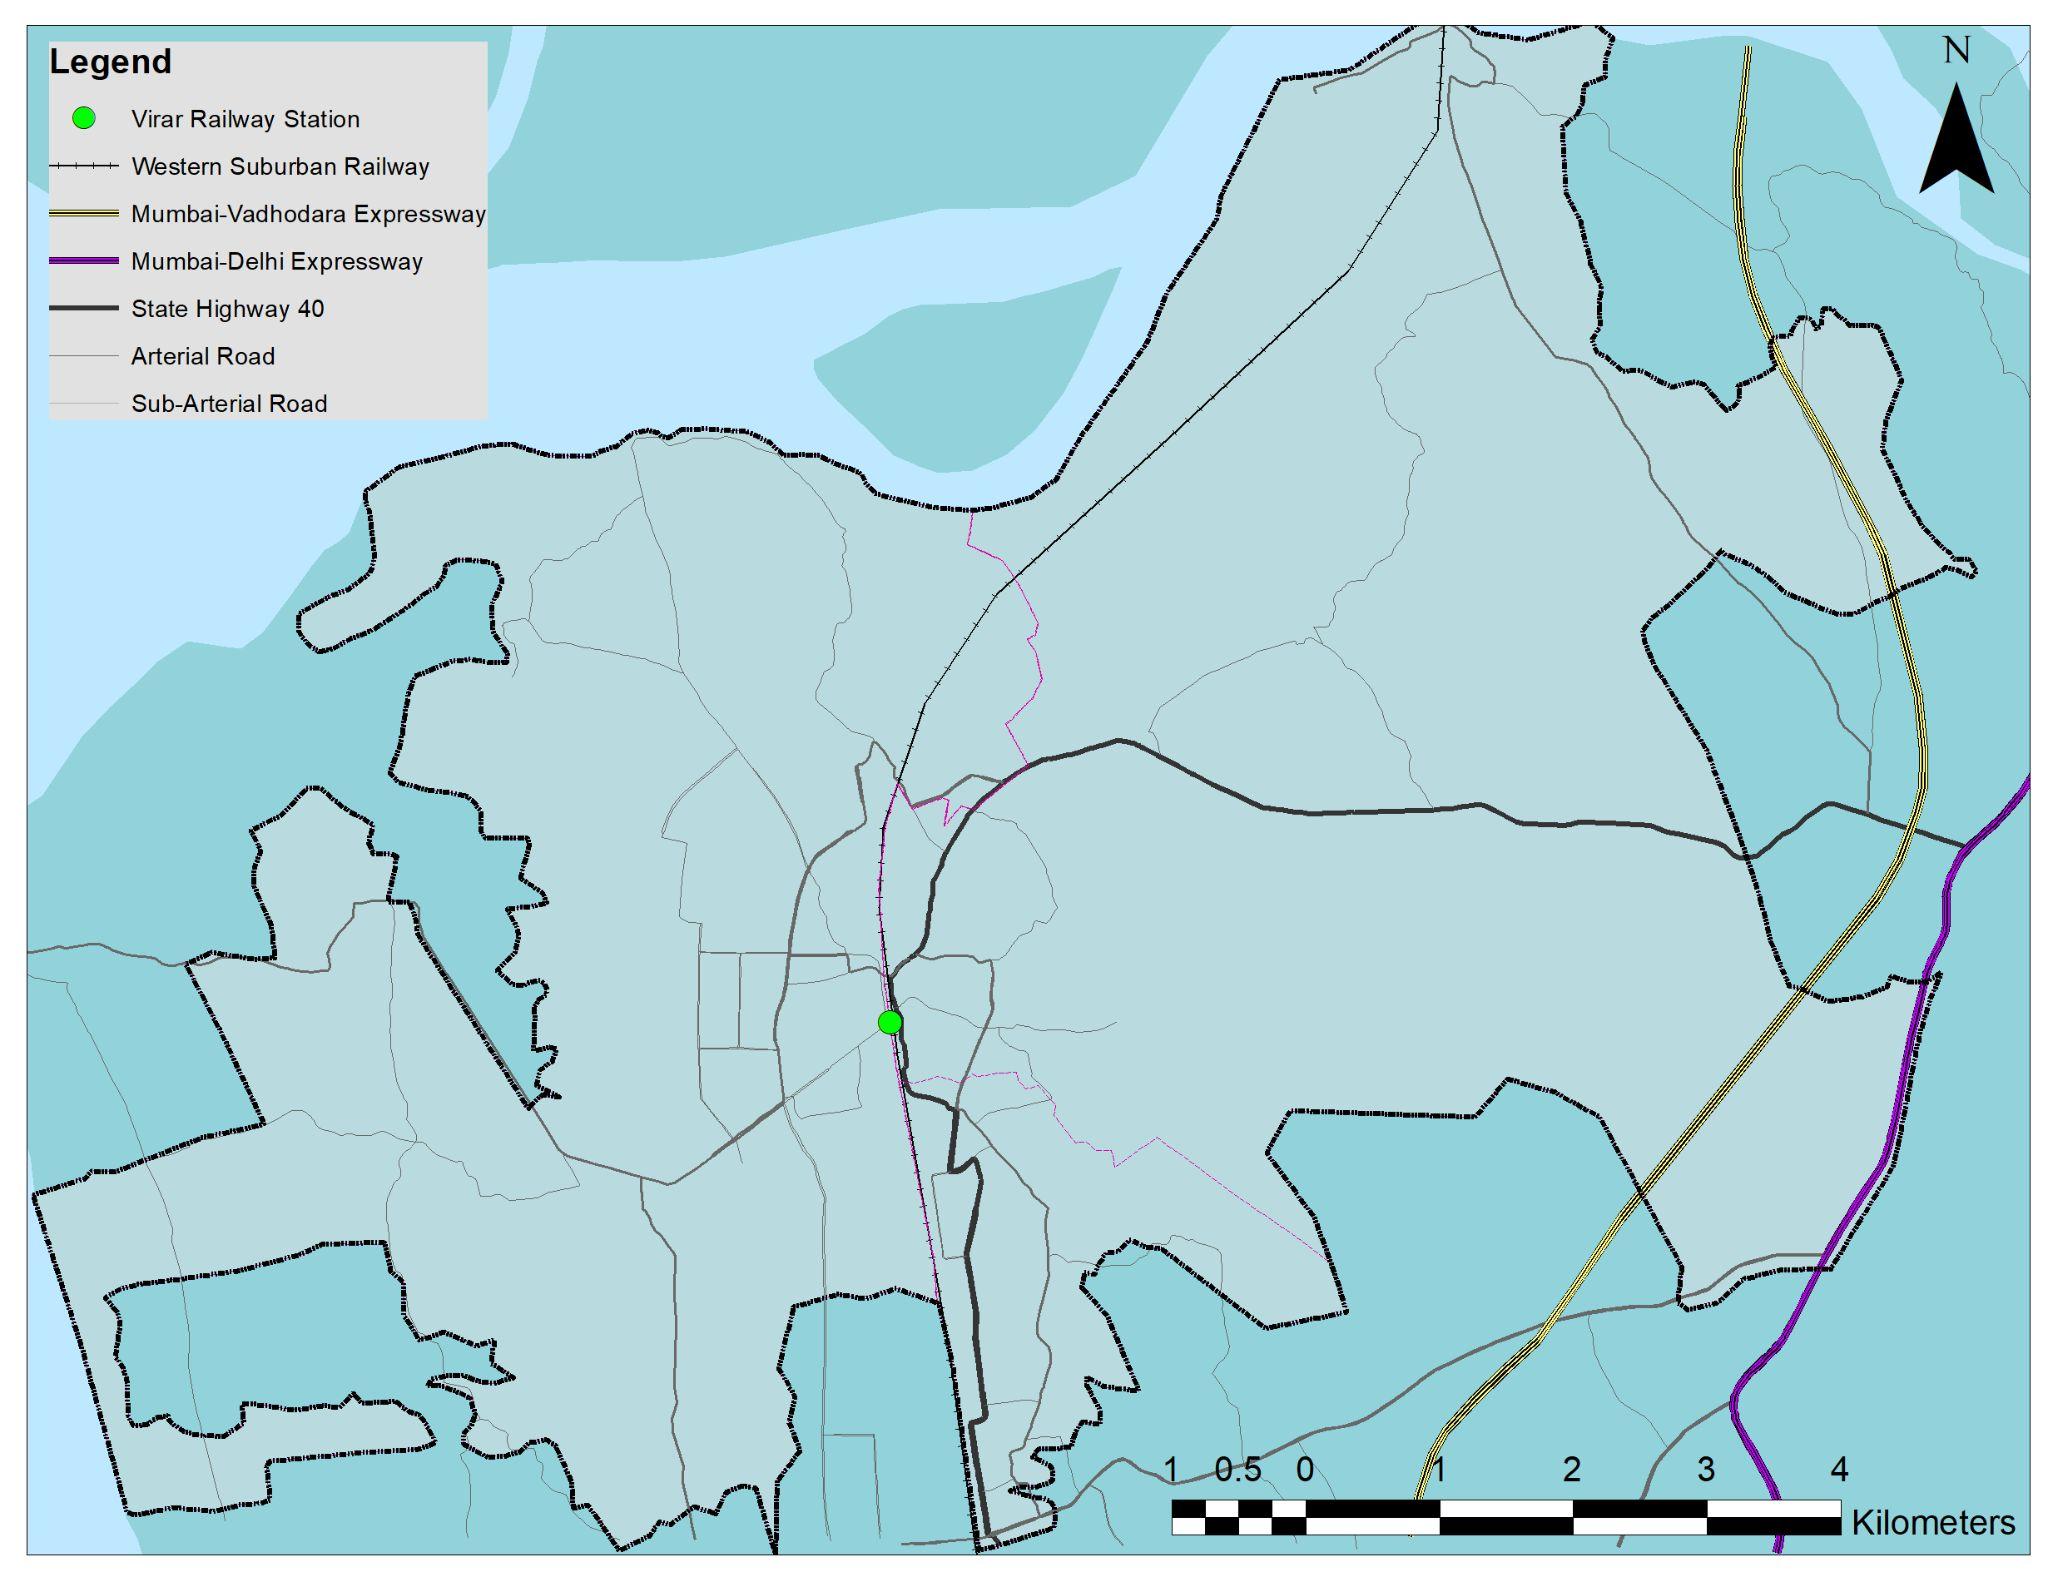
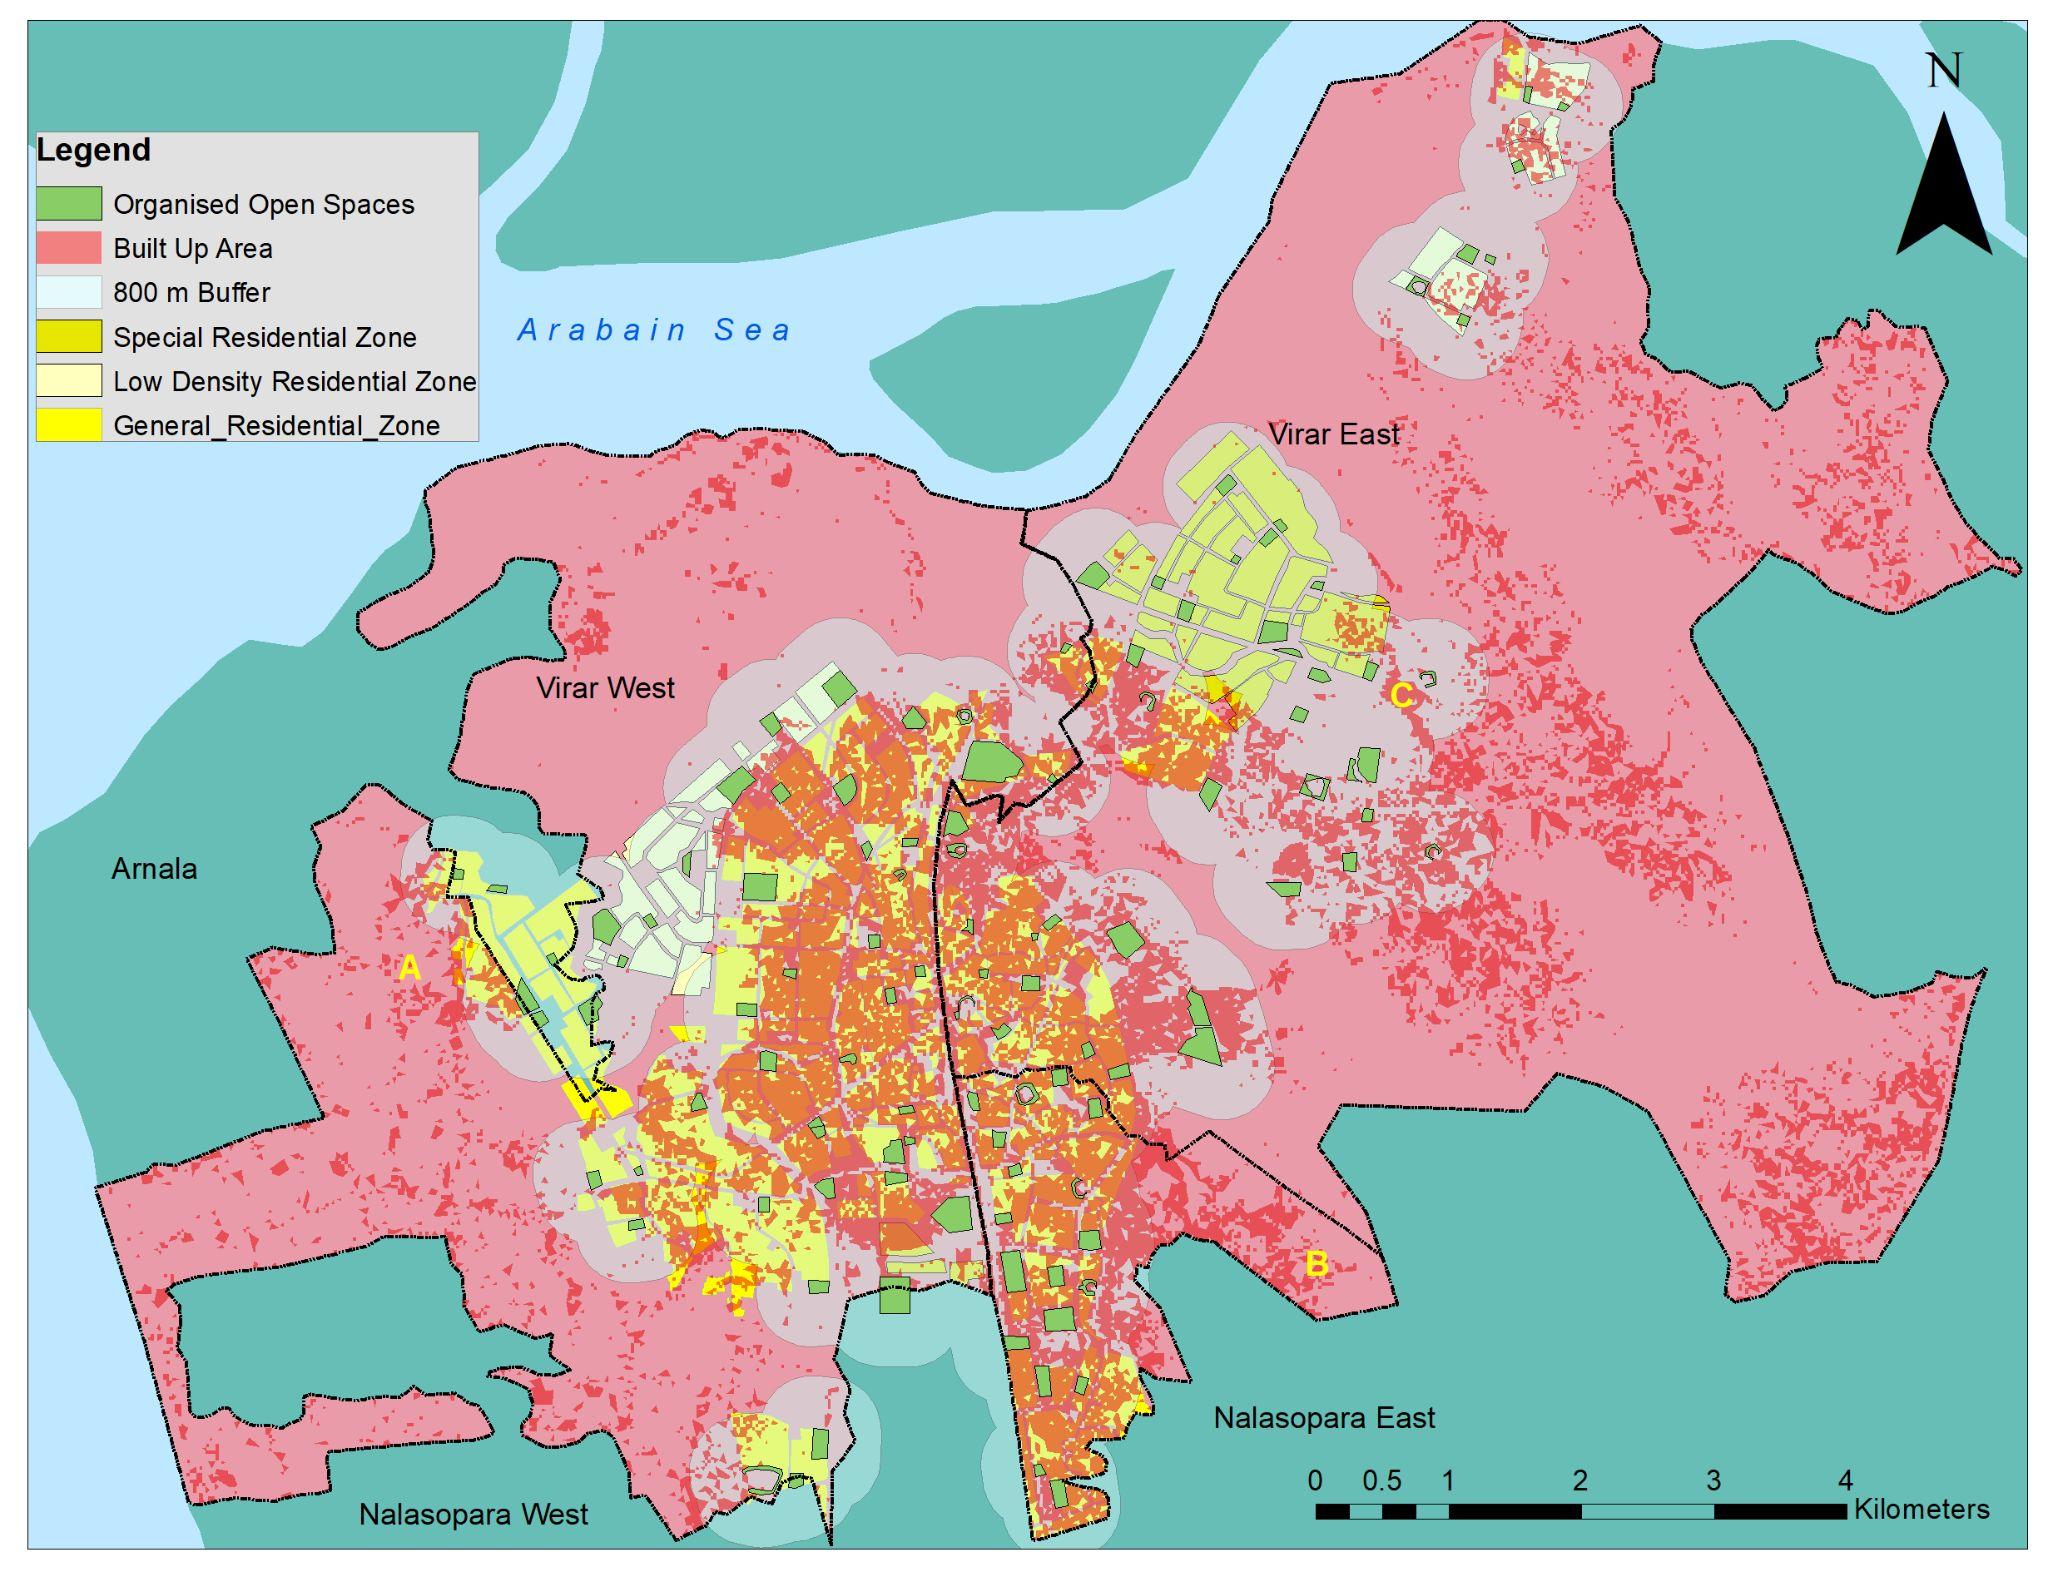
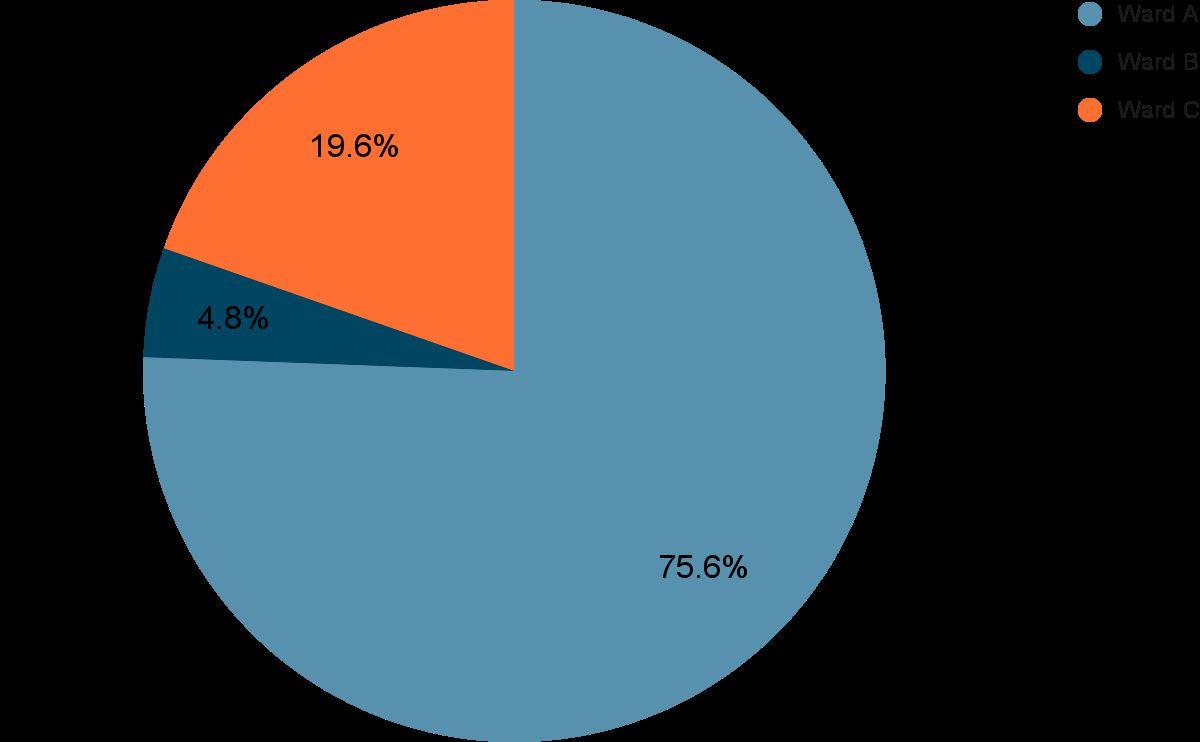
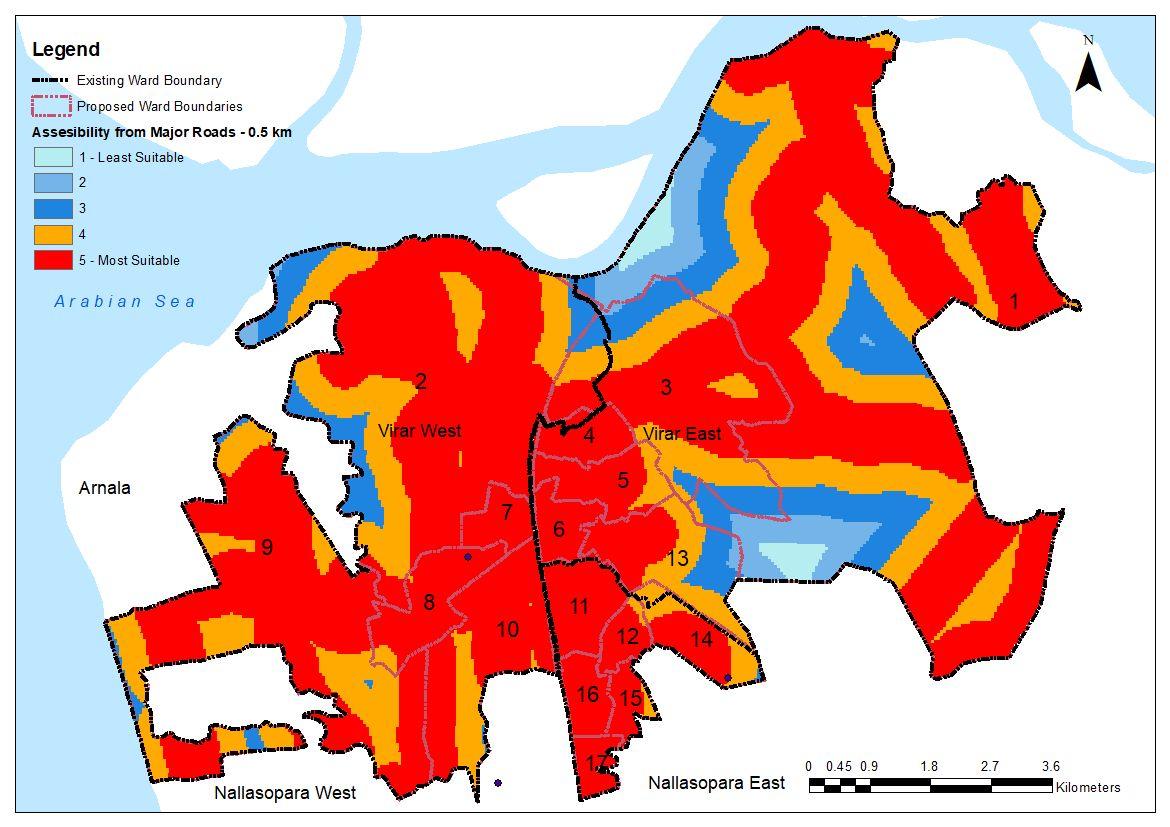
Virar boasts a robust network connectivity, with Ward A exhibiting the highest density of roads and junctions, followed by Ward C, and Ward B having the lowest density.
Source: Open Street Maps, 2023 NetworkAnalysis
Virar Road Network
Sr. No
1.
2.
Indicators to calculate Citv-wide Level of Service (LoS) of Public Transport Facilities
Public TransportationAccessibility
5.
VVMT
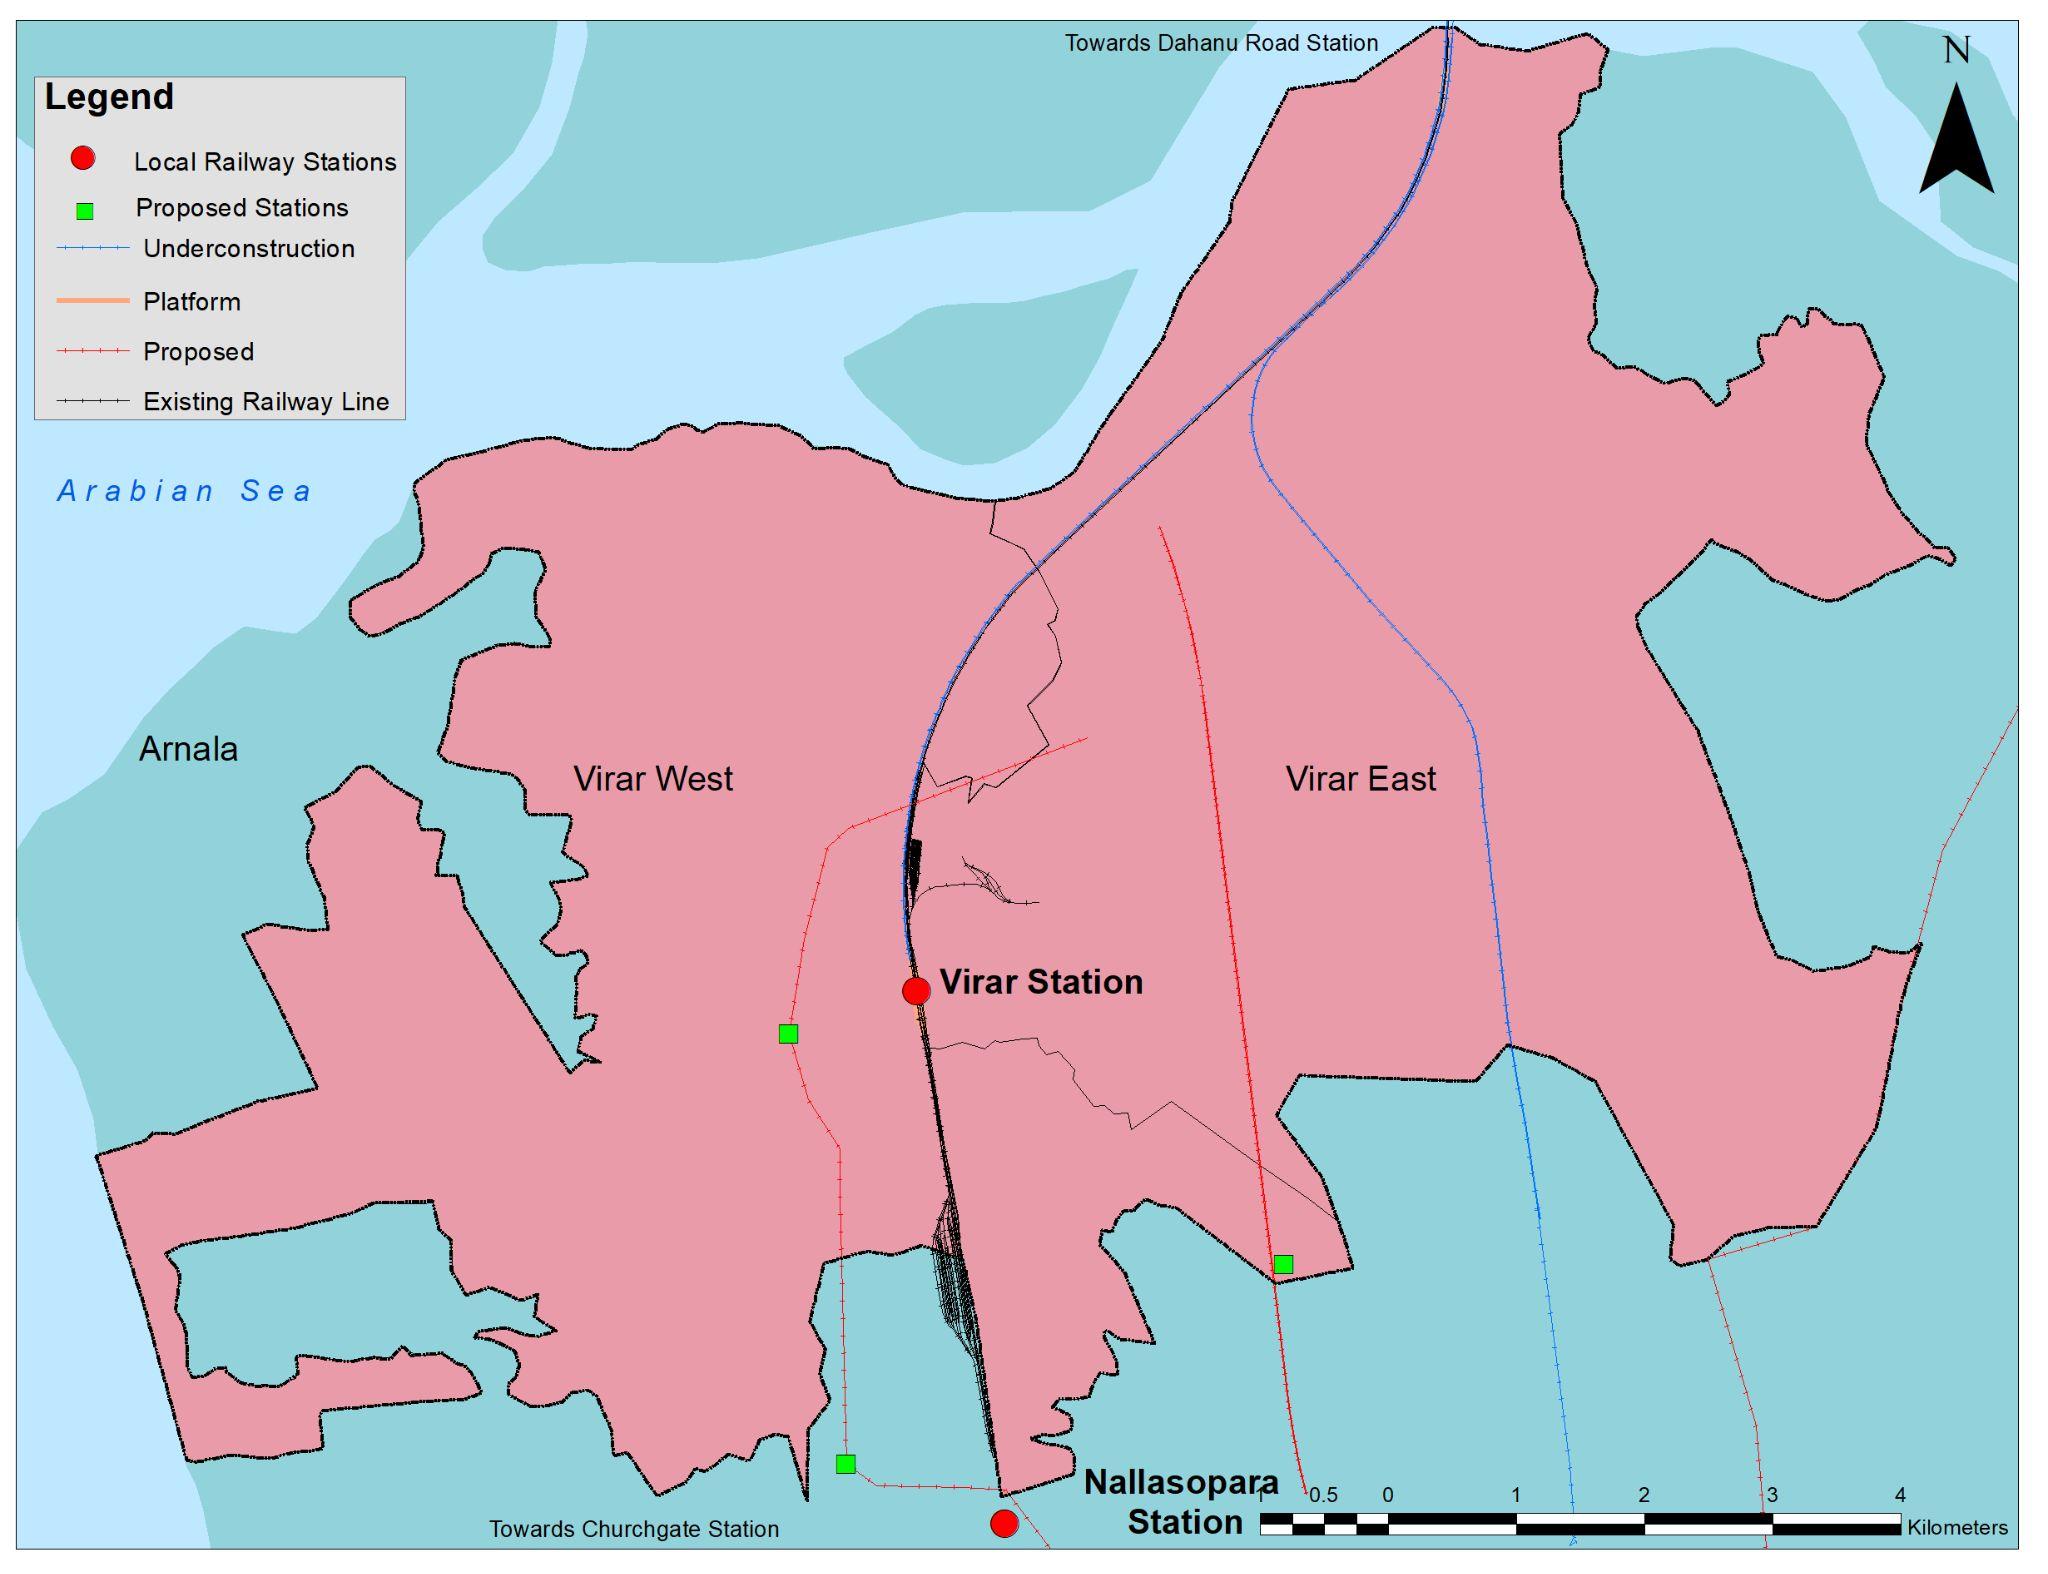
TRANSPORTATIONAND MOBILITY- RAILWAY
Impacts of Urbanization on City's Sustainable DevelopmentACase of Virar City, Maharashtra
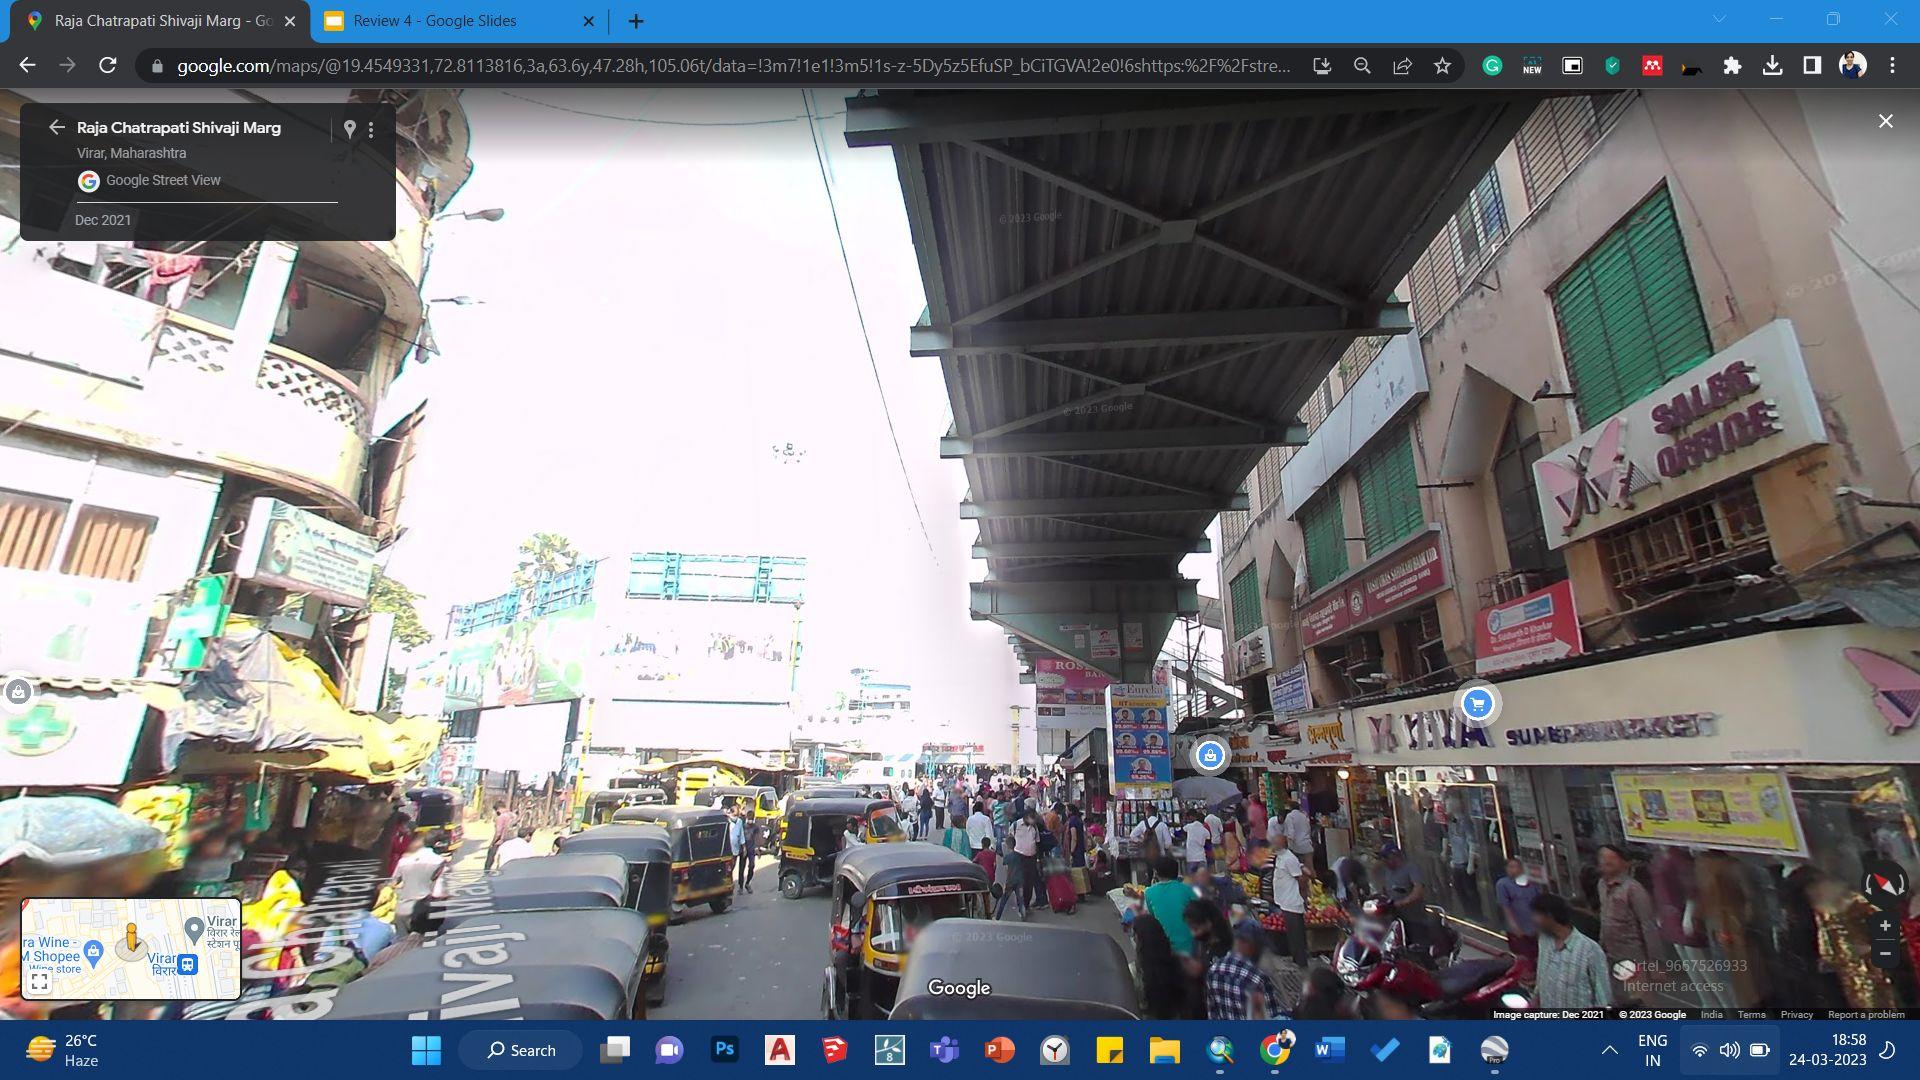
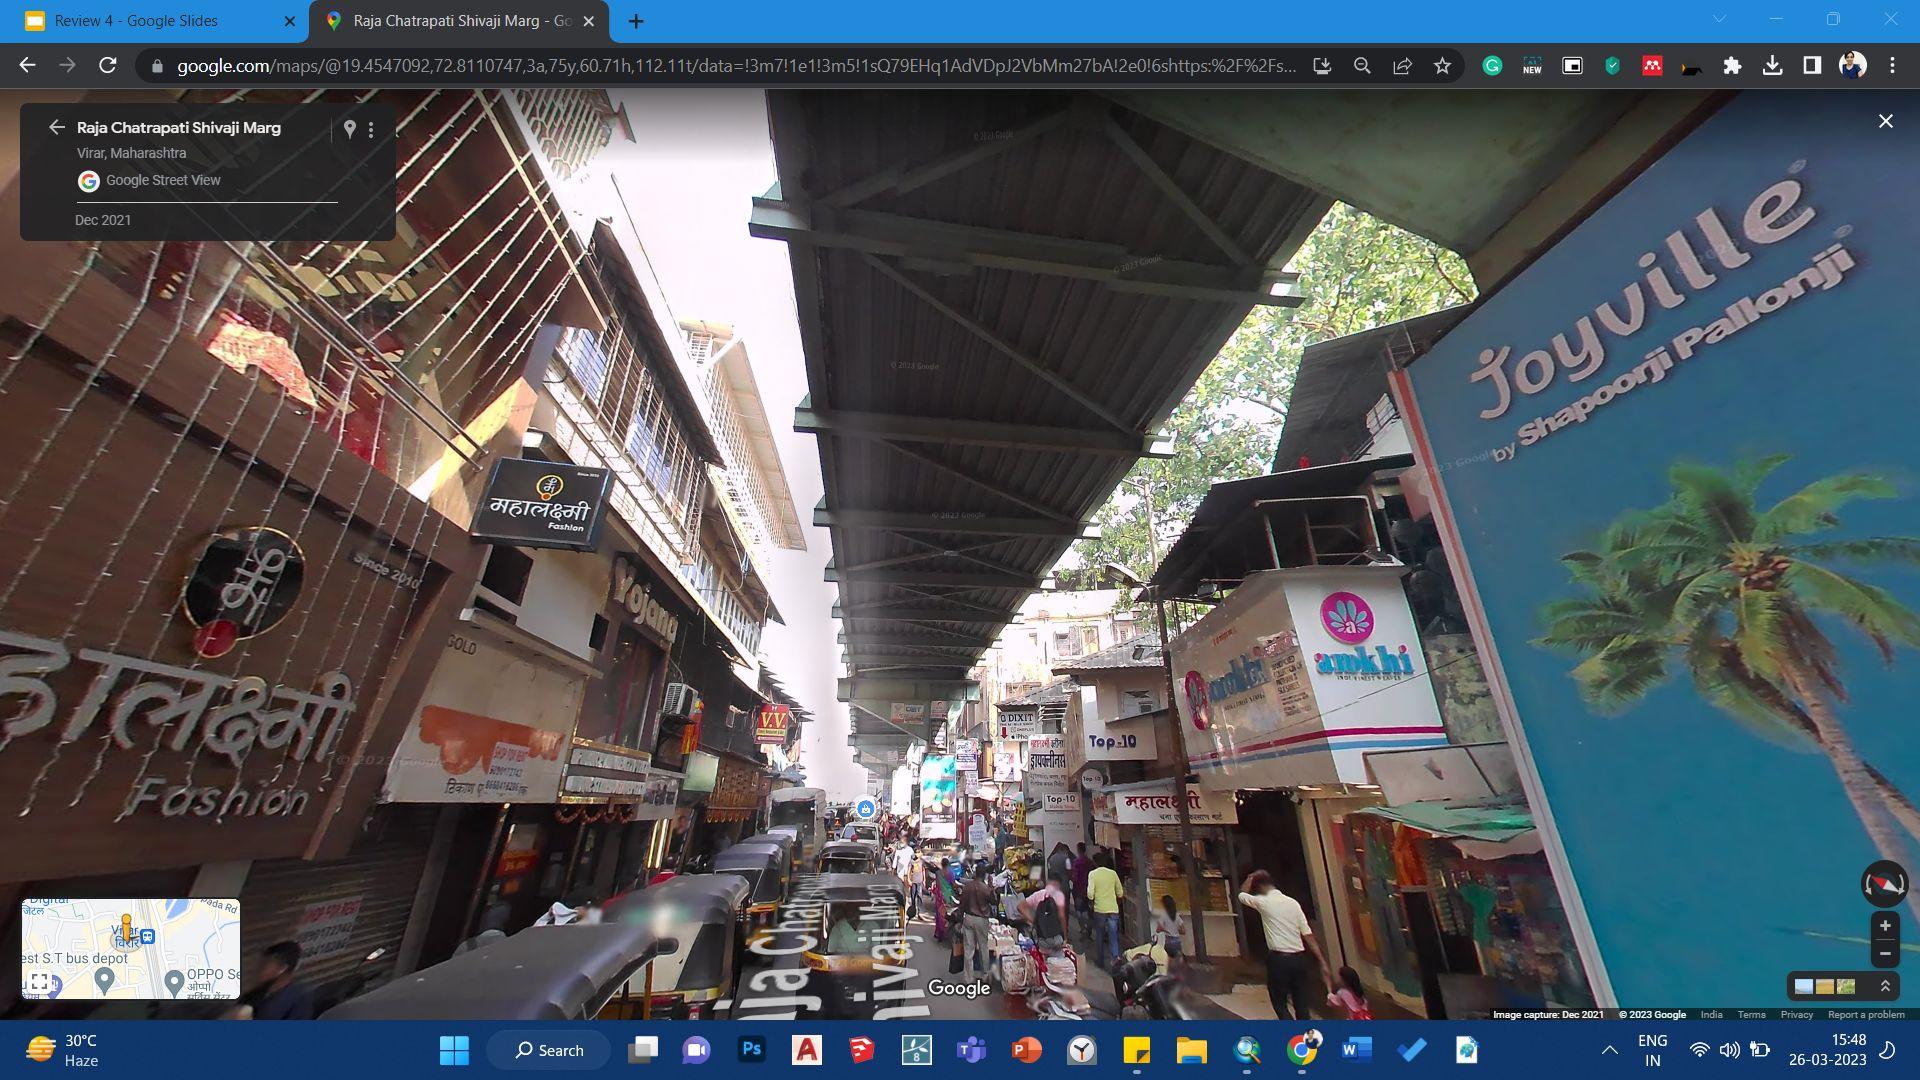
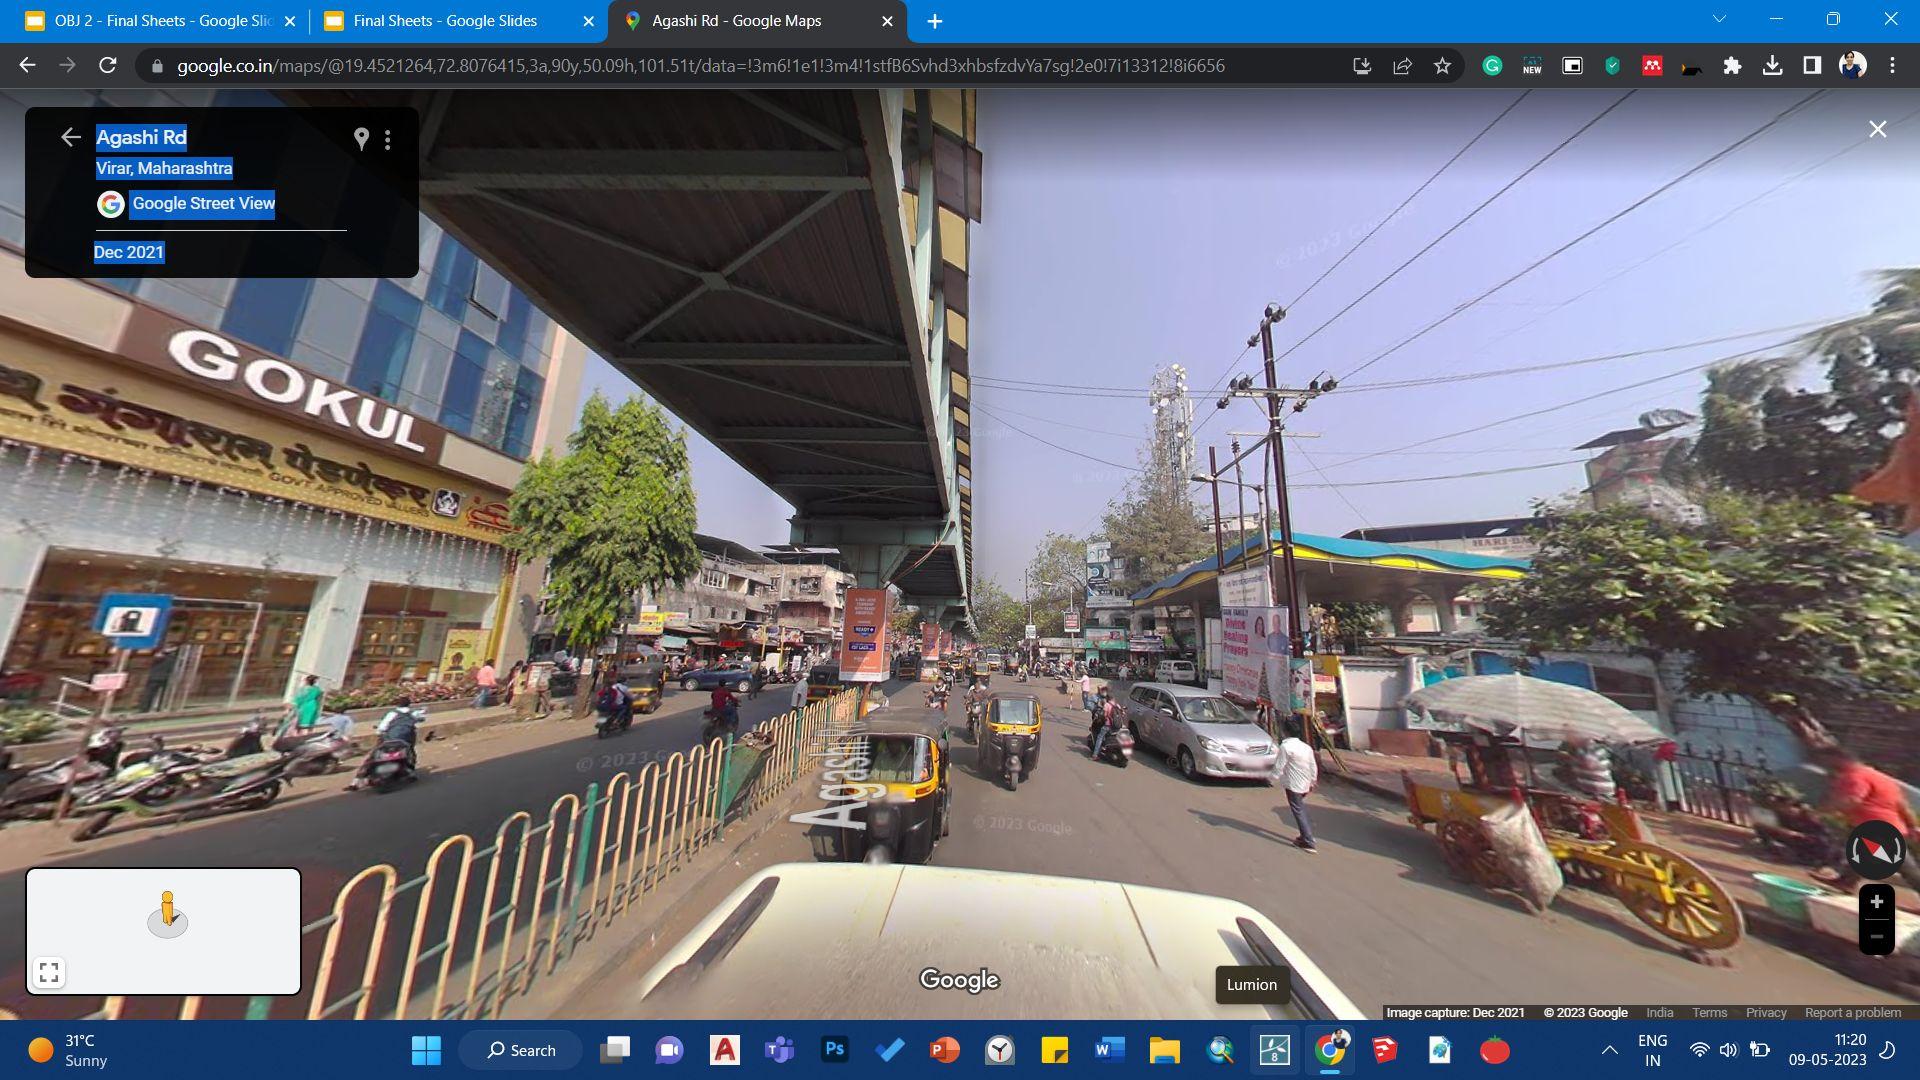
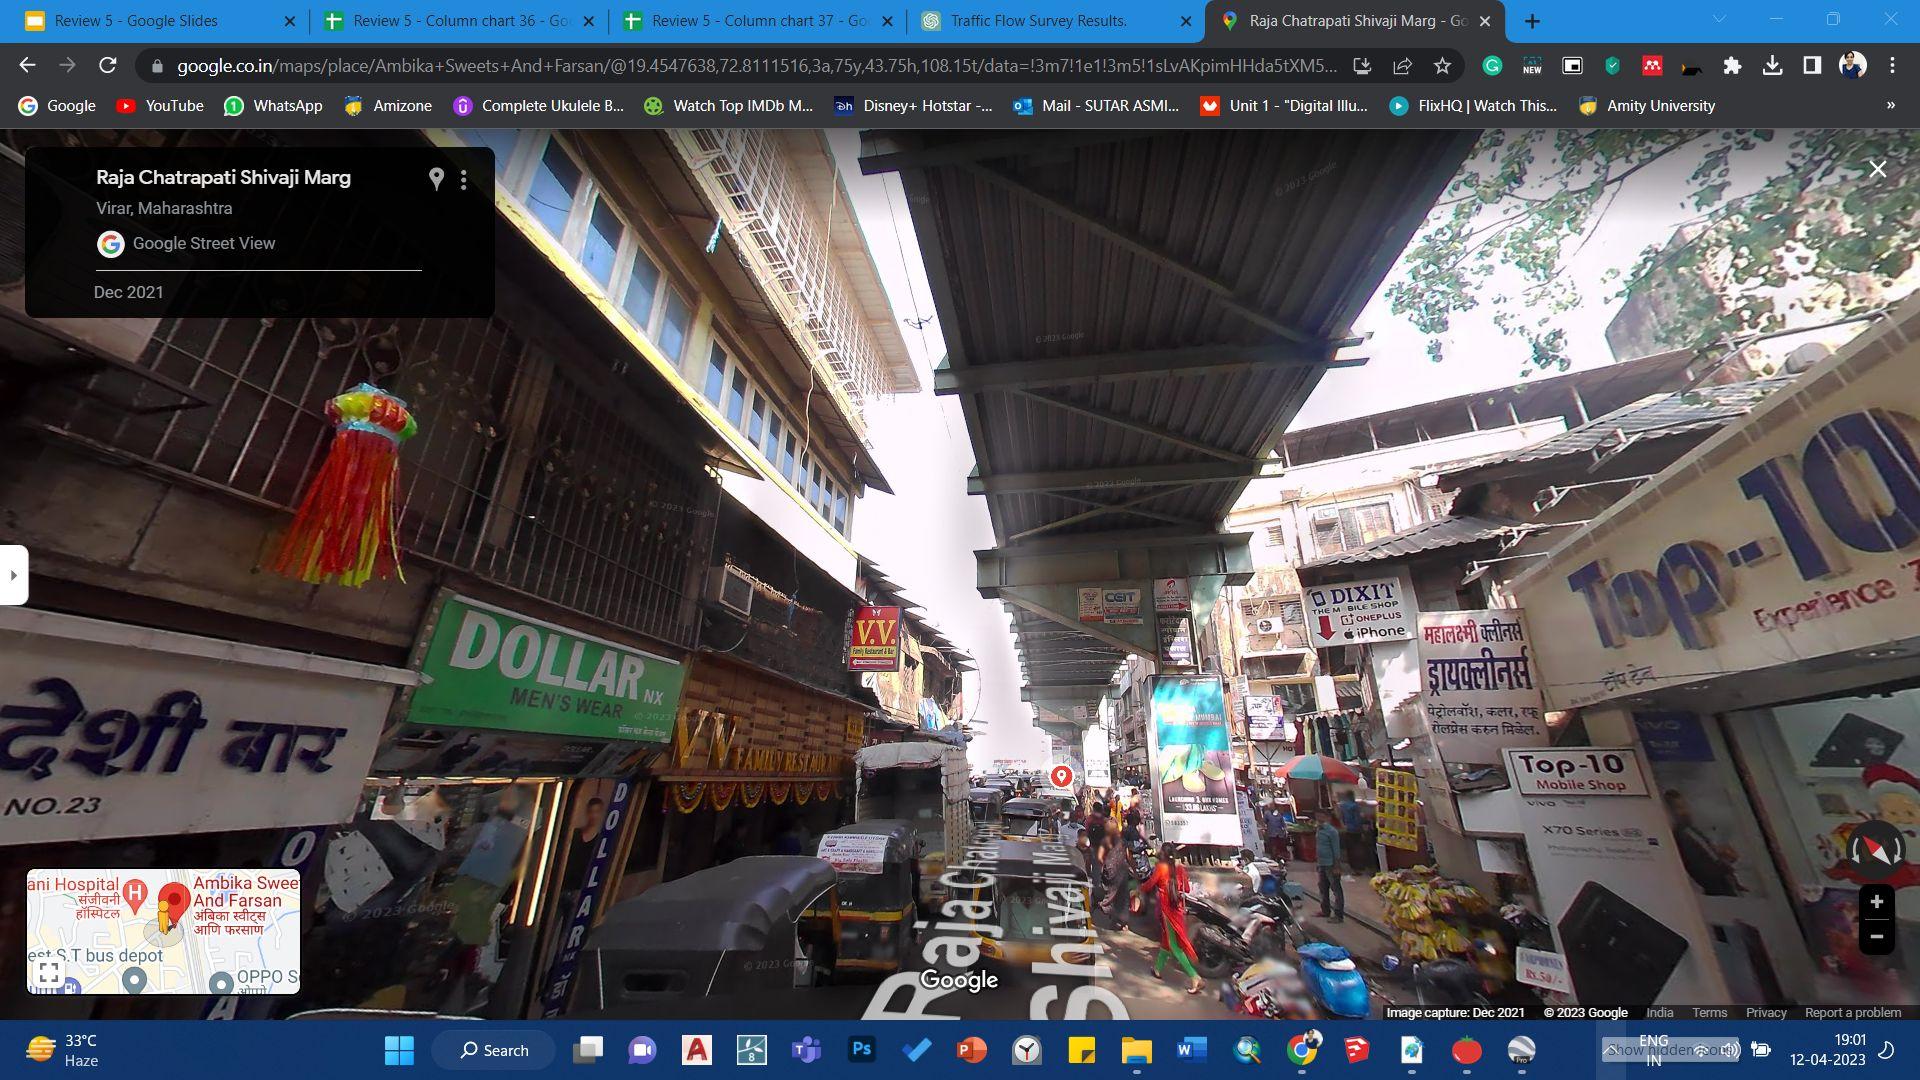
Image 01: Raja Chatrapati Shivaji Marg
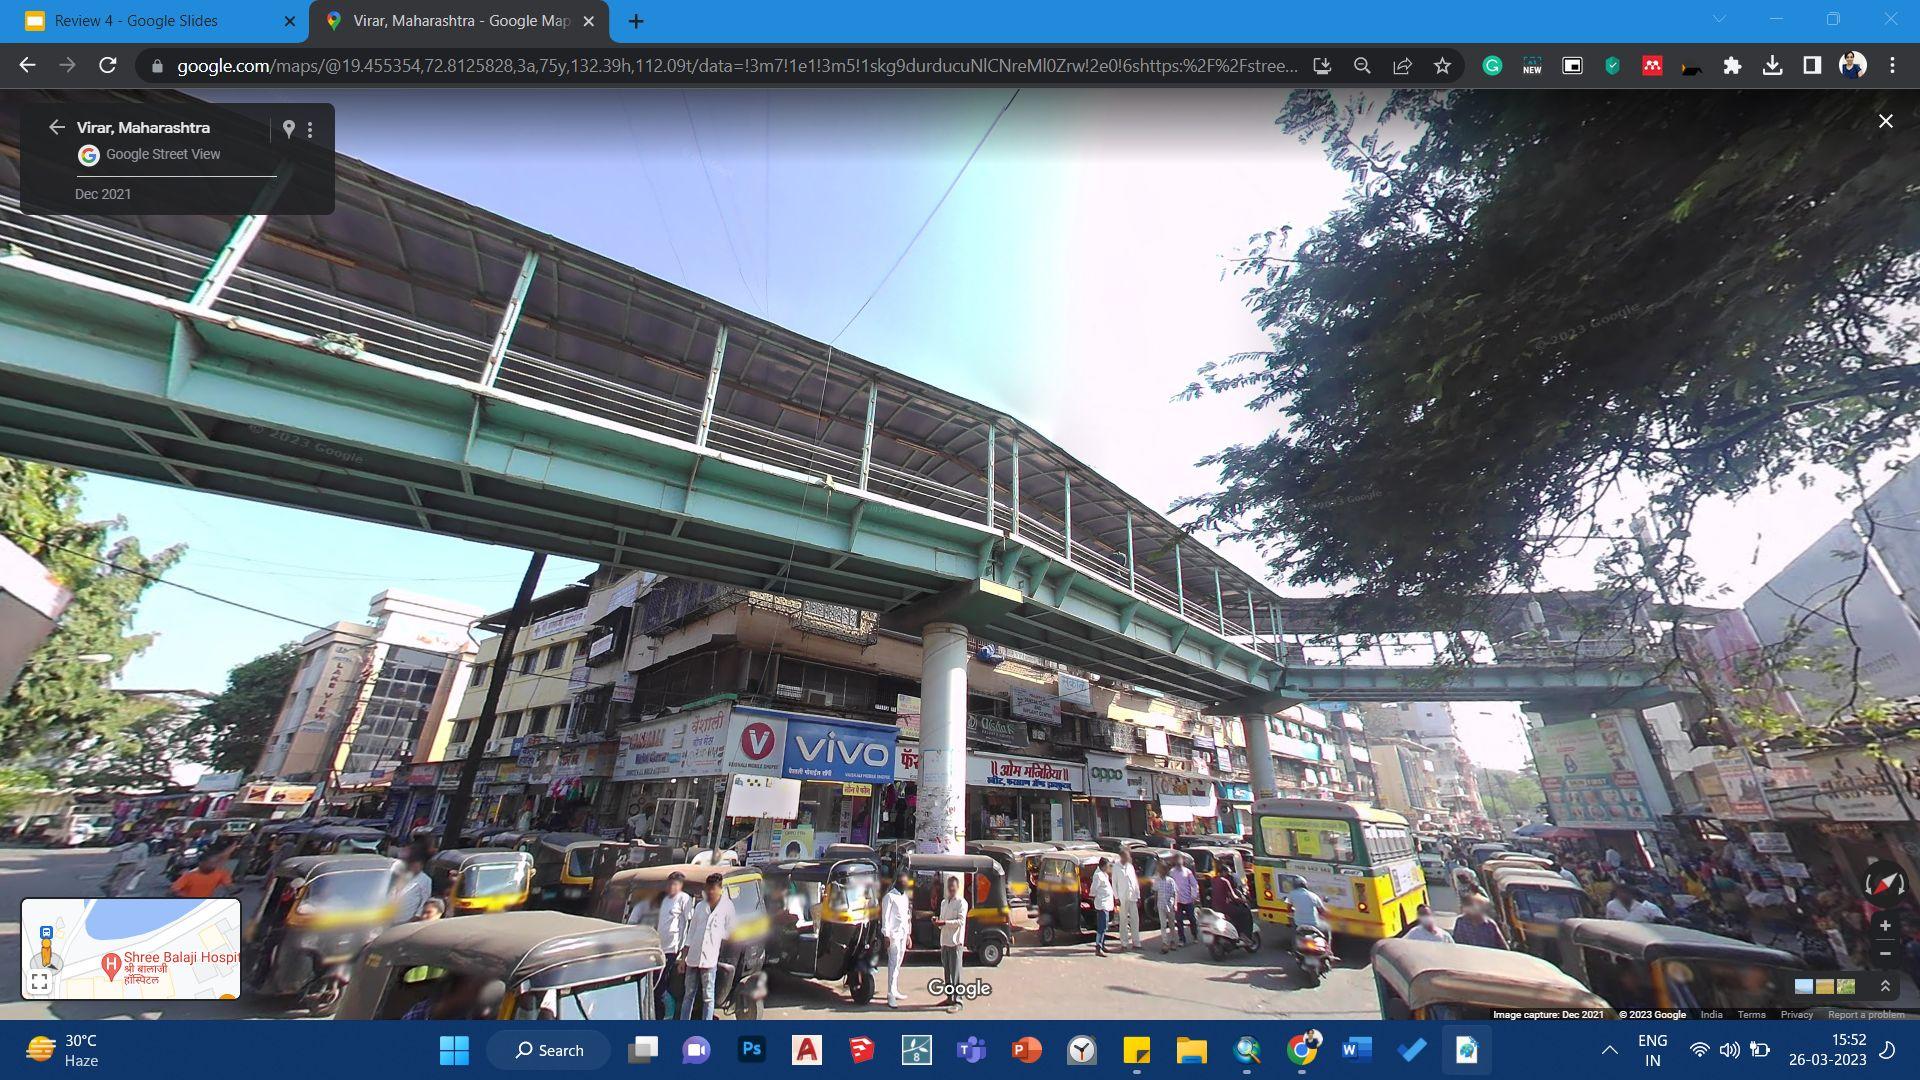
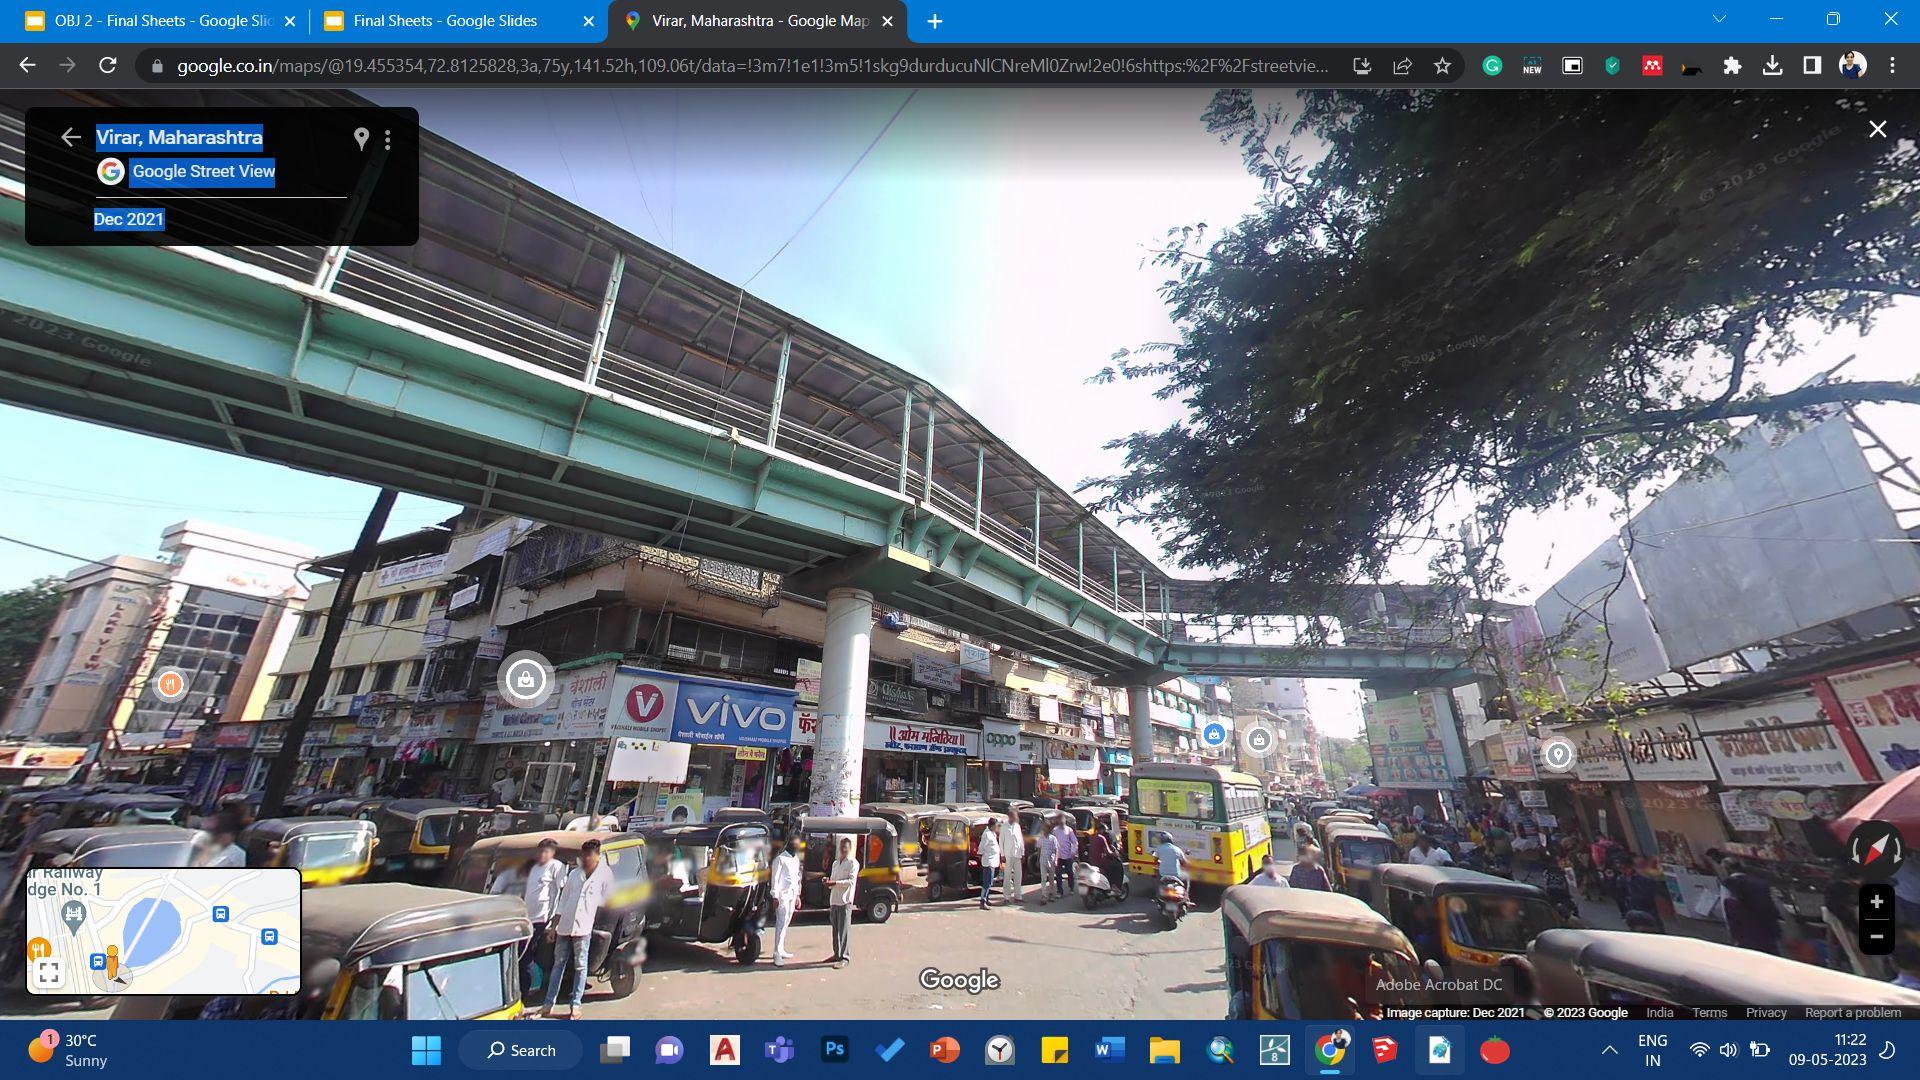
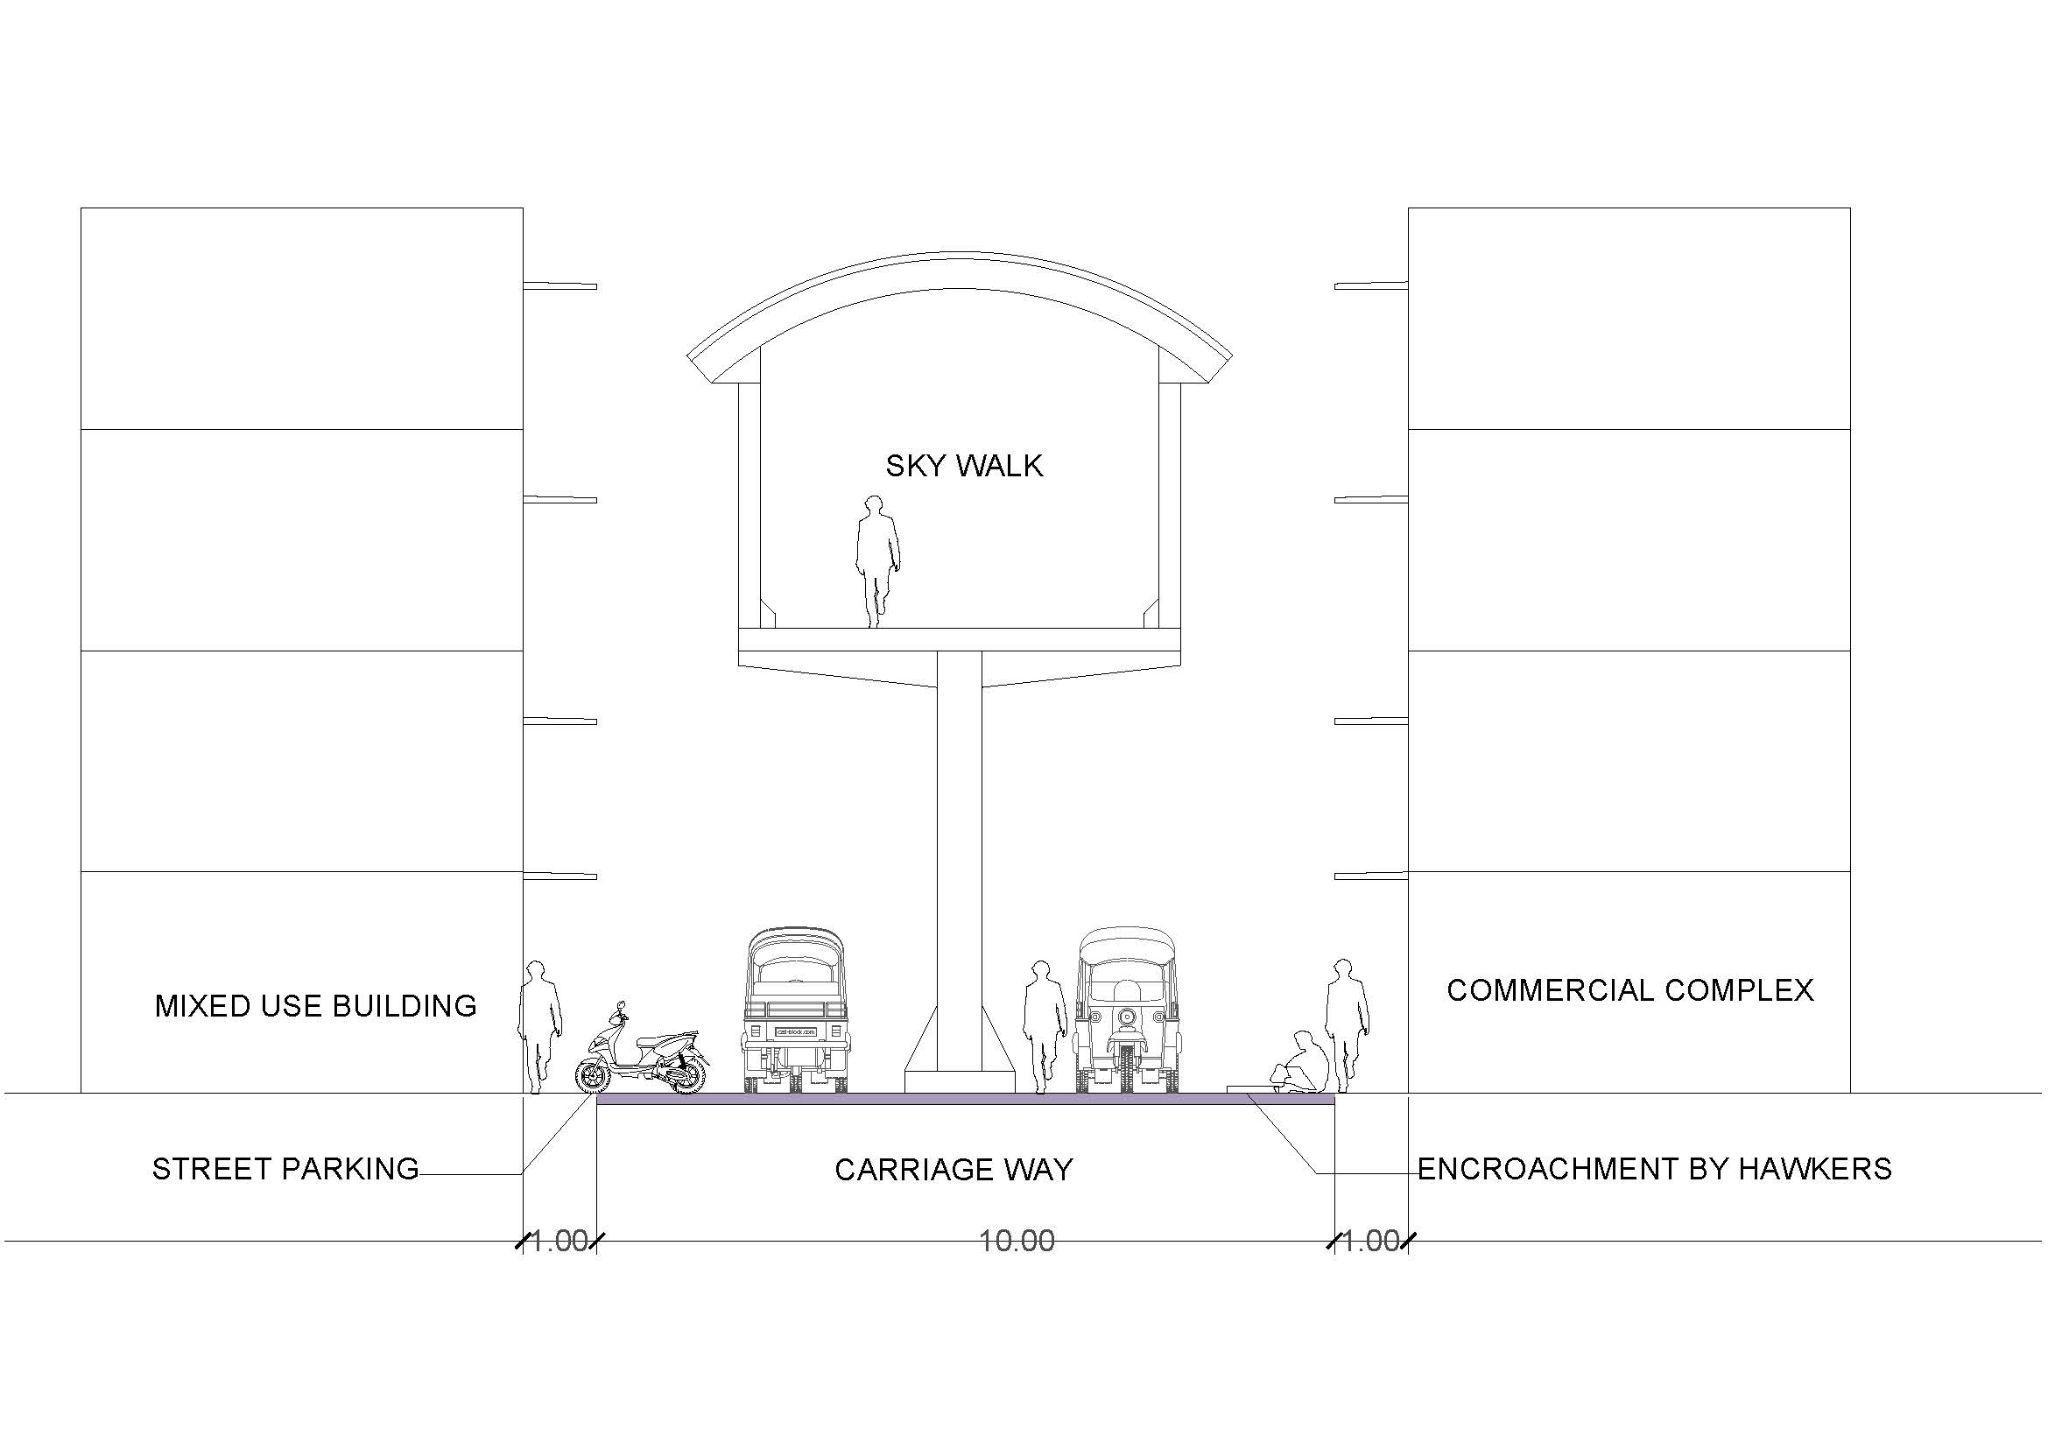
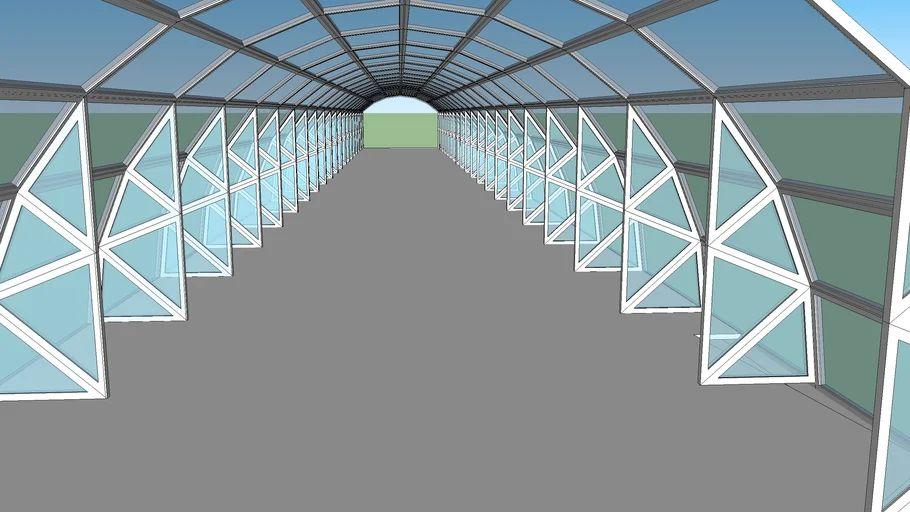
Image 02: Virar West Side under utilized Skywalk and traffic congestion
Image 03: Entry to Virar West Sky walk
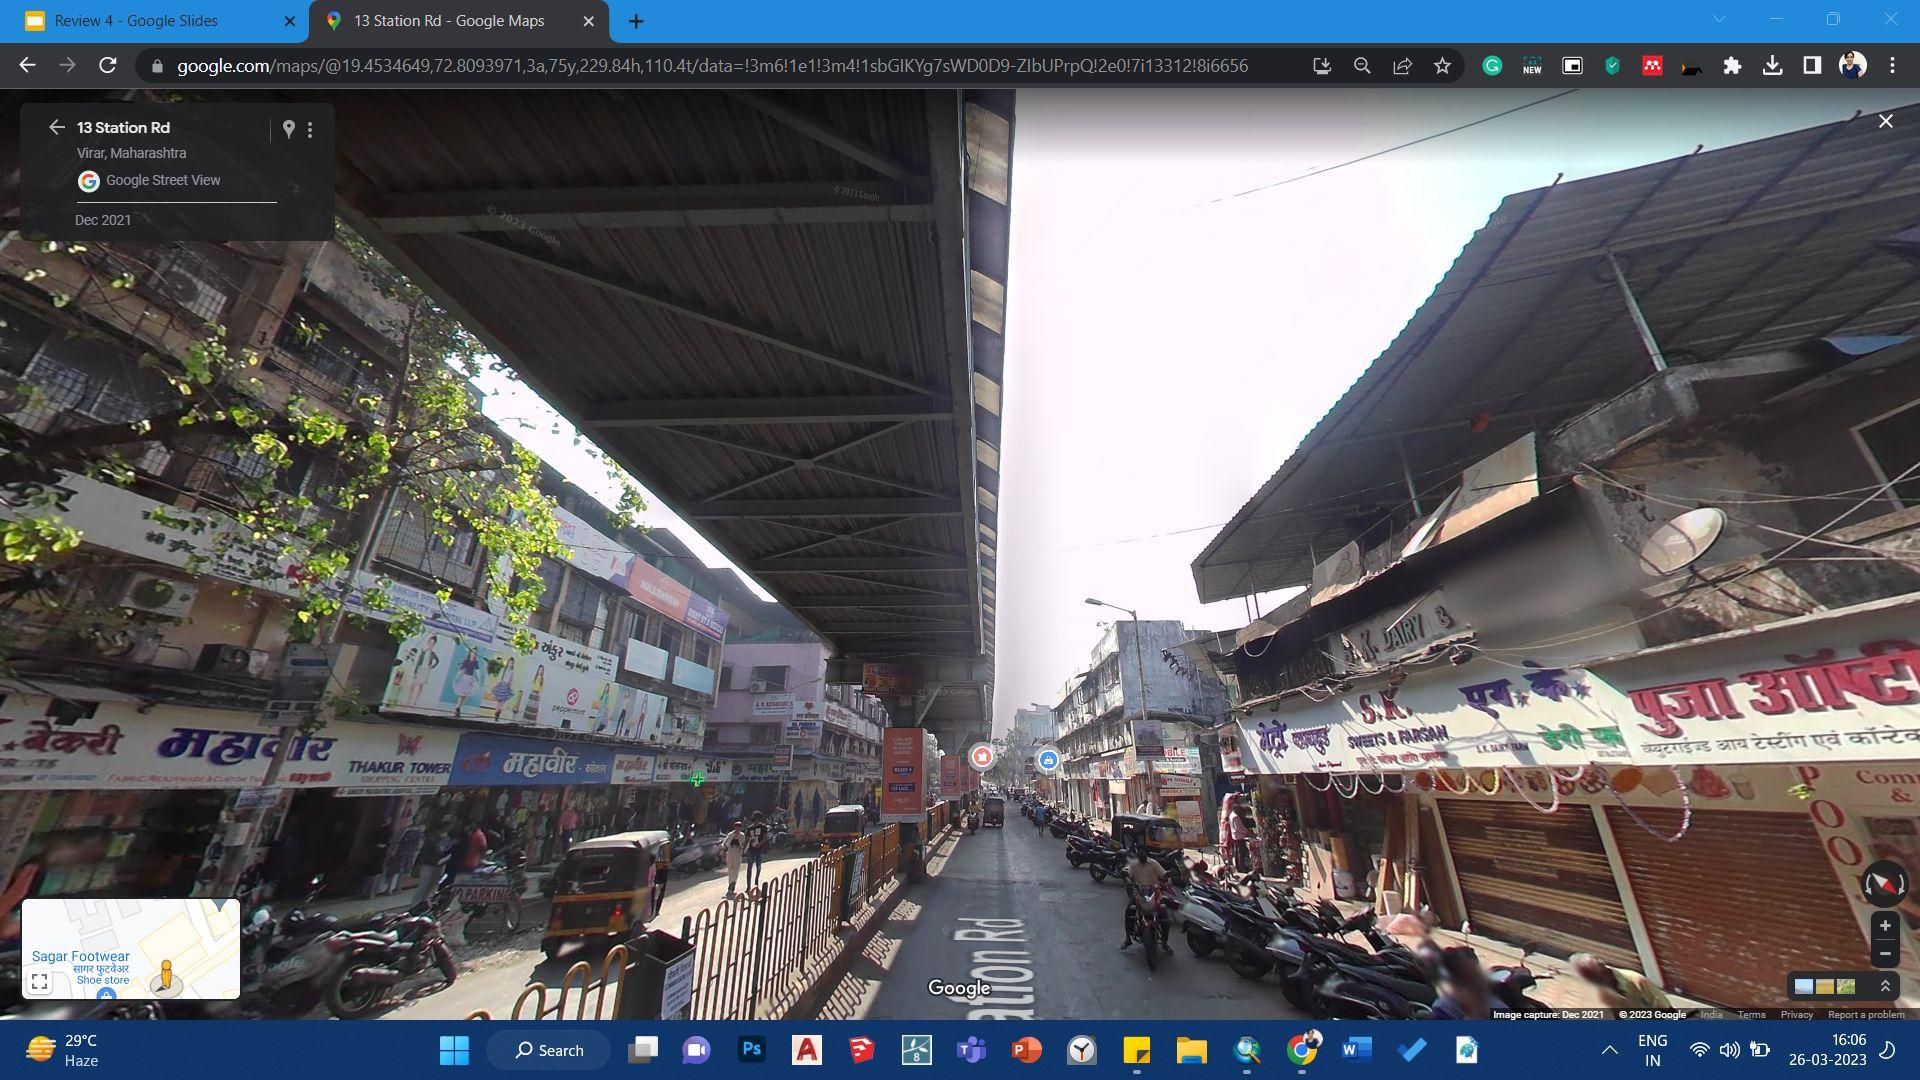
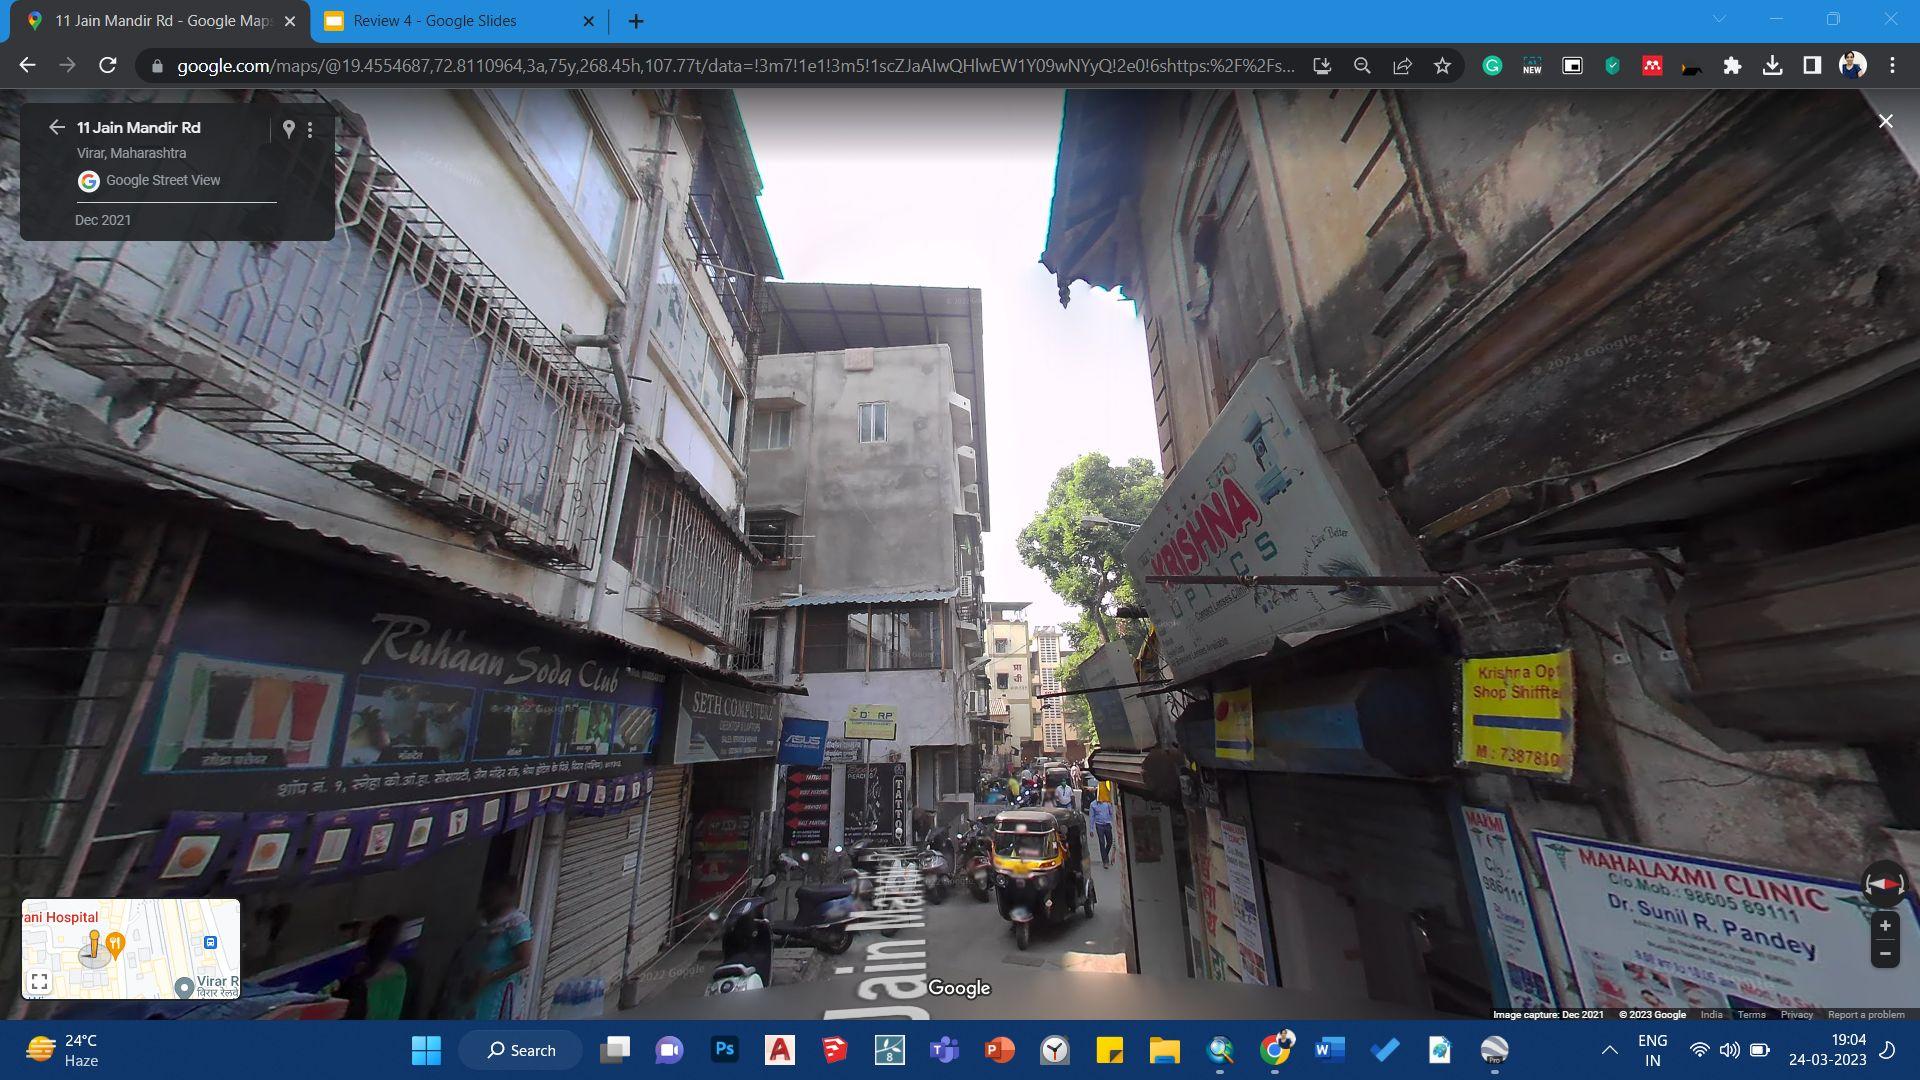
Image 04: NarrowApproach roads
Image 05:Two Wheeler Parking on StationApproach Road
Image 06: Traffic congestion, hawlers, parking
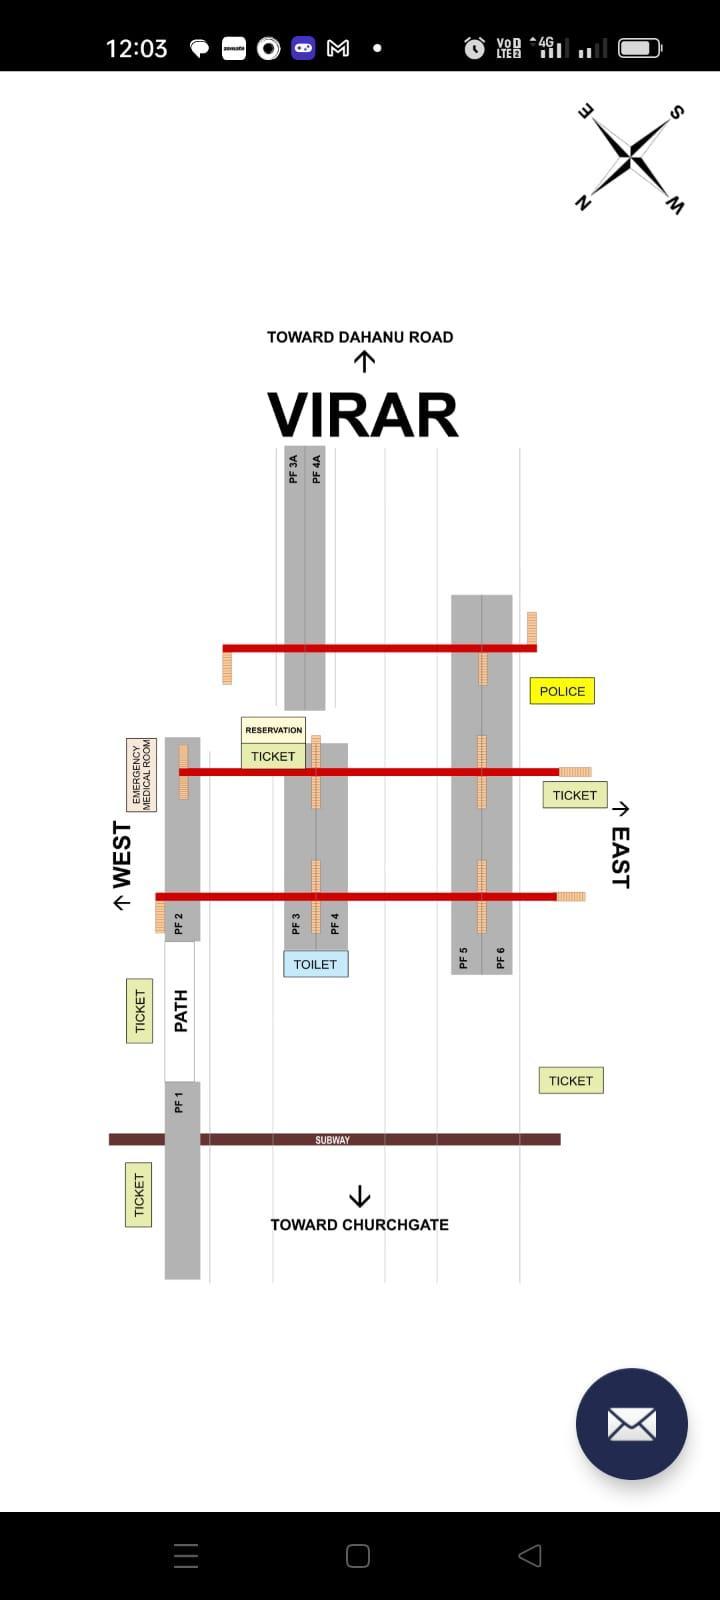
IndicativePlanofStation
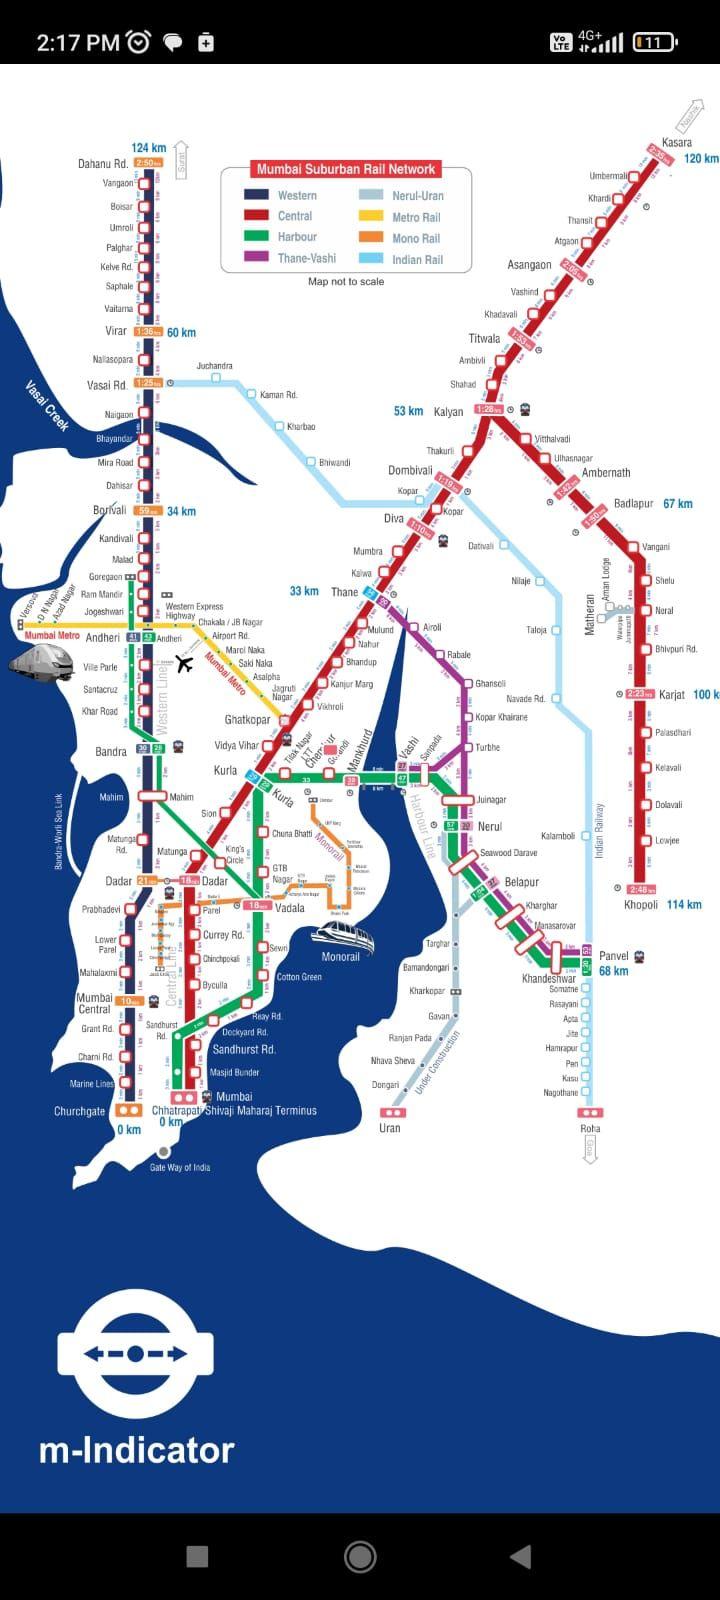
Source:M-Indicator, 2023
Source: Google Street View
Source:Google Maps
Detail of Virar Railway Station
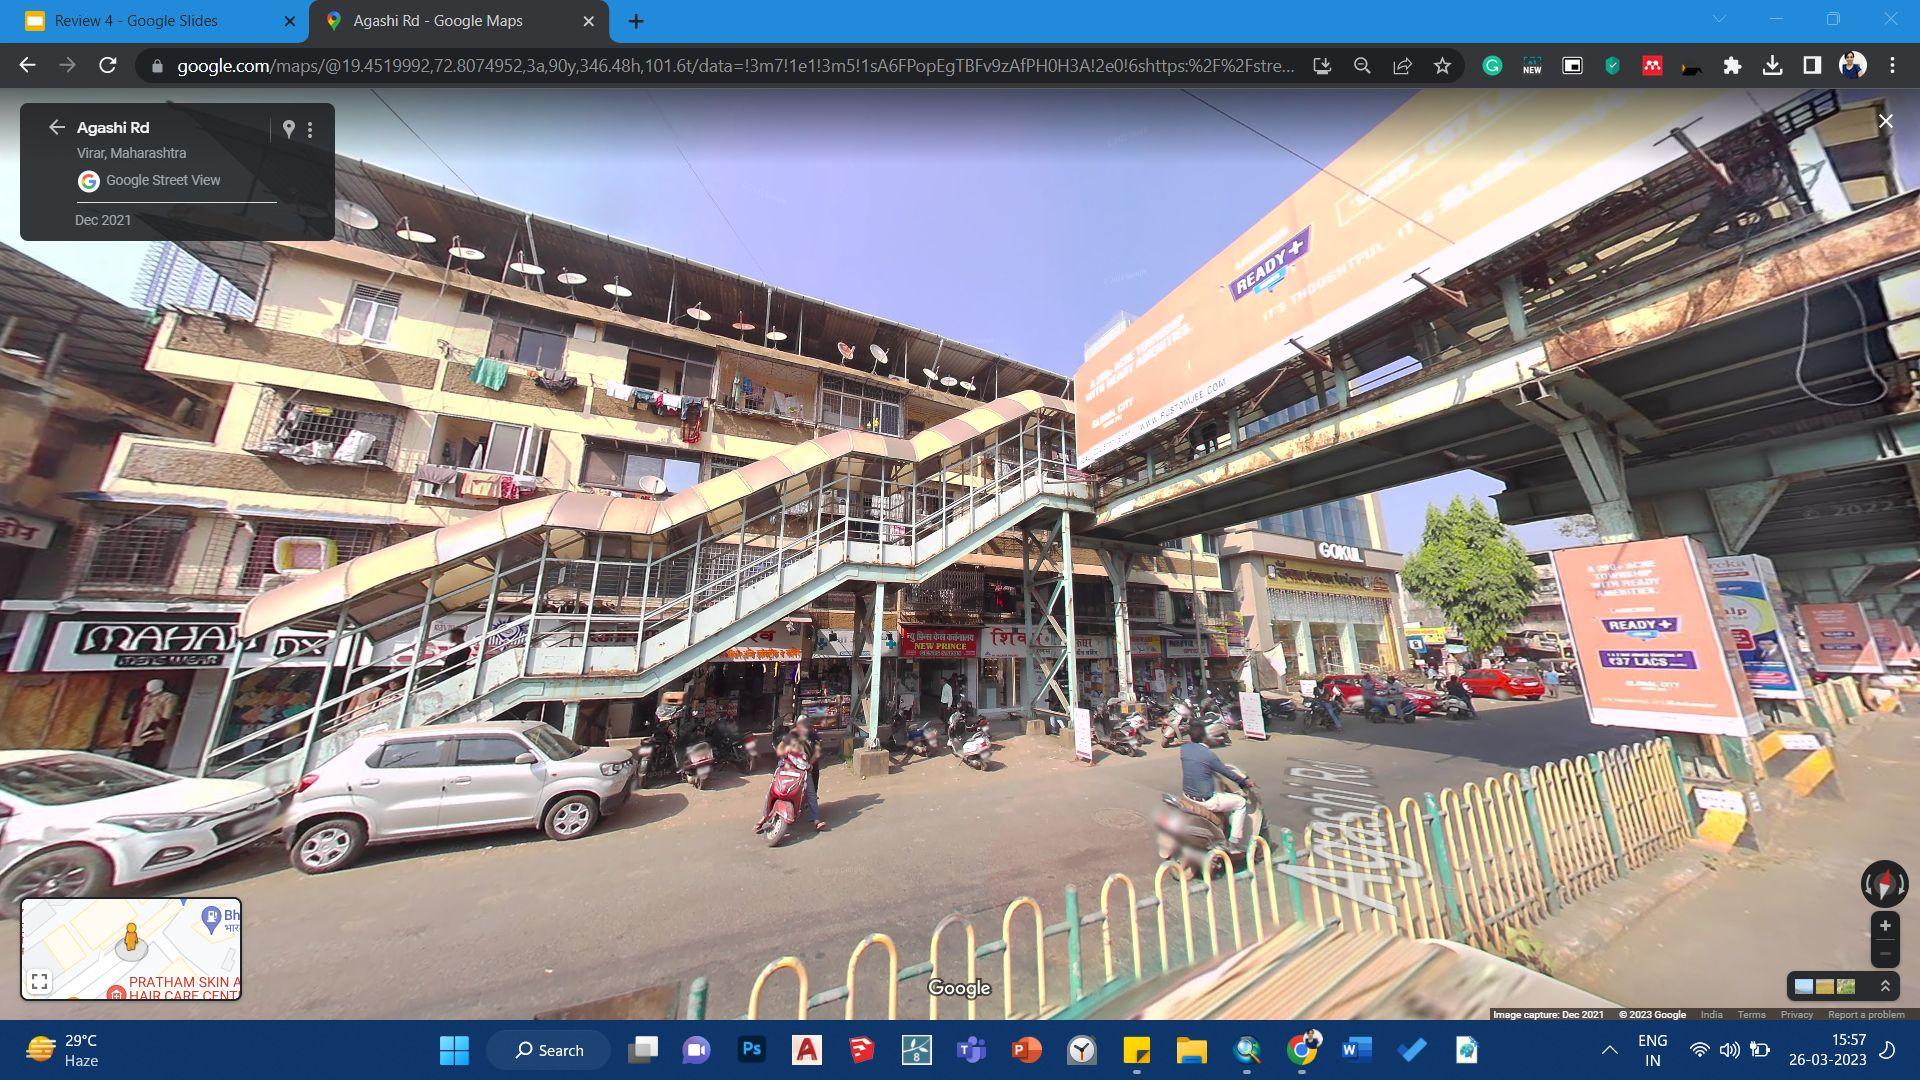
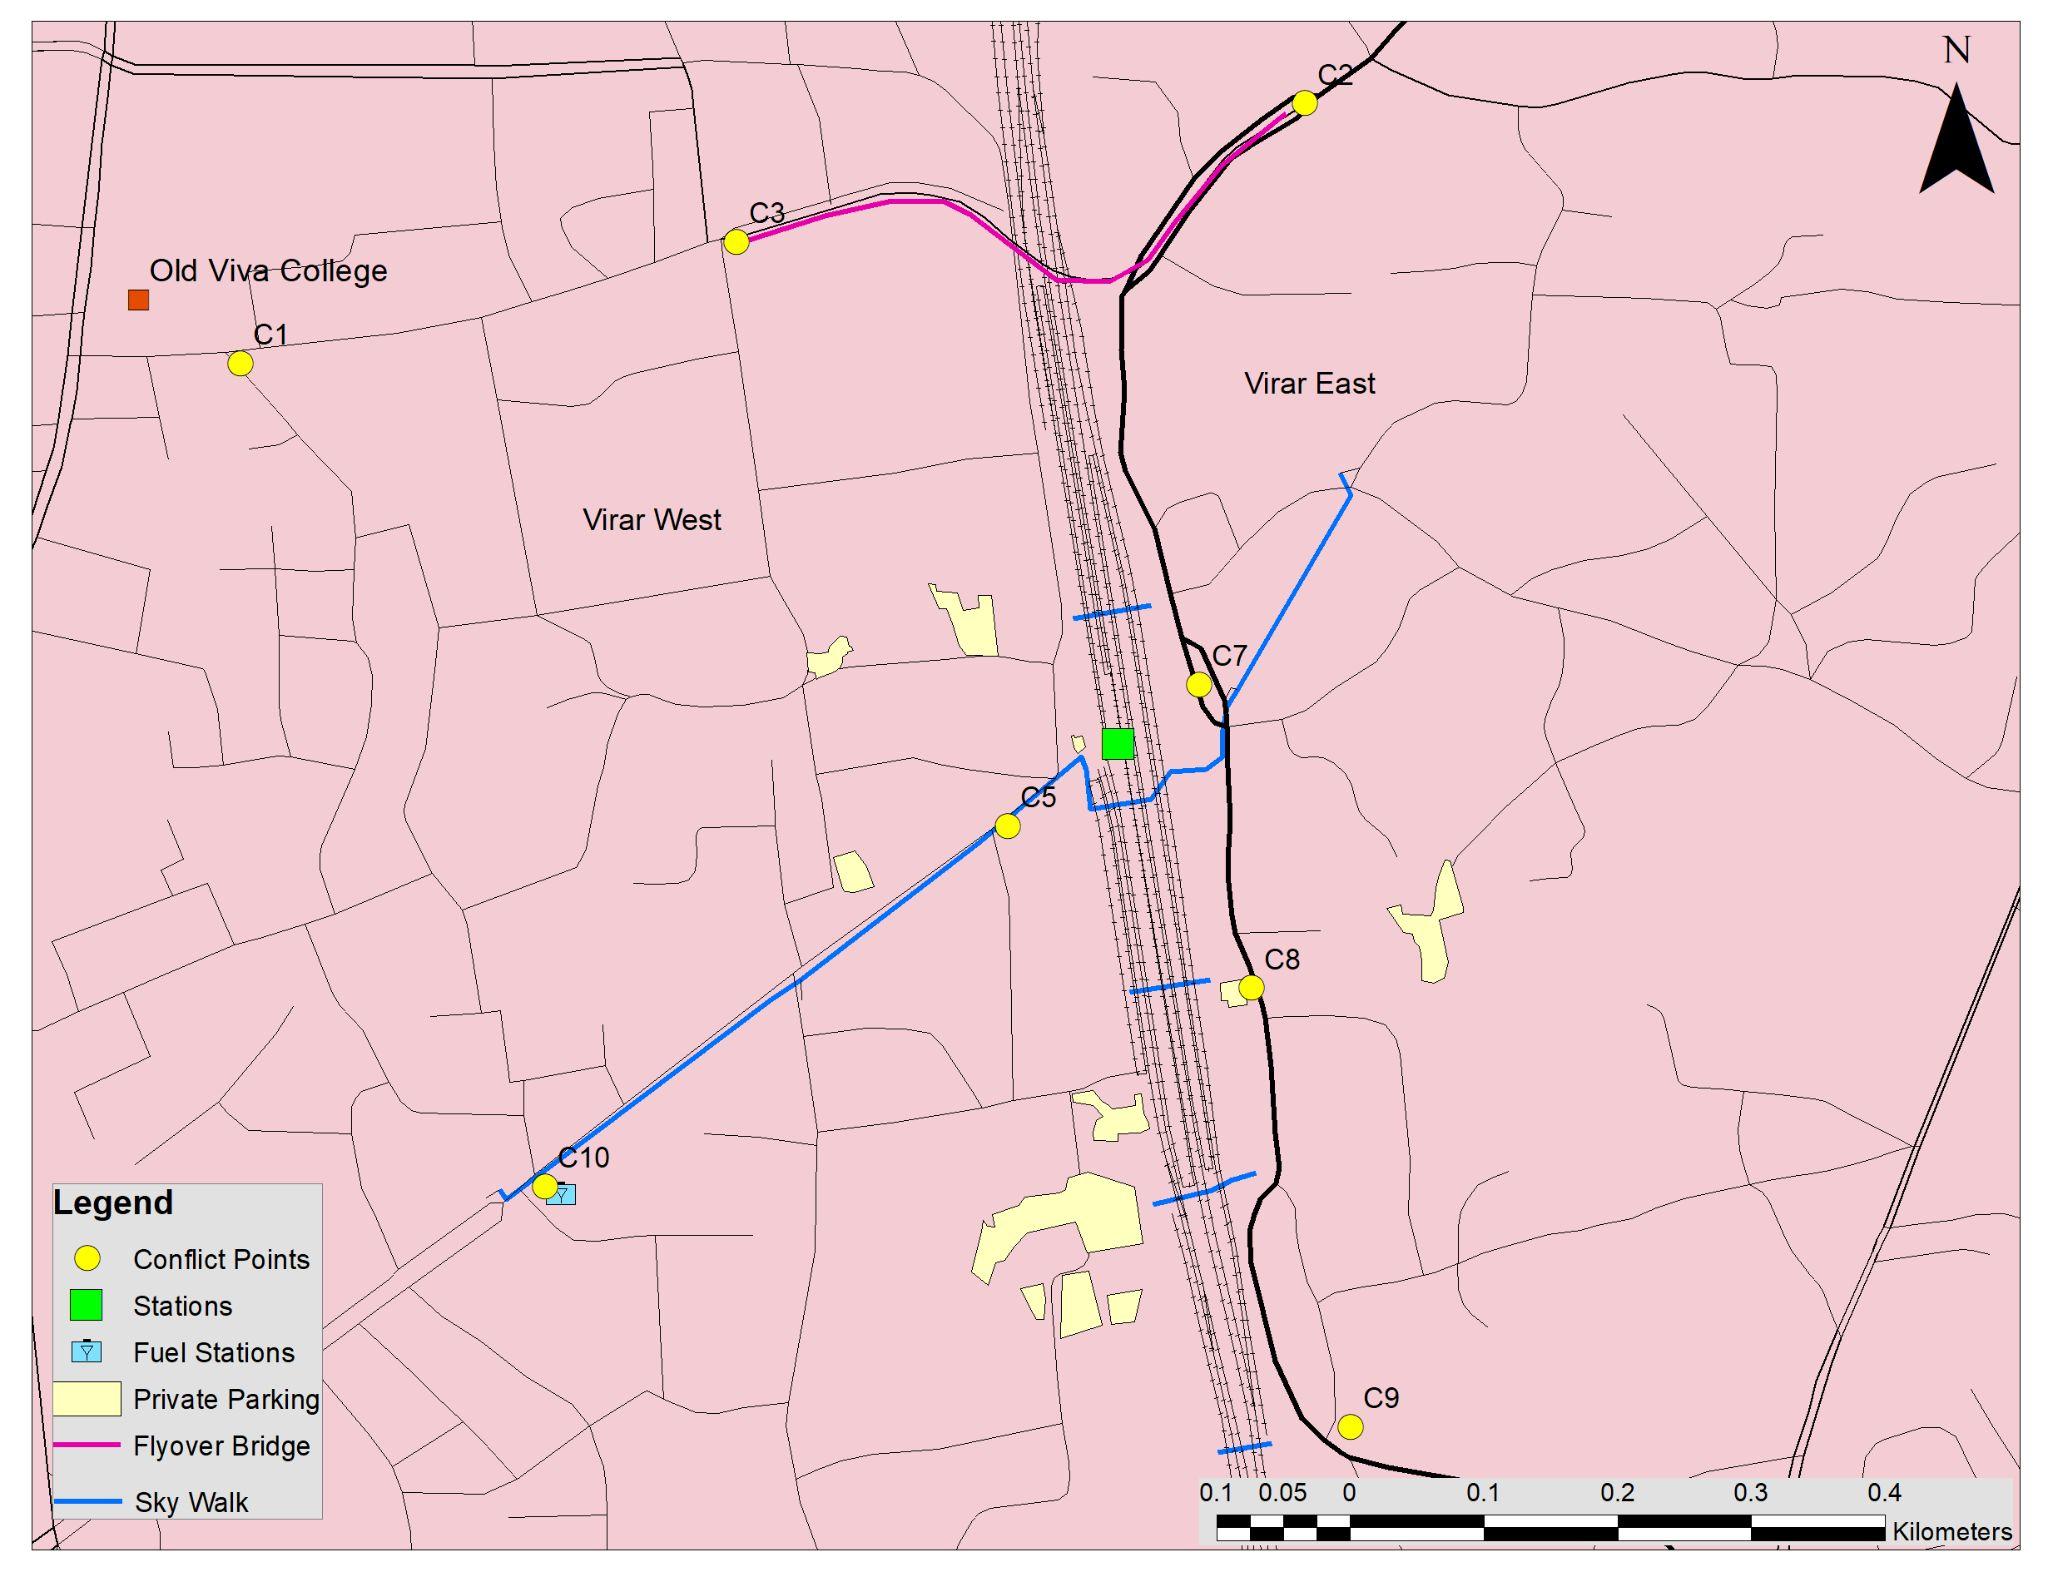
TRANSPORTATIONAND MOBILITY- CONFLICT POINTS
Conflict Point 07, 08, 09
Only one Fuel station in Virar West leading to pressure of the facility and also that being on the approach road to station causes trafficjamsatpeak hours.
Congestion near Virar East Local Railway Station due to mismanaged rickshaw stand, lack of private parking, unreliable public transport, and encroachment by hawkers.
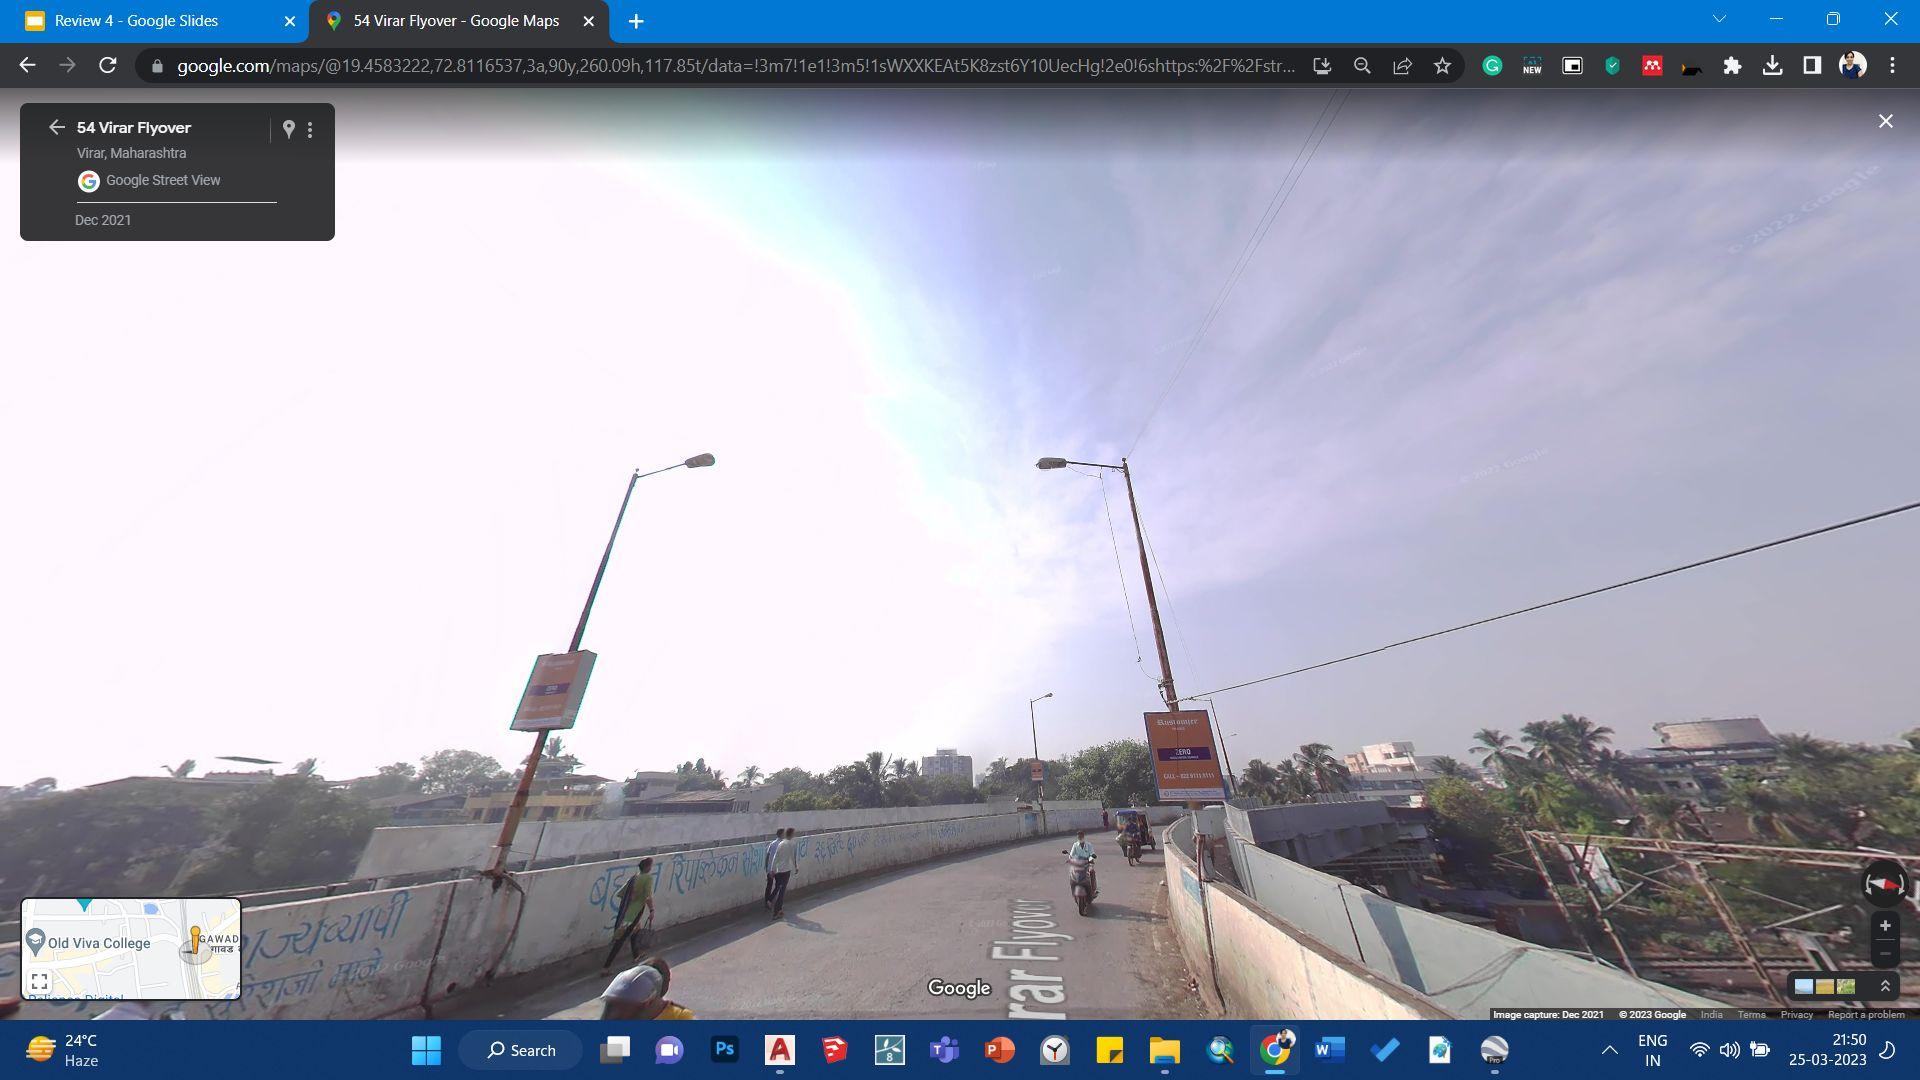
Pedestrians risking their lives by walking on flyovers without designatedwalkways.
Insufficient parking and unreliablepublictransport drive the surge in private vehicleownership.
Source:
People walking of flyover bridge
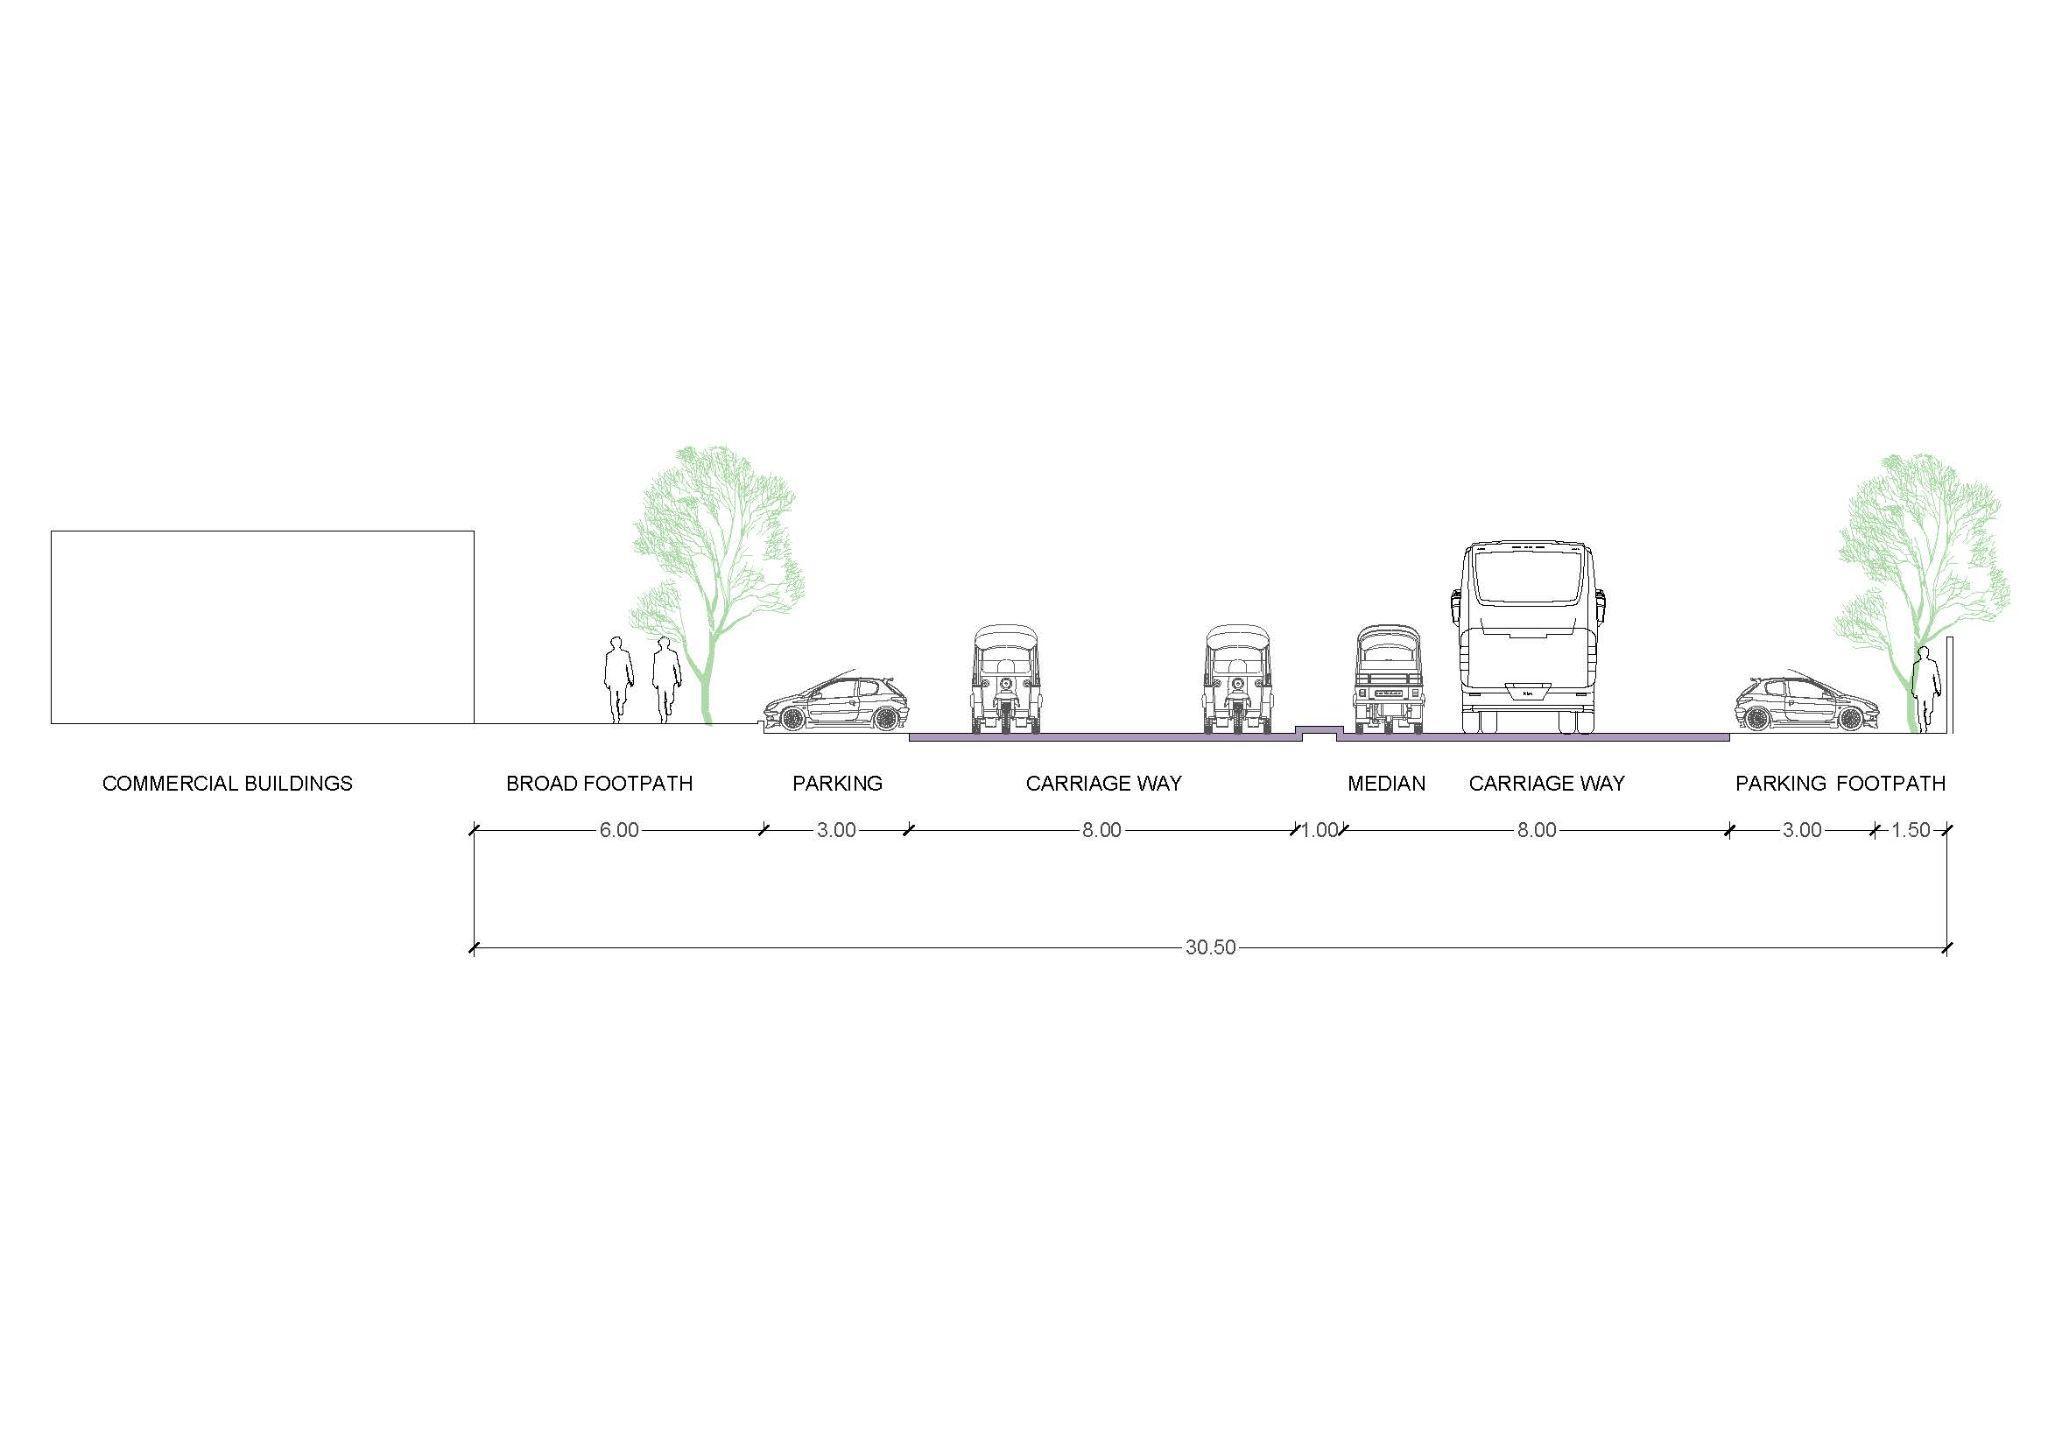
TheapproachroadtoVirarRailwaystation faces a bottleneck, with the road width abruptly reducing from 30 meters to 10 meters, resulting in congestion, traffic slowdowns, and difficulties in accommodating the high volume of vehicles.
The number of registered 2-wheelers has increased by 143% due to the poor connectivity in the city, particularly for commuters traveling to Virar station.
Source: Proposed Land Us Map 2027 , Google Earth, 2023
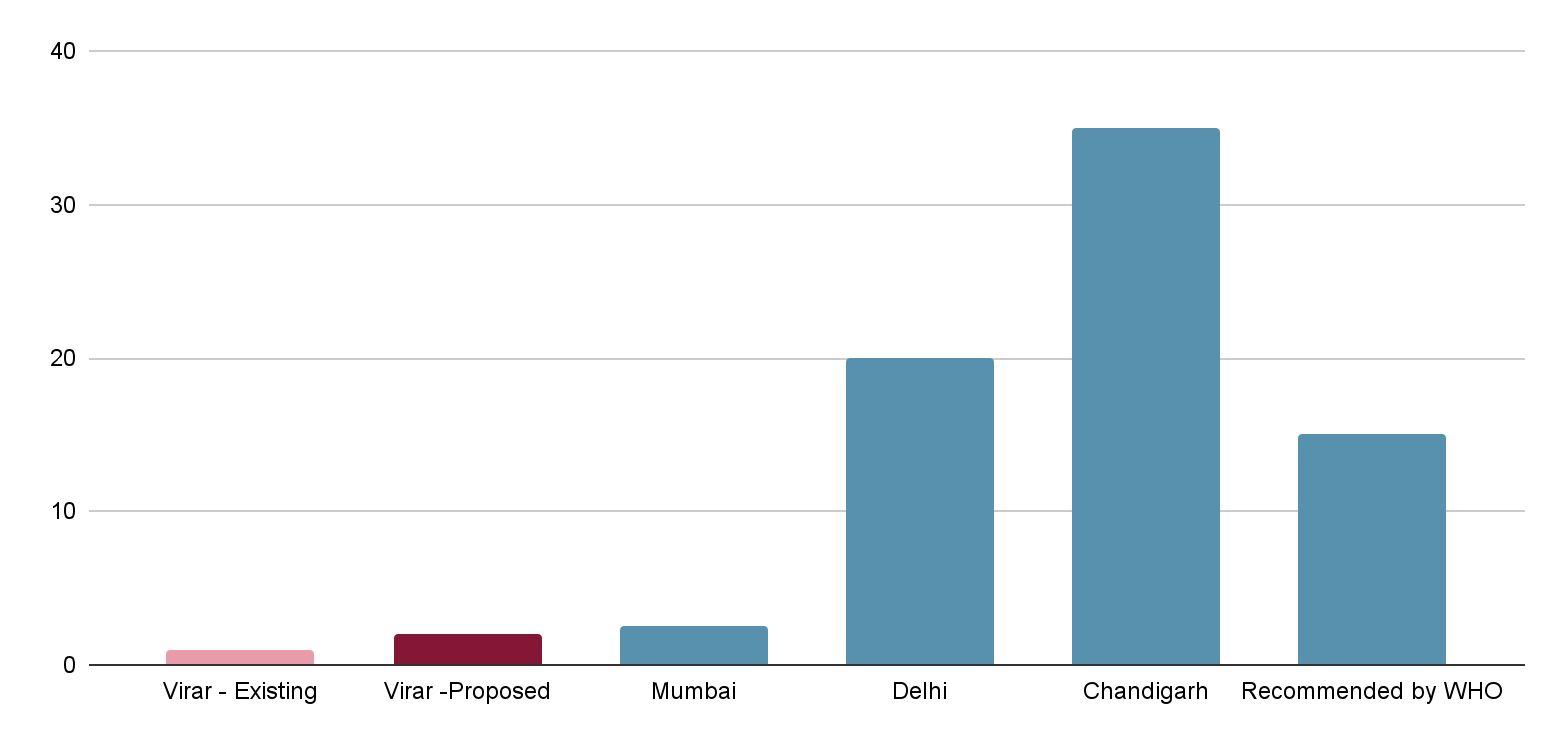
Open Public Spaces in comparison to other cities
Source: Proposed Land Us Map 2027 , Google Earth, 2023
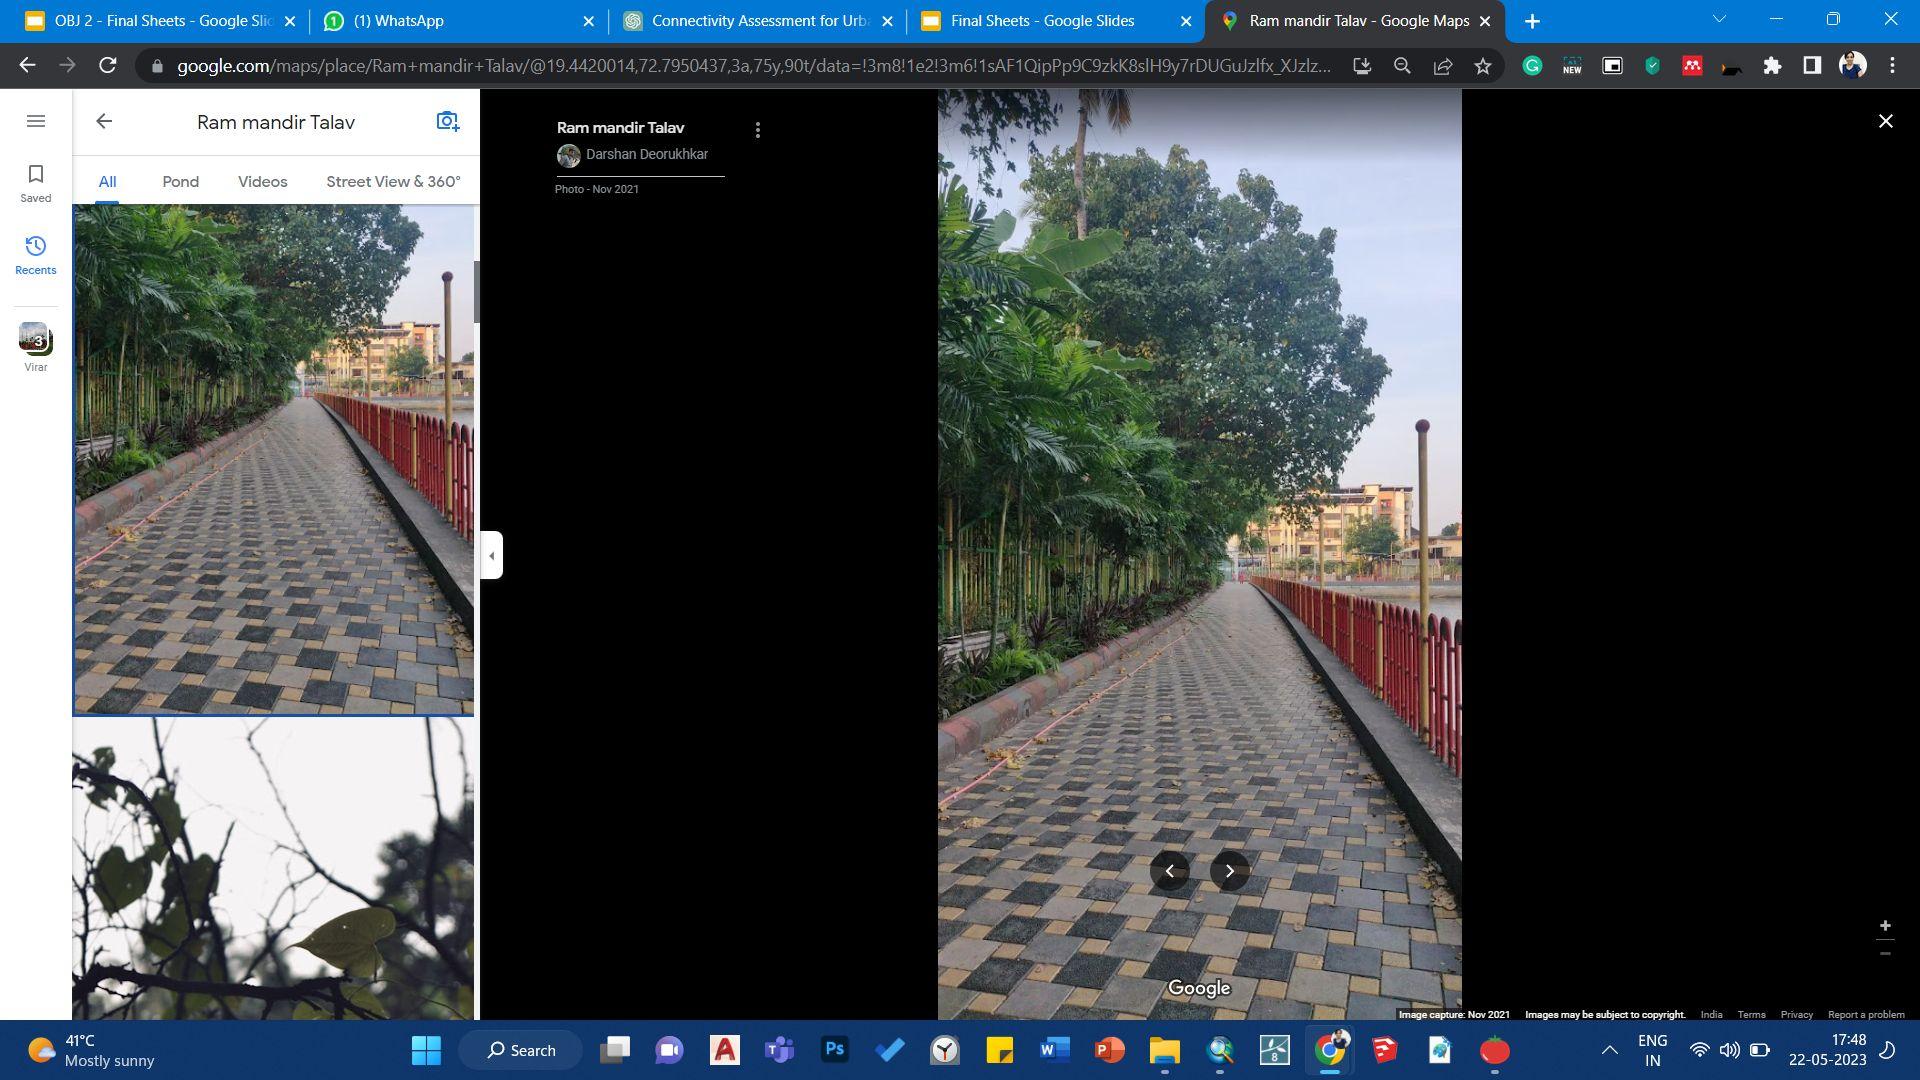
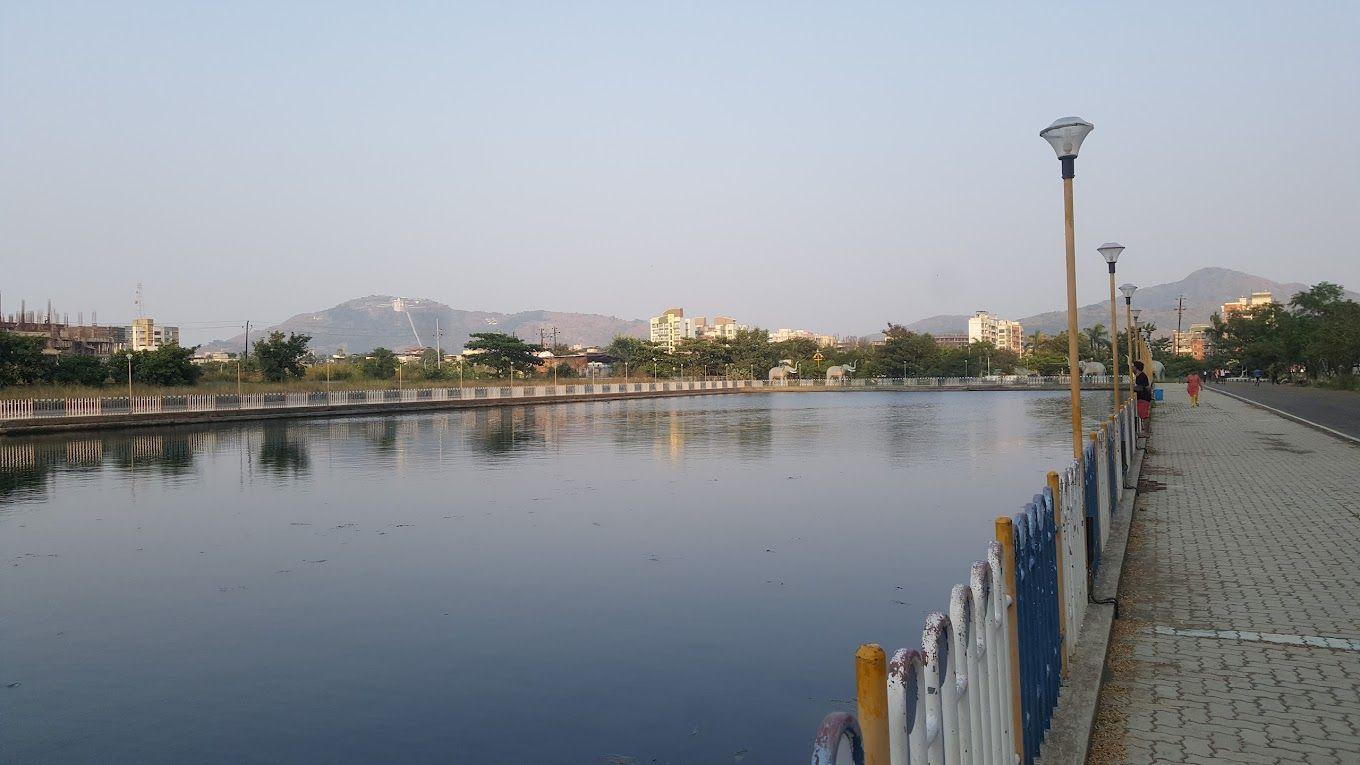
Source: Bolinj and Virat Nagar Lake , Google Photos
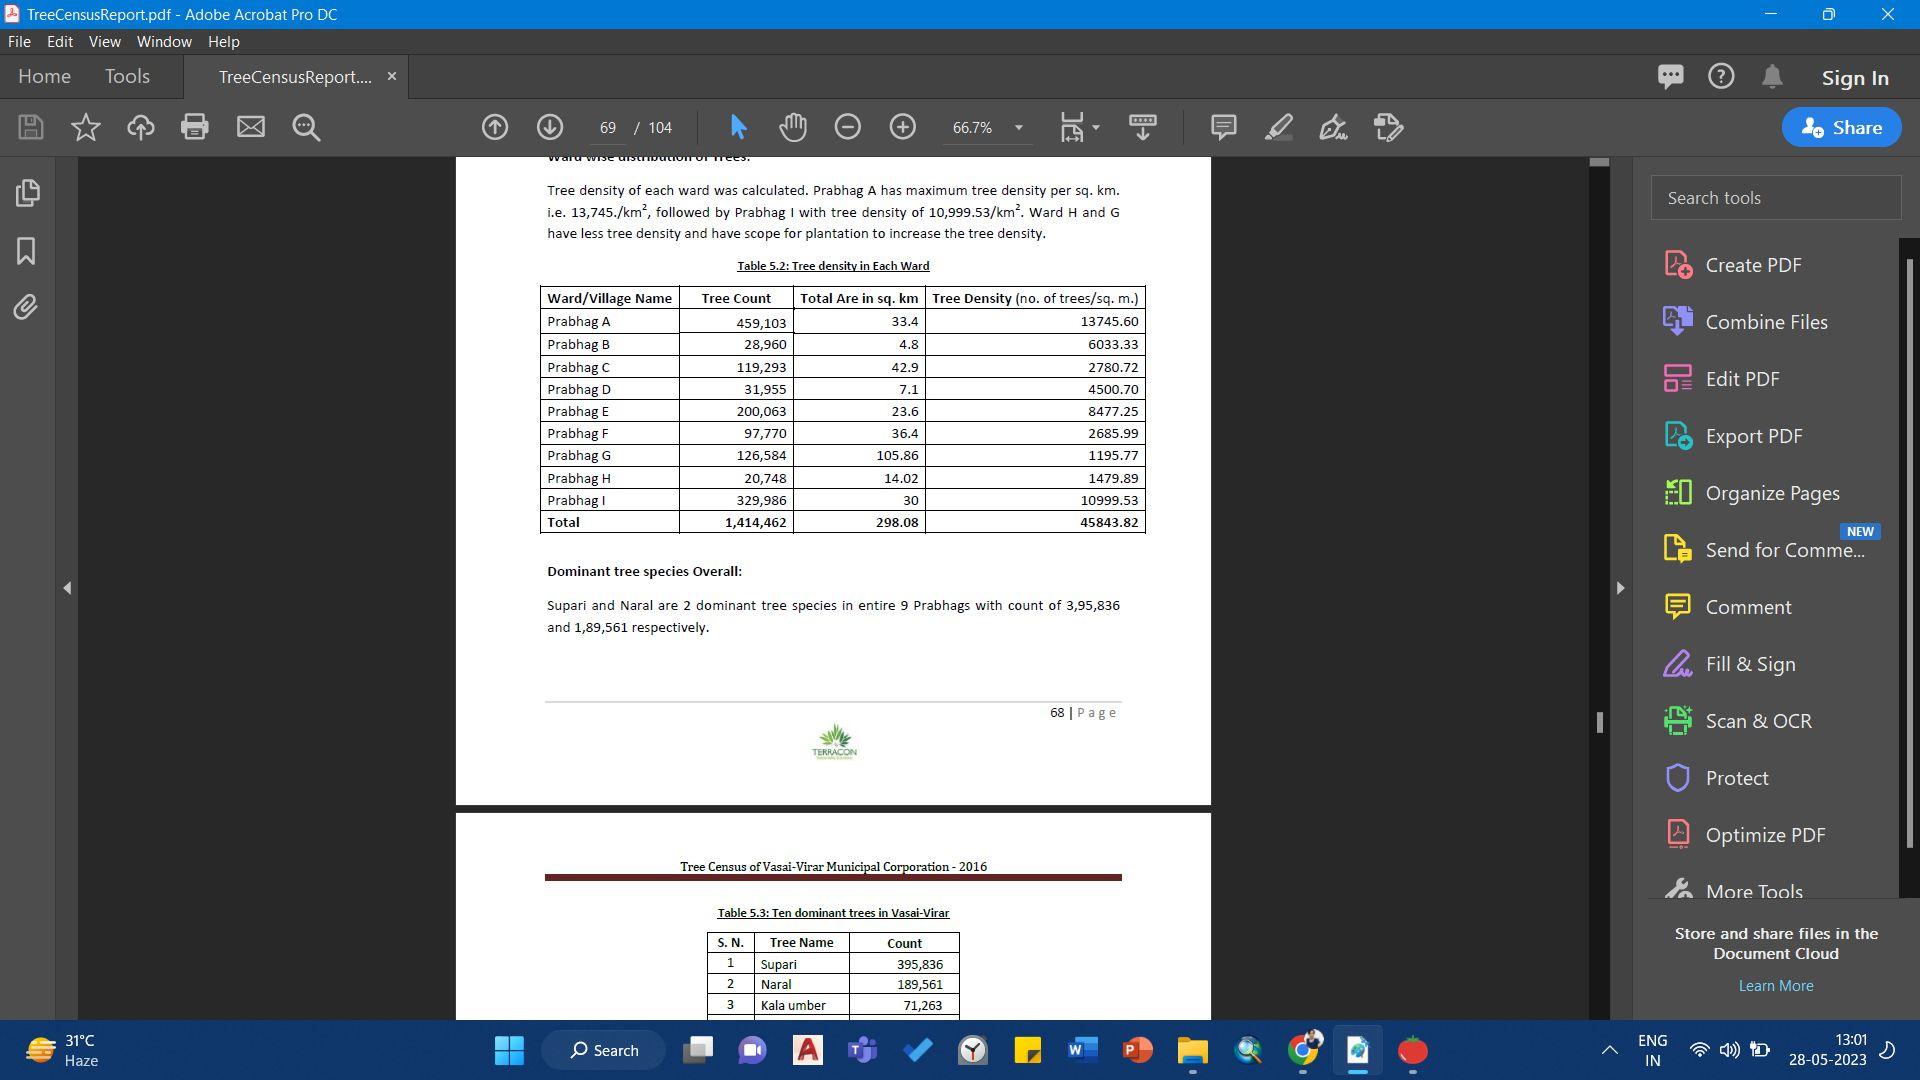
Source: Tree Census VVMC, 2019
Source: PWD ‘23, VVMC
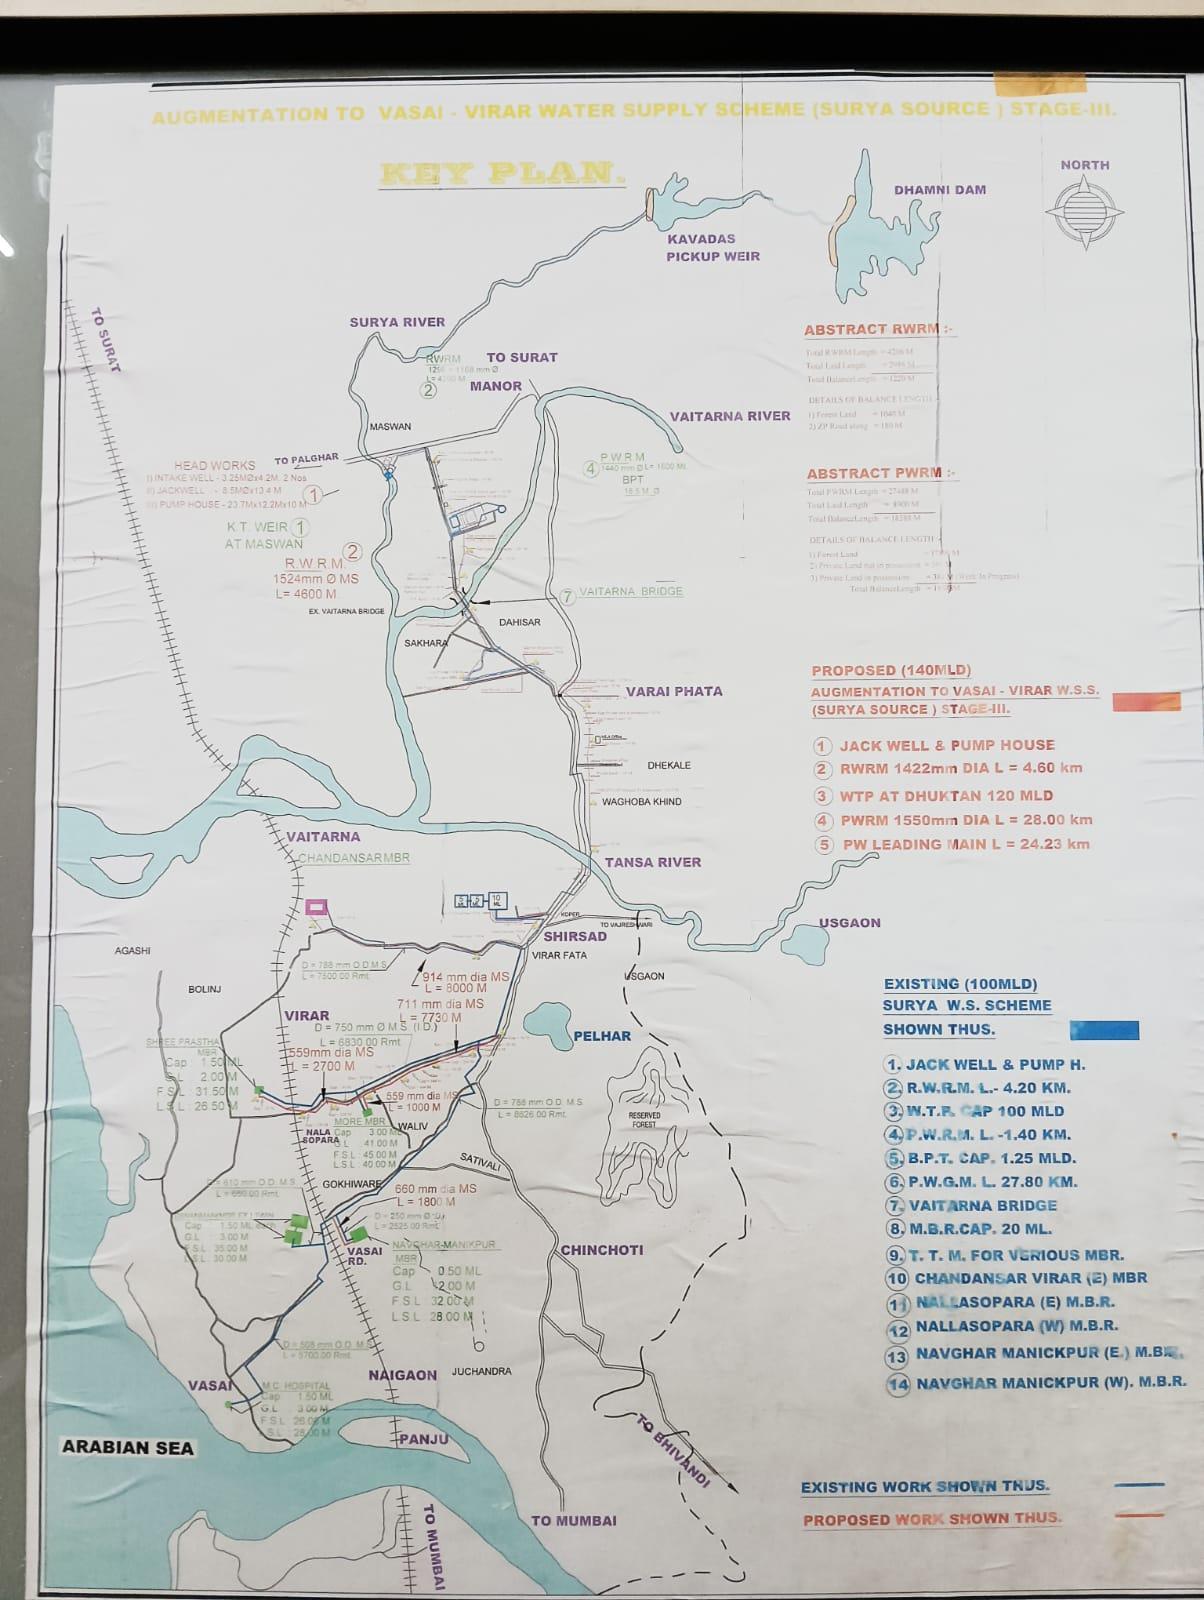
Augmentation to Vasai-Virar Water Supply Scheme (Source Surya)
Stage III
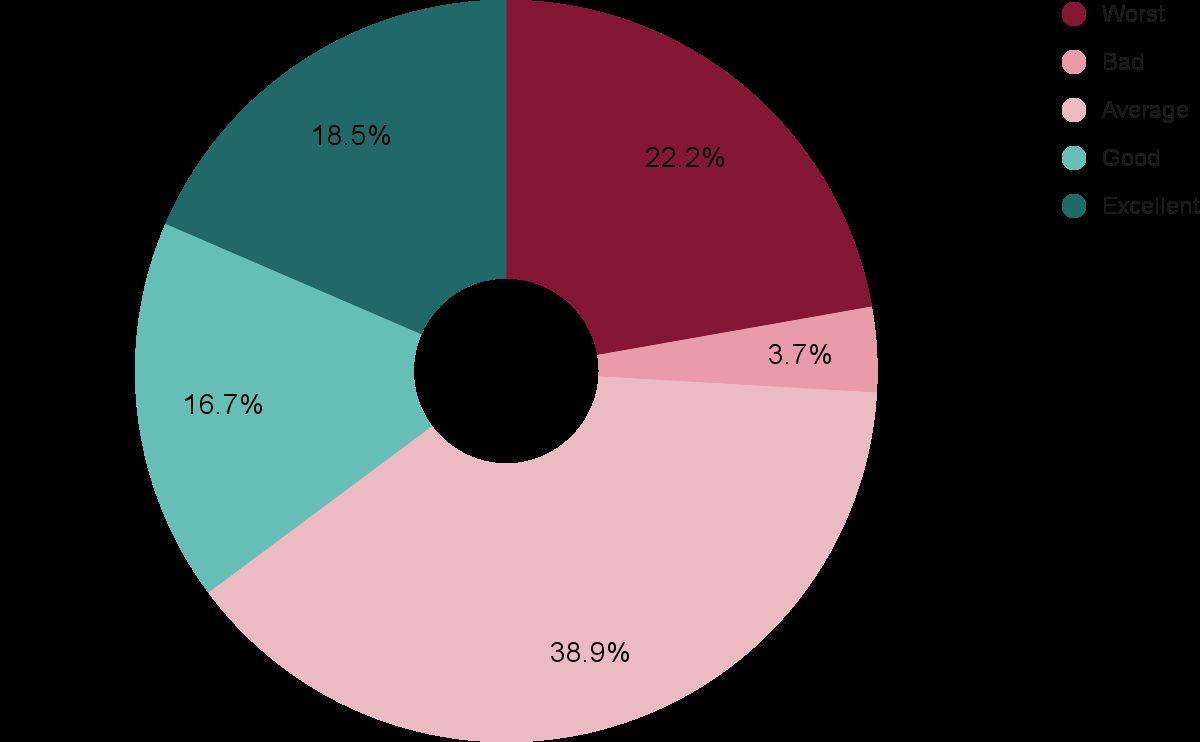
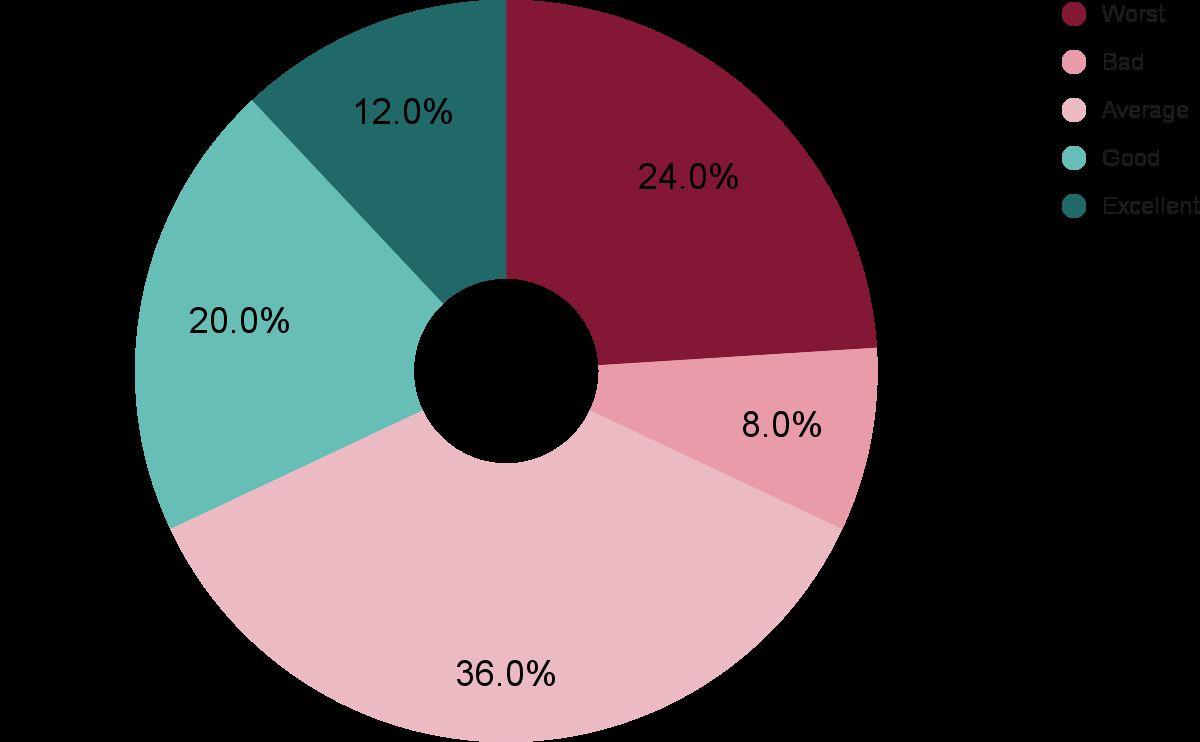
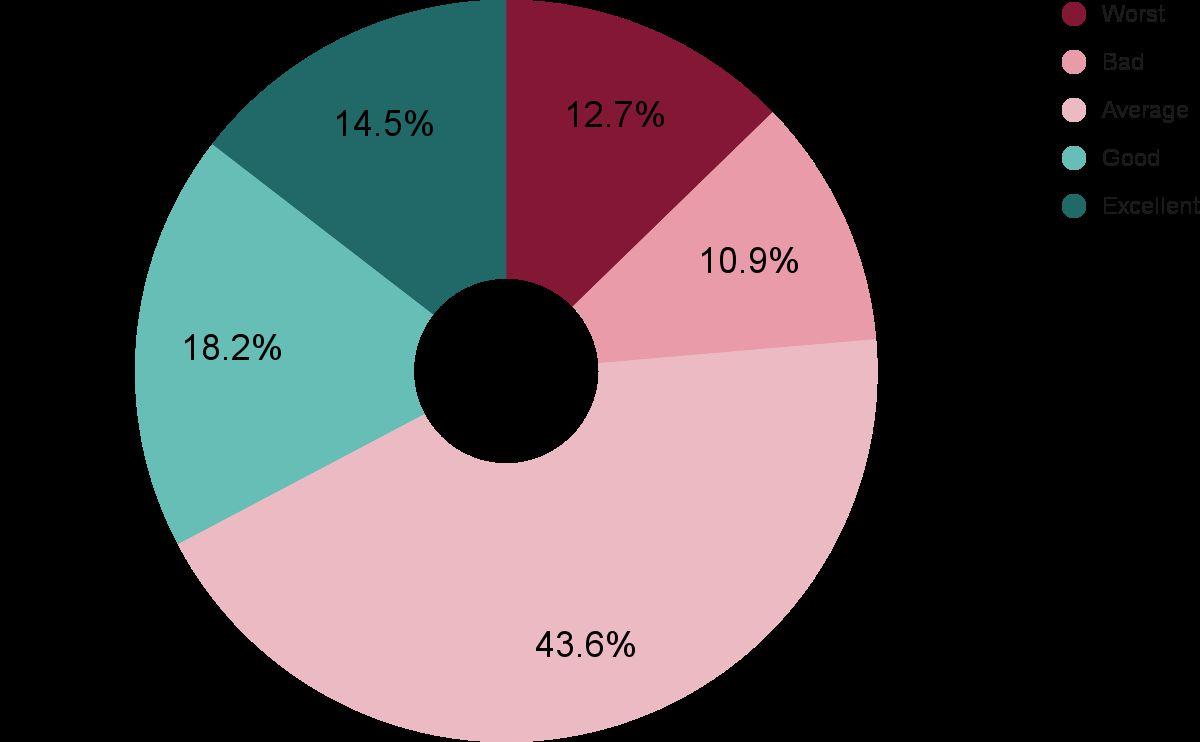
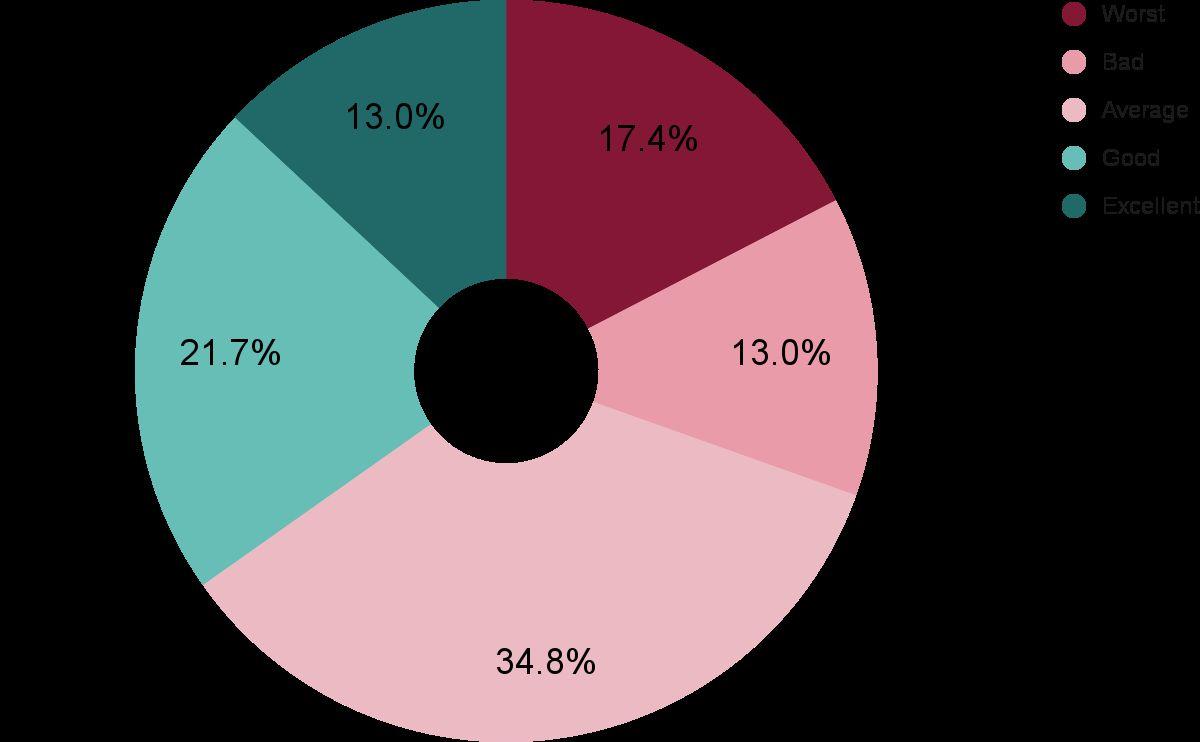
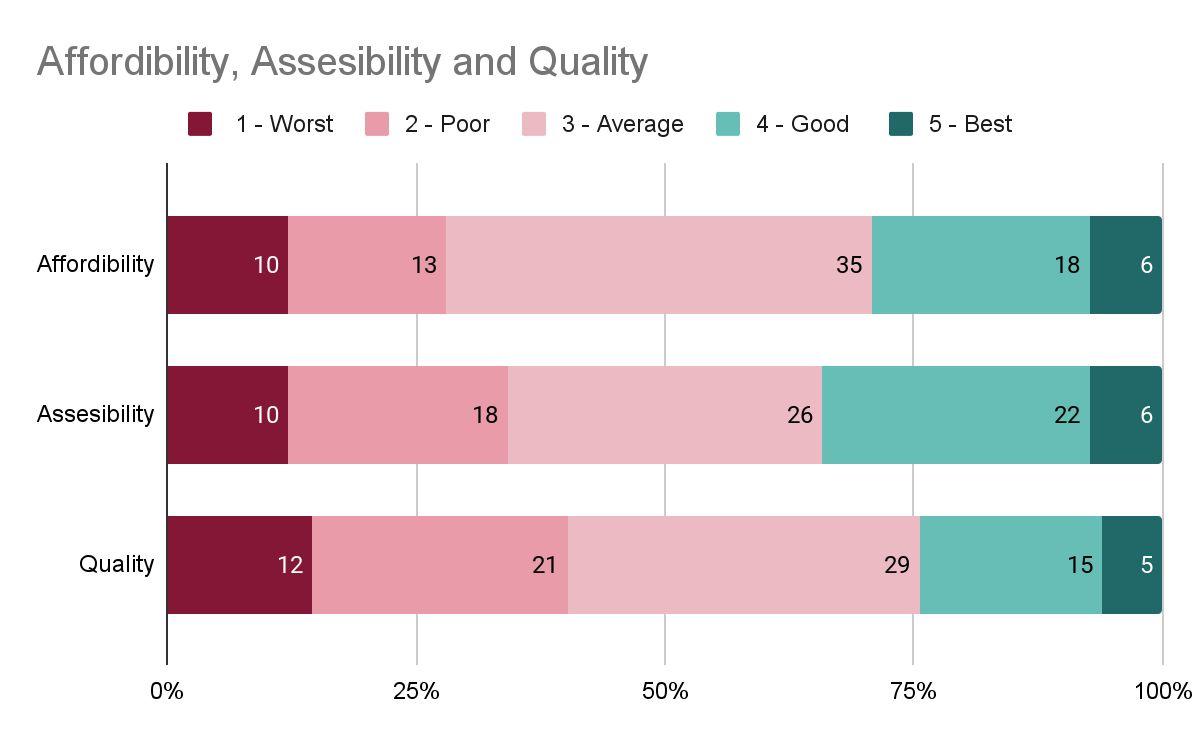
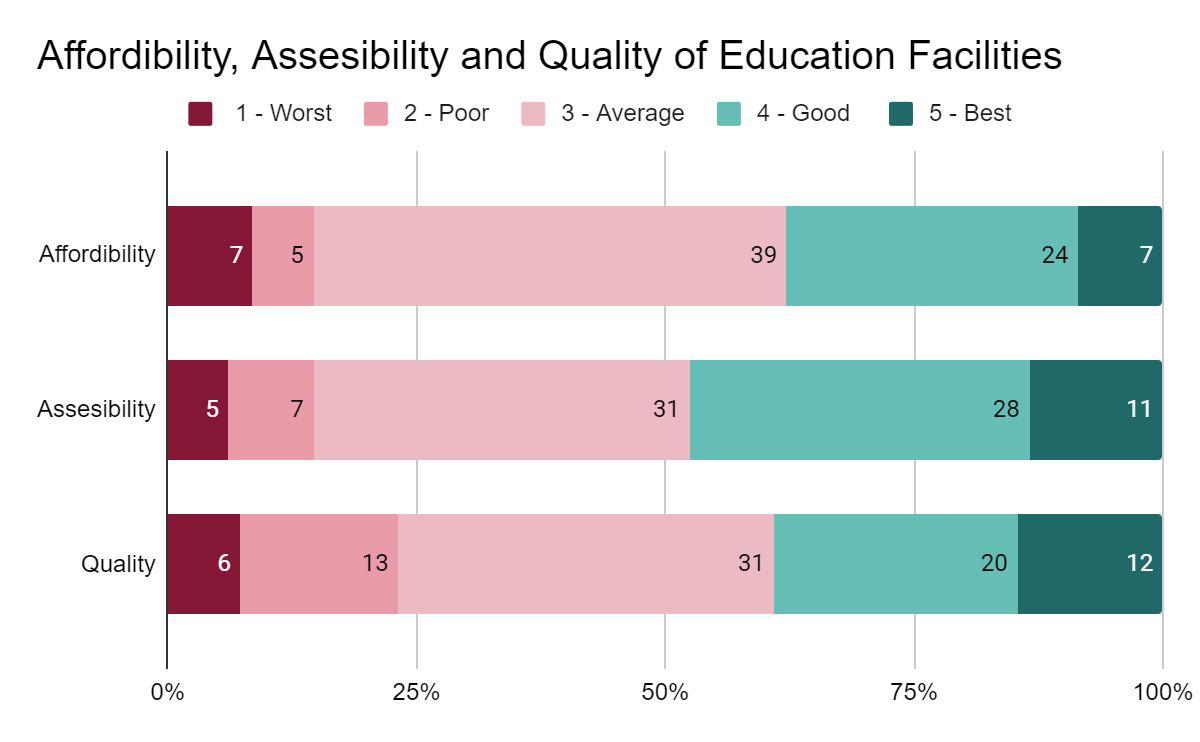
Rate the quality of water supply in your house (1 being the dirtiest and 5 being the cleanest)
AccordingtoMMRDA,thedailywaterdemandintheVasai-Virarregion, whichincludesNalasopara,is360mld.Thecivicbodyisonlyableto supply230mld.Thedemandisexpectedtotouch396mldby2026. The current shortfall of 130 mld has led to a crisis in the region.
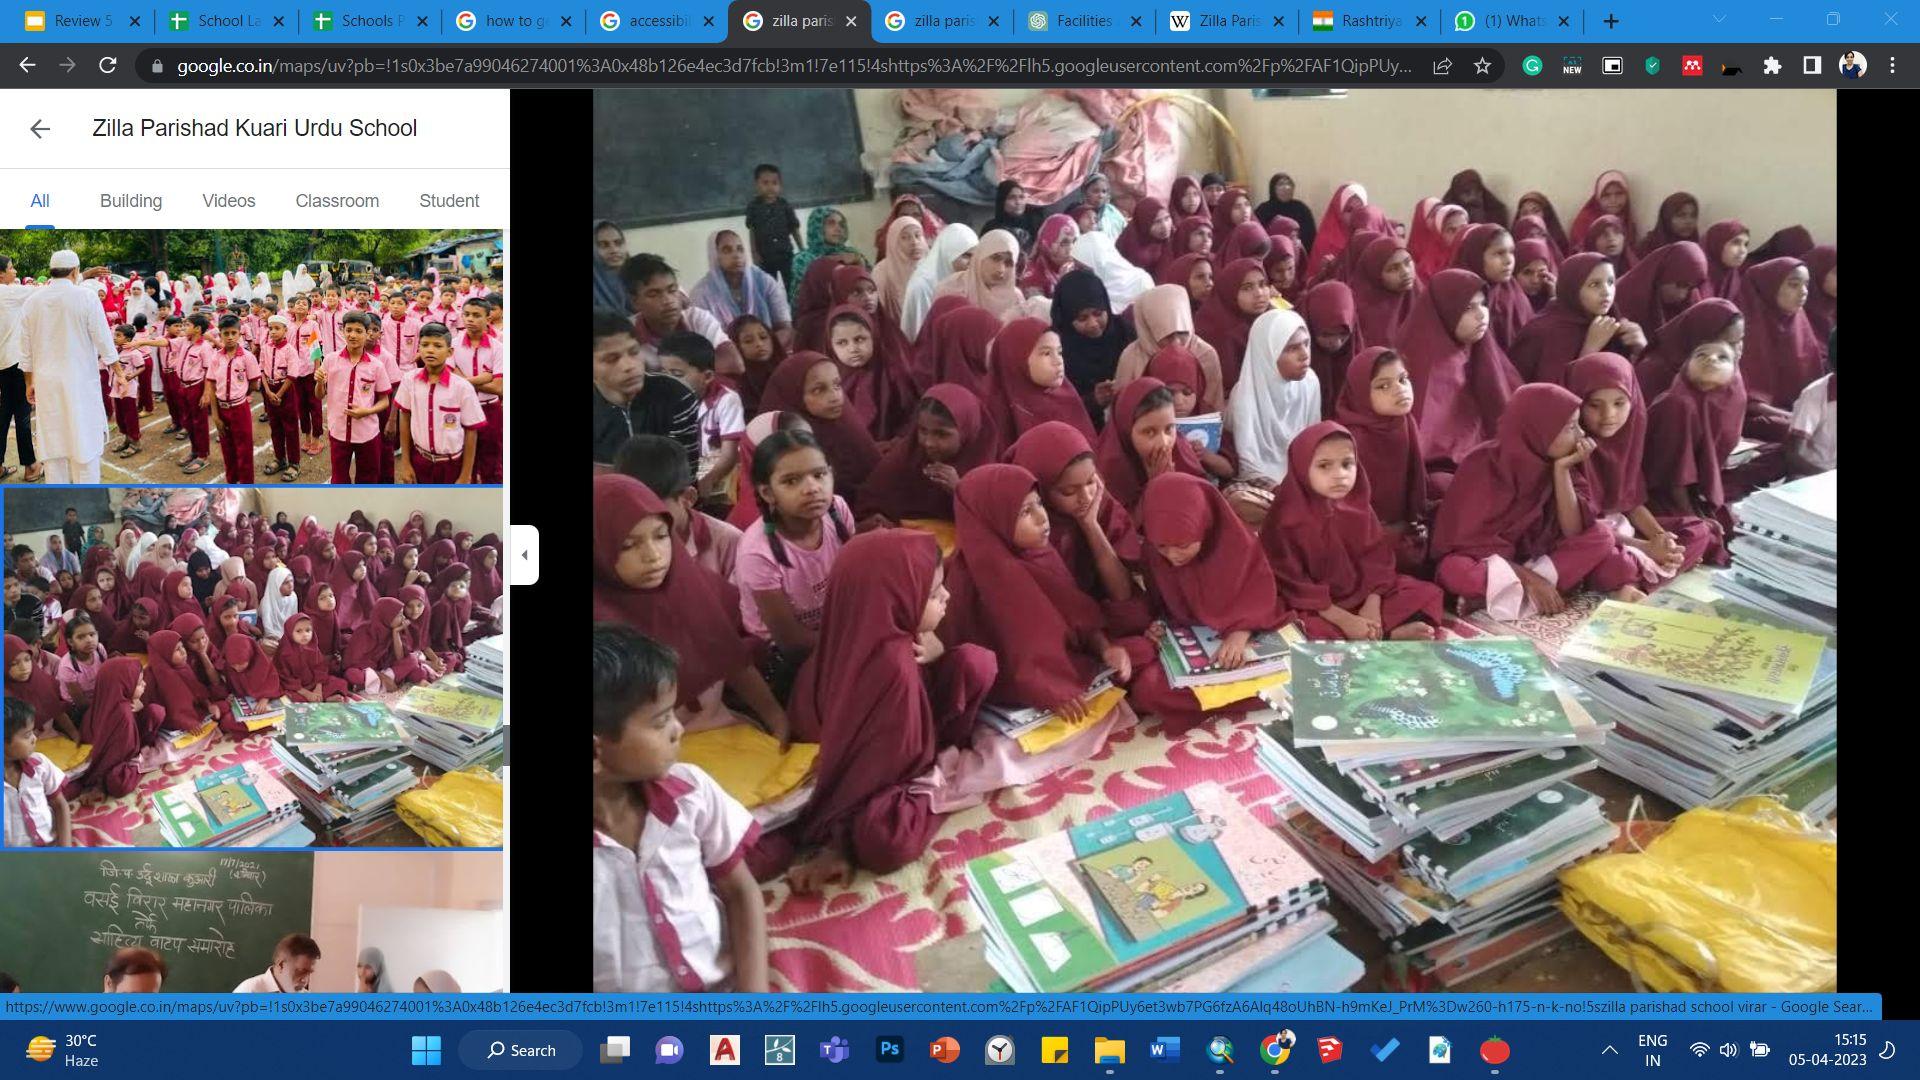
➔ Asperthesurvey,TheresidentsofVirar are satisfied with the available educationalinfrastructure.
➔ .Nopresenceofeducationaldepartment inVVMC.
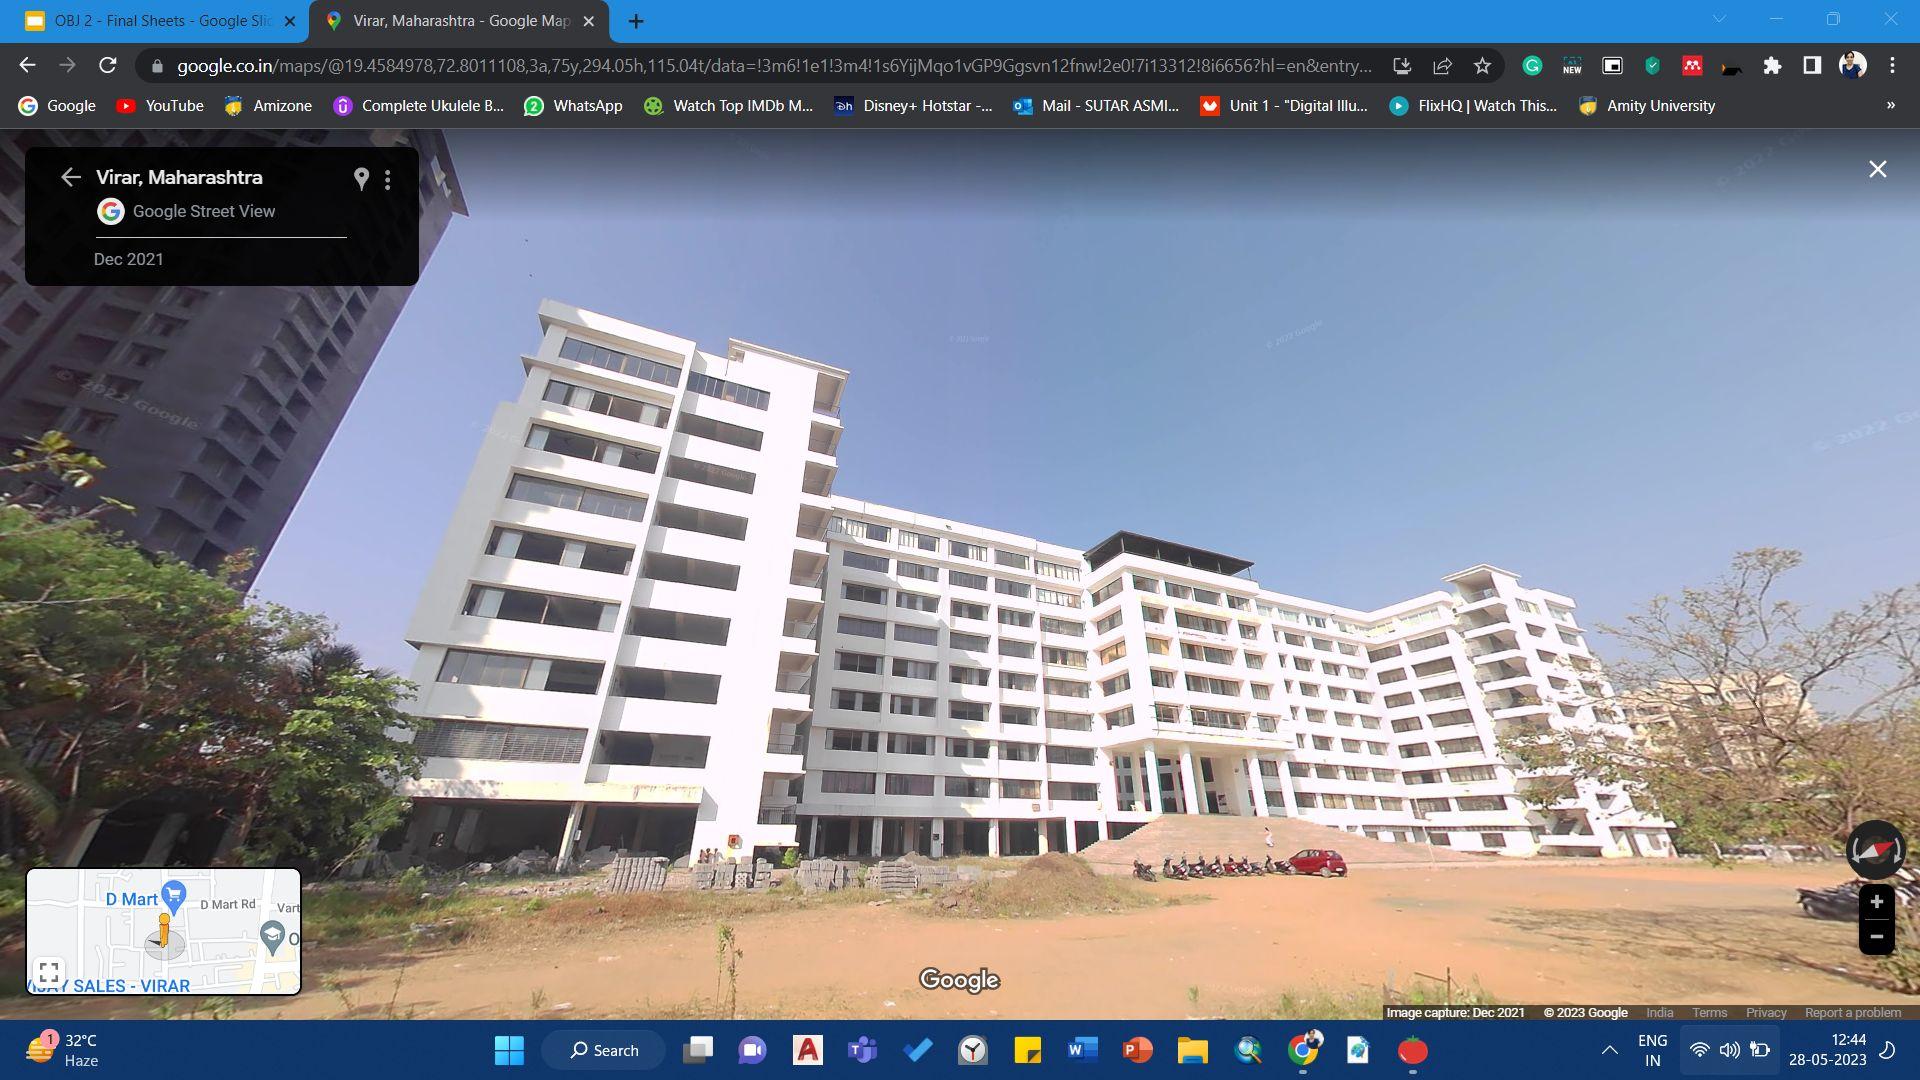
➔ Availability of only one degree college leads to dependency on local train for highereducation.
➔ The majority of the educational facilities in Virar city do not align with the proposed Virar land-use map for 2007-2027.
Source: URDPFI, Educational Infra,Educational Department VVMC.
Impacts of Urbanization on City's Sustainable DevelopmentACase of Virar City, Maharashtra
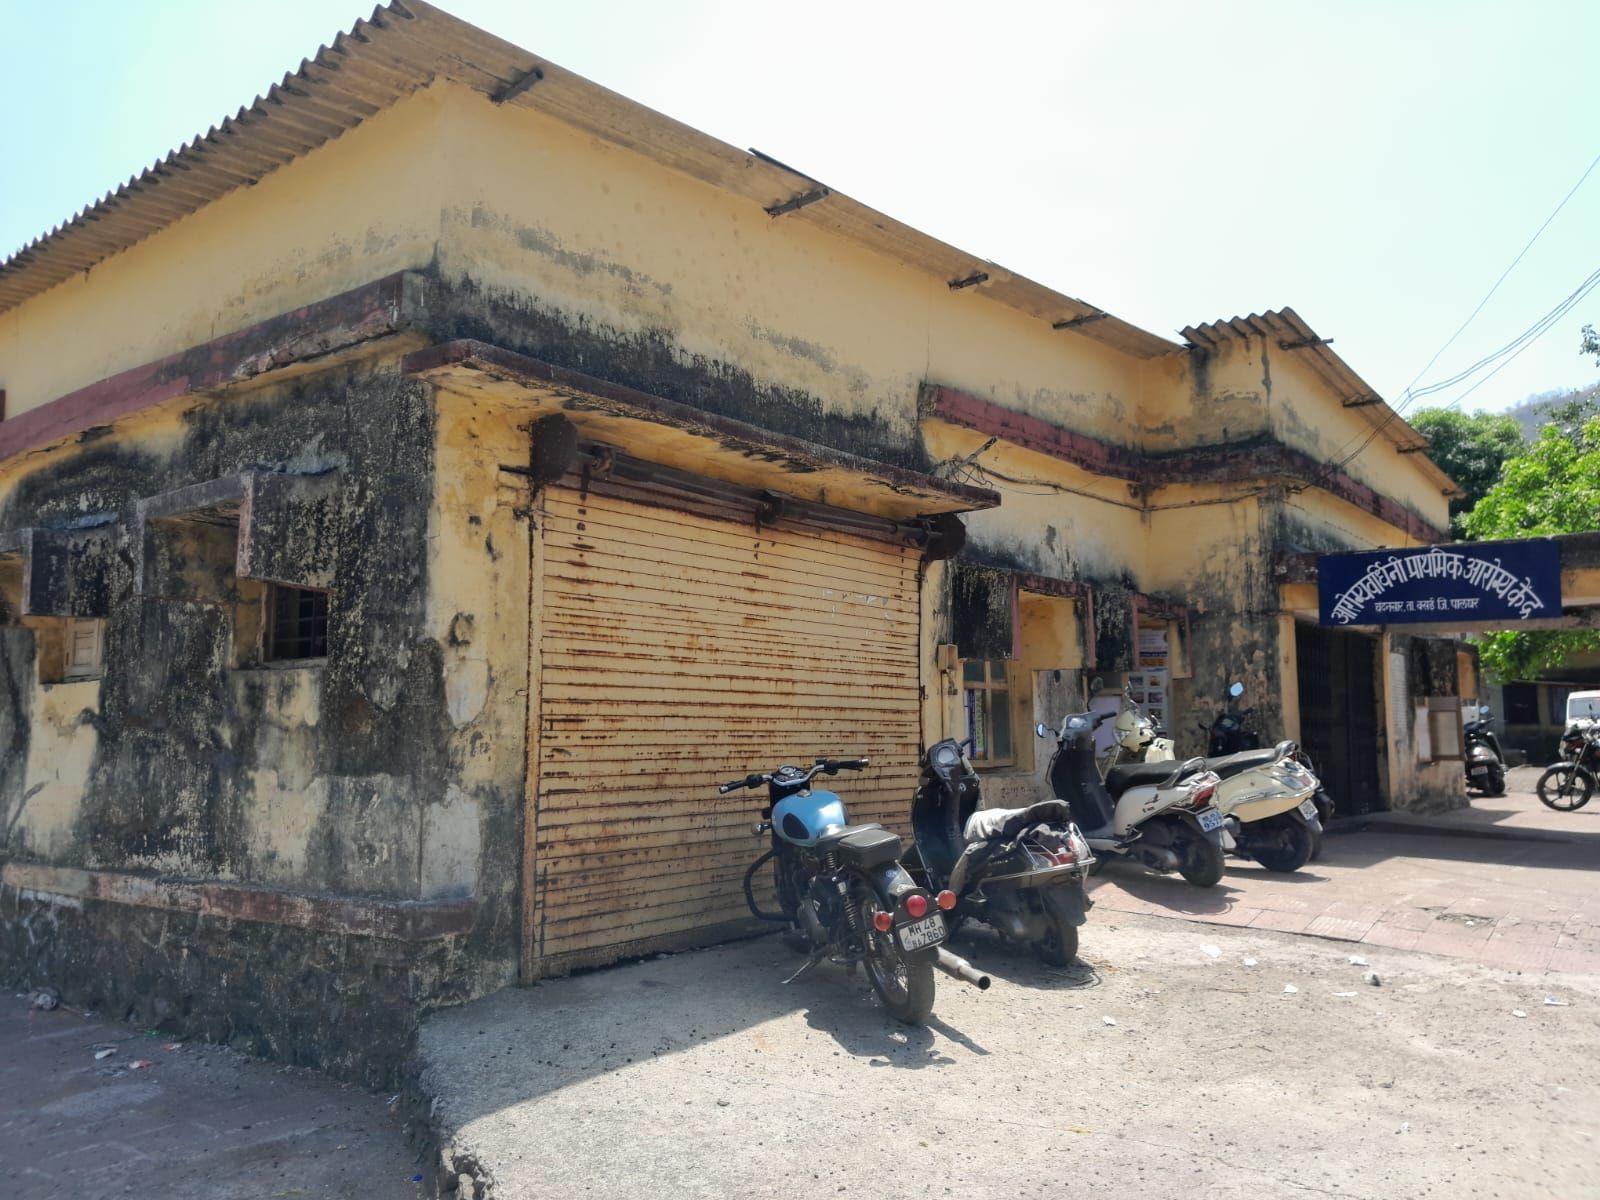
Zilla Parishad Urdu School, Virar (E)
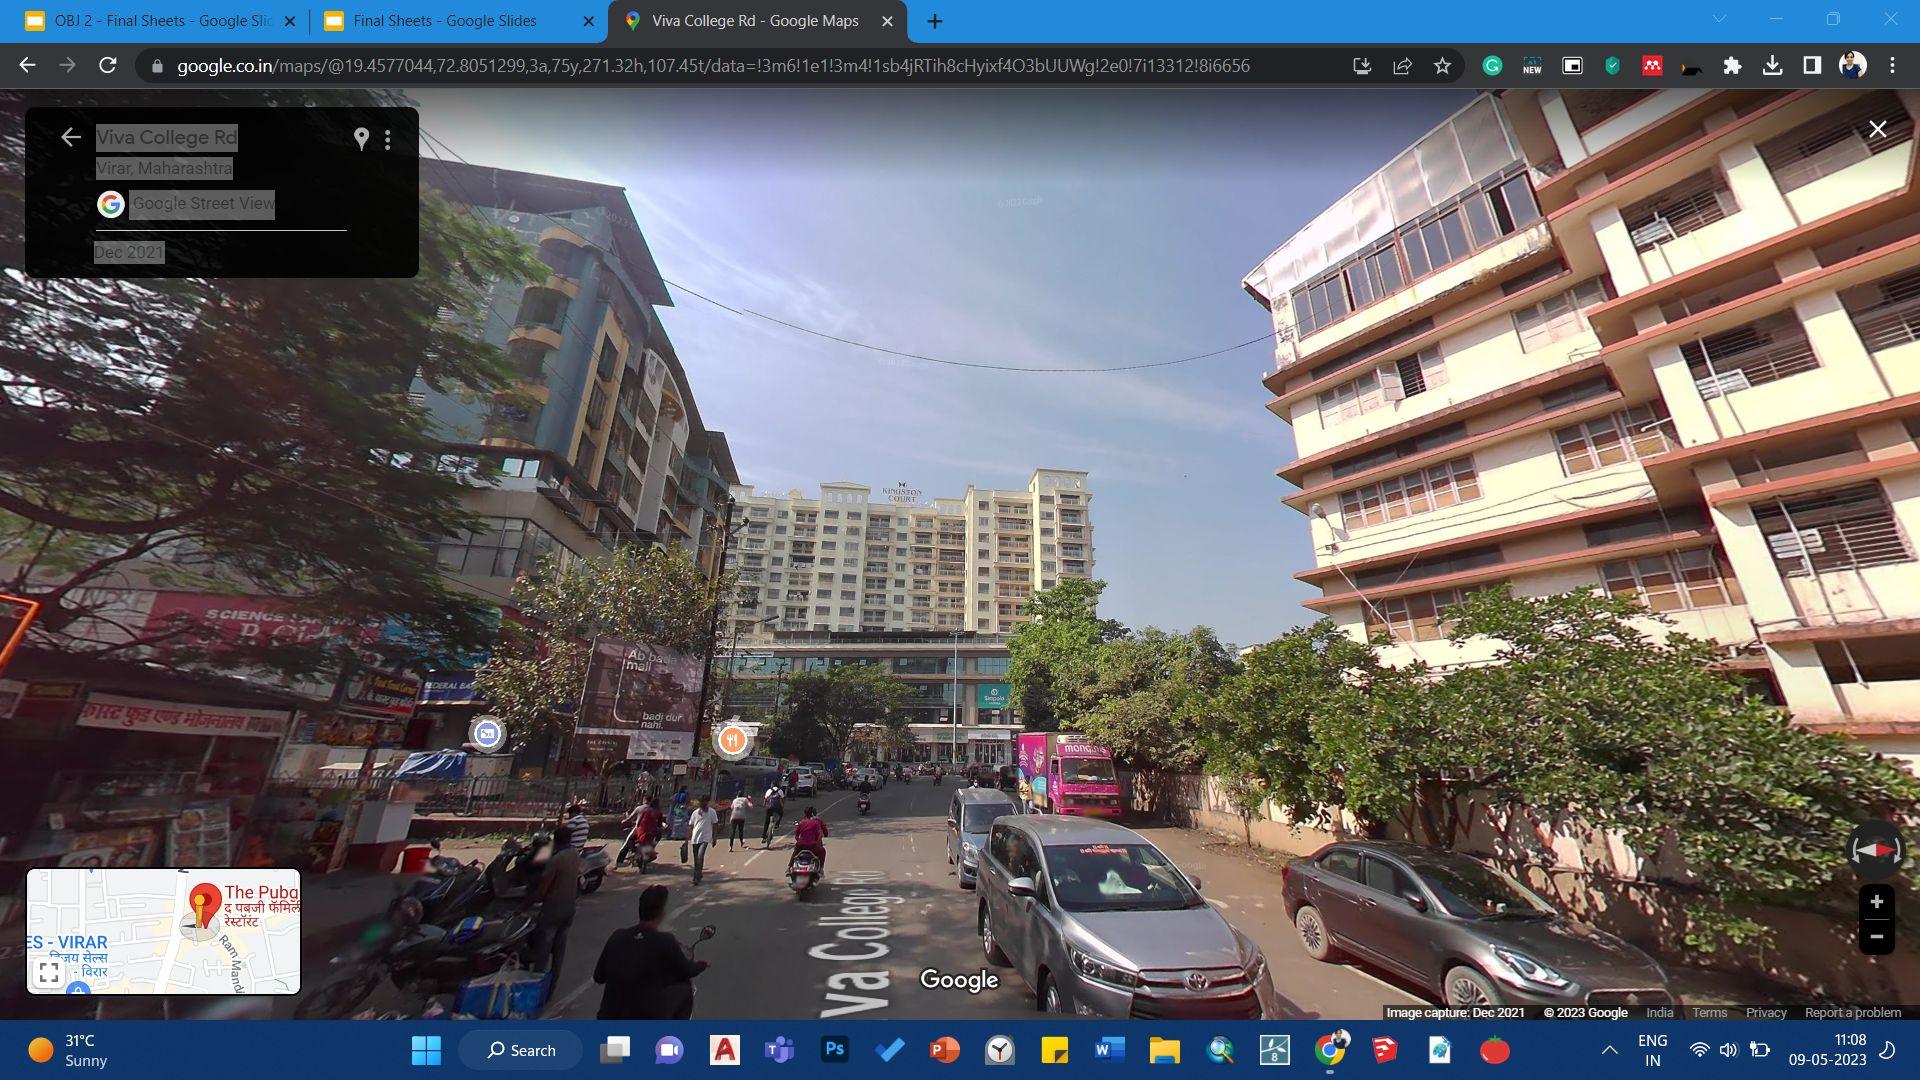
Source:Google Street View
Viva Degree College, Virar (W)
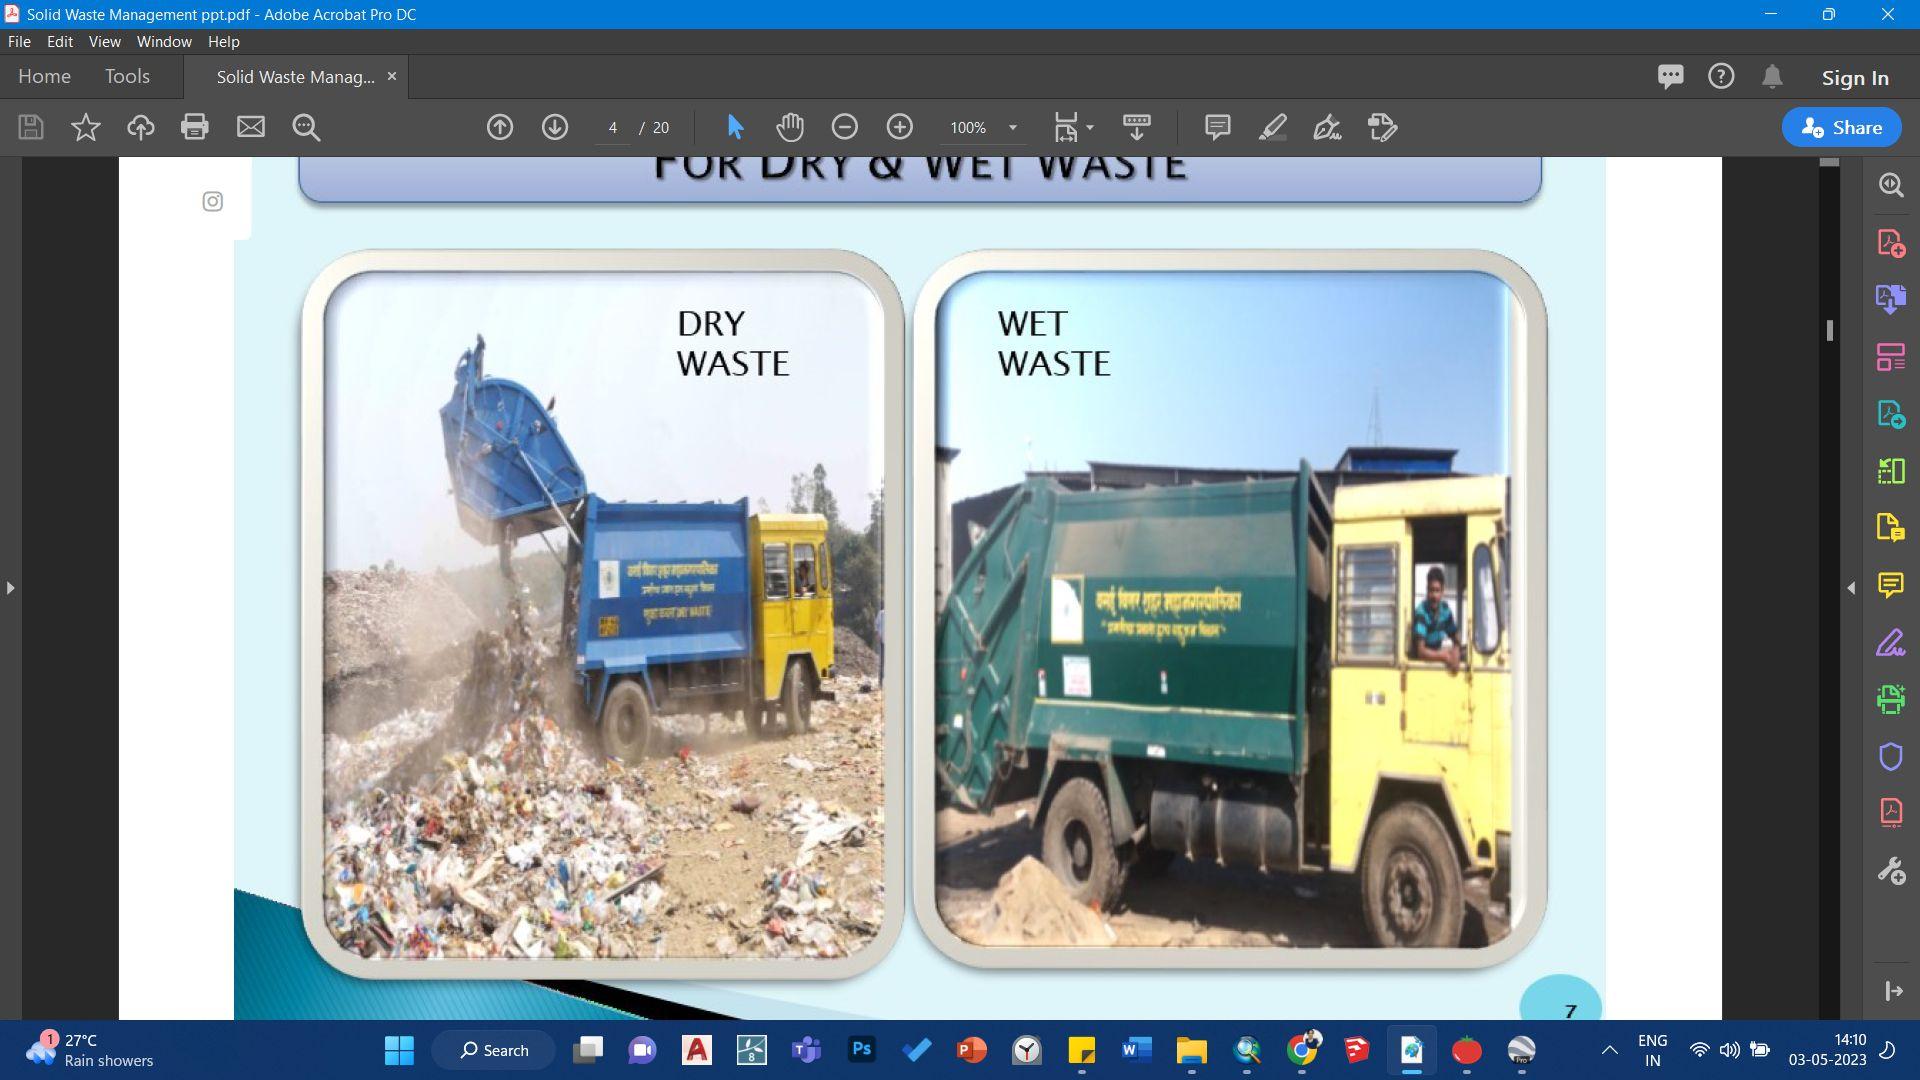
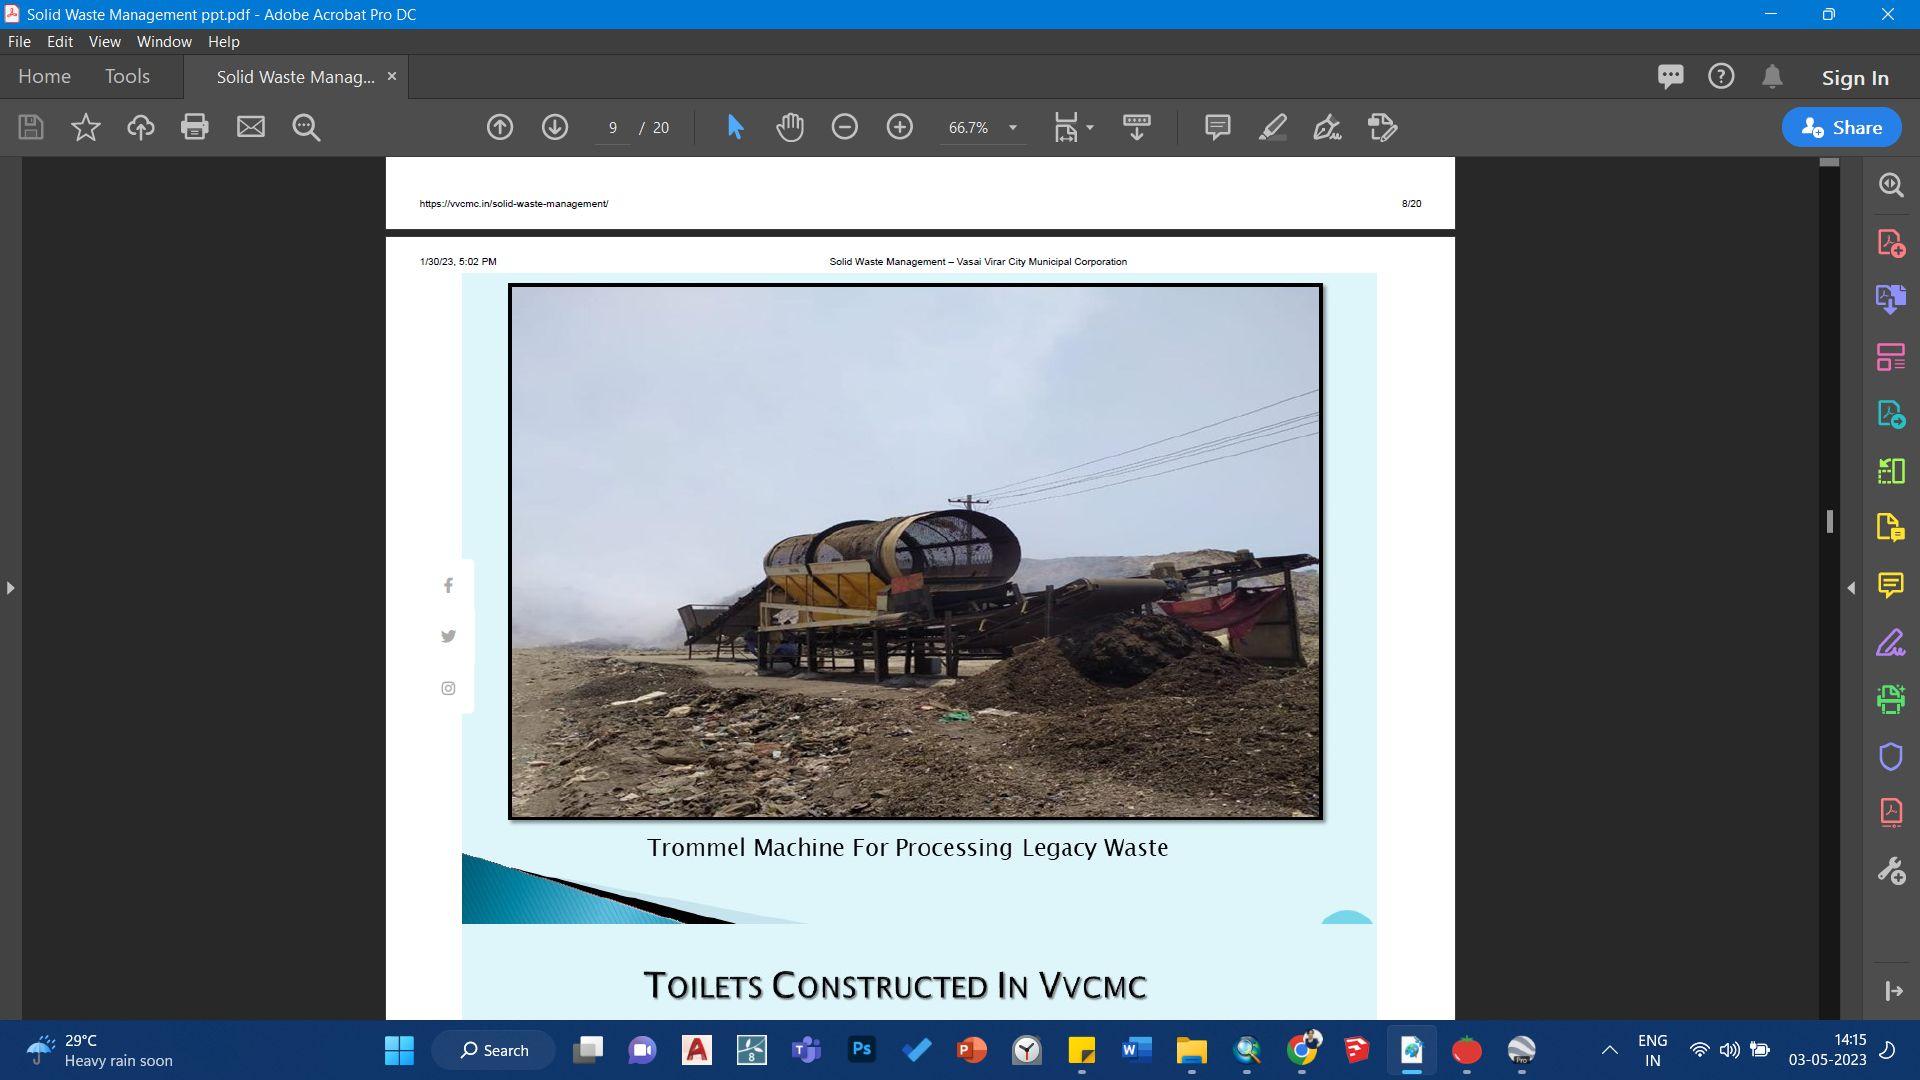
SOLID WASTE MANAGEMENT
Source:
Virar solid waste management has the necessary equipment for effective waste management. Efforts have been made to raise awareness about waste management. However, the issue of source segregation remains a challenge.
➔ Department oversees development plan implementation and compliance with regulations
➔ Provides technical support and advice to the Municipal Corporation on town planning matters
➔ Prepares funding proposals and acquires land
➔ Manages all aspects of implementation, including proposing modifications
Healthcare Department: Scope of Work
T
provide necessary medical services to the citizens of the Municipal Corporation, to implement the National Health Programme, to take measures to prevent epidemics, to create public awareness abouthealth.
➔ Enforces development control regulations, reviewing permits and ensuring compliance
➔ Provides guidance on unauthorized construction.
GOVERNANCE
Source: ITDepartment, VVMC
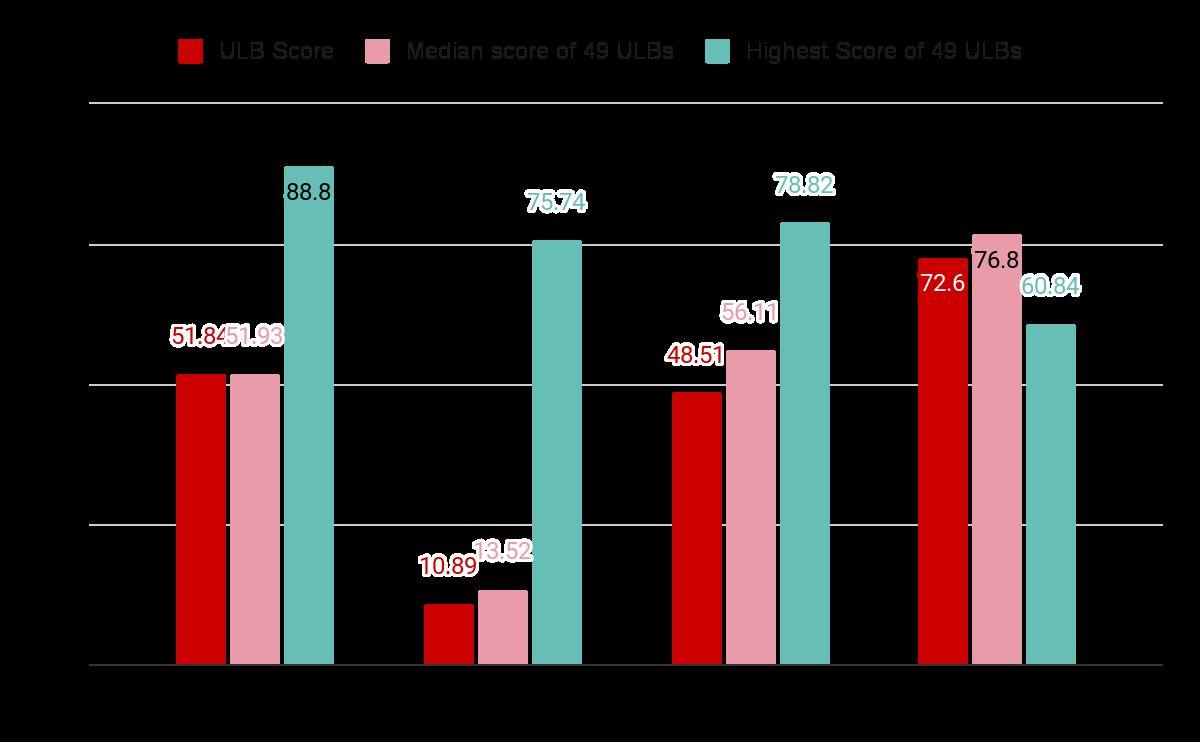
➔ Virardemonstratesamoderate performance across various indicators.
➔ The economic ability score is relativelylowcomparedtoboth themedianandhighestscores. This suggests that while there areareaswhereVirarperforms well, there is a need to focus on improving economic opportunities and enhancing the overall livability of the city to match the standards set by thetop-performingULBs.
● Recommends reservations for women in elected positions Many states have implemented a 33% reservation for women in seats/wards within ULBs.
● Suggests reservations for marginalized groups
● Delimitation of Wards: Emphasizes fair representation through ward demarcation
● State-Level Legislation:Allows states to enact laws for ULB governance and elections.
Source: Google form Survey
PROPOSALS: IMPLEMENTATION OF TRANSIT ORIENTED DEVELOPMENT
TOD integrates land use and transport planning and aims to develop planned sustainable urban growth centers, having walkable and livable communes with high density mixed land-use. Citizens have access to open green and public spaces and at the same time transit facilities are efficiently utilized.
Source: NationalTransit Oriented Development (TOD) Policy
Reasons for Implementing TOD in Virar
Aspect Issues TOD component as Solutions
Spatial Growth Rapid population growth and high land consumption rate Optimised DensitiesCompact Settlement
Insufficient land allocation for commercial activities. Mixed Land use
Lack of Employment opportunities.
Transport and Mobility Congested Railways Station NMT network
Parking Issues Managed Parking
Encroachment of Streets by Hawkers Informal Sector Integration
BENEFITS OF COMPACT SETTLEMENT
ECONOMICAL
- Increased Business Opportunities LocalEconomic Growth
- Reduced Transportation cost&Commuting time.
SOCIAL
- ImprovedAccess toServicesand Facilities
- IncreasedSense ofBelongingand Community Cohesion
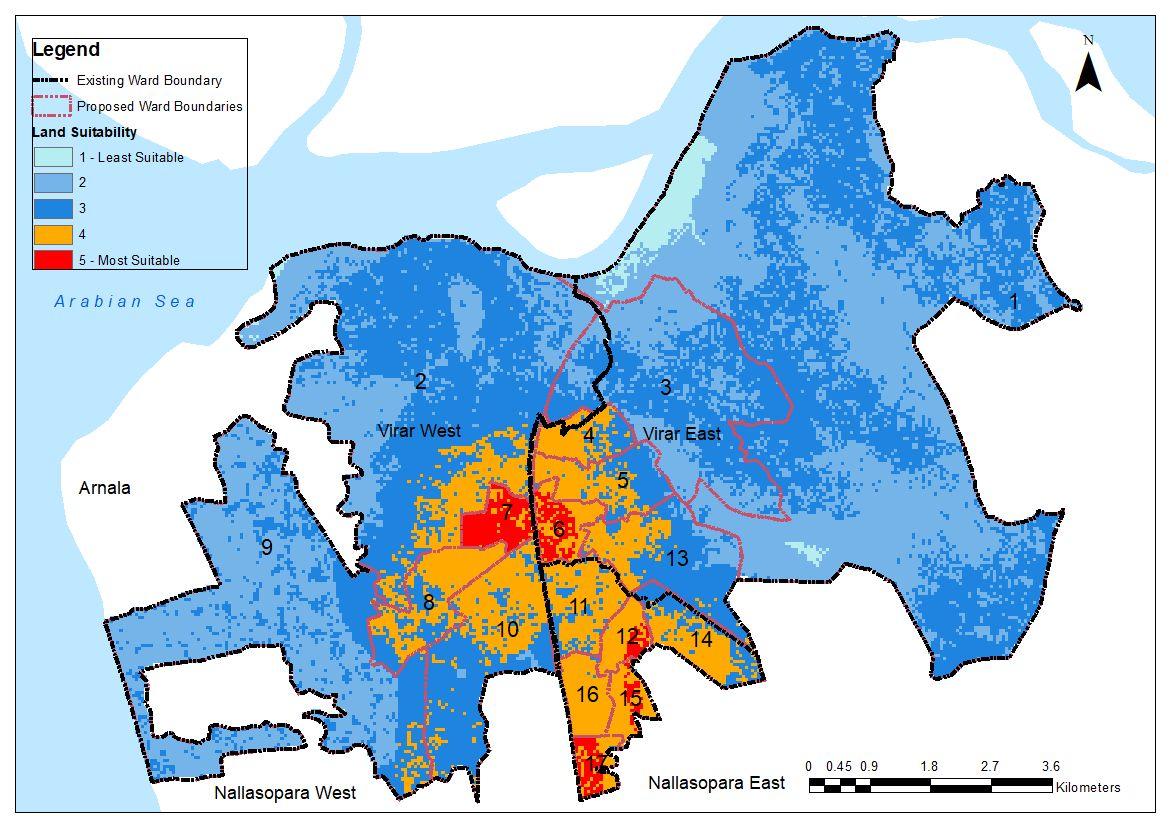
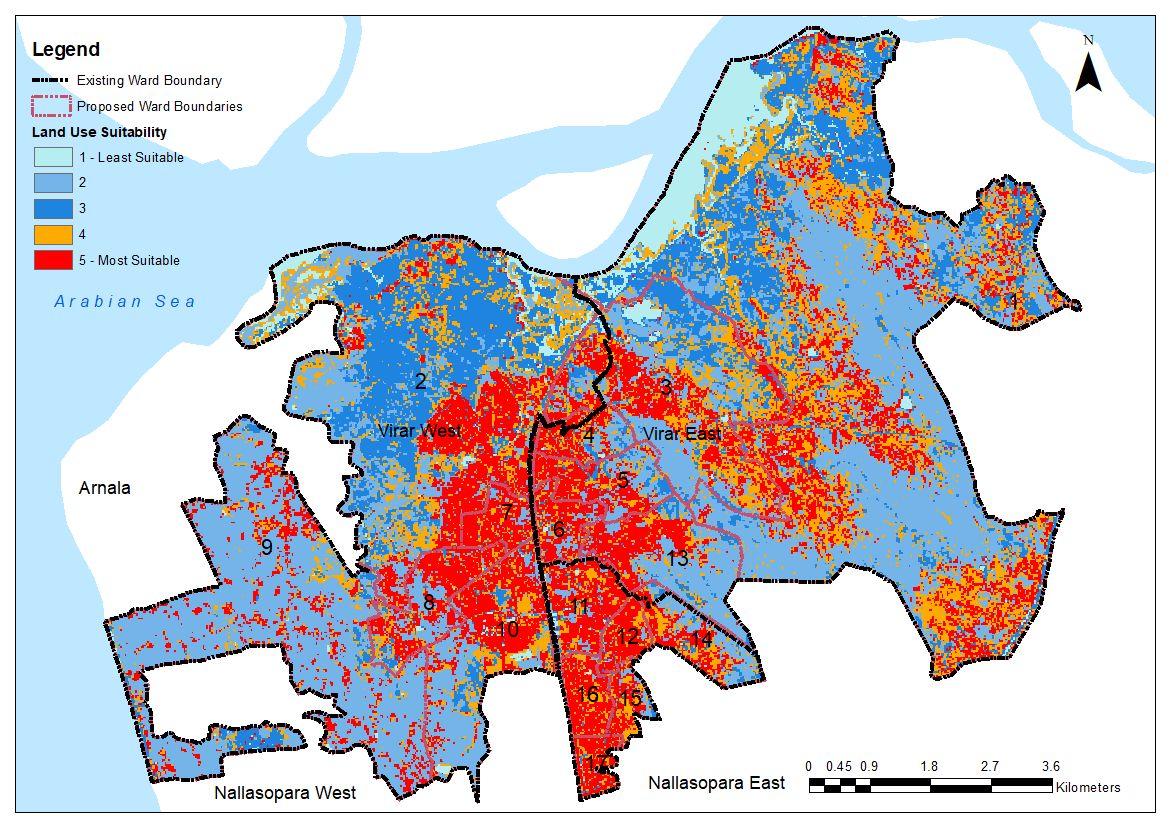
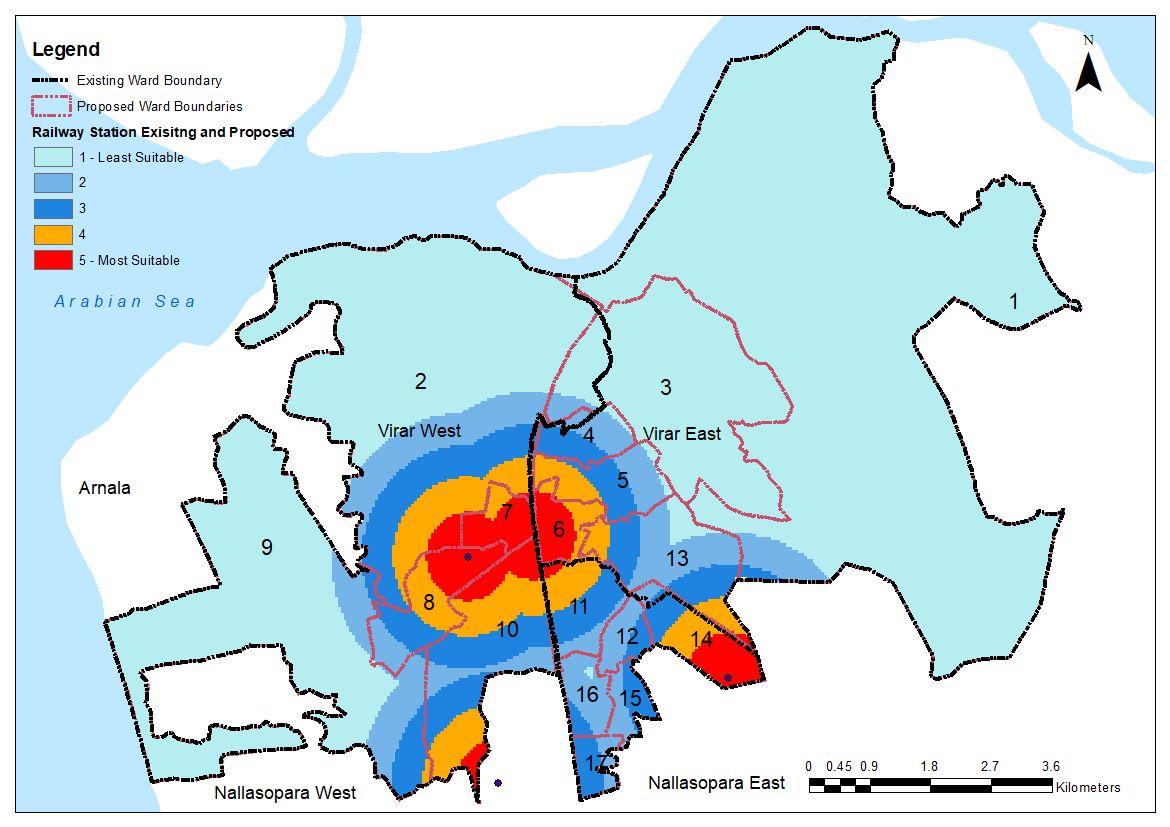
LAND SUITABILITYANALYSIS FOR COMPACT DEVELOPMENT
ENVIRONMENT
- EfficientUseof Resourcesand Infrastructure
- Conservationof LandandNatural Resources
Impacts of Urbanization on City's Sustainable DevelopmentACase of Virar City, Maharashtra
● Congested core city area near the railway station
● Lack of parking areas and emergence of private two-wheeler parking areas
● Underutilization of skywalks
● Inefficient public transportation with poorly designed bus routes
● Footpath encroachment by hawkers
● Good existing connectivity in the form of rail and road to MMR and Gujrat.
● Potential to improvise the Public Bus Network.
● Good potential for water front development for use as water transport. water sports.
PROPOSALSAT VIRAR RAILWAY STATION
Solutions and Recommendations
● Non-Motorised Zone Street
● No parking zone near Railway Station
● Scattered Multi-Level Private 2 and 4 Wheeler Slots.
● Integration of ICT for Booking Parking Slots
● Gradual Increase in Parking Prices- to encourage people to opt for Public Transportation
● Regular Monitoring and Evaluation.
● Engage Public and Private Stakeholders:(PPP)
● Integrated Transportation Planning:
➔ Enhanced safety and security measures
➔ Promoting community engagement
➔ Utilizing skywalk space for cultural events
➔ Regular maintenance
➔ Signage and information boards highlighting Virar's history
➔ Public art and beautification
accessibility
● Hawker Management and Regulation:
Enforce regulations to prevent encroachment by hawkers near the railway station area and designating specific areas for street vendors
Impacts of Urbanization on City's Sustainable DevelopmentACase of Virar City, Maharashtra
3. Open Public Spaces
➔ Inadequate allocation of land for public openspaces.
➔ Presence of illegal settlements on public openspaces.
ISSUES , POTENTIALS & RECOMMENDATIONS
➔ Availability of land for proposing organized openpublicspaces.
➔ Good accessibility to the proposedpublicspaces.
➔ Budget allocation for the conservation and beautification of lakes in Virar.
● IncreaseAllocation of Land for Public Open Spaces
● Utilize the available land to propose organized open public spaces that cater to various recreational activities and communityneeds.
● Involve urban designers and landscape architects to create well-designed and functional spaces that enhance the overallqualityoflifeinthearea.
● Address Illegal Settlements on Open Public Spaces:
● Take strict measures to prevent illegal settlements on open public spaces, including regular monitoring and enforcementofrelevantlawsandregulations.
● Ensure Effective Budget Utilization for Lake Conservation and Beautification.
Engage local communities and environmental experts in the process to ensure the conservation efforts align with the uniquecharacteristicsofthelakesandtheirsurroundings.
4. Solid Waste Management
➔ Poor implementation of the project and inadequate efforts towards source segregation.
➔ Inefficient collection of solid waste management (SWM) charges.
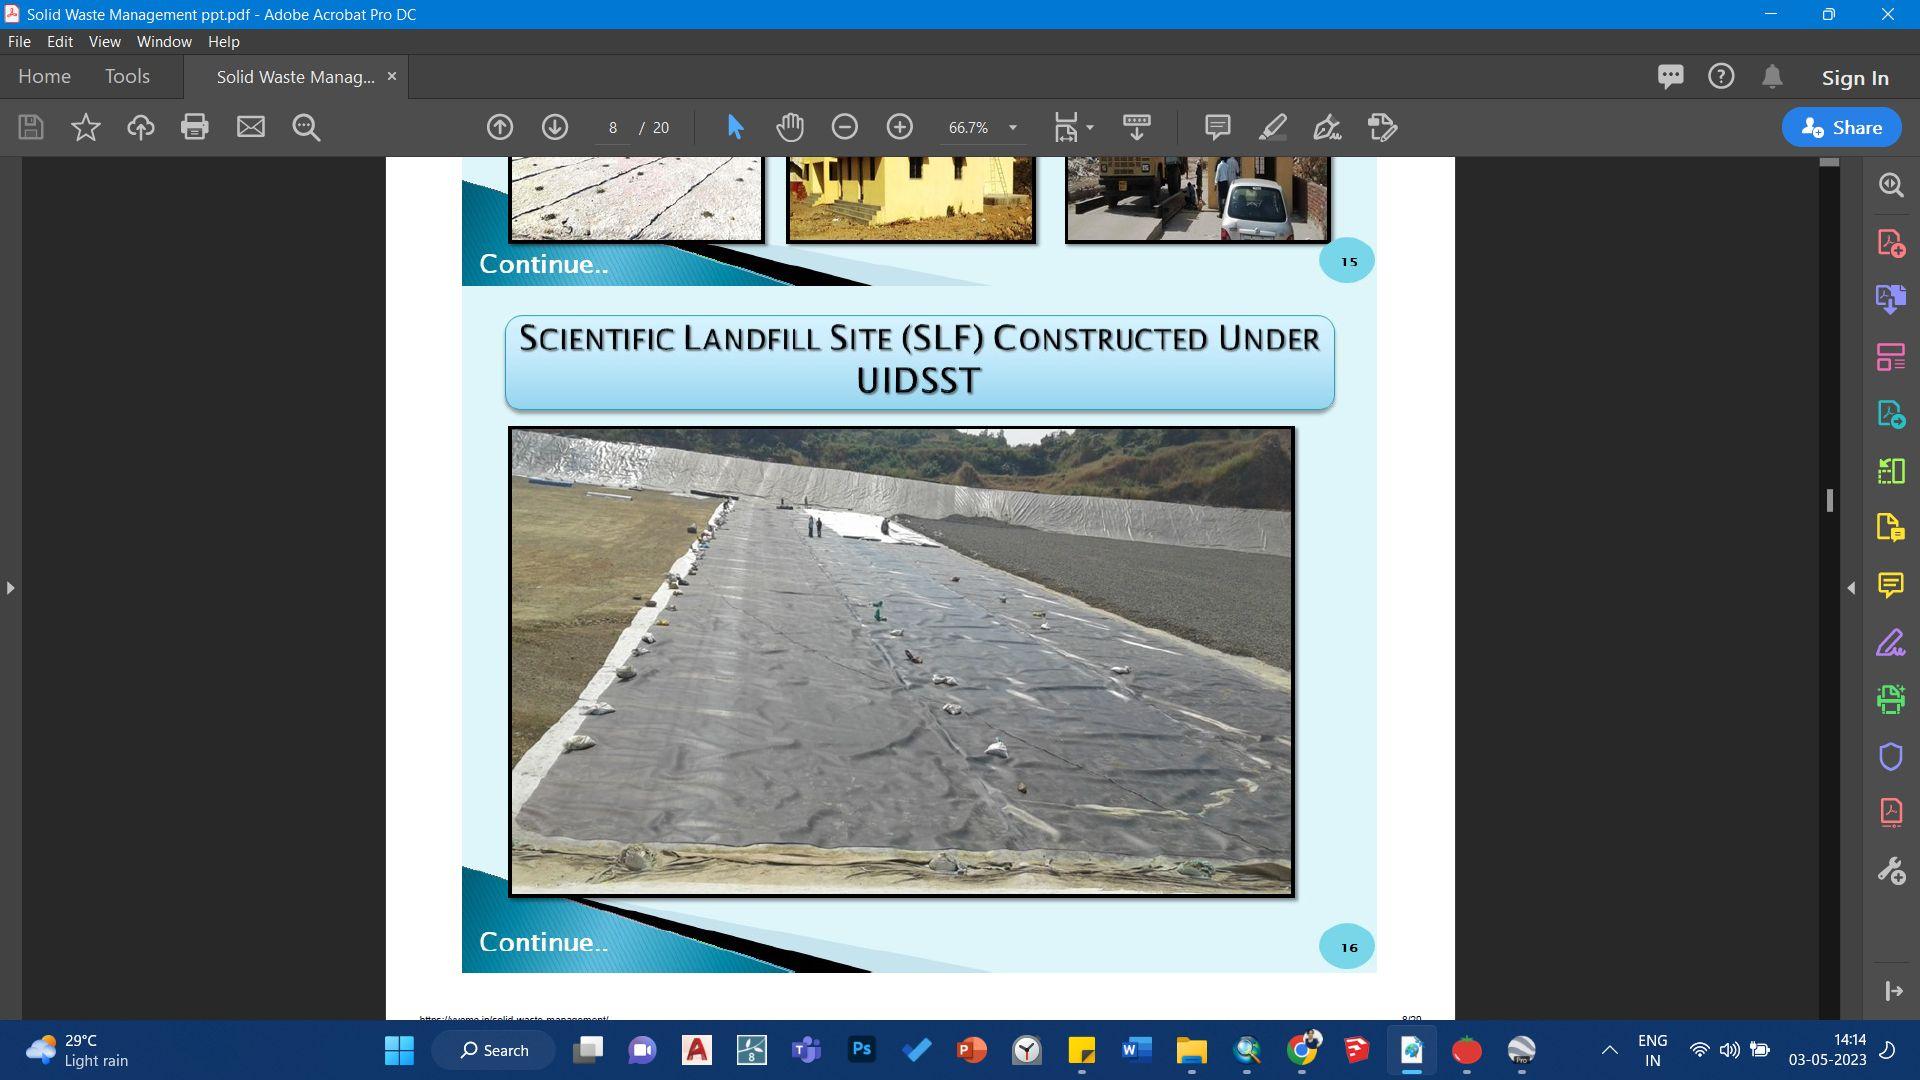
➔ Limited extent of scientifically disposing municipal solidwaste.
➔ Inefficiency in recovering municipal solidwaste.
➔ Availability of funds and equipment for managing municipalsolidwasteand sanitation.
➔ A higher percentage of the literate population to understand the importance of municipal wastemanagement.
➔ Integration of ICT (Information and Communication Technology)toeffectively manage waste and addressgrievances.
● Improve Project Implementation and Source Segregation Efforts:
- Implement water metering for all connections to accurately measure water usage, improve billing accuracy, and promoteresponsiblewaterconsumptionandconservation.