South Bay Subregional Profile


Exhibit 1. Comparison of demographic and labor market data, Los Angeles County and its subregions

To support California Community Colleges with collaborative efforts to update and enhance career education (CE) program offerings, the Los Angeles Center of Excellence (COE) has created six subregional profiles analyzing demographic, labor market, and postsecondary supply data.
Each subregional profile was created to:
• Identify labor market opportunities unique to each subregion
• Facilitate alignment between labor market needs and CE training
• Inform strategic planning efforts and investments by local community colleges
• Support the annual updating process of the Strong Workforce Program (SWP) Regional Plan
LOS ANGELES COUNTY SUBREGIONS
• CENTRAL LOS ANGELES
• GATEWAY CITIES
• SAN FERNANDO VALLEY
• SAN GABRIEL VALLEY
• SOUTH BAY
• WESTSIDE CITIES
SWP is an initiative designed to expand CE programs offered by the California Community Colleges to supply a skilled workforce to California’s employers. The Los Angeles Regional Consortium is charged with coordinating the planning and implementation of CE programs among the 19 community colleges in Los Angeles County. This project was supported by funding through the Los Angeles Regional Consortium and powered by the California Community Colleges Chancellor's Office.
This profile focuses on the South Bay subregion, which encompasses two community colleges: El Camino College and Los Angeles Harbor College (Exhibit 2).


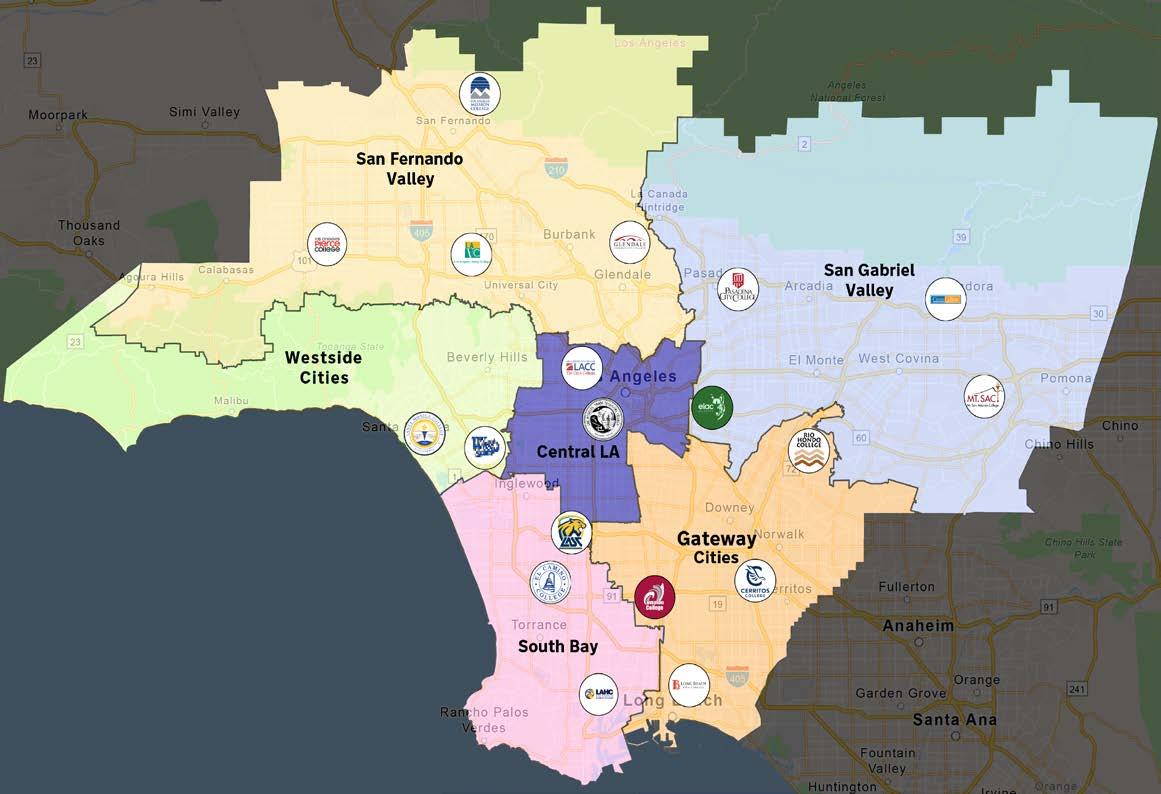
Summery of Map: The map of the Community Colleges of the Los Angeles Basin is a visual representation that highlights the educational network of community colleges in the greater Los Angeles area. This map serves as a valuable resource for students, educators, and the community to easily identify and locate the various community colleges situated throughout the region. The map offers a comprehensive overview of the educational landscape, promoting informed decisions for students and contributing to the growth and accessibility of higher education throughout the diverse neighborhoods of Los Angeles.
Map creators: Jason Polanco & The Los Angeles Region Center of Excellence for Labor Market Research

As one of the largest and most diverse counties in the nation, Los Angeles County has an enormous impact on key population and economic indicators in the state. Similarly, its subregions, which encompass 88 cities, are varied and contribute in myriad ways to the region’s overall economic vitality and labor market. To put these numbers into context, make them more digestible, and to better understand the factors defining each of the six subregions in the Los Angeles Basin, this report utilizes a number of data sources that shed light on important labor market needs and the role of community colleges in training a local workforce equipped to meet those needs. Expanding upon initial work conducted by the Los Angeles County Economic Development Corporation that divided Los Angeles into six distinct geographic regions, this report is broken into four sections. The methodology for each section, along with associated data sources, is described below:
This section describes the population of the subregion. The data is largely sourced from Lightcast’s 2023.4 dataset at the county level, as well as by ZIP code (Appendix B). ZIP-code-level data has been aggregated to represent the entire subregion. Educational attainment data represents the population of residents age 25 and older. Lightcast utilizes data collected by the U.S. Census Bureau through the American Community Survey and data from the California Economic Development Department. The race/ethnicity terms in this section, including white, Hispanic, and Black, adhere to the terms and definitions the Census Bureau uses in collecting its data. For definitions, please refer to: https://www.census.gov/topics/population/race/about.html.
This section describes the labor market conditions of the subregion, including data on occupations, industries, and job postings, sourced from Lightcast’s 2023.4 dataset. Sub-county job posting data is only available at the city level, so the cities listed in Appendix B were queried. Job ads posted during all 12 months of 2023 were analyzed.
This section describes the community colleges in the subregion in terms of student counts, awards (certificates and degrees), student demographics, and some career education program outcomes. The data contained in this section is sourced from the California Community Colleges Chancellor’s Office Management Information Systems Data Mart and the California Community Colleges LaunchBoard. Student counts are derived from the 2022-23 academic year. Awards represent a three-year average of the 2020-21 to 2022-23 academic years. Median annual earnings after exit, attained a living wage, and median change in earnings are from the 2020-21 academic year.
This report uses race and ethnicity data from LaunchBoard collected by the California Community Colleges. The terms in this section, including white, Hispanic, and Black, adhere to the terms and definitions the California Community Colleges use in collecting its data. For definitions, please refer to: https://webdata.cccco.edu/ded/std/std10.pdf
This section describes the career education student employment outcomes for each college in the subregion compared to the average across all 19 colleges in the LA County basin. The data come from the California Community Colleges LaunchBoard.
Data Sources: Lightcast (formerly Emsi); Census Bureau’s American Community Survey; Bureau of Labor Statistics (BLS); California Employment Development Department, Labor Market Information Division, OES; California Community Colleges Chancellor’s Office Management Information Systems (MIS).

Understanding the composition of the local population and how it’s projected to change can help community colleges in supporting the needs of the subregional and regional workforce.
Changing demographics can impact the demand for educational services. Los Angeles County’s population overall is an aging population, meaning there exists a larger proportion of adults over the age of 55 than young children, teens, and residents in their 20s. At the subregional level, this trend may affect student enrollment numbers from K12 through postsecondary education.
• Population estimates and projections
• Population concentrations
• Population demographics, including age, educational attainment, and race/ethnicity IN THIS SECTION
For this reason, the Los Angeles COE has included data and findings on whether the subregional population is growing or contracting, as well as findings on population concentration since more demand for education programs may exist in more densely populated areas.
Additionally, examining educational attainment among Hispanic and non-Hispanic residents can illuminate equity gaps, such as whether a larger share of a certain demographic has completed a bachelor’s degree compared to high school.
Finally, race/ethnicity analysis in the overall subregional population can be compared with the race/ethnicity composition of individual community colleges or a group of colleges in a subregion. This data can be used to determine if certain race/ethnicity groups are under- or overrepresented at a college or group of colleges.
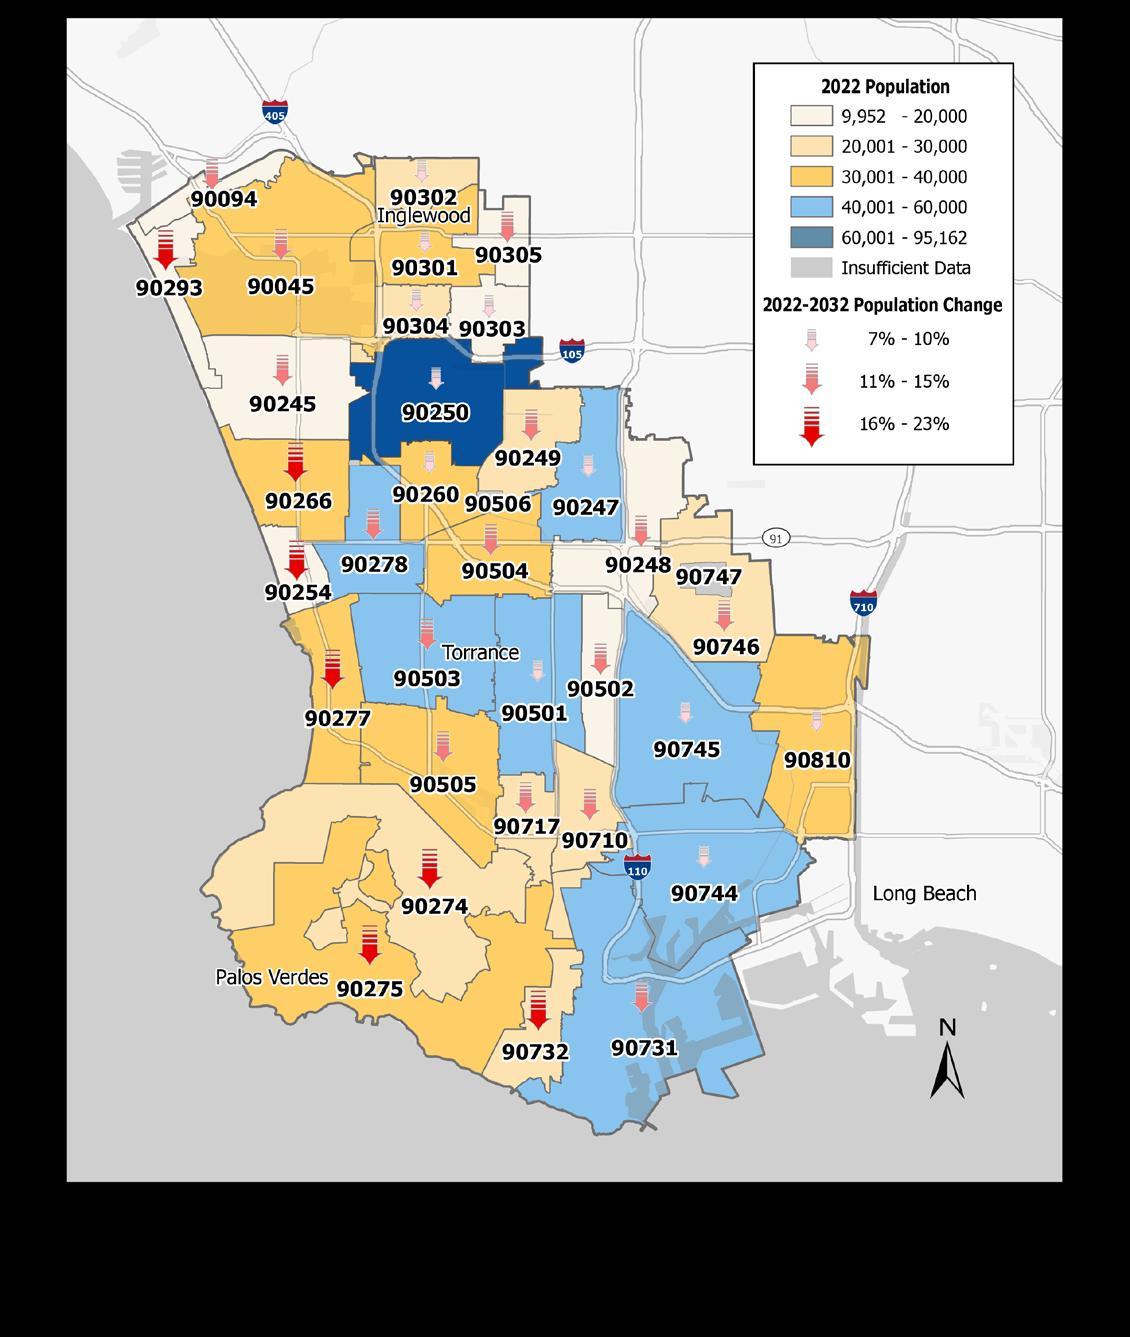
In 2022, the South Bay subregion had a population of more than 1.1 million residents (Exhibit 3). Over the next 10 years, the population is expected to decrease by more than 133,400 residents, or 12%, mirroring a broader trend across Los Angeles County.
Exhibit 3. Population estimates and projections in the subregion, 2022-2032
An analysis of ZIP codes shows Hawthorne has the highest concentration of residents in the subregion. Other ZIP codes with a dense population include areas of Carson, San Pedro, Torrance, and Wilmington. The lowest concentration of residents occurs in areas including El Segundo, Gardena, Hermosa Beach, Inglewood, and Playa Vista. All ZIP codes in the subregion are projected to experience a declining population over the next 10 years. (See Appendix A for more details.)
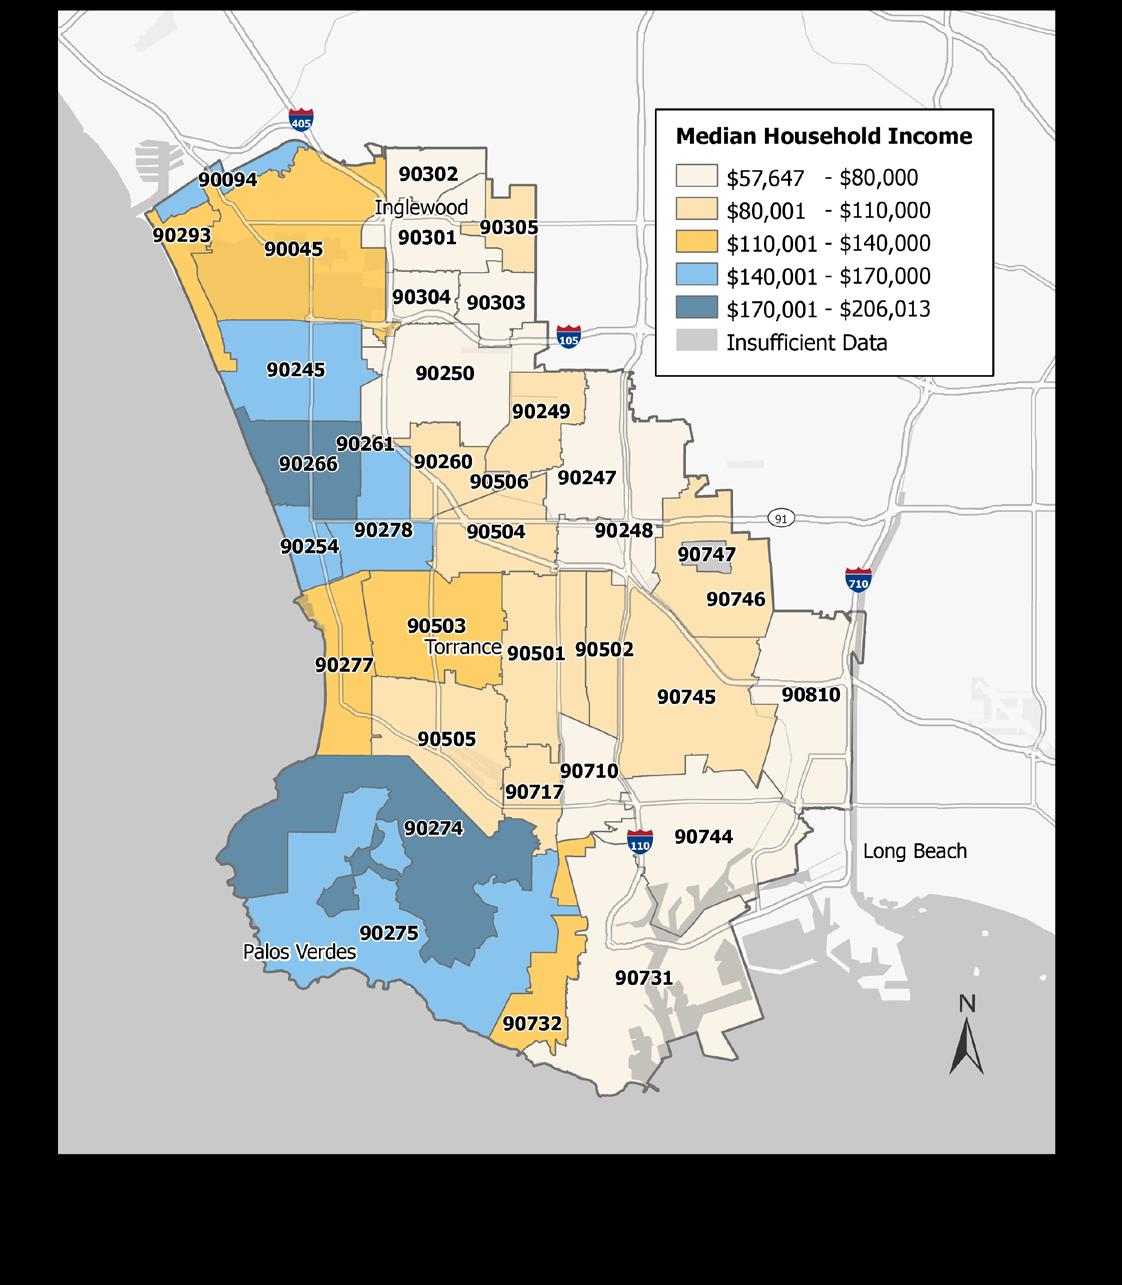
Household income is highest in ZIP codes in Manhattan Beach and Palos Verdes Peninsula. ZIP codes with the lowest household incomes are located in Gardena, Harbor City, Hawthorne, Inglewood, San Pedro, and Wilmington. (See Appendix A for more details.)
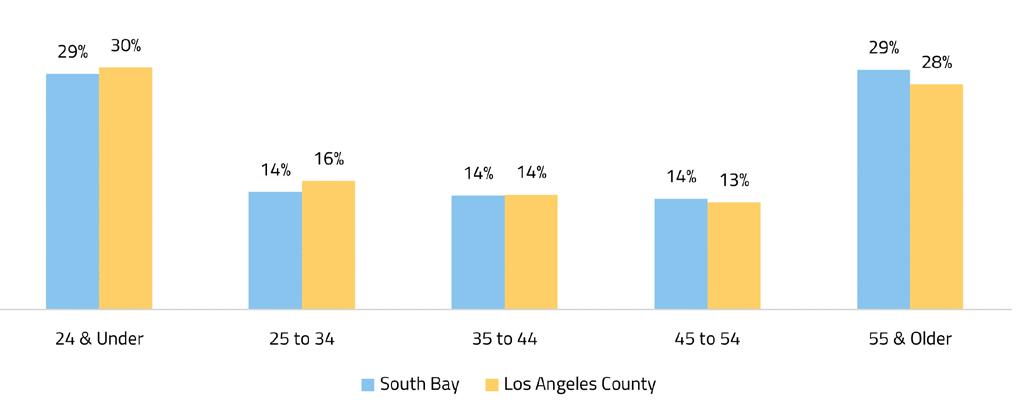
In 2022, 43% of the subregion’s population was under 35 years old (Exhibit 4). In comparison, 29%, of the subregion’s population is 55 or older, a slightly greater percentage than the county as a whole.
Exhibit 4. Age cohorts comprising the subregion’s population, 2022
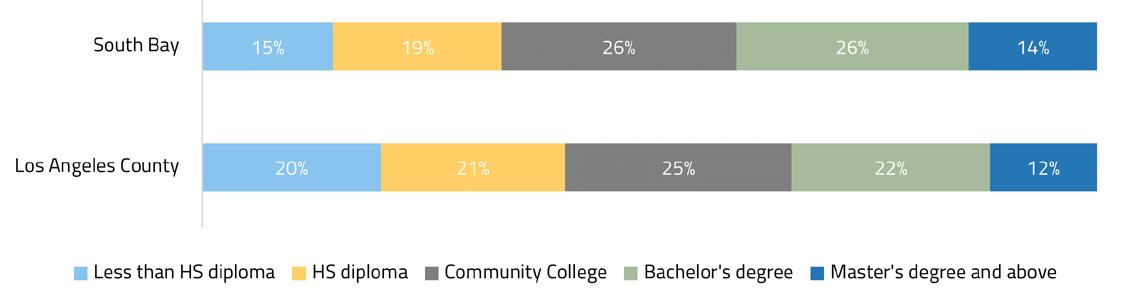
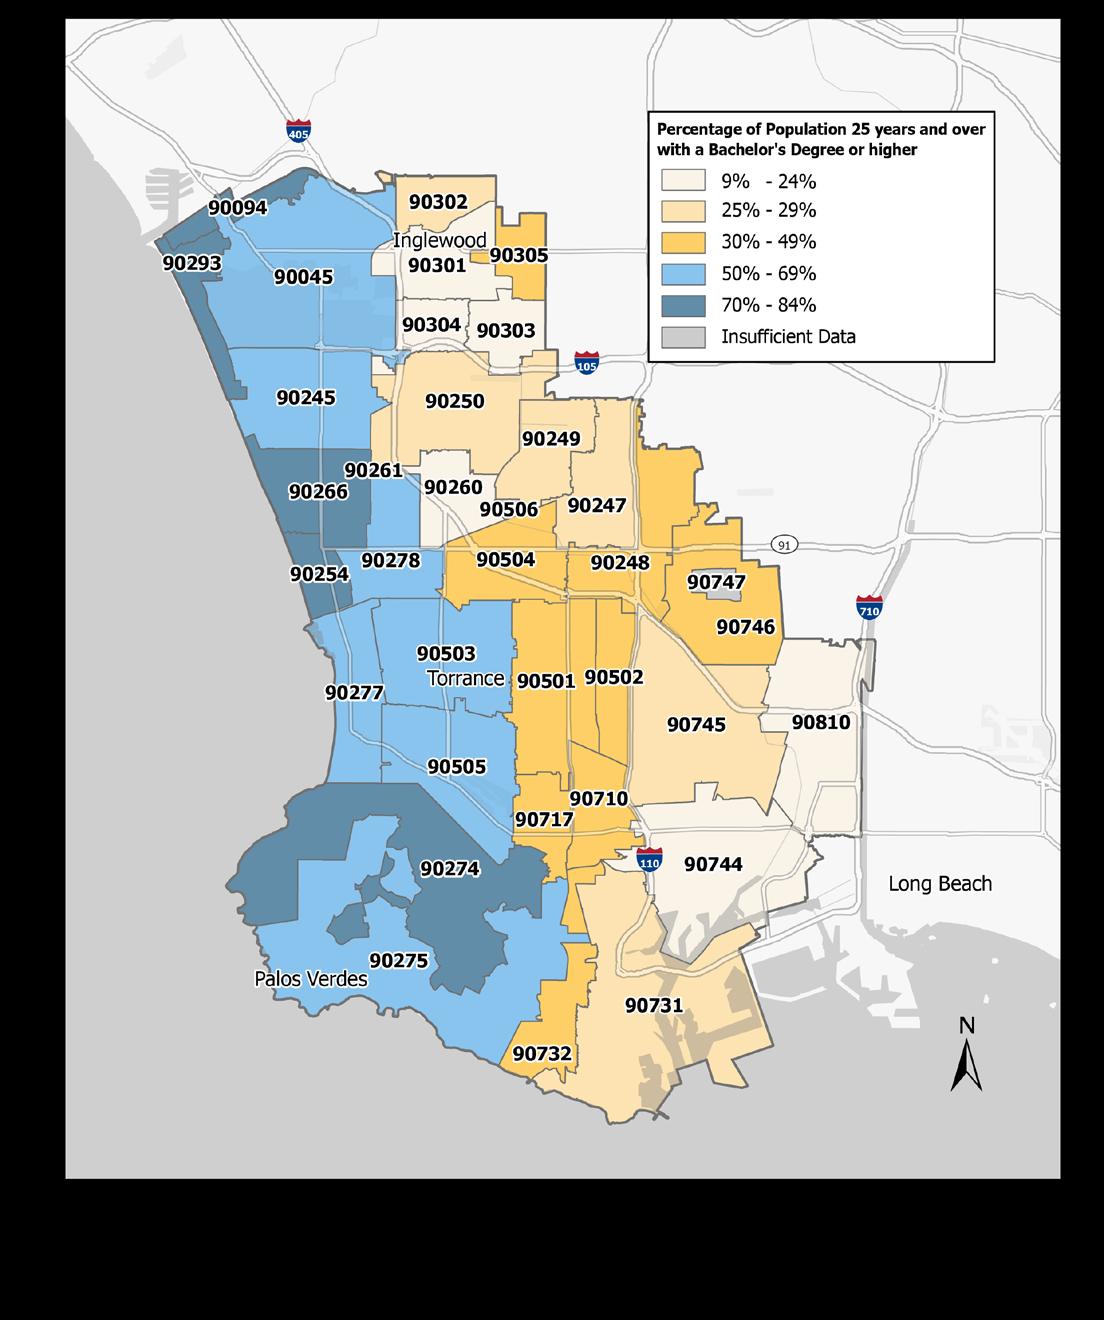
In the subregion, 40% of the population over the age of 25 has completed a bachelor’s degree or higher, 26% has completed community college, 19% has completed high school, and 15% has less than a high school diploma (Exhibit 5). ZIP codes with the greatest concentration of residents who have completed a bachelor’s degree or higher are located in Hermosa Beach, Manhattan Beach, Palos Verdes Peninsula, Playa del Rey, and Playa Vista. Zip codes with the lowest concentration include areas in Inglewood, Lawndale, Long Beach, and Wilmington. (See Appendix A for more details.)
Exhibit 5. Educational attainment in the subregion and region, 2022
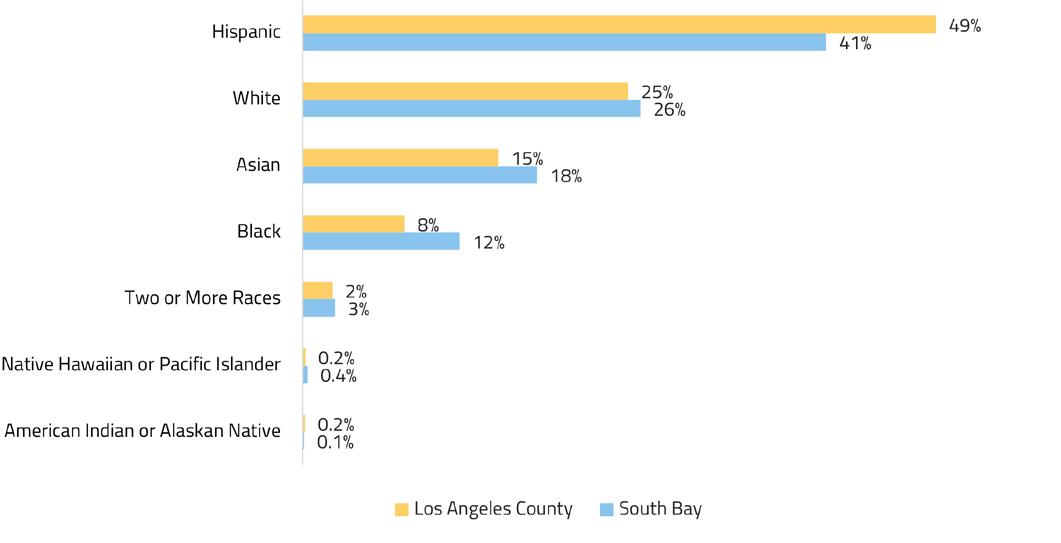
In 2022, 41% of the subregion’s population identified as Hispanic, followed by 26% white, and 18% Asian (Exhibit 6). Compared to the county overall, the subregion has a higher percentage of white, Black, and Asian residents and a lower percentage of Hispanic residents.
Exhibit 6. Race/ethnicity of the subregional population, 2022
Breaking the subregion’s educational attainment down by race/ethnicity reveals that at 33%, Hispanic residents have the largest share of individuals with less than a high school diploma (Exhibit 7). Conversely, 60% of Asian residents and 58% of white residents have a bachelor’s degree or higher level of education.
Exhibit 7. Educational attainment of adults 25 years and older by race/ethnicity in the subregion, 2022

This section can be applied to discussions about cross-industry collaborations, occupational employment opportunities for students, fine tuning partnerships between educators and employers, and exploring new or overlooked areas for training and education programs.
Employment size and concentration have been examined, as well as the subregion’s largest industries. Additionally, understanding which occupations are in demand now, and in the future, and what they pay, is critical for community college planning, career pathway development, and targeted employer partnerships.
• Employment size and concentration
• Top industries
• Occupations that are in demand and well paid
• Job posting data IN THIS SECTION
The Los Angeles COE has identified middle-skill occupations, jobs typically requiring education or training beyond a high school diploma but less than a bachelor’s degree, that offer promising career opportunities to students in the subregion. These occupations fall within the sectors designated by the California Community Colleges Chancellor’s Office that are critical to the economic vitality of the county.
Further illuminating the nuances within a subregion’s labor market, job posting data can indicate employer hiring preferences for specific jobs and skill sets. However, although this data can offer valuable insights into evolving employer needs, it should not be considered a direct measure of employer demand. Job posting totals may be over- or under-inflated for a variety of reasons, such as an employer posting more than one job ad for the same position, using one job posting for multiple openings or for year-round recruitment, or including misleading ads that do not represent actual available positions.
Since employer hiring needs can vary by subregion, job posting analysis can be useful for highlighting unique local employment trends. Occupational titles, employers, skills, and certifications commonly occuring in job postings specific to the subregion have been identified.
Between 2022 and 2032, the number of jobs in the subregion is projected to increase from nearly 686,500 to nearly 755,500, an increase of more than 69,000 jobs or 10.1%. Comparatively, Los Angeles County and California are projected to grow by more than 508,600 jobs (9.8%) and nearly 2.7 million jobs (13.0%), respectively (Exhibit 8).
Exhibit 8. Number of jobs and projected percentage change, 2022-2032
The greatest concentration of jobs are shown in the vicinity of Los Angeles International Airport (LAX) and El Segundo. ZIP codes with the lowest concentration of jobs are in Inglewood, Lomita, Playa del Rey, Playa Vista, and the area around California State University, Dominguez Hills. Every ZIP code in the subregion is projected to undergo job growth in the next 10 years. (See Appendix A for more details.)
In 2022, there were more than 5.2 million jobs in Los Angeles County, with nearly 686,500, or approximately 13% of jobs in the subregion. Exhibit 9 shows the industries projected to add the most jobs over the next 10 years.
Exhibit 9. Industry sectors projected to add the greatest number of jobs in the subregion, 2022-2032
The composition of industry employment in the subregion differs from Los Angeles County in several ways. The subregion has a larger share of jobs than Los Angeles County in the following industry sectors (Exhibit 10):
• Transportation and warehousing
• Manufacturing
• Accommodation and food services
• Retail trade
• Administration and support and waste management and remediation services
Exhibit 10. Industry sector employment in the subregion and Los Angeles County, 20221
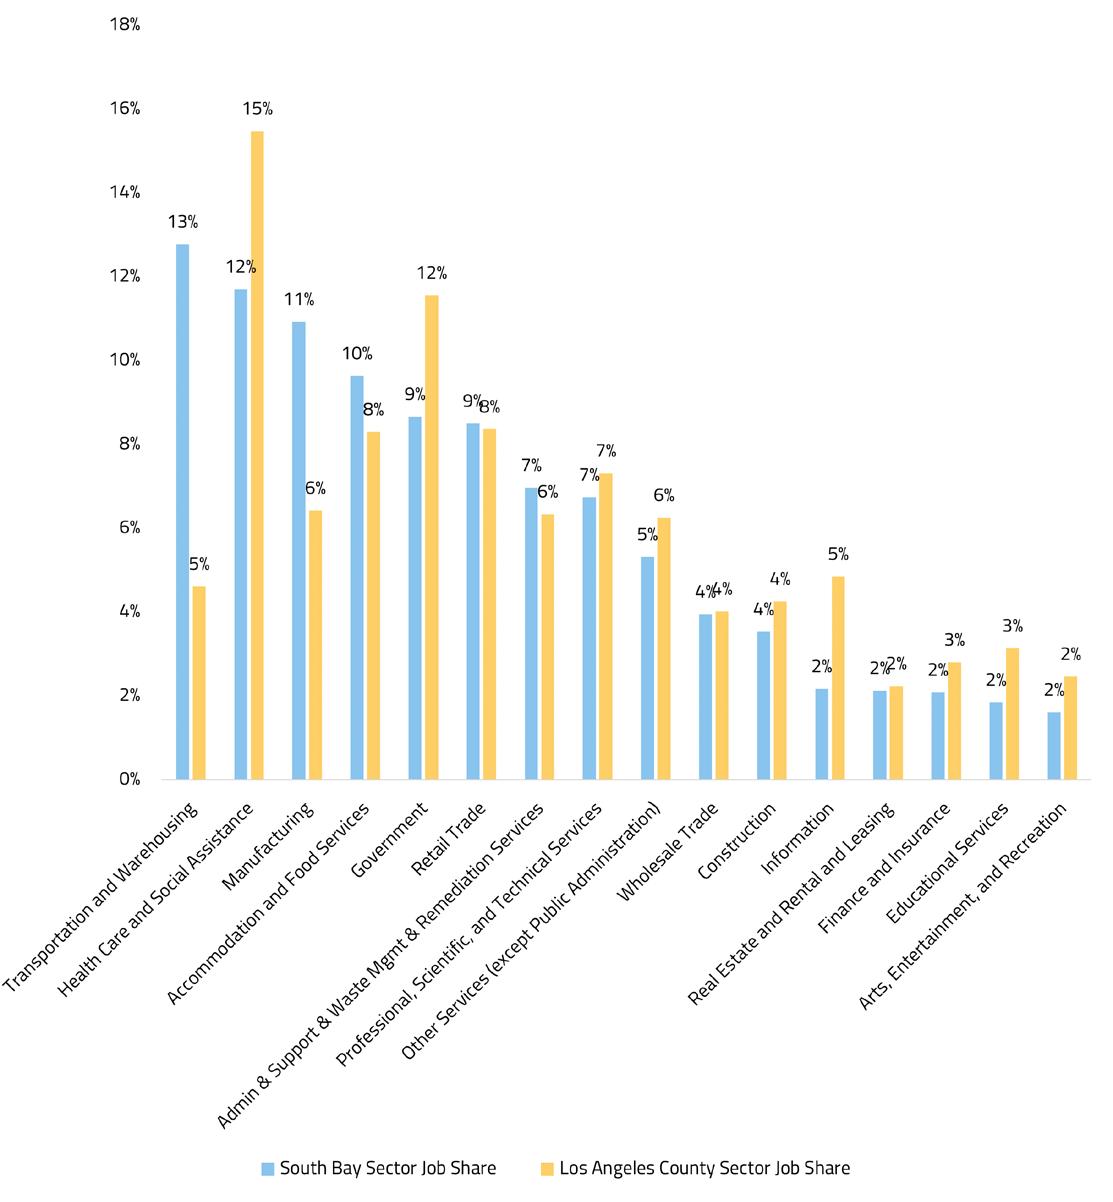
1Sectors not shown due to low employment numbers include: Management of Companies and Enterprises; Agriculture, Forestry, Fishing and Hunting; Utilities; Mining, Quarrying, and Oil and Gas Extraction.
The following analysis identifies promising occupations for students that are in demand and well paid in the subregion (Exhibits 11 and 12). For a more extensive list of middle-skill, in-demand occupations or middle-skill occupations that pay a strong median wage, please contact the Los Angeles Center of Excellence.
Exhibit 11. Top 10 occupations in terms of projected annual openings in the subregion
Exhibit 12. Top 10 occupations in terms of highest median wages in the subregion (>20 openings)
Exhibit 13. Top occupational titles in job postings, 2023
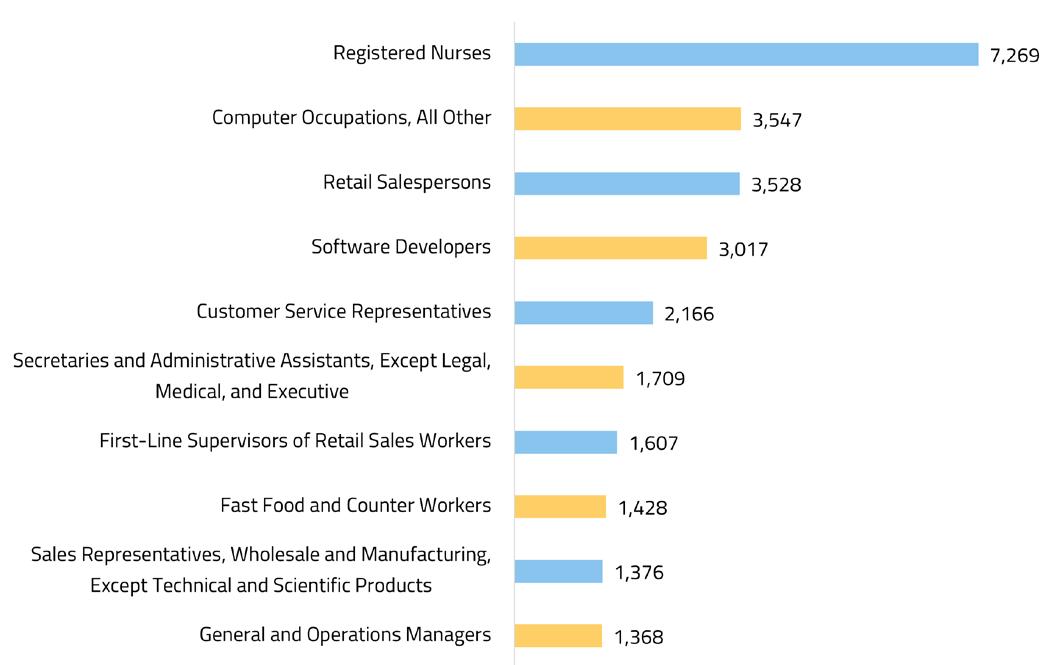
Exhibit 14. Top employers in job postings, subregion and Los Angeles County, 2023
SUBREGIONAL EMPLOYERS
Northrop Grumman
SpaceX
Boeing
Cedars-Sinai
The Aerospace Corporation
Providence
California State University
Robert Half
Kaiser Permanente
Prime Healthcare Services
LOS ANGELES COUNTY EMPLOYERS
University of California
Northrop Grumman
Cedars-Sinai
Allied Universal
Providence
University of Southern California
Boeing
Robert Half
Randstad
SpaceX
Exhibit 15. Top skills in job postings, 2023
SPECIALIZED SKILLS
SOFT SKILLS
Project Management Communication
Marketing
Customer Service
Auditing Management
Nursing Operations
Merchandising Sales
Computer Science
Accounting
Leadership
Detail Oriented
Finance Problem Solving
Restaurant Operation Planning
Systems Engineering Writing
SOFTWARE AND TECHNICAL SKILLS
Microsoft Excel
Microsoft Office
Microsoft PowerPoint
Microsoft Outlook
Python (Programming Language)
Microsoft Word
C++ (Programming Language)
SAP Applications
SQL (Programming Language)
Operating Systems

Community colleges play an integral role in training students to enter middle-skill jobs. By examining unduplicated student counts, how many awards (degrees and certificates) are being earned, and SWP metrics related to student outcomes, programs can be tailored to have the greatest positive impact.
The Los Angeles COE has analyzed CE programs for each community college in the subregion to identify programs that are performing most effectively in terms of advancing the median annual earnings of students after exiting a program, students who are able to attain a living wage after completing a program, and students who obtain a positive median change in earnings after completing a program.
• Student counts and number of awards
• CE programs with strong SWP outcomes
• Student demographics, including race/ethnicity, gender, and age IN THIS SECTION
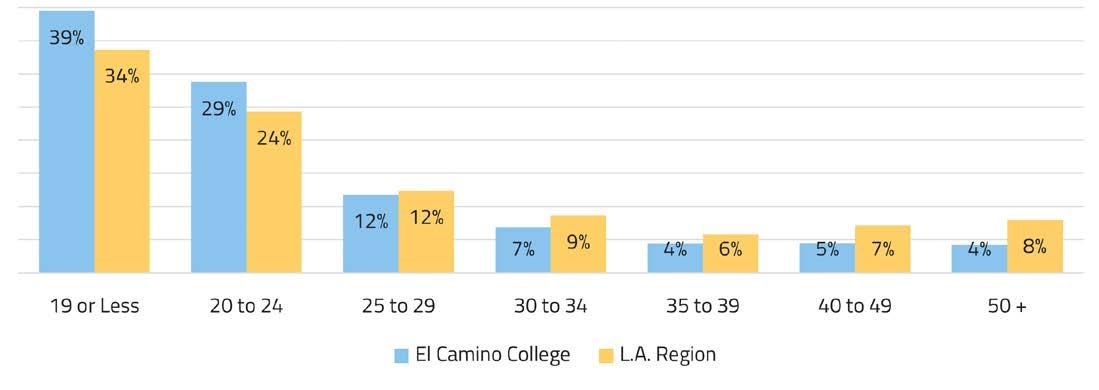
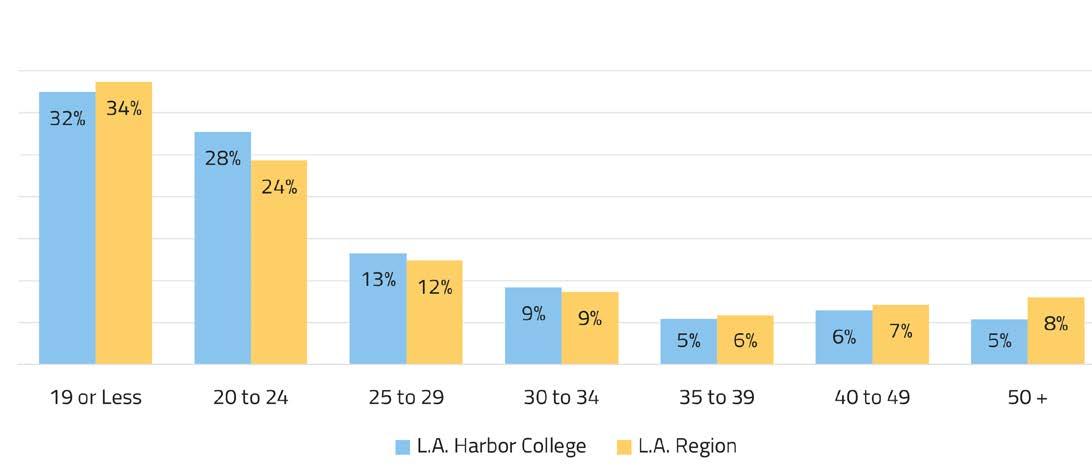
Examining patterns in student demographics, such as race/ethnicity and gender, can help community colleges advance equity and improve academic outcomes for underrepresented students. Additionally, examining the age breakdown of students can show where students may fall in terms of seeking education to further their lifelong careers. If a community college has a significant percentage of students above age 25, this may indicate demand by dislocated workers or incumbent workers seeking to retrain or upskill to access opportunities for career advancement.

30,575
EARNINGS
523,323
$54,228
$45,872
$44,268
3,731
83,827


13,692 LOS ANGELES HARBOR COLLEGE 523,323
2,986
(3-YEAR AVERAGE)
83,827
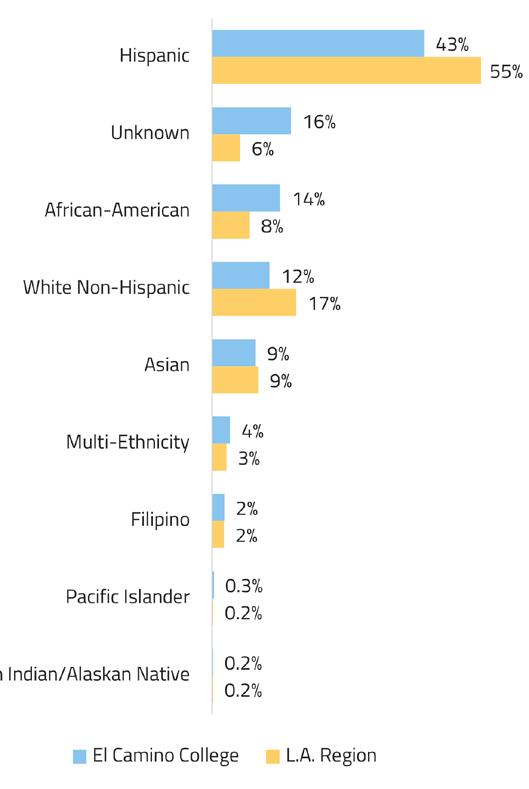
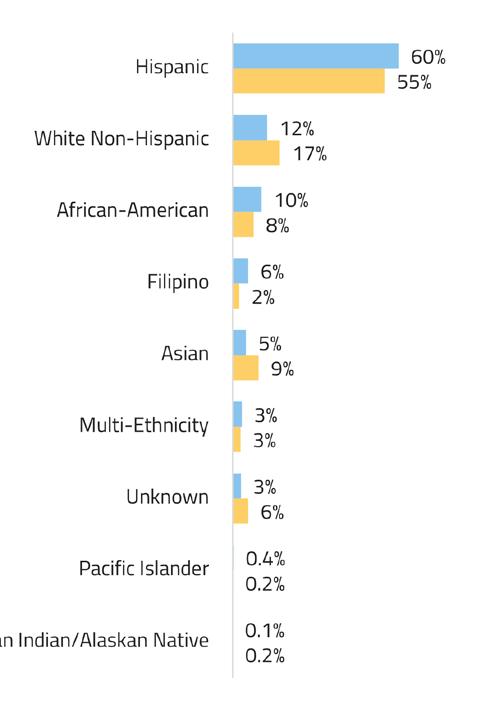
RACE/ETHNICITY


Through LaunchBoard, the California Community Colleges Chancellor’s Office collects data related to SWP metrics which are used to track student progress, credential attainment, and employment outcomes. These metrics can be applied to measuring the progress of community colleges toward meeting regional SWP goals.
The SWP metrics included in this section are:
IN THIS SECTION
• SWP metrics for individual community colleges in the subregion compared to the overall region: attained a living wage, median annual earnings, median change in earnings, attained a job closely related to field of study
• Attained a living wage—Among SWP students who exited a community college and did not transfer to any postsecondary institution, this is the proportion who attained the district county living wage for a single adult measured immediately following the academic year of exit.
• Median annual earnings—Among SWP students who exited the community college system and who did not transfer to any postsecondary institution, these represent median earnings following the academic year of exit.
• Median change in earnings—Among SWP students who exited and who did not transfer to any postsecondary institution, median change in earnings are calculated between the second quarter prior to the beginning of the academic year of entry (for the first time ever as a non-Special Admit or return to any community college after an absence of one or more academic years) and the second quarter after the end of the academic year of exit from the last college attended.
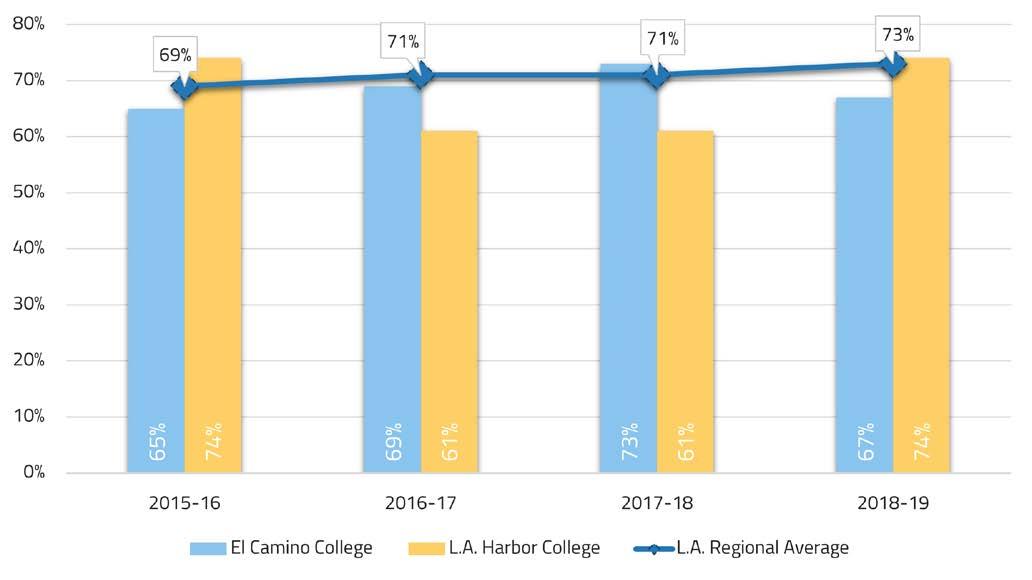
• Attained a job closely related to field of study—Among students who responded to the CTE Outcomes Survey and did not transfer to any postsecondary institution, this is the proportion who reported that they are working in a job very closely or closely related to their field of study.
Exhibit 16. Comparison of students who attained a living wage by college and Los Angeles regional average
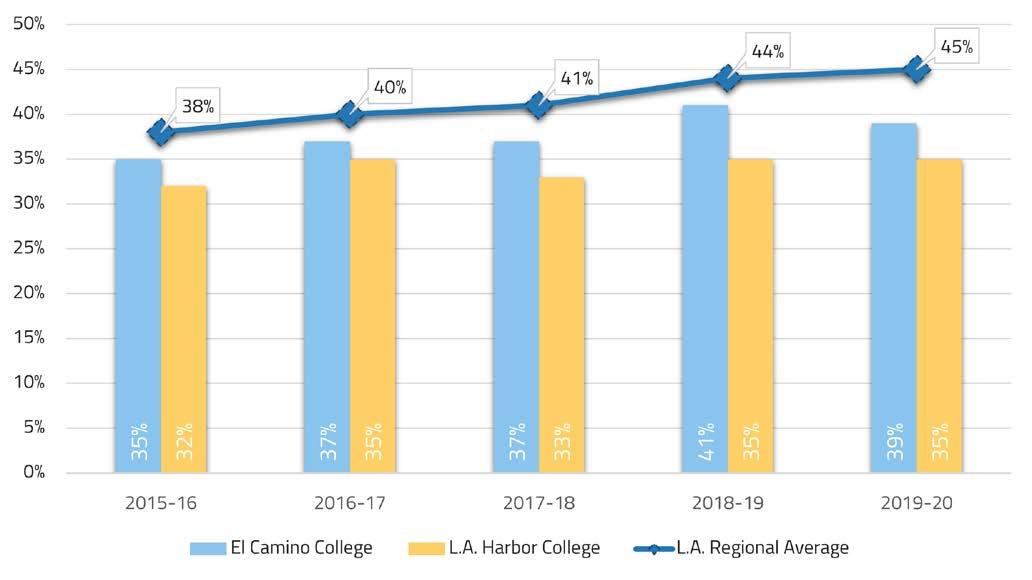
Exhibit 17. Comparison of median annual earnings by college and Los Angeles regional average
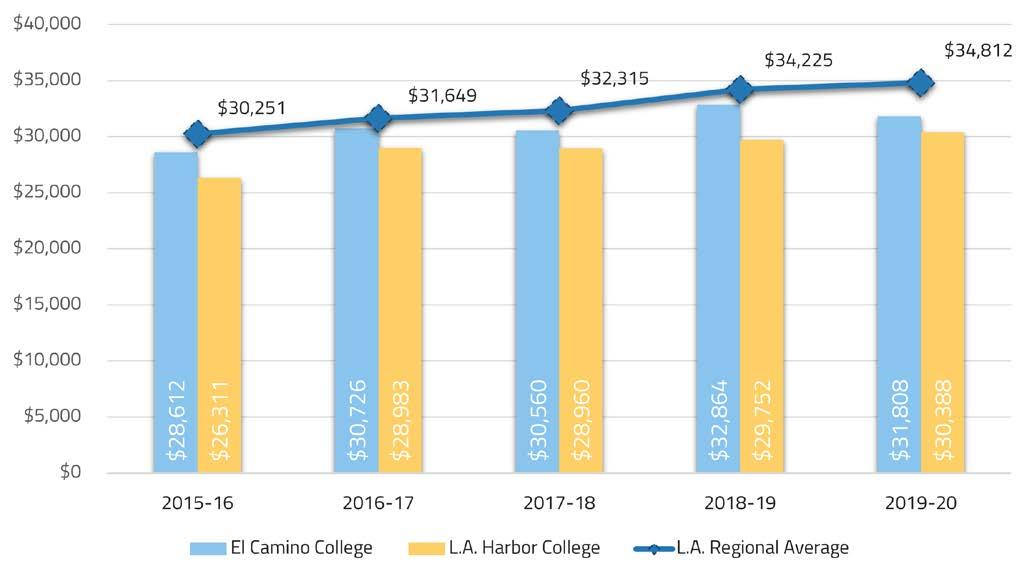
Exhibit 18. Comparison of median change in earnings by college and Los Angeles regional average
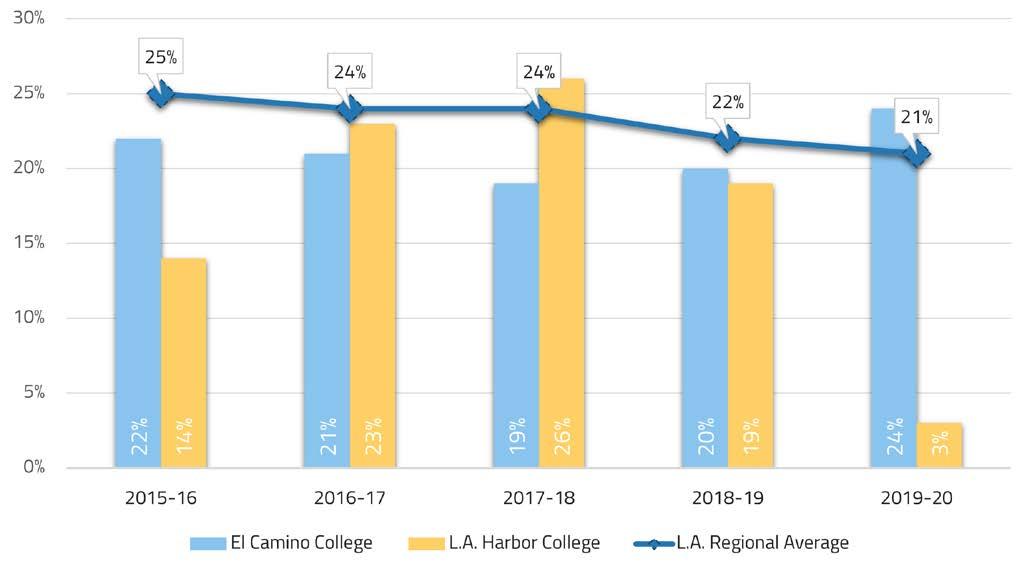
Exhibit 19. Comparison of students who attained a job closely related to field of study by college and Los Angeles regional average
SUBREGIONAL MAPS SHOWING POPULATION CONCENTRATION, HOUSEHOLD INCOME, EDUCATIONAL ATTAINMENT & EMPLOYMENT CONCENTRATION

Exhibit A1. Population concentration in the South Bay subregion
A2. Household income in the South Bay subregion
A3. Educational attainment in the South Bay subregion
A4. Employment concentration in the South Bay subregion
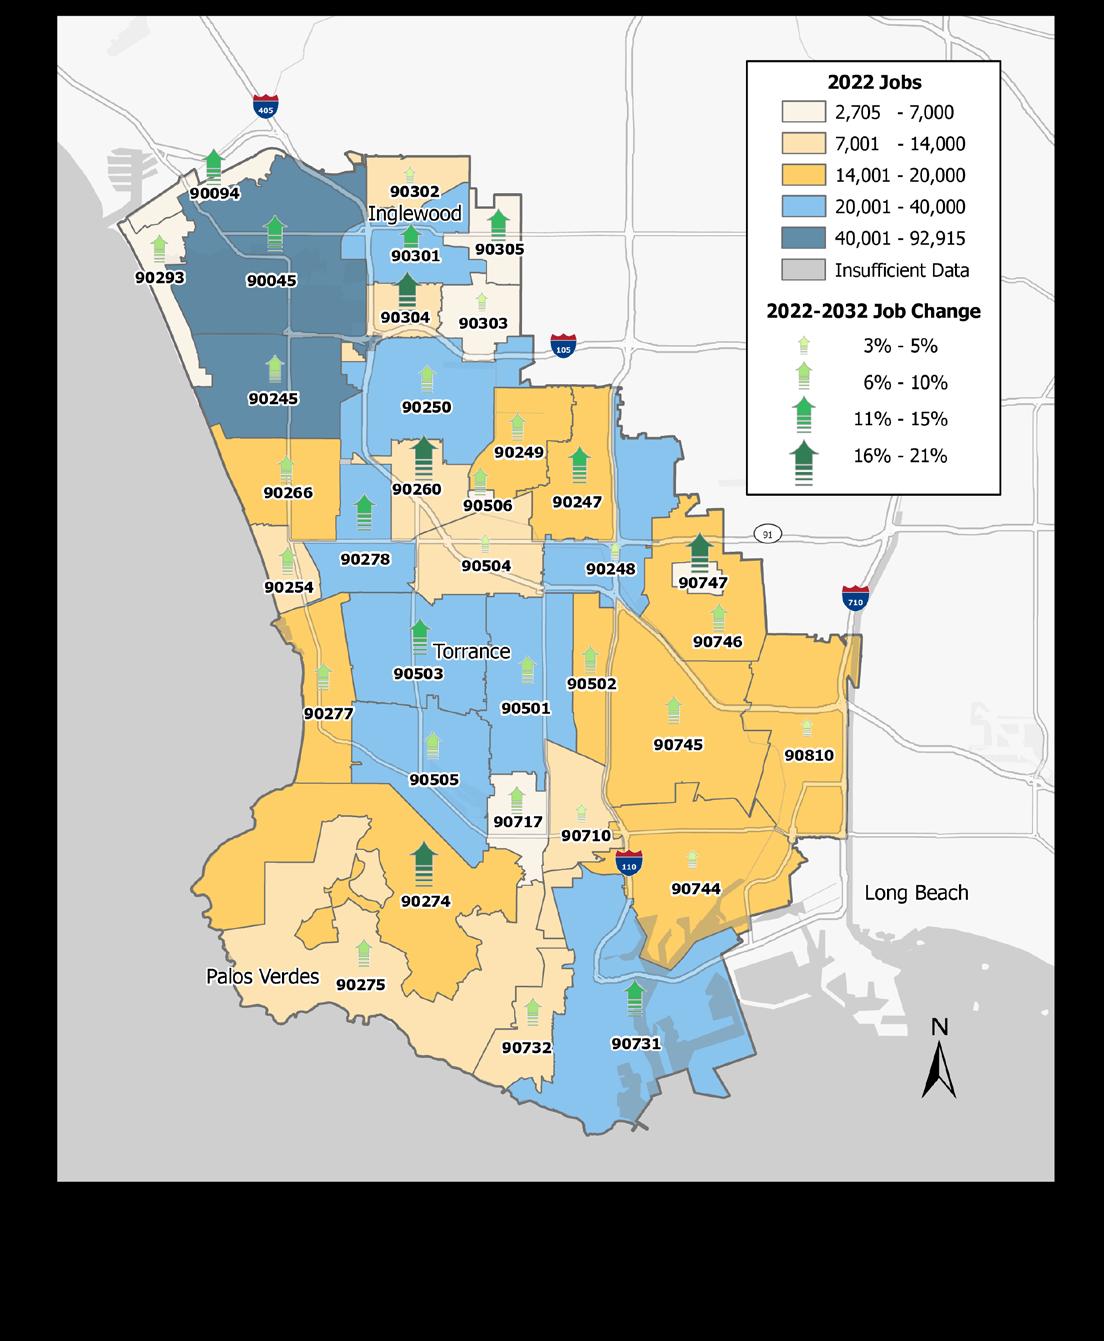

Exhibit B1. ZIP codes and cities comprising the South Bay subregion
90009
90045
Los Angeles 90309
Los Angeles 90310
90080 Los Angeles 90312
90083
90094
Los Angeles 90501
Inglewood
Inglewood
Inglewood
Torrance
Playa Vista 90502 Torrance
90245 El Segundo 90503 Torrance
90247 Gardena 90504 Torrance
90248 Gardena 90505 Torrance
90249 Gardena 90506 Torrance
90250
Hawthorne 90507 Torrance
90251 Hawthorne 90508 Torrance
90254
Hermosa Beach 90509
Torrance
90260 Lawndale 90510 Torrance
90266 Manhattan Beach 90704 Avalon
90267 Manhattan Beach 90710
90274
Palos Verdes Peninsula 90717
90275 Rancho Palos Verdes 90731
90277 Redondo Beach 90732
90278
90293
90296
Redondo Beach 90733
Playa Del Rey 90734
Playa Del Rey 90744
Harbor City
Lomita
San Pedro
San Pedro
San Pedro
San Pedro
Wilmington 90301 Inglewood 90745
90302 Inglewood 90746
90303 Inglewood 90747
90304 Inglewood 90748
90305 Inglewood 90749
90306 Inglewood 90810
90307 Inglewood 90895
90308 Inglewood
Carson
Carson
Carson
Wilmington
Carson
Long Beach
Carson