
IvanBrkan|LuisHobe|AxelRasmussen|TaoSun
ChairforArchitecturalInformatics DepartmentofArchitecture TechnichalUniversityofMunich UrbanRehab Tool


2 UrbanRehabTool ChairofArchitecturalInformatics Prof.Dr.-Ing.FrankPetzold PerformanceBasedDesignWS2021-22 GerhardSchubert|NickFörster|İlaydaMemiş Students IvanBrkan| LuisHobe| AxelRasmussen| TaoSun
3 4 6 8 10 14 22 26 28 30 32 34 Introduction Research&Motivation Ideation Concept Prototype UserInterface Discussion Outlook Collaboration Contact References TableofContents
TheUrbanRehabToolisintendedtoprovideabasisforsuchinterventions. Decisionmakersaswellasstakeholdersofallkindsshouldbeableto identifygrievances-presentandfuture-andproposeortakeappropriate measuresbasedontheanalysis.
Adynamicapproachmakesitpossibletoconsiderawiderangeoffactors intheanalysisandthusopensupthespectrumofpossibleconclusions.
Inanticipationofrapidlygrowingpopulationdensitiesincitiesaroundthe world,ensuringahighqualityoflifeinurbanareasisoneofthebiggest tasksofthecomingdecades.Themorepeoplemoveintocities,thegreater thepressureoncitycentersandtheirinfrastructurewillget.Thehigherthe populationdensitythere,themorecrucialitwillbetoreducetrafficandto beabletoreachallfacilitiesfordailyneedswithinwalkingdistance.And themorewehavetothinkaboutefficientwaysoflivingandhousinginview ofclimateprotection,themoreimportantitwillbetointerveneintheurban infrastructureinawaythathasbeenwellthoughtoutandsensiblydecided, takingintoaccountalltheimportantfactors.
However,italsorequiresahighdegreeofprecisionandqualityforthedata fedintothealgorithmandincreasesthedemandformeaningfulpreliminary considerationsbeforeusingthetool.Itisthusunderstoodasaframework fortheevaluationofacityorasectionofitwithrespecttoallcriteriathatthe userperceivesasimportant.
4 Introduction
5

[1]
AssumingthatJanGehliscorrectinhisassessment,wemustaskthe question:whythendowenotsucceedmoreoften?Amongmanyothers, oneanswertothisquestionisthatwhileweknowintheorywhatisinvolved insuchawell-servingcity,wefailinpracticetoapplythisknowledge specificallytoexistingstructurestomakeimprovements.Andwefail becausenobooktellsusexactlywhatinterventionsareneededina particularneighborhood-howcouldwe,wheneachofthemlooksdifferent intheworld,differentpeoplemovethere,anddifferentneedsexist?
„Nothinginthisworldismoresimpleandcheaperthanmakingcitiesthat providebetterforpeople.“-JanGehl.
6
Research&Motivation
Theattempttoanalyzeaparticularcityintermsofawidevarietyof parameterswasprovidedbyGarauetal.withanapproachtoevaluating theItaliancityofCagliariwithafocusonSustainableSmartCities.
Usingavarietyofindicatorsandsub-indicatorsincluding,amongothers, accessibility,availabilityofcertainfacilitiesand,forexample,theexistence ofgreenspaces,ascoringsystemwasdevelopedthatevaluatesthequality ofindividualareasofthecity,takingintoaccountallselectedfactors,and calculatesthe„SmartUrbanQualityindicator.“Theauthorshavealready statedinthisstudythattheappropriatechoiceofindicators,aswellastheir weighting,isthecriticalpointfortheevaluationofaparticularneighborhood andcanvarytoagreatextent.Themethoddevelopedinthispaperis alsousedtoalargeextentintheUrbanRehabTool.Thedifferenceisthat
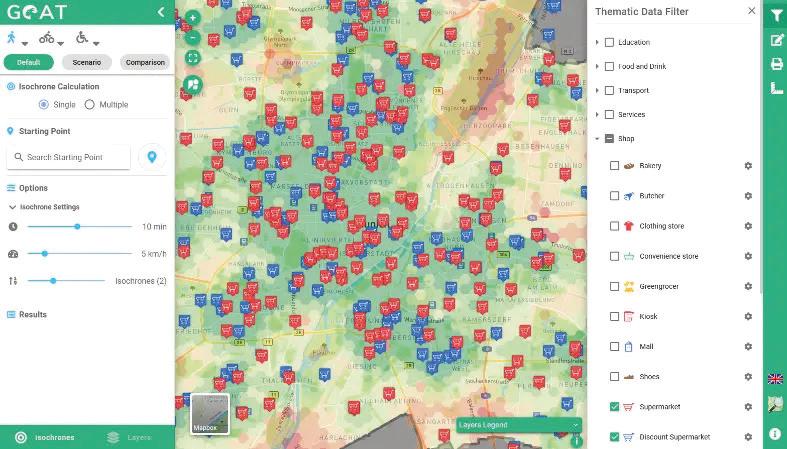
7 IndicatorforSmartUrbanQuality(ISUQ)for theCityofCagliari(Italy)[2] AccessibilityforMunichevaluatedwithGOAT[3] neithertheareastudiednortheselectionoffactorsandtheirweightingisfixedfromtheoutset,and accordinglytheresultcannotbeauniformindexthatcanbecomparedacrossdifferentcities.[2] Withthefocusoncertainfactors,digitaltoolssuchasGOAT(GeoOpenAccessibilityTool)already existtoanalyzequalitieswithinacity.Thistool,limitedtoMunichandindividualothercities,evaluates theaccessibilityofcertainfacilitiesstartingfromaselectedlocation,takingintoaccountdifferent walkingordrivingspeeds.Basedonaselectedtimetobespentandspeed,isochronesaredrawn showingtheouterlimitsoftheareathatcanbereachedunderthespecifiedconditions.GOATalso makesitpossibletomergethetwoparametersofaccessibilityandpopulationdensity,combining thetwoquantitiesintoanindexthatcanbevisualizedovertheurbanarea.Manyapproachesforthe conceptandtheuserinterfaceweretakenfromthistoolandespeciallytheideaofdynamicinput optionswasadapted.[3]

Ideation
Basedontheresearchandmanydiscussions,someideasandrequirements emergedforthedevelopmentoftheUrbanRehabtool,alongwhichthe wholedevelopmentprocesswasdesigned.Oneimportantfactorwasthe requirementforflexibility.Thetoolshouldtheoreticallyworkforanymap sectionintheworldandinpracticeproducemeaningfulresultsforanyarea withurbaninfrastructure.Inaddition,theparametersfortheanalysiswereto befreelyselectableasfaraspossible.Thus,inadditiontofunctionsbased onexistingdata,suchasaccessibilityassessment,thegoalwastooffer optionsforusingone‘sowndatasetsfromstatisticalsurveysorforecasts forthefuture.
Despitethediversityofthecriteriatakenintoaccount,theaimwas tocombinetheresultsfromtheanalysesofindividualindicatorsina meaningfulwayandtobeabletomakeacomparisonwithintheareaunder study.Duetotherealizationthattheimportantindicatorscanbeindividual anddifferentineachurbanarea,aqualitativeapproachwaschoseninthe evaluation.Thus,theresultsshouldonlyshowwithinthestudiedareawhere thegreatestneedforimprovementexistsandwhichplacesalreadyshow highqualityincomparison.Thisapproachalsofollowstheideathatthereare thingstoimproveineverycity-regardlessofitscurrentstate-andthatthe goalmustbetocreateequallivingconditionsatthecitylevel.
8
Anothergoalwastocreateauserinterfacethatmakesiteasyfortheuser toperformananalysis.So,whilekeepingtheinputoptionsasflexibleas possible,anattemptwasmadetomakethemassimpleaspossibleand thentovisualizetheresultinadescriptiveway.Thisfollowedtheideathat, inadditiontoprofessionalusers,everycitizenofacitycouldbecomeauser ofthetool.
9


Earlyon,ourteamtookthedecisiontouseameshtohandletheinformation anditslaterdisplayfortheuser.Thisapproachenabledustospeedup thecalculationprocessofouralgorithm.Althoughnotimplementedyetin thefinalversionofouruserinterface,ifweweretoaddasettingsoptions menu,theuserwouldhavetheopportunitytochangethegridsizeofthe meshinordertomaketheanalysismorepreciseorsimplytospeedupthe calculationtimes.Fornow,changingthegridsizeisonlypossiblethrough thegrasshopperscript.
Besidesthegrid-size,wealsodiscussedifweshouldshrinktheoverall sizeofthemeshandhavea“cut-out”areanotbeinganalized.Intheend, wedecidedourselvestoshrinkthesizeofthecolouredmesh,sincethe resultsneartotheborderoftheimportedmapweresometimesincorrect. Thisisduetothefact,iftheuserimportsanmapwheresomefacilitieswere slightlyoutofthemap,theareasnearofthesecaseswouldreceivea“low qualification”inouralgorithm,althoughinrealitytheyindeedhadagood accesstothosefacilities.Topreventthesecasestohappen,wedecidedto decreasethesizeoftheanalyzedarea,whichtranslatedtoasmallermeshsize.
10 Concept
11 MapsectionimportedfromOpenStreetMap Centerpoints(blue)andpositionsoffacilities(pink) Distanceevaluation,consideringfacilitiesoutsidethismesh Meshthatleavesouttheouterareaofthemapsection


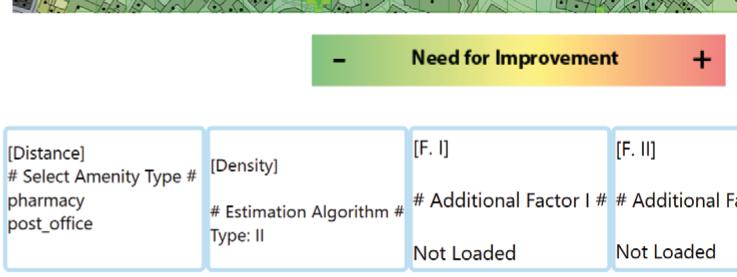
TheUrbanRehabToolcontainsthreecorefunctionsthatareconsideredfor theevaluationoftheurbanarea.
Thecalculationofthedistancetothenearestfacilityofagivenfunctionhas beenimplementedtoevaluateaccessibility.
Thesecondpillaroftheprogramisthecalculationofpopulationdensityona smallscale.Foreachfieldofthemesh,thepopulationdensityisdetermined. Thisinformationisimportanttocapturethedemandatcertainlocationsfor certainfacilitiesandincombinationwiththedistancetomakeastatementif theavailabilityissufficient.
Thelastelementimplementedisafreelyselectablefactor.Inthis,any informationcanbeconsideredthatcanbeexpressednumerically andfollowstheschemethatlowvaluescorrelatewithalowneedfor improvementandhighvaluescorrelatewithahighneedforimprovement intermsofinfrastructure.Thisfunctionisbasedonthefactthatthecriteria forananalysiscanbeindividuallyverydifferentandwewantedtocreatea possibilitytotakethisuncertaintyintoaccount.
Allfactorscanbeaddedtogetherinanyweightingandresultinaheatmap thatprovidesananalysisbasedonthefactorsconsidered.
Thetoolmightbeusedbyresidents,investorsorurbanplanners.We designedtheinterfacehavingthisinmind.Ourapproachwastohavea clear,straightforwardandintuitiveinterface.However,themostrealisticcase wouldbeourtooltobemainlyusedbyurbanplannersorpeopleanalyzing thequalityofacityorcityarea.
12
13 Resultsofdistance+density Resultsofdistanceonly Resultsofdistance+density+additionalfactor Resultsofdensityonly


14 Prototype
Fortheproject,osmdataisusedsincetheaccessisfreeofchargeas wellasrelativelycompletecomparedtootherproviders.However,the qualityofdatadependsontheregionandthecity.CitieslikeMunich aremorecompletethanothers.Thussimilaritiesofthesecitiesneedto befoundaswellaspossibilitiesofadjustingthedata.Therefore,forthe chosenamenitiespharmacies,restaurants,andpost-officesarechosen. Additionally,roadsaredescribedindetailandsmallerpathsareadded. However,thebiggestproblemthatallplaceshadincommonwasthe lackofinformationaboutresidentialbuildings.Intheoptimalcase,each buildingincludesinformationoftheamountofpeoplelivingthere.Since thisinformationisnotavailable,thegoalwastoapproximatethevalues.
[4]
InputdatafromOpenStreetMap
Theapproximationisdonebymultiplyingthelevelsofabuildingwiththe areaanddividingitbytheaveragespacethatapersonhasforliving.In ourcasethisconstantis49m²/person .Theareaofabuildingisobtained easilysinceabuildingisdescribedasawayinosm.Awayconsistsofthe connectionofseveralnodes.Withthepositionofthenodes,theareacanbe calculated. Thebiggestchallengeinthisapproximationisobtainingtheheightofa buildingdescribedbylevels.Thisinformationisscarce.Thesolutionofthis challengeisbasedontheidea“similarbuildingsareclosetoeachother”.A
15 RawOSMData-OnlyPaths RawOSMData-PathsandBuildings buildingwithoutthelevels-tagwilladoptthevalueoftheclosestbuildinghavingthisinformation.This solutionisfastandgivesagoodapproximationofbuildingheights.Thedistanceoftworesidential buildingsisdescribedbythehaversinedistance.Theformulaprovidesthedistanceoftwopointsona sphere.Thatenablesabetterqualityoftheapproximation. Theadjustmentontheosmdataisdoneintwoseperatepythonscripts.First,thelevelsareadded. Secondly,thepossiblenumberofpeoplelivinginabuildingiscalculatedandaddedtotheinputfile.


Iftherearetwoormorepositionsofthesameamenity,onlytheshortestpath isconsideredinfurthercalculationsaswellasrepresentingtheconnection ofasquaretothefacility.
Thefacility-typeconsideredarechosenintheUserInterfaceofthetool.In theprototype,thefacility-typesarerestrictedtopharmacies,restaurants andpost-offices.However,thecalculationofdistanceisnotconnectedto specificfacilities.Therefore,otheramenitiescanbeadded,easily.
16
Ifthetopologycalculatorwasnotabletoconnectthecentralpointwithan amenity,duetolackofdataorotherreasons,thedistanceisobtainedby air-linethetwopoints.Inthetestingcases,thiserrorhandlingwasused1% ofallcases.
Thegoalistoobtainthedistanceofanamenitytoasquareofthemesh. Thesquareisrepresentedbyitscenterpoint.Thedistanceitselfis calculatedbythewalkingdistanceusingthepathsoftheosmfiles.The algorithmusedisbasedonatopologycalculatorforfindingpossiblepaths toanamenity.Outoftheselectedpaths,thebestischosenbytheA* algorithm,asearchalgorithm.
DistanceCalculation
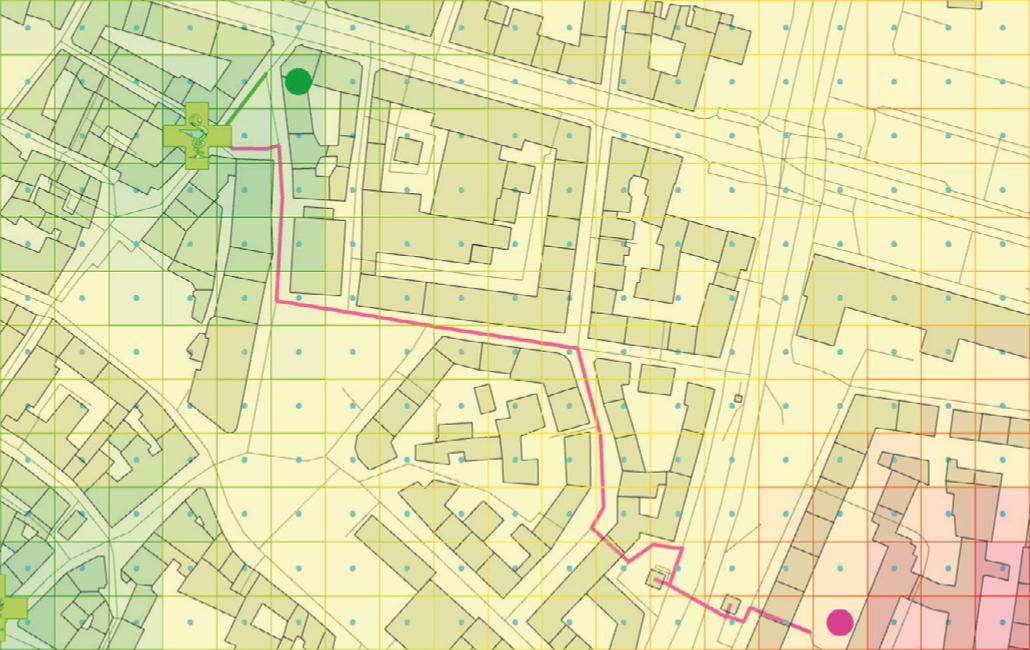
17 Thisimageisascreenshotofananalysisof centralMunich,wheretheuserselectedthe distanceasonlyevaluationfactor.Totheright,we seeacloseupofanexamplehowtheevaluation ofthemapisdone. Theshortestpath(green)receivesalowervalue, whichmeansthattheneedforimprovementis lowe,incomparissontotheotherone(red),which receivesahighervalue,whichtranslatestoa higherneedforimprovement. 450m

DensityCalculation
Differentmethodswereexperimentedwith.Thebestsolutionisaddedtothe project. Inthefirststepallresidentialbuildingsareextracted.Afterwards,squares areobtainedwhichintersectabuildingorfullyencloseit.
Secondly,eachsquareadoptstheresidentialnumberofthebuilding obtainedinstepone.Thusgivingagoodapproximationoftheamountof peoplelivinginacertainarea.Additionally,thechallengingcaseofabuilding crossingtheborderofsquaresisdealtwithinanefficientfashion. AdditionalFactors
18
Thegoalofthedensitycalculationistoobtaintheamountofpeoplelivingin onesquareofthemesh.
Foranincreaseinflexibilityandusability,additionalfactorscanbeaddedin aninteractiveway. Afteruploadingtheosmfile,theadditionalfactorcanbeselected.Itenables thepossibilitytoassignvaluestospotsonthemapselectedbytheuser. Theselectionisdoneinteractivelybypointingtothespot.Thisway,tinkering andplayingaroundwithdifferentscenariosispossible.Thusincreasingthe qualityoftheresultaswellastheinformationgainedintheprocess. Whentheprocessofassigningvaluesisfinished,thevaluesandthe respectivepointscanbewrittenincsvfilesforfurtheranalysis.
19
Asaresult,theinformationofallbuildingsistranferedtothemesh. BluedotsrepresentthepointwheretheinformationofthebuildingAistransferedfromittothemesh. A


20 CombinationofFactors Bringingtogetherthevariousindicatorstoproduceoneresultisprobablythe mostcriticalpointoftheconcept.Therefore,variousmathematicalmethods weretriedandevaluatedbasedontestruns.Inadditiontotheaverage value,thenthroot,theproductoftheindividualresults,theentropyandthe sumwereexamined.Allscoresexceptthemeanwerenormalizedtoa0-10 scale.Variouscombinationsofgood,badandmediocreresultswerecreated forthetests.Thecriteriafortheevaluationweresensitivitytoparticularly badvaluesandanappropriatedistribution. Thefigureonpage21showstheresultsofsomecombinations.Itbecomes apparenthowdifferenttheoverallresultcanbedependingonthemethod used.ThemethodusedintheUrbanRehabToolismarkedingreen. Dependingonthenumberofindicatorsconsideredintheanalysisandtheir weighting,thenthrootistakenfromtheproductofallindividualresults (Equation1)andthenputonascalefrom1to10,withthehighestandthus worstscorebeing10andtheremainingresults arescaledaccordingly(Equation2). Equation1* YOverallResultabsolute XScoreIndicator wweightingfactor iindexfactor jindexsquare *Inequation1itwasassumedthatatotalof five indicatorsaretakenintoaccount. Equation2 YOverallresultabsolute YmaxMaximumoverallresultabsolute jindexsquare

21 Exemplarycombinationsofresultsofthreefactorsandtheirscorewithfivedifferentcalculationmethods

22
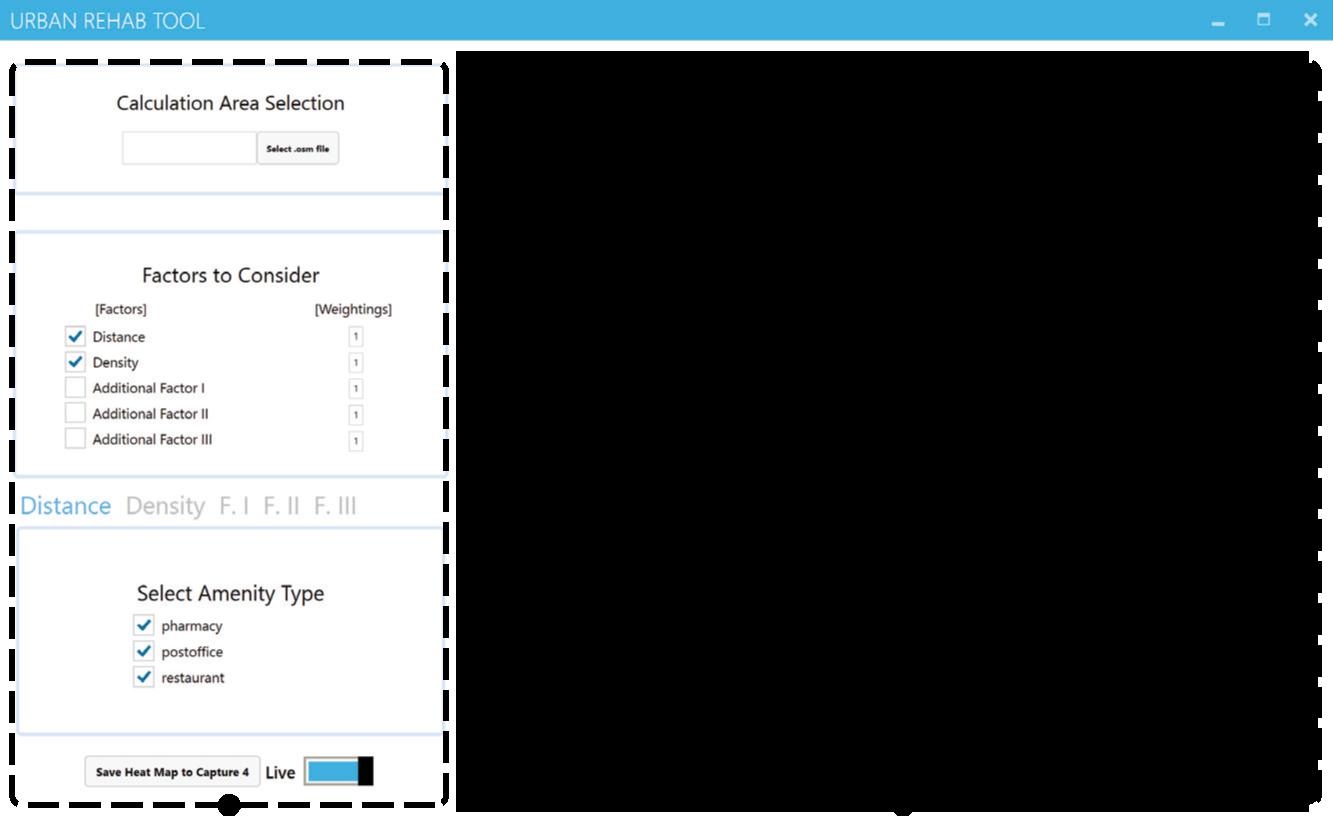
Weenvisionedaninterfacewithclearzoningshandlinginputsandoutputs separatelytominimisetheconfusionfortheuser.
Tomakemoreoutofit,wecameupwiththefunctionalitythatallowsusers tosavecalculationresultsintoseparatetabssothattheywillhavethe chancetorevisitandcompareacrossthedifferentresults.
BysettingupastandaloneUIfortheprototype,werecognisedthe underlyingmessageandtasks,thatthestandaloneshouldprovideextra valueratherthanjustamirroringfromtheRhinoviewport.Inotherwords: TheprimarygoaloftheUIshouldnotbejustapolishedversionofaRhino viewport.Itshouldbemorethanthis.
UserInterface
GUI Asagroupoffourmotivatedinterdisciplinarystudents,ourambitiondidnot justletussettlebyasemi-functioningscript,butthegoalwastodeliver afullyfunctioningwholepackageastheprototype.SotheGUIaswellas thevisualisationhasbeendeterminedasoneofthemostrelevanttopicsto tackle.
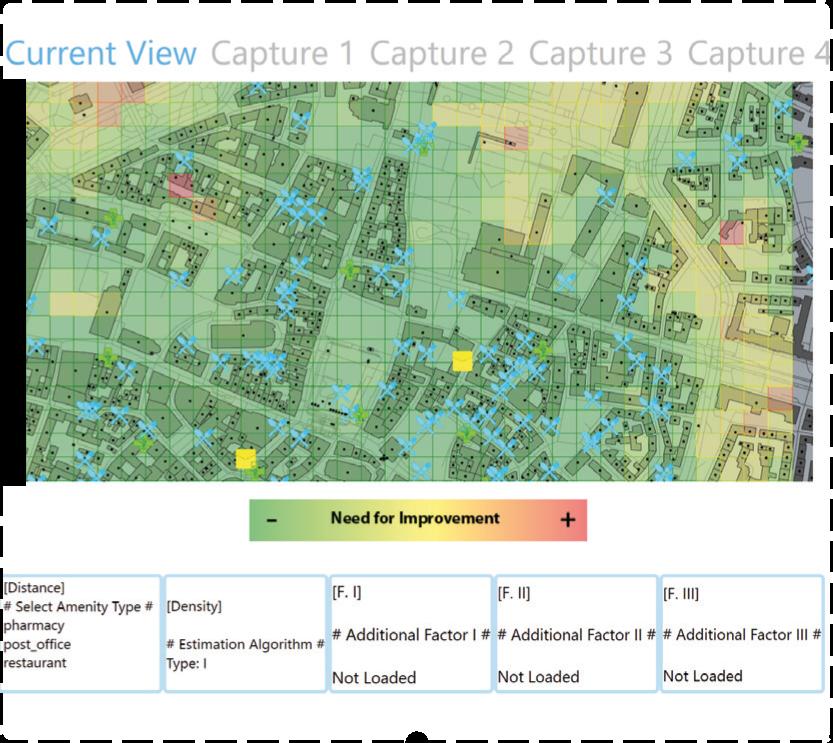
23 InputArea OutputArea OSMFileofthearea fortheinvestigation Tabsforcurrentview andsavedcaptures Resultheatmap Legendforheatmap Dashboardsummerizingtheinputfactors Selectionforfactors tobeconsidered intothecalculation Furtherdetailedsettingsforeachfactor Togglebetweenstatic anddynamicdisplay Captureresult GUILayout


24 Features Theabilitytoswitchbetweenstaticanddynamicdisplaymode Thepossibilitytointroduceadditionalfactorsintothecalculation


25 Byusingthe“savetocapture”function,theusercouldsaveupto4differentresults, whichenableslatercomparison


Mechanism WechosethepluginHumanUItobuildouruserinterfaceupon.Facingthe factthattheprototypeisprimarilyrunninginthescopeoftheGrasshopper+ Rhinoenvironment,theGHpluginHumanUIisthemostsuitable. Thenthechallengecameup.DespitethattheHumanUIoffersahighly extensivetoolkittoconstructtheUI,therewasnowaytolettheHuman UImirrorthecontentfromaRhinoviewport.Accordingtothedeveloper ofHumanUI,thepluginissupposedtoworkalongwithRhino,insteadof replacingRhino. WefinallyfoundtheworkaroundbydiggingintotheSDKofRhinoand Grasshopper.Thissolutionincludesconstructingaso-calledExternal DisplayCore(EDC)scriptedinC#todirectlyaccesstheRhinoApptotake andshowthescreenshotsfromtheRhinoviewportintotheHumanUIonce thecoredetects-throughthelistenercomponent-changesintheinputs. Besidesthat,theExternalDisplayCorealsohandlesotherfunctionalities suchasthe“saveheatmaptocaptures”.
26
TheHumanUIgatherstheinputdata,whichwillbeprocessedandparsed byasetofGHpython-basedonIronPython-scriptsintothealgorithmbuilt withinGrasshopper.Afterthecalculationisdone,theresultwillbedrawn anddisplayedinRhino,wheretheEDCtakesascreenshotinstantlytolet theHumanUIshow.Inthisway,thecircleoftheUImechanismisfinally closed.
27 Rhino Grasshopper HumanUI IronPython Inputs Calculation Connectivity DisplaySource Interection ExternalDisplay External Display Core C#

Consideringthreefactorswitheachascorebetweenoneandten,ifonly integernumbersareconsideredandnoweightsadded,wewouldhaveto compare220differentcombinationsofnumbers.220differentcasesaretoo muchtohandle.Thusfocusingonfiveedgecasesanddecidingwhatseems tobethemostfitableforus.
Theresultsofdifferentmapscannotbecomparedduetothequalitative
focuses. Aglanceofthestrugglecanbevisibleinthefigure“combinationof results”.Sincetheliteratureitselfdoesnotcomeupwithasolution,wehad totryoutdifferentformulasindifferentcasesandcomparethemourselves.
Byitscore,theprototypeworksasintended.Osmfilescanbeuploaded, distancesanddensitiescalculated,valuescombinedandresultsshown. However,onebigissueliesatthepoint“valuescombined”.
Thereforeadifferentformulacanhaveasignificantimpactontheresult.So ataskforthefuturewouldbetoresearchmoreaboutdifferentformulasand methodstocombinedifferentnumericalvaluesintooneresult.
Theaspectofcomparisonneedstobeaddressedaswell.
Everyformulahasitsstrengthsandweaknessesbutmoreimportantlyits
Thecombinationofvaluesintooneresultedinabiggerchallengethan expected.Manydifferentformulasarepresentedinvariouspapers.
28 Discussion
approach.Ascoretoacertainsquareisboundtotheworstandbestresult ofitsmap.Incaseofdistancecalculation,thefurthestdistanceononemap is450meterswhileonadifferentmap,it’s200meters.Bothsquareswould getascoreoften.However,inthesecondmapthedistanceismorethan double.Thesamephenomenonisvisibleinthedensitycalculation.Asquare cancontainover1000peopleandgetascoreof10.However,adifferent maphasascoreof10for100people.Thusgettingthesamescorefora differenceinfactor10.
Additionally,theresultofthecalculationhighlydependsonthequalityofthe osm-file.Itisnotguaranteedthateverymaphasthesamequalitystandards Aninstancewouldbethatcurvesaresimplified,resultinginshorterpaths. Anotherinstancewouldbethataresidentialbuildingisnotdeclaredas such.Bothcaseswouldresultinfalsifieddistanceanddensitycalculation andthusfalsifytheoutcome. Thisphenomenonisincreasesthedifferenceinoutcomebetweenmaps.
29
30 Outlook
Currently,thetoolhasthreetypesofamenitiestobeselectedandwalking asamodeoftransport. Onthesepoints,thetoolcanbeextended.Newtypesoffacilitiescanbe addedeasily.Thelimitationisjusttheavailabilityofinformationintheosmfilesimported. Agreaterchallengeisaddingnewformsoftransportationsincenewissues needtobeconsidered.Walkinghasthebenefitofreachingeveryspotwitha constantspeedandbarelyanylimitationsintermsofenvironment. However,thatisnotthecasefornewmodes.Publictransportationisthe bestexample. Besidesobtainingthedifferentaveragespeedsofdifferenttypesofpublic transportation,thedepartingtimesandtimesforswitchingtransportation needtobeconsidered.Missingthenextmetrowillresolveinafiveminutes timeloss,inMunich,whichaddsupiftransportationneedstobeswitched multipletimes.However,thefiveminutetimelossisonlyonweekdays. Onweekends,thetimelosscanbe20minutesifthemetroarrivesatthe sametimeatthesamestation.Toextendonthisissue,thetimelostand thewaitingtimesdifferfrommetrolinetometroline.Additionallybusesand tramsneedtobeconsideringwiththeirowndepartingtimesandactual positionsforswitchinglines.
31
Addingtothat,thewalkingdistancebetweenpublictransportationand centralpoint,andfacilityneedstobeaddedtothecalculationextendingthe difficultyfurther.Furthermore,additionalfactorsneedtobeconsideredwhen addingpublictransportationwhichincreasesthedifficulty.
Tokeeptheuniformityofthetoolthenewfactorshouldbeimportedby usingtheosm-fileastheinformationsource.Thiscanbedoneeasilyby addingtagsforthenewfactorsiftherearenoexistingtagsavailable.Asan example.airpollutionwillincreaseinimportanceinthefuture.Spotsonthe mapcangetthisnewtagdescribingthequalityofair.Thisoptionisnow availableasadefaultoptionandtheusageofthetoolisimproved.
Extensionofthetoolcanalsobedoneintermsoffactorsconsideredby default. Currentlytheprototypeislimitedtodensityanddistancefactors.Other factorscanbeaddedviauploadofafile.Thisprocesscanbechanged.Ifa newfactorincreasesinimportanceandinnumberofusages,thisnewfactor canbeaddedasadefaultoptiontothetool.Thecombinationoffactorsis notlimitedtotwothereforeadjustmentscanbedoneeasily.Theonlyruleis thatthescoreneedstobemappedtoanumericalvaluebetweenoneand ten.
32
Workingtogetherontheprototypewascertainlythebiggestchallengefor agroupoffourinthisseminar,alsobecauseGrasshopperisnotthemost suitableplatformforsuchcollectivecollaboration.However,byusingGit, awaycouldbefoundforallteammemberstocontributeacomparable amounttotheprogrammingoftheprototype.
Especiallytowardstheendofthesemester,asboththeconceptandthe productbegantotakeshape,thejoyoftheprojectwasevidentinthegroup dynamics.
Weeklyvideoconferenceswiththeentiregroupandregularexchangesvia textmessagesallowedforasensibledivisionoftaskstobefoundagainand again,sothateveryonehadsomethingtodoandcouldcontributetothe project.Thefeedbackfromthepresentationsandopen-helpsessionswas veryhelpfulintakingthenextsteps.
Successfullyorganizinggroupworkinadigitalprojectseminarwithan internationalandinterdisciplinaryteamiscertainlynottheeasiesttask.At thebeginning,youfeltthechallenges,sinceyoufirsthadtogettoknow andadjusttoeachotherandlearntounderstandtheworkingandthinking methodsoftheteammembers.However,overthecourseofthissemester, averyconstructivecollaborationhasdevelopedinwhicheveryonehasbeen abletocontributetheirstrengths.Thebackgroundsoftheteammembers rangefromarchitecturetoengineeringtocomputerscienceand,inasense, areallreflectedintheprojectoutcome.
Collaboration
33 Ivan Tao Luis Axel


34 References
[1] N.Ferraro,„Planetizen,“18August2013.[Online].Available:https://www. planetizen.com/node/64678. [2] C.GarauandValentinaPavan,„EvaluatingUrbanQuality:Indicatorsand AssessmentToolsforSmartSustainableCities,“Sustainability,25February 2018. [3] Plan4better,„WasistGoat?,“10March2022.[Online].Available:https:// plan4better.de/was-ist-goat/. [4] „WohnungsbauatlasfürMünchenunddieRegion-PerspektiveMünchen,“ LandeshauptstadtMünchen,ReferatfürStadtplanungundBauordnung, München,2018.
35 Contact IvanBrkan 03682833 4.SemesterM.SC.Informatics LuisHobe 03726096 4.SemesterM.Sc.R.N.B AxelRasmussen 03690472 1.SemesterM.A.Architecture TaoSun 03697319 1.SemesterM.A.Architecture