THE
MOST IMPORTANT MAPS IN AMERICAN HISTORY
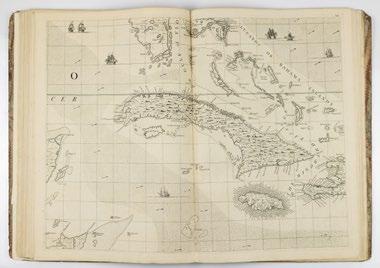
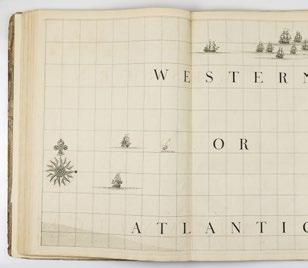
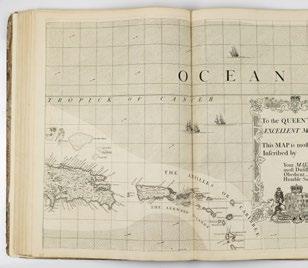
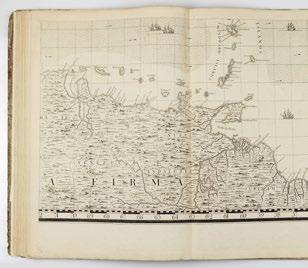
THE EARLIST OBTAINABLE DEPICTION
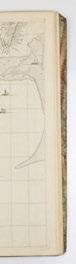
Johannes Ruysch. Universalior
DEPICTION OF THE NEW WORLD
Universalior Cogniti Orbis Tabula... 1508.
Johannes Ruysch (c. 1460-1533)
Universalior cogniti orbis tabula ex recentibus confecta observationibus
Engraved conical-projection map
1508, Rome (First edition, Shirley state 5/McGuirk 3-C)
Sheet size: 17 1/16” x 22 ¾”; Frame size: 30” x 35 ½”
$575,000
As exploration pushed European knowledge of the world east and south, cartographers built on the framework of Ptolemy (Claudius Ptolemaeus), a second-century philosopher living in Roman Alexandria in Egypt. In the Greek tradition (Ptolemy wrote in Greek, which was the administrative language of the Roman Empire in the Eastern Mediterranean), philosophy — the love of wisdom — bridged what we now divide into the humanities and the sciences; he was a mathematician, natural scientist and geographer-astronomer. No manuscripts of the (Geographical Guidance) survive from before the XIIIc, but some XIIIc examples survive with maps that bear some relation to those Ptolemy himself drew. Thus, with the exception of some excavated carved maps, Ptolemy is the source for ancient cartography as well as its culmination.
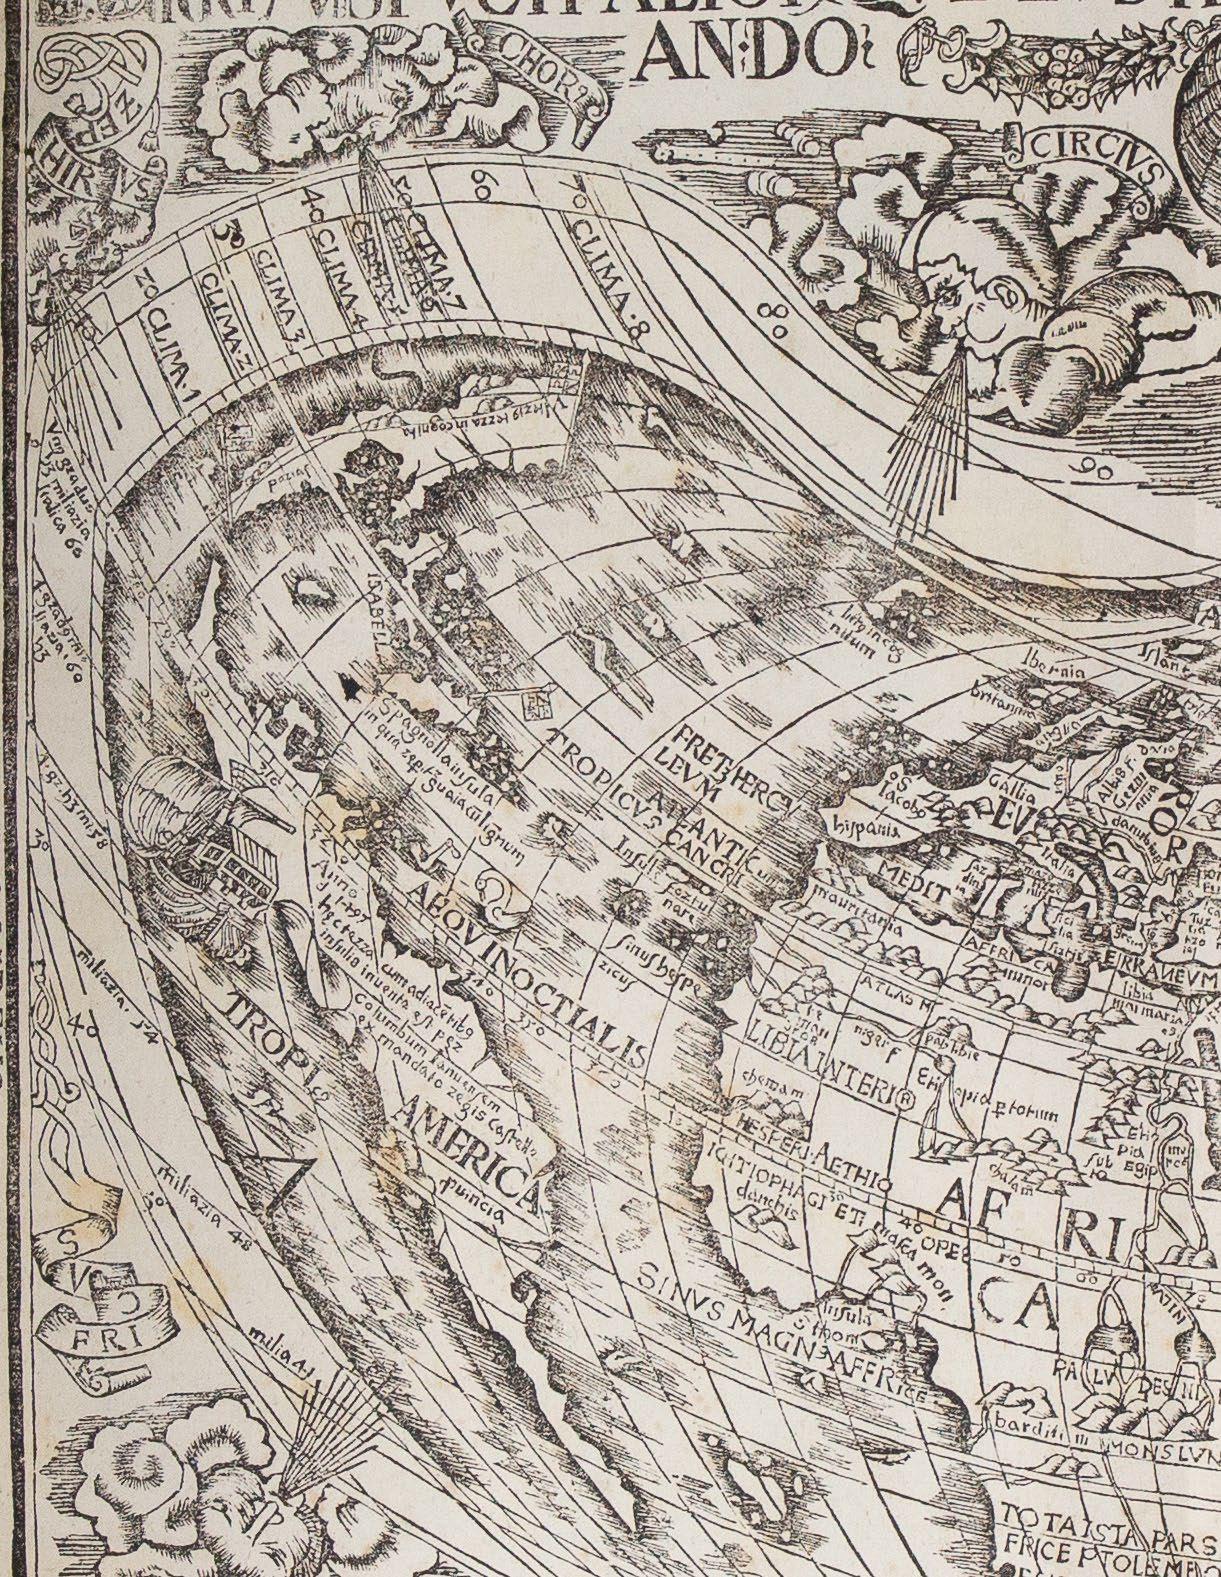
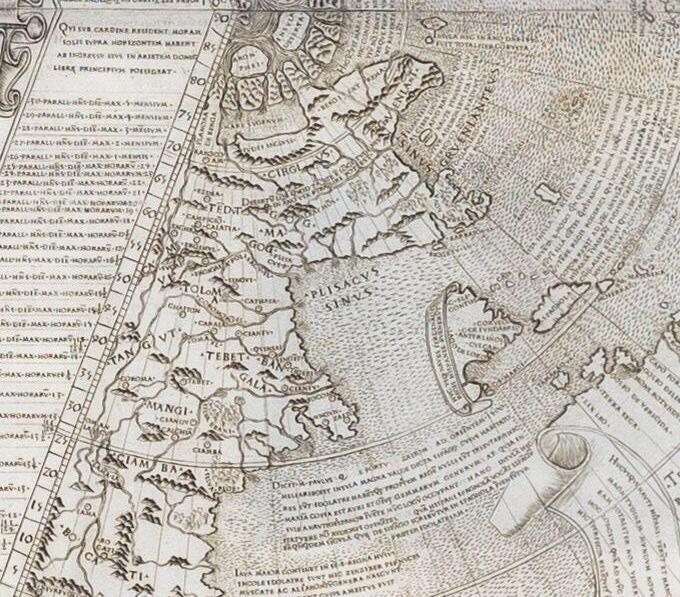
The discovery of the New World in the late XVc — Columbus assumed he had found the East Indies because of Ptolemy’s calculations and assertions about longitude — provoked a crisis in the understanding of the disposition of the globe; the Ptolemaic skeleton was showing signs of fracture. It is against this background that Johannes Ruysch (Johan(n) Ruijsch, ca. 1460–1533) made his coniform (cone or fan-shaped) projection. Ruysch was a profoundly cosmopolitan figure; he was Flemish or German or Netherlandish by birth, lived in Cologne, Rome, England and finally Portugal. From England, it is claimed, he himself sailed west as far as the American coast; thus he is the first mapmaker to have traveled to America.
Due, perhaps, to his first-hand knowledge of the contradictions entailed by a New World adjoining Ptolemy’s, Ruysch was visionary in his solutions. (The title translates to “a more universal illustration of the known world made out of new observations;” the comparative makes clear Ruysch’s competitiveness.) Newfoundland adjoins Tibet. Japan (Zipangu) is identified with Spagnola (modern Haiti and the Dominican Republic), although Ruysch is fairly agnostic in his reasoning. In other ways, however, his map is cutting-edge in its modelling of Asia —here the triangular form of India appears for the first time — and the Caribbean, largely drawing on Portuguese sources.
The map’s date is sometimes given as 1507, and indeed it does appear in some examples of the 1507 Rome edition of Ptolemy (colophon 8 September 1507); the vast majority, however, appear in 1508 editions, which have the addition of a commentary of Marcus of Benevento (Marcus Beneventanus) based on the findings depicted in this map. The tacit suggestion of most bibliographies is that the map was not completed until very late 1507 or early 1508, and its inclusion in 1507 editions is the work of owners rather than the publisher.
Although the 1506 map of Contarini/Rosselli and the 1507 Waldseemüller are earlier (excluding manuscript maps), each survives in a single example. The Ruysch map is thus the earliest obtainable depiction of the New World. McGuirk’s 1989 census counted 64 examples, of which 14 were in private collections (plus one on the market in 1986). He also determines that about two-thirds of the maps examined were Shirley’s state 5 (his 3-C). McGuirk estimates that 100 examples of the map survive, of which perhaps 25 are in private hands.
The present example was acquired from the Clements Library at the University of Michigan.
McGuirk, Donald L. “Ruysch World Map: Census and Commentary.” Imago Mundi 41 (1989) 133-141.
Peerlings, R.H.J., F. Laurentius and J. van den Bovenkamp. “The Watermarks in the Rome Editions of Ptolemy’s Cosmography and More.” Quaerendo 47 (2017) 307-327.
Burden 3 (p. xxiii); Harrisse 56; Sabin 66476 (Ptolemy); Shirley 25.
THE EARLIST OBTAINABLE MAP TO NAME THE
Peter Apianus. Tipus
THE NEWLY DISCOVERED CONTINENT “AMERICA”
Orbis Universalis... 1520.
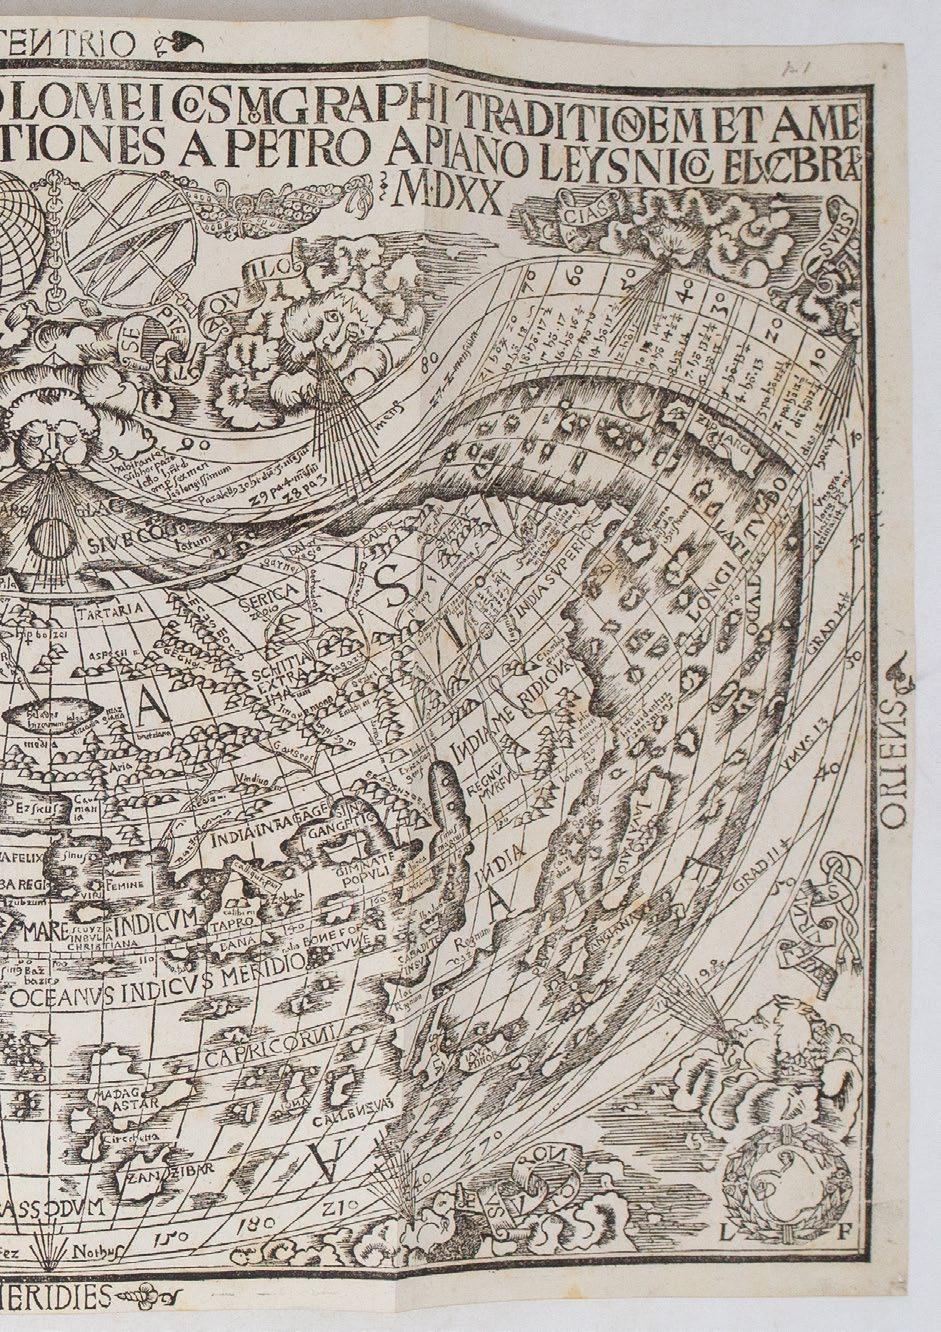
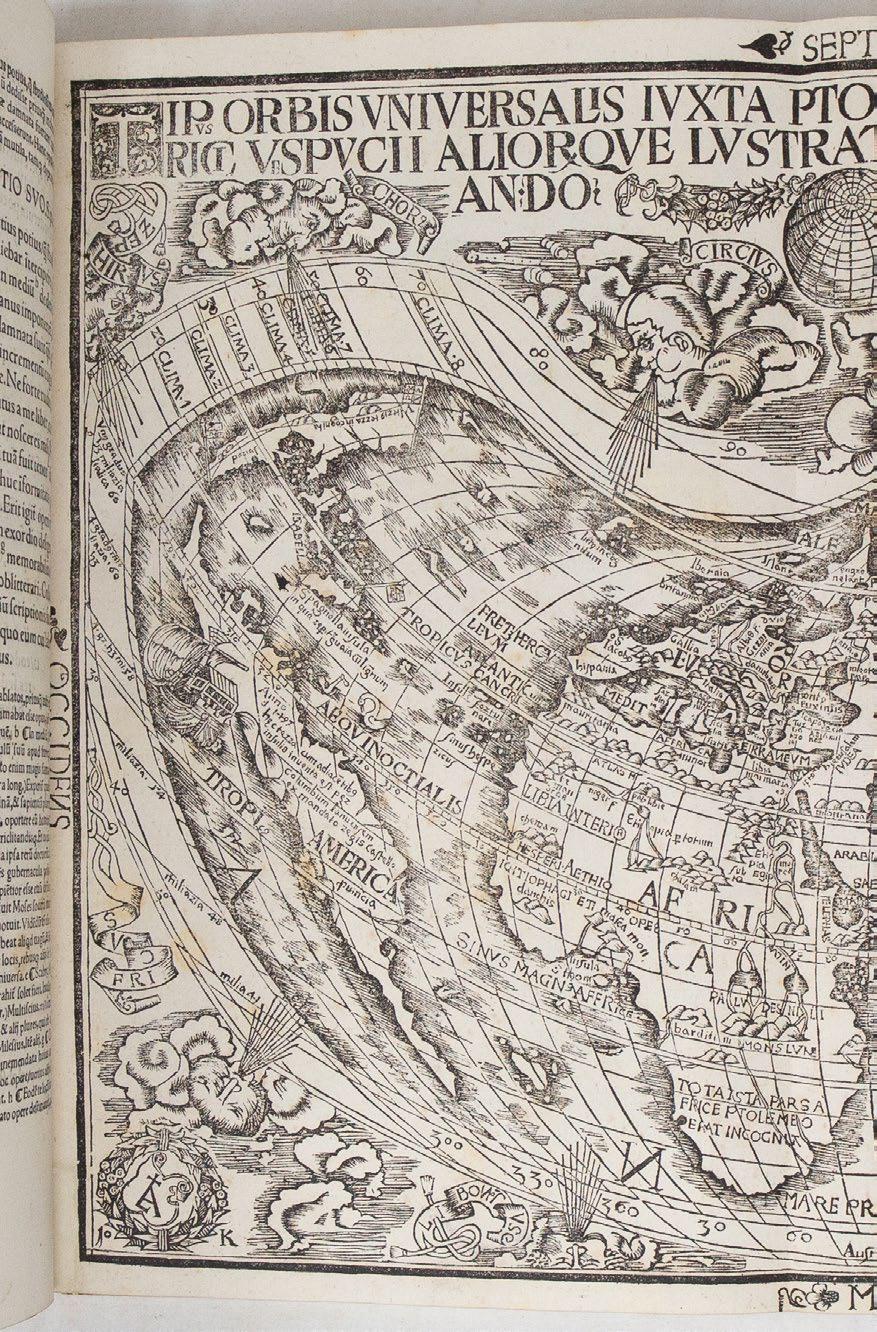
Peter Apianus (1495-1552) & Pomponius MELA (fl. AD 43).
Tipus orbis universalis iuxta Ptolemei cosmographi traditionem et Americi Vespucii aliorque lustrationes a Petro Apiano Leysnico elucbrat An. Do. MDXX.
Woodcut map
Sheet size: 12” x 16 3/4”
Bound in
Gaius Julius Solinus; ed. Joannes Camers (Giovanni Ricuzzi)
Ioannis Camertis minoritani, artium, et sacrae theologiae doctoris, in C. Iulii Solini [POLYHISTORA] enarrationes. Additus eiusdem Camertis Index, tum literarum ordine, tum rerum notabilu[m] copia, perco[m]modus Studiosis
Published by Johann Singriener for Lucas Alantse, Vienna, 1520. Folio in 6s (12” x 8 1/8”, 305mm x 207mm).Bound by Bedford (signed at the upper edge of the verso of the first free end-paper)in mirror calf. On the boards, a triple gilt fillet border. On the spine, six raised bands with a dashed gilt roll. Panels gilt. Author and title gilt to brown morocco in the second panel, imprint gilt to brown morocco in the third. Gilt strokes to the head- and tail-pieces. Double gilt fillets to the edges of the boards. Gilt inside dentelle. Marbled end-papers. All edges of the textblock gilt. Presented in a deep brown pull-off case made by Sangorski and Sutcliffe. Evidently cleaned and pressed. Lacking final blank (cc4). Some bumping to the fore-corners, with the front hinge starting. A little foxing to the map. Superb margins all-round.
With the bookplates of Huth and of Mendel on the front paste-down. Inkstamp of the “PUBBLICA LIBRERIA DI PAD.” to the title-page. Deaccession inkstamp of the Lilly Library at Indiana University, dated in pencil “2 Nov 1962” to the blank following the text’s colophon (F4v).
$275,000
THE PADUA—HUTH—MENDEL—LILLY EXAMPLE
The practice of inserting world maps in geoegraphical texts flourished in the early sixteenth century, in many cases being one of the few ways that these rare maps have survived down the years. Apianus’s striking truncated cordiform projection of the world is derived from Waldseemuller’s monumental 1507 wall map and first appeared in the 1520 Viennese edition of Solinus’s Polyhistor. The map is also sometimes found in Mela’s De situ orbis (Basel, 1522), and copies were probably also sold separately.
The lengthy title acknowledges the discoveries of Amerigo Vespucci, and two wreaths set in the lower corners recognize with monograms Apianus’s collaborators: “L. F.” for Laurent Fries, a draughtsman, woodcutter, and significant mapmaker in his own right; “J. K.” for Johann Kamers (Johannes Camertius), the publisher; and “L. A.” for Luca Alantses, who paid for the production of the map. The title translates as “Delineation of the entire world prepared according to the teaching of Ptolemy the cosmographer, and the voyages of Americus Vespuccius and others by Peter Apian of Leissig.”
By 1520 Apianus had gathered information from the most advanced maps yet produced in Europe, including the 1507 Martin Waldseemuller wall map (subsequently lost for almost 400 years) and perhaps the globes of Johan Schoner (ca. 1515). Apianus collected cartographical knowledge and refined these maps to produce a cordiform (heart-shaped) world map with the land mass of the New World labeled America. This map later appeared in various forms in Apianus’ famous and widely-circulated published works. Thus, for almost four hundred years, this 1520 world map was known as the source of the cartographic term “America” coined after the great explorer Amerigo Vespucci. In addition to the dramatic popularization of the term America, the map is significant as one of a handful of maps and gores from this early period to present the American continents as separate from Asia. In gauging the significance of this map, it is interesting to note that in an appendix to Ptolemy’s Atlas with additions by Waldseemuller in 1513, although the land mass of the Americas is represented, the term America was not used. Soon, however, Apianus was to popularize the term America in the present map and then in his influential Cosmographies.
Peter Apianus (1495- 1522), also known as Peter Apian was a mapmaker at the emergence of modern cartography. He was and a bridge from older traditions to modern cartography. His work always pays due reference to one of the earliest known mapmakers, Claudius Ptolemy (c127-c145) who worked in the great Library of Alexandria, building up geographical data of the then known world. His work was transmitted to the Renaissance in Europe via the Arab world. A world map bases on his observations first appeared in Vicenza in 1475. Other editions soon appeared all over Europe.
This map by Apian uses a cordiform, or heart shaped, projection. It also includes material on the New World obviously unknown to Ptolemy. The voyages of Vespucci referred to in the map refer to letters from Vespucci claiming the discovery of America a year before Columbus. The letter were forgeries, probably made in Florence to show how the Florentine Vespucci outdid the Genoaan Columbus. Despite the forgery, the name lived on. A heart-shaped map, drawing on an ancient geographer and a set of forged letters. It contains all the murkiness of the very early maps with the promise of the modern. The fact that Vespucci’s claims are an early example of “fake news” only adds to the modern character of this map.”
Gaius Julius Solinus wrote his treatise De mirabilibus mundi (On the wonders of the world) -also called the Polyhistor (“very learned”), as here -- in the first half of the third century of the current era. Although it draws on the work of Pliny and Pomponius Mela, it sets its observations on customs and peoples in a firmer chorographical-cartographical framework. Its editio princeps (1473) was before the discovery of the New World, and so its awareness of the world was surpassed only east- and southward. Over time, the Polyhistor along with the work of Pomponius Mela and Ptolemy became the framework for modern atlases. The present work is not (only) the Polyhistor but the commentary (enarrationes) of Johannes Camers, the Franciscan (Friar Minor, per the title) humanist. Laid out in the traditional manner of a manuscript commentary, the text unfurls from the spine and is ringed on three sides by notes on the text. The text and commentary are followed by Camers’s index of locations, which is indeed “perco[m]modus Studiosis,” very convenient for scholars.
Church 45. Sabin 86390; Shirley 45; Harrisse, The Discovery of North America 126; Harrisse, Bibliotheca Americana Vetustissima 108.
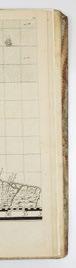
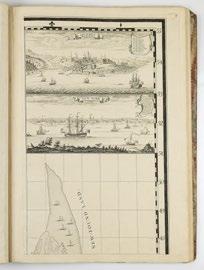
THE EARLIEST PRINTED MAP DEVOTED TO
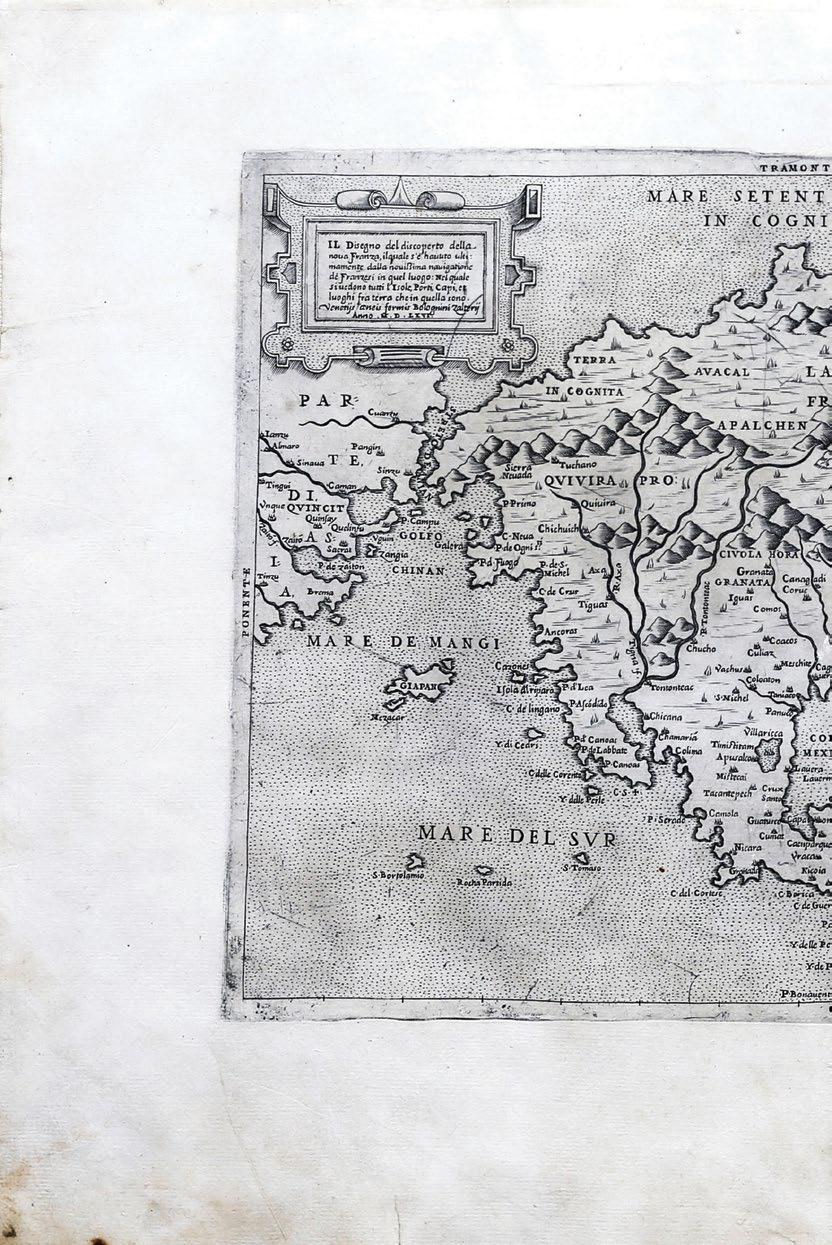
Paolo Forlani. Il Disegno Del Discoperto
TO THE CONTINENT OF NORTH AMERICA
Discoperto Della Nova Franza. 1566.
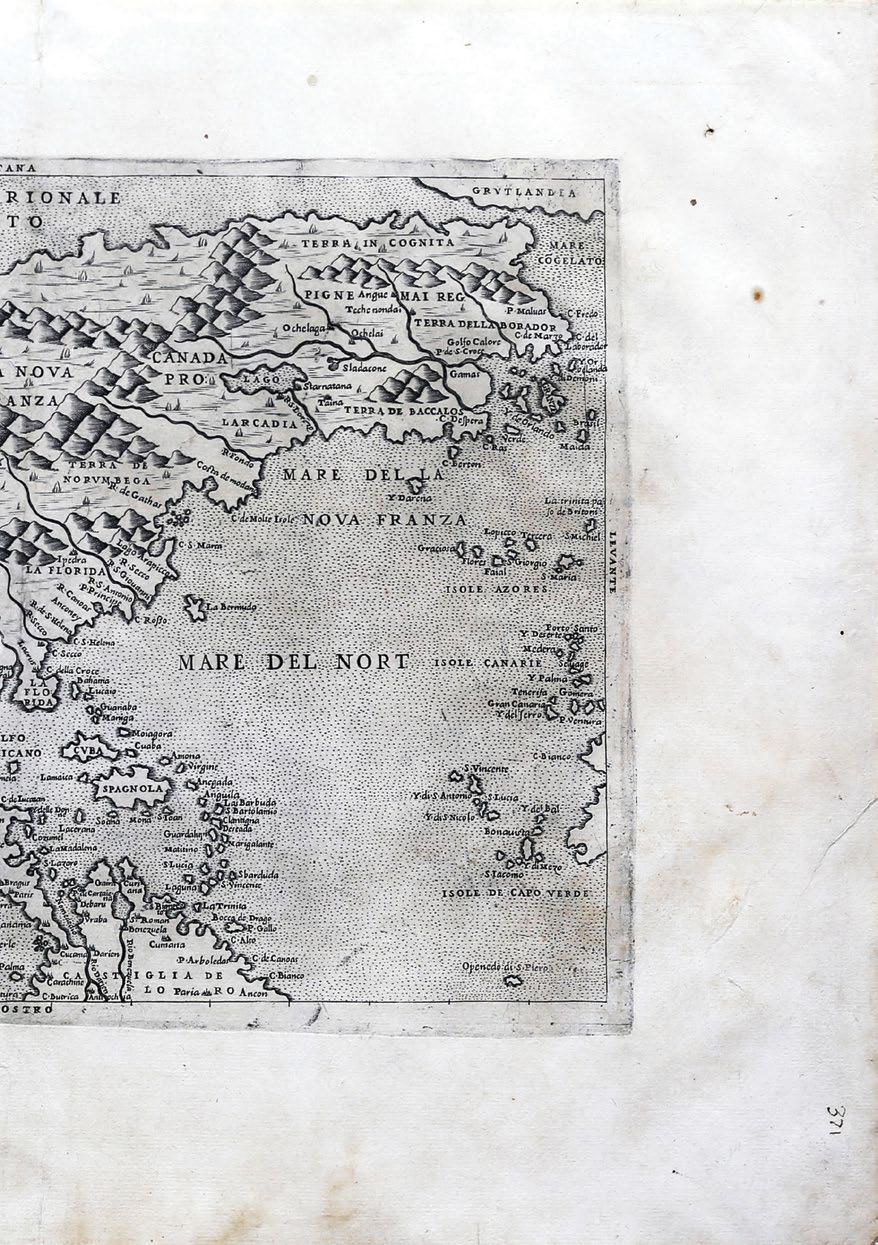
Paolo Forlani (fl. 1560-1571)
Il Disegno Del Discoperto Della Nova Franza, il quale s’e hauuto ultimamente dalla nouissima nauigatione de»»Franzesi in quel luogo.
Engraved map. Rich, dark impression with perfect paper patina. Venice: Bolognino Zaltieri, 1566
Sheet size: 16” x 22”; Frame size: 21 1/2” x 27”
$275,000
THE EARLIEST PRINTED MAP DEVOTED TO THE NORTH AMERICAN CONTINENT, AND THE FIRST TO SHOW THE STRAIT OF ANIAN.
In the sixteenth century Venice was the mecca of publishing. Many important mapmakers were working out of the floating city and all employed the distinctive style of small copper plate engravings. These mapmakers included Giacomo Gastadi (1500-1565), Bolognino Zaltieri (15551576) and Paolo Forlani, who flourished between 1560 and 1571. They drew on each other’s work and ideas to produce world maps and maps of the New World. Forlani’s map similary culminates all European knowledge on the New France that was available at the time. The Spanish territories in the Caribbean and Central America, and French claims along the St Lawrence are better known than the vast interior of New France. Illustrated is a New World only at the dawn of discovery and colonizaton. The vast interior still remains something of a mystery. The world has yet to be fully comprehended: the lonely island of Japan, here as “Giapan” sits in the middle of the Pacific yet to be fully integrated into an accurate world view.
The modest dimensions of Paolo Forlani’s rare and finely engraved map of North America belie its signal importance in the history of New World cartography. It is the earliest printed map devoted solely to North America, the first to portray that landmass as a separate continent and the first to show the so-called Strait of Anian separating America from Asia at the approximate location of the Bering Strait (in a purely coincidental instance of early geographical myth dovetailing with the discoveries of later exploration). The first depictions of the American continent appeared on early world maps as the eastern component of the Asian land mass” (Cohen). Entitled “The Drawing of the Discovery of New France, recently derived from the Newest Voyage of the French in that Region” Forlani based his rendering largely on the western part of a world map published by his colleague, the great Venetian cartographer Giacomo Gastaldi, several years before. Gastaldi had been the first to formulate the concept of the Strait of Anian, a name that probably originated with Ania, a Chinese province mentioned in a 1559 edition of Marco Polo’s travels. Forlani’s early graphic depiction of Gastaldi’s mistaken theory, which persisted well into the eighteenth century, makes this map a cornerstone work in the mapping of America.
In the early 1560s, Forlani also published a map of South America and the West Indies, “La descrittione de tutto il Peru’, and with this 1565 map of North America he completed his coverage of the New World. The map stretches from Greenland down the coast of Canada and the Atlantic Seaboard to the West Indies, including a corner of South America, and from the coast of China in
the west to the Azores and Cape Verde in the east. It is the first map to portray North America as a continent separate from Asia, and the first to show the Strait of Anian (the Bering Strait), depicted as flowing between the Mare Setentrionale in Cognito (north of the North American continent) and the Golfo Chinan (west of the continent). The concept of a strait separating America from Asia was first proposed only four years earlier by Giacomo Gastaldi in his pamphlet “La Universale Descrittione del Mondo” (Venice, 1562).
The map also includes French names, such as Lacardia and Canada, as well as Spanish names, including Florida, and the first ever mention of the Sierra Nevada (snowy mountains). Quivira is shown as an Indian Tribe in south-central Kansas, reached by Francisco Vasquez de Coronado in 1541. Quivira was the name of the mythical kingdom of gold sought by Coronado, but became the Spanish word for Wichita, the Indian tribe that Coronado found instead of gold.
Until fairly recently, the map was attributed to Venetian publisher Bolognino Zaltieri, whose name and imprint appear on the second state, published in 1566, as here. As David Woodward has demonstrated, however, authorship should be ascribed to Forlani, who sold some copperplatesincluding, presumably, the one used to print this map - to Zaltieri sometime around late 1565 or early 1566. Zaltieri then altered the plate, adding his own name, and proceeded to issue his own examples of the map, in a practice of appropriation (or licit plagiarism) that was quite common in the fluid world of Venetian map publishing. Following in the footsteps of his great colleague Giacomo Gastaldi, Paolo Forlani was a Venetian engraver and publisher of many significant maps and charts in the period of the Renaissance. It was in Italy, and particularly in Venice, that the map trade, which was to influence profoundly the course of cartographic history, was most highly developed during the first half of the 16th century. Venice was the most active port in the world, and successful trading expeditions necessitated accurate maps. In the 15th century the city had already become a clearing-house for geographical information, and the development of cartography in the city was further impelled by the accomplishment of Venetian printers and engravers. Forlani was perhaps the most prolific producer of maps in the mid-16th century, and largely responsible for diffusing advanced geographical information to other parts of Europe.
(Ashley Bayntun-Williams, “The Lafreri School of Italian Mapmakers circa 1544 -1602” online). Cohen, “Mapping of the West”, pages 29-30. R.V. Tooley, “Maps in Italian Atlases of the Sixteenth Century,” Imago Mundi 3 (1939), n. 80; Lloyd Arnold Brown, The World Encompassed, exh. cat. (Baltimore, 1952), n. 207; David Woodward, “The Forlani Map of North America,” Imago Mundi 46 (1994): 29-40; Philip D. Burden, The Mapping of North America: A List of Printed Maps 1511-1670 (Rickmansworth, 1996), 41.” Plate 30 in Schwartz / Ehrenberg “The Mapping of America”.
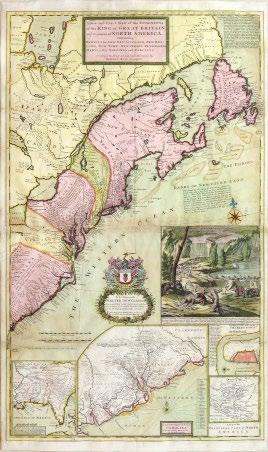
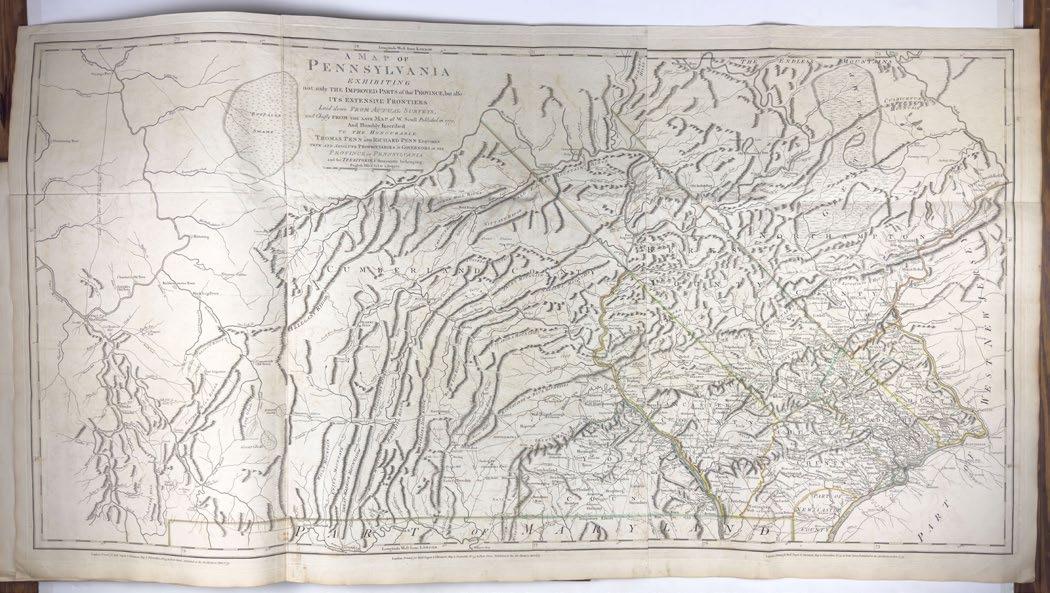
First map of the American Colonies under the First Hanoverian King — King George I (r. 1714-1727) —
The Hanoverian line has ruled to the Present Day
Herman Moll (1654-1732)
[Beaver Map] A New and Exact Map of the Dominions of the King of Great Britain on ye Continent of North America...
Engraved map with original hand color
Sold By H. Moll over against Deverux Court on the Strand, London, 1715
First Edition, First Issue
Sheet size: 42” x 25” ; Frame size: 49” x 31”
$42,000
THE FINEST ORIGINAL COLOR AVAILABLE IN A MAP OF COLONIAL NORTH AMERICA
Handsome example of the famous “Beaver Map,” Moll’s most celebrated effort as it documents the ongoing dispute between Great Britain and France over the boundaries separating their colonies in America.
The map explains the postal routes throughout the British territories and is generally thought to be the first postal map of the colonies. The striking beaver inset serves to not only symbolize the Puritan industriousness needed to settle in America, but also the lucrative fur trade spreading wealth and opportunity among the colonies. Plate 78 in Schwartz / Ehrenberg “The Mapping of America”.
“One of the first and most important cartographic documents relating to the ongoing dispute between France and Great Britain over boundaries separating their respective American colonies...The map was the primary exponent of the British position during the period immediately following the Treaty of Utrecht in 1713” (Degrees of Latitude). The British colonies according to British claims are outlined in red, with the French very lightly outlined in blue. All territory south of the St. Lawrence River and eastern Great Lakes is shown as British. Numerous notations relating to territorial claims, Indian tribes, the fur trade, and the condition of the land cover the face of the map. This map shows the early eighteenth century postal routes in the British colonies, and is frequently called the first American postal map.
There are four insets, including a large map of coastal South Carolina, and a plan of Charleston. At lower left is a map of Florida and the Deep South, which is based on a map by Thomas Nairne, the Indian agent for South Carolina. The most striking feature is the large vignette which gives the map it’s popular name. It consists of an early view of Niagara Falls, with a colony of beavers at work in the foreground. Pritchard holds that the beaver “was an appropriate image for the North American map for two reasons: the animal’s importance to the fur trade, and its industrious nature.” (Cumming, British Maps 6-12)
THE FIRST MAP TO SHOW THE
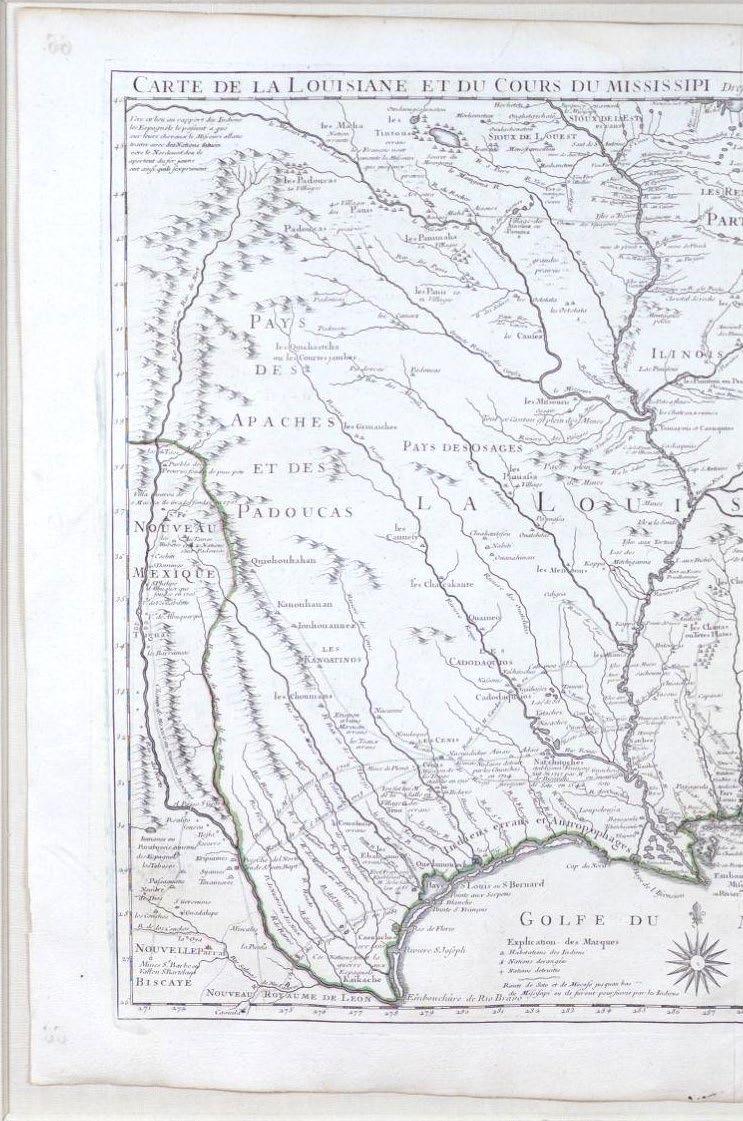
Guillaume de L’Isle. Carte Du Louisiane
THE NAME TEXAS (TEIJAS)
Louisiane et Cours du Mississippi... 1718
Guillaume
De L’Isle (1675-1726)
Carte du Louisiane et du Cours du Mississippi Dressee sur un grand nombre de mémoires entrautres sur ceux de mr le Maire Par Guillaume Del’Isle...1718
Copper plate engraving with original outline color
First edition, first impression Paris, 1718
Sheet size: 21 1/2” x 29”; Frame size: 32 7/8” x 40 3/8”
$35,000
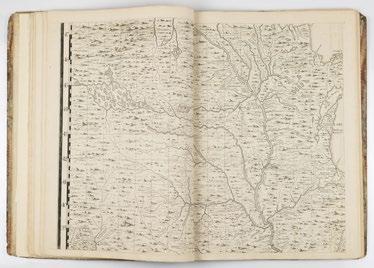
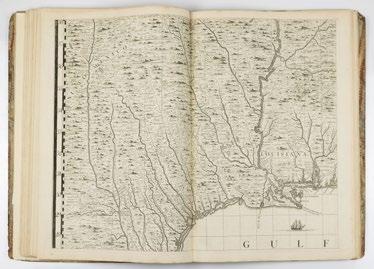
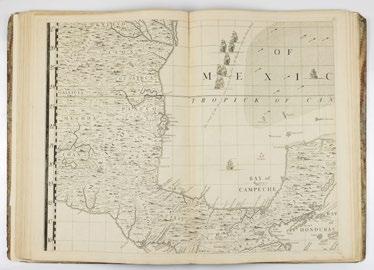
Louisiana at its greatest extent: De L’Isle’s map displayed the breadth of French ambition in North America while making a giant leap in accuracy.
France in 1718 was gripped by a fever of speculation in the stock of the Company of the West. It was also adapting to the consequences of the Treaties of Utrecht, which ended the War of the Spanish Succession. Those treaties had several effects in North America, none of them positive for France. It lost properties in the northeast part of Canada to the English, including Newfoundland and the Hudson Bay. But perhaps more importantly, the treaties recognized British sovereignty over the Iroquois, the most powerful native tribe east of the Mississippi, and they granted the English the right to trade with tribes in the interior of the continent.
Despite these developments, the French government continued to express optimism about its domination of North America. This was motivated in part by the ongoing geopolitical competition among the European powers, and also by the need to support the stock price of the Mississippi Company. As geographer to the King and also, by this time, an actual pensioner of the government, De L’Isle was in a perfect position to make the government’s case. He did so with what was to become one of the most influential maps in American history.
De L’Isle’s 1718 map of the course of the Mississippi graphically represented the maximum extent of French territorial ambitions in North America. De L’Isle omited the newly lost properties in Canada, and also the extensive Spanish claims to the west of the Rocky Mountains. The resulting map, with pleasing symmetry, centers on the Mississippi River and its multitude of tributaries. De L’Isle extended those tributaries indefinitely to the west, and almost to New England in the east. Never had La Salle’s claims had more impact than as shown on this map, but De L’Isle bolstered the hydrological argument with historical ones. Old forts, the routes of French explorers, French names given to rivers and other features, even a notation suggesting that the Carolinas were named for Charles IX - all lent credence to the map’s argument. The interests of France’s competitors were greatly diminished. English colonies were compressed into a small area north of the Carolinas and east of the Allegheny Mountains. Spanish claims were pushed to the West of current Texas and far south of modern New Mexico. In De L’Isle’s map, North America was almost completely French.
The map also advertised the riches that would likely come from the development of French lands in the continent. Numerous mines were noted, which for Europeans drew immediate parallels with Spain’s fabulously lucrative conquests in the south. Significant native populations would lead French readers to assume a steady supply of labor would be available in the new land. Where the tribes had expressed a conflict with other European powers, they were specifically identified.
Curiously, the first state of the map as here omitted New Orleans. That city was formally established in the year of the map’s publication, and the capital of French Louisiana was relocated there from Mobile the same year. De L’Isle promptly corrected his oversight, issuing a second state of the map with New Orleans added.
The map satisfied both the geopolitical desires of De L’Isle’s patrons and the enthusiasm of the company’s directors and investors. It was also the most accurate map of North America made up to that time. Modern studies, for example, place the cities along the eastern seaboard on the map no more than 27 miles from their actual locations. In one important respect, however, the map erred: the Mississippi River is placed about 100 miles too far west. This error had repercussions for generations to come.
Guillaume De L’Isle (1675-1726) ranks among the great cartographers in European history, as one of the leading contributors to the shift of cartography from its historical and religious roots to a new form based on science. He was famous for incorporating astronomical data into his maps, based in part on his relationship with early scientists like Giovanni Domenico Cassini. His maps set new standards of accuracy for latitude, and his explorations of longitude based on the position of Jupiter’s moons made him much imitated by his peers.
De L’Isle was also closely connected with the French royal court, having been named by Louis XIV as one of his Royal Geographers. He also counted among his patrons Louis Phelypeaux de Pontchartrain and his nephew the Comte de Maurepas, who were instrumental in asserting French claims in North America designed to restrict English and Spanish expansion there. Those relationships had a powerful effect on De L’Isle’s cartography, which in turn influenced historic events on both sides of the Atlantic.
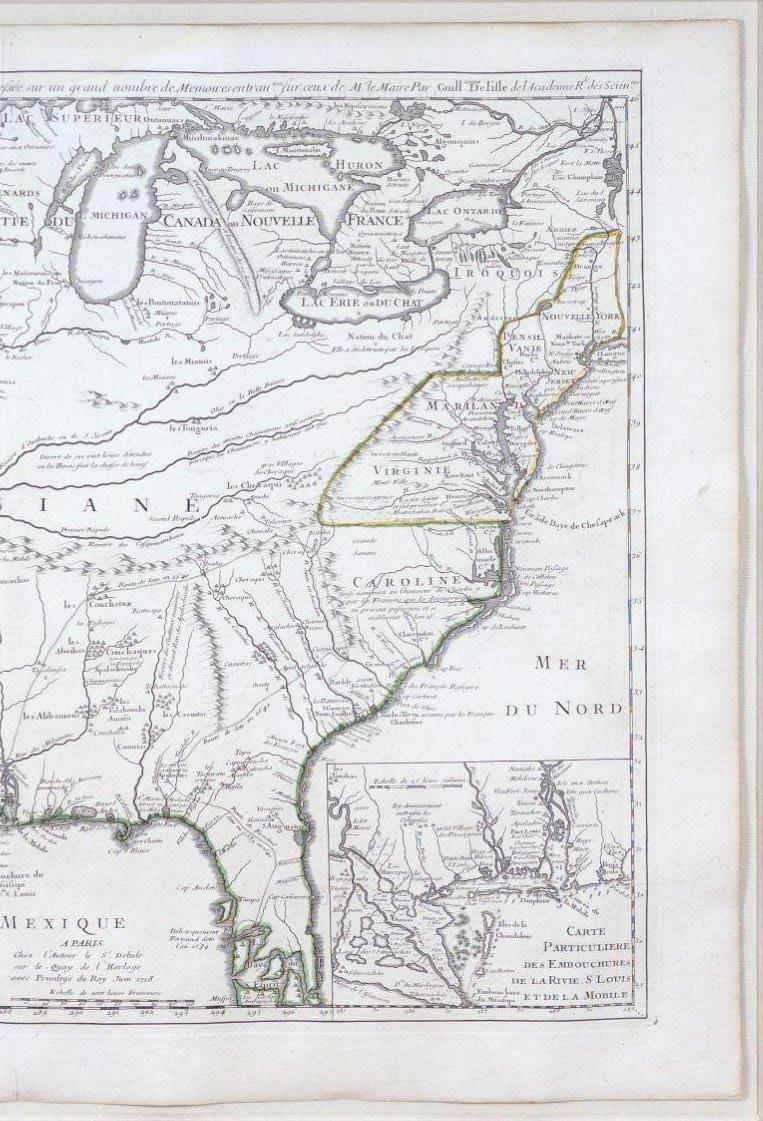
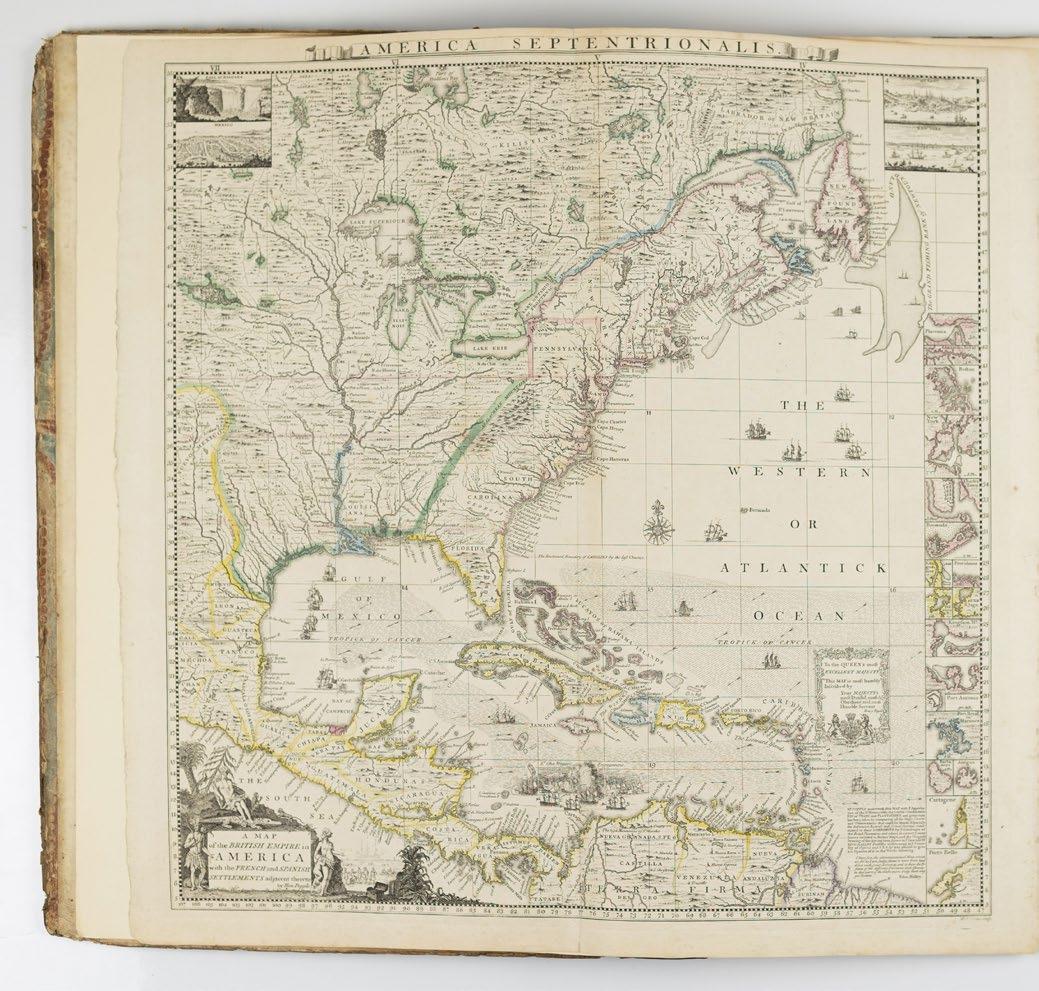
THE FIRST LARGE-SCALE PRINTED MAP
Henry Popple. Map of the British
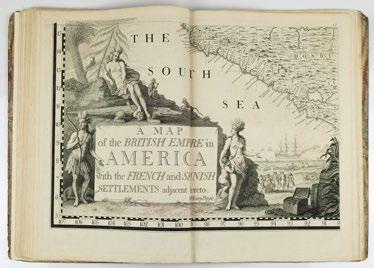
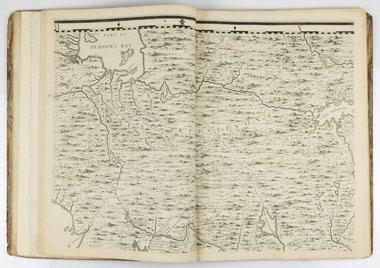
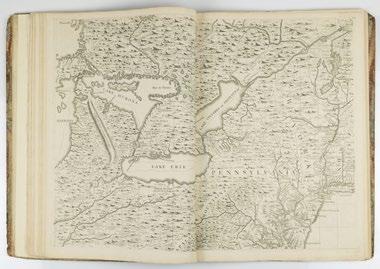
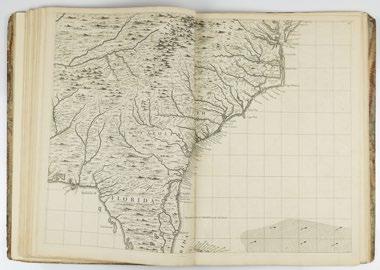
MAP OF COLONIAL NORTH AMERICA
British Empire in America... 1733
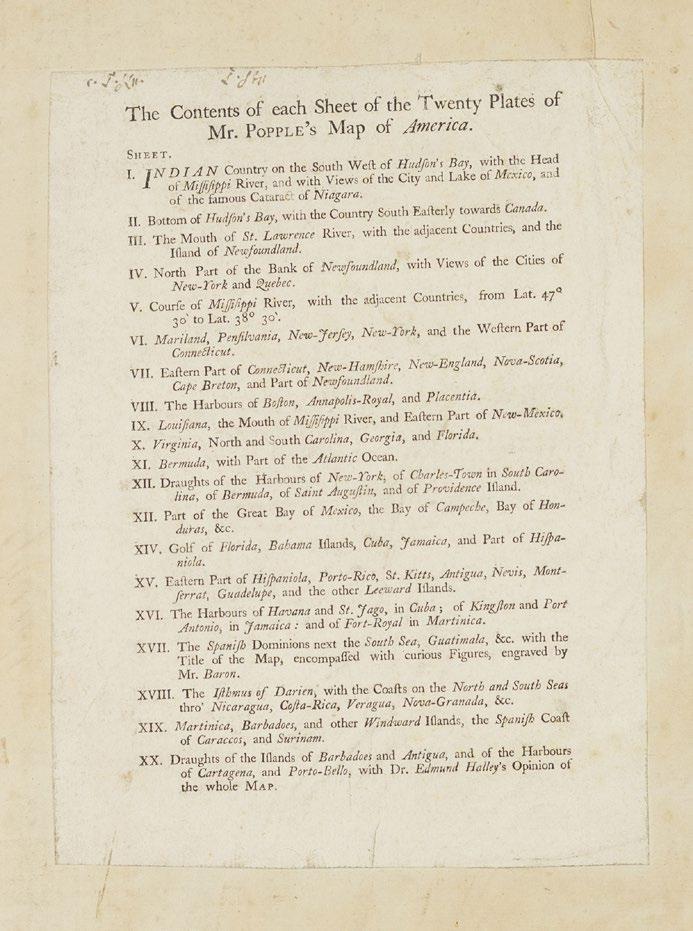
Henry Popple (d. 1743)
Map of the British Empire in America with the French and Spanish Settle- ments adjacent Thereto.
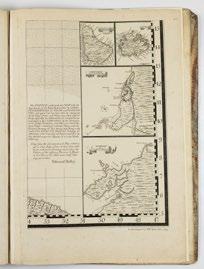
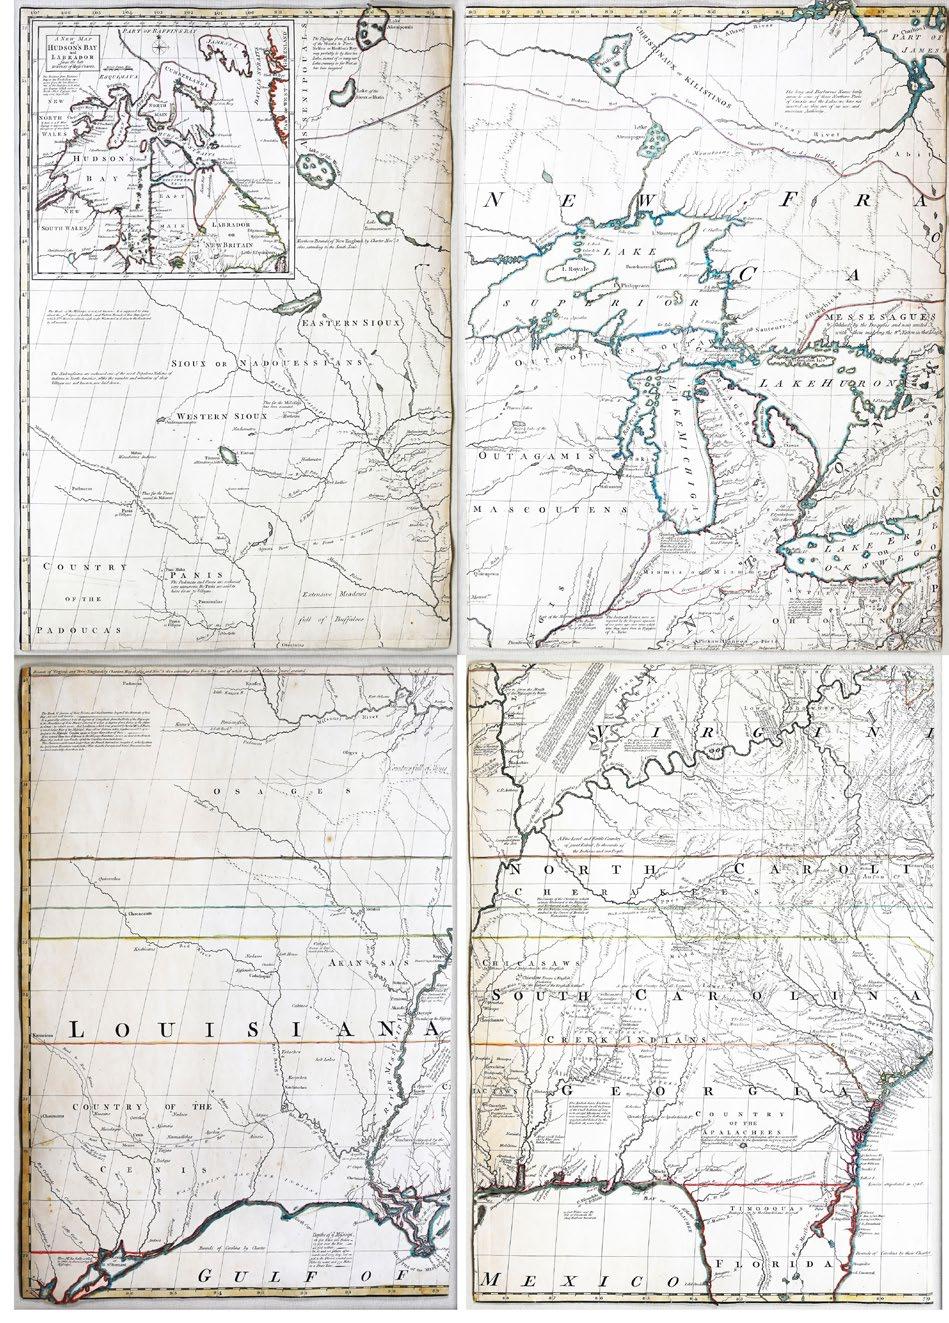
Folio. Original RARE letterpress contents leaf (Babinski State 1, with incorrect enumeration of sheet 13 as XII) laid-down on the front paste-down. Fine engraved double-page “key” map with original hand-colour in outline and mounted on guard (to neat line: 19 6/8” x 19 1/8”; Brabinski State 1, circa 1734/35), 15 exceptionally fine engraved double page and 5 single page sheet maps by William Henry Toms. Modern quarter calf over contemporary marbled boards (extremities worn, surface tears and stains). Babinski’s State 6 circa 1735, still sold by Henry Popple (Babinski, p.11) with engraved sheet numbers added in the upper right corners of each sheet distinguishing it from the preceding State 5; also lacking, as called for, the Toms & Harding proprietors imprint with detailed pricing below the bottom border on sheet 17.
$165,000
With Rare Letterpress Contents Leaf
Henry Popple’s Map of the British Empire in America marks the beginning of a new epoch in the mapping of America, and was the first in a series of maps published up to the 1760s that would catapult England to the forefront in the study of the geography of the continent. Commissioned by the Lord Commissioner of Trade and Plantation, it was intended as a tool for mediating disputes arising from the competing claims of English, French and Spanish colonists. In the years when this map was made, territorial disputes demanded current and precise geographical knowledge, and copies of Popple’s map were sent to the governors of each English colony for official use.
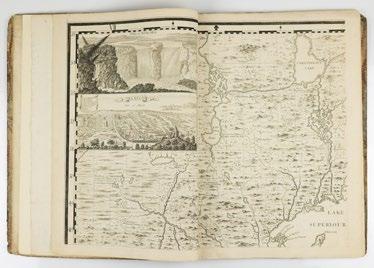
The map illustrates the growth of knowledge about the interior of the American Northeast, and there is much information regarding settlements and natives in the areas of the Great Lakes. Popple’s map is a compilation of French and English sources, primarily Guillaume De L’Isle’s Carte du Canada 1703 and Carte de la Louisiana et Cours du Mississippi 1718 (illustrated); , as well as the maps of Herman Moll (illustrated). The most valuable contribution is in the area of the American Southeast, where the map incorporates information from the highly important survey by Colonel John Barnwell, circa 1722, which was the first detailed English map of the southern frontier. Information for the printed map was compiled at least as early as 1727, a date that appears on a signed manuscript draft by Popple now in the British Museum, although the actual draftsman of the final map was Clement Lempriere, an English military cartographer who worked in the Corps of Engineers. Of the four inset views, two are of special note. The first, of New York City, is an early copy of William Burgis’s South Prospect of the Flourishing City of New York circa 1720. A second perspective view, of Quebec, is based on the manuscripts of Franquelin Joliet, which were previously published in French maps by De Fer and Châtelain. Seventeen detailed charts depict major islands and ports on the American coast and in the Caribbean. Boston, New York and Charleston are included, the latter based on the important inset to Edward Crisp’s map of 1711. Numerous legends note historical and topographical features, including the route of Spanish fleet through the Bahama Channel and a vignette depicting the engagement of Sir Charles Wagner against the Spanish off Cartagena.
Originally advertised for issue by subscription as early as 1731, Popple’s map was not published until December of 1733. made poor sales, largely because of the exorbitant price of 4 pounds and 4 shillings, and only 16 copies of this issue are located in institutions worldwide, as opposed to 35 copies of the later Toms and Harding issue of August 1739 with a cheaper price of 1 pound, 11 shillings and 6 pence, after which the contents leaf and the “key” map were altered. The “key” map was not available until after the earliest issues of the map, having been engraved as a direct response to the difficulties faced by clients in assembling the unnumbered sheets.
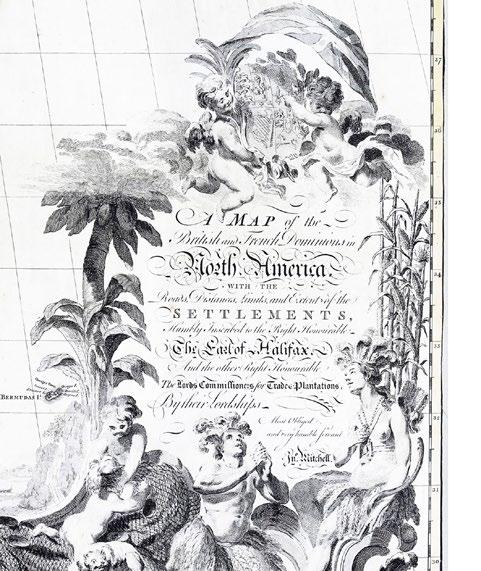
THE MOST IMPORTANT MAP
John Mitchell. A Map of the British and
MAP IN AMERICAN HISTORY
and French Dominions in North America... 1755
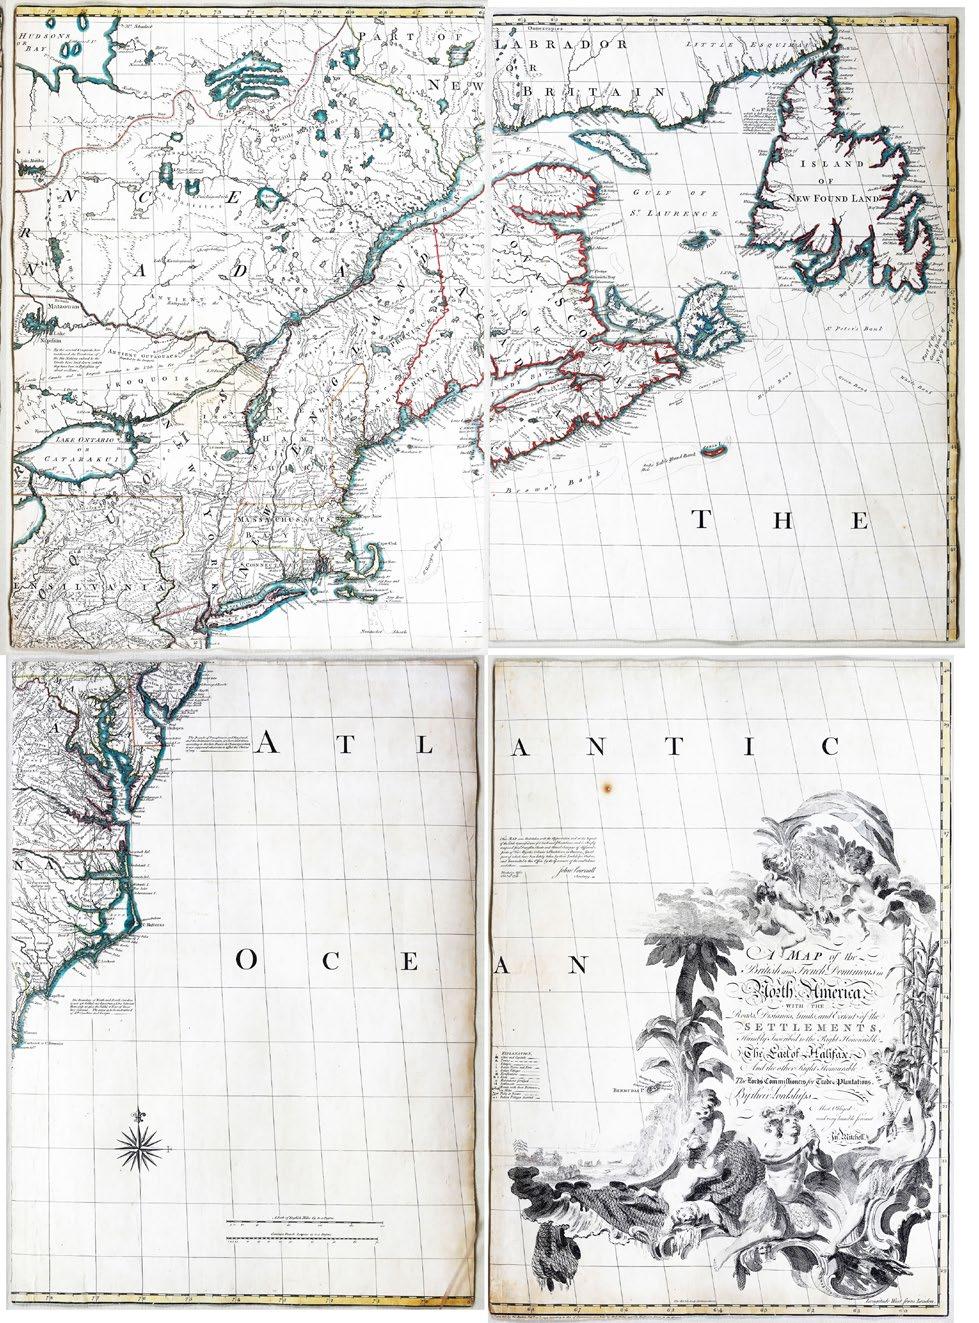
John Mitchell (1711-1768)
A Map of the British and French Dominions in North America...
Engraved map in 8 sheets with original color in outline
London: 1755 (First edition, first impression)
Sheet size: 26”x 18 ½” each; Frame size: 31”x 23” each
$750,000
THE VANISHINGLY RARE FIRST EDITION
A MONUMENTAL engraved map of North America, by Thomas Kitchen after Mitchell, the title within a magnificent asymmetrical allegorical cartouche lower right, with original hand colour in outline. VERY RARE FIRST EDITION, FIRST ISSUE, with the imprint reading ‘Publish’d by the Author Feb.ry 13th. 1755, and Sold by And: Miller opposite Katherine Street in the Strand’. The primary political treaty map in American history and regarded by many authorities as the most important map in the history of American cartography.
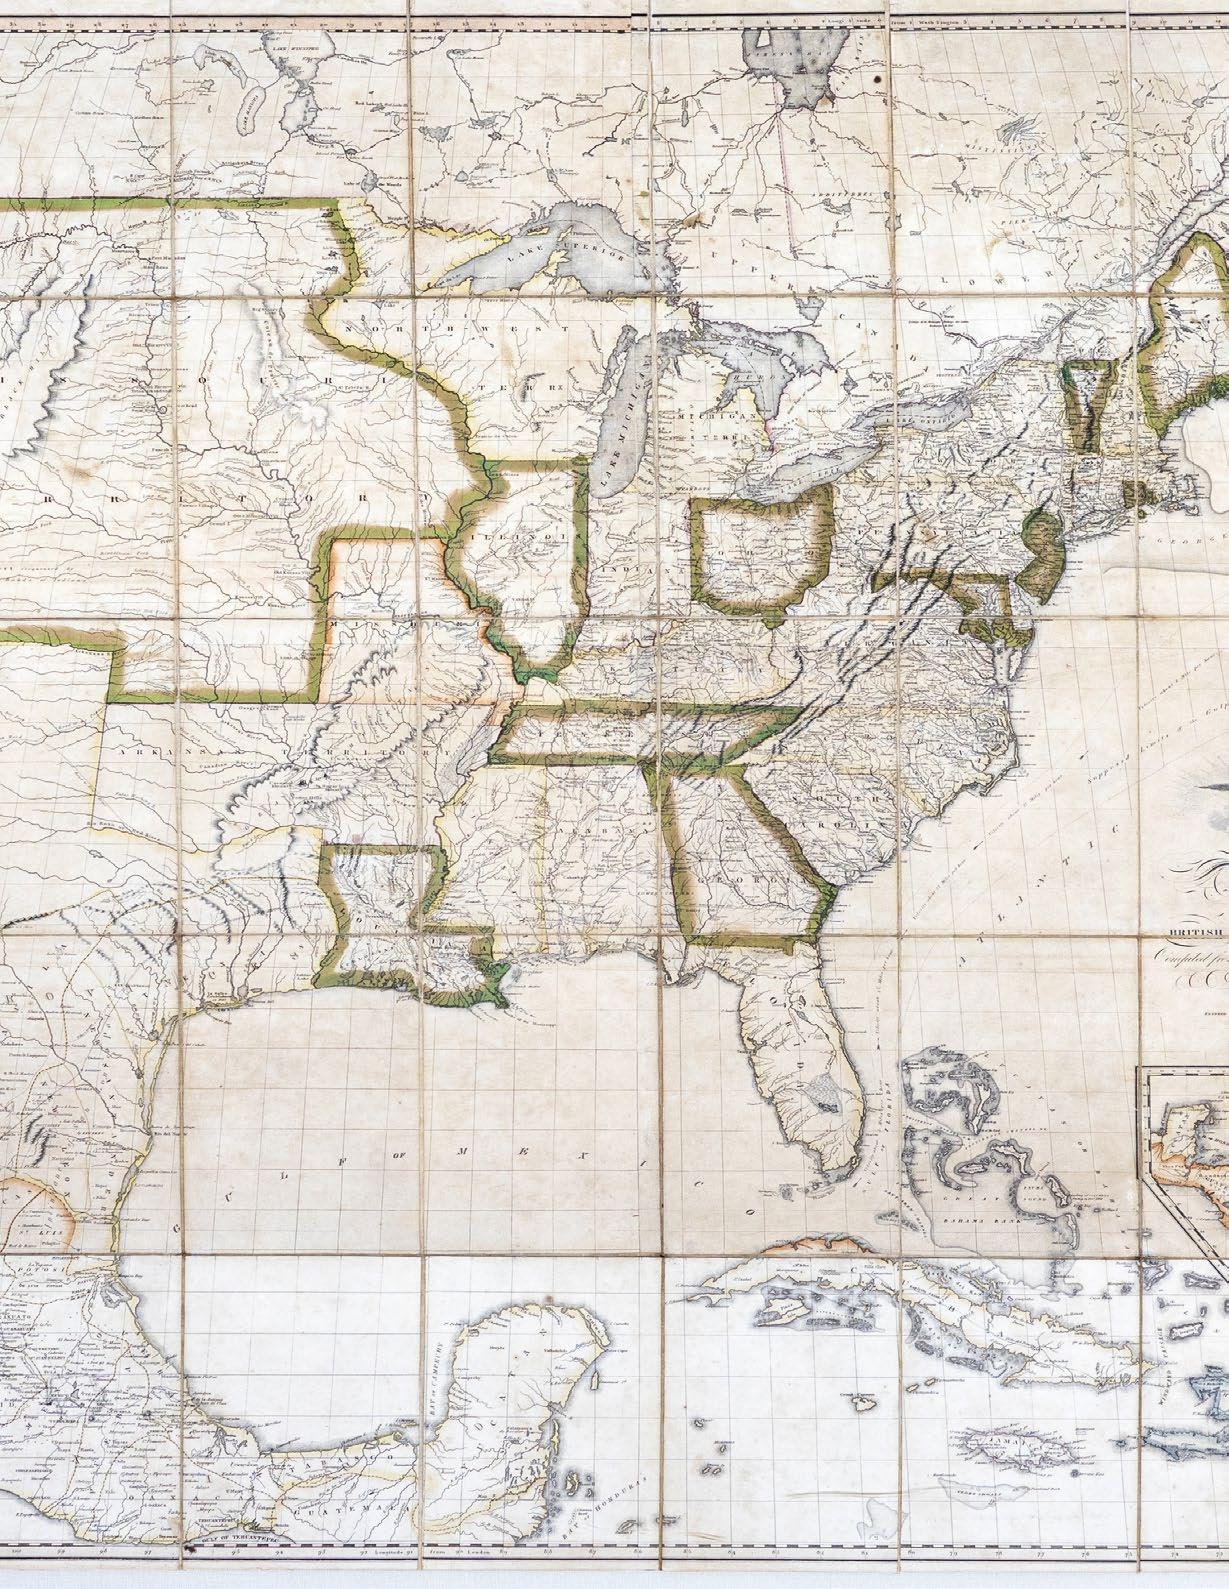
How often does a tool so fully meet its intended goal that it continues to be used for two centuries? The map of the eastern part of North America made by John Mitchell (1711–1768) is such a tool. In 1750 the president of the Board of trade, the second Earl of Halifax (to whom the map is dedicated), asked John Mitchell to prepare a map of British colonies in North America. Mitchell was a close friend of the second Earl of Halifax who was able to furnish Mitchell with the most accurate and up-to-date surveys that had been made of the terrain. He consulted every map he could; he wrote to Cadwallader Colden that “there are none I believe but what I have consulted.” This tremendous effort made all the difference, placing this map head-and-shoulders above others, even as cartographic knowledge advanced over the centuries. The map was first drawn in 1750 but corrected, improved and published in 1755. It had three aims: to be an accurate representation, to highlight the disposition and allegiance of the Native Americans who could be vital allies or enemies in the struggle with France and to promote British interests.
The enduring success of the map is all the more notable in view of its combativeness. Mitchell’s map was not neutral or nonpartisan; it was full-throatedly pro-English and anti-French. Borders were freely extended and transposed to maximize British territory. It would go to some 21 states (impressions and editions) by 1781, and was translated into Dutch, French and Italian. It was the third edition that lay before John Jay during the negotiations that led to the Treaty of Paris (1783; now in the New-York Historical Society). Over two centuries, it has been used settle issues in the British House of Commons, the Dutch Royal Court, the Supreme Court of Canada, and the Supreme Court of the United States. It is also known to have hung in the halls of Congress. The latest known use of the map is in the resolution of the 1980’s disagreement between the U.S. and Canada over fisheries in Maine.
The first impression (per Stephenson) is distinguished by the following points: “Miller” and “Katherine” for “Millar” and “Katharine” in the imprint, and “Leicester” twice: above and below the third S of “Massachussets” (the lower would be corrected to Worcester in the third impression). Of this first impression, only two further examples are known: in the Library of Congress (G3300 1755 .M5) and the British Library (K.Top.118.49.c.2; George III’s copy, donated to the nation by George IV).
John Mitchell (1711-1768) respected British physician, botanist, chemist, biologist, and surveyor, lived for a time in Virginia, but returned to England in 1746, where he remained until his death. Mitchell initially conceived of his map of North America in order to present the British public with a single large format image of all the colonies, in order to illustrate the extent of the French threat to the British claims in North America. Mitchell completed his first draft of the map in 1750. However, because Mitchell was limited to publicly available sources of information, this initial effort was rather crude, even in Mitchell’s own opinion. As word of Mitchell’s work spread, the Board of Trade and Plantations retained Mitchell to make a new map, using the official manuscript and printed maps and reports in the Board’s possession, including maps by Fry and Jefferson, Christopher Gist, George Washington, John Barnwell, and others. The Board also instructed all colonial governors to send detailed maps and boundary information for Mitchell’s use.
Literature: Stephenson, Richard W. “Table for identifying variant editions and impressions of John Mitchell’s Map...” In A la Carte, ed. Walter W. Ristow, 109-113. Washington: Library of Congress, 1972. Howes M 678, Pritchard-Taliaferro 33, Stevens-Tree 54 (1755(a) “first issue”).
THE MOST IMPORTANT 18th
Thomas Jefferys. The
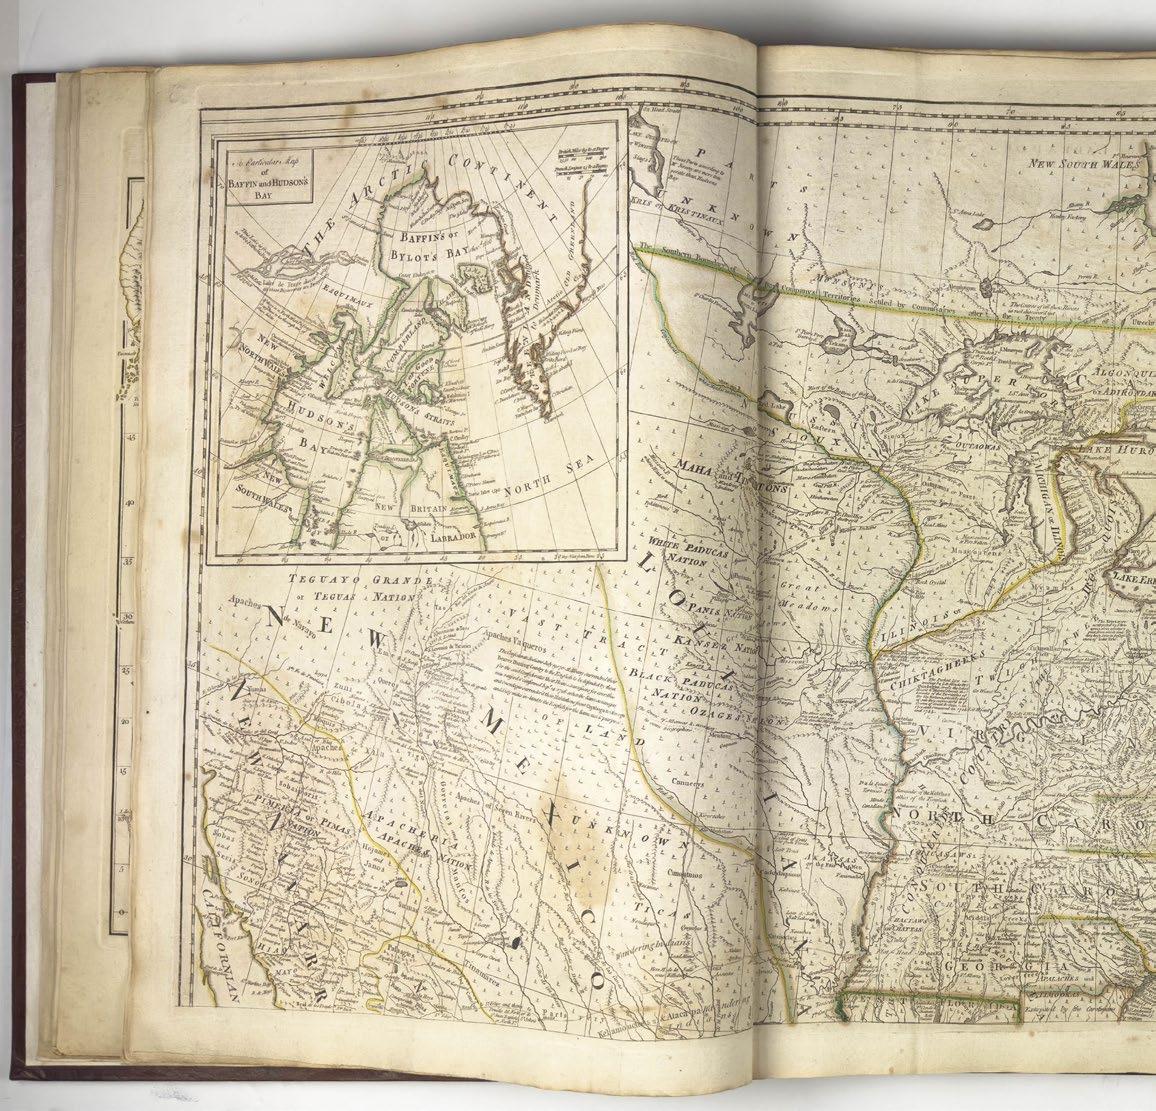
18th
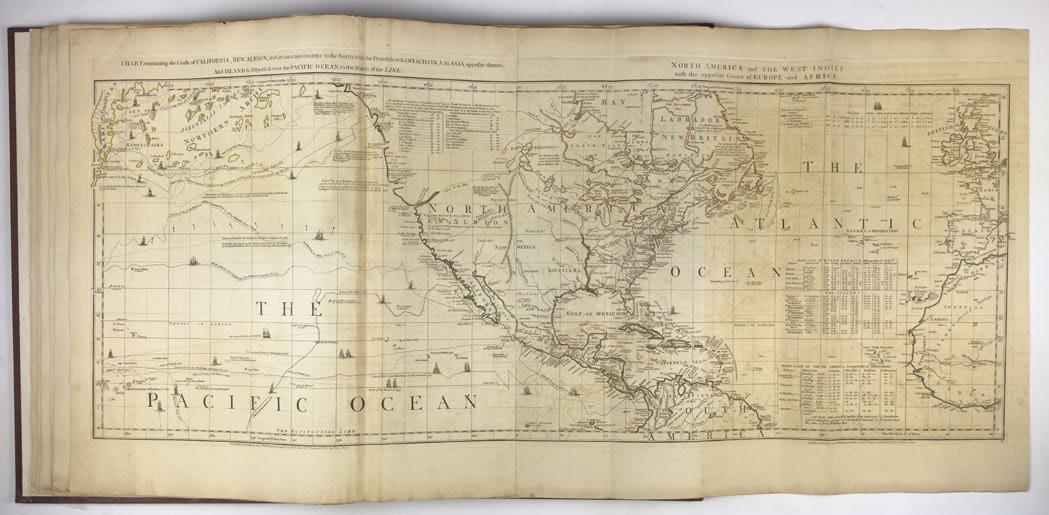
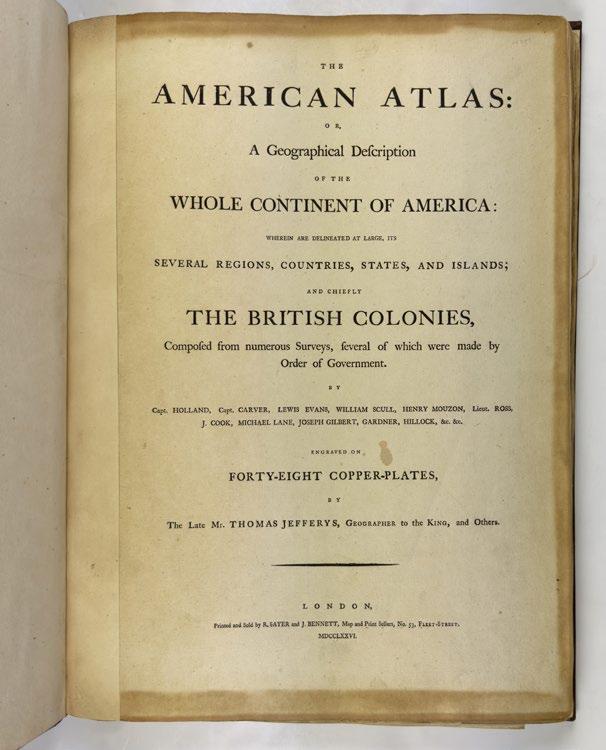
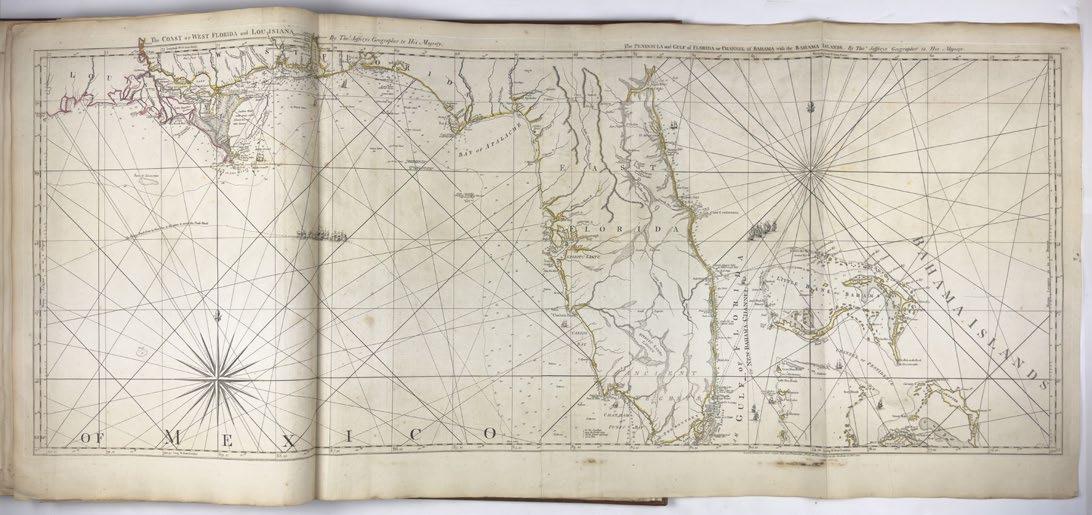
AMERICAN ATLAS
The American Atlas... 1776.
Thomas Jefferys (1719–1771)
The American Atlas: or, A Geographical Description of the whole continent of America... Engraved on forty-nine copper-plates, by the Late Mr. Thomas Jefferys, Geographer to the King, and Others.
London: Printed by R. Sayer and J. Bennett, 1776. Second edition, expanded.
Folio (22” x 15 7/8”, 557mm x 404mm): π-2π1 (title, blank, index, blank). With 29 engraved maps, of which 17 are folding and 11 double-page; all hand-colored in outline, with five or so additionally colored in part.
Bound in modern diced russia to style, with a wide gilt roll border. On the spine, seven raised bands. Author and title gilt to red sheep in the second panel. Gilt roll to the edges of the boards. All edges of the text-block untrimmed.
Text-block tanned at the extremities, with offsetting from the turn-in at the title-page. Maps numbered in ink manuscript mostly to the recto of the first leaf, occasionally elsewhere. A handful of peripheral splits and wear to the mapsheets, but altogether an excellent example.
$135,000 Thomas Jefferys (1719–1771) was geographer first to the Prince of Wales and then, upon his accession, to George III. From the 1750’s he had been issuing maps of the Americas, which, because of the Prince of Wales’s patronage, benefitted from the most up-to-date surveys. After his death, Sayer and Bennett came to own his copyright and, doubtless, his plates. In 1775 they issued the first collection of his maps in addition to others’, doubtless in response to the commencement of hostilities in April of that year.
As tensions rose, demand — from American and British officers, crucially — rose with it, not only for the original maps but to more detailed and precise maps of crucial battlegrounds. The 1776 edition is the great setting of the stage for the War of Independence, the preparation of the board on which the game would be played.
It is telling which maps were updated: 8, “A map of the british empire in North America” is now “improved from the surveys of capt. Carver”; 17 (orig. 18) “The provinces of New York and New Jersey, with part of Pensilvania” is now “improved from the original materials by govern. Pownall;” and generally more focus on the regions flanking the modern U.S.-Canada border, as with the addition of map 18: “A survey of lake Champlain, including lake George, Crown point and St. John. . .” Collation of this sort is a concrete and underexploited way of tracking shifting British strategy.
Harley-Petchenik-Towner Mapping the American Revolutionary War pp. 85-7; Howes J 81; Phillips 1166; Sabin 35953.
THESE ARE THE MAPS BENJAMIN FRANKLIN SUPPLIED TO INDEPENDENCE
HALL
THE FIRST ENGLISH MAP TO USE
Aaron Arrowsmith. A Map of the United
USE THE TERM “UNITED STATES”
United States of North America... 1796.
Aaron Arrowsmith (1750-1823)
A Map of the United States of North America. Drawn from a number of Criti- cal Researches by A. Arrowsmith, Geographer
Engraved wall map with original hand color, mounted on cartographic linen London: A. Arrowsmith, 1796. (First Edition, original issue: Stewart 79a)
Sheet size: 49 1/4” x 57”; Frame size: 56” x 63”
$48,000
FIRST EDITION, FIRST ISSUE. WITH MAGNIFICENT & PERFECT ORIGINAL COLOR
Arrowsmith’s map was the first English wall map to use the term “United States” to describe the newly independent colonies in North America, and demonstrated the difficulties facing cartographers seeking to identify the enormous concession of lands made by England in the Treaty of Paris.
It is often said that the Treaty of Paris in 1783 explicitly recognized the “United States” as a nation. It certainly had that effect, but the language in the treaty reflected a certain ambiguity about what that meant.
The three American representatives charged with negotiating the treaty were appointed by the Continental Congress, which was operating under the Articles of Confederation. The Constitution, of course, was not adopted until 1787. This presented the European powers with many opportunities to influence the outcome of peace negotiations, for good and bad. Also, to a large extent each of the colonies felt free to have its own foreign policy, making the task of the negotiators a difficult one. In the words of John Jay, peace was achieved “in spite of the malice of enemies, the finesse of allies and the mistakes of Congress.”
On the British side, the chief negotiator’s original commission charged him with negotiating with the thirteen “colonies or plantations, or any of them or any part or parts of them.” This proved inadequate, so some five months later his commission was revised to authorize him to negotiate with “the Thirteen United States of America, Viz: New Hampshire, Massachusetts Bay, Rhode Island, Connecticut, New York, New Jersey, Pensylvania, the three lower Counties on Delaware, Maryland, Virginia, North Carolina, South Carolina, and, Georgia in North America, a Peace, or a Truce with the said thirteen United States…”. This precise language was used in the Treaty of Paris. It acknowledged that the thirteen former colonies were “united” but the treaty consistently used the plural to describe the states.
Whatever the definition of the “United States” the Treaty of Paris also represented a stunning concession of land by Great Britain, extending the new nation from the Atlantic to the Mississippi River. The treaty explicitly described the boundaries of the lands belonging to the states, but since the best information available was Mitchell’s 1755 map, the treaty necessarily created some ambiguities that challenged subsequent cartographers.
On such mapmaker was Aaron Arrowsmith. Arrowsmith was England’s preeminent wall map publisher, and the founder of a cartographic dynasty that continued for generations. His talents were in synthesis, using a variety of sources including the records of the Hudson’s Bay Company. His 1795 Map of the Interior of North America used such records to make the most useful map of the day about the topography of the American west; a later edition accompanied Lewis and Clark. But his 1796 Map of the United States of North America was intended to be a political map; an up to date map depicting the territory and boundaries of the new “United States.” It was the first English wall map to use that name.
Arrowsmith’s map is an aesthetic masterpiece, particularly with the extraordinary coloring displayed in this example – the best we have ever seen on this map. On the other hand, as the first state of a much-updated map it reflects some of the challenges created by the Treaty of Paris, and by subsequent events. One example is the northern boundary between the District of Maine and British Canada. The Treaty of Paris began its description of the boundary of the United States at “the Northwest Angle of Nova Scotia” which the treaty defined as being a point on the “highlands” at the end of a line going north from the head of the St. Croix River. Arrowsmith began his boundary line at what he called the “lands hight” but made no reference to the northwest angle, and neither his engraver nor his colorist seemed confident on the actual location of the boundary. This uncertainty was understandable since it had never been surveyed. The actual location remained disputed (occasionally with the threat of violence) well into the 19th Century. The border dispute was finally resolved in the Webster-Ashburton Treaty of 1841.
In the South, the treaty established a border with West Florida at the 31st parallel. This corresponded to the border of West Florida established by the English in 1763 after the French and Indian War. This ignored the fact that the English expanded West Florida in 1764 by moving the border north to 32 degrees 22 minutes, which is presumably where it still was when the Revolution ended.
Spain was not a party to the Treaty of Paris, but the revolution was a global war, and it had claims to make as part of the settlement. In a separate treaty, to which the United States was not a party, Spain recovered Florida and West Florida from England, basically as a consolation prize for not receiving Gibraltar, its real goal in the war. However, the treaty between England and Spain did not define the northern border of West Florida. Spain asserted that the border was at 32 degrees 22 minutes as it had been set in 1764; the United States claimed that the 1763 border at the 31st parallel applied. This conflict between Spain and the United States was resolved in 1795 in Pinkney’s Treaty. Arrowsmith may not have gotten the news; certainly his colorist on this example did not. The border is clearly delineated in color at 32 degrees 22 minutes, granting Spain a far larger West Florida than it had recently agreed to accept. Subsequent states of the map properly locate the border at the 31st parallel, making this rare first state an example of the difficulties facing even the most talented mapmaker trying to capture the changing shape of North America.
THE FIRST MAP TO SHOW “MANIFEST
John Melish. Map of the
“MANIFEST DESTINY” REALIZED
the United States. 1816 [1823].
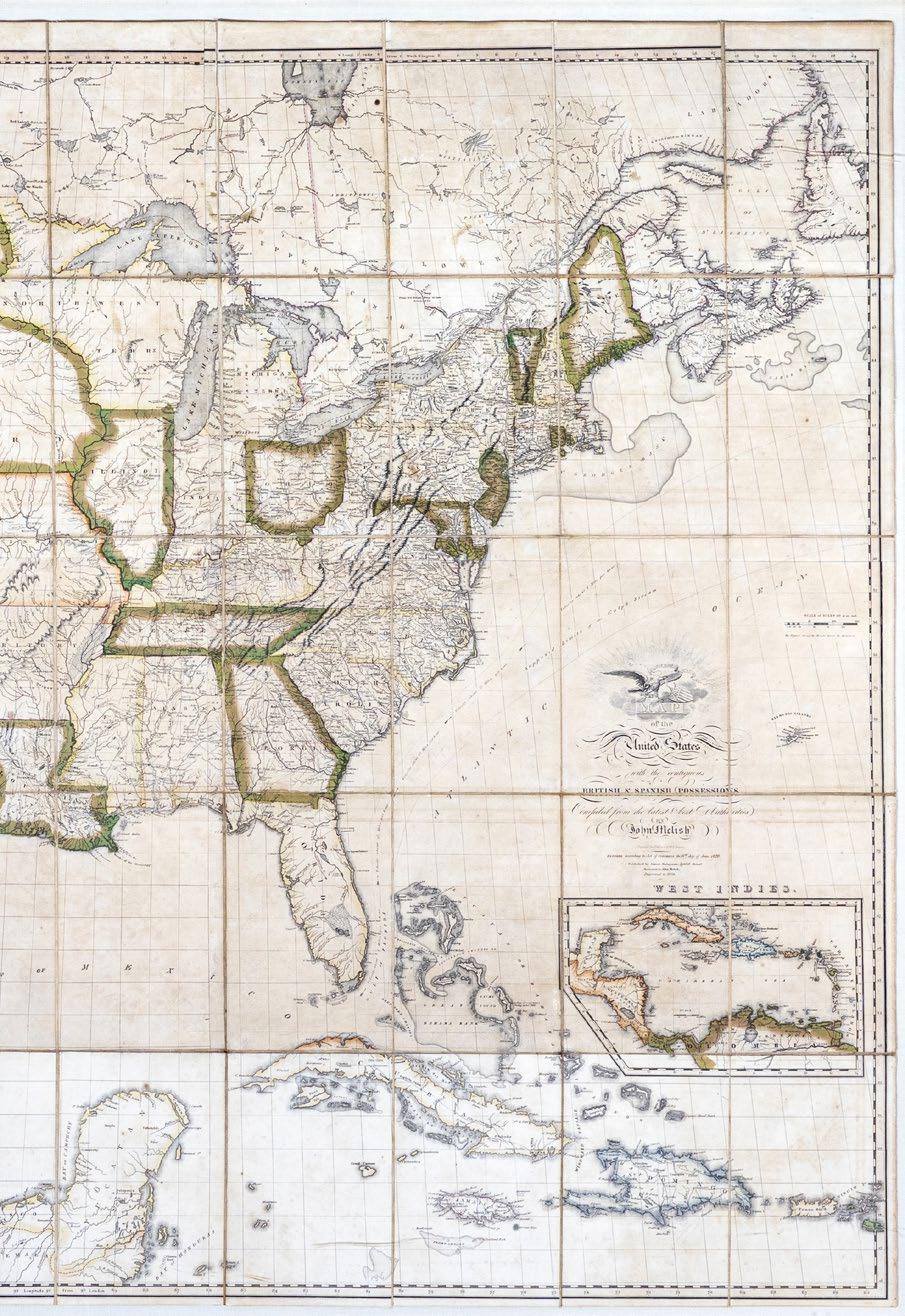
John Melish (1771-1822)
Map of the United States with the contiguous British and Spanish Possessions Compiled from the latest & best Authorities
Copper plate engraving with original hand color
Philadelphia: James Finlayson, [1816] 1823
Sheet size: 43 ¼” x 56 ¾”; Frame size: 40 ½” x 56 5/8”
$120,000
The first map to display a cross-continental United States as the nation’s “Manifest Destiny”, the 23 editions of Melish’s map set the borders between Spain and the newly expanded United States under the Adams Onis Treaty.
The Louisiana Purchase stimulated demand for information about the American west that continued unabated for decades. John Melish, Philadelphia’s premier mapmaker, responded in 1816 by publishing his Map of the United States with the contiguous British and Spanish Possessions Compiled from the latest and best Authorities. The map was the first of the United States that covered the entire North American continent, encompassing the findings from Lewis & Clark, Zebulon Pike, Stephen Long, Thomas Nutall, and Andrew Ellicot. Melish updated it religiously, and the 23 known editions from 1816 to 1823 serve as a running account of the agreements and conflicts that gave the nation its modern configuration.
One such treaty was signed in 1818 between the United States and Great Britain. This “London Convention” resolved two boundary issues left open following American independence: the northern boundary of the United States, and the question of which country owned the Oregon Country.
The Treaty of Paris in 1782 had initially established the northern boundary of the United States as running through the center of the Great Lakes, then west to an area assumed by the English to be the headwaters of the Mississippi River. Based on incorrect cartography by John Mitchell and others, the British were under the impression that the river’s headwaters were farther north than they were. American negotiators agreed to the boundary despite having knowledge to the contrary.
By 1818, both parties knew the actual position of the Mississippi headwaters. The existing boundary of Louisiana, recently acquired by the United, was a complex contour which followed various natural features. It dipped as far south as 45 degrees and north into what is now Saskatchewan and Alberta. The London Convention then established a new, straight boundary at the 49th parallel, running from the Lake of the Woods to the Rocky Mountains. This gave Britain the northernmost part of what might have been included in the Louisiana Purchase, but at the expense of the territory known now as Minnesota, North Dakota and South Dakota.
The London Convention also resolved – or rather, deferred – the question of the ownership of the Oregon Country. The area to the west of the Rocky Mountains and north of the 42nd parallel up to the border of Russian Alaska had been claimed at various points in time by either the French, Russians, Spanish, English, Americans, or some combination of the few. By 1818 the claimants were down to the last three. The London Convention defined the region properly for the first time as being bounded on the south by the 42nd parallel. It also provided that England and the United States would jointly occupy it for a period of ten years.
Spain was not a party to the London Convention and its claims to the Oregon Territory, as part of Alta California, were not addressed within the treaty. However, the United States was carrying on active ne-
By the early 19th century, Spain was struggling to contain its American colonies. When Napoleon invaded Spain in 1808, colonial revolutionaries throughout North and South America took the opportunity to seek independence. Spain could not devote the money or resources to preserving its position everywhere and was forced to focus on specific regions.
In the southeast, the United States had already annexed and finally invaded West Florida, ending the short lived “Republic of West Florida” and its rebellion from Spain. The Spanish were in the west, powerless to intervene. East Florida was in open revolt, and Spain could not afford the troops to keep control outside from a few enclaves by the sea. Much of the interior was controlled by the Seminoles, who were openly hostile to Spain. The United States also contested with the tribe: Americans from the Southern states were particularly incensed when the Seminoles offered refuge to runaway slaves. On more than one occasion, General Andrew Jackson led troops into nominally Spanish territory to enforce American law. There were also geopolitical concerns: during the War of 1812, the British had raided American ships from ports in Florida, and its merchants were highly active there with Spanish acquiescence.
The United States still claimed Texas as part of the Louisiana Purchase and there was strong popular opinion in favor of expansion into the region. The Spaniards exacerbated the problem by encouraging Anglo-American settlement in Texas. They did this by making land grants to agents who agreed to settle a certain number of Catholic immigrants on their lands. This policy was partly in response to devastating raids by the Commanches, which had recommenced after several decades of peace because the Spanish colonial government failed to pay its annual tribute in 1811. The Spanish hoped that the establishment Anglo-American settlements would serve as a buffer between the Commanches and Spanish missions and settlements. By the time Spain realized that Anglo-Americans were outnumbering its own colonists and began to reconsider its policy, anti-Spanish sentiment was already rampant in Texas.
However, in Washington, the government resisted pressure to acquire Texas. The United States had recently concluded the War of 1812 with England and did not want a new conflict with Spain. East Florida was perceived to be far more valuable than Texas, so their negotiations focused on the southeast. Private citizens were not necessarily in agreement with the government’s policies, and the activities of so-called filibusters were a constant irritant to the government as it hewed to its policy.
Further west, the 1818 treaty with Britain over the Oregon Country was an incentive for Washington to reach an agreement with Spain over the border of Alta California. The U.S. government was eager to establish the areas in which it could act without fearing a response from Spain and Spain in turn wished to rid itself of the costs associated with even a nominal presence in the regions remote from Mexico City.
Peace between Spain and the newly expanded United States was benefited both sides. After long negotiations, the United States and Spain finally defined the borders between their respective interests in America by entering into the Adams Onis Treaty in 1819. They turned to the most current version of Melish’s Map of the United States…to define their interests.
The treaty ceded East Florida to the United States and conceded the reality of American possession of West Florida as well. Texas remained Spanish territory. Its borders were defined by referencing the 1818 edition of John Melish’s Map of the United States of America following the Sabine, Red and Arkansas Rivers, then West to the 42nd parallel, which it followed to the Pacific.
Spain conceded any claim to lands in North America north of the 42nd parallel, a historic contraction of Alta California that brought its claims in line with the American/British London Convention.
The treaty left Spain a vast swath of territory, including Texas, in exchange for the renunciation of its claims in Florida. The agreement was widely denounced in the U.S. as a giveaway and planted the seeds of Texan independence and the Mexican American War.
THE TREATY MAP FOR THE John Disturnell. Mapa de los
los Estados Unidos de Mejico. 1846.
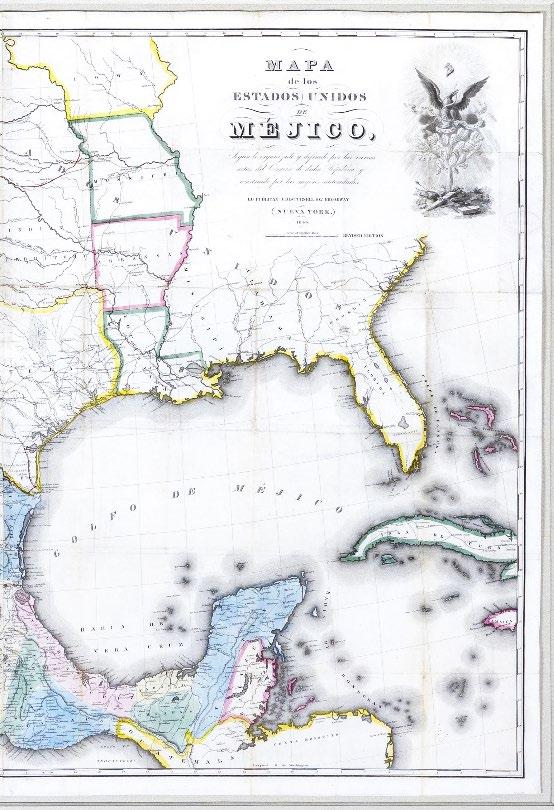
USED AT THE TREATY OF GUADALUPE HILDAGO
THE U.S. Takes California, which was 50% of Mexico’s Territory
John Disturnell (1801-1877)
Mapa de los Estados nidos de Mejico...
Engraved map with original color
New York: John Disturnell, 1846 (Martin/Ristow’s 4th Edition)
Sheet size: 29 ½” x 42”; Frame size: 51 ¾” x 39”
$145,000
The Treaty of Guadalupe Hidalgo used Disturnell’s map to describe the agreed southwest border of the United States.
When General Winfield Scott and his army captured Vera Cruz, negotiations for a treaty were inevitable. Scott was a political opponent of President Polk’s and a likely Presidential candidate, so Polk was not eager to have him claim credit for the treaty. Nor did he want to give another political figure the opportunity. The man Polk selected for the task was Nicholas Trist.
Trist was an aristocratic Virginian who was married to Thomas Jefferson’s granddaughter. Officially the Chief Clerk for Secretary of State James Buchanan, he was intelligent, politically loyal and spoke fluent Spanish. He also had a reputation for being insubordinate.
In April 1847 Polk and Buchanan gave Trist a draft treaty that set out the terms he was allowed to negotiate. A sealed copy was to be given to the Mexican government. Traveling incognito as already insulted and suspicious Scott. Weeks went by as the two feuded by letter (Trist described Scott as “the greatest imbecile I have ever had to work with”) but they finally managed to meet, at which point they dropped their disagreements and ultimately became good friends.
Trist’s initial negotiations with Mexico were not productive. Mexico offered only limited concessions of lands in Alta California and would not agree to the Rio Grande as the border with Texas – that it, it would not concede the “Nueces Strip” to the United States. Since the latter was a firm condition of his authority, Trist broke off the negotiations. Hostilities renewed, Scott then captured Mexico City and the government collapsed. There was no one with whom Trist could negotiate.
In the meantime, back in Washington Polk was impatient and decided to recall Trist. Buchanan wrote to Trist, saying that if Trist had a treaty in hand when he received the letter he should bring it to Washington, but if not, he was to cease negotiations and return himself. Trist received the letter, but in the meantime the Mexicans had appointed a member of the peace party to negotiate the treaty, and Trist was convinced he could achieve his original objectives. He disregarded the instructions, and after further negotiations, the Mexican side accepted his terms. They were incorporated in the Treaty of Guadalupe Hidalgo, which he signed on February 2, 1848.
The “Treaty of Peace, Friendship, Limits and Settlement between the United States of America and the United States of Mexico” provided that the United States would pay Mexico $15 Million, in exchange for which Mexico would agree to new boundaries. In establishing those boundaries, the treaty expressly incorporated the “1847 Revised Edition” of Disturnell’s map:
The boundary line between the two Republics shall commence in the Gulf of Mexico, three leagues from land, opposite the mouth of the Rio Grande, otherwise called Rio Bravo del Norte, or Opposite the mouth of its deepest branch, if it should have more than one branch emptying directly into the sea; from thence up the middle of that river, following the deepest channel, where it has more than one, to the point where it strikes the southern boundary of New Mexico; thence, westwardly, along the whole southern boundary of New Mexico (which runs north of the town called Paso) to its western termination; thence, northward, along the western line of New Mexico, until it intersects the first branch of the river Gila; (or if it should not intersect any branch of that river, then to the point on the said line nearest to such branch, and thence in a direct line to the same); thence down the middle of the said branch and of the said river, until it empties into the Rio Colorado; thence across the Rio Colorado, following the division line between Upper and Lower California, to the Pacific Ocean. The southern and western limits of New Mexico, mentioned in the article, are those laid down in the map entitled “Map of the United Mexican States, as organized and defined by various acts of the Congress of said republic, and constructed according to the best authorities. Revised edition. Published at New York, in 1847, by J. Disturnell,” of which map a copy is added to this treaty, bearing the signatures and seals of the undersigned Plenipotentiaries.
The treaty went on to require the formation of a boundary commission, which would be responsible for surveying the border and establishing where in fact the line should lie.
The intention of the treaty was to clarify the United States’ ownership of the “Nueces Strip”, the lands claimed by Texas in Santa Fe de Nuevo Mexico, and all of Alta California. Unfortunately, by relying on the Disturnell map the treaty failed to definitively resolve any of these boundaries.
With respect to the Nueces Strip, the treaty did confirm that the Rio Grande and not the Nueces would be the border. But when the Boundary Commission began its work, it found that Disturnell’s map put the Rio Grande River more than 100 miles farther west than its actual location. They also found that in the north, the map placed the town of Paso (modern day Juarez) and by extension the southern boundary of New Mexico, about 34 miles north of its real location. Since the treaty did not reference any locations by longitude and latitude, the differences made the treaty unworkable.
The two leading boundary commissioners proposed the “Bartlett-Conde Compromise” which used measurements that resolved the east-west error in the United States’ favor, and the north-south error in the Mexico’s favor. The compromise was approved by their superiors, but the part that favored Mexico in the north was soundly rejected and declared invalid by the incoming President, Franklin Pierce. One reason was that during the boundary survey, it was determined that the land in dispute – the “Mesilla Strip” – was a suitable location for the planned Southern Pacific Railroad.
Tensions on both sides rose, and Mexico and the United States came close to declaring war once again. Realizing the cost of such a war, Pierce appointed James Gadsden as minister to Mexico with instructions to try to negotiate a solution. He did, and in 1854 the Gadsden Purchase finally resolved the nation’s southwest border. The “Treaty of Boundary and Cessation of Territory” provided for a payment of $10 million for a new boundary that began roughly at El Paso on the Rio Grande, then ran west, south then west again to the Colorado River and on to the coast. This represented the final adjustment to the border of the continental United States.