E-Waste Management
A Case of Ahmedabad City Data Analysis Stage
Sandeep Verma, 16AR60R18
Department of Architecture and Planning
Indian Institute of Technology, Kharagpur
Guided by : Prof. Arup Das

Sandeep Verma, 16AR60R18
Department of Architecture and Planning
Indian Institute of Technology, Kharagpur
Guided by : Prof. Arup Das
“
E-waste includes a wide and developing range of electronic appliances ranging from large household appliances, such as refrigerators, air-conditioners, cell phones, stereo systems and consumable electronic items to computers discarded by their users”.

Basel Action Network (www.ban.org)
“Any household appliance consuming electricity and reaching its life cycle end”.
OECD(www.oecd.org)
“Waste electrical and electronic equipment, including all components, subassemblies and consumables which are part of the product at the time of discarding”. The Directive 75/442/EEC, Article I (a), defines as “waste” “any substance or object which the holder discards or is required to discard in compliance with the national legislative provisions”.
European Directive 2002/96/EC
• E- Waste is routinely exported by Europe, US and Japan to Asian countries
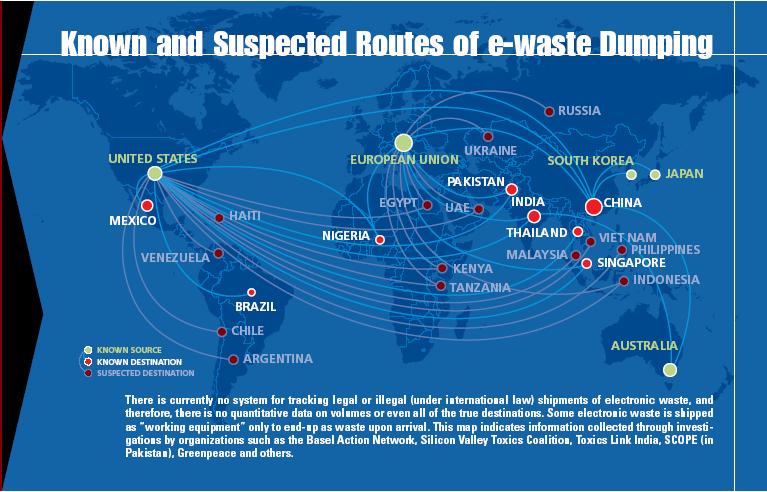
• About 80 per cent of the E-Waste generated in the US is exported to India, around 50,000 metric tonnes
• illegally imported into India, China and Pakistan (Ghana Business News, 2009).
• Trading in E-waste is camouflaged in India, in the form of obtaining ‘reusable’ equipment or as ‘donations’ from developed nations.
Reasons of exporting E-Waste to Developing Countries.
Lower Environmental Standards
(Legislative Factor)
Cheap and Skilled Labour
(High Population Illiteracy)
Labour intensive
Waste recycling Market Forces
Lack of Technology (Poverty)
Image Source: Greenspace
(High Competition )
• The second largest mobile market with 1.03 billion subscribers.
• Fifth largest producer of E-Waste
• Electronic Equipment – 21% of E-Waste
• India annually generates about $1.5 billion worth of E- Waste.
• 60 per cent of the total E- Waste in India is generated by 65 cities.
MT – Million Matric Tonnes
• Annual Growth Rate : 3-5%
• 3 times faster than other waste streams. (Cuchiella et al.,2015)
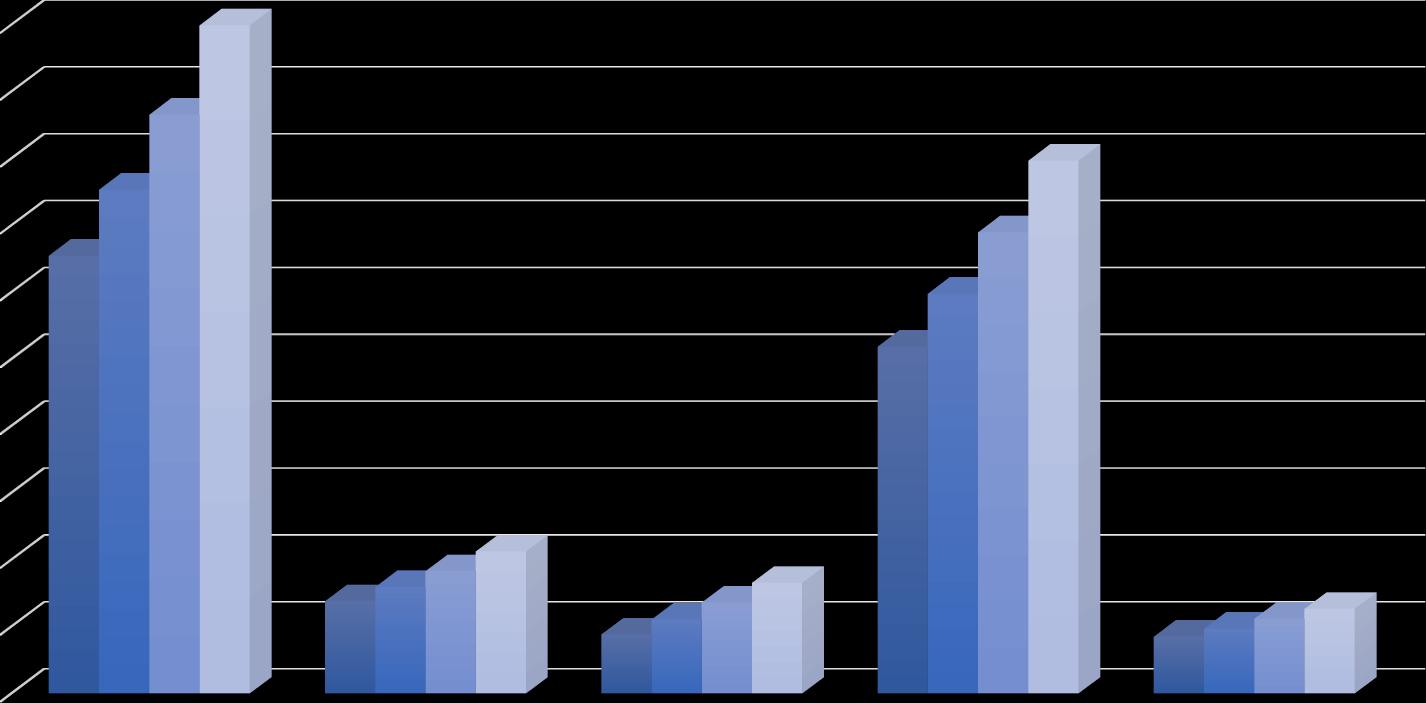
Top 10 E-Waste Generating Cities (2016)
Mumbai: 1,20,000 metric tonnes (MT)
Delhi: 98,000 metric tonnes (MT)
Bangalore : 92,000 metric tonnes (MT)
MT – Million Matric Tonnes
Chennai – 67,000 metric tonnes (MT)
Kolkata – 55,000 metric tonnes (MT)
Ahmedabad – 36,000 metric tonnes (MT)
• Annual Growth Rate : 30%
• 5th largest producer of EWaste
Hyderabad – 32,000 metric tonnes (MT)
Pune – 25,000 metric tonnes (MT)
Source: Ascocham, India
To create a comprehensive e-waste management framework incorporating the informal sector and assess the scope for formalising of key activities in e-waste management.
To study the e-waste growth pattern.
To assess entire chain of activities of e-waste management framework and identify the role of informal sector in such activities.
To study phases and phenomena associated with recycling techniques.
To validate the proposed methodology using the case study of e waste management of Ahmadabad.
• The study deals with the aggregate level e-waste management at aggregate level with information on LCA, recycling & disposal techniques based on secondary study.
• The study deals with the e waste route derivation using cost optimisation.
• The study does not deal with the solid waste issue related with the e waste.
• The study is city specific and does not deal with regional level e waste management due to lack of reliable data source.
• Transboundary issue related with e waste management is beyond the scope of the study.
• Understanding the informal e-waste recycling methods.
• Understanding the impacts of informal recycling.
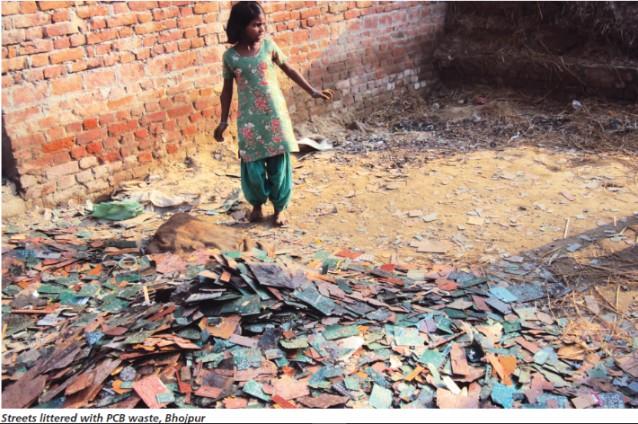
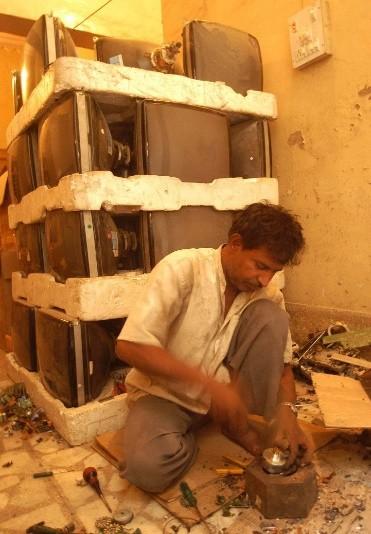
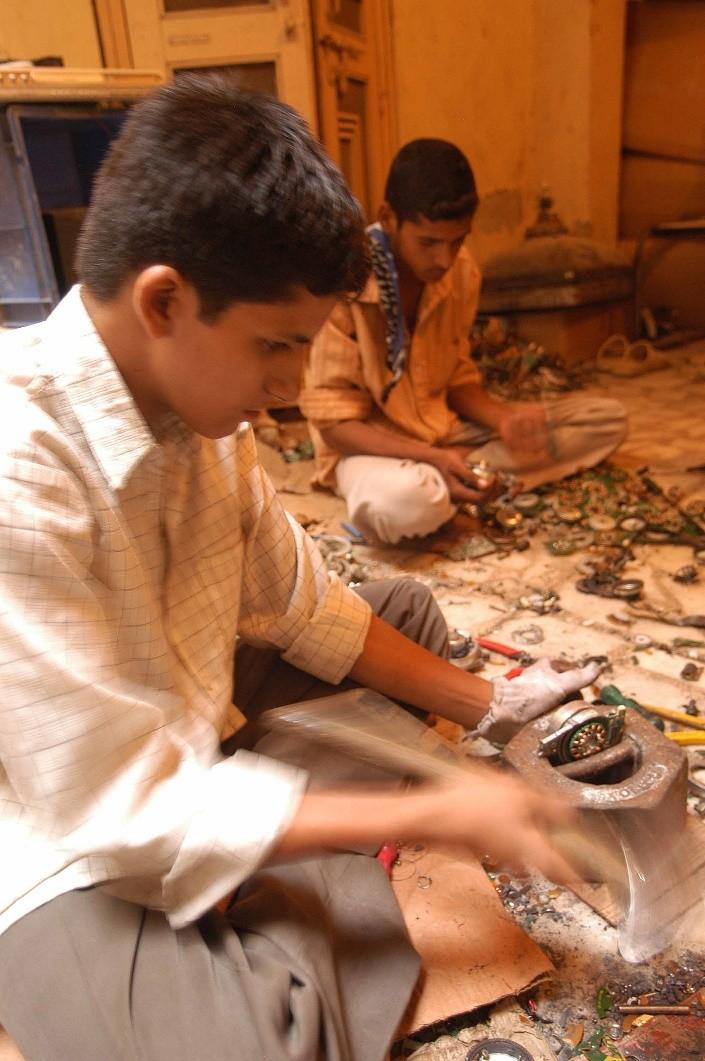
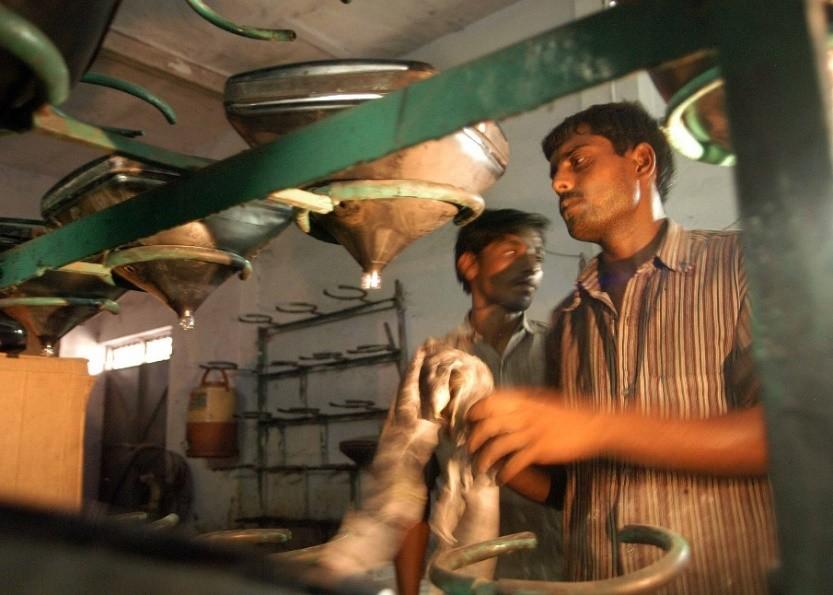
One of the biggest informal e-waste recycling hubs in India.
known as the Brass City of India
E global recession and consequent decrease in demand for brass products, manufacturers and handicraft workers are shifting towards the informal, unauthorized e-waste sector.
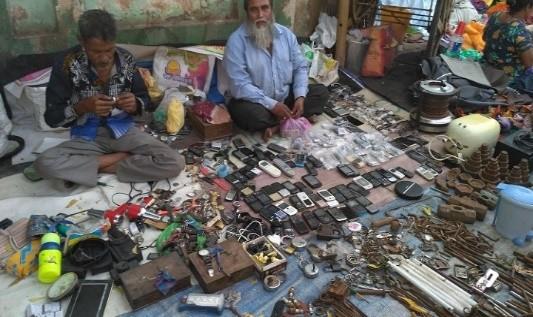
Women engaged in dismantling and segregation of components from PCBs, Bhojpur

E Waste Source : New Delhi (Shastri Park, Silampur, Mundka and Mandoli), Mumbai, Kolkata, Bangalore and Chennai.
Source: Centre for Science and Environment. (2015).
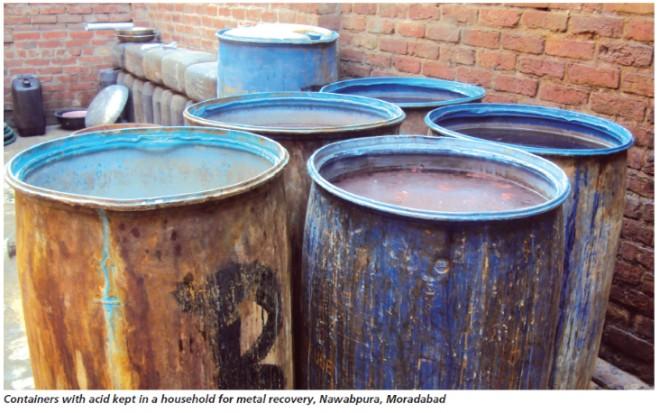
E-waste recycling has become a home business in the city, with most members in a family involved in processes right from dismantling to metal recovery.
Daily earning Rs 150-200 per for dismantling.
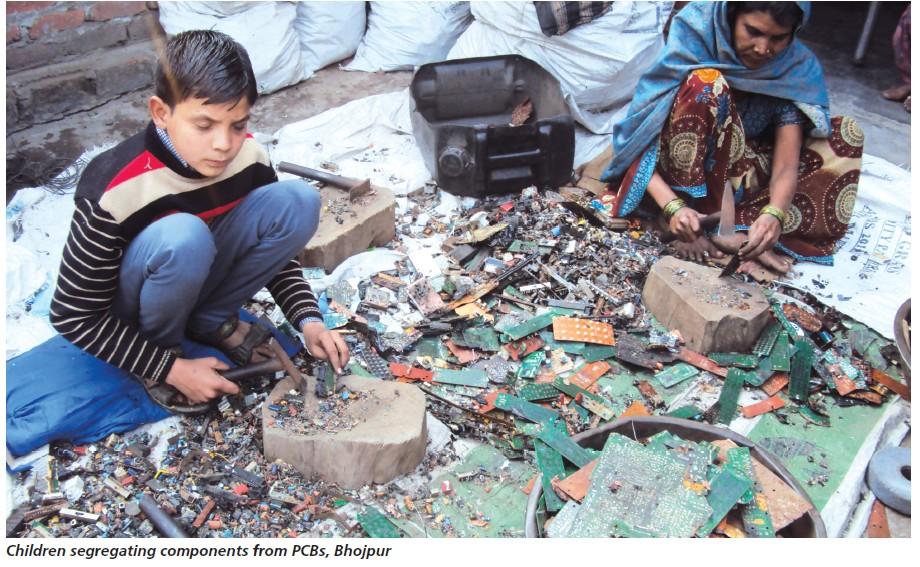
Women and children get only Rs 70-100 per day for 10 hours of work
almost 80 per cent of the population is involved in dismantling and segregating
only 8-10 per cent is involved in the process of metal recovery
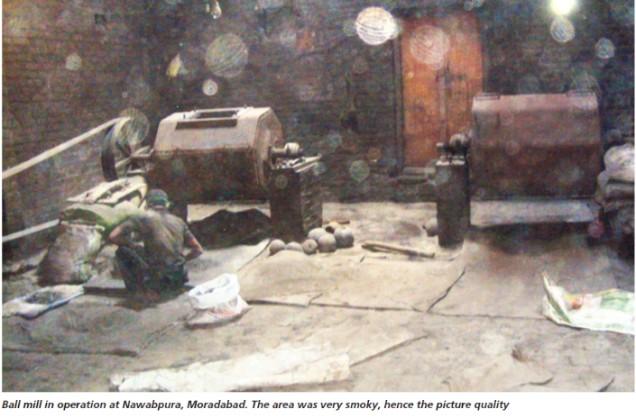
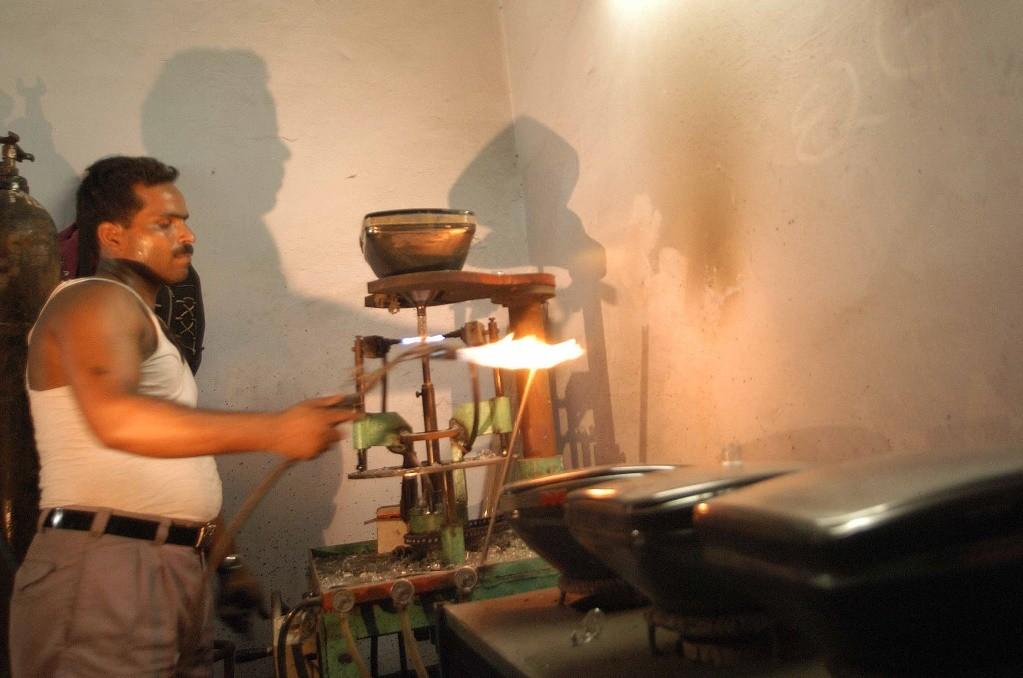
Ball mill in operation at Nawadpura, Moradabad, The area was very smoky, hence the picture quality
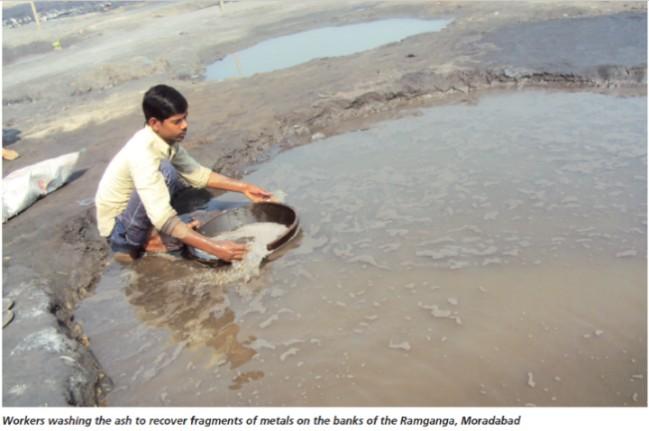
Workers
Source: Centre for Science and Environment. (2015)

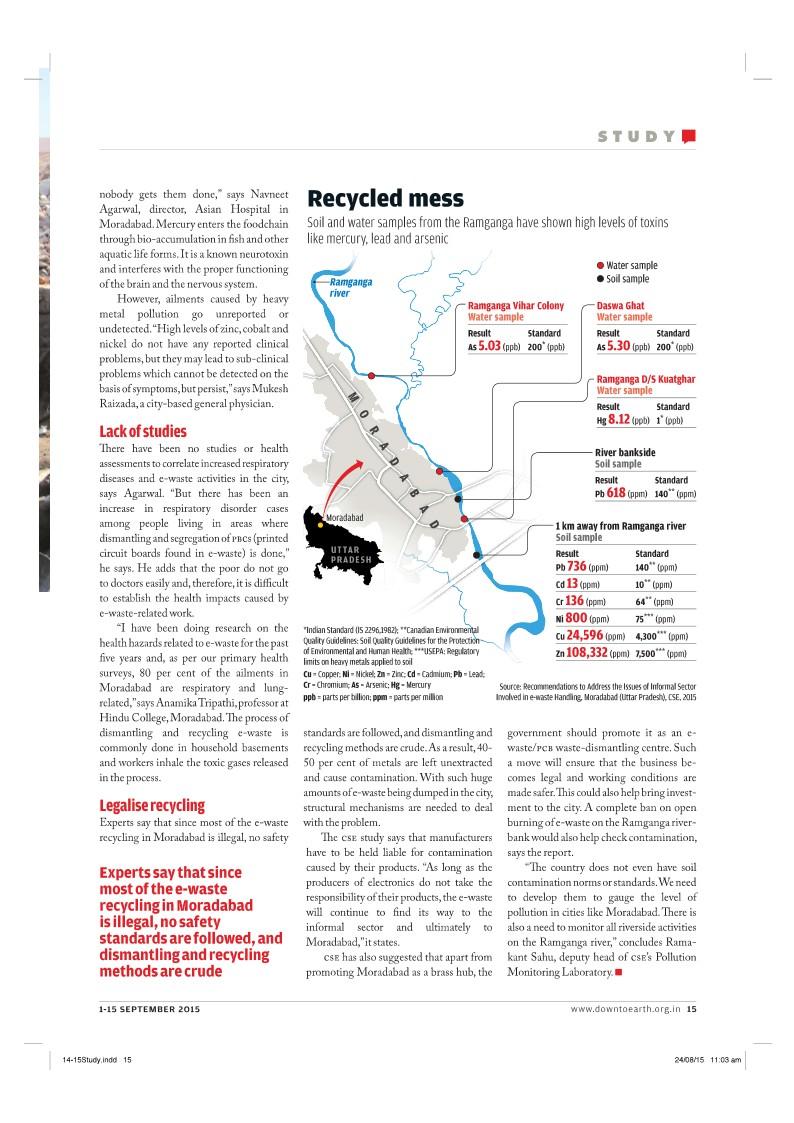
Results from the analysis of water and soil samples collected at Moradabad
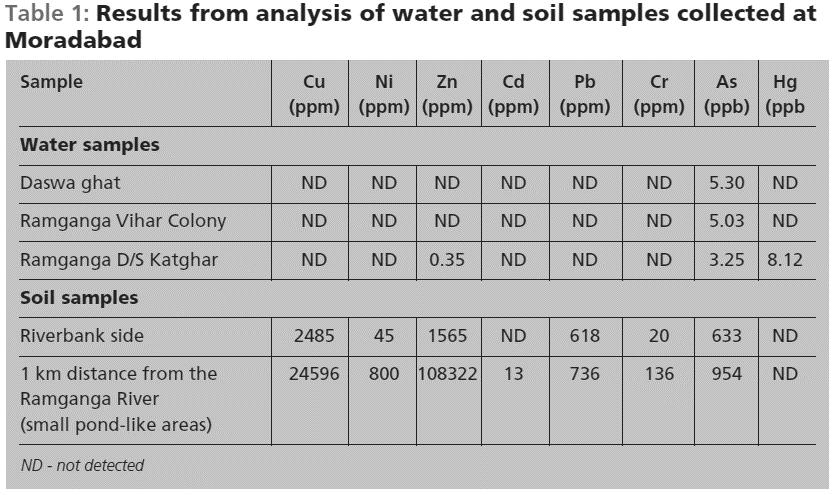
Source: Centre for Science and Environment. (2015)
Per capital Income 78,813US$
Source :World Bank (2016)
Among most technological advance countries.
PC base is 3.15 million PCs, 1 PC for almost every 2 person.
99% households have refrigerators.
96& households have TV
62.6% of the citizens wanted the government to place more emphasis on environmental issues
Ranked 7th on the 2005 Environmental Sustainability Index.
annual per capita spending on ICT products topping US$3600, the highest in the world.
First country in the world to have established a formal system to manage e-waste
Keys for efficient management
Producer Responsibility Organisations (PROs)SWICO and S.EN.S.
SWICO manages brown goods electronic equipment such as computers, TVs, radios, etc.,
while S.EN.S handles white goods such as washing machines, refrigerators, ovens, etc.
Source: Sustainability Index: http://sedac.ciesin.columbia.edu/data/collection/epi
Source: Deepali Sinha-Khetriwal, P. K. (2005). A comparison of electronic waste recycling in Switzerland and in India. Environmental Impact Assessment Review, 492– 504.

The entire operative responsibility is however with the two PROs–SWICO and S.EN.S–who manage and operate the system on behalf of their member producers.
SWICO and S.EN.S had 500 official collection points
thousands of retail locations which have to take back old equipment free of charge.
By having common collection points, the PROs are better able to manage logistics
to pay for the collection, the transport and the recycling of the disposed appliances.
minimum CHF (Swiss franc) 1 on small items, such as hair dryers and electric shavers, to up to CHF 20 for TVs or CHF 40 for refrigerators. The total ARF collected in 2003 was CHF 71.66 million.
1. Official Take Back System
• Collection by Municipality, retailers or commercial pickup centres.
• Waste sent for processing to different centres.
• Japan and EU in past
• China India and other developing countries.
Export and Dump
2. Disposal and Mixed Residual Waste
• Observed in developing countries.
• E-waste is disposed with household waste.
• Landfill or Incineration with low chance of separation .
3. Collection outside official takeback system.
• Waste collected by individual waste dealers or companies.
• Then sent to metal recycling, plastic recycling or exported.
Source: Kumar, 1., & Singh, D. D. (2013)). E – Waste Management through Regulations. International Journal of Engineering Inventions, 3(2), 06-14.
Local Dumping
• North Korea
Global Low level Recovery
Regional
High level Recovery
• Japan and EU in future.
4. Informal Collection and recycling in Developing Countries.
• Self employed people are engaged in collection & recycling of e waste.
• Recycled or dumped or incinerated.
• Extraction process is informal.
• Cause severe damage to environment and serious health risks.
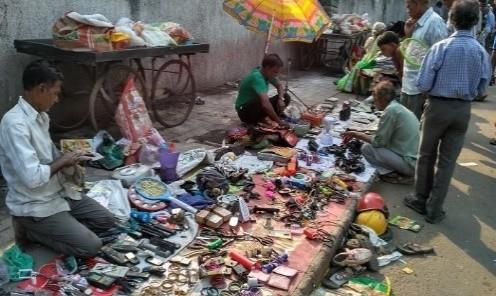
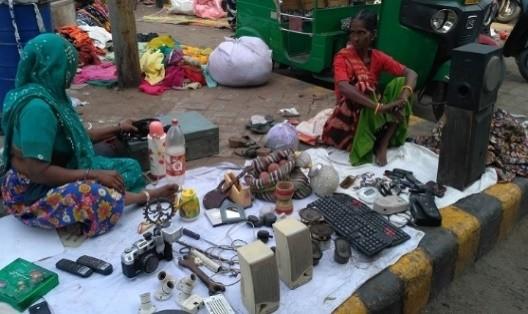
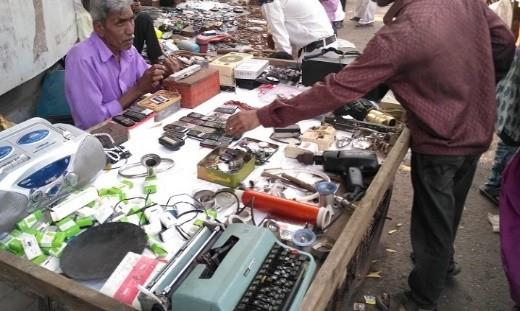
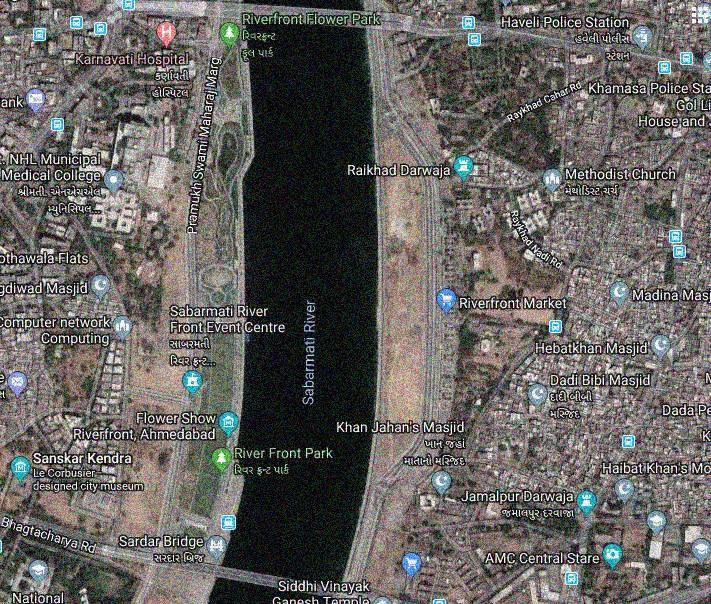
Jamalpur Weekly Market
Dudhleshwar MemNagar Madhupura Rakhial Gujjari Market
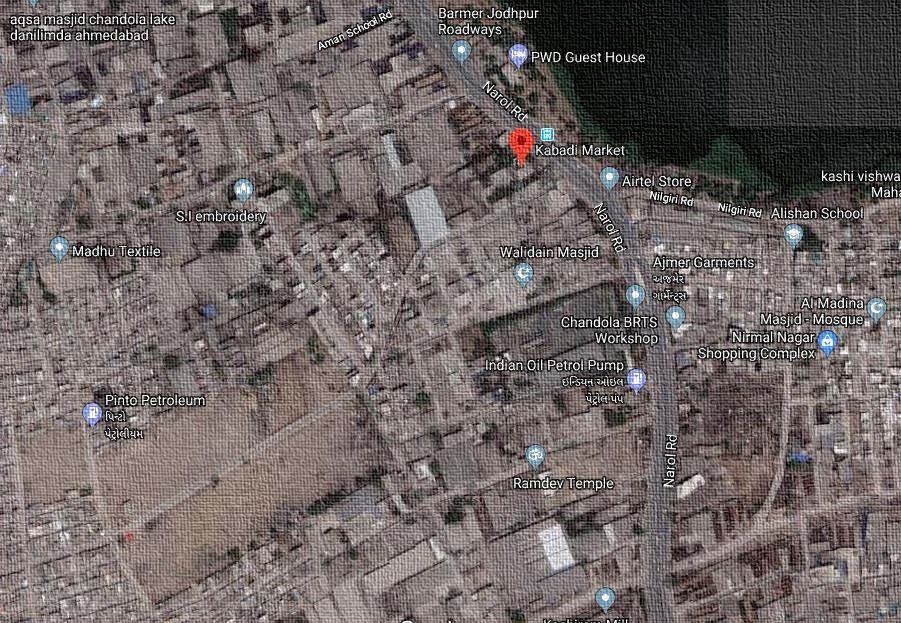
Kabadi Market (Dhani Limda)
Vatva Recyclers
Scrap Market
Informal Recycling Area

• Total ban on illegal exports of electronic items.
• Lifespan of the reused and stored electronic items are considered as 3 years.
• 50% of the total reused items are further stored, whereas 20% and 30% items are recycled and landfilled (X5=0.50 ; X6=0.20; X7=0.30 )
• 20% and 80% of the stored items are recycled and landfilled (X8, X10=0.20, X9, X11= 0.80)


Reuse (X1)
Stored (X5)
Recycled (X10)
Purchased
Electronic Items
Obsolete Electronic Items
Stored (X2)
Recycled (X6)
Landfilled (X11)
Recycled (X3)
Landfilled (X7)
Landfilled (X4)
Source : Dwivedi and Mittal..2007
Recycled (X8)
Landfilled (X9)
X1….X11 = Fraction of obsolete electronic items for various EOL (End of Life) scenario (Reuse, stored, recycled, landfilled)
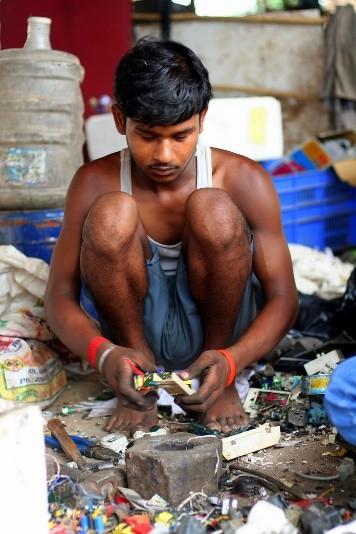
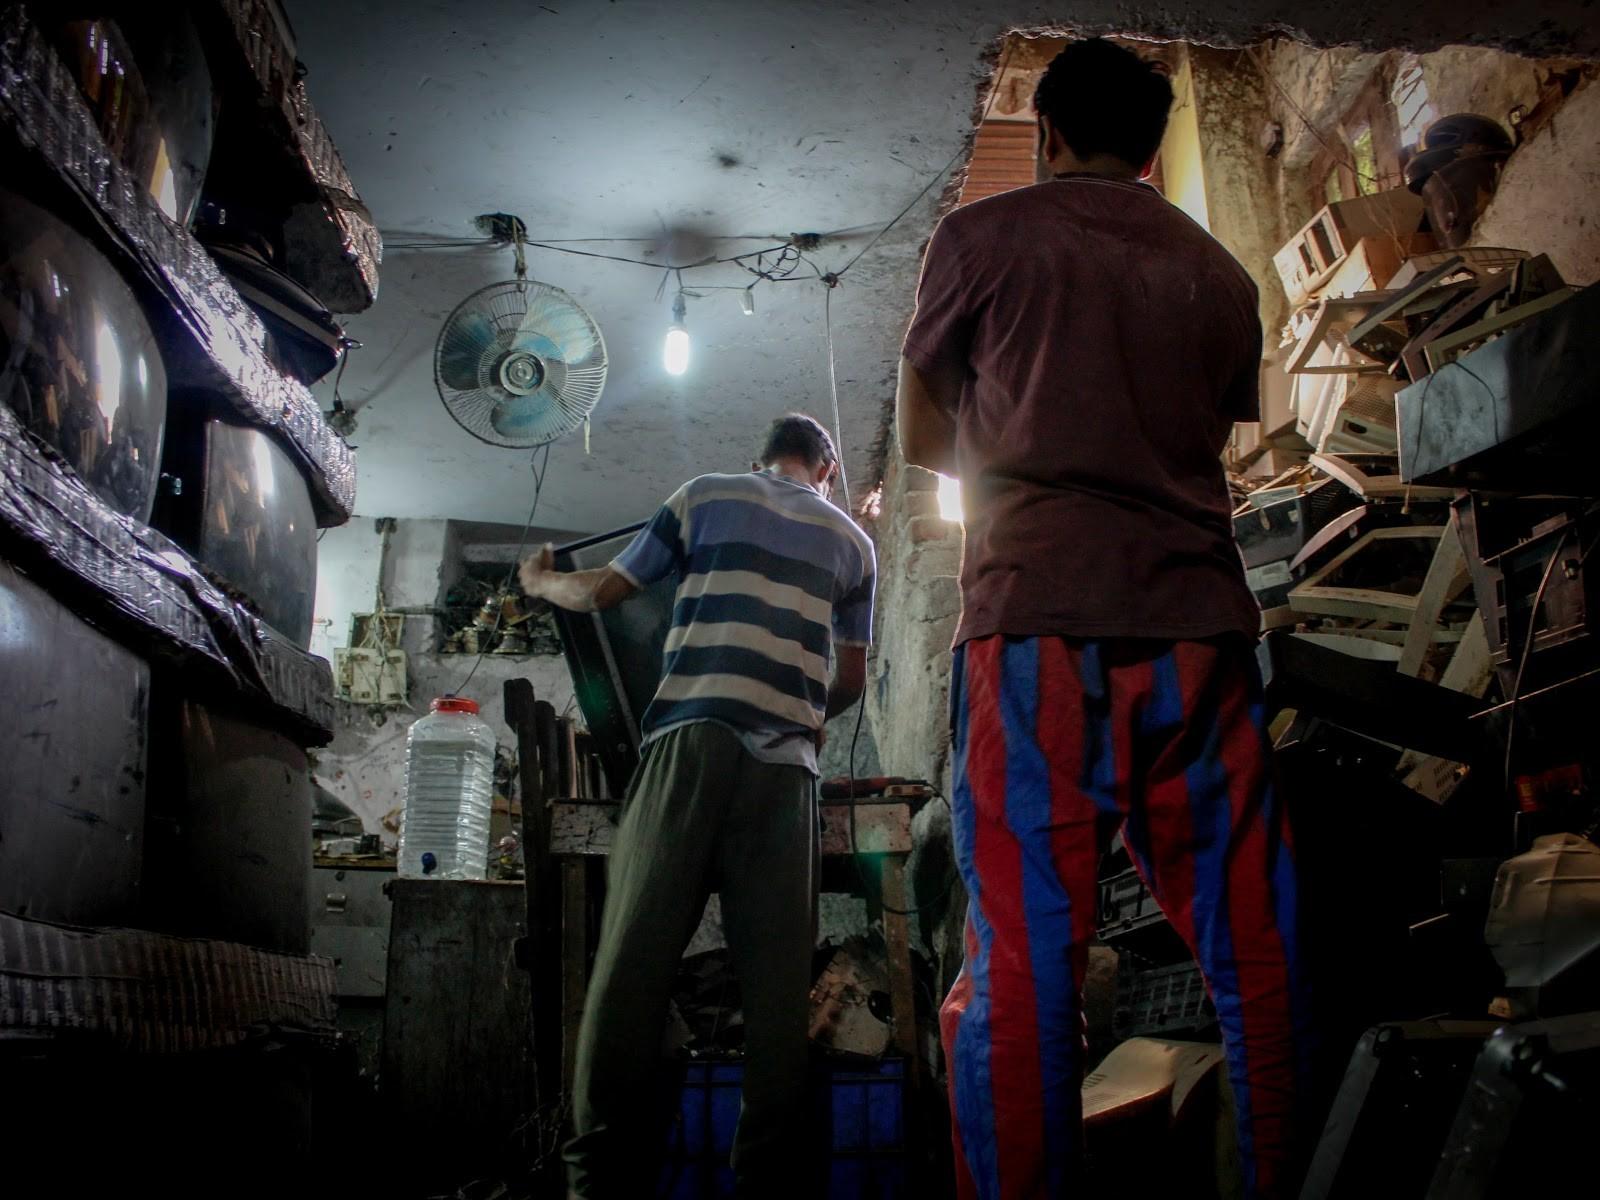
Dismantling Area + Primary Storage
Automobile and E waste processing workshops


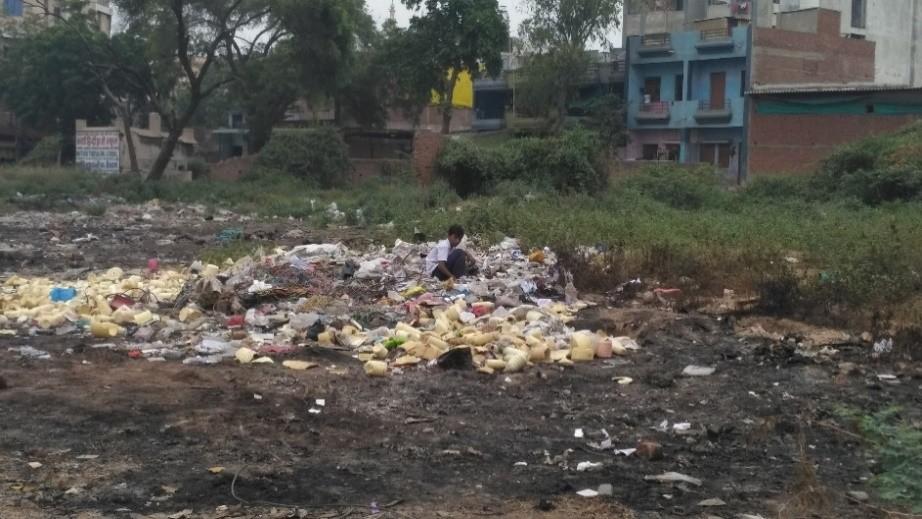
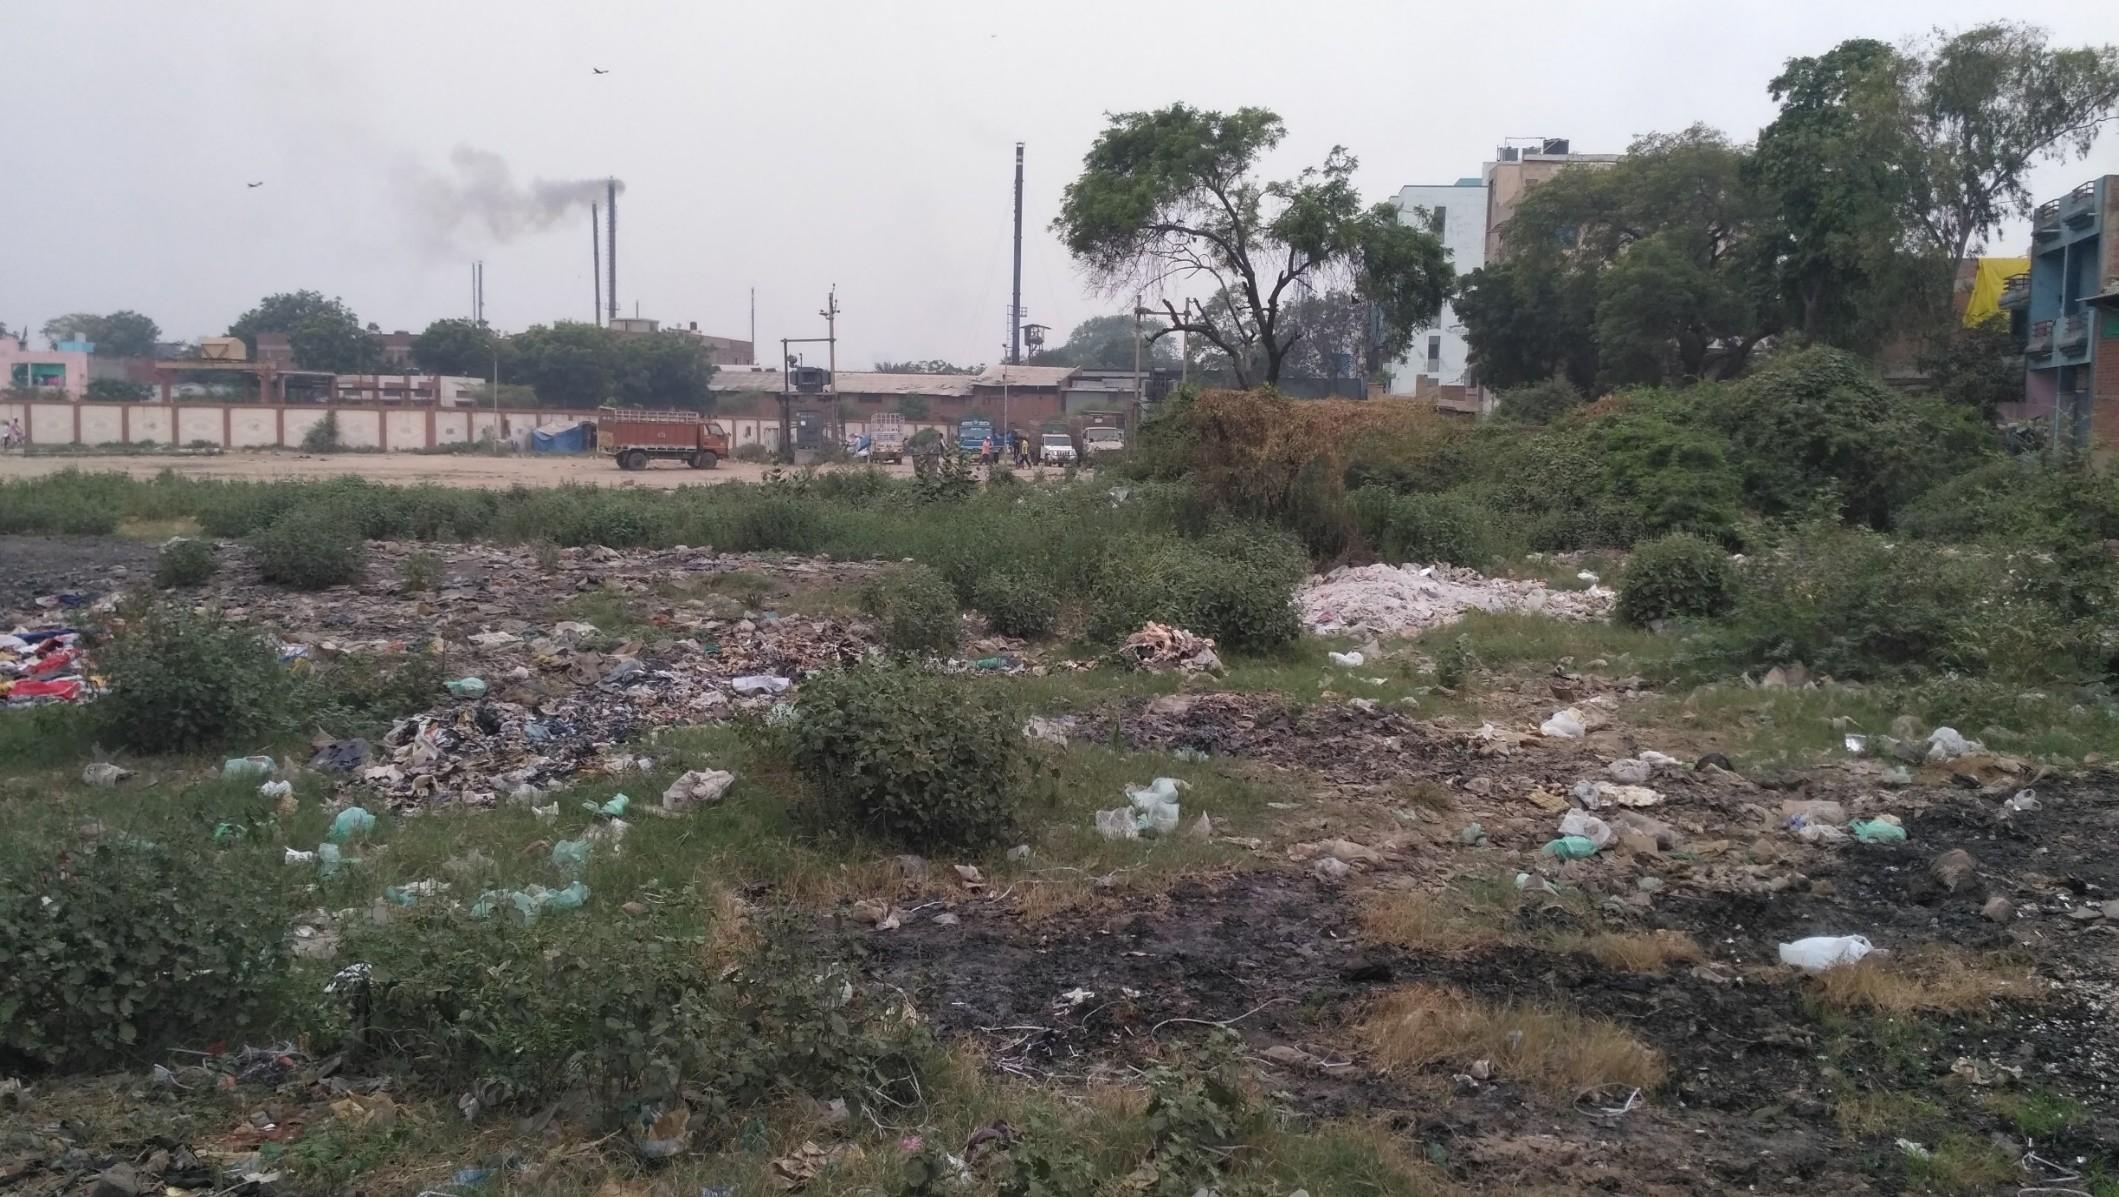
Incineration & Dumping Area
Kabadi Market, Dhani Limda, Ahmedabad
Dismantling Area + Primary Storage
Automobile and E waste processing workshops


Incineration & Dumping Area
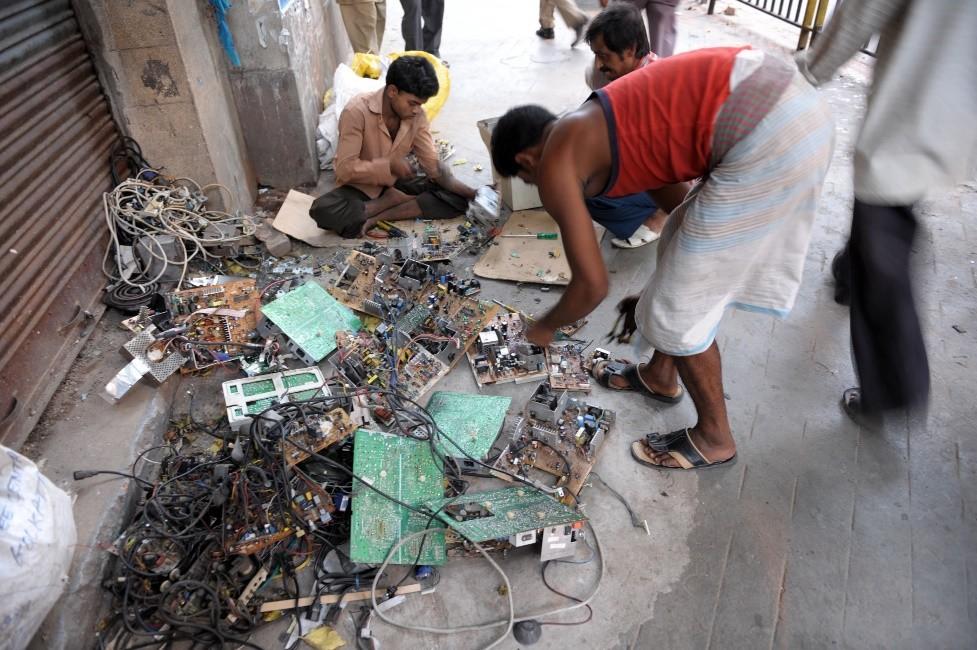
Workers engaged in Manual Dismantling Activities.
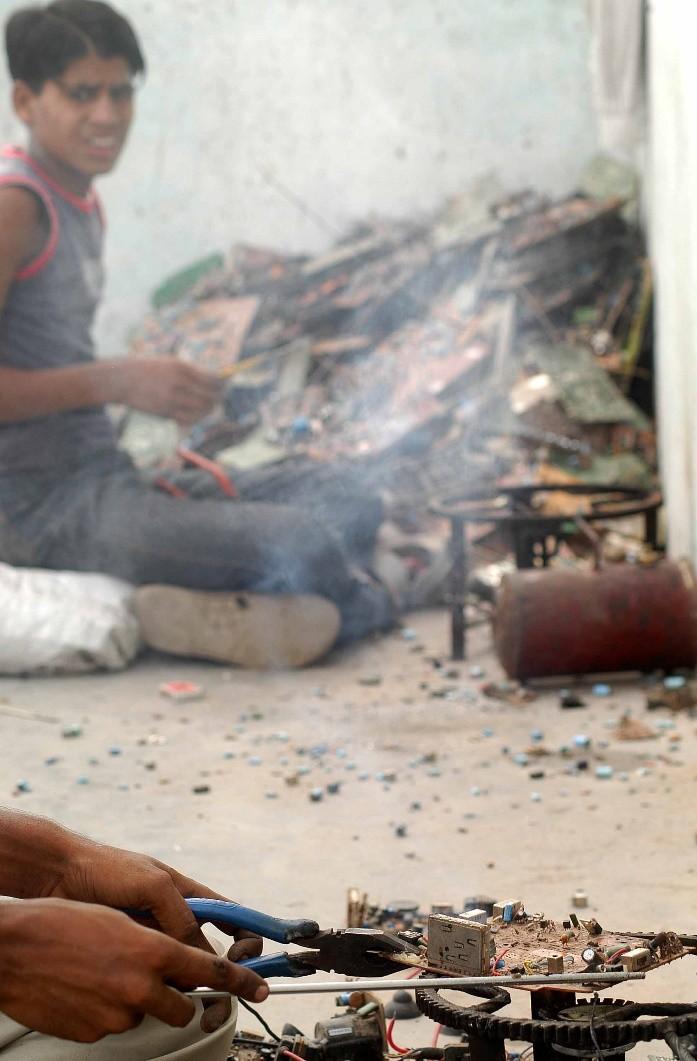
PCBs De-soldering Process

Heating of CRT for Recycling

• Located at backyard of Kabadi market (Danilimda).
• Open Burning of electrical wires for extraction of metal
• Air pollution has been major issue as identified during inspection, the surrounding region severely affected by the fumes produced on burning.
• Land is illegally used for dumping and incineration, hence degradation of soil is taking place.
Cathode ray tubes(CRTs) Breaking, removal of copper yoke, and dumping.
Silicosis; Cuts from CRT glass in care of implosion; Inhalation or contact with phosphor containing cadmium or other metals
Lead, barium and other
heavy metals leaching into
groundwater, release of toxic phosphor.
Printed circuit boards. De-soldering and removing computer chips.
Dismantled printed circuit board processing Open burning of waste boards that have had chips removed to remove final metals.
Tin and lead inhalation; Possible brominated dioxin, beryllium, cadmium, Mercury inhalation
Toxicity to workers and nearby residents from tin, lead, brominated dioxin, beryllium, cadmium, and mercury inhalation; Respiratory irritation.
• Air emission of same substances
Tin and lead contamination of immediate environment including surface and ground waters.
Brominated dioxins, beryllium, cadmium, and mercury emissions
Secondary steel or copper and precious smelting.
Furnace recovers steel or copper from waste including organics.
Exposure to dioxins and heavy metals.
Emissions of dioxins and heavy metals.
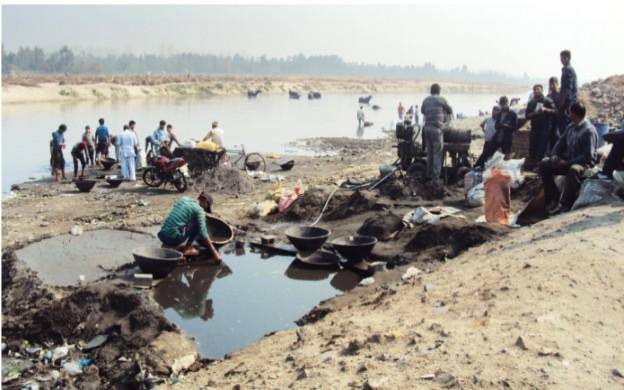
Chips and other gold plated components Chemical stripping using nitric and hydrochloric acid along riverbanks.
Acid contact with eyes, skin may result in permanent injury; Inhalation of mists and fumes of acids, chlorine and sulphur dioxide gases can cause respiratory irritation to severe effects including pulmonary edema, circulatory failure, and death.
Hydrocarbons, heavy metals, brominated substances, etc. discharged directly into river and banks; Acidification the river destroying fish and flora.
Plastics from computer and peripherals, e.g. printers, keyboards, etc.
Shredding and low temperature melting to be reutilized in poor grade plastics.
Computer wires. Open burning to recover copper.
Probable hydrocarbon, bromin ated dioxin, and heavy metal exposures.
Emissions of brominated dioxins and heavy metals and hydrocarbons.
Brominated and clorinated dioxin, polycyclic aromatic hydrocarbons (PAH) (carcinogen nic) exposure to workers living in the burning works area.
Hydrocarbon ashes including PAH’s discharged to air, water and soil.
Miscellaneous com puter parts encased in rubber or plastic, e.g. steel rollers.
Open burning to recover steel and other metals.
Hydrocarbon including PAHs and potential dioxin exposure.
Hydrocarbon ashes including PAH’s discharged to air, water and soil.
Distributors
Scrap Dealer I (Unorganized)
Scrap Dealers 2 (Organized)
Linkage E-Waste Flow Inferences
Linkage 1 Retailers, Subdistributors Consumers
Linkage 2 Retailers, Subdistributors Service Centre
• No significant e-waste generation.
• Retailers not accountable to share data of e waste generation.
• E waste generated is not channelized properly.
• Though rules are made but applicability is lacking for the accountability of generation of e waste.
• Informal sector is predominantly taking care of all the e waste generated.
Linkage E-Waste Flow Inferences
Linkage 6 Consum ers Refurbisher
• High amount of e-waste generation
• By rules refurbisher are accountable for generation and channelization of e waste.
• currently the implication of rules is not observed.
• High risk of e waste leakage to informal sector.
Linkage 3 Retailers, Subdistributors Informal Recyclers
• The channelization of e waste flow is through informal sector,
• Recyclers are majorly not authorised by the govt.
• The methods applied by the recyclers are not safe.
Linkage 7 Scrap Dealer I Scrap Dealer II
• The economic feasibility is responsible for the waste flow.
• The value of the product increases with the profit and labour cost add up.
• Manual methods used for dismantling and retrieving of components.
• Unhealthy methods are used for extraction of the metals.
Linkage 4 Consumer Scrap Dealer I
• Majorly through door to door collection.
• Monitory gain is expected by the consumers in place of discarded products.
• Reverse economic chain after the end of life of e products.
• Collection efficiency is very high.
Linkage 8 Scrap Dealer I Disposal
Linkage 9 Scrap Dealer II Disposal
Linkage 10 Formal Recycler s
Linkage 5 Consumers Formal recyclers
• Collection points are setup.
• Collection efficiency is quite low.
• The practice is against the market forces.
• The lack of rigid policy framework to channelize the flow.
Linkage 11 Informal Recycler s
Disposal
• Unhealthy disposal of e waste,
• Water and soil Contamination.
• Unhealthy disposal of e waste,
• Water and soil Contamination.
• Disposed (Dumping) and incinerated.
• Current practices are not environmentally sound.
• No sanitary landfilling.
• Waster and soil Contamination.
• Prone to leaching of metal.
Disposal
• Unhealthy disposal of e waste,
• Water and soil Contamination.
Central Pollution Control Board
1. Coordination with states
2. Guidelines and Standards
3. EPR Targets
4. Training and Awareness
5. Enforcement of RoHS
6. Incentives & Certifications
NGO Assisting in formalising the management of EWaste Bulk consumer
1. Recordkeeping (Bulk consumers) for scrutiny or SPCB
Individual Consumer
Gujarat Pollution Control Board
1. Inventorization of e-waste
2. Enforcement & implementation
3. Program implementation
- Producers are not able to achieve specified targets.
Authorized Collection Centre / Dismantler ? Recycler (ARFs)
1. Proper storage and handling
2. Proper transportation
3. Proper processing.
Informal Chain
No formal Takeback system
Dealer Exchange
Offers
Local recycler in exchange of money
Repair workshop who buy back.
- Collection inadequacy.
- Competition between informal and formal Recyclers.
- No provision of ban of informal recycling.
Manufacturer
1. Setup and finance of collection centres or take back schemes (Individually or jointly) Under EPR
Lack of transparency and information sharing
Urban Local Bodies
1. Collection of e-waste (non branded and orphaned)
Submit Annual Report Waste
2. RoHS
3. Product labelling and consumer awareness
4, Buyback schemes
- Bulk consumers are not liable to sell their products to the formal sector.
- The accountability and information sharing is not in practice.
Disposed to MSW


1. High employment opportunity.
2. High collection penetration of informal system at door to door level.
3. Adequate capacity formal recycling units installed in Gujarat.
4. Strengthen in government policies shows political will.
1. Dominance of informal sector over formal sector system.
2. E-waste leakage to informal sectors at various levels.
3. Quantification of e-waste generation is very difficult.
4. Profits are secured by large scrap dealers and informal recyclers.
5. Improper Implementation of government rules.
6. Formal recyclers are running short of supply.
1. Spreading awareness among people for safe disposal of e-waste.
2. Batter enforcement of the rules by the local government.
3. Collaborating the informal sector with the formal sector for economically efficient material chain.
1. Hazardous impact on the environment and health because of informal recycling.
2. Degradation of ecology because of open dumping of e-waste.
3. A huge e-waste recycler group may loose job.


Informal solution to a formal problem
Informal Sector
Refurbish/Reuse
Refurbish/Reuse
Interface Organisation


• Functions can be assumed as a local municipal ewaste management organisation

Disassembly
Disassembly
• Not a capital Intensive organisation.
• Buy Components, Scrap Devices Materials from informal collectors.
Recycling
Landfill/
Open Burning
Economic Flow
Recycling
Landfill/ Incineration
• Sell it to formal Recyclers.
• Financed by the Public funds collected by ARF and PRO.
• Interface organisation will charge the bills of subsidy to be refundable from govt.
Material Flow
E-Waste Material flow in the proposed System
Registration of all categories of waste collectors and provision of photoidentification. The registration could be renewable every ten years. Under shops and establishment act.
• Identification of Informal Sector clusters.
• Federating the informal sector workers into collectives.
• Establishment of Interface organisation collection points.
• Providing health and insurance for the scrap
• Law enforcement needed for bulk consumers can sell their obsolete items only to the registered waste dealers who are registered and comply with the proposed framework.
EEE Production
EEE Sales
E Waste Import
E Waste Generation
Door to door
E Waste Collection And trading (Registered)
Interface Organisation

Producers
(own recovery setup)
Refurbishing
Bidding by Bulk consumers. Disposal
(Dismantling and Primary Separation)
(Transport)
Formal Recyclers
EEE: Electronics and electrical equipment. EPR: Extended producer Responsibility.
Materi
als
flow
Description Examples
Type I No processing needed for use in formal sector
Type II
Relatively profitable to recycle in formal sector
Used DRAM, CPUs, scrap aluminium, steel
Used Markets
Formal Recycling Firms
Wires
Printed circuit boards (when informal recycling is inefficient)
Type III
Subsidy needed to recycle in formal sector
Copper wires with insulation
Informal Dismantlers
Interface
Organization
Government Agencies
IV - e.g. Casings
Type IV Too expensive to recycle in formal sector, for sanitary landfill, Not at all profitable, Totally waste
Plastic casings
Sanitary Landfill
Material Flow
Economic Flow
Profitability
Informal Sector > Formal Sector
Let mass of a product is M
(Incentive/Public Subsidy)
Profit = Revenue – Cost
Recycling Cost
Profit of Recycling
Monitory gain with the yield. Profit
Equation 1

f = Formal , I = Informal
M = Mass of the Product.
Y = Yield of recovering material / Per Unit
P = Average Price of recovered material per unit.
U = Average cost of processing Per Unit of Mass
Profit transfer = {(Profit in Formal Processing – Profit in Informal Processing) – Transportation informal to formal }
Case I : At Zero Profit,
P = Average price of recovered material .


Case I : Informal Recycling is more profitable than formal recycling.
• Have to function against the market force.
• The interface organisation will act as a subsidized quasi-public entity designed to deliver a public good.
• Price Subsidy – Set by some public organisations.
Informal Collectors Interface Organisation Formal Recyclers
+ SUBSIDY
Public Fund (Cost Sharing)
• The public fund will be collected for electronics end of life mechanism such as e-market for return deposit or EPR. Circular Economy.

It’s Important to trace the material flow. Transparency and Accountability of Stakeholders
• Providing registration number to all the bulk consumers, producers, dealers.
• During any material flow it should be updated with the registration numbers of suppliers and receiver along with the quantity of the waste.
• The material flow can be traced this way.
• Data should be published in public domain.
• SMEs need to provide update of their material flow twice a year to state agencies or local authority.
• Bulk consumers and Formal recyclers etc. need to provide update of their input output to state/state agencies.
• Information sharing between state and central agencies.

1- E Waste management as national Agenda should be promoted for spreading awareness regarding e-waste
Clean India Mission + Digital India Mission = Clean Digital India Mission
• Cross Ministry Collaboration, Skill India Mission
2- School should incorporate e-waste related education in to the academics.
3 Compelling consumers to deposit back their equipment to producers.
• Imposing high ARF (Advance Recycling Fee) and deposit refund scheme should be strictly followed.
• 10-15% of the cost of commodity should be the deposit refund.
• Implemented by all the large producer companies.

Other Policy Level Recommendations
• Collection and recycling centres in the development plans. Reserving space for scrap markets in the development plans.
• Taxing E waste manufacturers with an obsolescence tax that would be levied on all products that would enter the E waste stream.
• The tax collection could be diverted to create the institutional mechanisms/frameworks to support informal waste collectors and micro enterprises.
• The ARF should be levied on the price of the equipment.
• Extra price should be added to the MRP of the equipment as the refund value on depositing back to producers.
• The rule should be enforced that that all the bulk consumers should sell their scrap by the means of bidding etc; only to the registered scrap dealers who comply with the proposed system.
Dasgupta, D., Debsarkar, A., Hazra, T., Bala, B. K., & Gangopadhyay, A. (2016 ). Scenario of future e-waste generation and recyclereuselandfill based disposal pattern in India: a system. Springer Science+Business Media Dordrecht 2016, 1473-1487.
Kumar and , P., & S, S. (2007). Estimation and Material Flow Analysis of Waste Electrical and Electronic Equipment (WEEE) - A case study of Mangalore City, Karnataka, India. the International Conference on Sustainable Solid Waste Management (pp. 148-154). Chennai : National Institute of Technology Karnataka, Surathkal, Karnataka, India.
Abhishek Kumar Awasthi, J. L. (2017). Management of electrical and electronic waste:A comparative evaluation of China and India. Renewable and Sustainable Energy Reviews, 434–447.
Ari, V. (2016). A Review of Technology of Metal Recovery from Electronic Waste. Retrieved 08 22, 2017, from https://www.researchgate.net/publication/304614936_A_Review_of_Technology_of_Metal_Recovery_from_Electronic_Waste
Awasthi, A. K., & Li, J. (2017). Management of electrical and electronic waste: A comparative evaluation of China and India. Renewable and Sustainable Energy Reviews, 76, 434–447. Retrieved 8 28, 2017, from http://www.elsevier.com/locate/rser
Kumar, 1., & Singh, D. D. (2013)). E – Waste Management through Regulations. International Journal of Engineering Inventions, 3(2), 0614.
CEAMA, A. W. (n.d.). Imlications issues & recommendations for handling home appliances and consumer electronics. APCO Worldwide.
Centre for Science and Environment. (2015). Recommendations to address the issue of informal sector involved in e-waste handling. New Delhi: Centre for Science and Environment. Retrieved 09 08, 2017, from www.cseindia.org.
Deepali Sinha-Khetriwal, P. K. (2005). A comparison of electronic waste recycling in Switzerland and in India. Environmental Impact Assessment Review, 492– 504.
Dipsikha Dasgupta, A. D. (2017). Scenario of future e-waste generation and recycle-reuselandfill-based disposal pattern in India: a system. Environ Dev Sustain, 1473–1487.
Dr. Lakshmi Raghupathy, M. C. (2007). E-Waste Recycling In India – Bridging The Gap Between The Informal And Formal Sector. MAIT-GTZ, GTZ-ASEM, adelphi.
Dwivedy, M., & Mittal, R. (2010). Estimation of future outflows of e-waste in India. Waste Management 30, 483-491.
Dyson, B., & Chang, N.-B. (2005). Forecasting municipal solid waste generation in a fast-growing. Waste Management 25, 669-679.
Guptha, C. K., & Shekar, G. L. (2009). Electronic Waste Management System In Bangalore – A Review. JK Journal of Management & Technology, 1, 11–24. Retrieved from http://www.ripublication.com/jkjmt.htm
Hong, J., Wenxiao, S., Yutao, W., Xiangzhi Li d, C., & Xiangzhi, L. (2015). Life cycle assessment of electronic waste treatment. Waste Management.
Kumar, R., & Karishma. (2016, January). Current Scenario of e-waste management in India:issues and strategies. International Journal of Scientific and Research Publications, 6(1).
Lukose, M. N. (2015). A Review on E-waste Management and Recycling Challenges in India. International Journal of Scientific & Engineering Research, 2229-5518.
Mundara, M. N., Kumar, S., & Shekhar, A. V. (2007). Ewaste: a new challenge for waste management. ‐ International Journal of Environmental Studies, 265-279. Retrieved from http://dx.doi.org/10.1080/0020723042000176060
Nadali, A., Shirmardi, M., Babei, A., Takdastan, A., & Bagheri, N. (2015). Waste electrical and electronic equipment (WEEE) estimation: A case study of Ahvaz City, Iran. Journal of the Air & Waste Management Association, 98-305. Retrieved from http://dx.doi.org/10.1080/10962247.2014.976297
Pariatamby, A., & Victor, D. (2013). Policy trends of e-waste management in Asia. The 7th International Conference on Waste Management (pp. 411–419). Japan: Springer.
Satish Sinha, P. M. (2007). WASTE ELECTRICAL AND ELECTRONIC EQUIPMENT: The EU and India: sharing best practices. New Delhi: Matt Macdonald, Toxic Link .
Schluep, D. M. (n.d.). D Case Study / Switzerland: E- waste management. Federal Laboratories for Materials Research and Technology (Empa), Technology & Society Lab.
Sushant B. Wath, A. N. (2017). A roadmap for development of sustainable E-waste management system in India. Science of the Total Environment, 434–447.
Wath, S., Vaidya, A., Dutt, P., & Chakrabarti, T. (2010). A roadmap for development of sustainable E-waste management system in India. A roadmap for development of sustainable E-waste management system in India, 19-32.


