E-Waste Management
A Case of Ahmedabad City Proposal Stage
Sandeep Verma, 16AR60R18
Department of Architecture and Planning
Indian Institute of Technology, Kharagpur
Guided by : Prof. Arup Das


Sandeep Verma, 16AR60R18
Department of Architecture and Planning
Indian Institute of Technology, Kharagpur
Guided by : Prof. Arup Das
Introduction & Discussion on existing situation
E Waste Generation Model
Management system Model

Economic Model
Conclusion
Memnaga r
Gandhigram
Pal di Vasn a
Madhupura Old Ahmedabad Jamalpu r
Chandola lake
Makarpur a
Kankariya lake
Baherampura
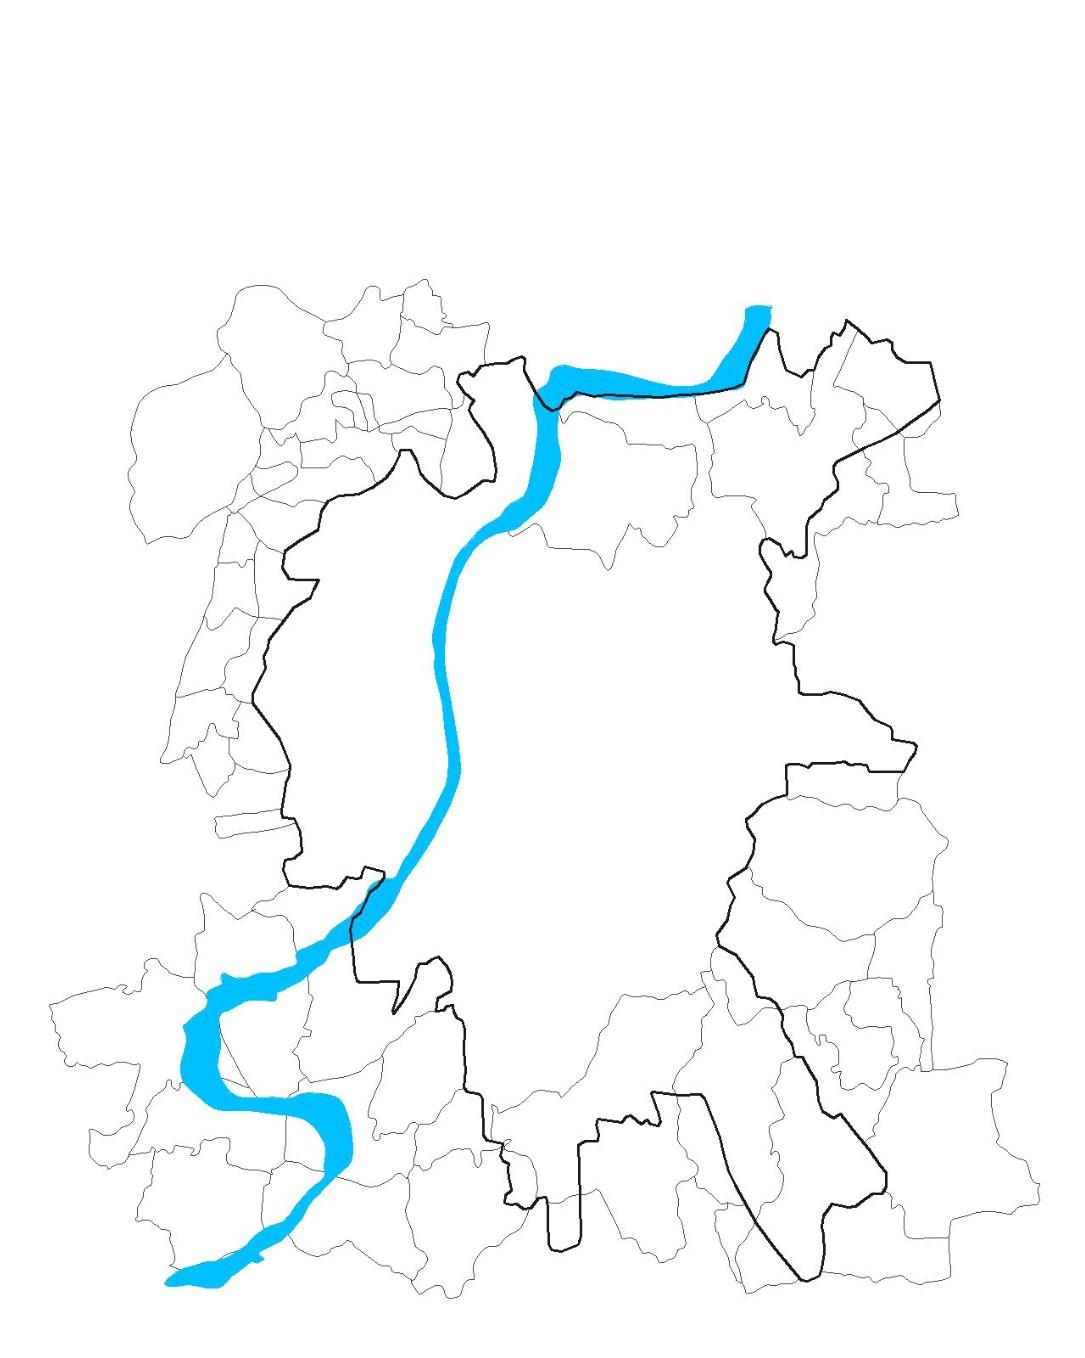
Jamalpur Weekly Market
Dudhleshwar
Madhupura
MemNagar
Rakhial
Gujjari
Market
Hatkeshwar
Hatkeshwar Jasodha Nagar
Vatva
Kabadi Market (Dhani
Limda)
Vatva
Recyclers
 1. E-Process House
2. E-coli Waste Management P. Ltd
3. ECS Environment Ltd
4. Pruthavi E-Recycle Pvt. Ltd
5. M/s. Earth E-Waste Management Pvt. Ltd
6. M/s. Gujarat Refilling Centre
7. M/s. Greencare E-Recycle Company
8. M/s Felix Industries Pvt. Ltd.
9. M/s Recotech E-waste Management
10. M/s. E-front line recycling Pvt. Ltd.
1. E-Process House
2. E-coli Waste Management P. Ltd
3. ECS Environment Ltd
4. Pruthavi E-Recycle Pvt. Ltd
5. M/s. Earth E-Waste Management Pvt. Ltd
6. M/s. Gujarat Refilling Centre
7. M/s. Greencare E-Recycle Company
8. M/s Felix Industries Pvt. Ltd.
9. M/s Recotech E-waste Management
10. M/s. E-front line recycling Pvt. Ltd.


1. High employment.
2. High collection penetration of informal system at door to door level.
3. Adequate capacity formal recycling units installed in Gujarat.
4. Strengthen in government policies shows political will.
1. Dominance of informal sector over formal sector system.
2. E-waste leakage to informal sectors at various levels.
3. Quantification of e-waste generation is very difficult.
4. Profits are secured by large scrap dealers and informal recyclers.
5. Improper Implementation of government rules.
6. Formal recyclers are running short of supply.
1. Spreading awareness among people for safe disposal of e-waste.
2. Batter enforcement of the rules by the local government.
3. Collaborating the informal sector with the formal sector for economically efficient material chain.
1. Hazardous impact on the environment and health because of informal recycling.
2. Degradation of ecology because of open dumping of e-waste.


Informal Sector
Collection
Refurbish/Reuse
Formal Sector
Collection
Refurbish/Reuse
Disassembly
Disassembly
Recycling
Landfill/ Open Burning
Recycling
Landfill/ Inceneration
Economic Flow

Material Flow
Registration of all categories of waste collectors and provision of photo-identification. The registration could be renewable every ten years. Under shops and establishment act.

• Identification of Informal Sector clusters.
• Providing registration to every scrap dealer.
• Federating the informal sector workers into collectives.
• Clustering/Union formation/ Grouping of various scrap dealers who will only deal with the mechanised system.
• Establishment of Interface organisation collection points into the city. For informal scrap dealers to exchange their materials and scrap with money.
• Providing health and insurance for the scrap dealers those who comply with the system and agrees upon channelize material via proposed framework.
• Law should be enforced that bulk consumers can sell their obsolete items only to the registered waste dealers who are registered and comply with the proposed framework.
E Waste Import
E Waste Generation
Door to door
Bidding by Bulk consumers.
EEE Sales
EEE Production
Interface Organisation
E Waste Collection And trading (Registered)
(Dismantling and Primary Separation)
E
Refurbishing
(Transport)
Producers
(own recovery setup)
EEE: Electronics and electrical equipment.
Formal Recyclers
EPR: Extended producer Responsibility.
Disposal


E-Waste Generation
Informal
Sector
Interface Organisation
Formal Sector
Disposal
Interface Organisation
• Functions can be assumed as a local municipal e-waste management organisation
• Not a capital Intensive organisation.
• Buy Components, Scrap Devices Materials from informal collectors.
• Sell it to formal Recyclers.
• Financed by the Public funds collected by ARF and PRO.
• Interface organisation will charge the bills of subsidy to be refundable from govt.
Materials flow Description
Examples
Type I No processing needed for use in formal sector Used DRAM, CPUs, scrap aluminium, steel
Type II Relatively profitable to recycle in formal sector Printed circuit boards (when informal recycling is inefficient)
Type III Subsidy needed to recycle in formal sector Copper wires with insulation
Type IV Too expensive to recycle in formal sector, for sanitary landfill, Not at all profitable, Totally waste Plastic casings DRAM
Formal Recycling Firms
Used Markets
II - e.g. PCBs
III - e.g. Wires
Informal Dismantlers
I - e.g. CPUs
II-IV
Interface Organization
IV - e.g. Casings
Government Agencies
Material Flow
Economic Flow
Sanitary Landfill
Note:
• Not all the informal processes create significant risk.
• Intervention is required for only processes those are unacceptable.
High Impact
Cyanide/acid treatment of boards.
Open burning of wire insulation.
Low Impact
Informal Collection, Repair, Dismantling.
Informal Collectors
(Low Impact Activities)
Informal Recyclers
(High Impact Activities)
• Interface organisation must purchase before undesired recycling takes place.
• It does not purchase already treated boards or burnt wires
Profitability
Informal Sector > Formal Sector (Incentive/Public Subsidy)
Formal Sector > Informal Sector Follow Market force
Research – Rochat and collaborators


Output – More profit to export PCBs to Europe rather than process ourselves. (Indian Context )
Depending on the process differences in the economic and technology conditions which is more profitable is the key question
An economic Model to be formed:
• To determine when a flow from informal to formal needs to be subsidised.
• Should follow Market forces.
Comparing profitability of informal Recycling Vs transport from an informal site followed by formal processing
Let mass of a product is M
Profit = Revenue – Cost
Recycling Cost
Profit of Recycling
Monitory gain with the yield.
Profit of Recycling = M * Y * P – M * U
Equation 1

M = Mass of the Product.
Y = Yield of recovering material / Per Unit
P = Average Price of recovered material per unit.
U = Average cost of processing Per Unit of Mass
f = Formal , I = Informal Profit transfer = {(Profit in Formal Processing – Profit in Informal Processing) – Transportation informal to formal }
Tif and (Uf – Ui ) be constant


Tif = Per unit cost to transport material from the informal to formal facility
Case I : At Zero Profit,
P = Average price of recovered material .
Case I : Informal Recycling is more profitable than formal recycling.
• Have to function against the market force.
• The interface organisation will act as a subsidized quasi-public entity designed to deliver a public good.
Informal Collectors
+ SUBSIDY
Interface Organisation

(Cost Sharing)
Public Fund
Formal Recyclers
• Subsidy is needed just to balance the equation
• Informal collectors and dismantlers are paid more to sell to the interface organisation rather than informal recyclers.
• Price Subsidy – Set by some public organisations.
• The public fund will be collected for electronics end of life mechanism such as e-market for return deposit or EPR. Circular Economy.
Cost sharing (Subsidy to be provided)
Quantity of waste to be recycled
Minimum Input for making Formal recycling profitable.
Formal Recycling
Recycling (Informal Sector)
Collection + Dismantling (Informal Sector)
Cobb- Douglas Production Function


Real world design of an interface organisation would need carefully planning to avoid potential failures.
Lack of participation from Informal Sector.
• Spreading awareness among the clusters of informal sectors.
• Incentives and subsidy should be adequate.
• Establishment of trust.
• System be design in consultation with the informal sectors and with consideration of their needs. Corruption
• Possibilities like interface organisation charges bills for parts and equipment not actually sent for formal recycling.
• To route the subsidy through the formal recycling firms receiving the equipment.
• Formal Recycling firms pays a premium price to the interface organisations.
• Medium and large firms are easier to monitor than local government.
• Forces larger risk on firms if exposed.
Informal Collectors Interface Organisation Formal Recyclers
+ SUBSIDY
+ SUBSIDY
Public Fund
(Cost Sharing)
(Cost Sharing)
Public Fund
Smuggling “Different institutions /recyclers that could finance subsidy system to encourage flows from informal to formal recycling.”
Solution: Traceability system could solve this problem.
Information tags in electronics would verify that components processed by an interface organisation.


Informal Collectors Interface Organisation Formal Recyclers
Material Subsidy (Cost Sharing)
Economic profitability of transfer from informal to formal sector does not necessarily ensure that transfer would take place.
• Problematic legal status of informal recyclers.
• Insufficient knowledge on the part of informal collectors and dismantlers.
• Lack of capital to establish an interface organisation, need to establish collection facilities + system of purchasing selling & exporting circuit boards.
• Reluctance in the part of formal Recyclers to enter into business relationship with the informal sector.
• Possibility of strong Loyalties within the informal recycling chain or in informal recyclers have non economic means.
• Threats of violence, mafia for persuading collectors and dismantlers to sell to them rather than interface organisation.
Informal Collectors

Time Delay
(Financial Buffer is required)
Formal Recyclers


Collection at Interface Organisation And Store
Integrating Individual scrap dealers in to collective group
Formal Recyclers Disposal Transport Transport
• Formation of systematic clustering of scrap dealers, area wise,
• Selection of union representatives from various parts of the city.
• Fair participation in the decision making regarding system design & Economic incentives to be provided.
• Annual meeting between all important stake holders to address the grievances of informal groups.
It’s Important to trace the material flow in the circular economy.
• Providing registration number to all the bulk consumers, producers, dealers.
• During any material flow it should be updated with the registration numbers of suppliers and receiver along with the quantity of the waste.
• The material flow can be traced this way.
• Data should be published in public domain.

• SMEs need to provide update of their material flow twice a year to state agencies or local authority.
• Bulk consumers and Formal recyclers etc. need to provide update of their input output to state/state agencies.
• Information sharing between state and central agencies.
1- E Waste management as national Agenda should be promoted for spreading awareness regarding e-waste
Clean India Mission + Digital India Mission = Clean Digital India Mission
• Cross Ministry Collaboration, Skill India Mission
2- School should incorporate e-waste related education in to the academics.
3 Compelling consumers to deposit back their equipment to producers.
• Imposing high ARF (Advance Recycling Fee) and deposit refund scheme should be strictly followed.
• 10-15% of the cost of commodity should be the deposit refund.
• Implemented by all the large producer companies.


• Collection and recycling centres in the development plans. Reserving space for scrap markets in the development plans.
• Taxing E waste manufacturers with an obsolescence tax that would be levied on all products that would enter the E waste stream.
• The tax collection could be diverted to create the institutional mechanisms/frameworks to support informal waste collectors and micro enterprises.
• The ARF should be levied on the price of the equipment.
• Extra price should be added to the MRP of the equipment as the refund value on depositing back to producers.
• The rule should be enforced that that all the bulk consumers should sell their scrap by the means of bidding etc; only to the registered scrap dealers who comply with the proposed system.
• Total ban on illegal exports of electronic items.
• Lifespan of the reused and stored electronic items are considered as 3 years.
• 50% of the total reused items are further stored, whereas 20% and 30% items are recycled and landfilled (X5=0.50 ; X6=0.20; X7=0.30 )
• 20% and 80% of the stored items are recycled and landfilled (X8, X10=0.20, X9, X11= 0.80)
The projected /Input Sales figure for estimation of e-waste under AMA


• Source : Dwivedi and Mittal..2007
X1….X11 = Fraction of obsolete electronic items for various EOL (End of Life) scenario (Reuse, stored, recycled, landfilled)


For Year 2018-2019
For Year 2019-2020

The success of policies in driving the transition towards green economies often relies on their ability to include informal sector.
• Civic Societies to Play a role.
• Create awareness and engagement
• Need to capitalise on the strength of Informal workforce.
• Sharing of knowledge resources and technology.
• Encouragement for R&D for better technologies for better management of the waste.
• Laws and Policies should be strictly implemented.
