COLUMN
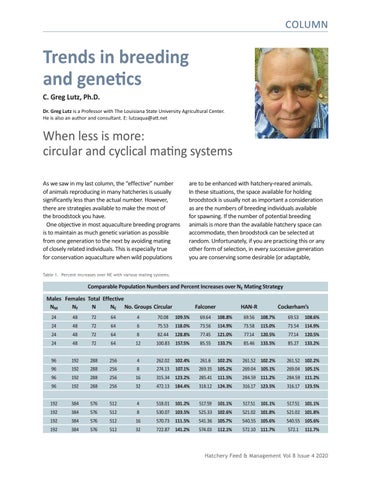
Trends in breeding and genetics C. Greg Lutz, Ph.D. Dr. Greg Lutz is a Professor with The Louisiana State University Agricultural Center. He is also an author and consultant. E: lutzaqua@att.net
When less is more: circular and cyclical mating systems As we saw in my last column, the “effective” number of animals reproducing in many hatcheries is usually significantly less than the actual number. However, there are strategies available to make the most of the broodstock you have. One objective in most aquaculture breeding programs is to maintain as much genetic variation as possible from one generation to the next by avoiding mating of closely related individuals. This is especially true for conservation aquaculture when wild populations
are to be enhanced with hatchery-reared animals. In these situations, the space available for holding broodstock is usually not as important a consideration as are the numbers of breeding individuals available for spawning. If the number of potential breeding animals is more than the available hatchery space can accommodate, then broodstock can be selected at random. Unfortunately, if you are practicing this or any other form of selection, in every successive generation you are conserving some desirable (or adaptable,
Table 1. Percent increases over NE with various mating systems.
Comparable Population Numbers and Percent Increases over NE Mating Strategy
Males Females Total Effective
NM
NF N NE
No. Groups Circular
24 48 72 64
Falconer
HAN-R
Cockerham’s
4 70.08 109.5% 69.64 108.8% 69.56 108.7% 69.53 108.6%
24
48 72
64
6
75.53 118.0% 73.56 114.9% 73.58 115.0% 73.54 114.9%
24
48 72
64
8
82.44 128.8% 77.45 121.0% 77.14 120.5% 77.14 120.5%
24
48 72
64
12
100.83 157.5% 85.55 133.7% 85.46 133.5% 85.27 133.2%
96
192 288 256
4
262.02 102.4% 261.6 102.2% 261.52 102.2% 261.52 102.2%
96
192 288 256
8
274.13 107.1% 269.35 105.2% 269.04 105.1% 269.04 105.1%
96
192 288 256
16
315.34 123.2% 285.41 111.5% 284.59 111.2% 284.59 111.2%
96
192 288 256
32
472.13 184.4% 318.12 124.3% 316.17 123.5% 316.17 123.5%
192
384 576 512
4
518.01 101.2% 517.59 101.1% 517.51 101.1% 517.51 101.1%
192
384 576 512
8
530.07 103.5% 525.33 102.6% 521.02 101.8% 521.02 101.8%
192
384 576 512
16
570.73 111.5% 541.36 105.7% 540.55 105.6% 540.55 105.6%
192
384 576 512
32
722.87 141.2% 574.03 112.1% 572.10 111.7% 572.1 111.7%
Hatchery Feed & Management Vol 8 Issue 4 2020