San Francisco Sales Summary Single Family Sales Over $4M Condo Sales Over $2.5M


San Francisco Sales Summary Single Family Sales Over $4M Condo Sales Over $2.5M
$ 2.5 B I L L I O N S O L D
The Warrin team is pleased to present you with our annual report on the San Francisco real estate market. The housing market moderated in 2024 after a strong first half of the year but overall remained positive. The inventory of homes for sale increased in 2024, with the greater number of options helping to bring more buyers off the sidelines. Home prices experienced steady appreciation, though economic shifts and external factors influenced both supply and demand.
A renewed push for a return to the office drove demand for homes in the inner San Francisco Bay Area, while increased stability in the technology sector and record stock market gains fueled sales in the higher price segments. Economists are projecting a more active housing market in 2025. Mortgage rates will vary throughout the year but will likely stay within the 6% - 7% range. So far, the spring market is off to a strong and healthy start.
For the year:
• The median single family home price rose 4.9%, to $1,625,000
• The median condo/TIC/co-op price rose 2.3%, to $1,125,000
• The overall number of homes sold rose 11.4%, to 4,570
• The average SFH sale price was 11.3% over asking, up 4.3% from 2023
• The number of luxury homes sold in San Francisco (over $4M) rose 43% to 193 homes
The biggest sales in SF were:
• 2840 Broadway (Purchased by Laurene Jobs), $71M
• 2799 Broadway (Sold by the founders of the Battery), $39.15M
• 290 Seacliff (Sold by VC George Sarlo), $26M
• 3630 Jackson (Sold by VC, and Co-Founder of Hotwire), $24M
• 825 Francisco (Sold by one of the founders of Silicon Valley), $22.1M
• 2350 Broadway, $21.8M
With $140,000,000 in sales last year, The Warrin Team was the #1 team at Golden Gate Sotheby’s in San Francisco and Marin, and one of the top teams in the country. We’d like to take a minute to thank all our friends, clients, and colleagues who have entrusted us to help with their real estate needs. We wish you a very happy and healthy 2025.

TOP
If you have questions about the market or your home, call us anytime at 415-299-8999, or email team@warrinteam.com.


SOLD
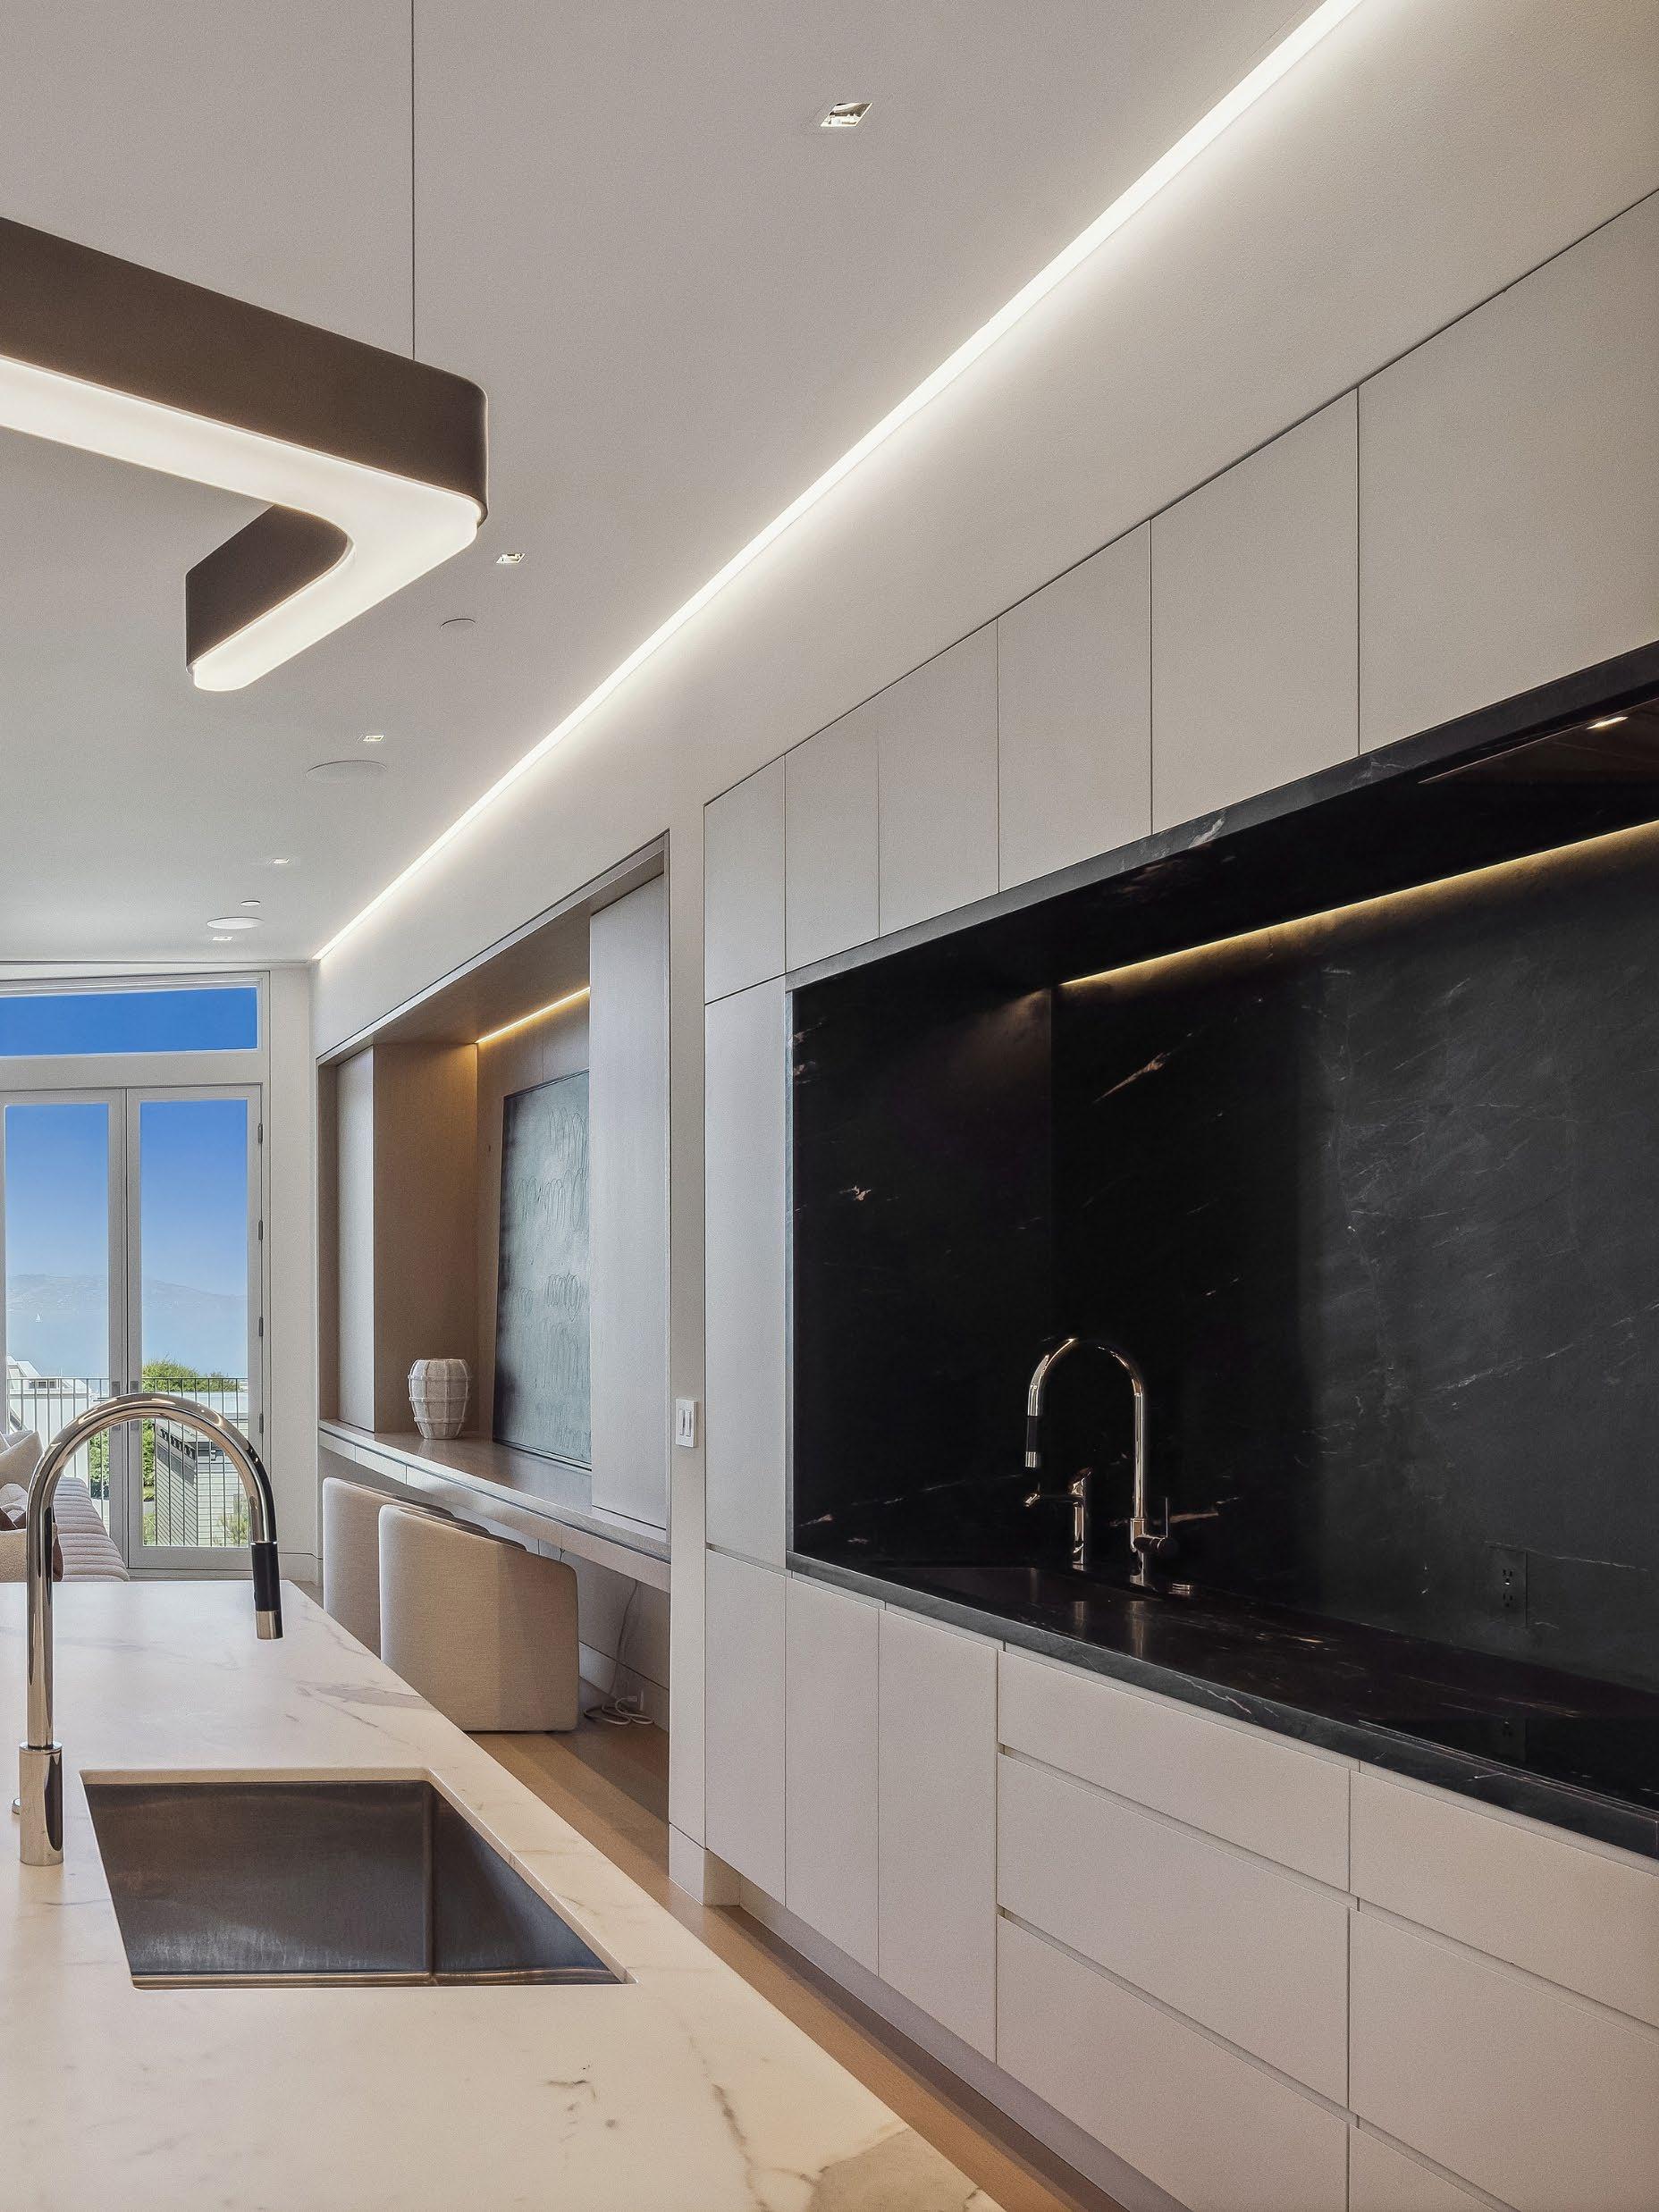
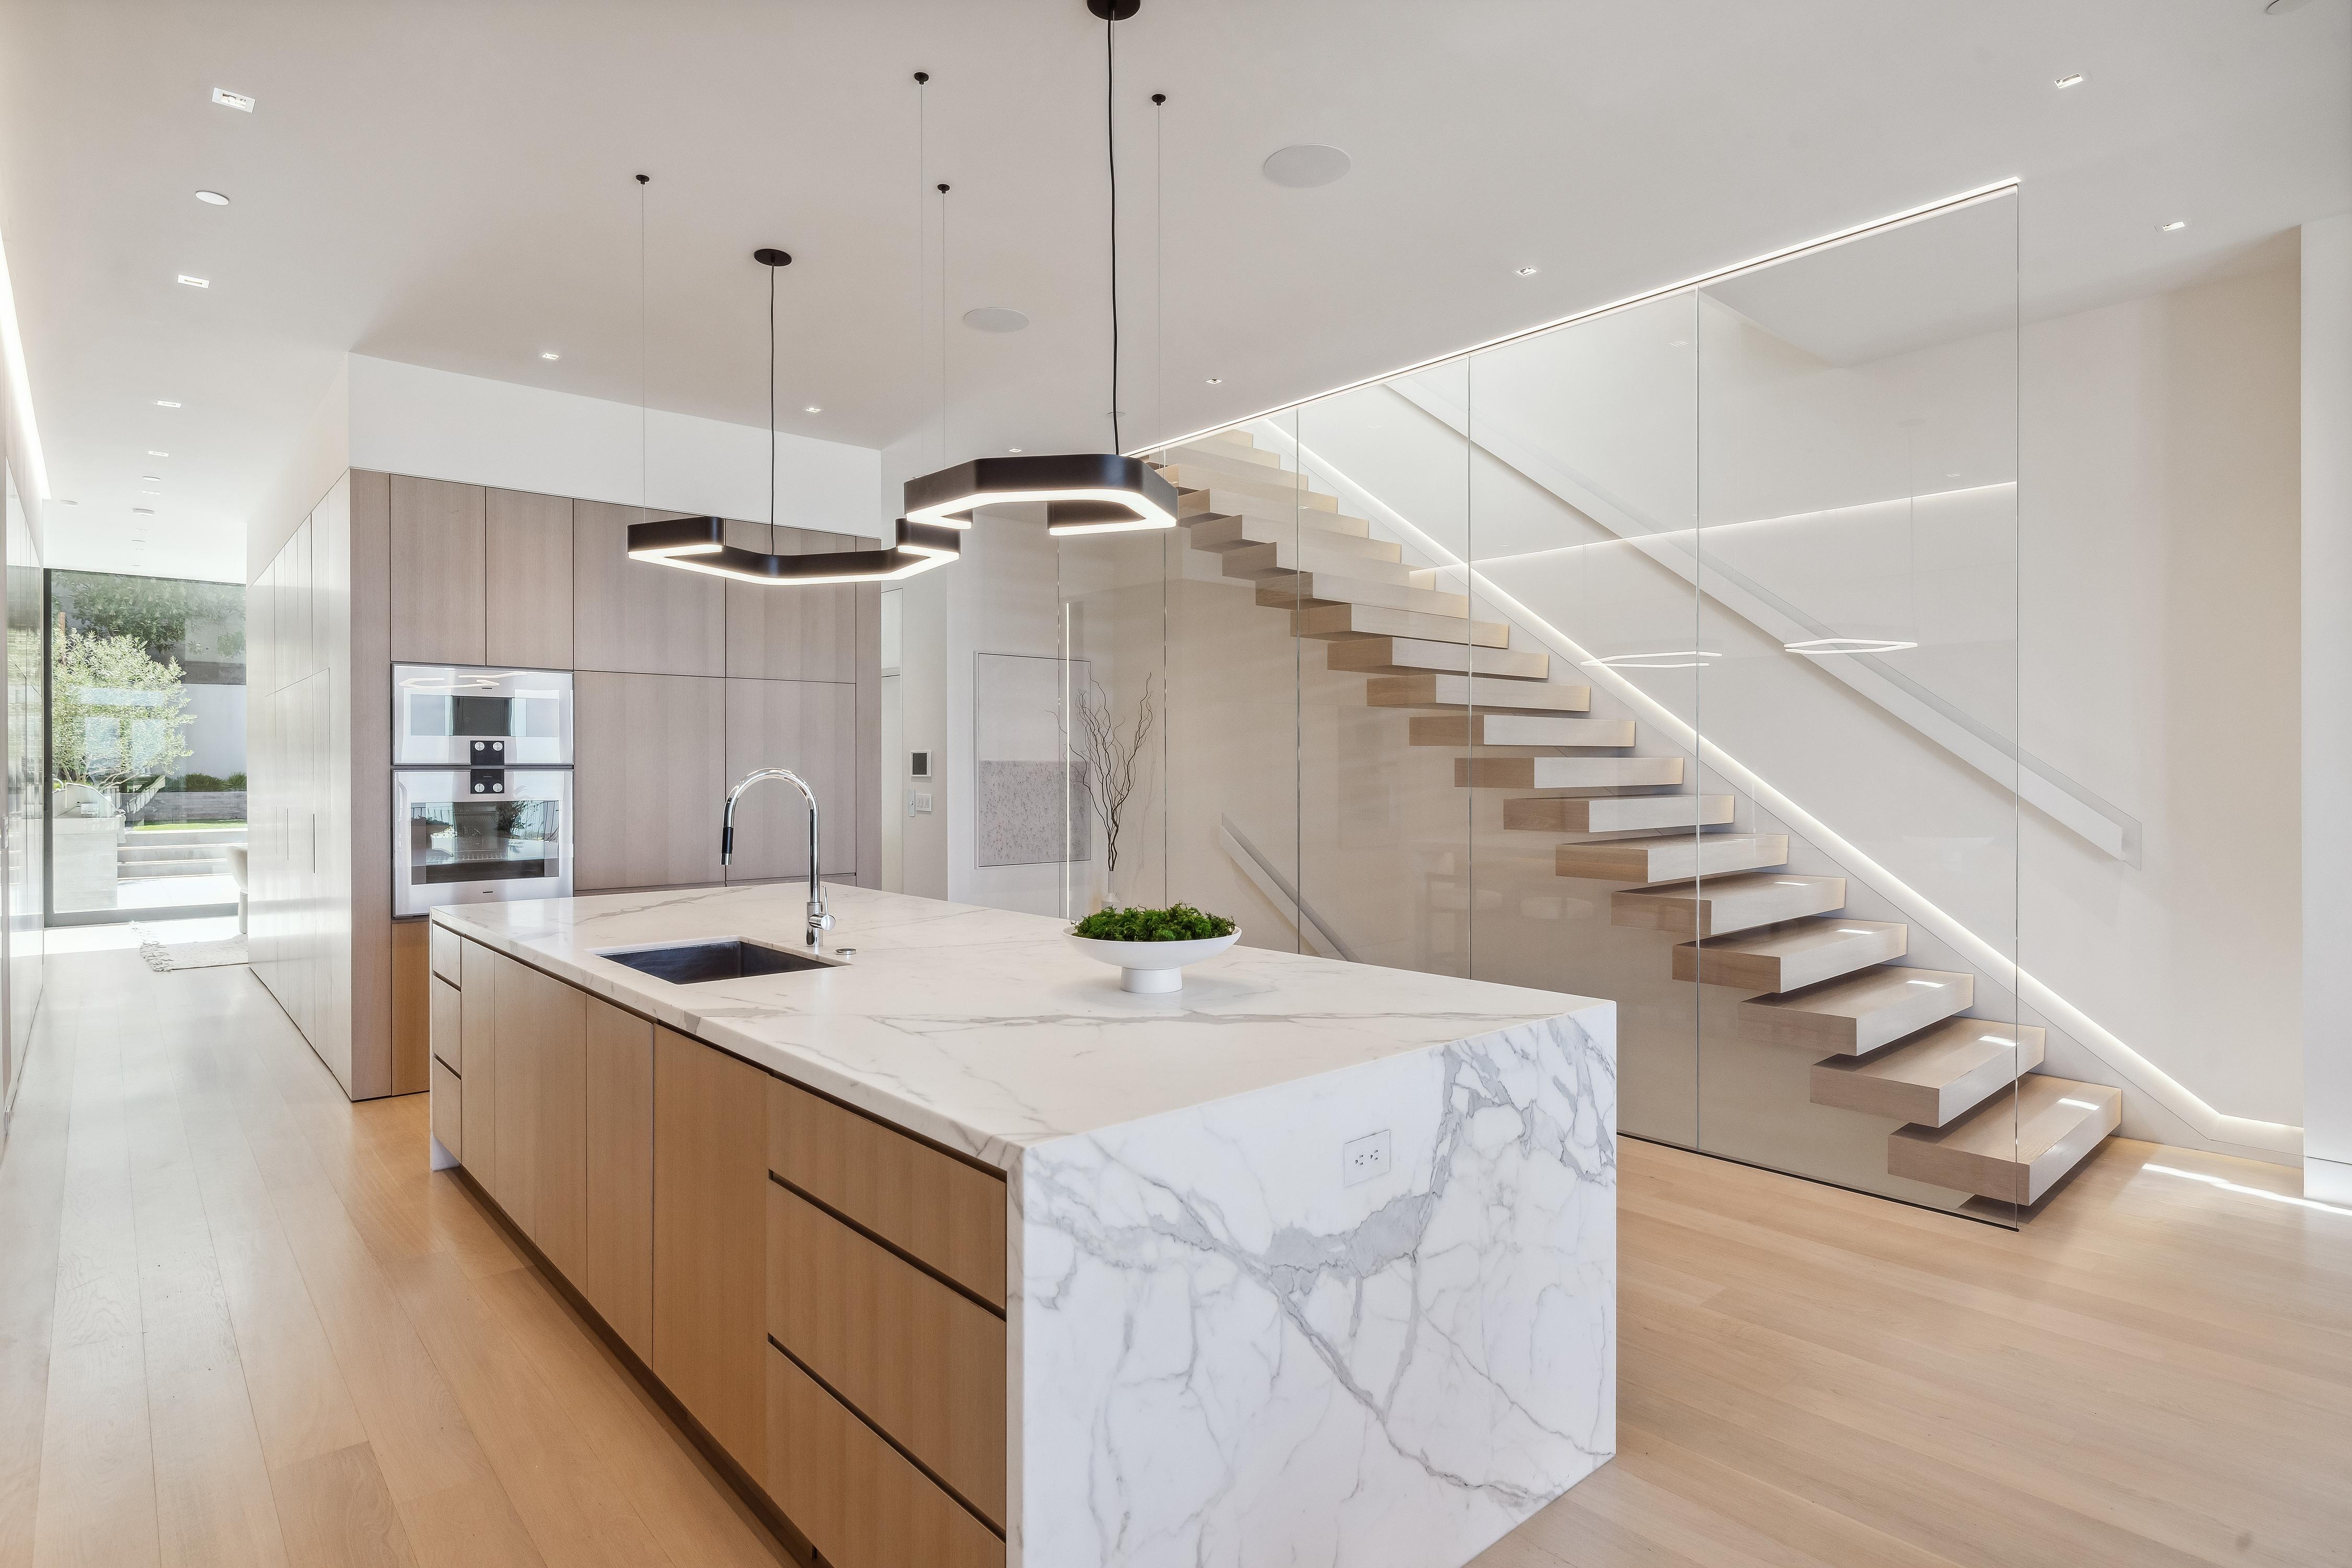
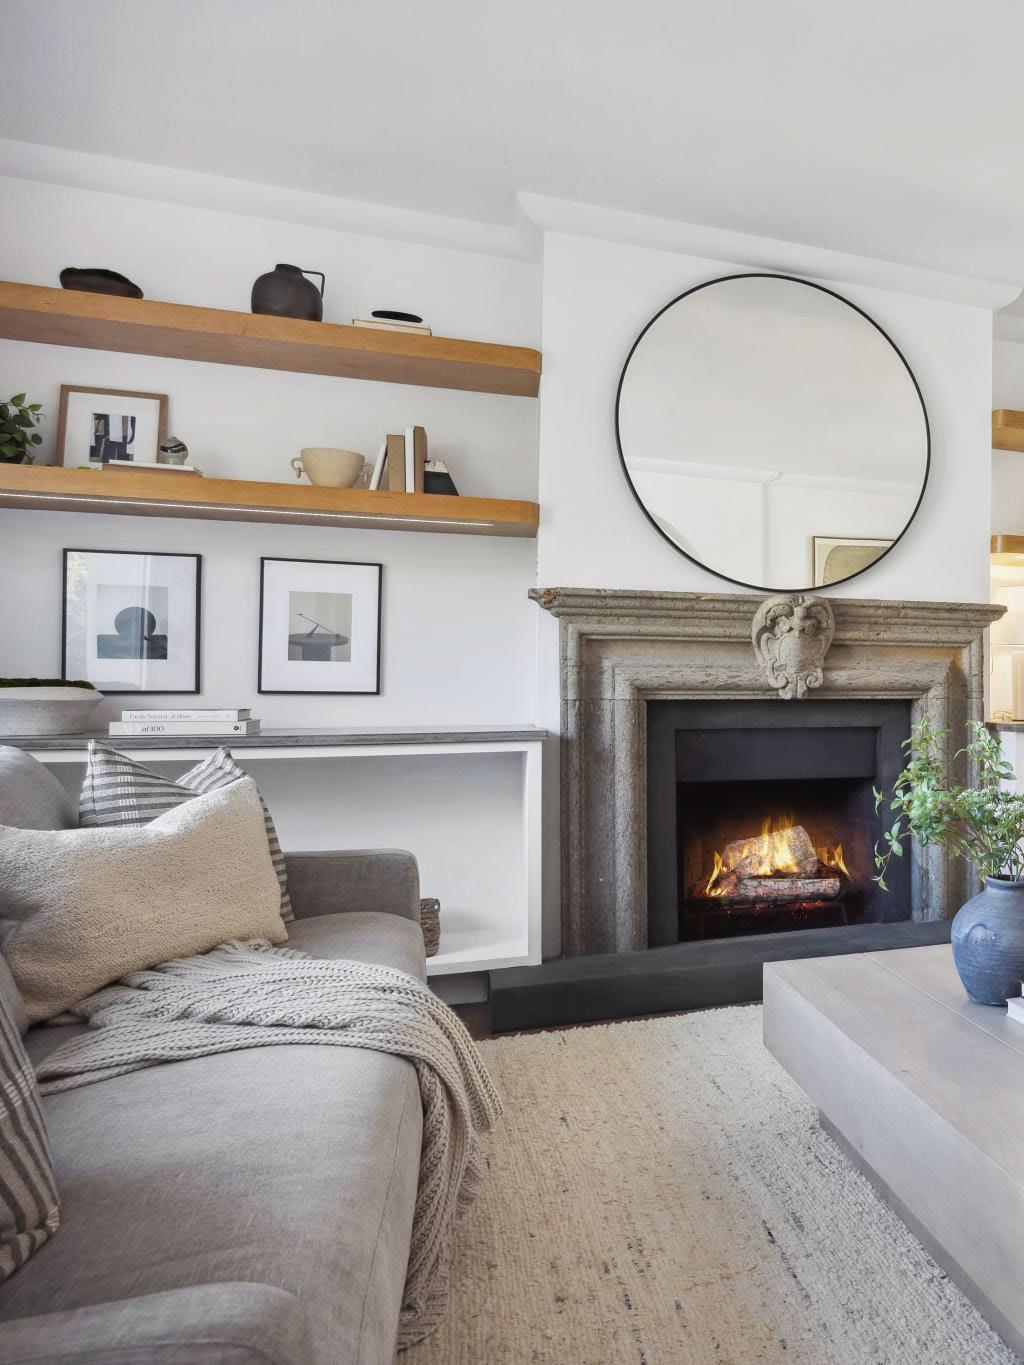
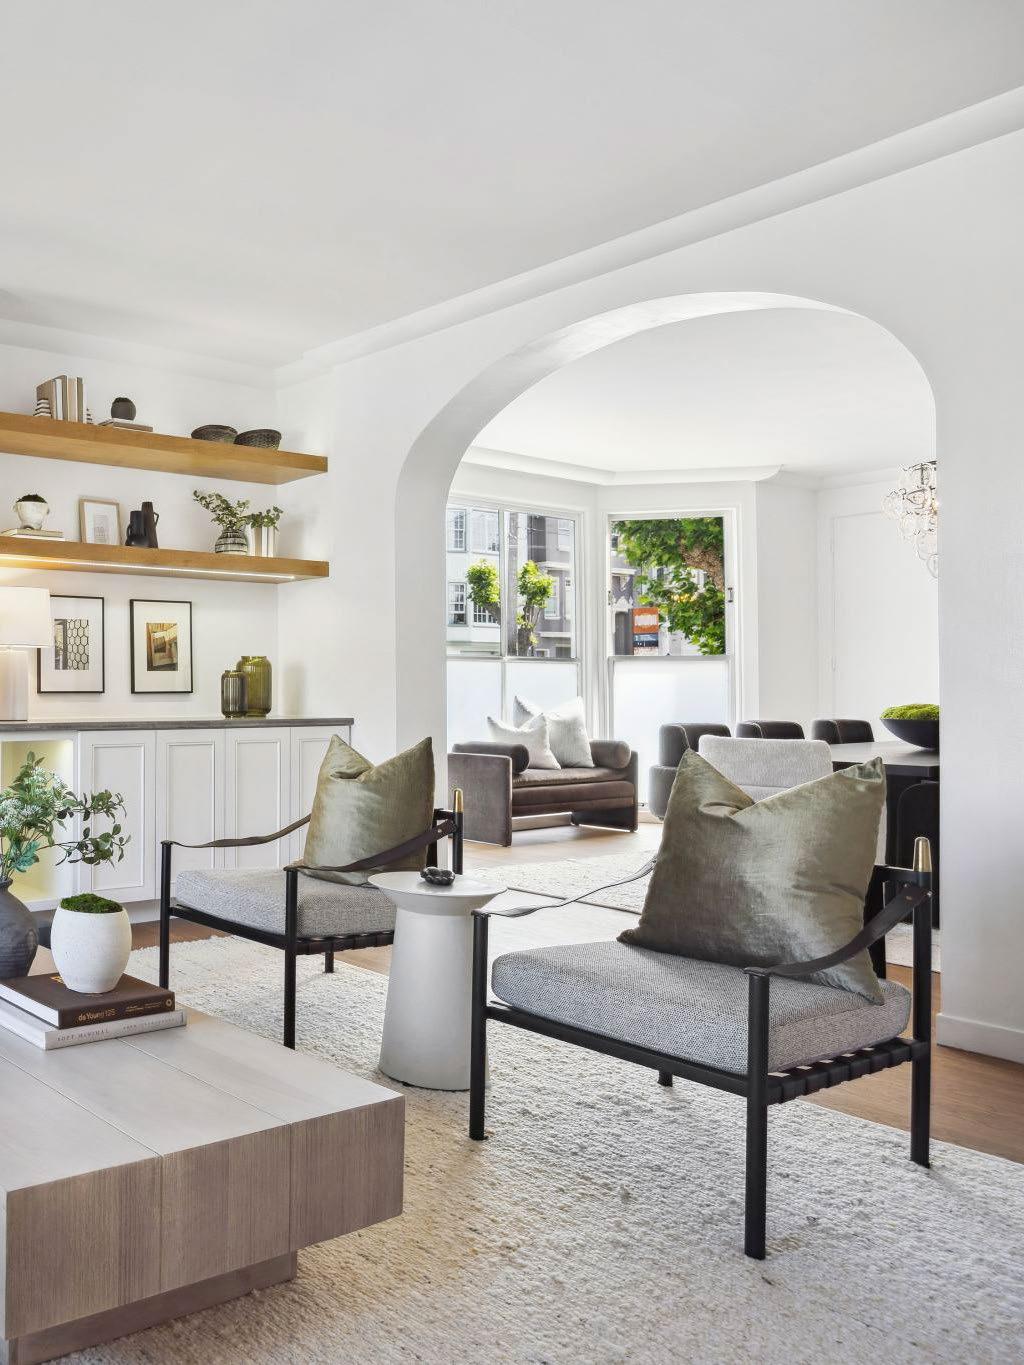
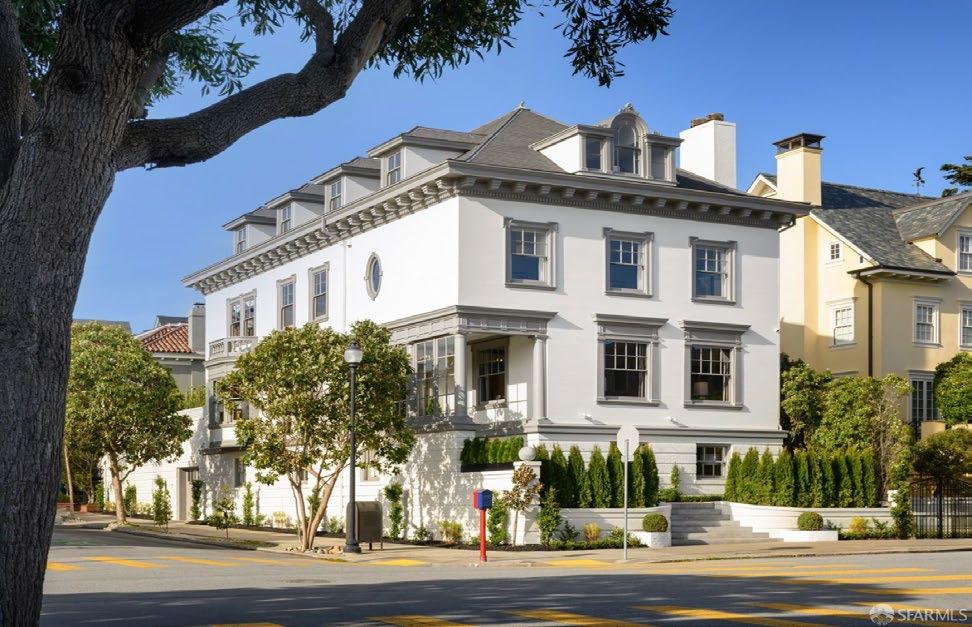
PACIFIC HEIGHTS MODERN
$14,000,000

FOR SALE
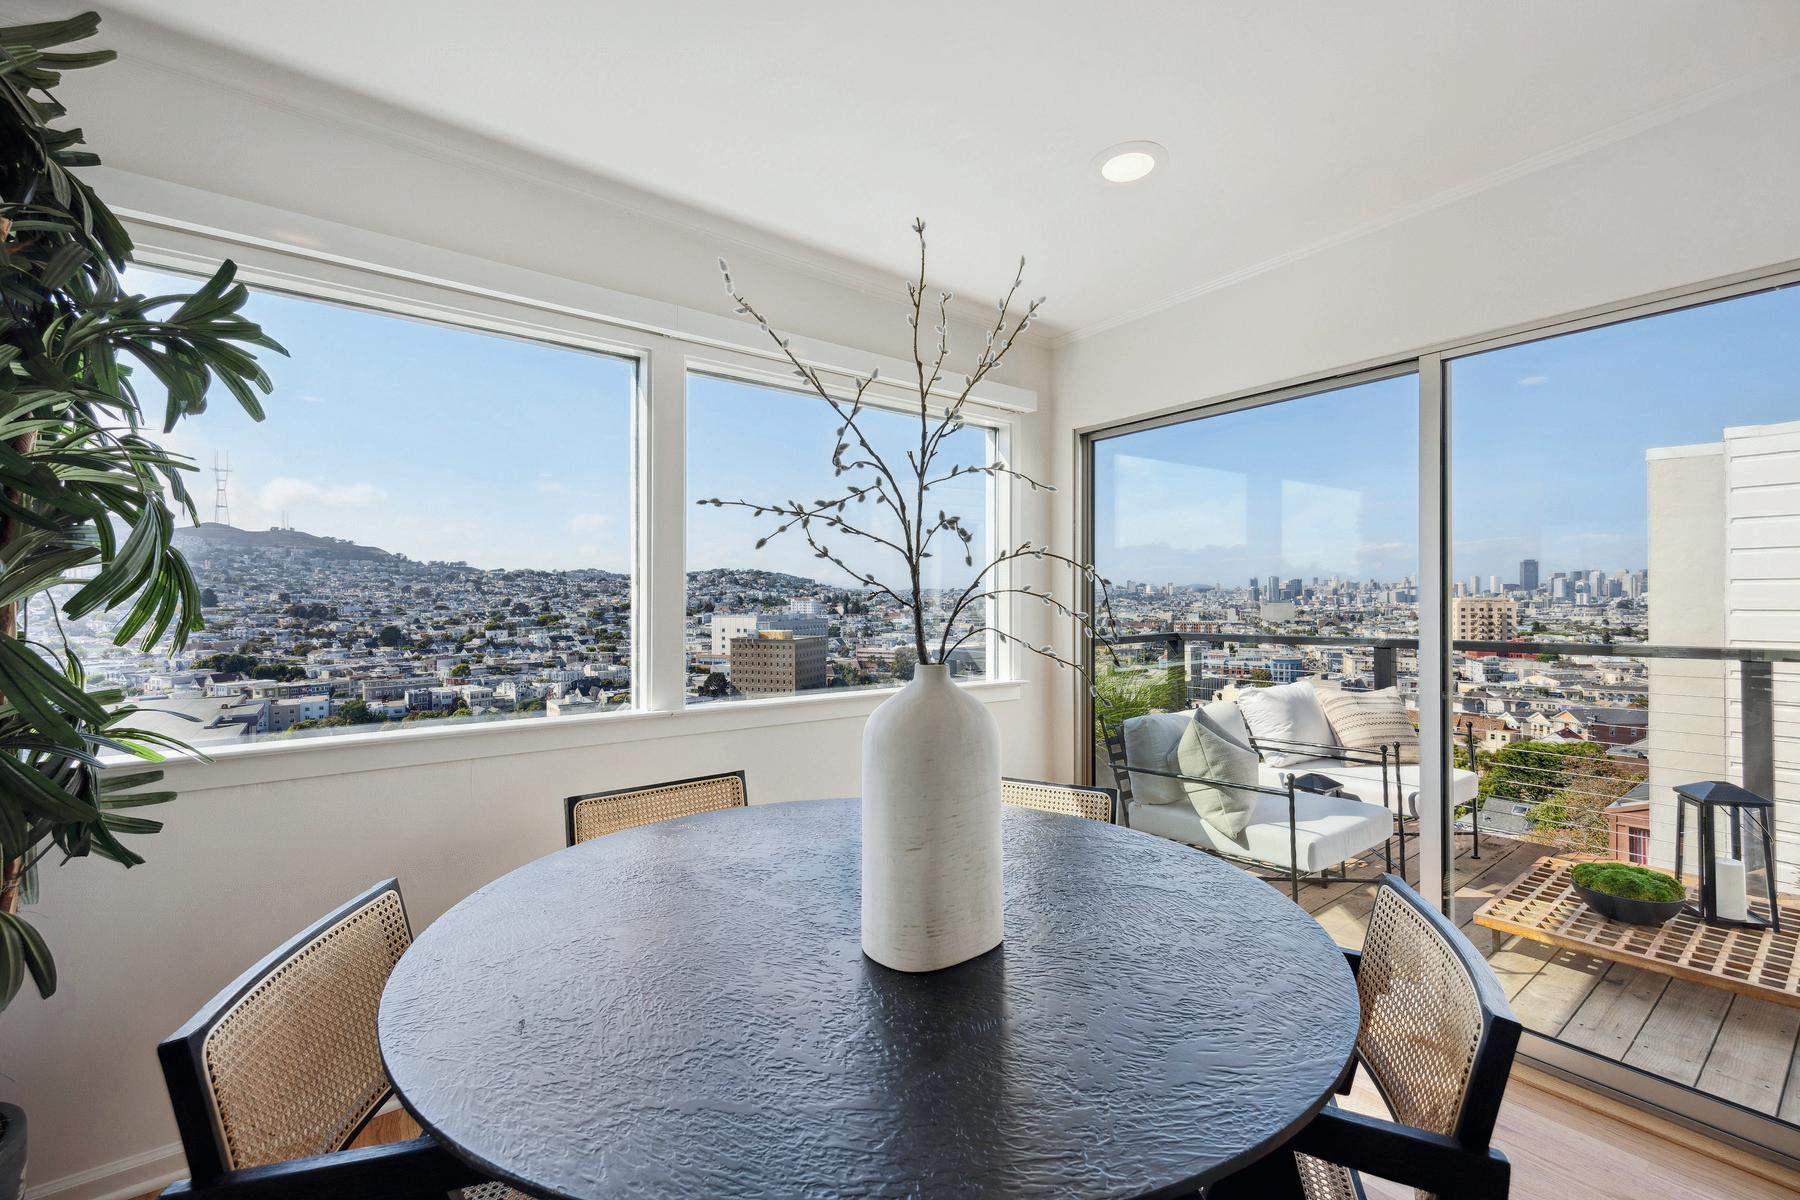
MARINA TOP FLOOR PERFECTION
$2,395,000
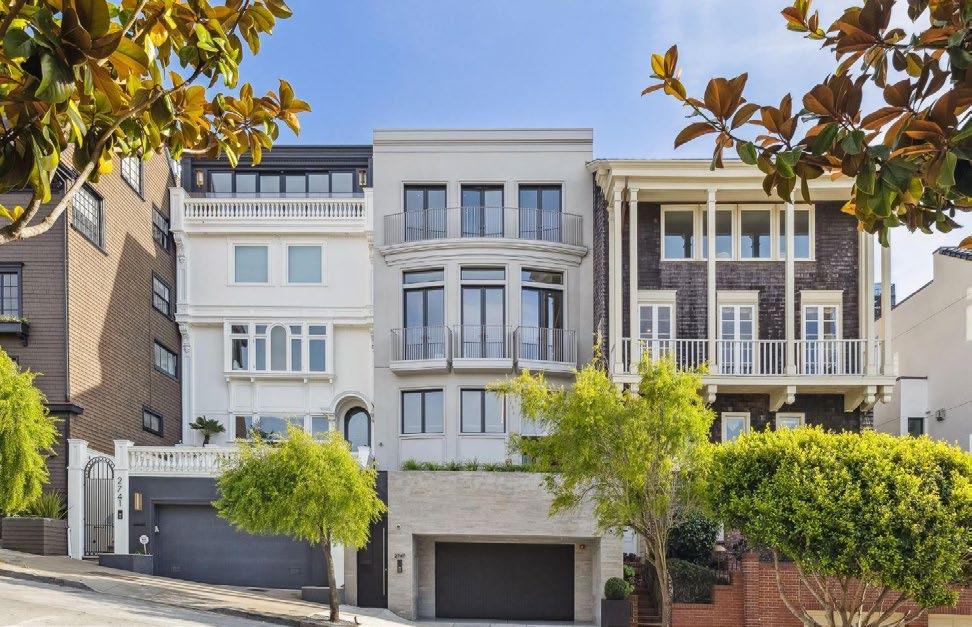
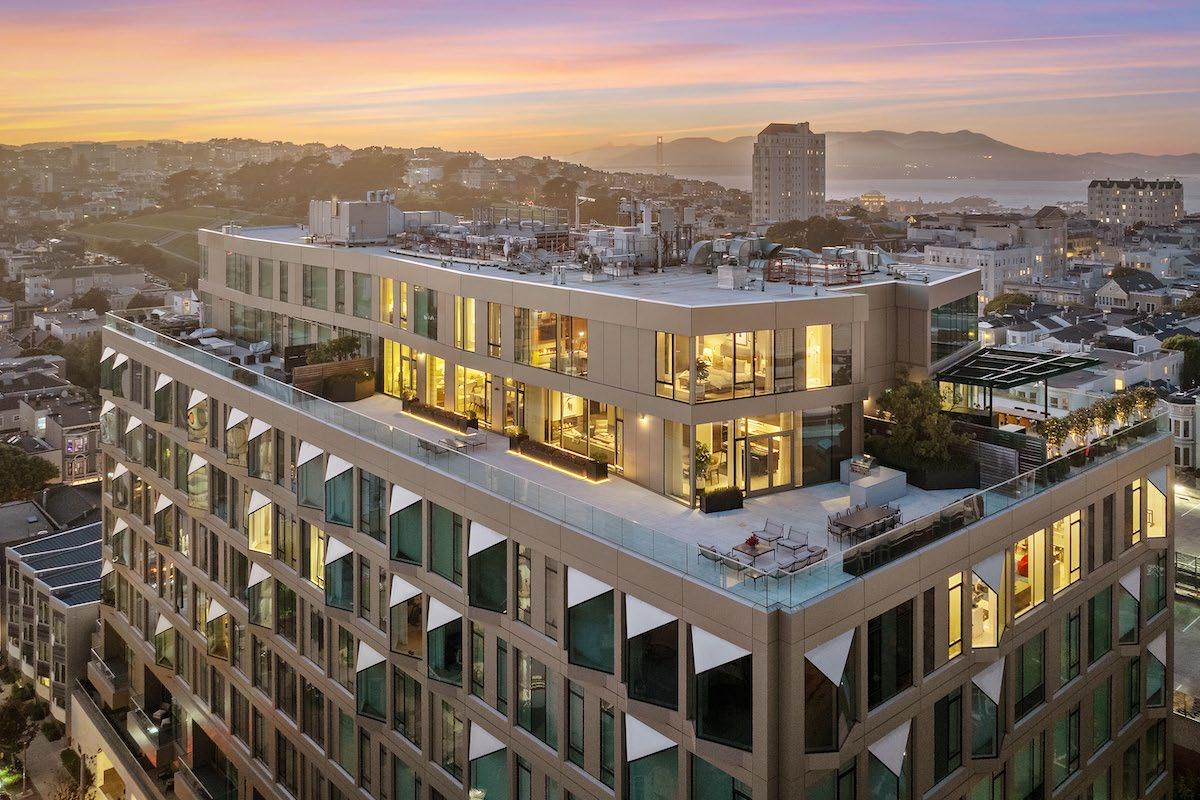
SOLD PACIFIC HEIGHTS MASTERPIECE
$13,250,000
SOLD RUSSIAN HILL VIEW PROPERTY
$2,350,000 Represented Buyer
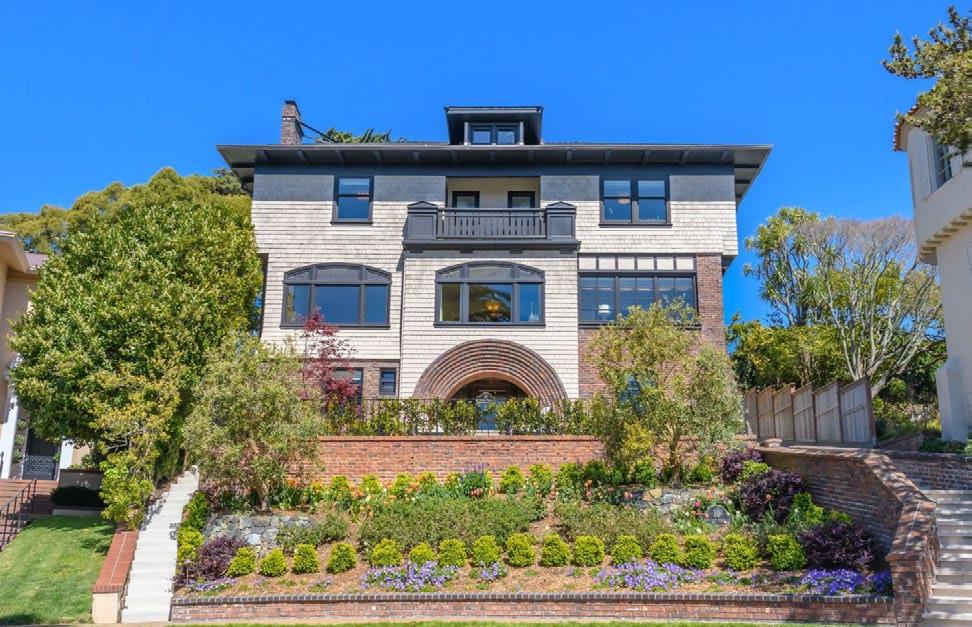
SOLD
SEACLIFF STUNNER
$3,490,000
SOLD
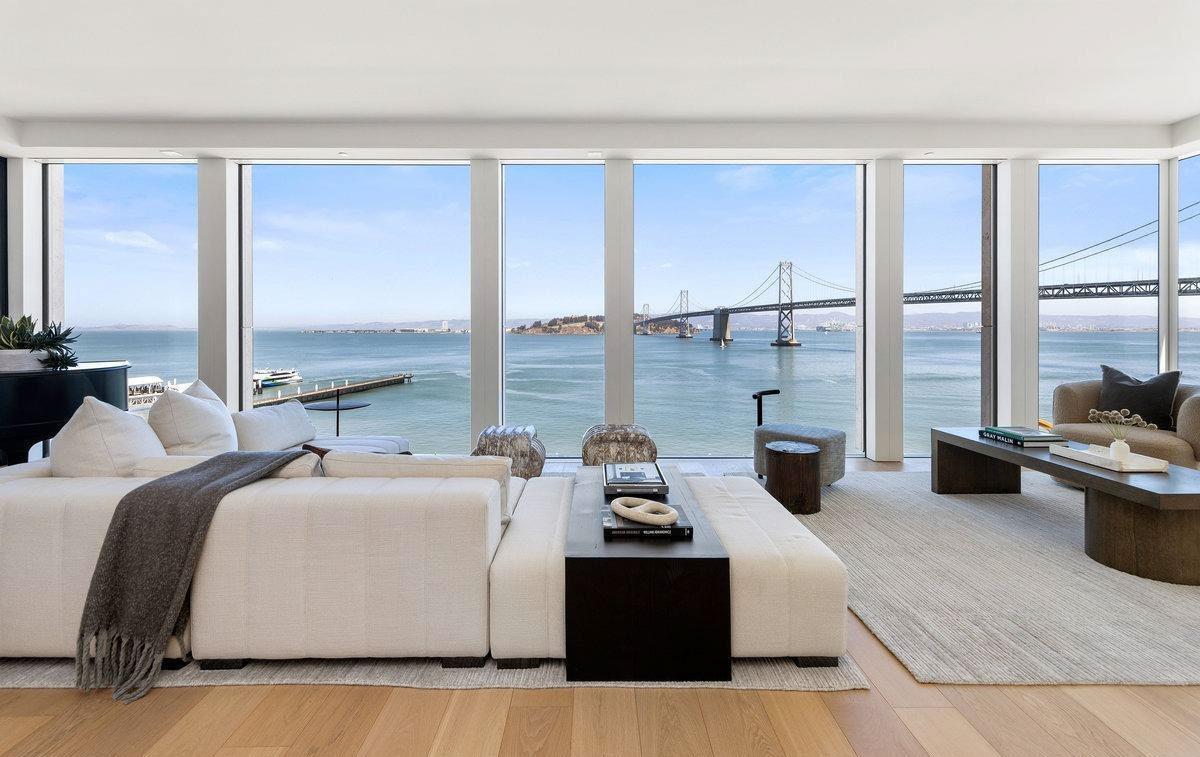
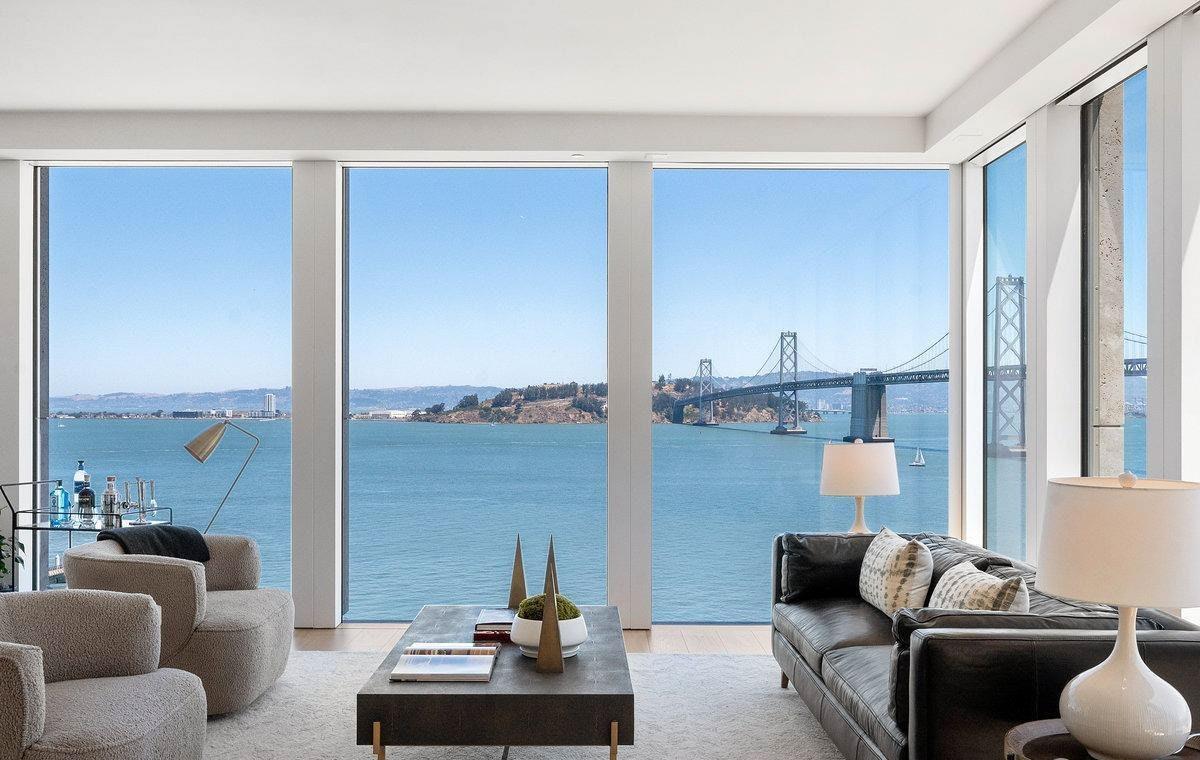
FOUR SEASONS RESIDENCES
$2,700,000
SOLD
COW HOLLOW CONDO
$2,240,000
SOLD
BEAUTIFUL IN BERNAL HEIGHTS
$1,900,000

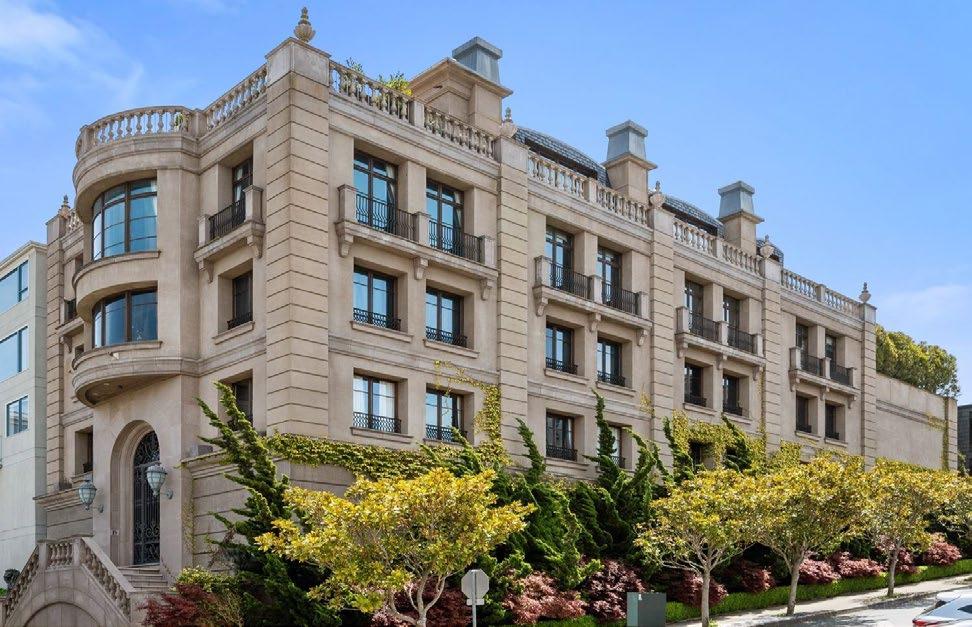
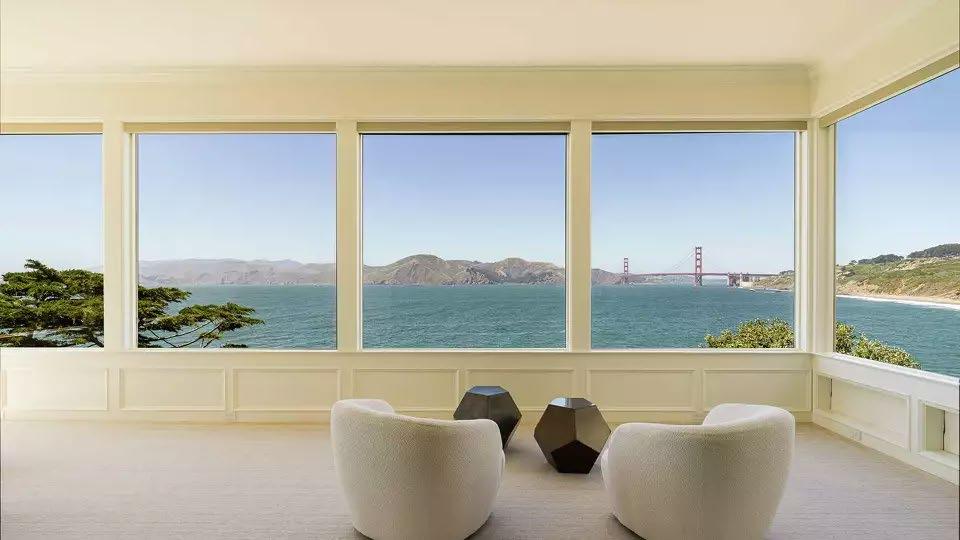
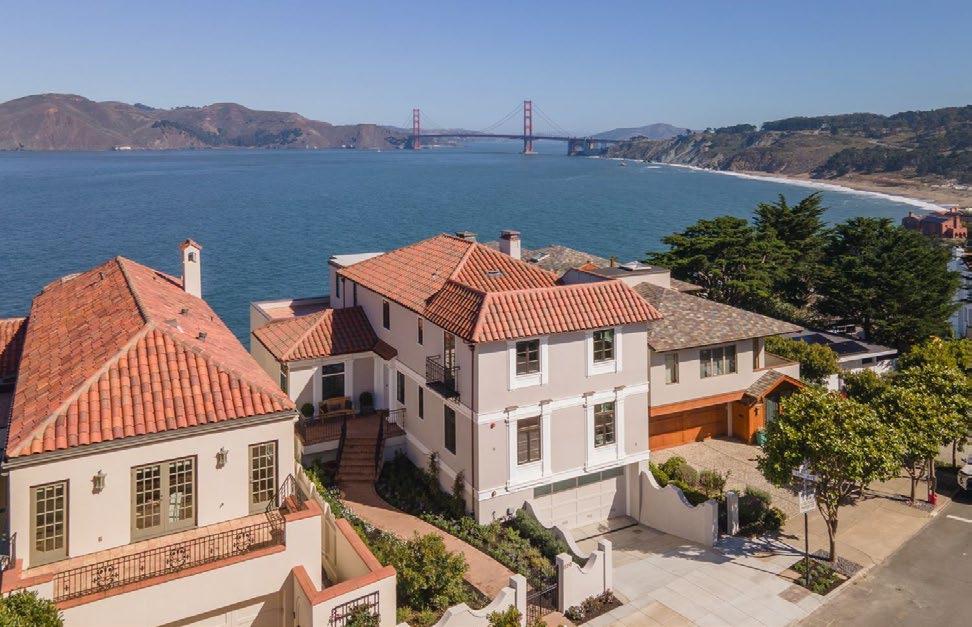
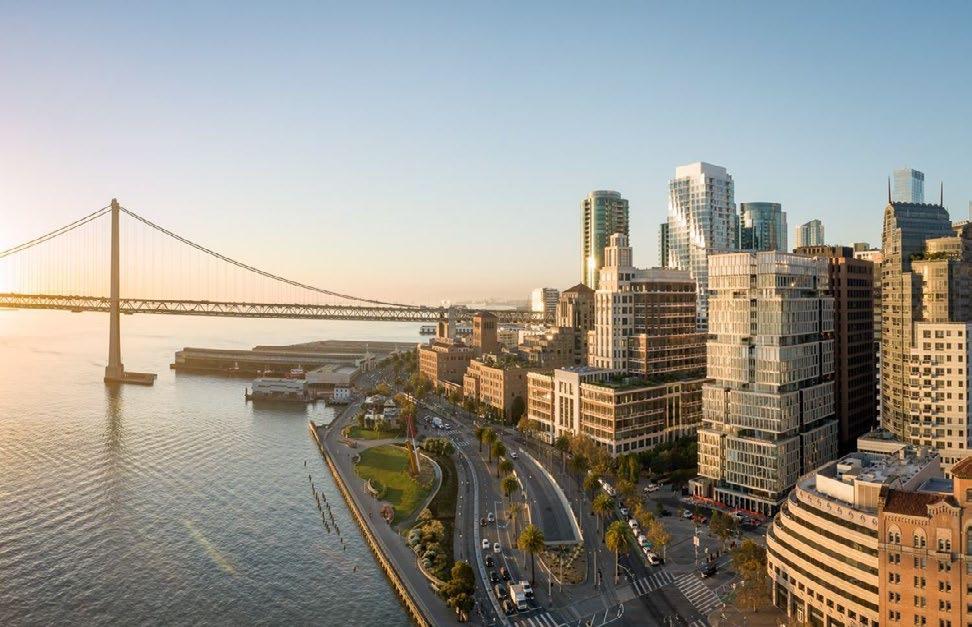
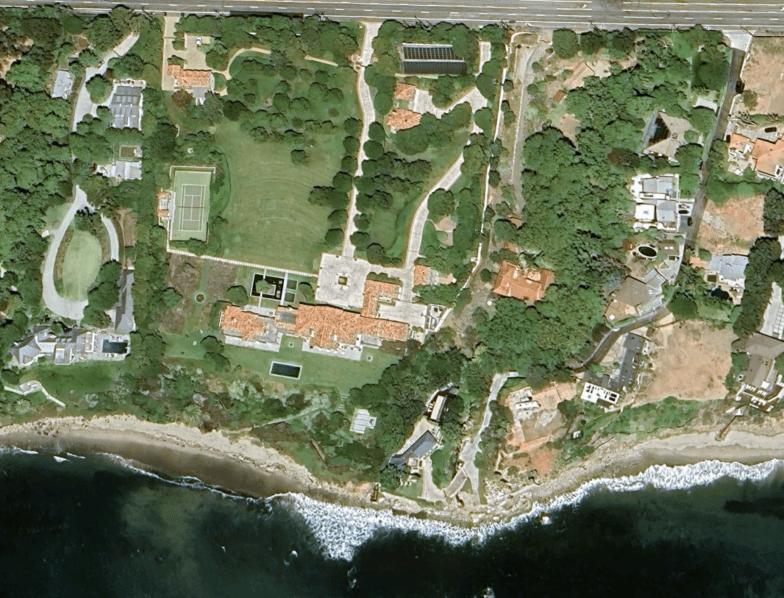
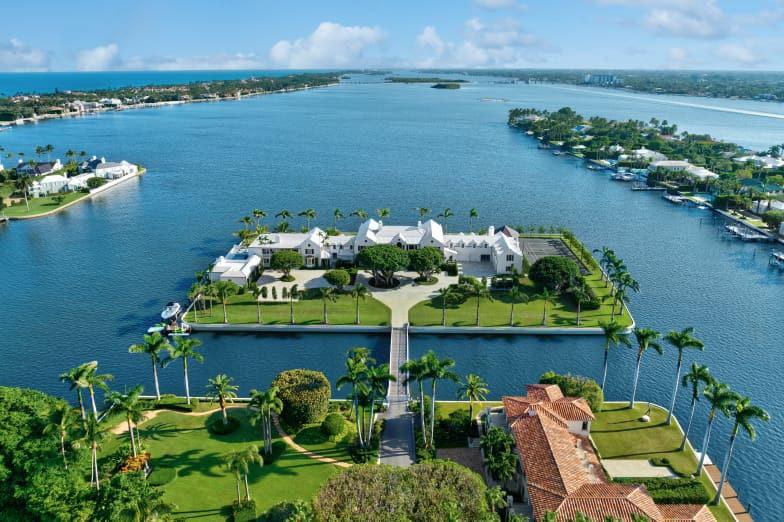
OCEANFRONT LEGACY PROPERTY
$9,950,000
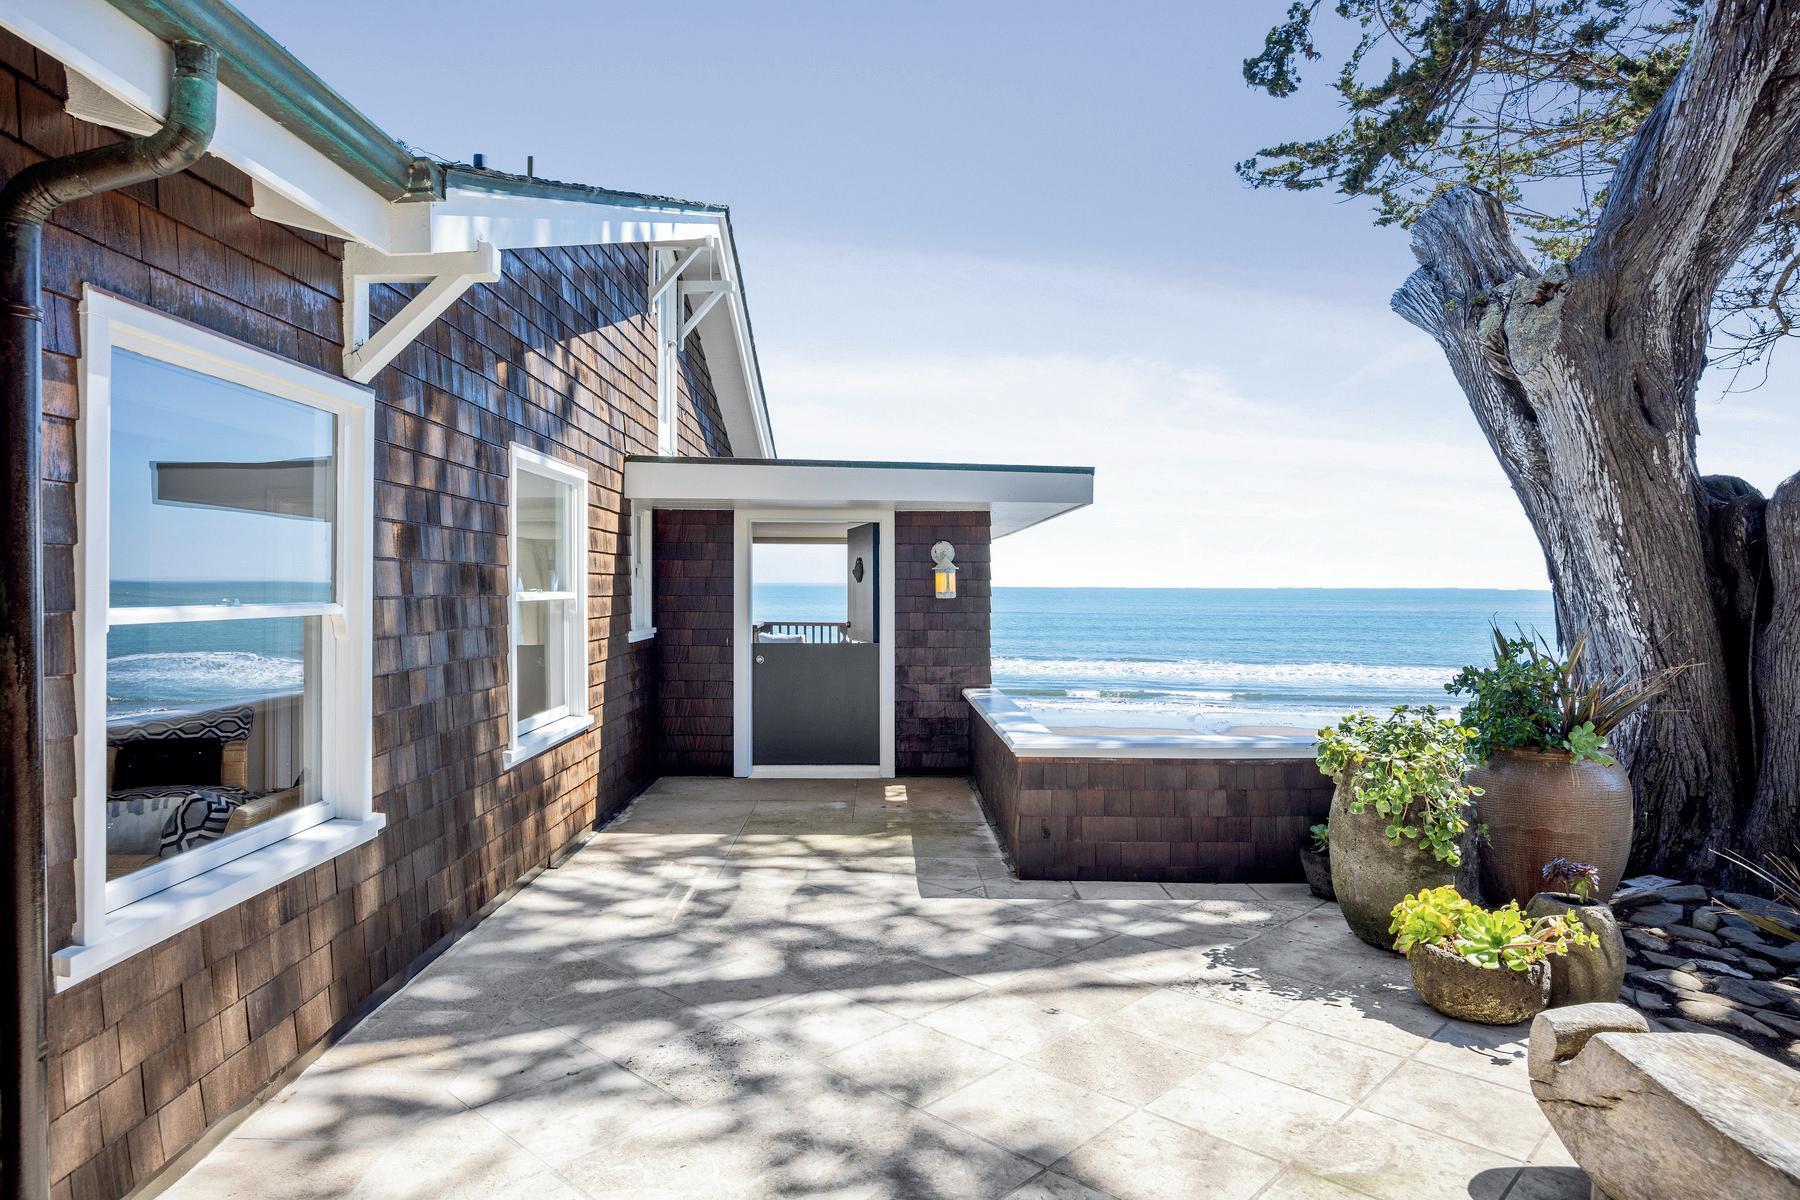
SOLD
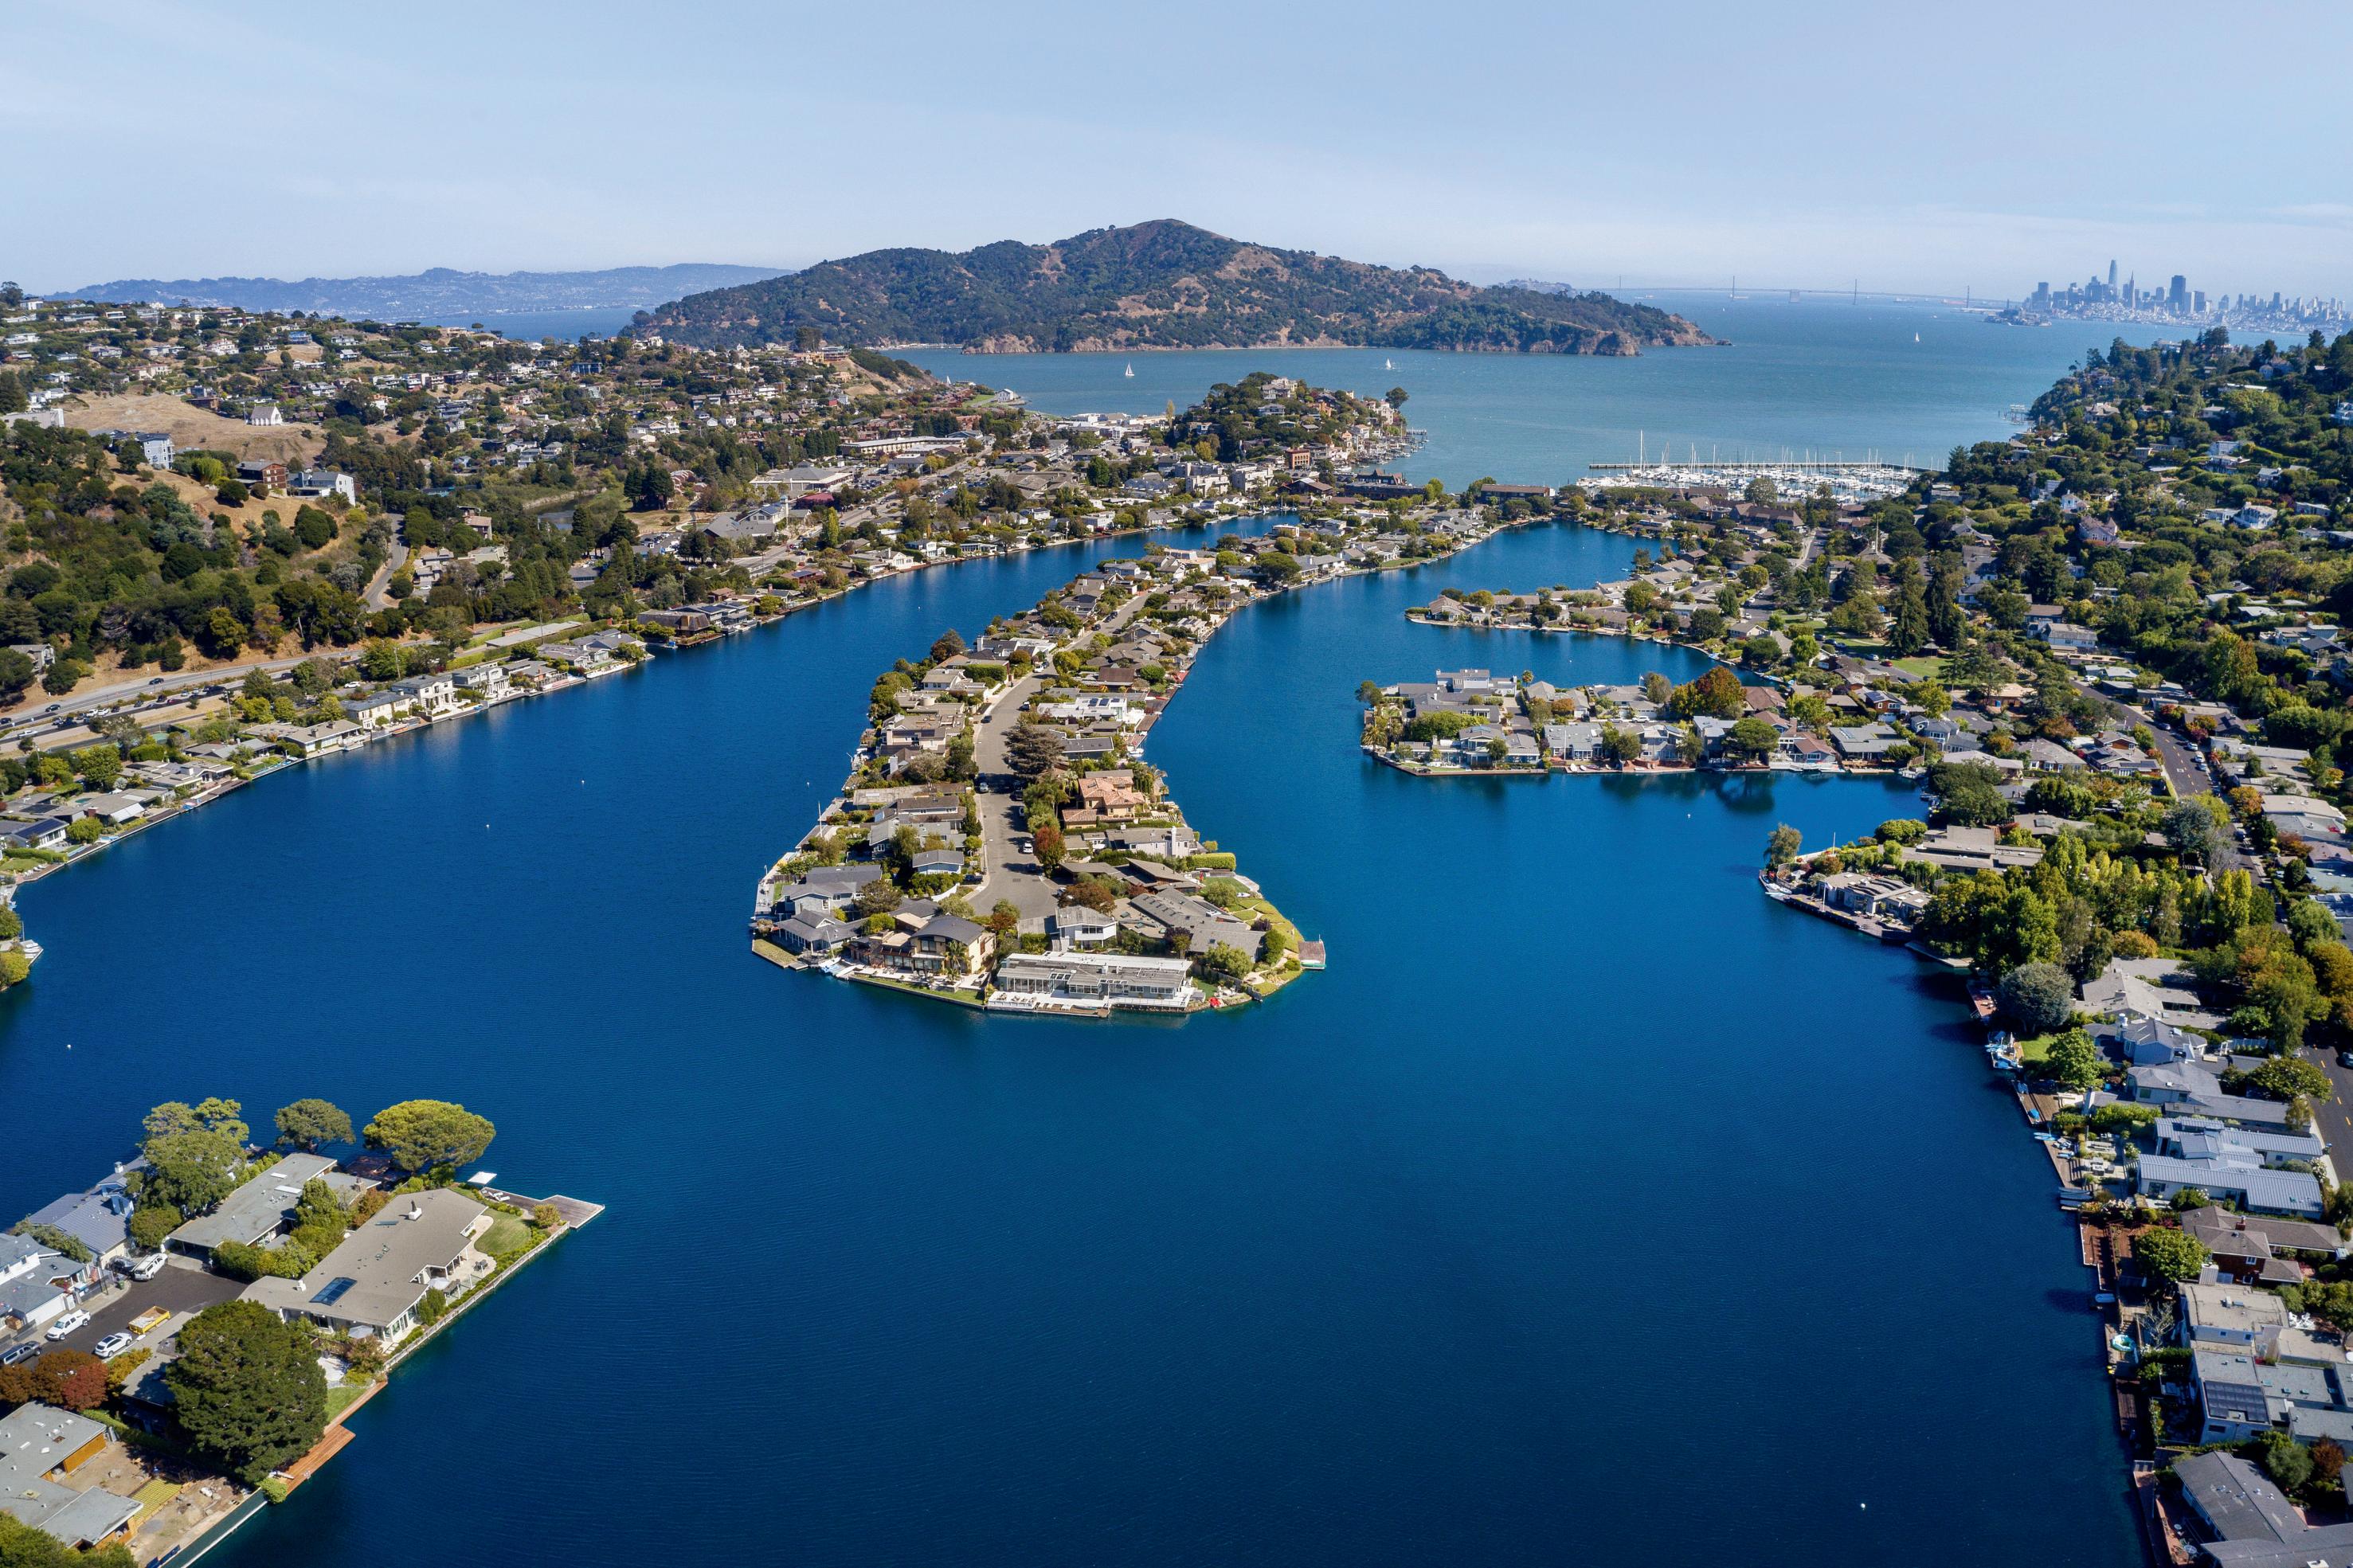
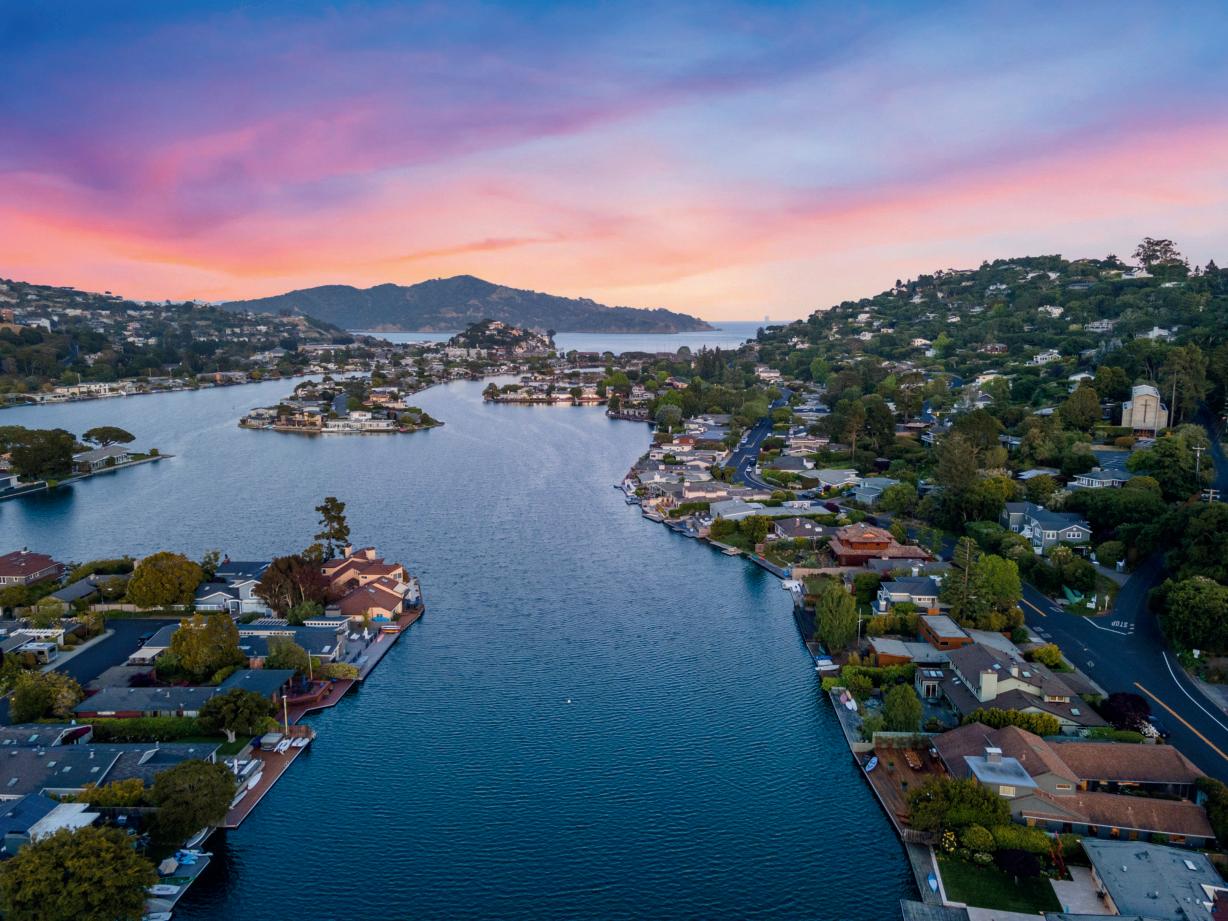
BELVEDERE LAGOON
$8,750,000
SOLD
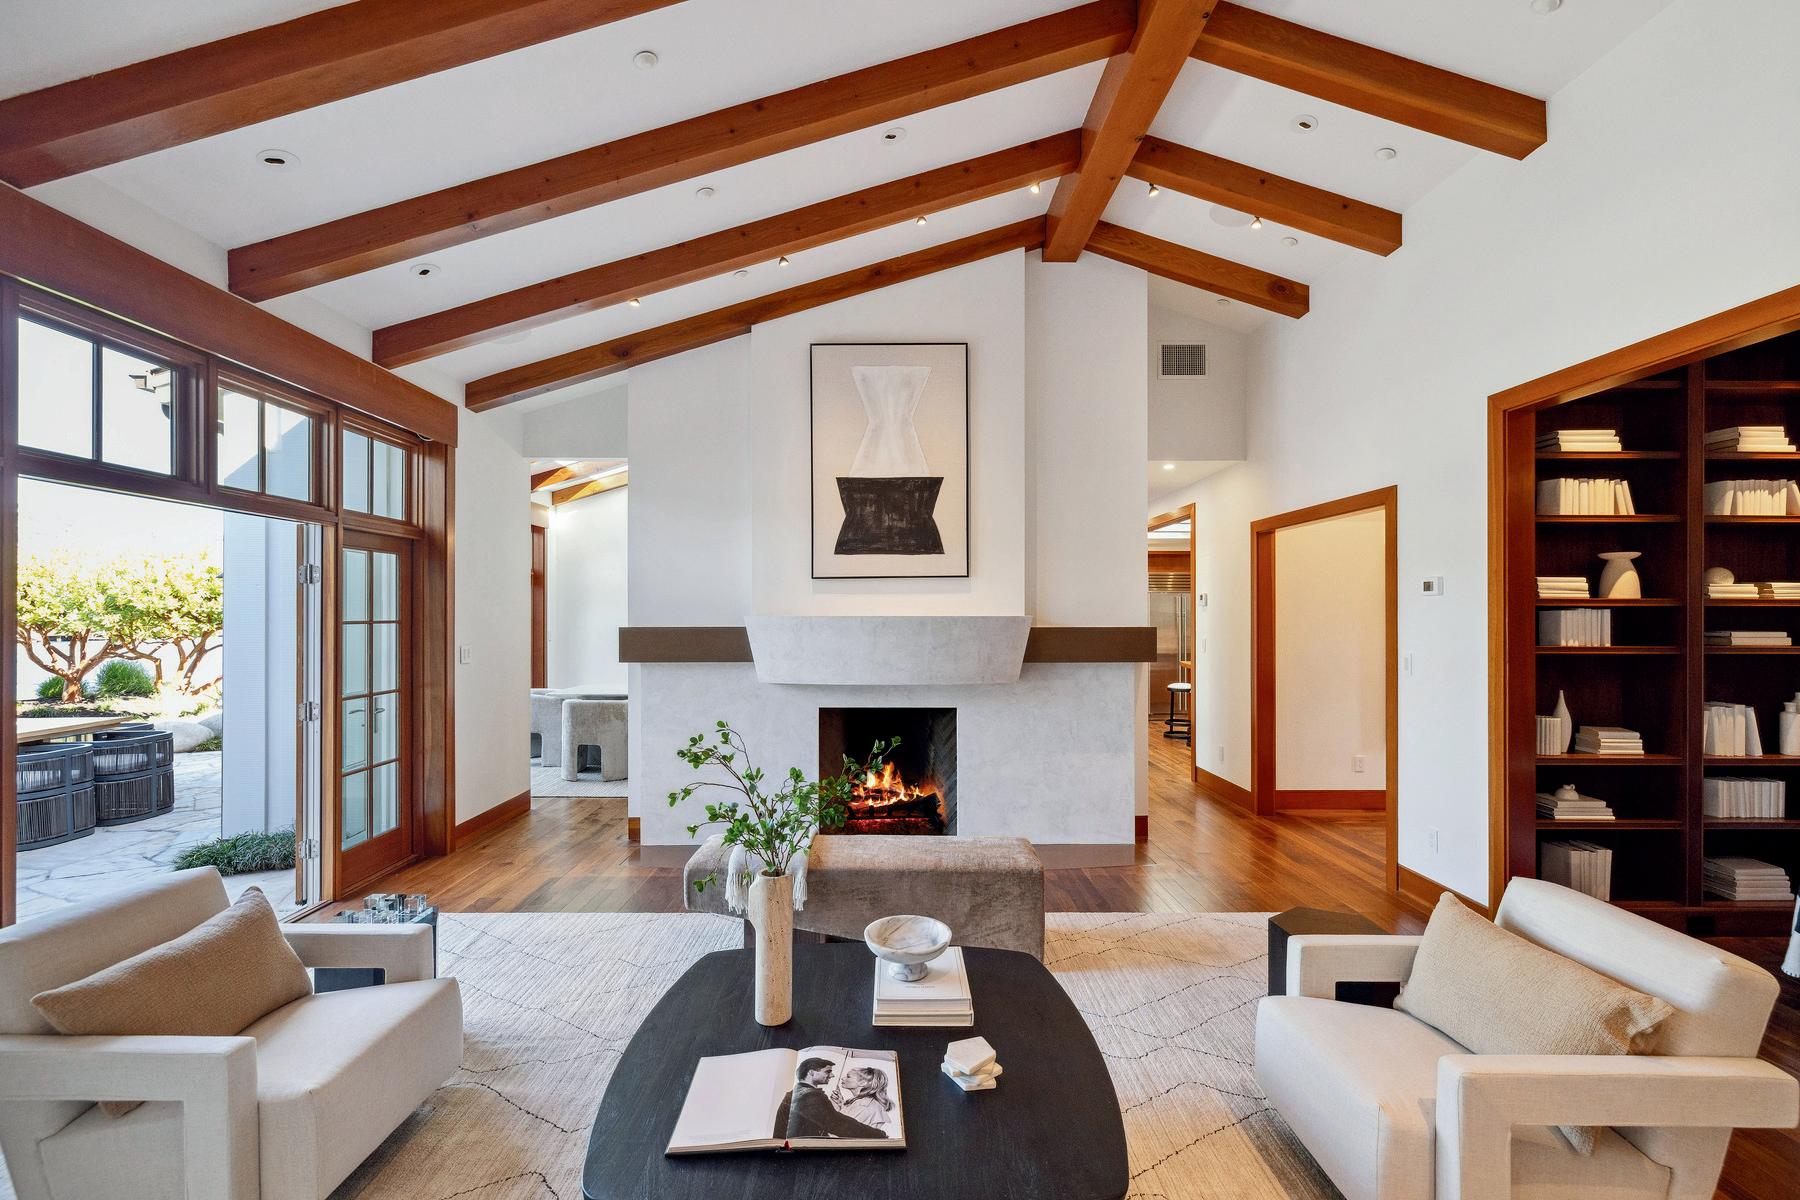
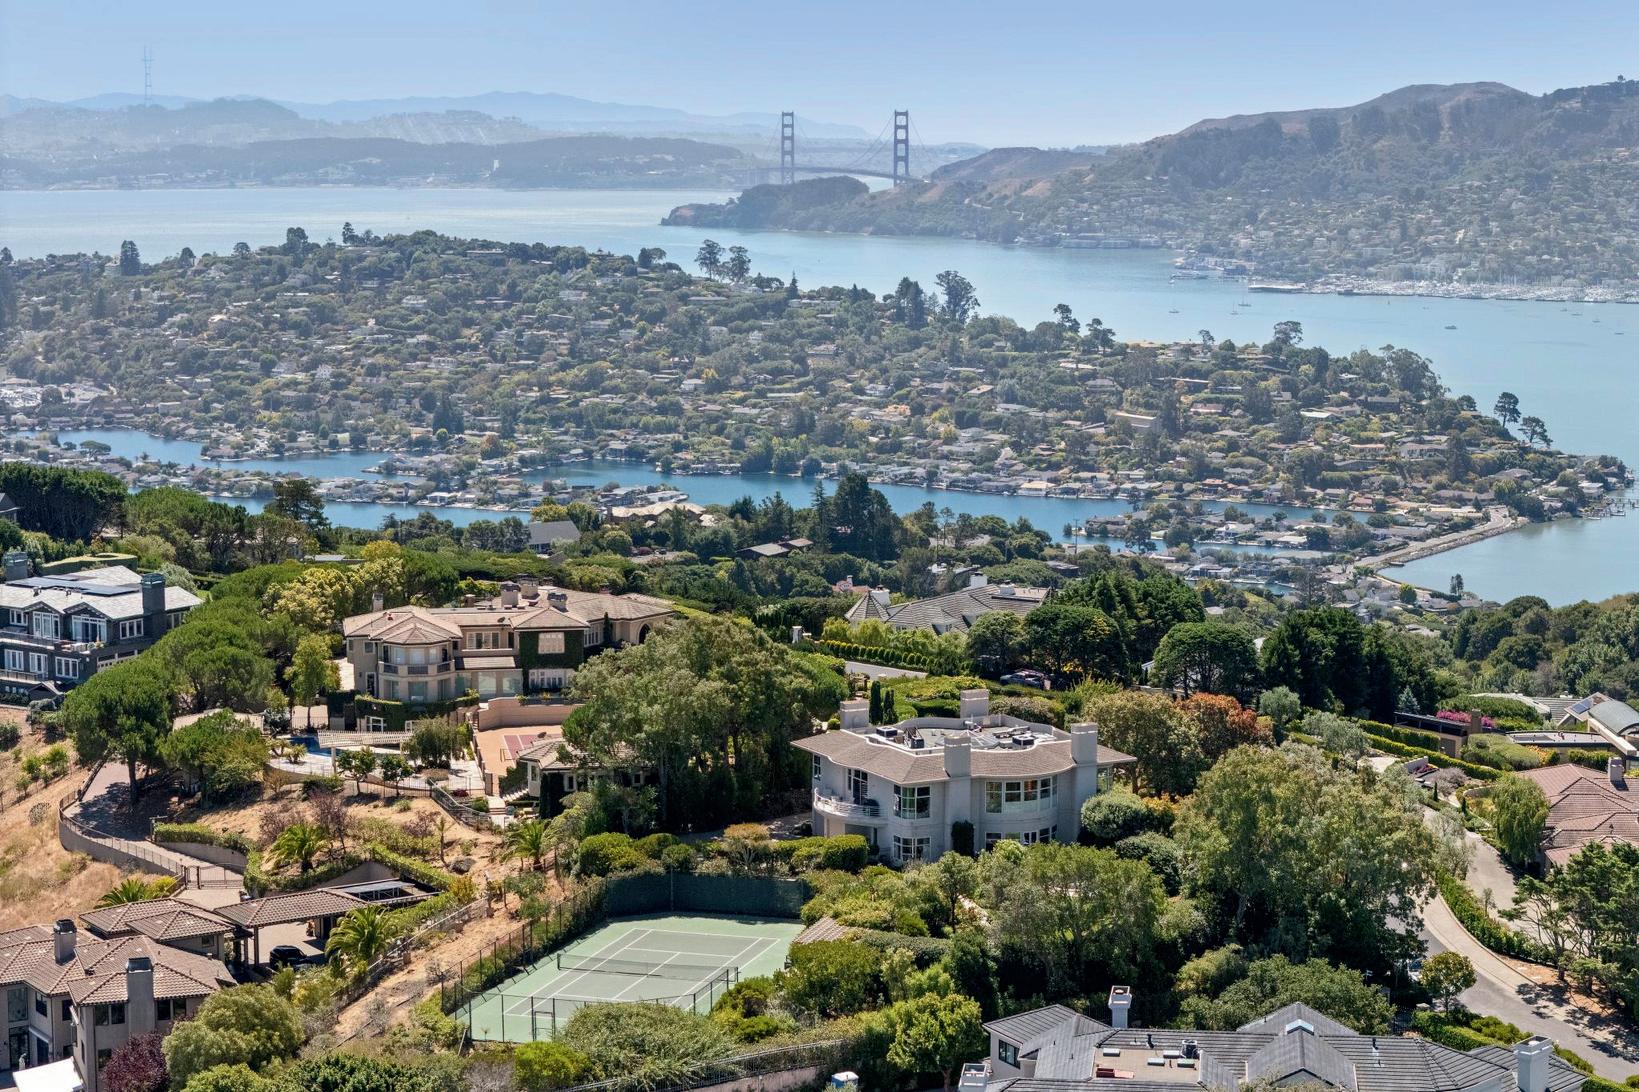
TIBURON STUNNING VIEW PROPERTY
$9,000,000
SOLD
BELVEDERE LAGOON
$7,200,000

SOLD
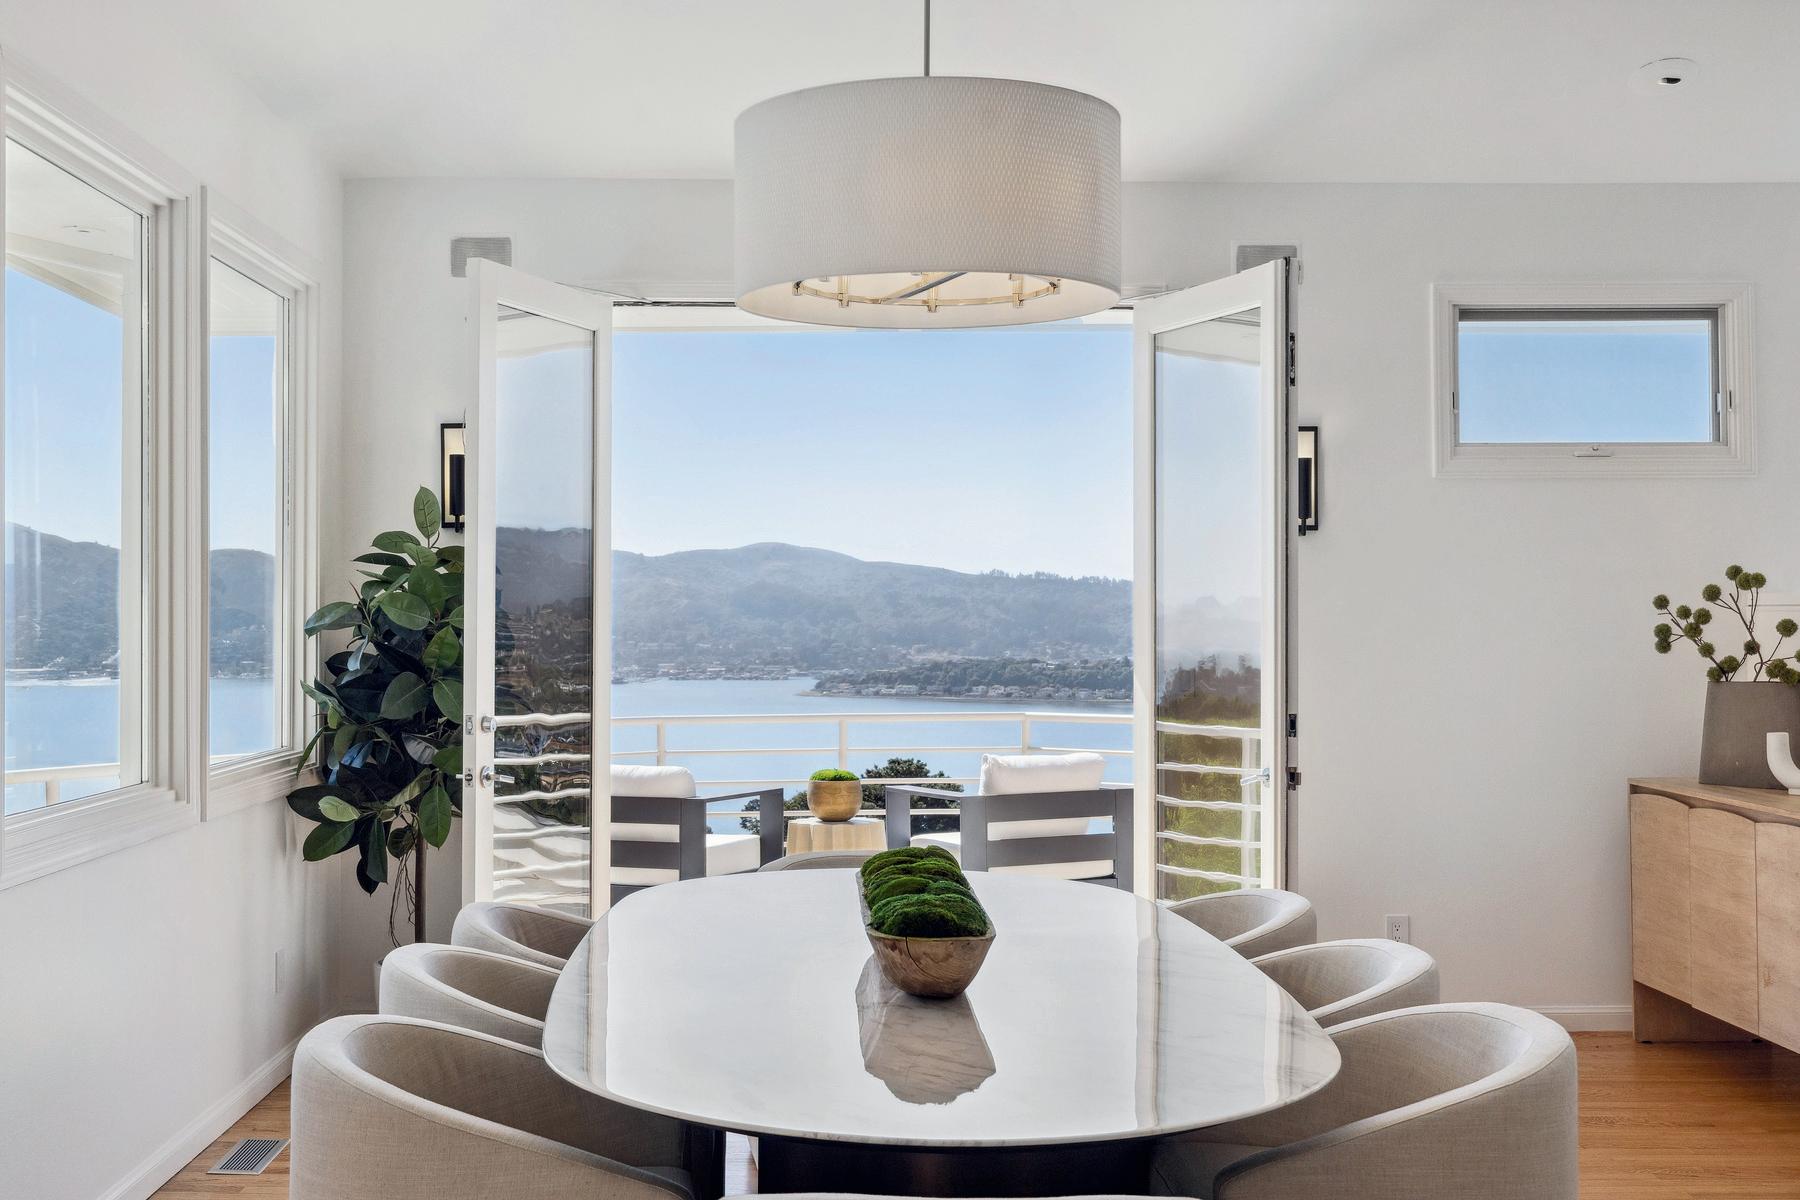
TIBURON VIEW HOME
$5,800,000
SOLD
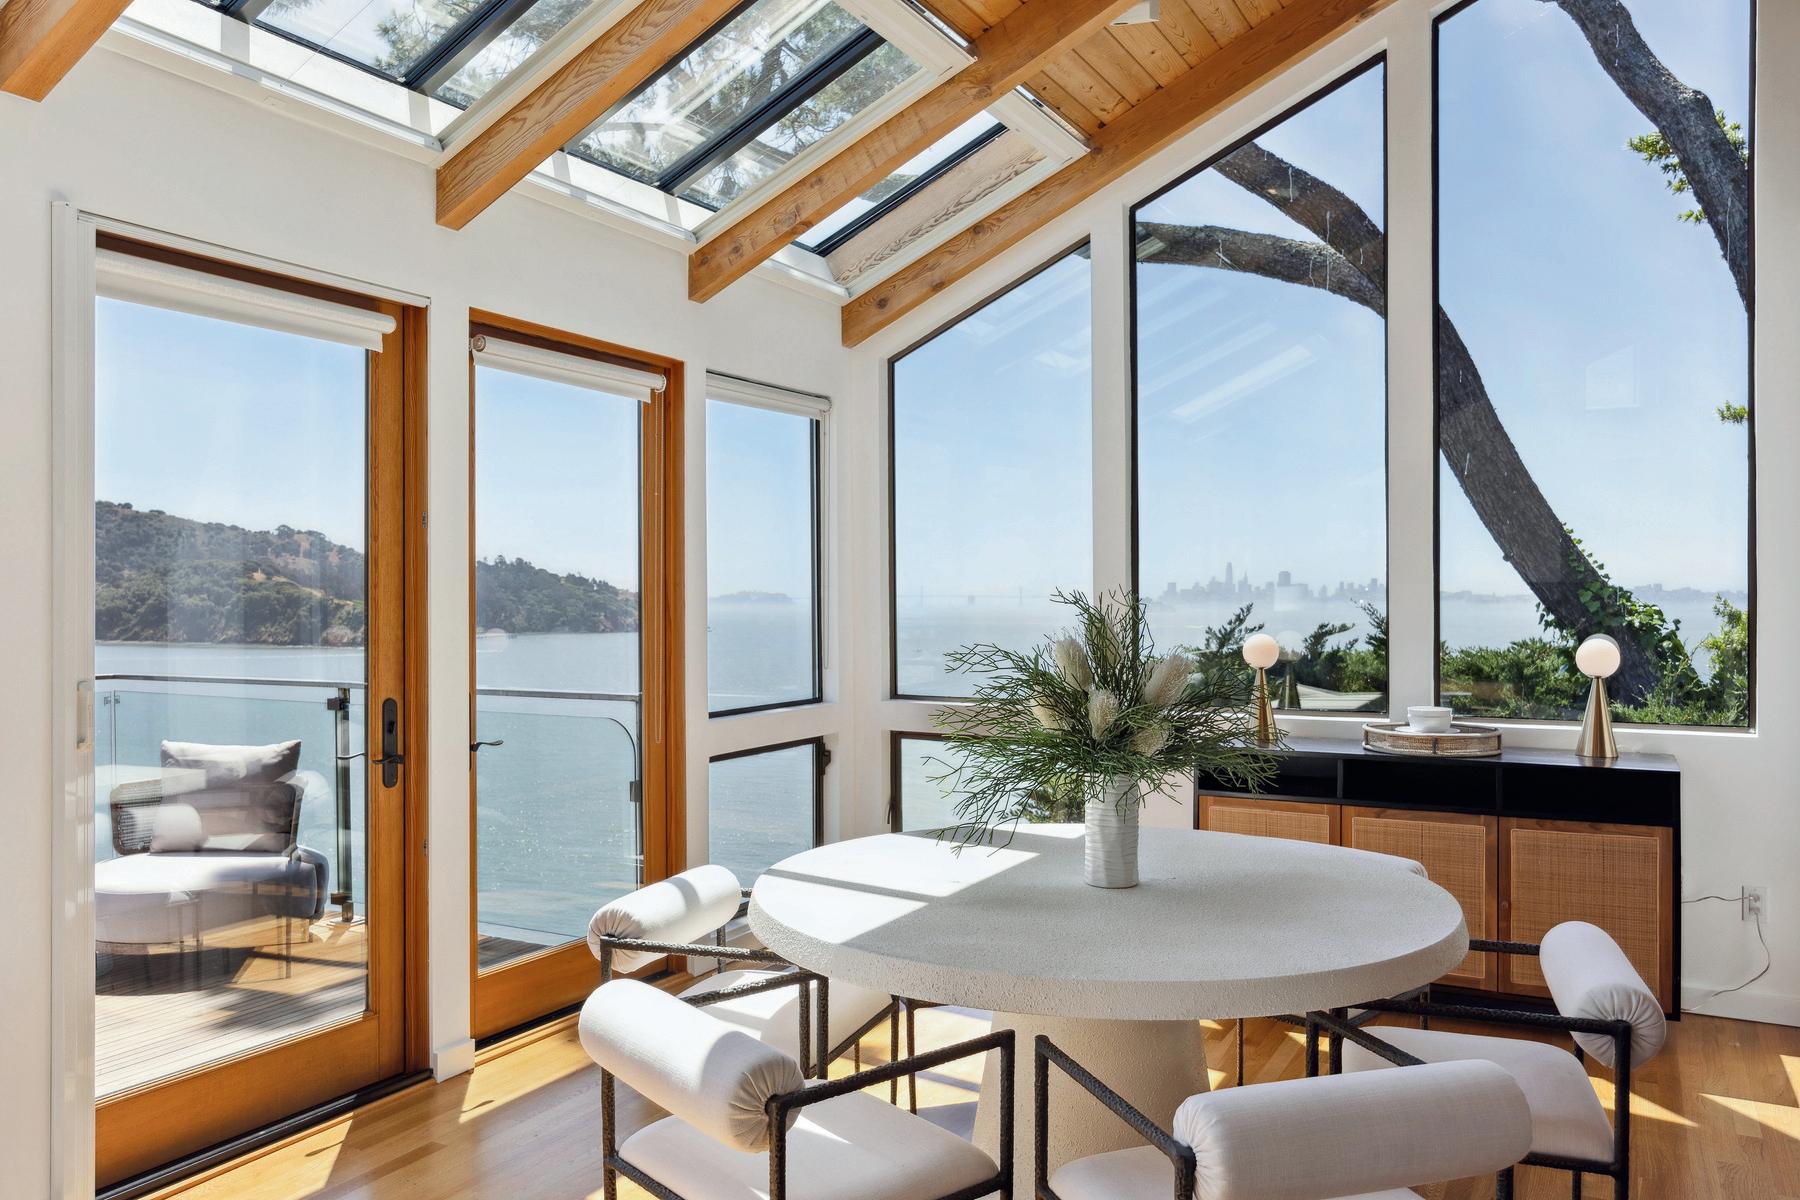
BELVEDERE ISLAND
$5,300,000
Trusted to Sell Your Most Valued Asset
Sotheby’s Auction House has over 200 years of history selling our clients’ treasures. Our association with the brand ensures stellar representation, brings cachet to your property and allows us access to affluent buyers around the world.
With our distinguished global referral network we can find qualified buyers or quality agents for your next purchase from around the globe. Our listings achieve maximum sale price.
1,100 Offices
52M Million Annual Page Visits SIR.com
#1
Most Profiled Real Estate Company in the News
26,500 Sales Associates
1.2M Engaged Social Media followers
49% SIR.com visits from outside U.S.
83 Countries
79M Videos played in 2023
41% Organic Search Traffic to SIR.com


The housing market moderated in 2024 after a strong fi rst half of the year, but overall remained positive. The inventory of homes for sale increased in 2024, with the greater number of options helping to bring more buyers o ff of the sidelines. A renewed push for a return to the o ffi ce supported demand for homes in the inner SF Bay Area, while greater stability in the technology industry and record stock market gains boosted sales in the higher price segments.
The SF Bay Area economy added nearly 24,000 jobs in 2024. While payrolls increased in nearly all SF Bay Area counties last year, most of the new jobs were located in the inner SF Bay Area. Employment in the professional and business services sector, which includes many tech jobs, stabilized as large-scale layo ff s eased. The unemployment rate increased slightly to 4.4% in 2024, which was still much lower than the long-
term average. The relatively tight labor market and continued job gains supported annual wage growth of more than 3% in 2024. Finally, in
SF Bay Area Unemployment Rate
another positive sign for the market, population growth in California accelerated in 2024 to 0.6% from 0.1% in 2023. The combination of improving local job prospects and fewer remote work options helped to stem migration out of the SF Bay Area and surrounding counties.
Despite higher mortgage rates constraining seller relocations, the number of active listings improved in 2024. After reaching a peak in the spring, the number of for-sale homes reached roughly 3,500 in December, an increase of 21% since 2023. Highlighting improved seller con fi dence in the market in 2024, active listings averaged 5,400 per month, the highest average since 2019. The increase in homes available for sale was widespread across the region. However,
San Francisco and San Mateo counties were notable exceptions, as average active listings decreased year-over-year, primarily because of strong buyer activity. The largest increases in listings were in Alameda and Solano counties, particularly in neighborhoods with access to primary job centers such as Benecia, the TriValley and Vallejo.
As inventory increased in 2024, so too did the number of closed sales, highlighting the deep demand pool. Despite the seasonal dip in the fourth quarter, an active spring buying season that persisted through the summer and into the fall boosted the SF Bay Area sales fi gure to nearly 40,000 homes in 2024, a 19% increase compared with 2023. Home sales increased in all SF Bay Area counties year-over-year. San Francisco led the region with an increase of nearly 20%. The relative a ff ordability of homes in Sonoma County supported a 15% increase in sales amidst rising regional prices and higher mortgages rates. Meanwhile, sales increased by a smaller amount in counties where vacation homes make up a larger share of total sales, including Santa Cruz and Napa counties.
One of the de fi ning features of the SF Bay Area housing market in 2024 was strong demand for homes in higher price segments, especially in
premier neighborhoods in the Peninsula and South Bay. The number of homes sold for $3.5 million or more increased by 40% compared with 2023, while sales of homes in the $1.25 to $2.5 million price range increased by 18%. Elevated mortgage rates a ff ected buyer a ff ordability in the lower price segments, which resulted in a smaller increase in the number of homes sold in much of the region. Bucking this trend, sales in the less than $1.25 million price range in Sonoma County improved by nearly 15% in 2024.
than the asking price increased to 55% in 2024. Competition was particularly intense near prime job centers such as Alameda, San Francisco and Santa Clara counties, as more than two-thirds of homes sold for more than asking in these counties. While SF Bay Area sellers that accepted o ff ers over asking received 10% more than the list price on average, sellers in San Francisco received nearly 18% more.
In addition to a large number of sales over asking, the relatively short amount of time homes spent on the market also re fl ected strong competition. The average days on market gradually increased during the year to slightly more than a month as of the fourth quarter. More broadly, homes were on the market for an average of 29 days in all of 2024, roughly on-par with 2023, and slightly less than what would be considered equilibrium.
Despite greater inventory, competition among buyers resulted in many homes selling at a premium. The share of homes sold for more
Strong demand and elevated sales activity in the luxury segment resulted in an increase in the median sales price. While seasonal trends resulted in a slight decrease in prices during the second half of the year, the SF Bay Area median sales price was $1.32 million as of 2024. This was a 5.2% increase compared with 2023, and an annual record high for the region.
The increase in sales in premier inner SF Bay Area neighborhoods helped boost the median price. In fact, at the county level, only Santa Clara County set an annual price record as of year-end 2024. However, the median sales price still increased in all SF Bay Area counties in 2024. Price growth was strongest in San Mateo and Santa Clara counties, and the median price climbed to more than $1.9 million in each county. Price growth was slower in markets where lower priced homes make up a larger share of sales, and thus where buyer demand is more sensitive to mortgage rates, such as Contra Costa, Solano and Sonoma counties.
After decreasing during the fi rst half 2024, mortgage rates rose through late 2024 and into early 2025, and may remain elevated this year. Additionally, given the strength of the national economy, the Federal Reserve is expected to make fewer rate cuts in 2025 to the short term interest rate. The higher borrowing costs and worsening a ff ordability may dampen some sales activity, particularly within the lower price tiers. However, strong wage growth, stock market performance and resumption of hiring in the technology sector may o ff set some of this e ff ect. Furthermore, as highlighted in 2024, the demand pool for housing in the SF Bay Area is deep and remarkably resilient. Along with more stable demographic trends, these factors provide signi fi cant tailwinds for the SF Bay Area single family market in 2025..
$1,600,000
$1,400,000
$1,200,000
Graph shows the 12-month rolling average of the median sales price for existing single family detached homes in the nine SF Bay Area counties. The rolling average smooths out seasonal variations to give a clear picture of long term trends.
Source: California Association of Realtors
$1,000,000
$800,000
Dotcom bubble peaks
$600,000
$400,000

12-MONTH ROLLING AVERAGE
$1,500,000 High April 2022
Subprime bubble bursts Market Trough $321,110 Feb 2009
MONTHLY MEDIAN
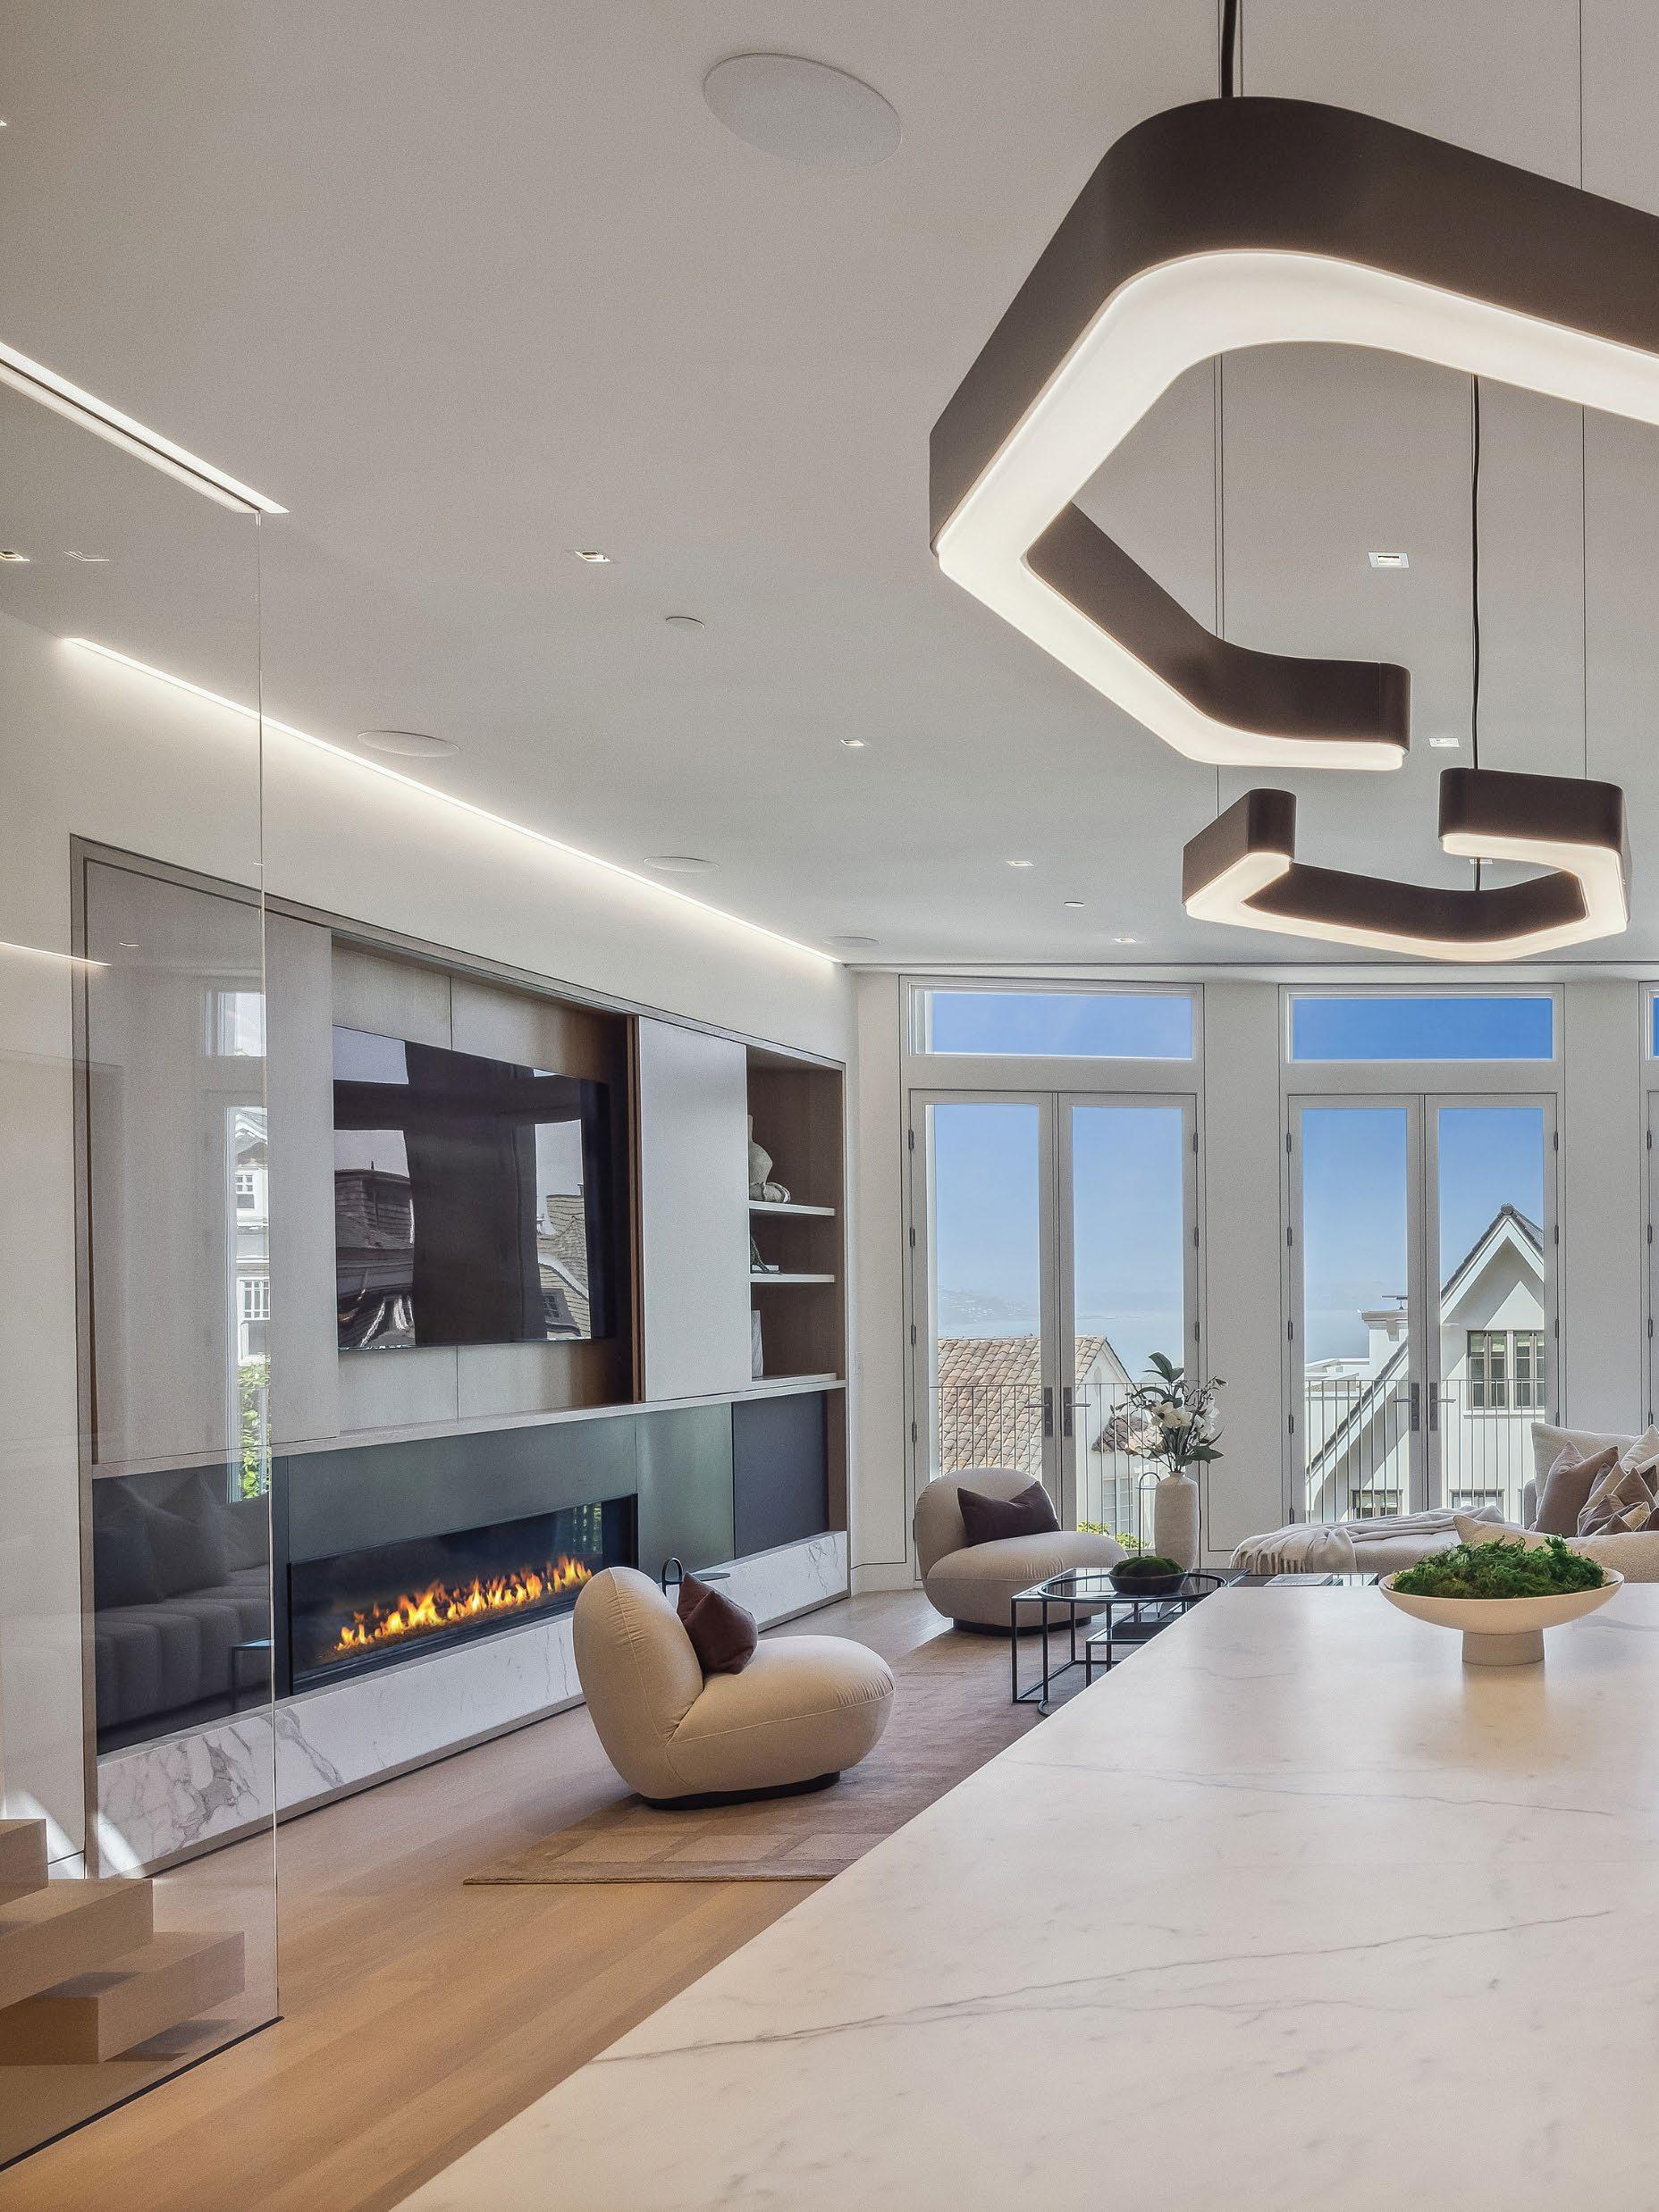
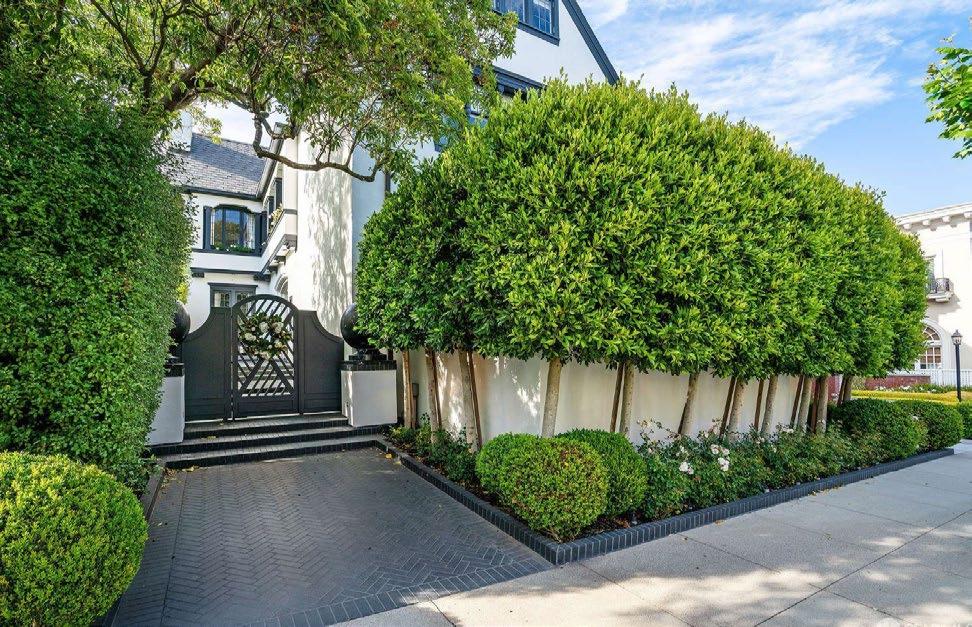
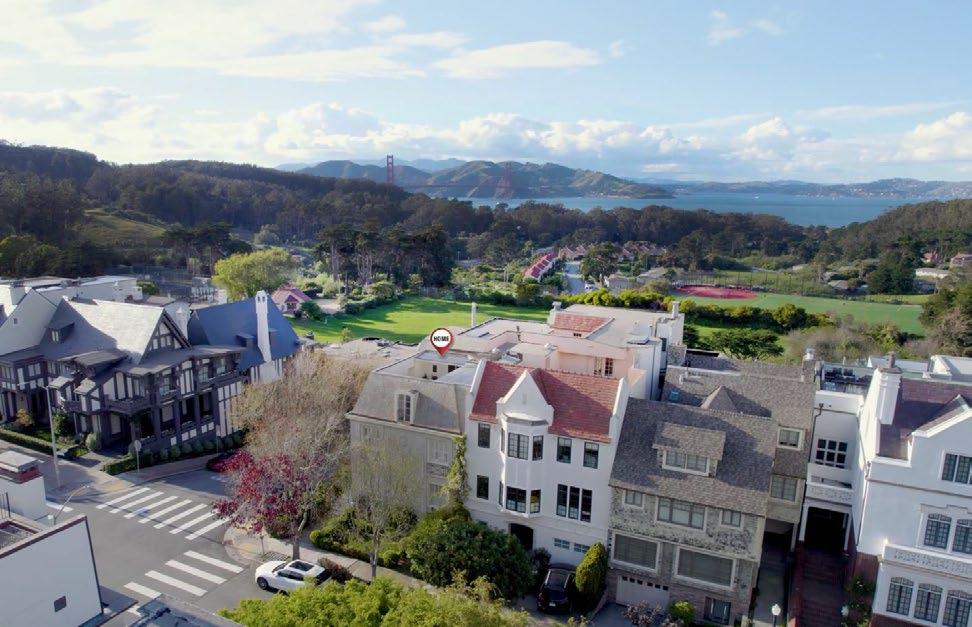
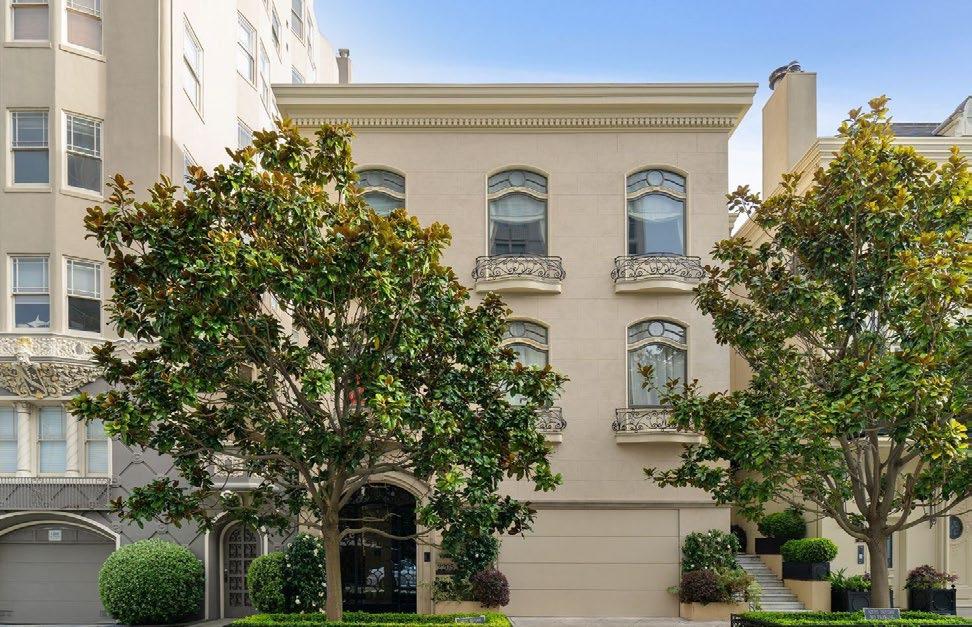
2747 VALLEJO I $14,000,000
PACIFIC HEIGHTS I SOLD OCTOBER 2024
LISTED BY WARRIN TEAM
Golden Gate Sotheby’s International Realty serves the SF Bay Area luxury home market with exclusive access to the largest international “Luxury MLS” — the Sotheby’s International Realty listing syndication platform, which inlcudes sothebysrealty.com and partners that include Mansion Global, The Wall Street Journal, Barron’s, Financial Times, James Edition and Juwai, just to name a few. The platform allows buyers from around the world to locate luxury homes in the SF Bay Area and beyond.
Luxury Sales by County and Sale Price
The number of homes sold at $4,000,000 or above came roaring back in 2024 with a 43% increase over the prior year, after falling 26% in 2023.
The highest-priced sale recorded in the MLS in 2024 was for a 13,525 square foot home on 3.17 acres in Atherton, originally built in 1932 and extensively remodeled.
Of the top ten highest sales for the year, six were in Atherton, three were in San Francisco, and one was in Sonoma.
For an in-depth review of the luxury housing market worldwide, see luxuryoutlook.com


DISTRICT 1
Central Richmond, Inner Richmond, Outer Richmond, Jordan Park/Laurel Heights, Presidio, Lake Street, Sea Cli ff , Lone Mountain
DISTRICT 2
Golden Gate Heights, Outer Parkside, Outer Sunset, Parkside, Central Sunset, Inner Sunset, Inner Parkside
DISTRICT 3
Lake Shore, Merced Heights, Pine Lake Park, Stonestown, Lakeside, Merced Manor, Ingleside, Ingleside Heights, Oceanview
DISTRICT 4
Balboa Terrace, Diamond Heights, Forest Hill, Forest Knolls, Ingleside Terrace, Midtown Terrace, Saint Francis Wood, Miraloma Park, Forest Hill Extension, Sherwood Forest, Mount Davidson Manor, Westwood Highlands, Westwood Park, Sunnyside, West Portal, Monterey Heights
DISTRICT 5
Glen Park, Haight Ashbury, Noe Valley, Twin Peaks, Cole Valley/ Parnassus Heights, Buena Vista/Ashbury Heights, Castro, Corona Heights, Clarendon Heights, Duboce Triangle, Eureka Valley/Dolores Heights, Mission Dolores
DISTRICT 6
Anza Vista, Hayes Valley, Lower Paci fi c Heights, Western Addition, Alamo Square, North Panhandle
DISTRICT 7
Marina, Paci fi c Heights, Presidio Heights, Cow Hollow
DISTRICT 8
Downtown, Financial District/ Barbary Coast, Nob Hill, North Beach, Russian Hill, Van Ness/ Civic Center, Telegraph Hill, North Waterfront, Tenderloin
DISTRICT 9
Bernal Heights, Inner Mission, Mission Bay, Potrero Hill, South of Market, Yerba Buena, South Beach, Central Waterfront/ Dogpatch
DISTRICT 10
Bayview, Crocker Amazon, Excelsior, Outer Mission, Visitacion Valley, Portola, Silver Terrace, Mission Terrace, Hunter’s Point, Bayview Heights, Candlestick, Little Hollywood
Graphs show trends in market activity for the county comparing this year (dark lines) with last year (light lines) for the same period. Data is gathered from Multiple Listing Service (MLS) sources, reviewed for accuracy, and charted for easy comparison. Data shown is for single family homes only.
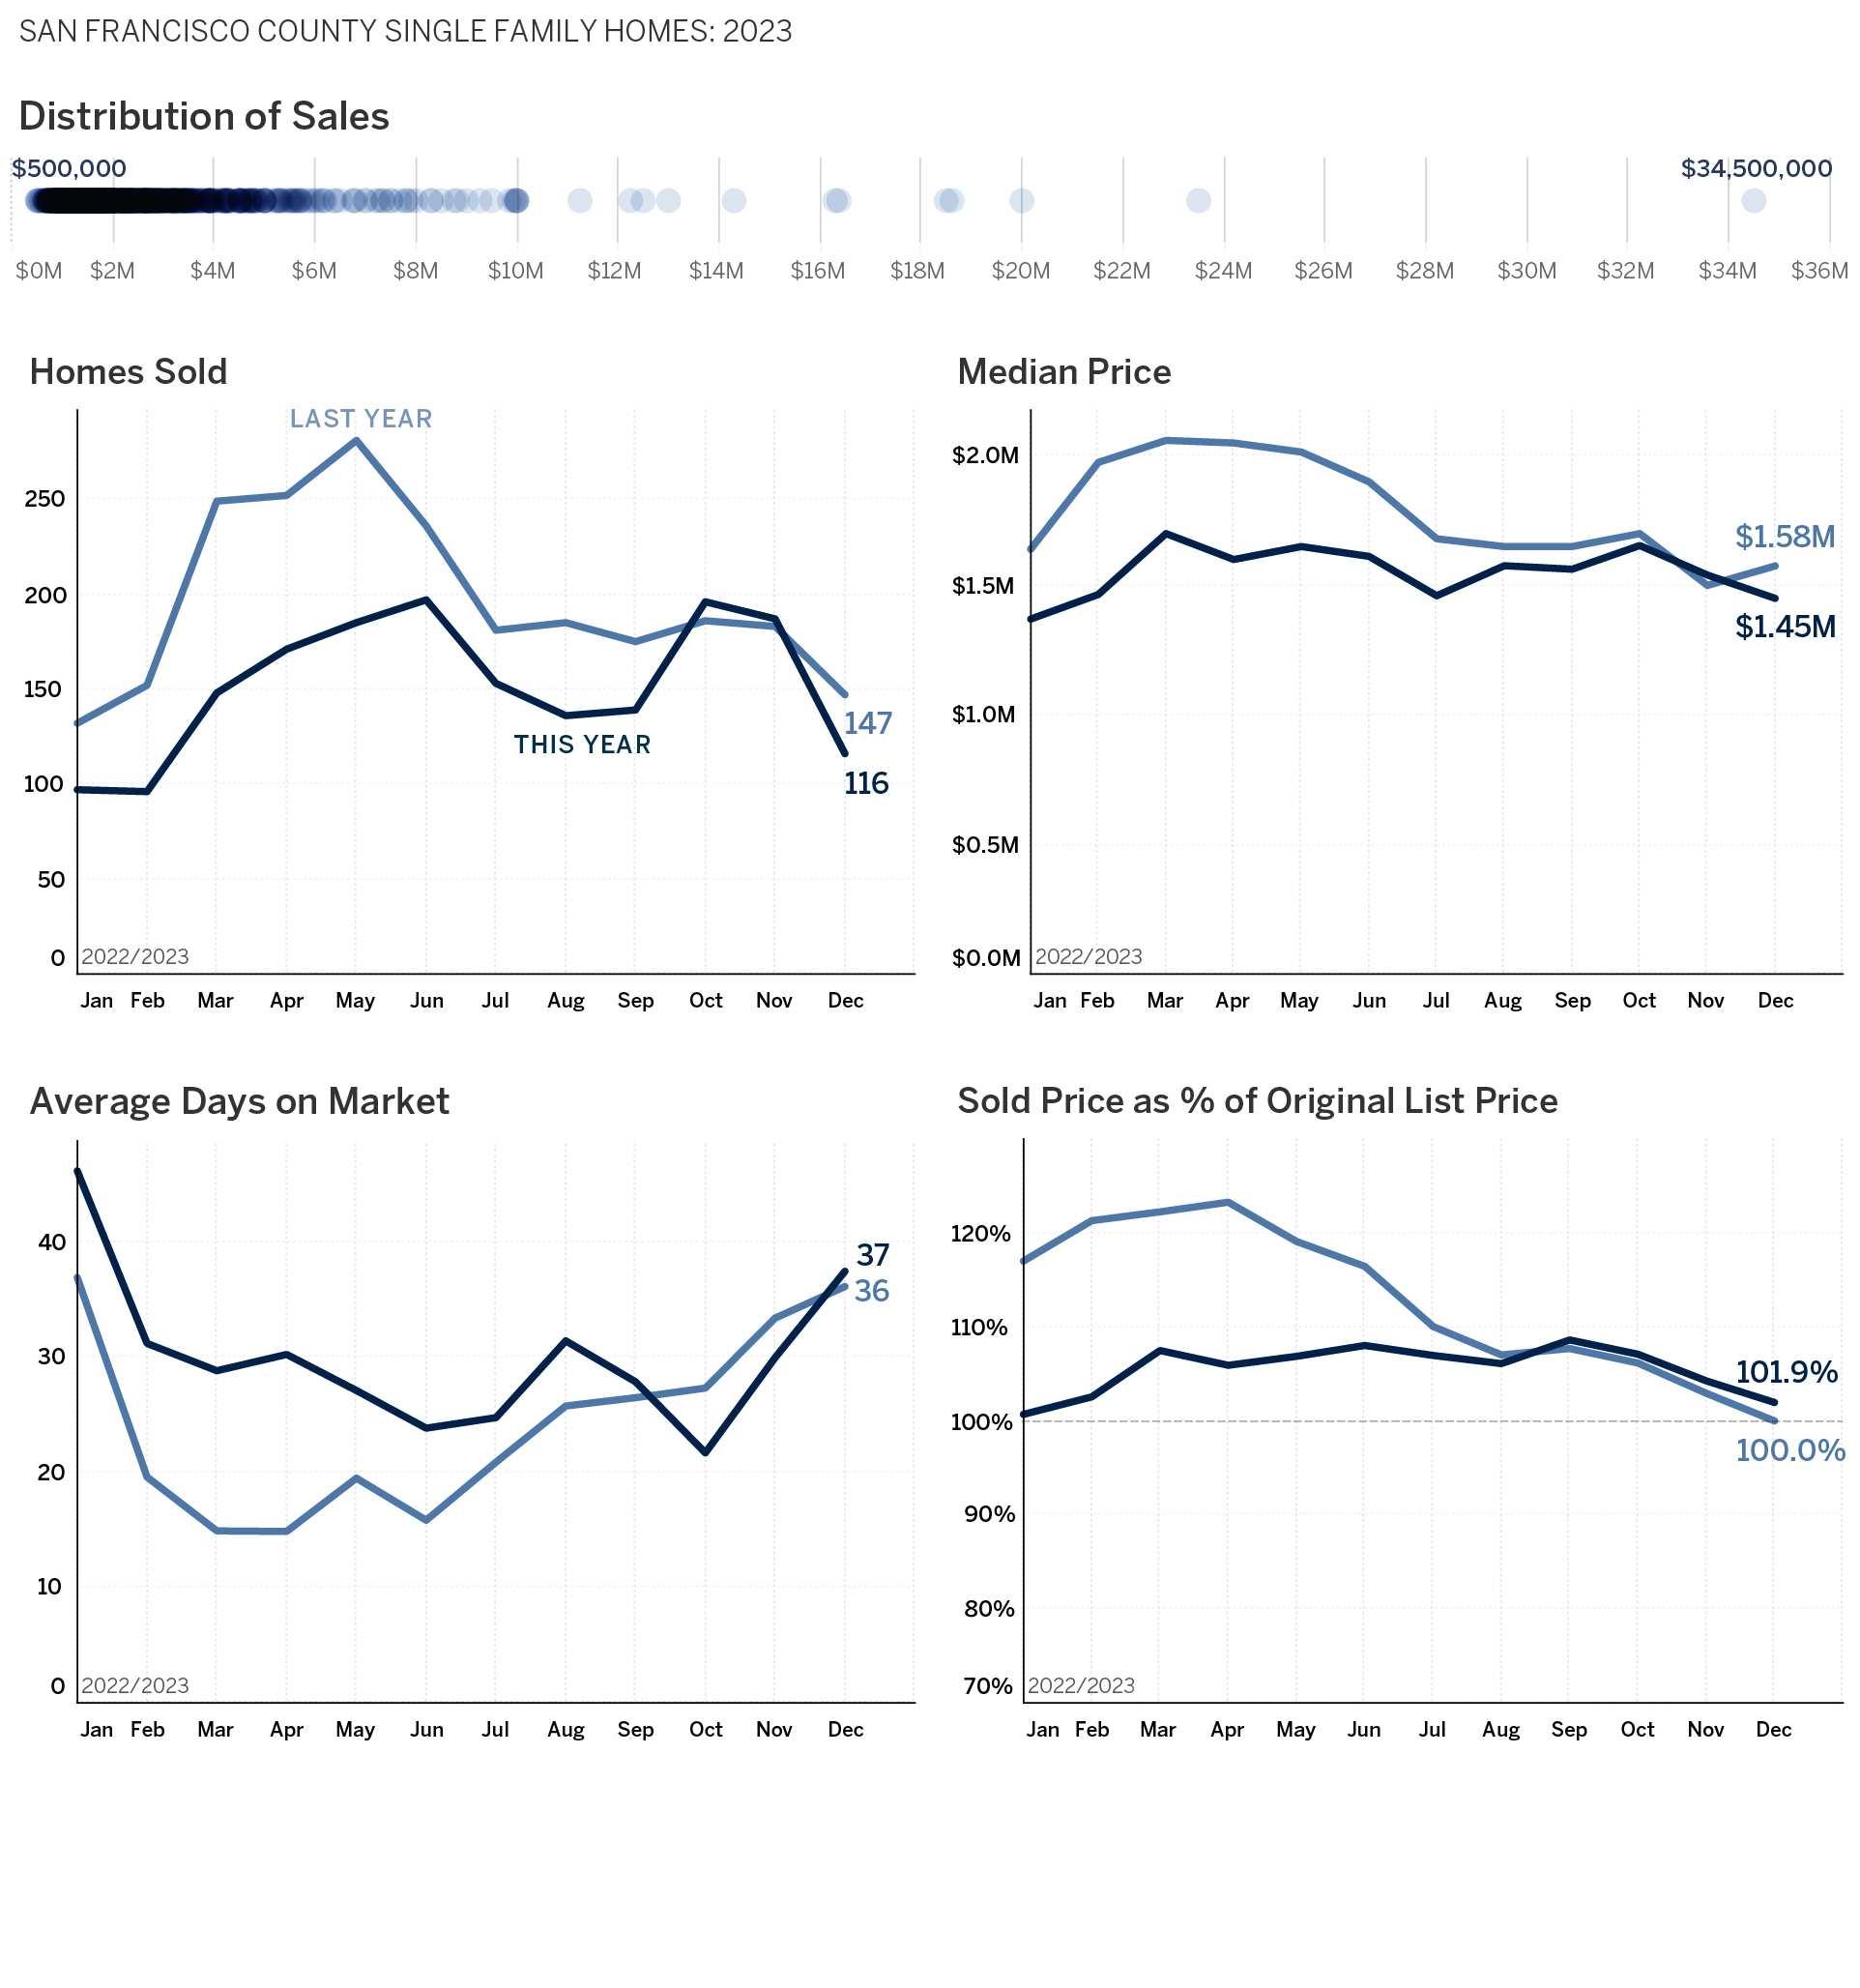
Data sourced from local MLS and deemed to be reliable, brokerage cannot verify data or guarantee accuracy. Data that appeared to be incorrect was not included in the calculations.
DISTRICT 1
Central Richmond, Inner Richmond, Outer Richmond, Jordan Park/Laurel Heights, Presidio, Lake Street, Sea Cli ff , Lone Mountain
DISTRICT 2
Golden Gate Heights, Outer Parkside, Outer Sunset, Parkside, Central Sunset, Inner Sunset, Inner Parkside
DISTRICT 3
Lake Shore, Merced Heights, Pine Lake Park, Stonestown, Lakeside, Merced Manor, Ingleside, Ingleside Heights, Oceanview
DISTRICT 4
Balboa Terrace, Diamond Heights, Forest Hill, Forest Knolls, Ingleside Terrace, Midtown Terrace, Saint Francis Wood, Miraloma Park, Forest Hill Extension, Sherwood Forest, Mount Davidson Manor, Westwood Highlands, Westwood Park, Sunnyside, West Portal, Monterey Heights
DISTRICT 5
Glen Park, Haight Ashbury, Noe Valley, Twin Peaks, Cole Valley/ Parnassus Heights, Buena Vista/Ashbury Heights, Castro, Corona Heights, Clarendon Heights, Duboce Triangle, Eureka Valley/Dolores Heights, Mission Dolores
DISTRICT 6
Anza Vista, Hayes Valley, Lower Paci fi c Heights, Western Addition, Alamo Square, North Panhandle
DISTRICT 7
Marina, Paci fi c Heights, Presidio Heights, Cow Hollow
DISTRICT 8
Downtown, Financial District/ Barbary Coast, Nob Hill, North Beach, Russian Hill, Van Ness/ Civic Center, Telegraph Hill, North Waterfront, Tenderloin
DISTRICT 9
Bernal Heights, Inner Mission, Mission Bay, Potrero Hill, South of Market, Yerba Buena, South Beach, Central Waterfront/ Dogpatch
DISTRICT 10
Bayview, Crocker Amazon, Excelsior, Outer Mission, Visitacion Valley, Portola, Silver Terrace, Mission Terrace, Hunter’s Point, Bayview Heights, Candlestick, Little Hollywood
Graphs show trends in market activity for the county comparing this year (dark lines) with last year (light lines) for the same period. Data is gathered from Multiple Listing Service (MLS) sources, reviewed for accuracy, and charted for easy comparison. Data shown is for single family homes only.
District 1 - Inner Richmond
730FunstonAve
$4,025,0008-Nov178$4,695,0005/55335$754
District 1 - Jordan Park/Laurel Heights
624EuclidAve
District 1 - Lake Street
2517thAve
$6,370,0007-Jun6$5,795,0005/4.54979$1,279
$4,700,00015-Aug7$4,350,0004/53465$1,356
$6,500,0006-Mar20$7,250,0005/75000$1,300
$6,300,00027-Feb7$5,795,0005/4.53645$1,728
$6,200,0007-Jun**Off-Market5/6N/AN/A
$5,410,00030-May**Off-Market5/4.53939$1,373
$4,875,00029-Oct6$4,550,0004/54565$1,068
$4,700,00016-Oct5$3,850,0004/4.53417$1,375 77thAve
$4,610,00022-Jan116$5,000,0004/4.53505$1,315
$4,500,00031-May18$4,695,0004/53450$1,304
$4,296,00031-Oct39$4,295,0005/53802$1,130 1630LakeSt
District 1 - Seacliff
290SeaCliffAve
$4,275,0005-Jul13$4,200,0004/33763$1,136
$4,200,0003-Dec38$4,495,0004/52886$1,455
$4,200,00019-Jul**Off-Market4/4.52890$1,453
$4,100,00022-Oct25$3,995,0007/65340$768
$4,100,00017-Jul7$3,500,0004/4.52762$1,484
$26,000,00018-Jul41$26,000,0004/67890$3,295 870ElCaminoDelMar$14,500,00018-Jan126$19,000,0004/65376$2,697
$12,400,0005-Aug60$12,995,0005/75935$2,089
750ElCaminoDelMar$7,850,00011-Apr40$9,800,0005/54500$1,744
20SeaViewTer
$6,800,0002-Apr11$6,100,0005/63610$1,884 224SeaCliffAve
$6,500,0005-Feb85$9,995,0007/57045$923 125SeaCliffAve
$6,000,00022-Aug**Off-Market5/32792$2,149 2025thAvenueNorth$5,400,00015-Apr6$4,980,0004/4.53215$1,680
6627thAve
$4,950,00020-Aug8$4,695,0004/32835$1,746
346ElCaminoDelMar$4,627,5008-Nov10$4,300,0004/54265$1,085
2901LakeSt
7025thAve
District 4 - Balboa Terrace
316SantaAnaAve
District 4 - Ingleside Terrace
184LunadoWay
$4,500,00017-Jul67$5,000,0004/4.54177$1,077
$4,050,00026-Jul13$3,100,0003/32760$1,467
$4,010,00018-Jul12$3,680,0005/53217$1,247
$4,100,00028-Mar6$3,890,0005/54294$955
District 4 - St. Francis Wood
150SantaPaulaAve$5,705,00023-Apr7$4,795,0005/33585$1,591
55SantaPaulaAve
$5,350,00026-Mar4$5,495,0005/32732$1,958
17SanAndreasWay$4,999,9997-Nov11$4,995,0005/54160$1,202
200SantaClaraAve
120SantaAna
$4,550,00027-Jun56$4,795,0004/53513$1,295
$4,350,00030-Oct90$4,600,0005/64800$906
25SaintFrancisBlvd$4,350,00022-Apr52$4,850,0005/6N/AN/A
254SantaPaulaAve$4,250,00022-Apr**Off-Market4/4.53757$1,131
275SantaClaraAve
260SantaClaraAve
$4,225,0005-Aug7$3,850,0003/33115$1,356
$4,200,00027-May**Off-Market5/4N/AN/A
163SanLeandroWay$4,170,00015-Oct8$3,595,0004/33170$1,315
60SantaAnaAve
$4,118,00024-Jun15$3,498,0004/4.53790$1,087
District 5 - Buena Vista/Ashbury Heights 1493MasonicAve
$5,550,00018-Oct5$5,398,0005/4.53915$1,418 851AshburySt
District 5 - Clarendon Heights
98CrownTerrace
$4,900,00030-Apr10$4,200,0004/4.53370$1,454
$4,850,00031-May21$4,950,0005/53790$1,280
$4,250,00017-May**Off-Market3/4.53300$1,288
$4,250,0002-Oct10$3,200,0004/4.53335$1,274
$5,700,0008-Nov46$6,200,0004/4.53247$1,755
District 5 - Cole Valley/Parnassus Heights 31ParnassusAve
$6,200,0001-Nov7$5,500,0005/64190$1,480
$5,250,00012-Aug**Off-Market4/4.53682$1,426
$4,500,00011-Oct9$4,250,0006/43250$1,385
$4,500,0009-Oct125$5,495,0004/4.53691$1,219
District 5 - Eureka Valley/Dolores Heights 328CumberlandSt
$7,150,0001-May42$7,950,0004/64160$1,719
$6,300,00028-Oct13$6,100,0004/54070$1,548
$5,250,00013-Sep115$5,698,0004/54190$1,253
District 5 - Glen Park 387BeaconSt
$6,200,0006-Jun2$4,999,0005/53549$1,747
$4,900,0008-Oct3$4,485,0006/53961$1,237 38WilderSt
District 5 - Haight Ashbury
District 5 - Noe Valley
442823rdSt
$4,900,0003-Jun2$4,395,0004/4.53426$1,430
$5,888,00024-Jun40$5,995,0005/64961$1,187
$4,500,00022-Oct11$4,250,0006/75156$873
$7,200,0005-Feb12$7,200,0005/6N/AN/A 354FairOaksSt
$7,125,00030-Dec20$7,125,0005/54670$1,526
$7,000,0008-Nov18$6,995,0006/76036$1,160
$6,900,00014-Jun126$8,500,0004/64020$1,716 426724thSt
$6,800,00017-Sep15$6,795,0004/64371$1,556 384625thSt
$6,375,0004-Apr9$6,495,0004/4.5N/AN/A
$5,890,0001-Nov12$6,295,0004/4.5N/AN/A
$5,750,00019-Jan59$5,995,0004/53741$1,537
$5,500,00017-May25$5,985,0004/4.53850$1,429 253ChattanoogaSt
46127thSt
$5,475,00018-Oct11$5,295,0004/6N/AN/A
$5,430,00022-Oct21$5,900,0004/4.54075$1,333
$5,200,00016-Aug1$5,500,0004/33200$1,625 33227thSt
$4,995,00022-May113$5,495,0005/64620$1,081 876ElizabethSt
$4,950,00029-Mar56$5,195,0005/4.53210$1,542 230JerseySt
1119CastroSt
384125thSt
$4,850,0008-Jul7$4,495,0004/53432$1,413
$4,750,00031-May11$4,495,0005/53416$1,391
$4,630,00020-May12$3,998,0004/4.5N/AN/A 1825CastroSt
$4,431,10015-Jul**Off-Market5/4.53044$1,456
$4,380,00027-Dec103$4,980,0005/64006$1,093
$4,350,00025-Mar**Off-Market5/63550$1,225 431925thSt
$4,350,00014-May10$3,995,0004/52893$1,504
$4,300,0004-Sep**Off-Market4/4.53112$1,382 373322ndSt
$4,280,00014-Feb15$3,880,0004/4.5N/AN/A
$4,100,00018-Nov**Off-Market4/32760$1,486
$4,050,00013-Sep13$4,295,0004/43191$1,269
$4,000,00020-Dec**Off-Market3/4.52940$1,361 District 6 - Hayes Valley
$4,995,00016-Feb**Off-Market4/53317$1,506
District 6 - Lower Pacific Heights 1914WebsterSt
District 7 - Cow Hollow
2550FilbertSt
2601LyonSt
$4,150,00019-Mar6$4,150,0004/3N/AN/A
$8,000,00023-May4$6,995,0004/54280$1,869
$6,650,00029-Jan84$6,500,0004/4.54554$1,460
$6,212,5005-Jul**Off-Market4/54365$1,423
$6,200,00021-Jun91$6,750,0005/54724$1,312
$4,999,9995-Dec240$7,125,0004/4.54815$1,038 2649GreenwichSt
$4,800,00020-Mar36$4,995,0004/4.52868$1,674
$4,850,0006-Dec7$4,695,0005/4.52928$1,656 2850FilbertSt
$4,700,0007-Oct14$4,750,0004/33608$1,303
$4,650,0007-Jun52$4,995,0005/53975$1,170
$4,000,0005-Apr32$4,250,0004/3N/AN/A 1808FilbertSt
$3,775,00013-Nov54$4,150,0004/4.52980$1,267 2934BroderickSt
$3,500,00030-Sep9$3,100,0003/4.52180$1,606
$10,750,00021-Oct17$9,950,0005/85420$1,983
$7,150,0008-Jan96$7,900,0003/4.53600$1,986
$6,150,00029-Mar70$6,500,0005/53990$1,541
$4,995,00013-Sep2$4,995,0005/4.52867$1,742
$4,600,0005-Jul39$5,500,0004/32978$1,545
$4,500,0009-Dec15$4,500,0004/32924$1,539
$4,216,8755-Apr8$4,295,0005/42750$1,533
$4,150,00010-May13$3,995,0003/32710$1,531
$4,100,0002-Jul64$4,200,0004/32735$1,499
$4,030,00024-Jun66$3,980,0004/22774$1,453
$4,000,00014-Feb**Off-Market5/33681$1,087
$71,000,00027-Jun**Off-MarketN/A17,286$4,107
$29,150,00016-Aug590$35,000,0007/911,635$2,505
$21,816,66727-Mar**Off-Market6/109125$2,391
$15,250,00030-Oct24$16,000,0008/98960$1,702
2480BroadwaySt
2760VallejoSt
2776BroadwaySt
1969CaliforniaSt
3015PacificAve
2834JacksonSt
2623DivisaderoSt
$9,500,0004-Nov257$12,935,0005/56507$1,460
$9,500,00025-Oct52$9,500,0006/9N/AN/A
$9,300,00011-Jan57$9,750,0003/53579$2,598
$9,000,00018-Jun5$9,000,0005/78990$1,001
$9,000,00014-Mar10$8,000,0006/77405$1,215
$8,350,00020-Dec35$9,500,0007/86840$1,221
$7,340,00030-Apr**Off-Market5/55021$1,462
$7,235,00020-Feb19$7,900,0005/64770$1,517 2445WashingtonSt$7,200,00022-Nov13$7,300,0004/54560$1,579 2536BakerSt
$7,200,00031-May109$7,750,0004/55580$1,290 2773ClaySt
$6,828,0001-Apr**Off-Market4/33808$1,793
$6,950,00026-Feb101$7,495,0004/4.53562$1,951 2077BroadwaySt
$6,750,00020-Sep**Off-Market4/64679$1,443
$6,750,00030-Oct114$7,995,0007/8.56415$1,052
$6,649,00020-Feb39$6,649,0007/67115$935
$6,500,00023-Sep9$6,500,0005/54740$1,371
$6,375,00031-Jul15$5,950,0004/43265$1,953
$6,200,00013-Dec**Off-Market5/3.53435$1,805
$6,100,0006-Nov22$6,750,0003/3.5N/AN/A
$5,995,00014-Aug185$6,250,0006/54820$1,244
$5,800,00016-Aug54$5,495,0004/4.52395$2,422
$5,750,00024-Jun37$5,990,0004/53807$1,510
$5,550,00024-Apr20$5,550,0005/63952$1,404
$5,500,0008-Oct11$5,600,0004/4.5N/AN/A
$5,400,0008-Jan89$6,195,0004/63650$1,479
$5,125,00031-Jan14$4,895,0004/53045$1,683
$4,999,00026-Apr12$5,300,0005/54363$1,146
$4,995,00029-Mar**Off-Market6/55584$895
$4,995,00016-Jan115$6,300,0006/54494$1,111
$4,995,00011-Jan122$5,500,0004/4.53730$1,339
$4,995,0007-Feb3$4,995,0003/4.53460$1,444
$4,625,0004-Jan**Off-Market6/54701$984
$4,550,00031-Oct5$3,995,0003/32595$1,753
$4,480,00016-Aug94$4,650,0004/4.52930$1,529
$4,425,00012-Nov46$4,749,0005/54311$1,026
$4,355,00031-May12$3,995,0005/64645$938
$4,351,00025-Mar8$3,890,0003/4.52867$1,518
2611PacificAve
$4,338,00015-Oct13$4,500,0004/42911$1,490 2826SacramentoSt
District 7 - Presidio Heights
3630JacksonSt
$4,300,00017-Jun29$4,600,0004/33525$1,220
$24,000,00024-Apr296$36,000,0008/912022$1,996
3621WashingtonSt$20,166,66717-Jul**Off-Market4/53650$5,525 3898WashingtonSt$14,700,00026-Apr16$14,950,0007/78765$1,677 10Presidio
3498JacksonSt
3323PacificAve
$13,500,00010-May**Off-Market5/66320$2,136
$12,900,0002-Jul8$11,980,0007/76385$2,020
$11,550,00015-Apr8$12,000,0004/55010$2,305
$9,950,00028-Oct7$8,995,0005/55558$1,790 16PresidioTer
$8,500,00021-Nov13$7,499,0005/56084$1,397 3233PacificAve
District 9 - Potrero Hill 877CarolinaSt
District 9 - Russian Hill
$8,500,00026-Apr49$9,900,0005/65260$1,616
$8,400,00022-May24$8,900,0005/65722$1,468
$8,208,37523-Apr15$8,750,0005/4.56146$1,336
$7,300,00025-Apr11$6,700,0005/75490$1,330
$6,675,0007-Jun**Off-Market6/65910$1,129
$6,550,00024-Jul61$7,000,0006/55400$1,213
$6,000,0001-Apr13$5,800,0005/53700$1,622
$6,000,00027-Mar8$5,450,0004/4.5N/AN/A
$4,800,00027-Feb9$4,250,0004/33402$1,411
$4,100,0009-Jul12$3,795,0004/33004$1,365
$4,000,00015-Mar15$3,900,0004/34750$842
$5,655,00017-Oct5$4,995,0004/53445$1,642
$22,100,00015-Nov12$22,000,0005/78440$2,618
$9,350,00013-Dec81$9,995,0004/64993$1,873
$4,895,00025-Mar**Off-Market5/3.53610$1,356
297 30 th AVE I $3,490,000
SEACLIFF I SOLD JUNE 2024
LISTED BY WARRIN TEAM

District 1 - Jordan Park/Laurel Heights
1 -Lake Street
5 - Buena Vista/Ashbury Heights
5 - Cole Valley/Parnassus Heights
5 - Duboce Triangle
5 - Eureka Valley/Dolores Heights
280SpearSt#39D
280SpearSt#38D
1SteuartLn
280SpearSt#37D
280SpearSt#40B
488FolsomSt#3701
280SpearSt#38B
$4,700,00011-Oct144$4,900,0003/32351$1,999
$4,495,00020-May**Off-Market3/32304$1,951
$4,366,50028-Oct**Off-Market3/31679$2,601
$4,200,00020-May**Off-Market3/32312$1,817
$3,850,00020-May**Off-Market3/32162$1,781
$3,800,00028-Mar36$3,995,0003/42195$1,731
$3,695,00023-Feb68$3,695,0003/32213$1,670
488FolsomSt#4302$3,600,00012-Aug**Off-Market3/31888$1,907
280SpearSt#32F
280SpearSt#38A
488FolsomSt#4401
488FolsomSt#4202
301MainSt#26AB
201FolsomSt#37E
338SpearSt#35D
200BrannanSt#232
201FolsomSt#32E
4251stSt#5802
$3,595,0002-Oct42$3,695,0003/31984$1,812
$3,524,00020-Dec67$3,595,0003/32123$1,660
$3,485,00025-Oct**Off-Market3/31934$1,802
$3,427,50023-Jul99$3,675,0003/31888$1,815
$3,325,0001-May29$3,500,0003/32480$1,341
$3,070,00029-Apr19$3,168,0003/31784$1,721
$2,995,00020-Sep**Off-Market3/31730$1,731
$2,920,00012-Apr25$2,920,0003/32508$1,164
$2,875,0008-Jul84$3,095,0003/31784$1,612
$2,650,0004-Sep223$2,848,0003/2N/AN/A 201FolsomSt#29A
District 9 - South of Market 765MarketSt#36CD
765MarketSt#28A
District 9 - Treasure Island
37MeadowDr#4
37MeadowDr#2
District 9 - Yerba Buena
181FremontSt#67C
181Fremont#56A
188MinnaSt#33E
181Fremont#64D
181FremontSt#65D
301MissionSt#55A
188MinnaSt#35D
$2,550,00012-Apr**Off-Market2/21568$1,626
$3,850,00013-Dec2$4,000,0003/5N/AN/A
$2,700,0002-Jul37$2,995,0002/32855$946
$3,195,00012-Apr**Off-Market3/42443$1,308
$3,175,00028-Jun1$3,195,0003/42445$1,299
$4,250,00014-Mar11$4,500,0002/31748$2,431
$4,000,00016-Jan5$4,500,0002/31985$2,015
$4,000,0002-Jan45$4,999,0003/42670$1,498
$2,900,00026-Feb120$3,474,0002/21577$1,839
$2,900,00028-May95$2,995,0002/21555$1,865
$2,700,0007-Nov69$3,975,0002/32706$998
$2,650,0004-Apr**Off-Market2/31792$1,479

765 MARKET #24F I $2,700,000
SOUTH OF MARKET I SOLD JULY 2024
LISTED BY WARRIN TEAM

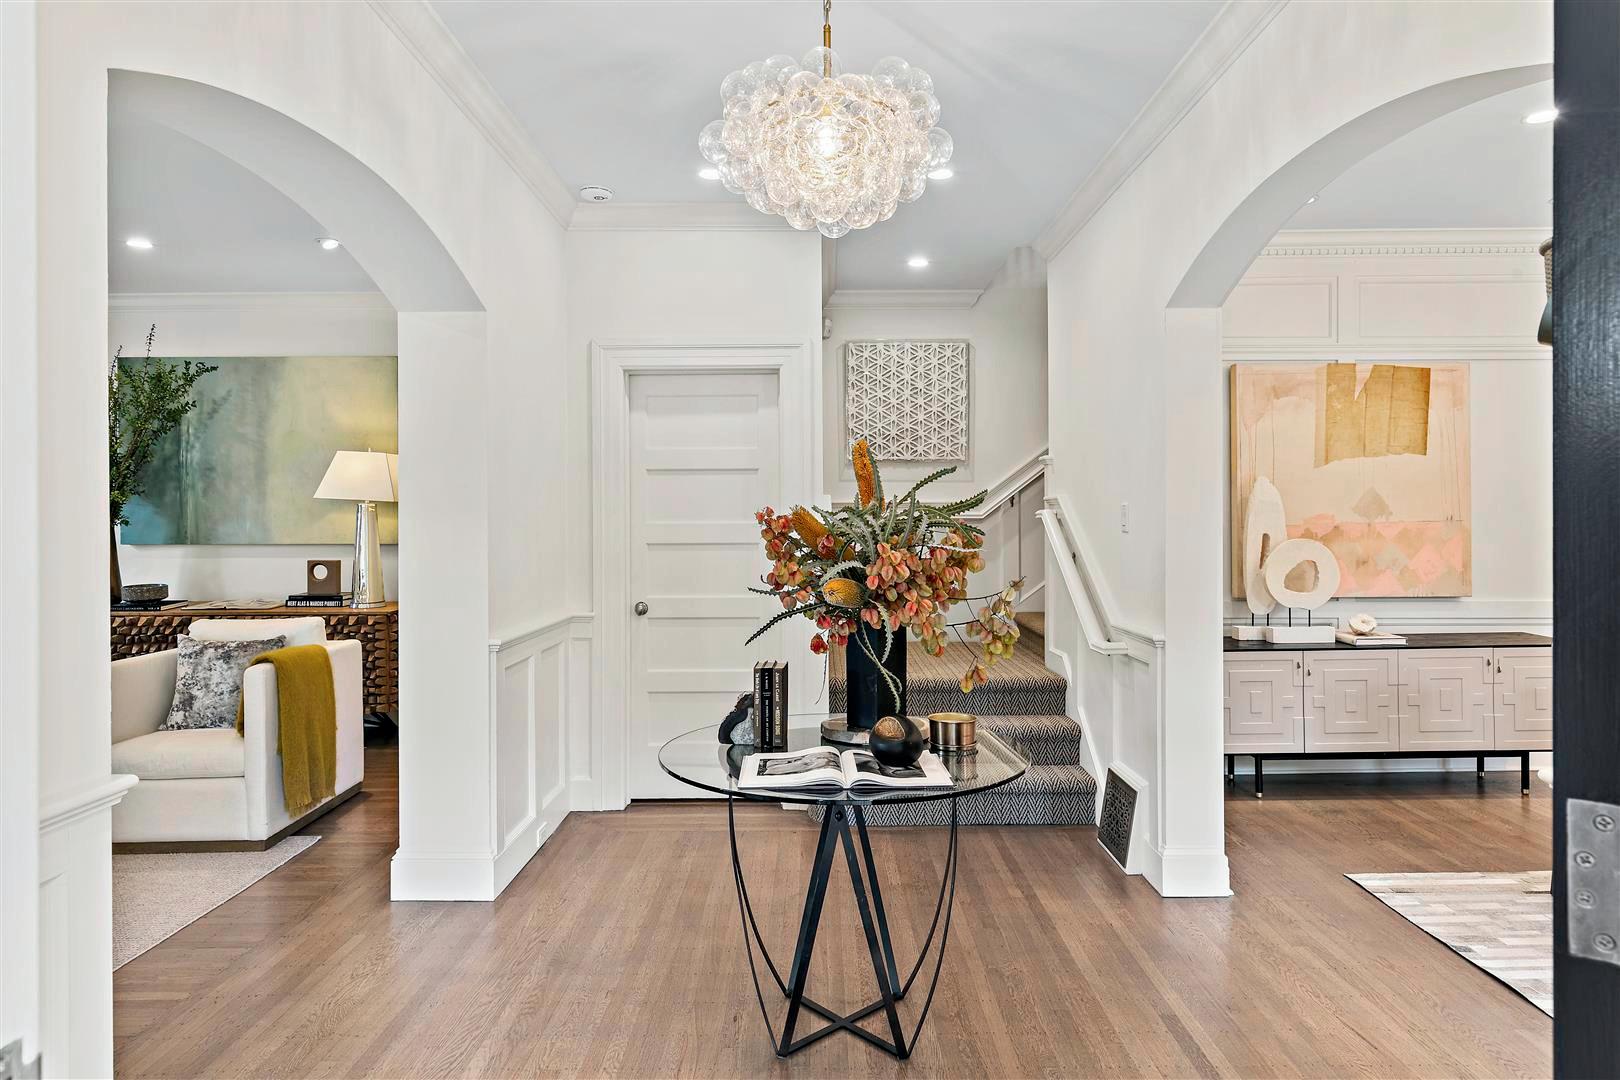
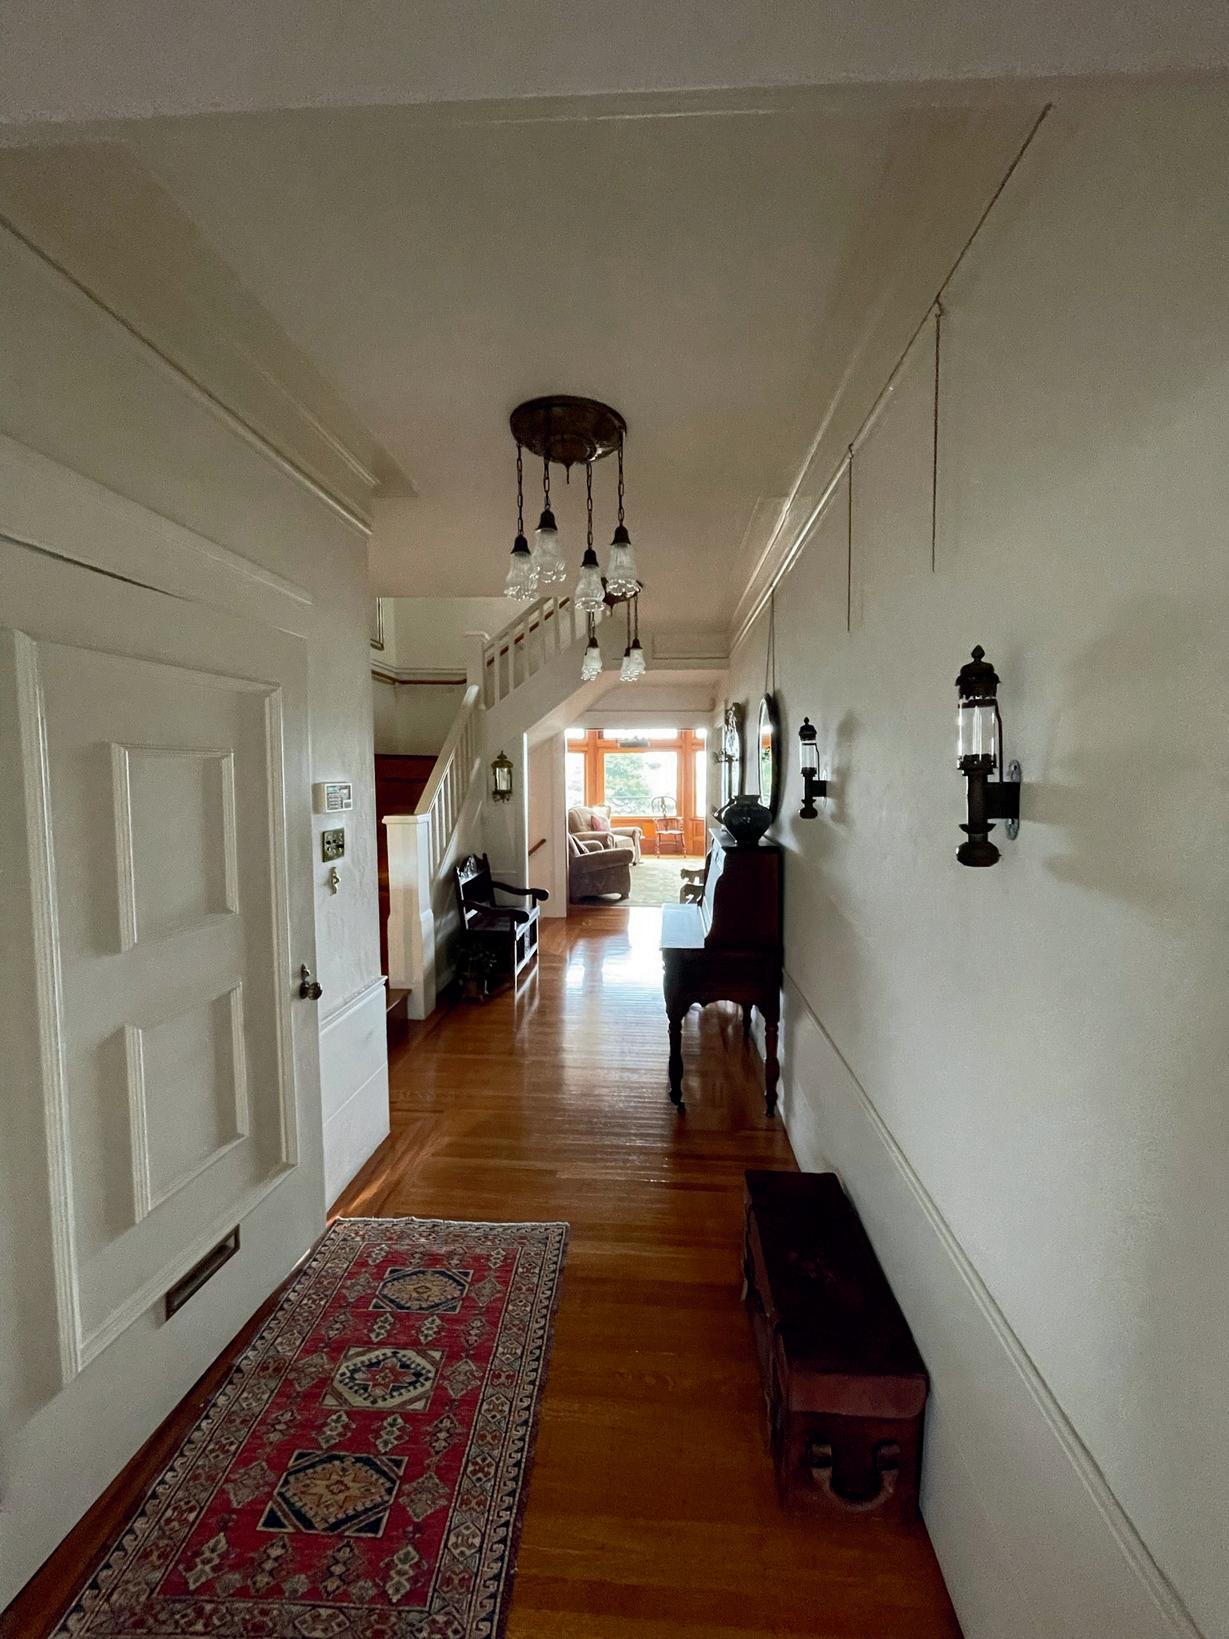
A fresh coat of paint, newly refinished floors, and updated lighting completely revitalized this Cow Hollow home. The once-dark foyer, with its heavy walnut flooring and outdated halogen lighting, was transformed into a bright, airy, and sophisticated entryway—setting the tone for the stunning home beyond. This property was one of the highest condo sales in Cow Hollow in 2023.
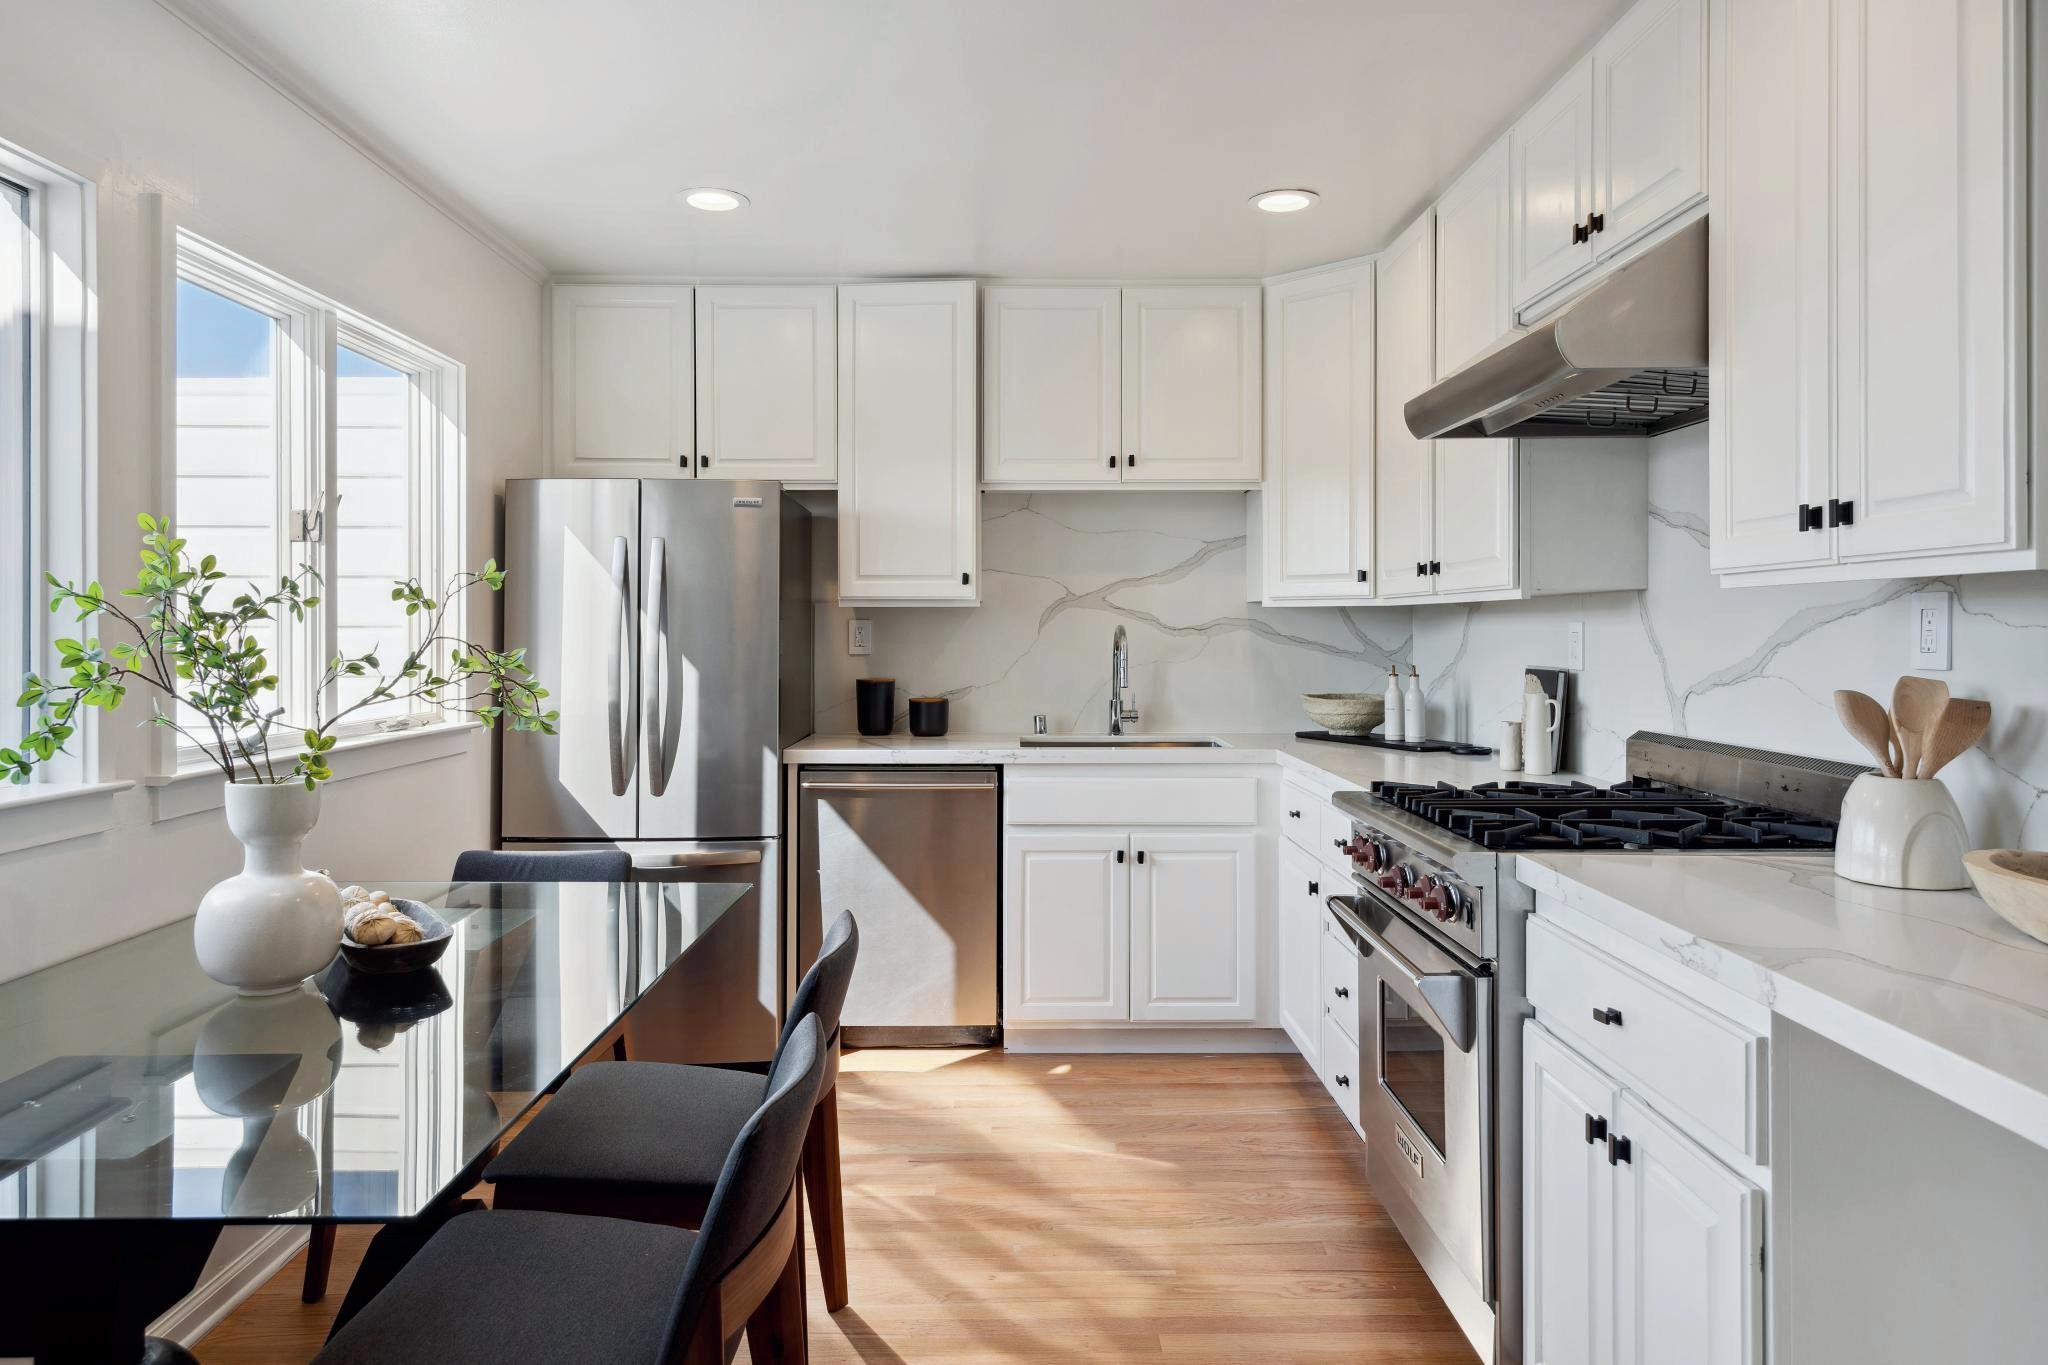
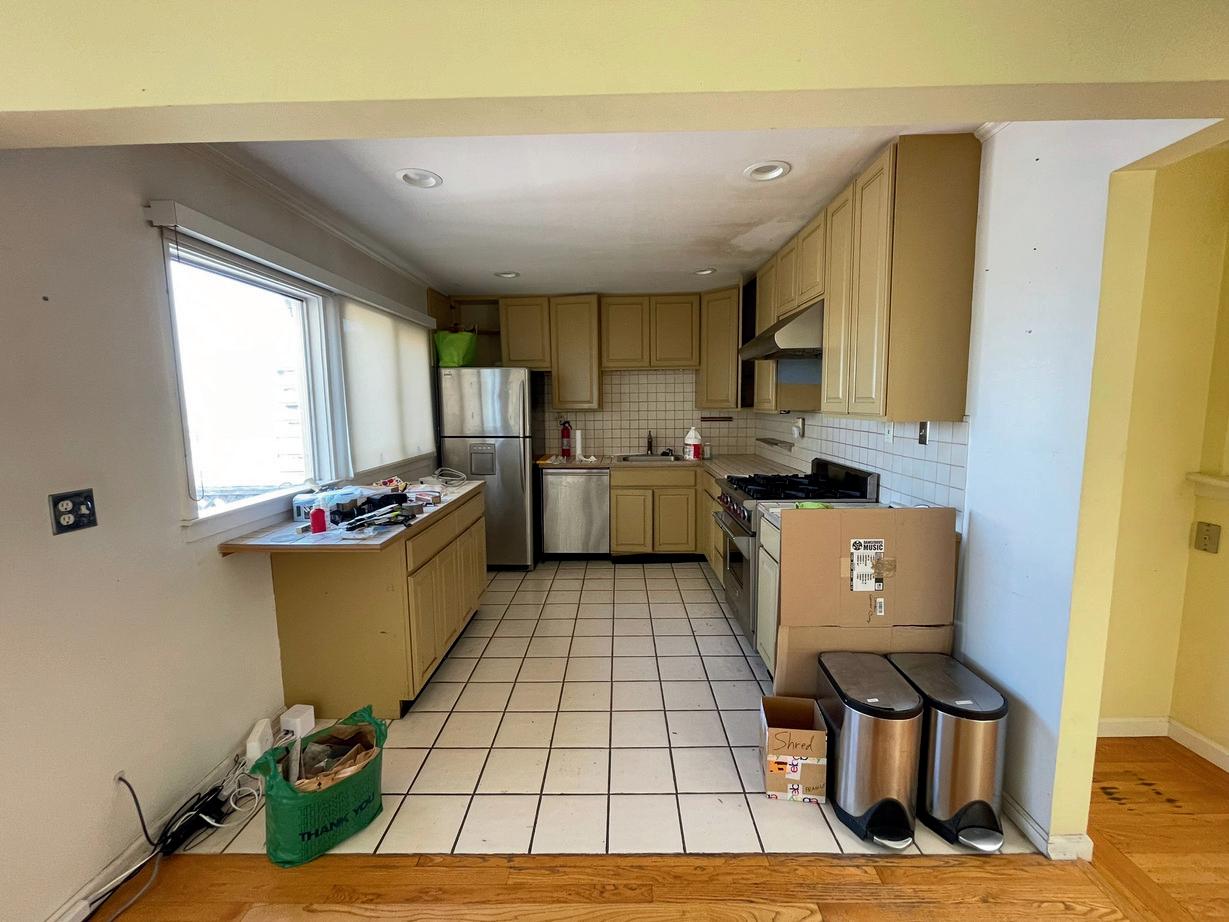
We revitalized this Bernal Heights home with a fresh coat of paint, new hardwood flooring, and elegant Calacatta countertops. The once dated kitchen, characterized by tiled floors, worn wooden cabinetry, and older appliances, was transformed into a bright and airy space that radiates modern sophistication. This impressive renovation perfectly highlights the beautifully updated heart of the home. This property received multiple offers and sold well above asking price.
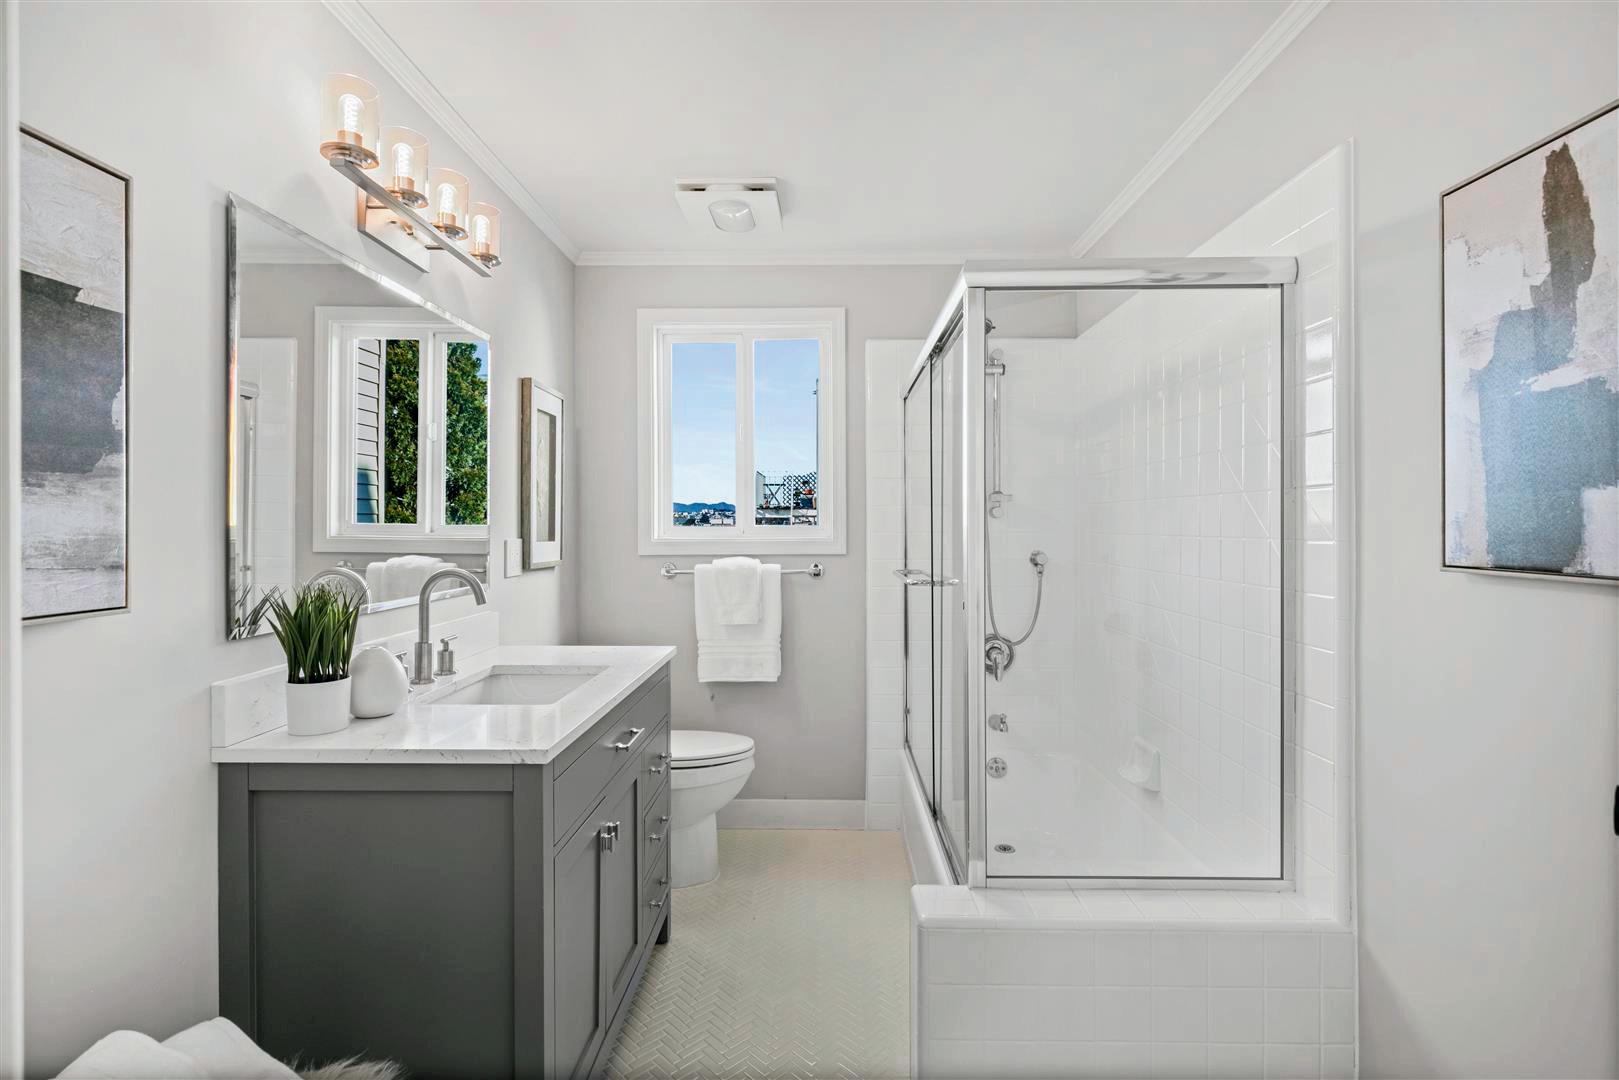
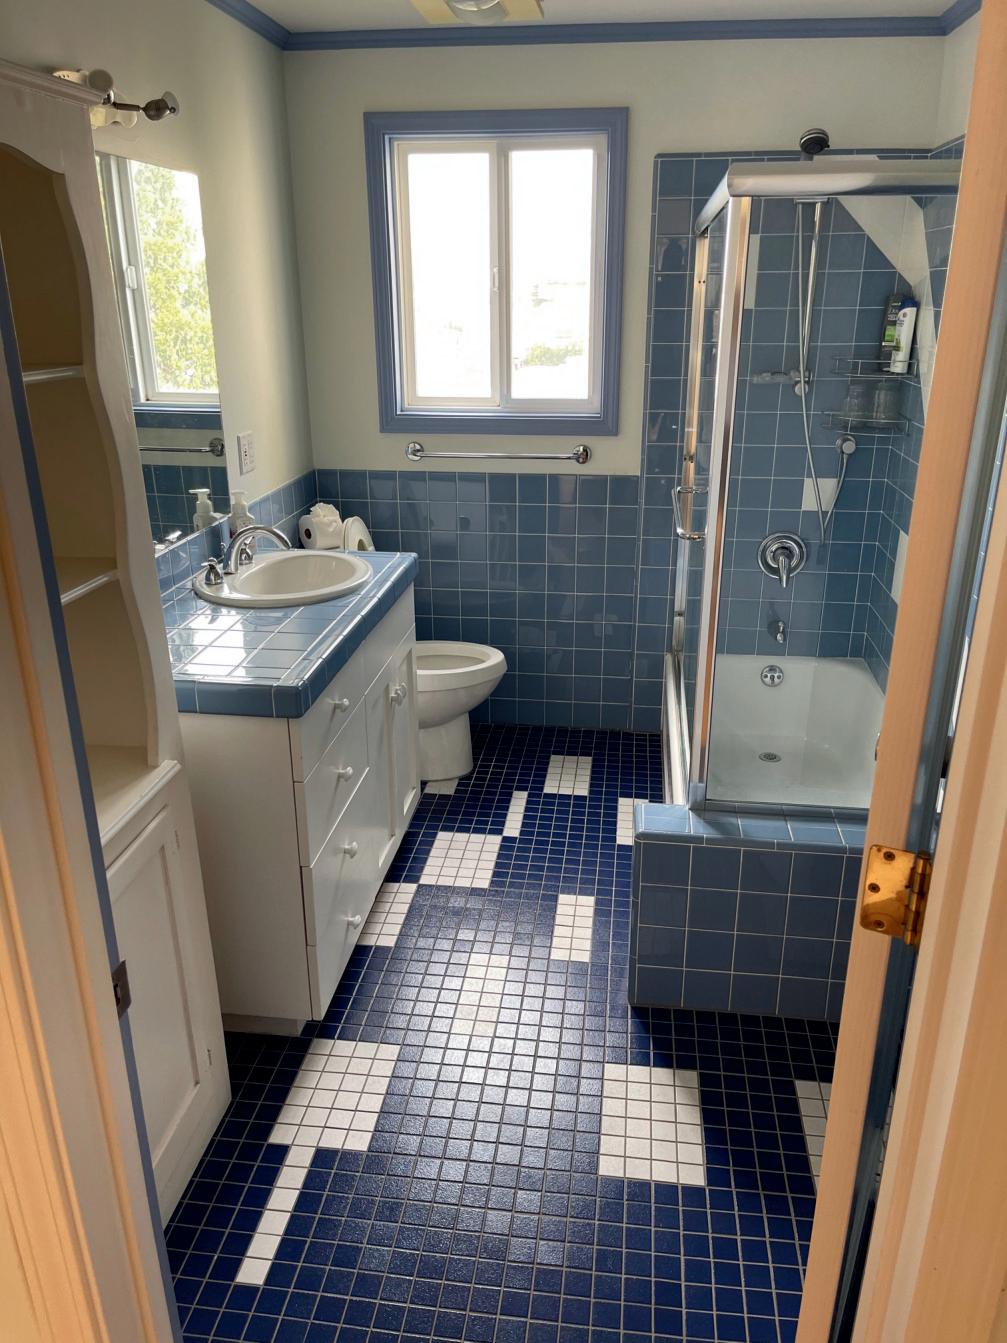
This Bernal Heights bathroom has been beautifully transformed with a fresh coat of paint, elegant new tile, striking lighting, and new hardware. Once marked by dated blue tile floors, worn cabinetry, and aging fixtures, it has now evolved into a bright and sophisticated space. With a modern vanity and thoughtfully curated design, this revamped space perfectly complements its contemporary vibe. This property sold quickly despite high interest rates and a slower market.
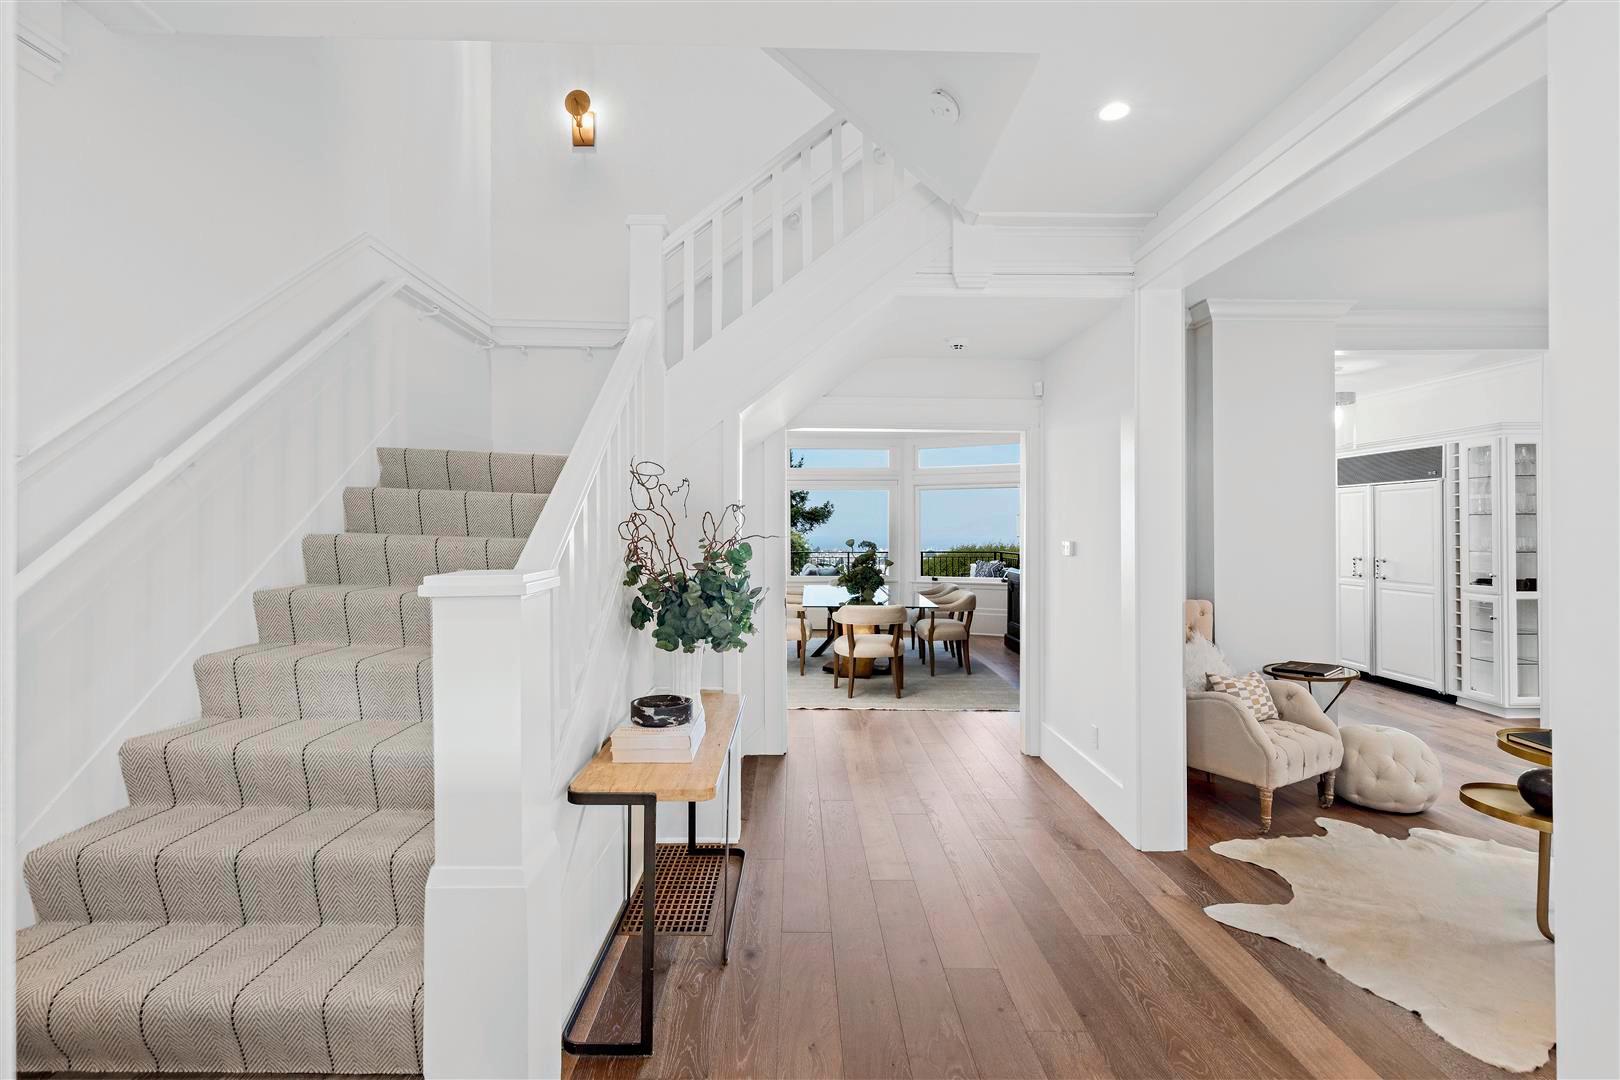
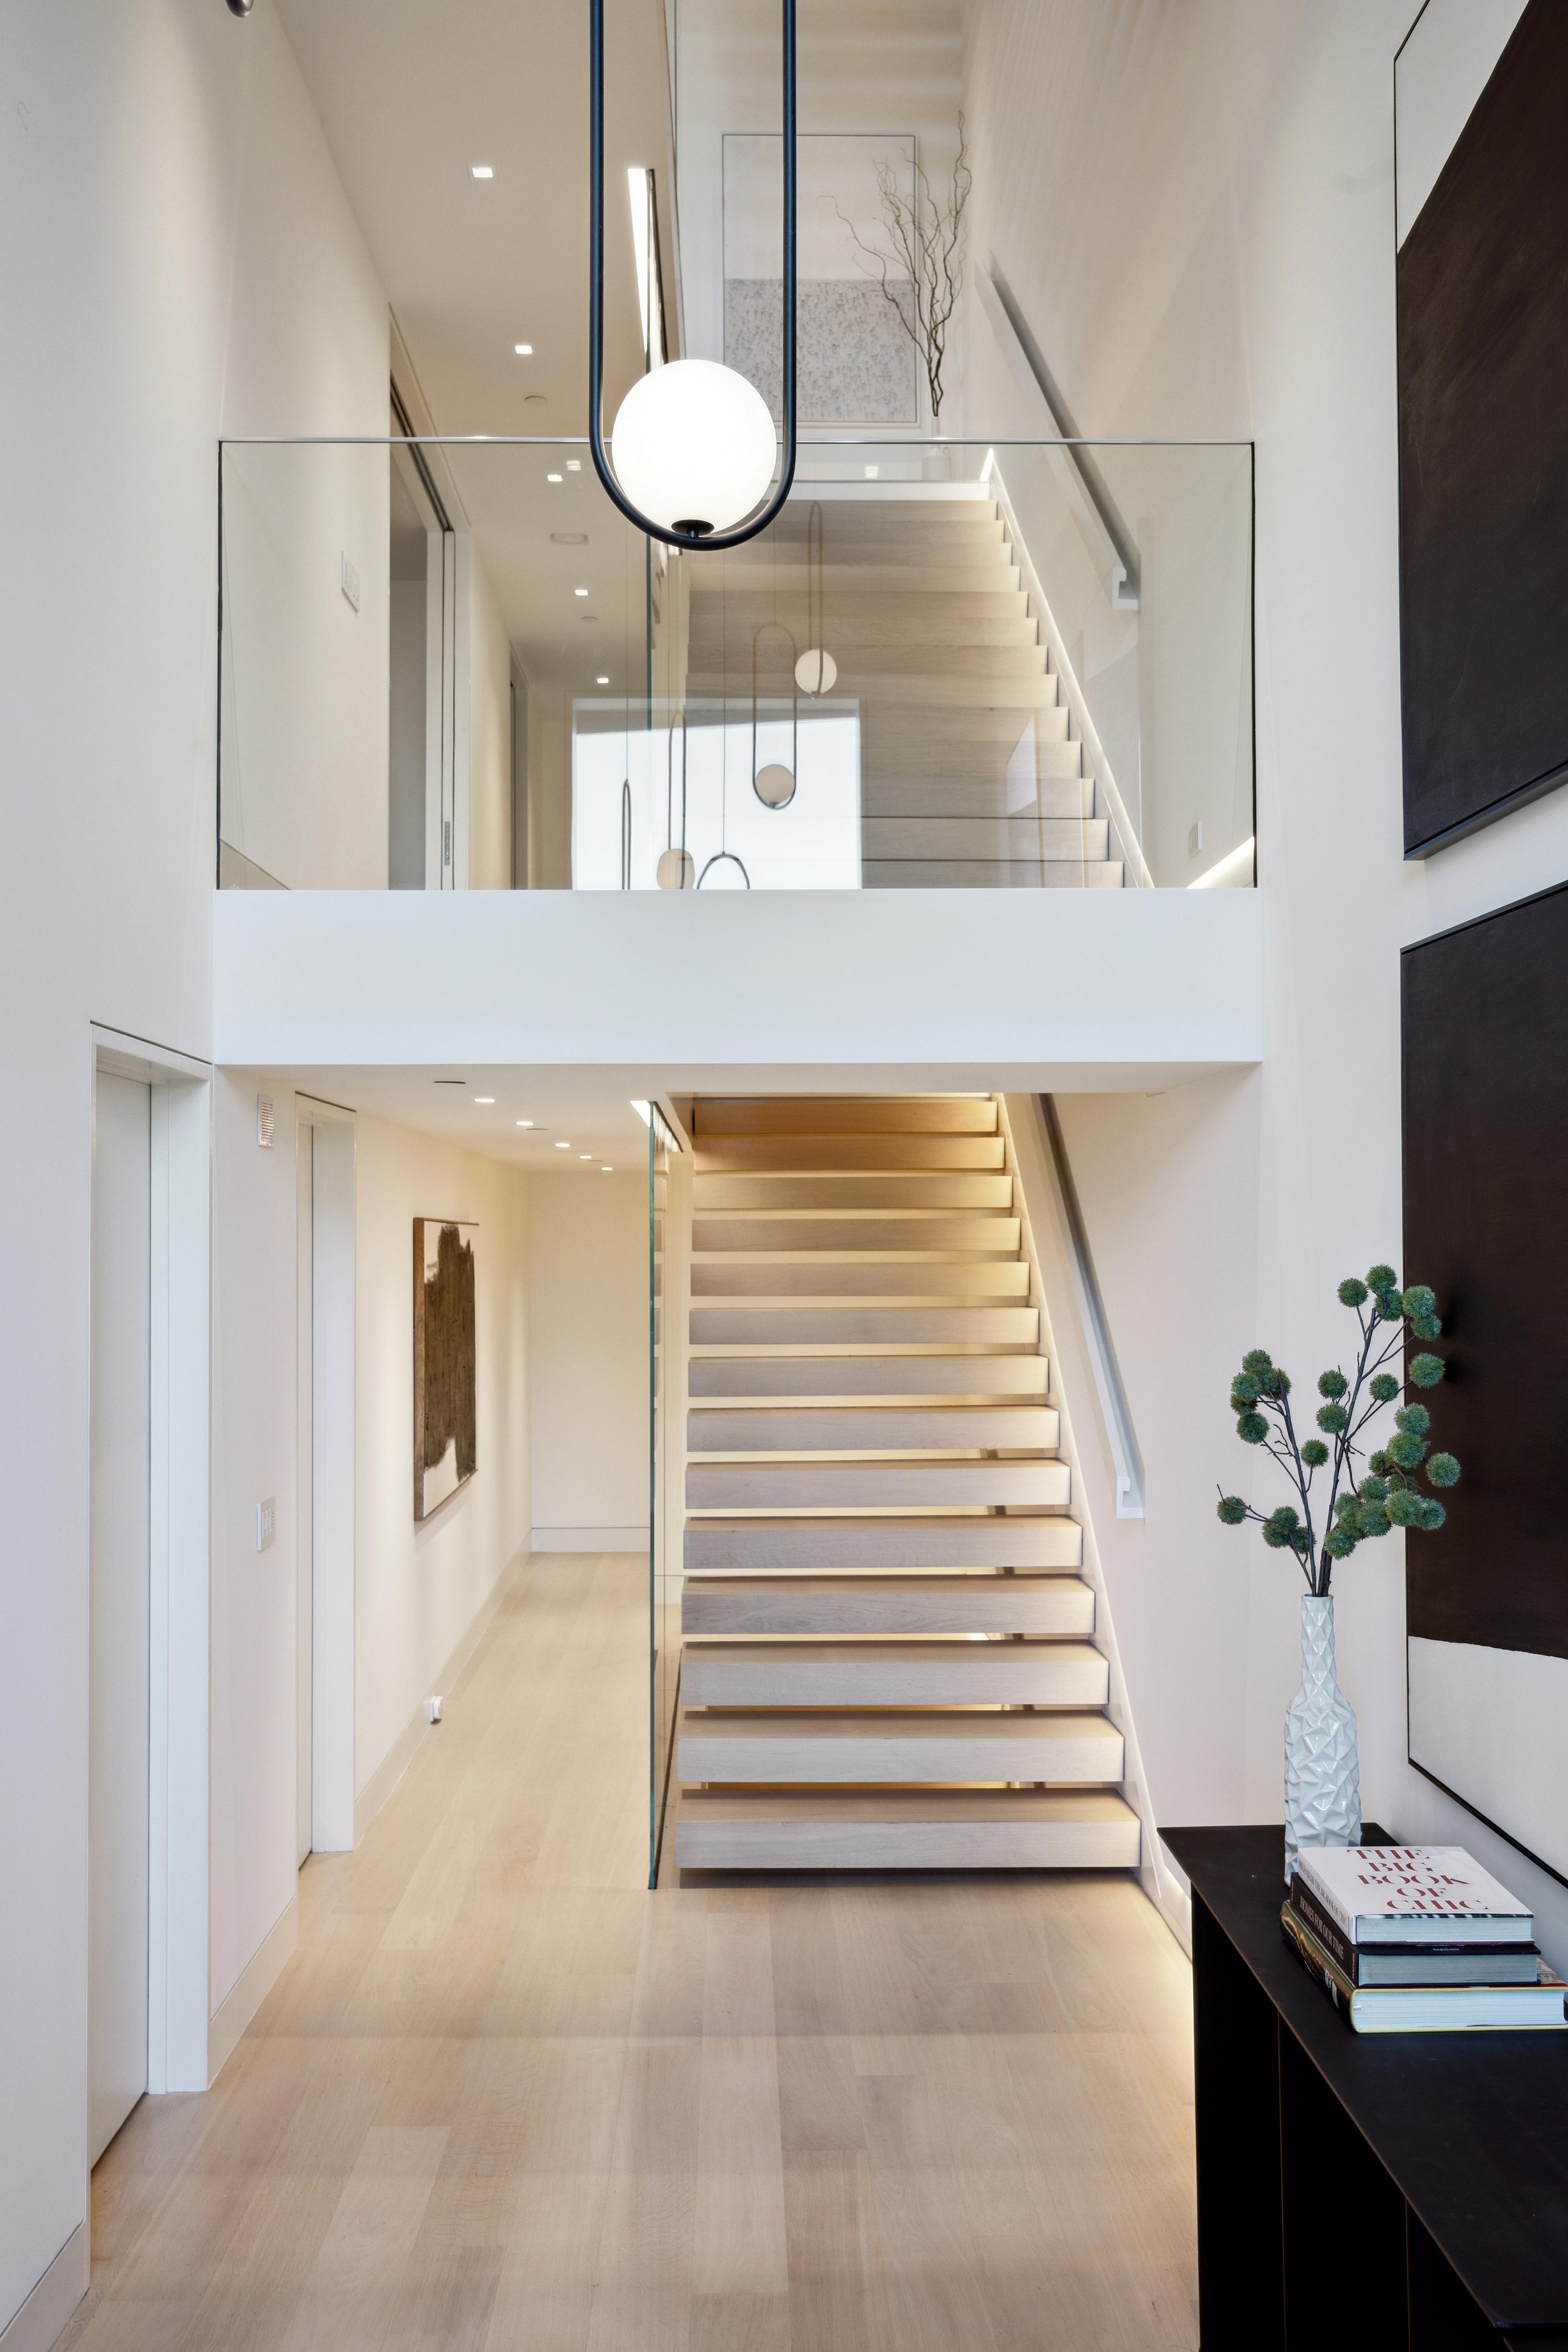
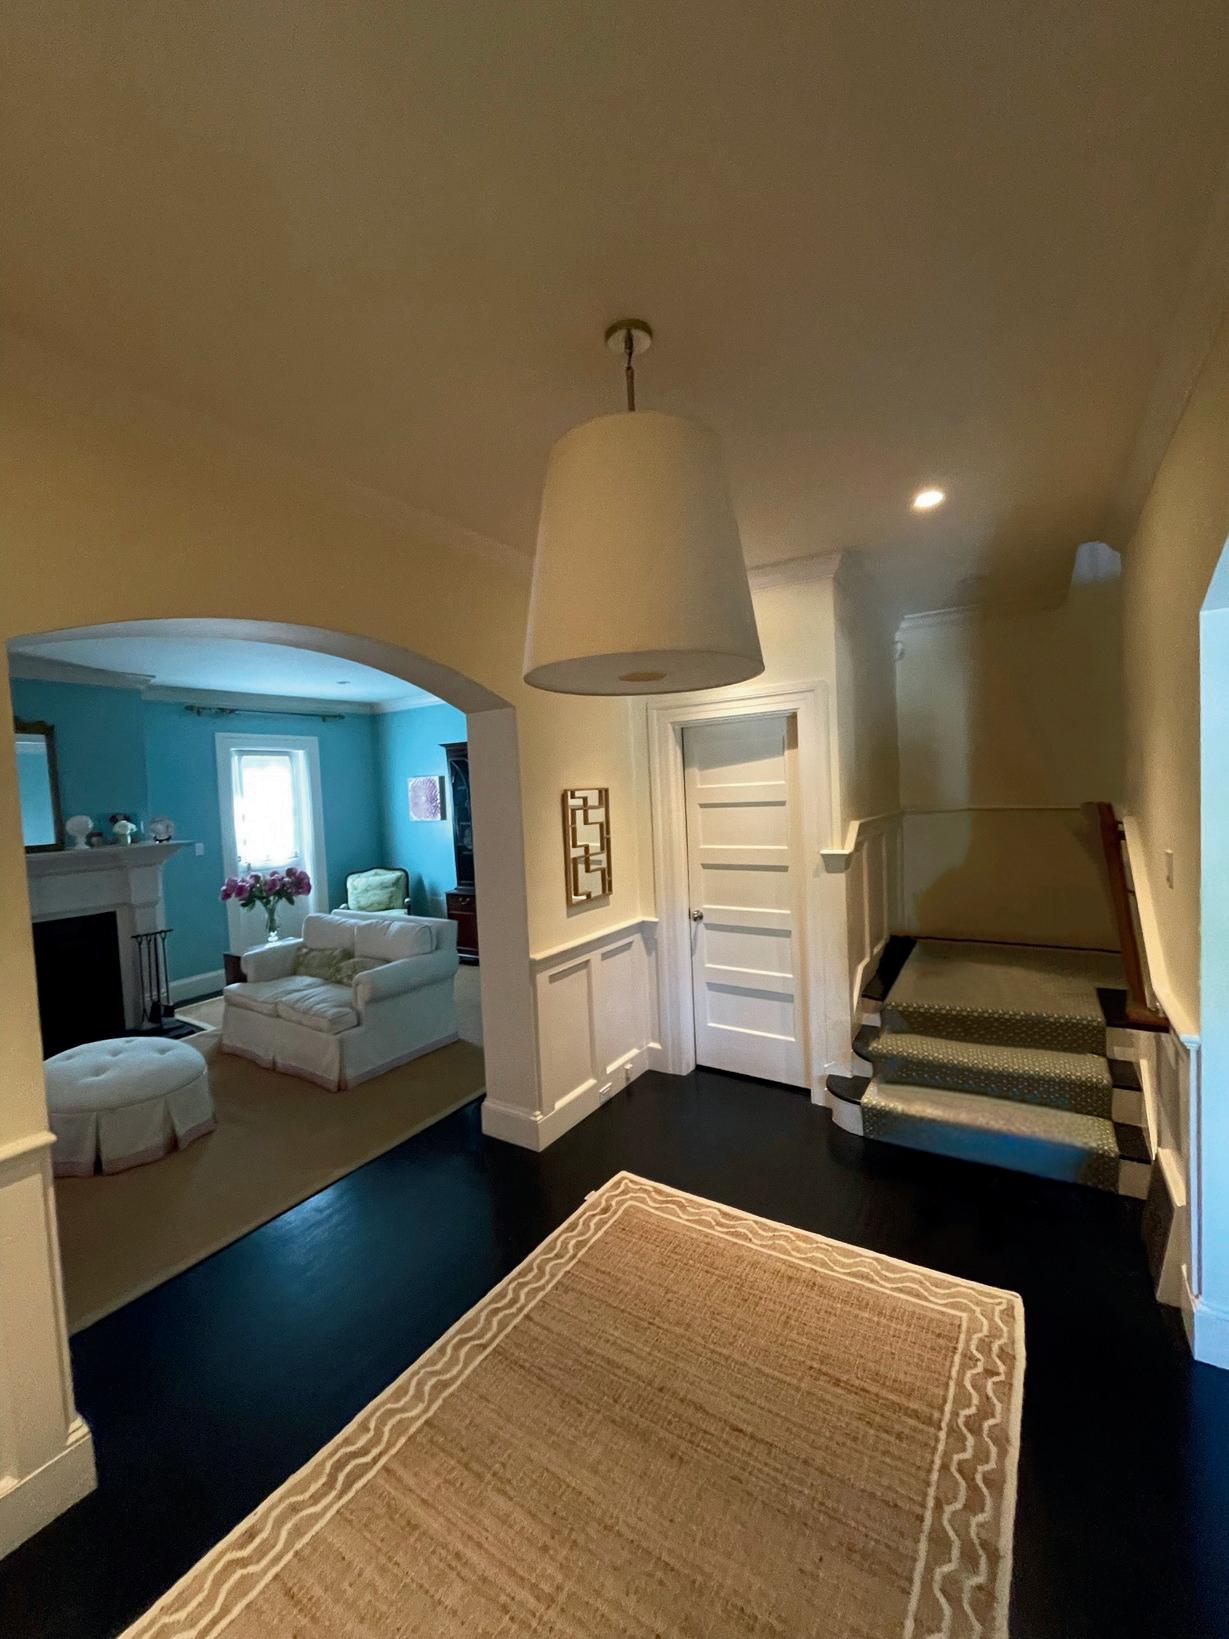
We reimagined this Cow Hollow home with sleek engineered oak flooring, luxurious herringbone wool carpeting on the staircase, and striking statement lighting that set an elevated tone. By removing a confining wall, we opened up the layout, creating a seamless flow that enhanced both space and light. Every detail was carefully curated to blend modern sophistication with timeless style. The result? A stunning transformation that captivated buyers, leading to multiple offers and a sale at over $1,400 per square foot.
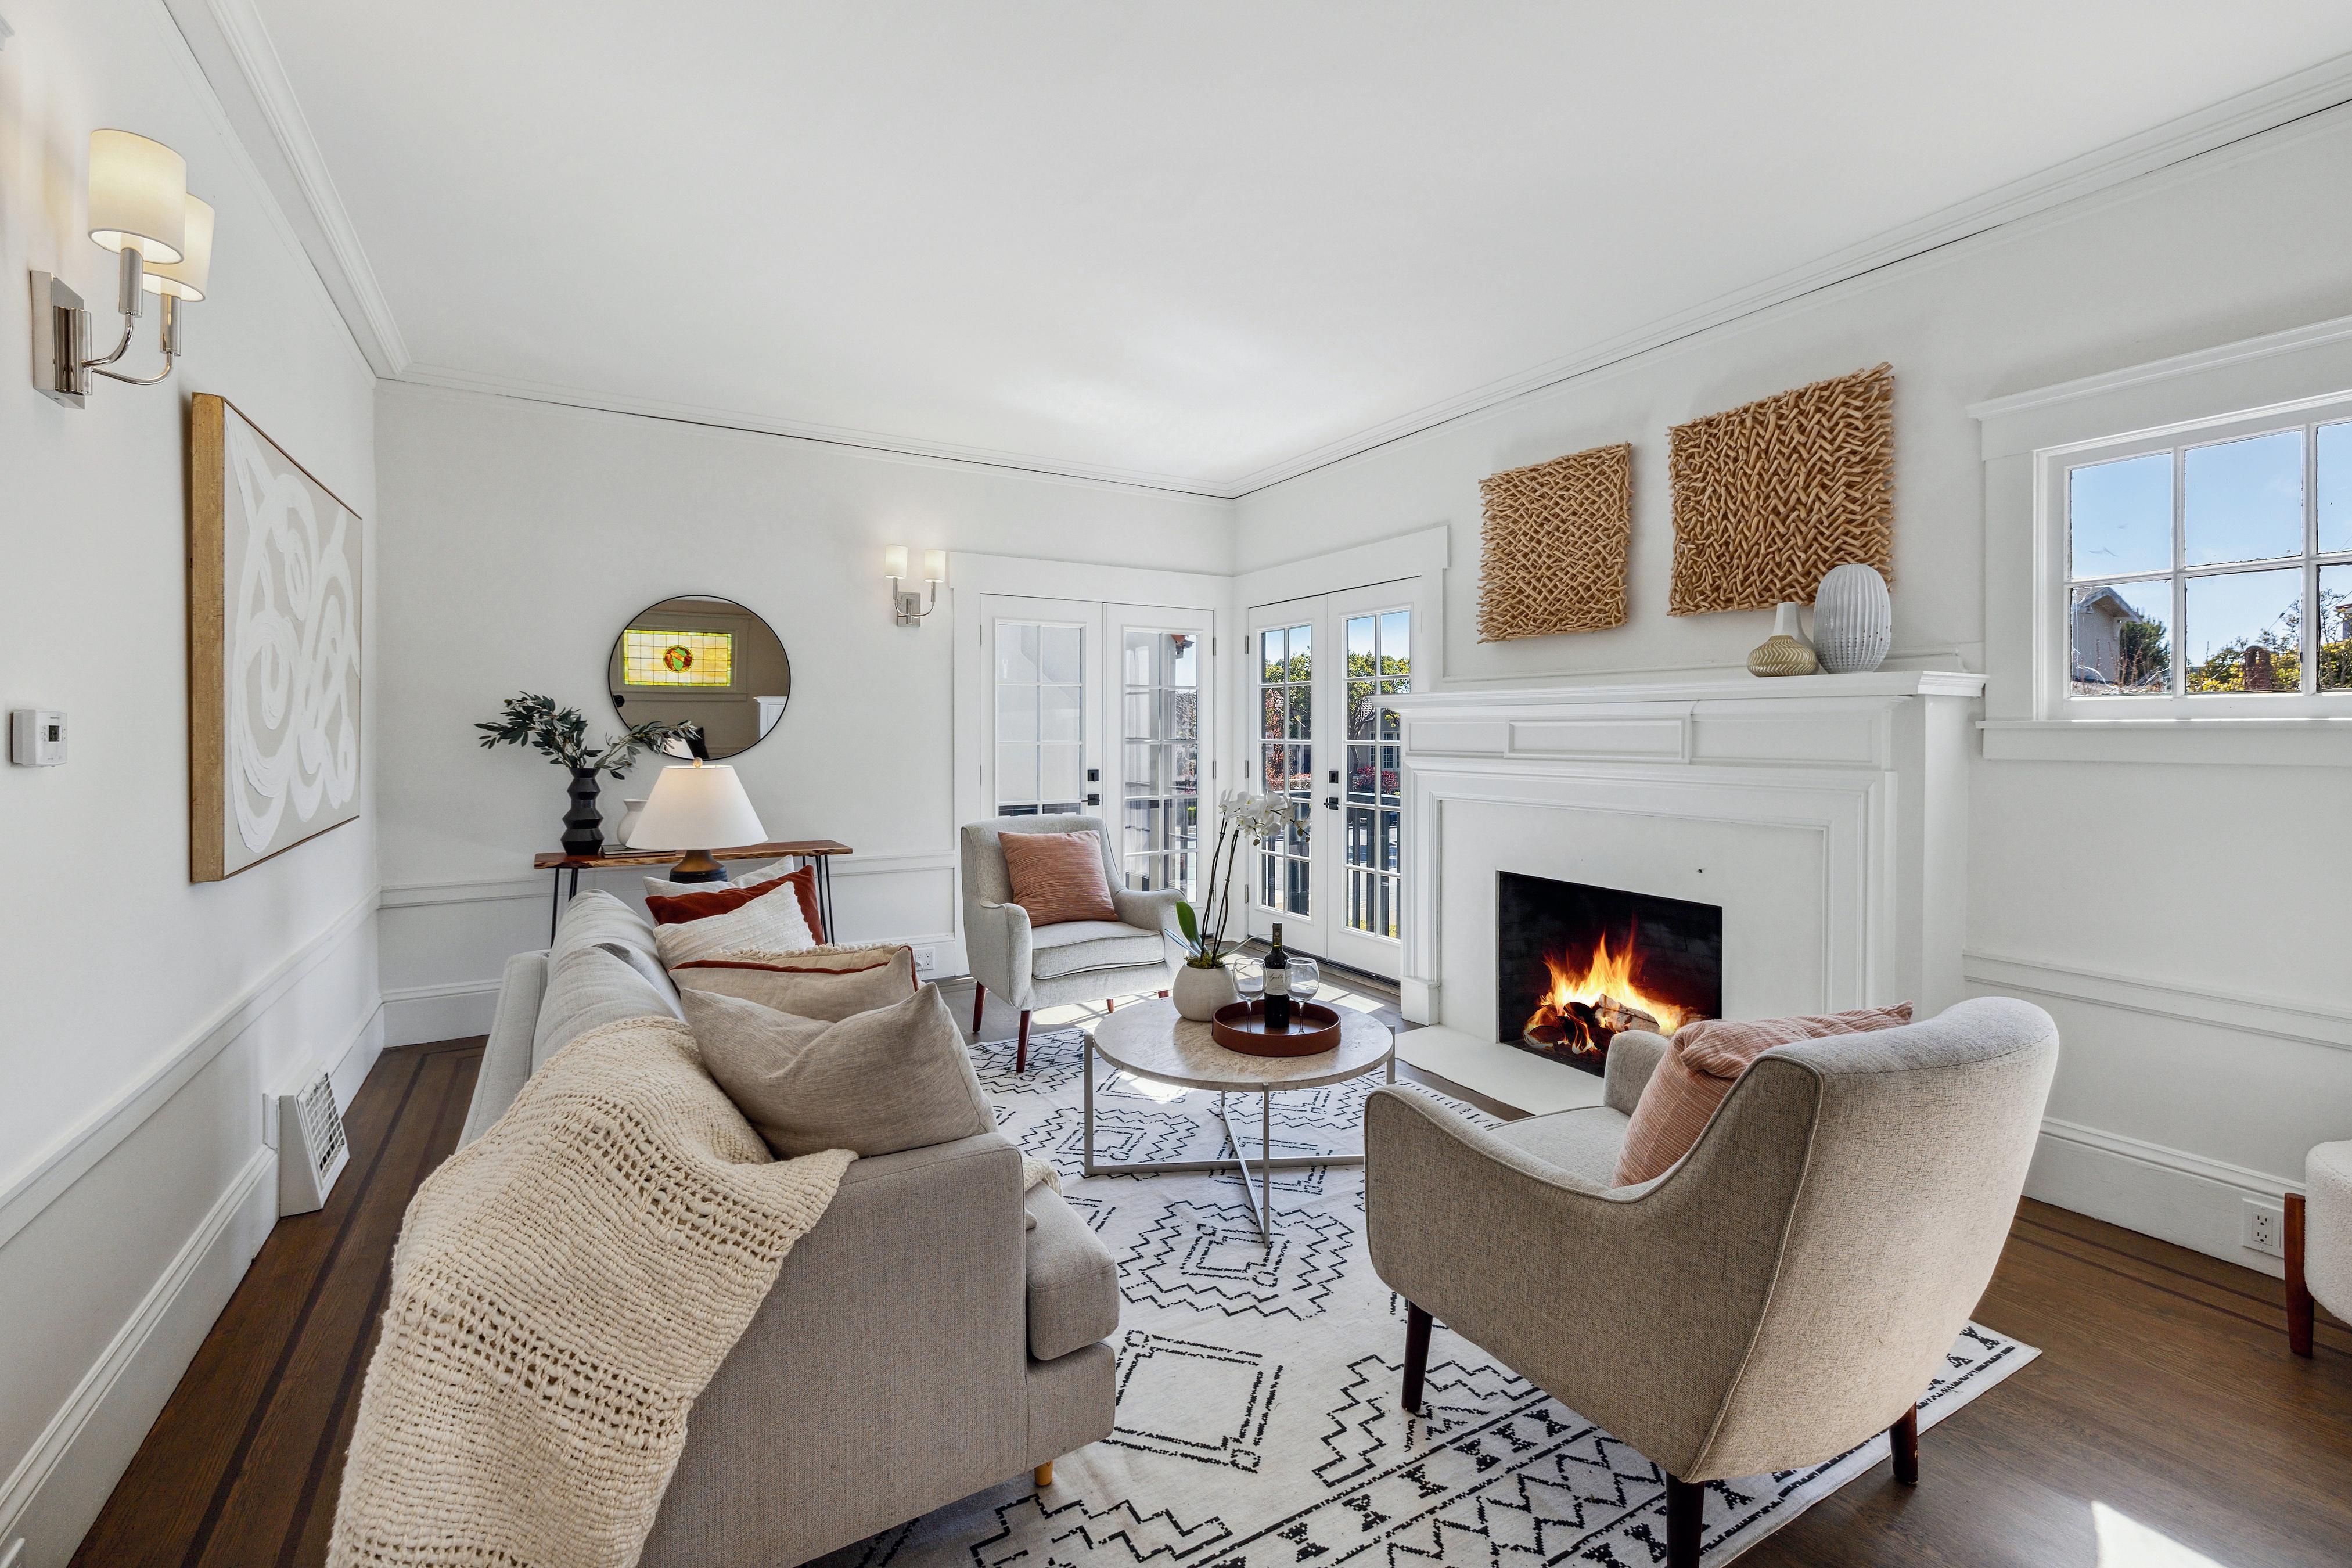
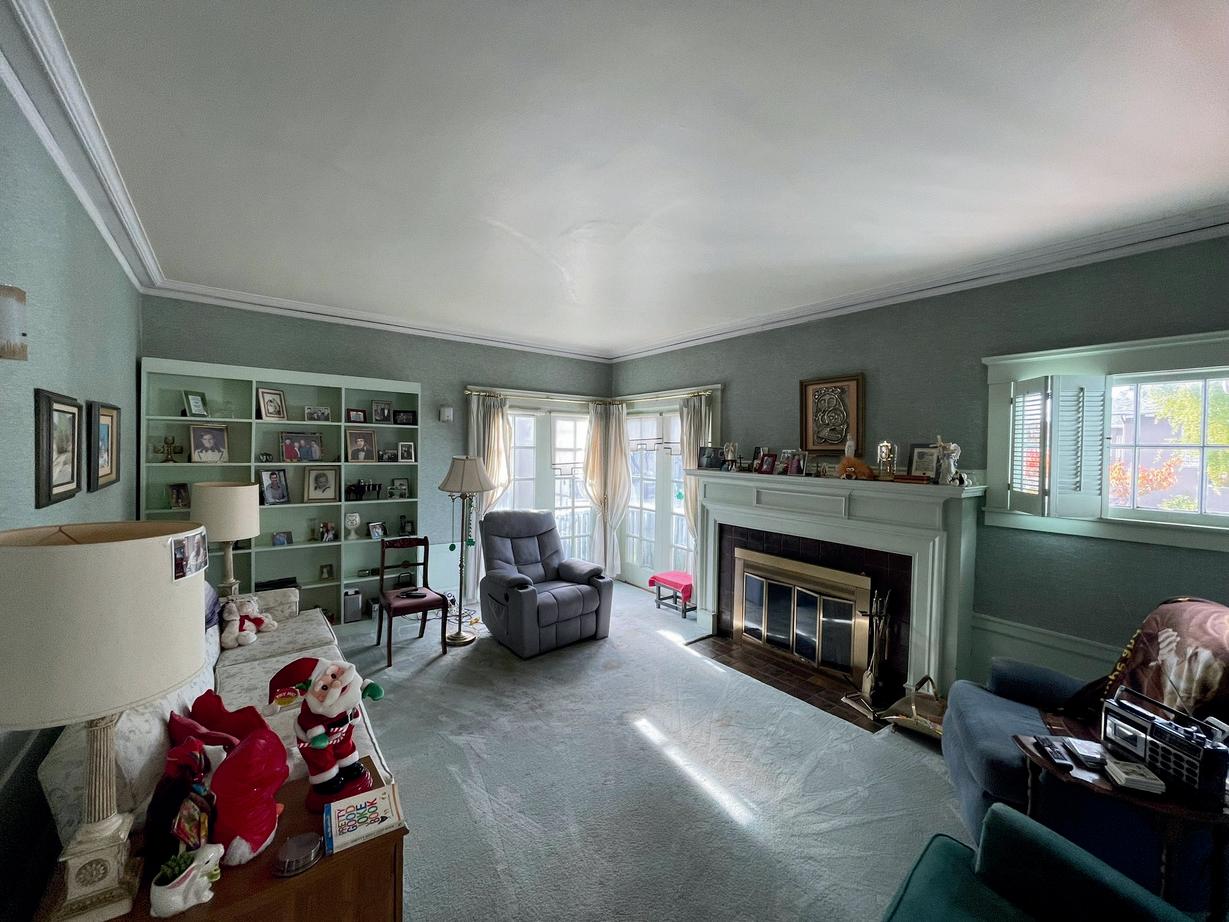
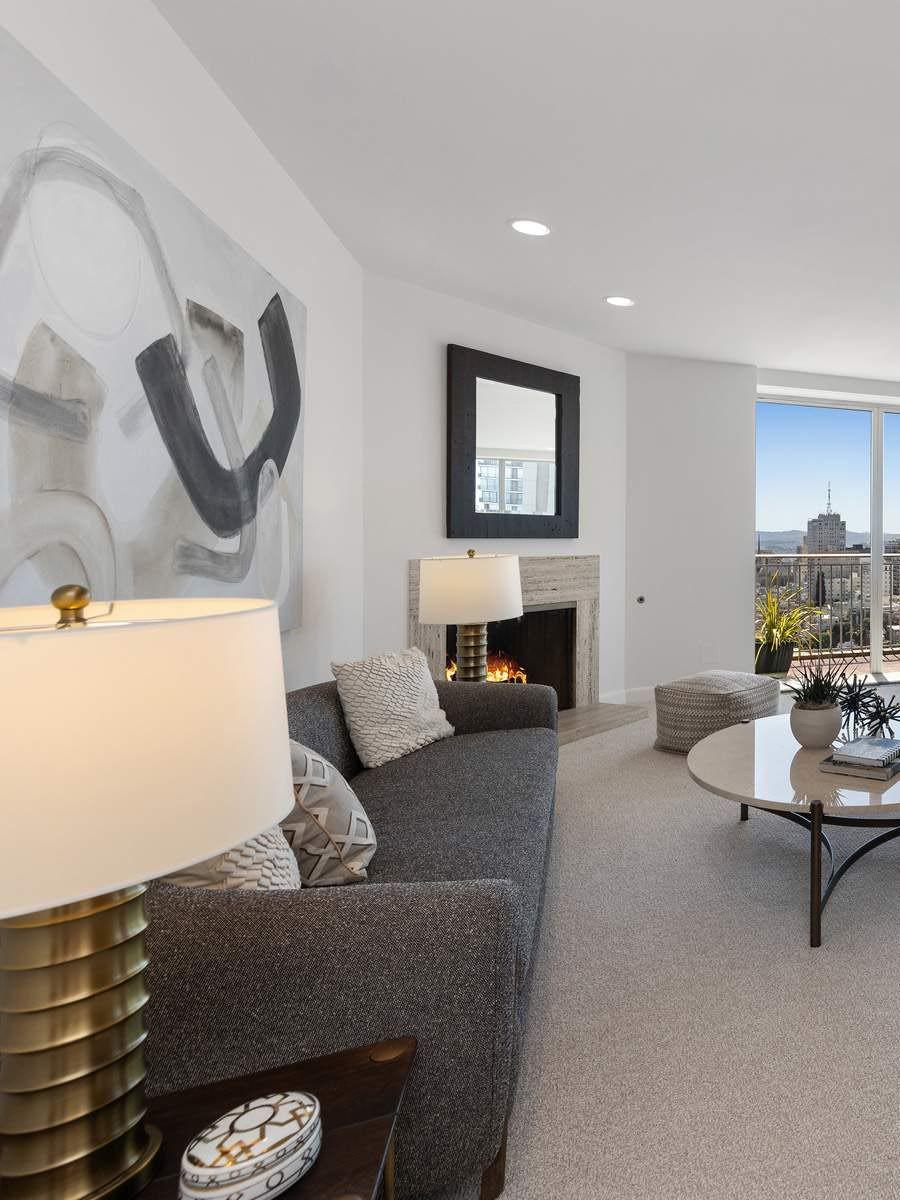
We transformed this Westwood Park home with refinished oak flooring, fresh paint, and stylish lighting throughout. The once carpeted green living room and brass fireplace were reimagined with stunning Venetian plaster, creating a modern yet timeless focal point. We added new French doors leading to a beautiful deck, enhancing natural light and indoor-outdoor flow. As a result, the home sold quickly and achieved the highest price per square foot on the street.
1750 TAYLOR #2305 I $2,350,000
PACIFIC HEIGHTS I SOLD JULY 2024
REPRESENTED BUYER
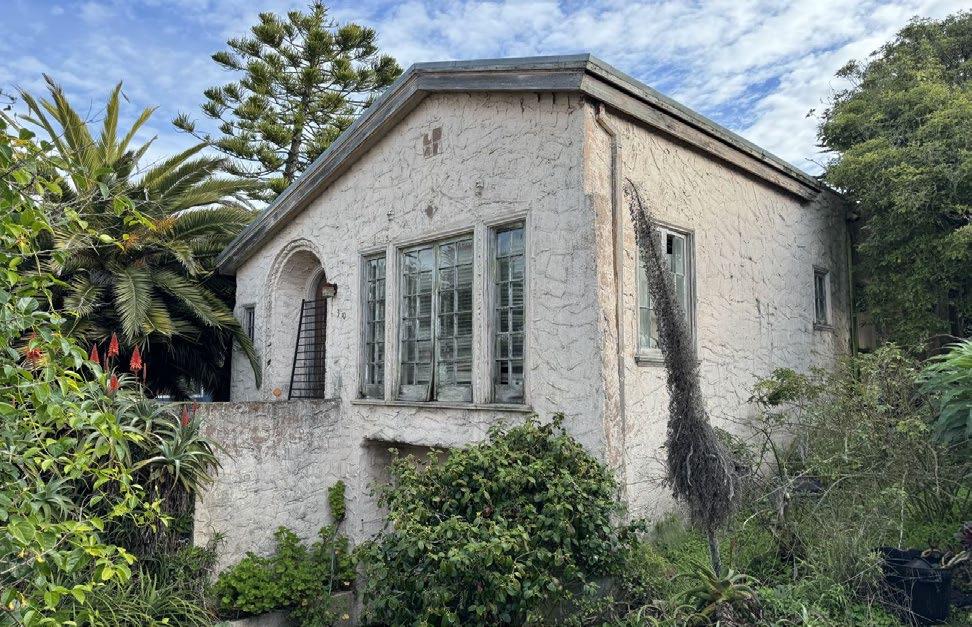

74 PROSPECT I $1,900,000
BERNAL HEIGHTS I SOLD OCTOBER 2024
LISTED BY WARRIN TEAM
Central Richmond, Inner Richmond, Outer Richmond, Jordan Park/Laurel Heights, Presidio, Lake Street, Sea Cliff, Lone Mountain


Golden Gate Heights, Outer Parkside, Outer Sunset, Parkside, Central Sunset, Inner Sunset, Inner Parkside

Lake Shore, Merced Heights, Pine Lake Park, Stonestown , Lakeside, Merced Manor, Ingleside, Ingleside Heights, Oceanview

Balboa Terrace, Diamond Heights, Forest Hill, Forest Knolls, Ingleside Terrace, Midtown Terrace, Saint Francis Wood, Miraloma Park, Forest Hill Extension, Sherwood Forest, Mount Davidson Manor, Westwood Highlands, Westwood Park, Sunnyside, West Portal, Monterey Heights

Glen Park, Haight Ashbury, Noe Valley, Twin Peaks, Cole Valley/Parnassus Heights, Buena Vista/Ashbury Heights, Castro, Corona Heights, Clarendon Heights, Duboce Triangle, Eureka Valley/Dolores Heights, Mission Dolores
Anza Vista, Hayes Valley, Lower Pacific Heights, Western Addition, Alamo Square, North Panhandle

Marina, Pacific Heights, Presidio Heights, Cow Hollow
Downtown, Financial District/Barbary Coast, Nob Hill, North Beach, Russian Hill, Van Ness/Civic Center, Telegraph Hill, North Waterfront, Tenderloin
Bernal Heights, Inner Mission, Mission Bay, Potrero Hill, South of Market, Yerba Buena, South Beach, Central Waterfront/Dogpatch
2205 SACRAMENTO #301 I $1,420,000
PACIFIC HEIGHTS I SOLD APRIL 2024
LISTED BY WARRIN TEAM
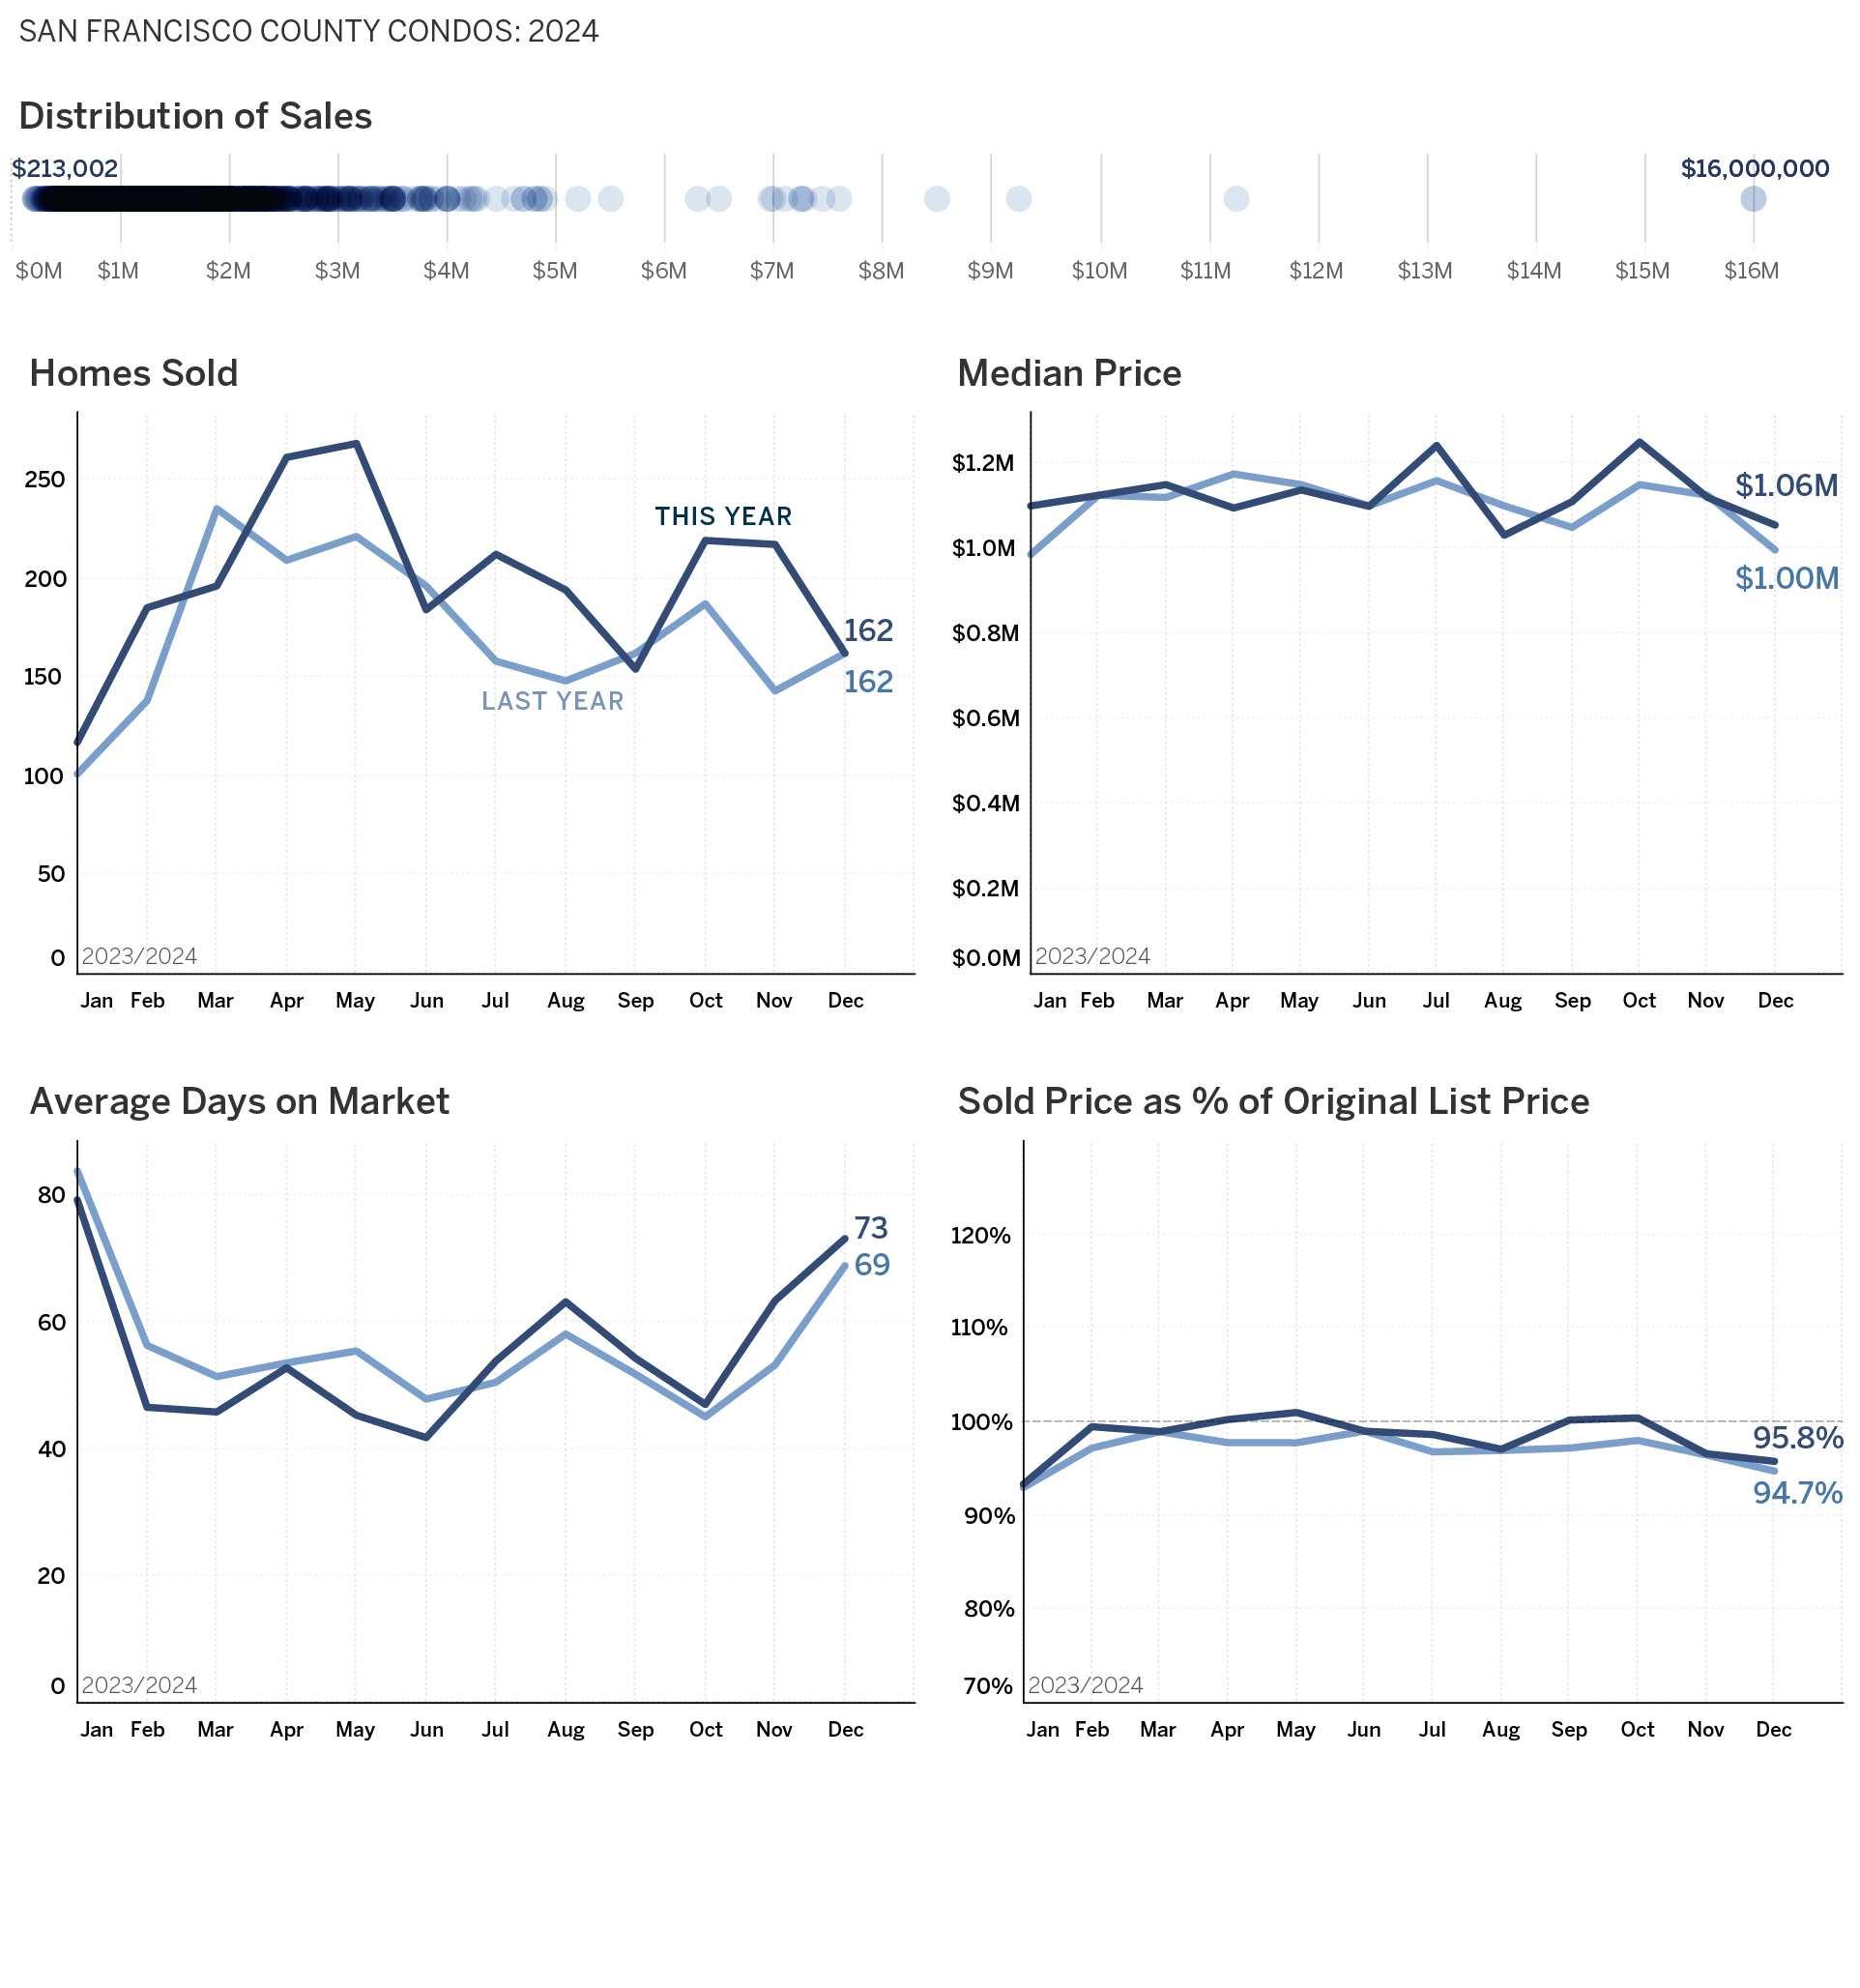
Residential real estate activity in San Francisco County (Districts 1-10), composed of single-family properties, townhomes and condominiums.


Residential real estate activity in San Francisco County (Districts 1-10), composed of single-family properties, townhomes and condominiums.
The 2024 housing market started on a positive note: inventory was on the rise, mortgage rates had fallen from a 23-year high of 7.79% in October 2023 to the mid 6% range, and homebuyers had returned to the market, with U.S. existing-home sales posting back-to-back monthly increases for the first time in more than two years in January and February. But rates soon began to climb, topping 7% in April, and buyers pulled back, causing sales to slump during the traditionally busy spring buying season.
Summer arrived, and with it came a surge of new listings, pushing inventory to its highest level since 2020, according to the National Association of REALTORS®. Although buyers had more options to choose from in their home search, the additional supply did little to temper home prices, which continued to hit record highs nationwide, and sales remained slow. Eventually, mortgage rates began to ease, falling to a yearly low of 6.08% in September, and with inflation moving toward its 2% target, the Federal Reserve initiated a series of interest rate cuts, dropping the benchmark rate one full percentage point. Buyers took advantage of lower borrowing costs and a greater supply of homes on the market, leading sales of existing homes to surge in October and November, marking the first time since May that home sales exceeded four million units.
Sales: Pending sales increased 13.8 percent, finishing 2024 at 4,645. Sold listings were up 11.4 percent to end the year at 4,570.
Listings: Comparing 2024 to the prior year, the number of homes available for sale was down by 22.7 percent. There were 551 active listings at the end of 2024. New listings increased by 5.8 percent to finish the year at 6,590.
Prices: Home prices were up compared to last year. The overall median sales price increased 4.9 percent to $1,375,000 for the year. Single Family home prices were up 4.8 percent compared to last year, and Condo/TIC/Coop home prices were up 2.3 percent.

List Price Received: Sellers received, on average, 105.8 percent of their list price at sale, a year-over-year increase of 2.7 percent. Single-Family homes received 111.3 percent of their list price, and Condo/TIC/Coop homes received 100.7 percent.
Economists are projecting a more active housing market in 2025. Existing-home sales are predicted to increase, as are home prices, albeit at a moderate pace. Mortgage rates will vary throughout the year but will likely stay within the 6% - 7% range. Buyers and sellers remain sensitive to fluctuations in mortgage rates, and the trajectory of rates will have a major impact on market activity. Inventory of new and existing homes will continue to improve in the new year, building on the supply gains made in 2024, with increases in both single-family and multifamily construction expected, according to the National Association of Home Builders.
Top 5 Areas: Change in Pending Sales from 2023
Bottom 5 Areas: Change in Pending Sales
2024 Annual Report on the San Francisco County Housing Market
PACIFIC HEIGHTS I SOLD OCTOBER 2024
LISTED BY WARRIN TEAM


London, England
SOLD FOR £15.5M
Sotheby’s International Realty Represented by Christopher Steen, Anders Elbe

Dubai, United Arab Emirates
SOLD FOR AED240.5M
Sotheby’s International Realty Represented by Erick Knaider

Tokyo, Japan
SOLD FOR JPY6.685B
Sotheby’s International Realty Represented by Kantaro Aoki, Jinyu Cui

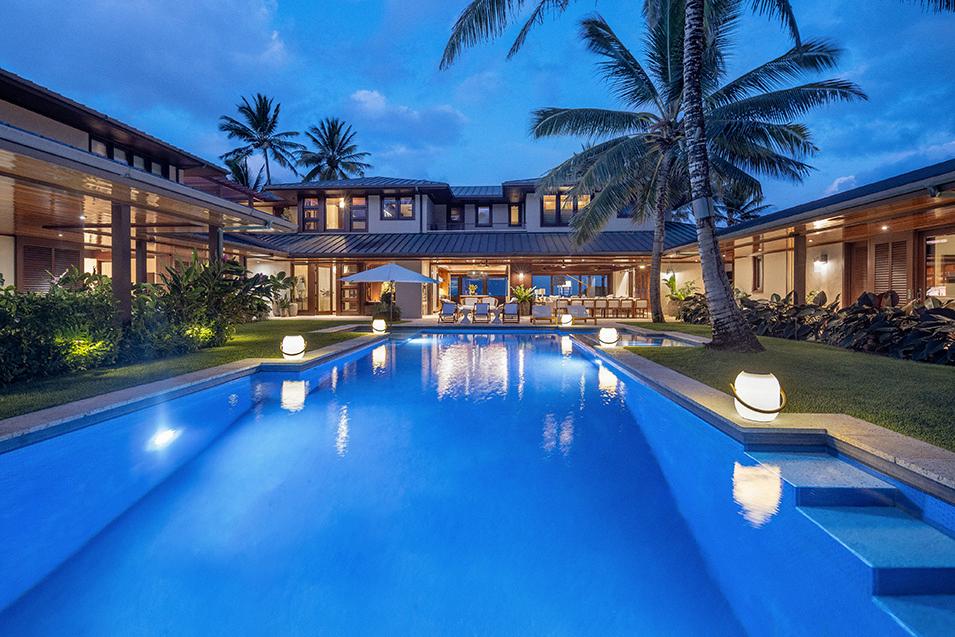
Kailua, Hawaii
SOLD FOR $26,000,000
Sotheby’s International Realty Represented by Scott Carvill
SOLD FOR $24,000,000
Sotheby’s International Realty Represented by Mark Hussey
SOLD FOR £15.5M
Sotheby’s International Realty Represented by Guy Bradshaw

SOLD FOR $24,925,000
Sotheby’s International Realty Represented by Deborah Pirro, Diane Anderson
SOLD FOR $26,125,000
Sotheby’s International Realty Represented by Richard Ellis
Las Vegas, Nevada
SOLD FOR $15,000,000
Sotheby’s International Realty Represented by Michael Pallier

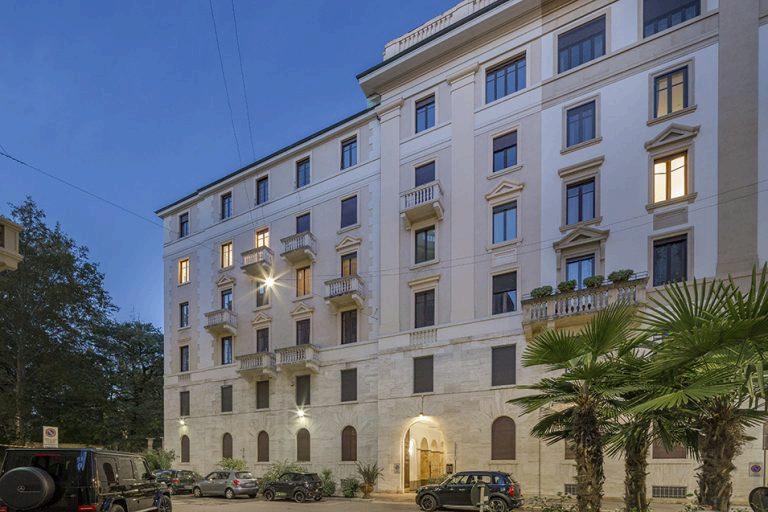
Milan, Italy
SOLD FOR £12M
Sotheby’s International Realty Represented by Barbara Legnani
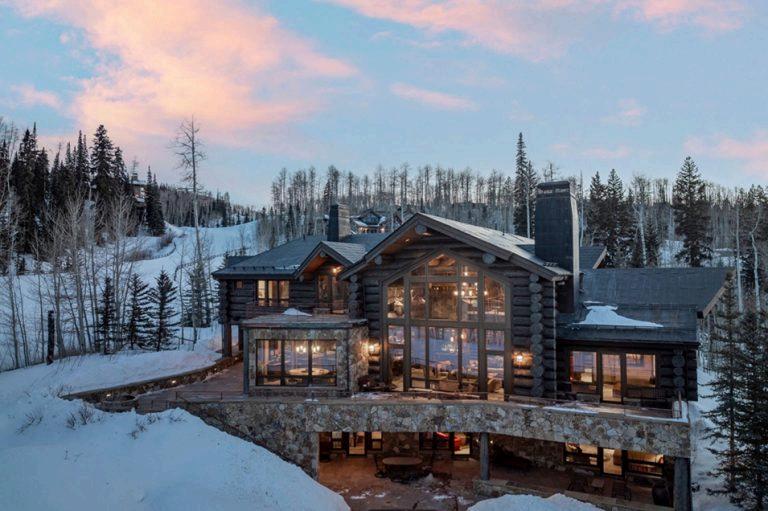
Mountain Village, Colorado
SOLD FOR $15,000,000
Sotheby’s International Realty Represented by Angie Johnson, Dan Dockray
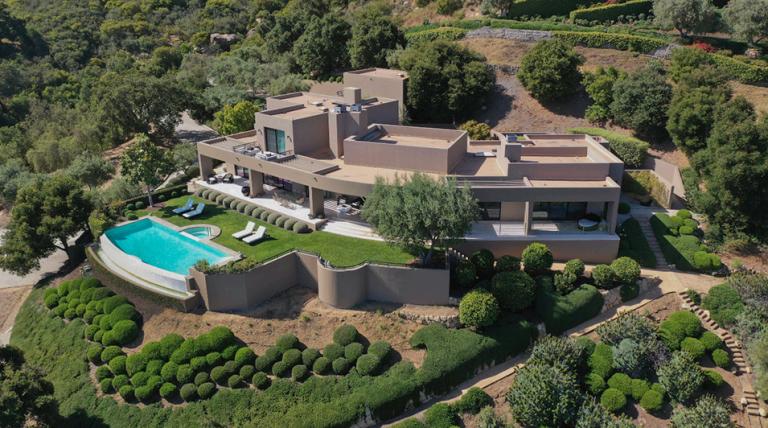
Montecito, California
SOLD FOR $11,005,000
Sotheby’s International Realty Represented by Richard Ellis
SOLD FOR $50,000,000
Sotheby’s International Realty Represented by Todd Peter
SOLD FOR $13,465,000
Sotheby’s International Realty Represented by
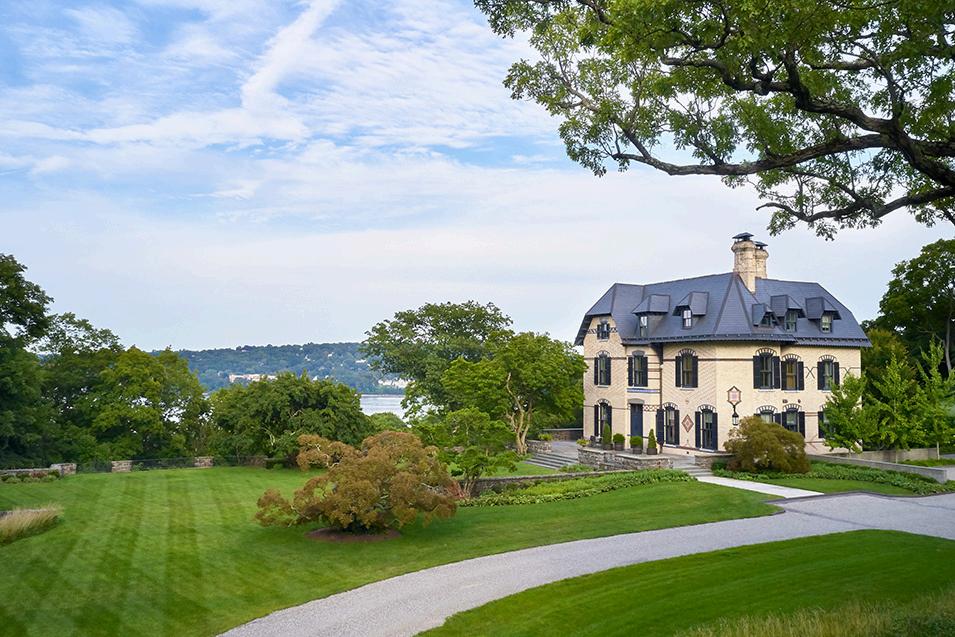
Bedford, New York
SOLD FOR $30,675,000
Sotheby’s International Realty Represented by Barbara

SOLD FOR $10,000,000
Sotheby’s International Realty Represented by

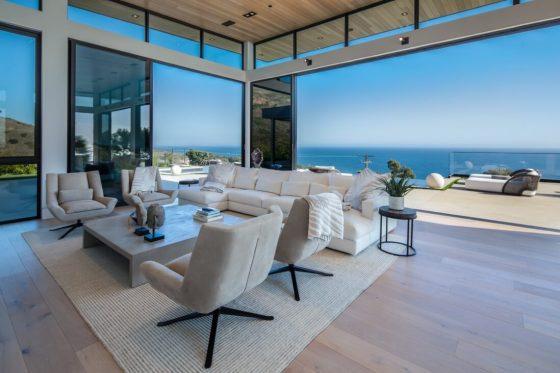
Malibu, California
SOLD FOR $15,500,000
Sotheby’s International Realty Represented by Gayle Pritchett-Macleod, Lacey Rose Gorden
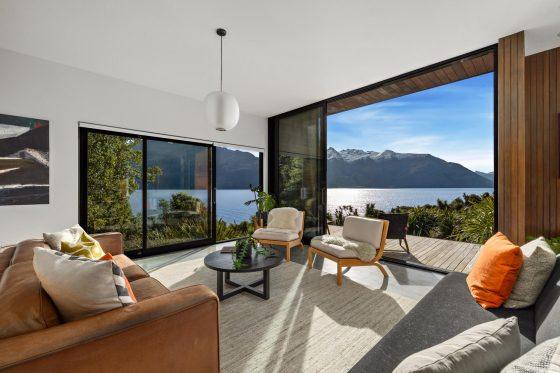
Queenstown, New Zealand
PRICE UNDISCLOSED
Sotheby’s International Realty Represented by Matt Finnigan, Russell Reddell
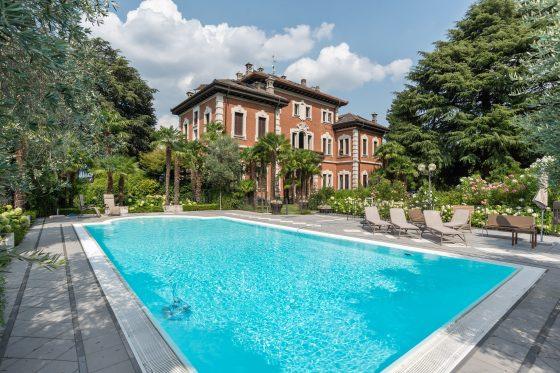
Como, Italy
SOLD FOR €4.2 Million
Sotheby’s International Realty Represented by Diego Antinolo
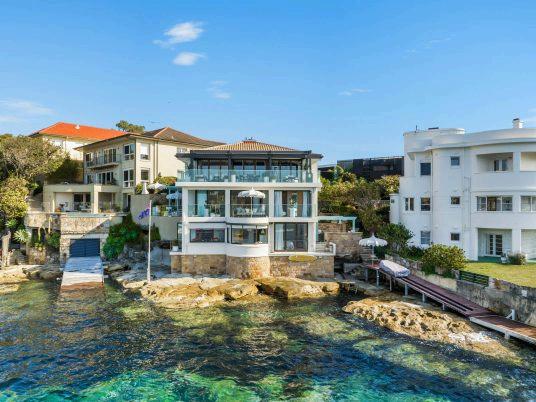
Vaucluse, Australia
SOLD FOR $30,388,000
Sotheby’s International Realty Represented by Michael Pallier
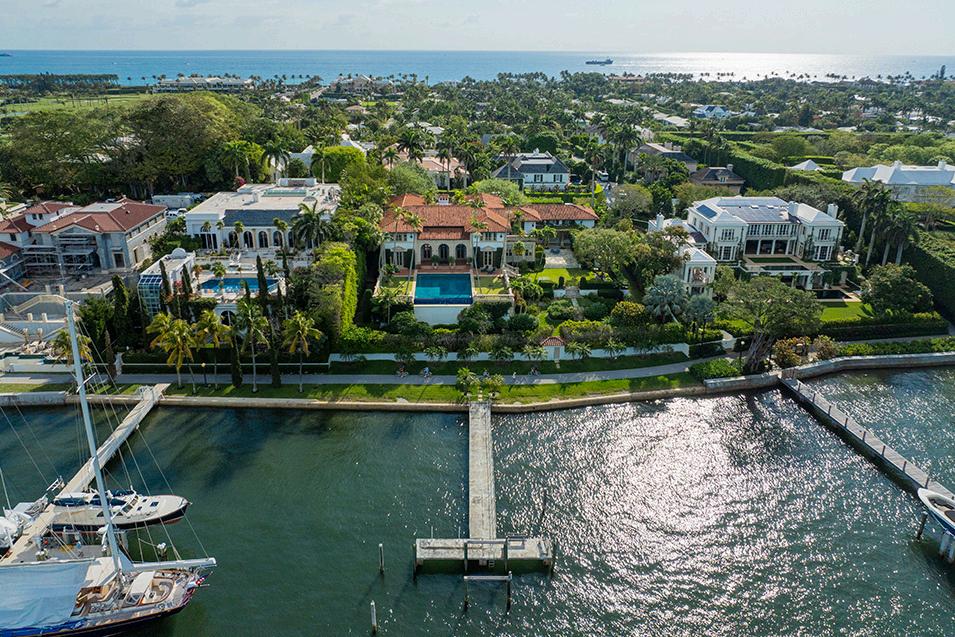
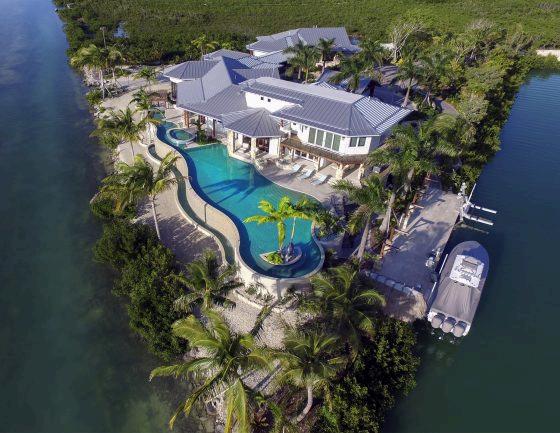
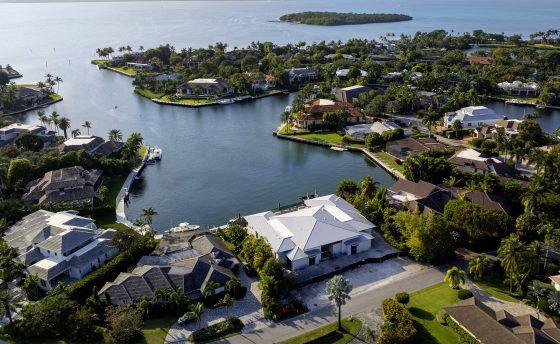
Key Largo, Florida
SOLD FOR $22,855,000
Sotheby’s International Realty Represented by Mary Lee
Newport Beach, California
SOLD FOR $14,800,000
Sotheby’s International Realty Represented by Cain Group
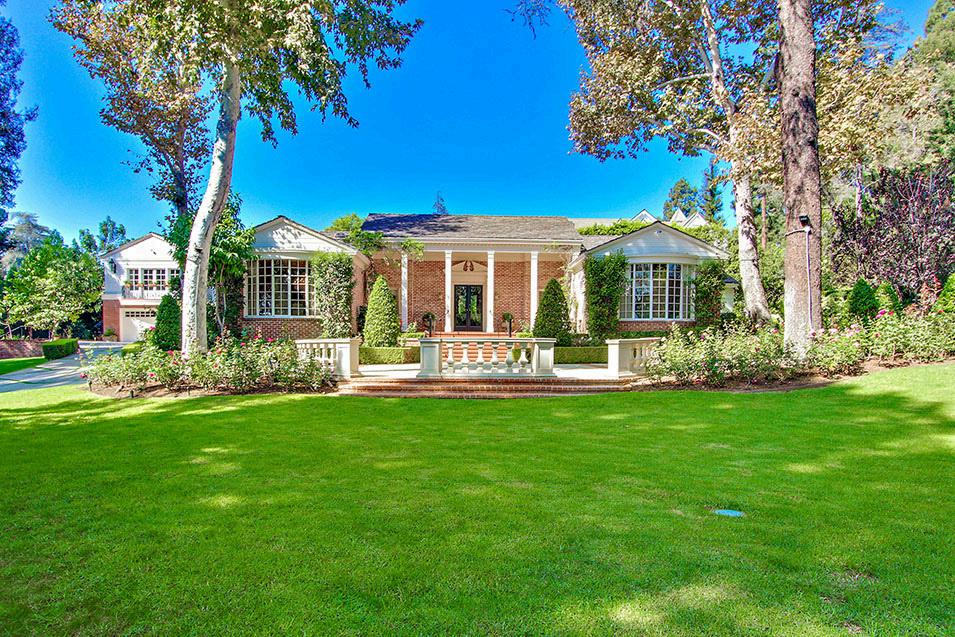
Beverly Hills, California
SOLD FOR $18,995,000
Sotheby’s International Realty Represented by Lori Berris
Lesa, Italy
SOLD FOR €4 Million
Sotheby’s International Realty Represented by Isabella Masserini