Providing Missing Middle Housing through Commercial Conversion

FPC 2022 SEPTEMBER 7, 2022
Today’s presentation
The economics of conversions
construction, management


and regulation
sources
Financing,
Planning
Potential funding
Questions/discussion
Owen Beitsch
Senior Director of Real Estate Advisory Services
GAI's Community Solutions Group
The Economics of Conversions
Quick takeaways
• Obvious that lower income households spend vastly disproportionate percentages of their income on housing
• Less obvious that they spend significant sums for transportation, leaving nominal dollars for other essentials
• At some level of income, the dollarsbecome more material than the percentages
• Limited dollars suggest some rethinking about the types of housing that are feasible, appropriate, and available
• Impossible to discuss the use of financial resources of households without also discussing developmentcosts. The solutions rarely match shelter needs andincome
• Philosophically, it may be necessary to think about alternative housing forms

consumer units
Consumer expenditures relative to income, 2020
Income
Source: Bureau
than $15,000 $15,000 to $29,999
$30,000 to $39,999
$40,000 to $49,999
$50,000 to $69,999
$70,000 to $99,999
$100,000 to $149,999
$150,000 to $199,999
$200,000 and more
Income before taxes $84,352 $7,489 $22,130 $34,766 $44,719 $59,191 $83,593 $120,944 $171,127 $318,252
Income after taxes 74,949 9,045 24,496 36,692 45,478 58,115 78,164 108,838 146,907 241,675
Wages and salaries
Mean
Share
Average number in consumer unit:
People................................
Children under 18
65,449 2,520 7,495 19,168 28,598 42,929 67,890 102,822 147,778 256,803
33.7 33.9 55.1 63.9 72.5 81.2 85.0 86.4 80.7
1.7 1.8 2.1 2.3 2.5 2.7 3.0 3.2 3.2
0.3 0.3 0.4 0.5 0.6 0.7 0.8 0.8 0.8
Adults 65 and 0.4 0.4 0.6 0.6 0.5 0.5 0.3 0.2 0.3 0.2
Earners
Housing tenure:
Homeowner
Renter
Average annual expenditures
Mean
Housing
Mean
Apparel and services
Mean
Transportation
Mean
Healthcare
Mean
Labor
Personal
0.4 0.5 0.9 1.1 1.3 1.7 1.9 2.1 2.2
1.9 1.0 1.2 1.6 1.7 1.9 2.2 2.5 2.7 2.7
42 56 57 58 62 70 80 86 90
58 44 43 42 38 30
$51,285 $63,592 $83,050 $100,484 $145,402
$1,412 $1,543 $1,827 $2,188 $2,734 $3,883
2,037 2,276 3,405
$1,241 $1,200 $1,616
6,508 7,662 8,997
$7,327 $11,885 $16,539 $27,429
Pensions
Social
$6,847 $11,202 $15,743 $25,906
of
Statistics Item All
Less
..............................................
............................................. 77.6
2.5
0.6
1.3
Vehicles ...........................................
66
34
20 14 10
Incomes....................... $61,334 $28,235 $31,604 $40,689 $44,081
Monthly.................................. $1,784 $1,014 $1,124 $1,284
Share ............................................. 34.9 43.1 42.7 37.9 38.4 36.1 34.5 31.6 32.6 32.0
.............................................. 1,434 796 779 851 1,160 1,208 1,145
Share ............................................. 2.3 2.8 2.5 2.1 2.6 2.4 1.8 2.5 2.3 2.3
Monthly.................................. $819 $366 $389 $541 $615 $769 $925
Share ............................................. 16.0 15.5 14.8 16.0 16.7 18.0 17.5 17.9 14.3 13.3
.............................................. 5,177 2,267 3,594 4,180 4,386 4,958 5,745
Share ............................................. 8.4 8.0 11.4 10.3 9.9 9.7 9.0 7.8 7.6 6.2
insurance and pensions Mean .............................................. $7,246 $454 $997 $2,130 $3,106 $4,625
Share ............................................. 11.8 1.6 3.2 5.2 7.0 9.0 11.5 14.3 16.5 18.9
and
Security Mean .............................................. $6,760 $282 $763 $1,863 $2,797 $4,300
Share ............................................. 11.0 1.0 2.4 4.6 6.3 8.4 10.8 13.5 15.7 17.8 + savings
Consumer expenditures relative to income, 2020
• In the lower income strata, $389 to $541 per month [1.2 to 1.6 vehicles on average] is spent on transportation
• Completelyeliminating transportation costs has the effect of reducing housing costs to about 20-25% for the most adversely challenged populations
• While not likely to reduce all transportation costs, partial reductions suggest: - Locational decisions for housing are important, especially in terms of job/housing relationships and transit corridors - Savings generate opportunities for thoughtful allocations to other essential expenditures
Construction Cost per Square Foot: Density Drives Costs
Apartment Type

Cost per SF, net of land
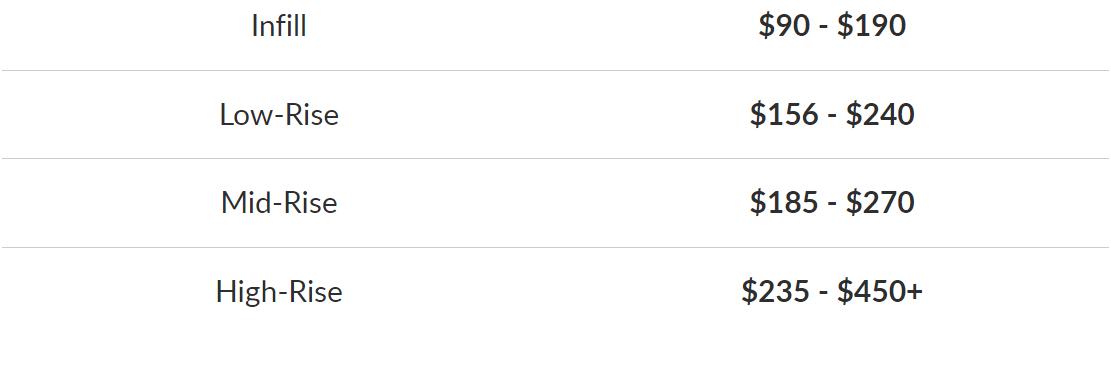
Construction Cost per Story: Height Drives Costs

Stories Cost per SF Total
3-Story $90 - $240 $3.2 - $3.6 million
4-Story $156 - $240 $4.7 - $5.9 million
Story $180 $270 $7.3 $13.4 million
Story $180 $270 $8.8 $15.5 million
10 Story $180 $270 $10.9 $17.6 million
15-Story $235 - $450+ $20.8 - $37.5 million
20-Story $235 - $450+ $26 - 53.5 million
30-Story $235 - $450+ $36.5 - $80 million
40-Story $235 - $450+ $52 - $160.5 million
50 Story $235 $450+ $78 $267.5 million
• Initial planning • Elevators • Floor efficiency • Material requirements • Structural conditions • Phasing completion and leasing
5
6
Structural Considerations: Complexity Drives Costs
INFILL LOW-RISE MID-RISE HIGH·RISE
Names Duplex, two, three or four-family, garden, walk-up
over 1, 5 over 2, 4 over-2 Tower
Construction type Typically wood Typically wood Wood on concrete or steel podium Concrete or steel
# of Floors 3, up to 6 in older buildings
of Units
4
Typical Circulation Single stair, no corridor Double-loaded corridor, multiple stairs, sometimes elevator
Double-loaded corridor, multiple stairs and egress, elevator
Unlimited by IBC, dictated by zoning, usually 12+
~4 20+ per floor
Smaller floor plate, doubleloaded corridor, elevator, egress stairs
Location Rural, suburban, urban Rural, suburban, urban Suburban, urban Urban
Cost PSF Varied $150 225
250 $225 400+
3 over 1 5
1 3 4 7
#
~1
~5 50 ~50 200
$175
Does Density Reward Developers? Not Always.
• Sometimes entitlements and zoning thresholds do not match real costs or objectives • Given the jump in construction costs, developers may not build to the maximum height or floor-to-area ratio (FAR) allowed • Exceptions occur largely in locations where expected rents per square foot are very high • Balance between housing affordability and location • Initial planning • Elevators • Floor efficiency • Material requirements • Structural conditions • Phasing completion and leasing
Potential Impacts of Regulation: Not Insignificant.
Cost of
for
Costs when site work begins
Timing is
Pure cost of delay
other
regulation
Development requirements (layout,
the ordinary,
Cost of land dedicated to the
or left unbuilt,
Fees charged when building
Costs of affordability mandates
Complying
Source:
Changes to building codes over
past
NAHB
applying
zoning approval, 3.2%
(fees, required studies, etc.), 8.5%
mats, etc.) beyond
5.4%
govt.
2.4%
(e.g., IZ), 2.7%
the
10 years, 11.1%
with OSHA/other labor regulations, 2.6%
construction is authorized, 4.4%
worth a lot
(if
imposed no
cost), 0.5% TOTAL = 40.6%
Development Timing Impacts: Not Just Local 9 6 12 6 12 12 6 6 27 12 0 3 6 9 12 15 18 21 24 27 30 33 36 39 42 45 48 51 54 57 60 63 66 Longest Fastest Prepare entitlement application Entitlement process Prepare construction drawings Building department plan check Construction Source: Terner Center for Housing Innovation
Allocation of Total Development Costs

Given the substantive jump in construction costs to accommodate height or units, developers may not build to the maximum height or floor-to-area ratio (FAR) allowed under zoning except in locations where expected rents per square foot are very high.
Source: Brookingstics


Allocation of Total Development Costs Source: Brookingstics Mt. Dora $102,857 / UNIT Kissimmee $43,000 / UNIT St. Pete $250,000 / UNIT Disney Unknown Vero $32,000 / UNIT Land 10%-20%
Operating Costs/SF: Note Costs of Utilities and Taxes


Source: NAA Survey
45% 48%
Final Thoughts: The Form is Often the Solution
• Cost of housing does not match (in most cases) the feasible cost of housing

• Transportation options are a major consideration in affordability
• Costs of delivering private market solutions often reflect density opportunities
• Land costs are a substantial development cost, typically justifying more density, but the advantages of density and height often are lost to higher development costs
• Regulations add to development costs, sometimes prohibitively
• Rents are spiking, but so are many costs that contribute to rent
Ryan Hyler
Styx Company
Financing, Construction, Management
Partner
Castles, Castles, everywhere…. without a place to sleep
Osceola County Made Sense
Why
• Median studio rental rate: $1,590 plus utilities • Typical qualifier is 3x base rental rate • Need income of $52,200 to qualify • 48% of population makes under $50,000 per year • In-place zoning • Accessible staff
Market-based solutions to housing issue


Current Market Solutions • Extremely long commutes, decreased quality of life and recreation time • Roommates and group housing, lack of independence • Sub-par living standards
The Teale


• Everyone deserves a quality place to live • Class A community with less square footage • Professional management • True amenities • “True” multifamily - 12-month leases - Occupancy restrictions consistent with Fair Housing Laws • Credit and criminal background checks
Philosophy
The Teale


Before and After
–
The Teale


Before and After

–
The Teale


Before and After

–
The Teale


Before and After


–
The Teale


Before and After


–
The Teale

Amenities


–
The Teale

Studio Apartments


–
Income


and
• We are a market solution to affordability • The Teale requires 2x income for gross rent • Current rents require $27,000 and $31,200 annual income, depending on unit
Requirements
AMI SIZE
for Attainable Housing


The Demand
• Every building virtually pre-leased • 57 move-ins on one day • 4,400 inquiries; over 1,000 tours • 20% of resident base is employed by Disney or affiliate • 5% of resident base is employed by Osceola County Governments
Entitlement Challenges
• Zoning - Multifamily and hotels do not always exist in same zoning district - Maximum density – many municipalities have caps on units per acre - Minimum parking requirements, variances are extremely challenging • Building code vs. local requirements - Individual electric and water meters create affordability issue for developer and renter • Carry cost during permitting equals higher rents • Sellers’ expectations do not align with length of time needed for entitlements
Affordability Challenges
• Impact fees - Impact fees in Osceola County – 20% of TOTAL development cost - County doesn’t charge a mobility fee for conversions - School District student generation rate – 35 students per 100 apartments - Currently 4 residents under 18, or 1.3 per 100 apartments - Difference in impact fee payment: - School District fee is $1.176 million for 100 units - Actual impact justifies only $33,000
• Time - Navigating entitlements, authorities, and nuances for each municipality becomes very expensive
Susan Caswell Sustainability Director Osceola County
Planning and Regulation
Planning for Housing
Whose housing needs are not being met?

What do they need?
What is local government’s role in providing it?


0% 10% 20% 30% 40% 50% 60% 70% 80% 90% 100% $50,000 or more $35,000 to $50,000 $20,000 to $35,000 Less than $20,000 Housing Cost/Rent Burden by Income Level Osceola County 2020 Less than 30% 30 to 50% 50% or more
Tourist
One-person

Single
Elderly
sector workers Younger households
households
parent families
Income under $35,000
What they need
Smaller homes
homes are
Rental housing
bedroom
afford to buy a home

this income level
Homes near…
of
are
• 52% Osceola hhs are 1-2 person • 8%
0-1
• Can’t
at
• Jobs (25%
jobs
on W192) • Schools • Stores • Services
Young, single… Rental, small unit ok
In college… Rental, near school and part-time jobs, roommates or small unit
Working… Can afford more housing as wages increase – rental or first time homeownership
Married… Multiple incomes, move to first-time homeownership
Children… Larger home, school location is a consideration

Move up… Depending on circumstances (income, school, job changes) move to larger home
Empty nest (young old)… Children move out, parents may want to downsize
Old old… Loss of spouse, back to 1-person household, may need assistance with daily activity
This is a continuum representing housing products and services, from homelessness all the way to market rate housing. Relative to the life span continuum at left: in an ideal world, all of the housing needs for the typical life span would be met in the last two market rate types, but they’re not.

This is just the continuum of a normal life span –housing needs differ throughout out lives. But without a continuum of housing types, we’re trying to fit people with vastly different needs into a few products at a few price points. That’s where missing middle comes in.

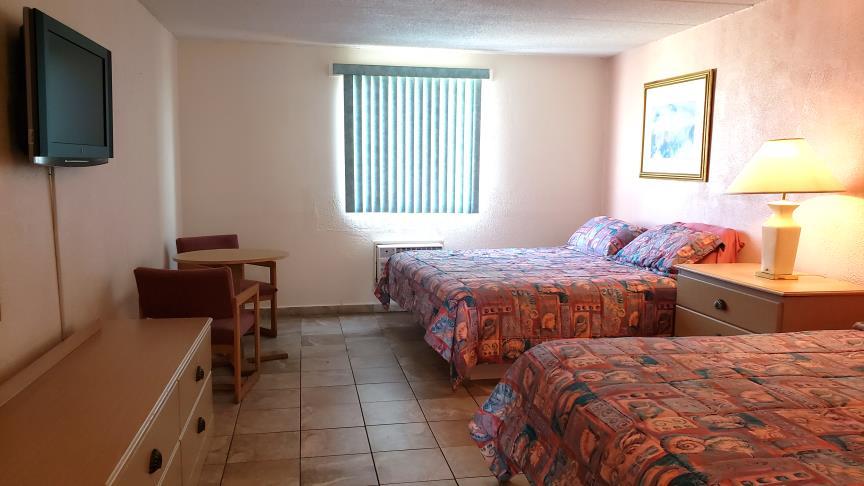
Motel Conversions


The Pros • Provides housing near lower-wage jobs in an area with transit • Hotel sector struggling • Addresses long-term motel resident issue • Provides 24-hour environment for W192 businesses The Concerns • Type and quality of conversions • Effect of conversions on W192 corridor • Who will live in them • School impacts • Utility metering

• W192 history • Long-term motel residents • Zoning (commercial tourist) • Initial conversions • Change of use • Impact fees • Transitional housing • Ordinance Osceola’s Experience West 192 Corridor in Osceola County
Ordinance Addressing Conversions


• Interior upgrades must meet residential standards, including fully operable kitchens with sink, refrigerator, stove/oven • Individual electric and water meters • Building façades must have residential appearance • Setback and multi-use requirements in certain areas • Minimum densities • Landscaping must include green space for tenants, shade trees in parking areas, entry landscaping
Lessons


Learned • Converting motels can solve multiple problems • Need to know what developers are looking for (location, zoning, etc.) • Understand needs and goals of all parties • Set up a clear process for conversions • Expedite process whenever possible • Address misconceptions
Motels, Apartments, Conversions
Motels Studio Apartments Studio Conversions Transitional Housing Unit size (sq. ft.) 200 to 360 415 to 670 200 to 360 300 Monthly rent Can change daily $1,380 to $2,170 $1,045 to $1,265 $800 Credit check? No Yes Yes No Deposit? No YES Yes Alternative to deposit offered Yes Lease terms No lease 12-month* 12-month 7 month, month to month available Covered expenses Rent, utilities, cable, WiFi Separate payments (and deposits) Rent, utilities,** some cable/WiFi Rent, utilities, WiFi Occupancy 4 or 5 Up to 2 Up to 2 4 or 5 * Varies – primarily 12, range is from 3 to 18 ** Utilities must be metered separately since ordinance adoption
Mitchell Glasser
Housing and Community Development Manager
Orange County
Funding Sources
Hotel Conversions


Conversions can provide: • Naturally occurring affordable housing (NOAH) • Rent restrictive affordable housing • Permanent supportive housing for homeless or disabled individuals and families
Types of Assistance
• Regulatory –

fee waivers
zoning code,
• Low interest loans and conventional financing (naturally occurring and rent restrictive)
• Grants, low interest loans, and small conventional debt (permanent supportive housing)

flexible
impact
Financial


Resources • American Rescue Plan (ARP) –affordable housing is an eligible use of federal funds • HOME-ARP– special HOME program for activities targeted to qualifying populations (QPs) • State Housing Initiatives Partnership (SHIP) program – rent restricted affordable housing • Local Housing Trust Fund – flexible source of financing


• Clients: Serves Qualifying Populations (QPs) • Homeless • At risk of homelessness, extremely cost burdened • Domestic violence, sexual assault, human trafficking victims • Activities: Hotel Conversion • Acquisition, rehabilitation for rental housing • Up to 70% of units must be occupied by QPs • No income restrictions for QPs • Minimum compliance period 15 years Financial Resources – HOME-ARP
Regulatory Relief
Impact Fee Waivers
–
• Florida Statute (163.318.01) allows for impact fee waivers for affordable housing (as defined by Section 420.9071, F.S.) • Does not require use of other revenue to offset impact • Orange County amended school and transportation impact fee ordinances to provide an opportunity for exemptions • The level and duration of affordability must be documented to County’s satisfaction to qualify for exemption • Must meet or exceed statutory definition for affordability • Must be affordable long-term • Developer’s agreement required


Case Study/ Maxwell Gardens Permanent Supportive Housing for Homeless • 205 units (180 studio) • Purchased in 2001 for $2.4 million • Owned by Pathlight Home (nonprofit) • Rent is $728, which includes utilities • Maximum rent paid by tenants is $625 – difference covered by federal, state, local subsidy, as well as donations • Supportive services available • Capital repairs over the years needed local government support: roof and HVAC replacements, storefront for Sobik’s Subs
Case Study/ Lessons Learned
Projects like this don’t make a profit (not tax credit deals)


Need grants, low-interest
with conventional loans

Need subsidy to keep rents affordable for the residents served (at or below 50% AMI)
Need to identify funding for future capital expenditures, as rental revenue will not be enough
Property can’t be managed solely by regular

it must have a social service
•
•
loans in combination
•
•
•
management company –
component
Questions and Discussion
