AUGUST 2023
MARLBOROUGH VINTAGE & NZ WINE INDUSTRY OVERVIEW
JOHN WILSON
“THE CHANGING LANDSCAPE OF NZ WINE”
The Marlborough wine industry celebrates its 50th anniversary as consumers around the globe enjoy more NZ wine than ever before.
The landscape for NZ wine and Champagne share similar trends. Rebounding from a lower 2021 to achieve record global sales in 2022, both have a declining domestic market, with growth in the last decade being export led with USA being the key market.
Continued success is reliant on increasing access to new export markets, greater penetration into existing markets, and connecting with consumers to encourage purchase at higher price points.
KEY INSIGHTS:
1. Marlborough grape supply is in the 4th phase with the last two vintages averaging 404K tonnes. This is the result of producing hectares moving above 29,000 and the high tonnes per producing hectare, compared to historic yields.
2. Global sales achieved MAT June 2023 of 356ML resulting in 16% or 49ML volume growth compared to a year ago. The 3.6% CAGR over a 12 year period (2012-2023) has been driven from export sales countering a consistent decline of NZ wine sold in the domestic market.
3. A record export MAT June 2023 of $2.4 billion has grown at 23% year on year. Driven from an improved $ per litre ($7.61 LT) from both packaged and non-packaged exports.
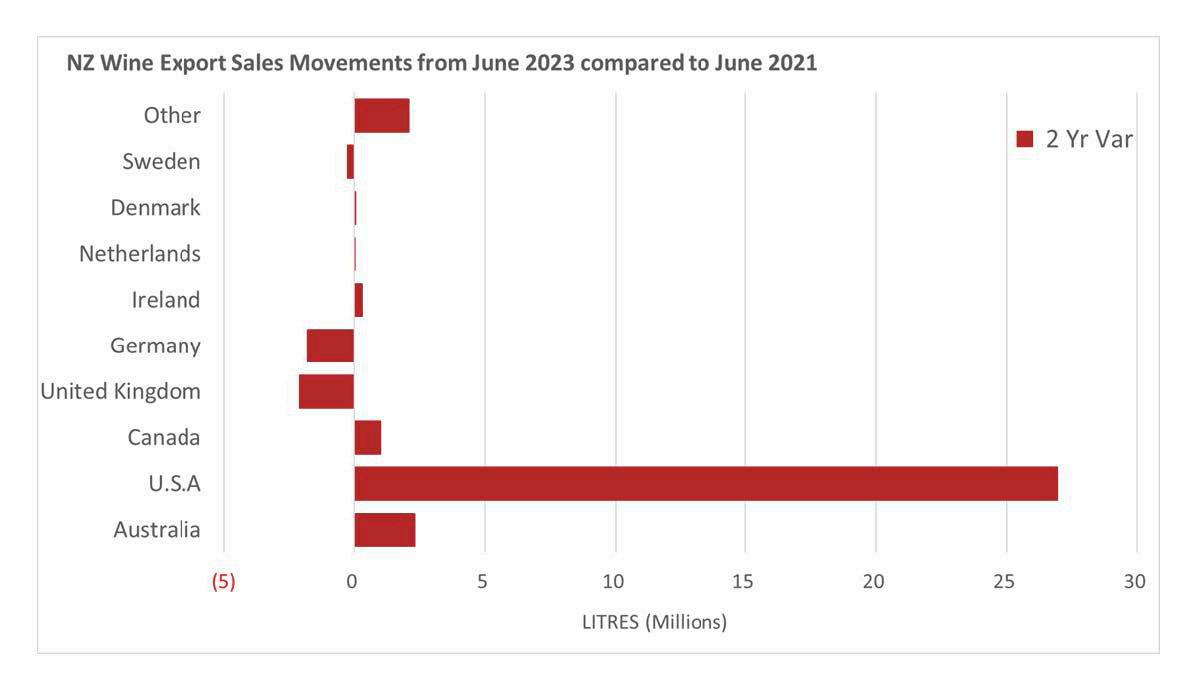
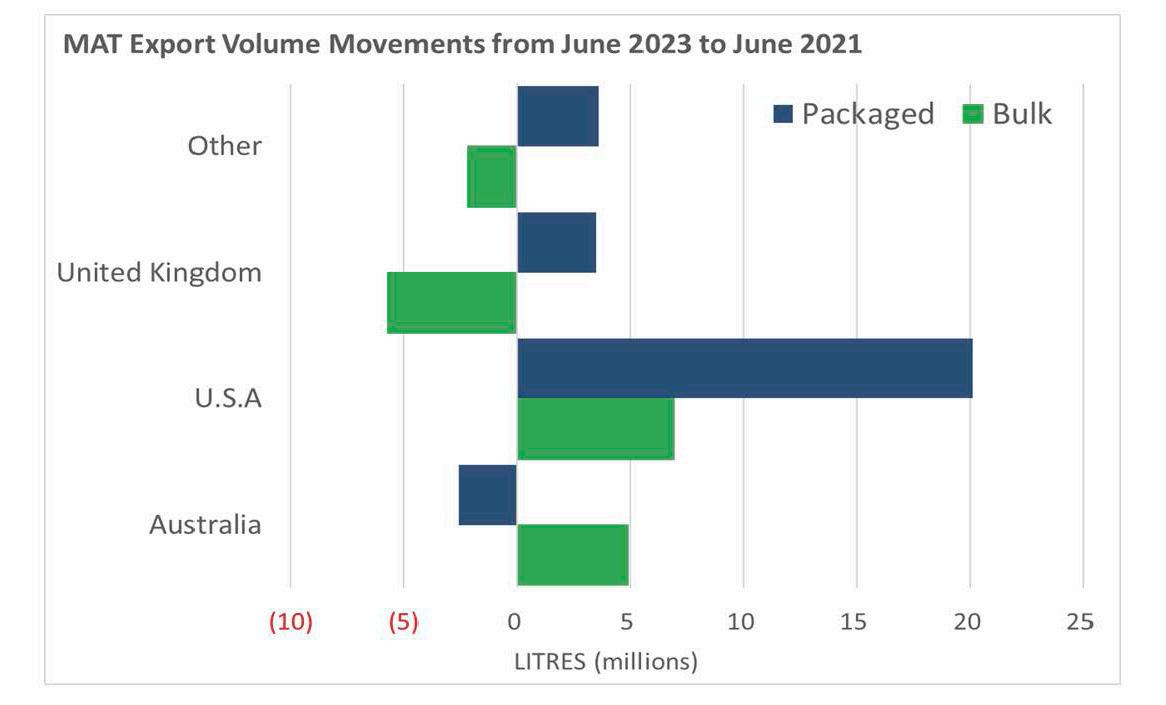
4. The 2 Year (June 2023 – June 2021) volume movement illustrates the changing export landscape where USA exports grew 27ML or 34% from total export growth of 29ML.
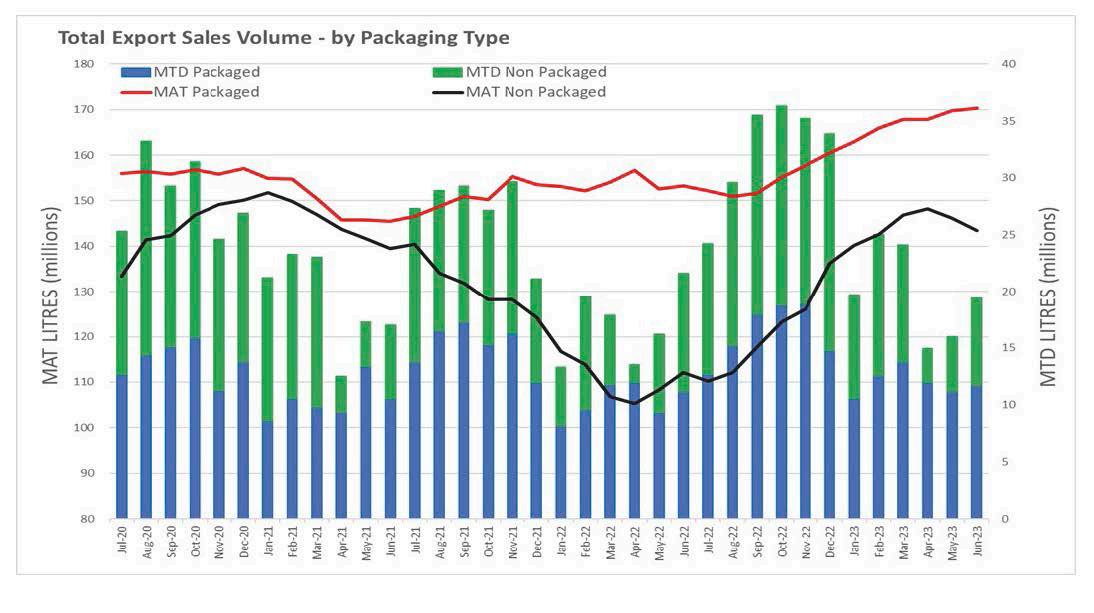
5. The release of V22 has seen the re-emergence of non-packaged wine exports. The MAT June 2023 % ratio between packaged and non-packaged wine is currently 60:40. Non- packaged wine exports are now +4ML or +3% above June 2021.
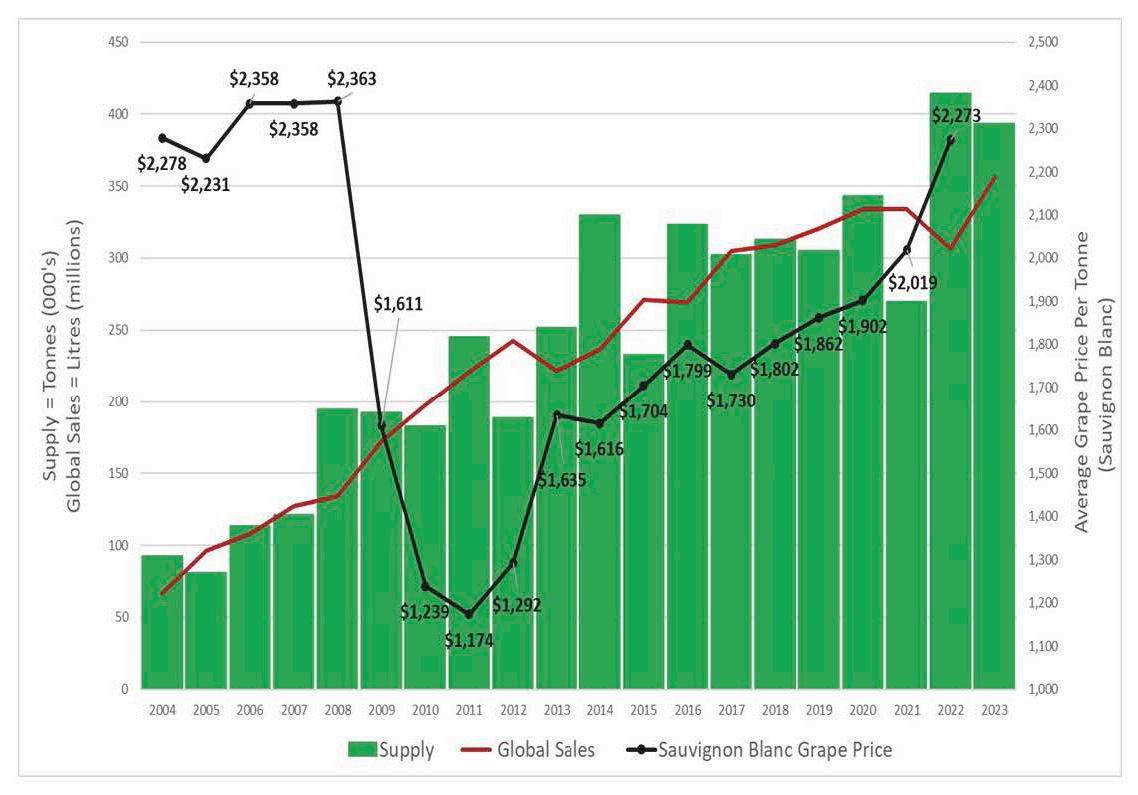
6. There is a direct correlation between demand, supply and the Marlborough Sauvignon Blanc grape pricing. After a consistent period of under supply the 2013 – 2020 grape price increased. Under supply was accelerated with the low V21 harvest resulting in a V22 grape price increase of 13%.
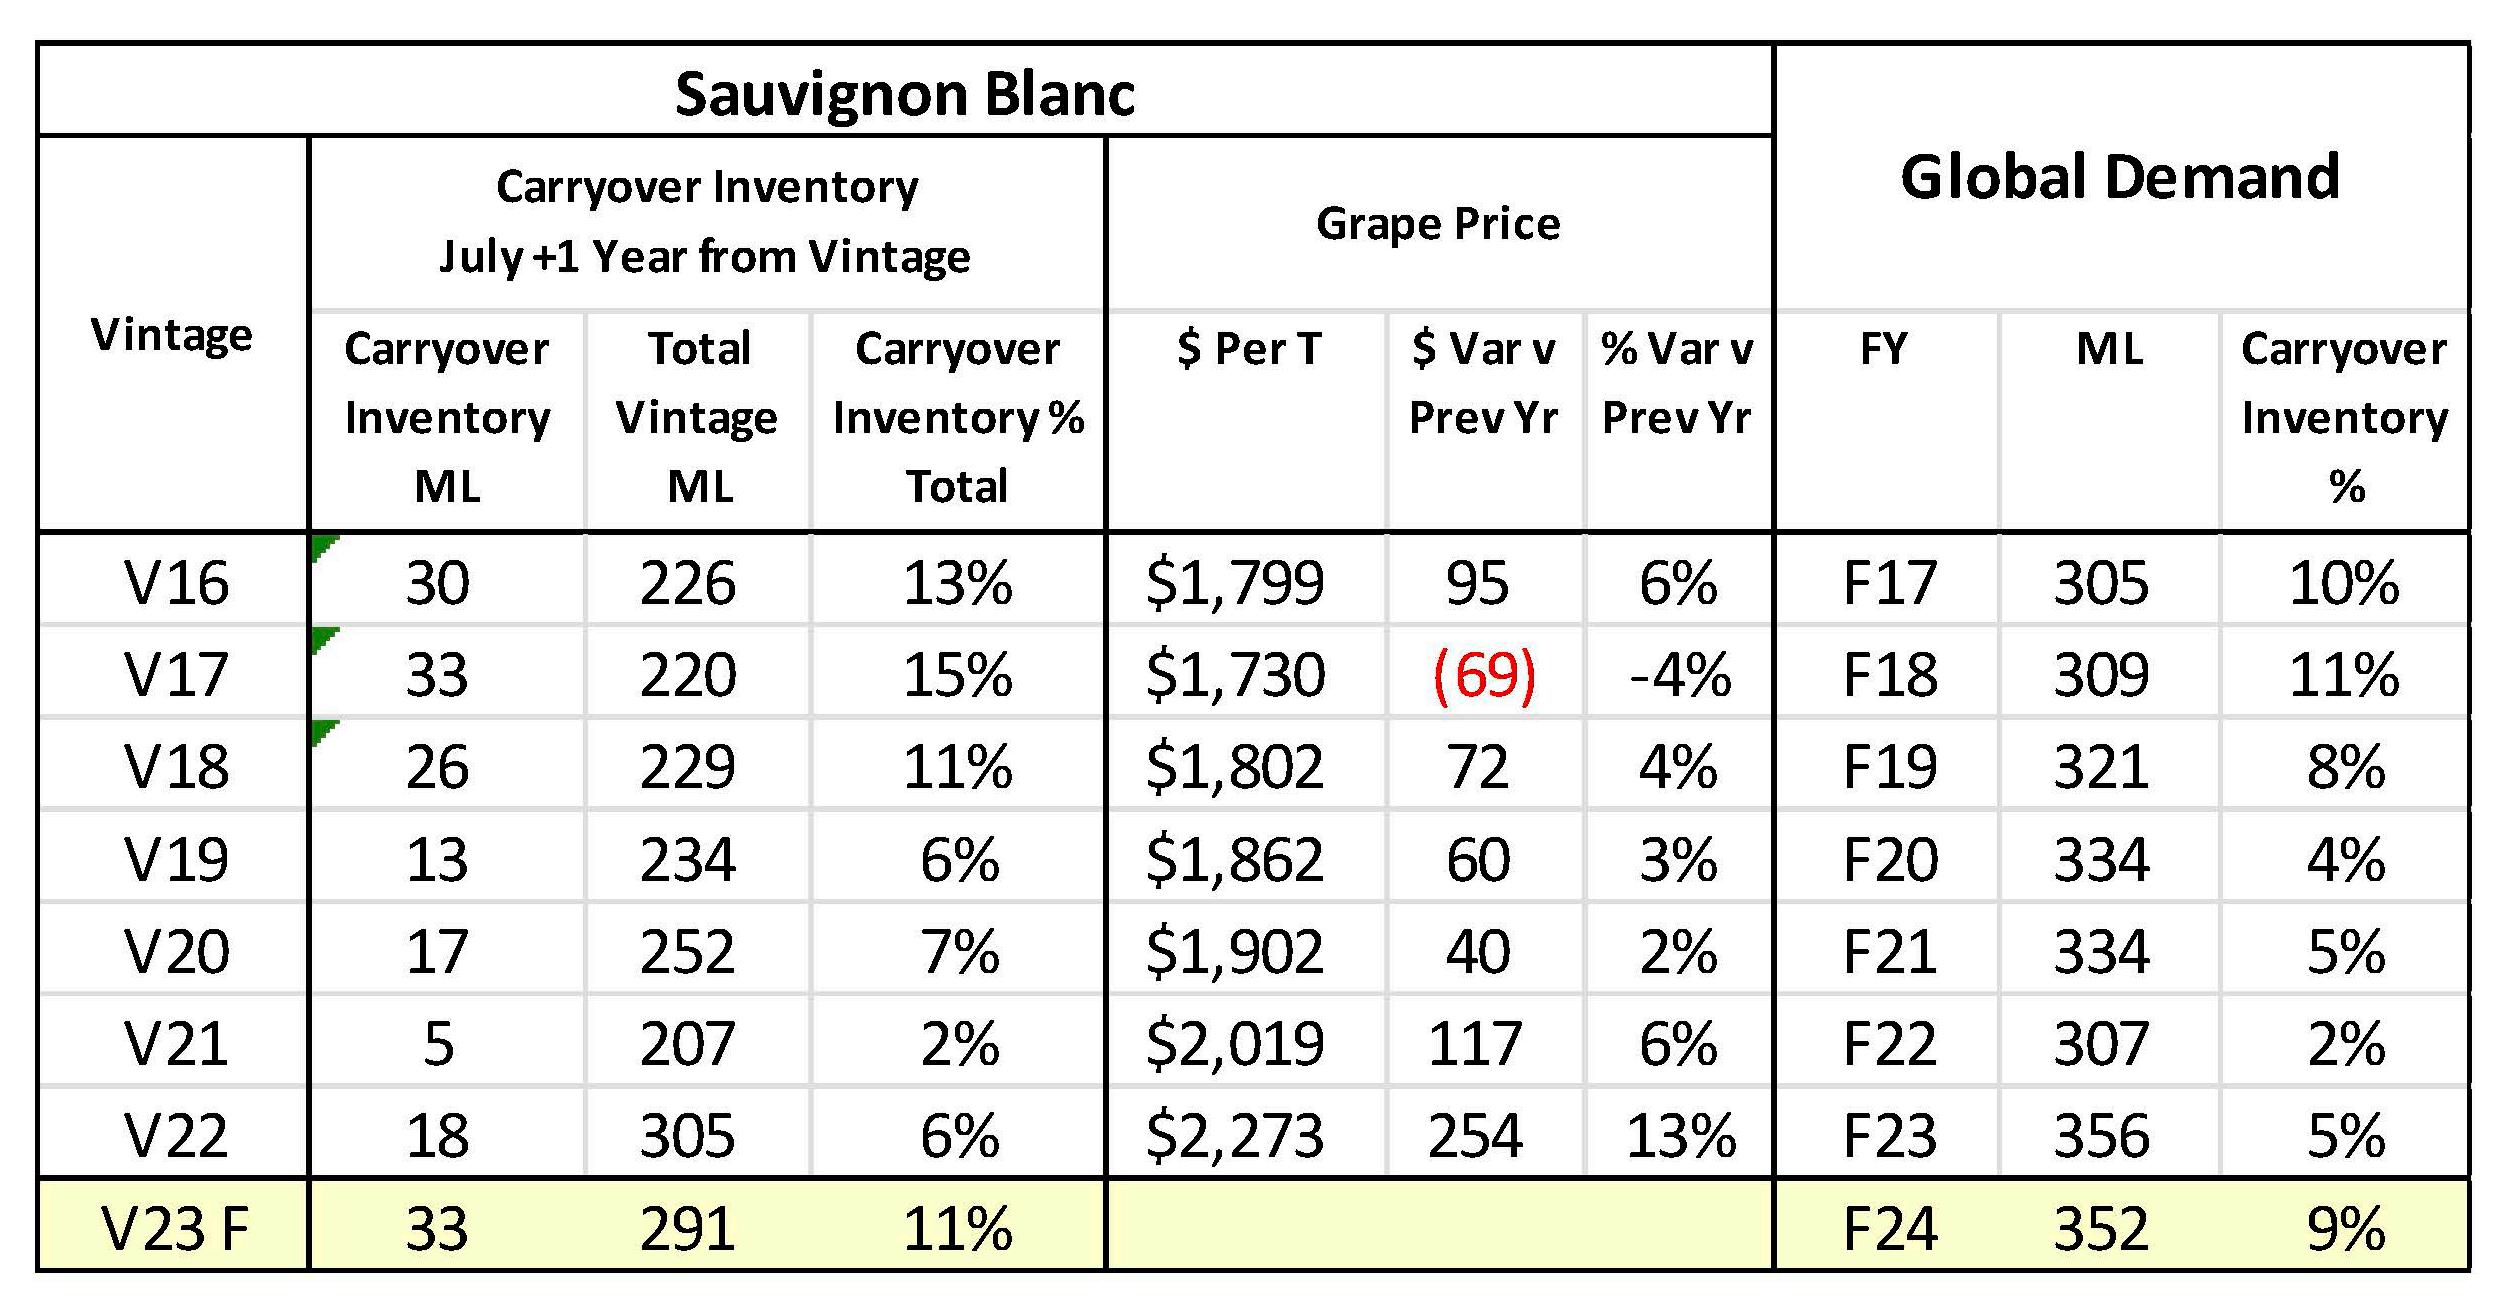
7. V22 Sauvignon Blanc carryover inventory levels have increased to 18ML or 6% of total vintage supply. V23 carryover inventory is forecast to increase to 33ML. This level is in line with carryover inventory in V16-18. The V23 forecast assumes 12ML of V22 Sauvignon Blanc is held as carryover inventory (packaged and non-packaged) within wineries located outside NZ. Note:
MARLBOROUGH SUPPLY TRENDS
Marlborough grape supply is in the 4th phase with the last two vintages averaging 404K tonnes. This is a result of producing hectares moving above 29,000 and the high tonnes per producing hectare (V22 = 14.1 T, V23 = 12.9 T), compared to historic yields.
The 3rd phase averaged 302k tonnes over 8 vintages between 2014 – 2021. This phase was relatively stable and consistent however vintage 2015 & 2021 reduced the average due to lower yields. The 2nd phase averaged 209k tonnes, the 6 vintages were a challenging period after the global financial crisis, resulting in a calibration between demand, supply, grape pricing and asset values.

KEY POINTS:
• The last two vintages have step changed Marlborough supply to new levels of producing hectares and yields.

• This chart includes all sub regions and grape varieties within Marlborough.
• Climate change, water availability, bud initiation, labour supply, trunk disease, time lag of new planted and producing hectares and nursery supply are all recognised as impacting on harvest yields.
Source: Vintage 2004 – 2023 statistics from New Zealand Winegrowers Vintage Survey Report. Vintage 2023 hectares from Marlborough Wine Industry Growth projected hectares in production.NZ WINE GLOBAL SALES TRENDS

Global sales achieved MAT June 2023 of 356ML resulting in 16% or 49ML volume growth compared to a year ago. The 3.6% *CAGR over a 12 year period (2012-2023) has been driven from export sales countering a consistent decline of NZ wine sold in the domestic market.

From 2018, the export CAGR % growth has been consistently within the 5 - 6% range. The exception is 2022 where export and domestic demand for NZ wine declined (supply constrained) due to the low yields from vintage 2021.
The 2024 forecast is based on moderating export growth rates from 2023 and the lower 2023 vintage harvest. NZ wine sold in the domestic market is forecast to decline to MAT 41ML by June 2024. Price elasticity (where price appreciation results in volume declines) is a key dynamic in this market combined with an increased focus on higher price segments. A future focus in key export markets is to understand when importers and distributors increase their prices to maintain margins, then understand how this impacts the in-market rate of sale and ex NZ shipment export volumes.
NZ WINE EXPORT SALES TRENDS


The export MAT June 2023 of 314ML has rebounded from the low point of 261ML (May 2022). This rebound has been driven from an outstanding Sep – Dec 2022 period, averaging 35ML per month. This new export level peaked in March 2023 with a rebalancing occurring in the last quarter. Growth is across all winery sizes with small wineries having the highest MAT % growth (+34%), an indicator of export customers building depth into their NZ Wine categories and consumers seeking new taste experiences.
This growth has restored in-market export stock levels to ensure consistency in supply for export customers. This consistent availability is critical to connect with consumers and build confidence to range and list NZ wine.
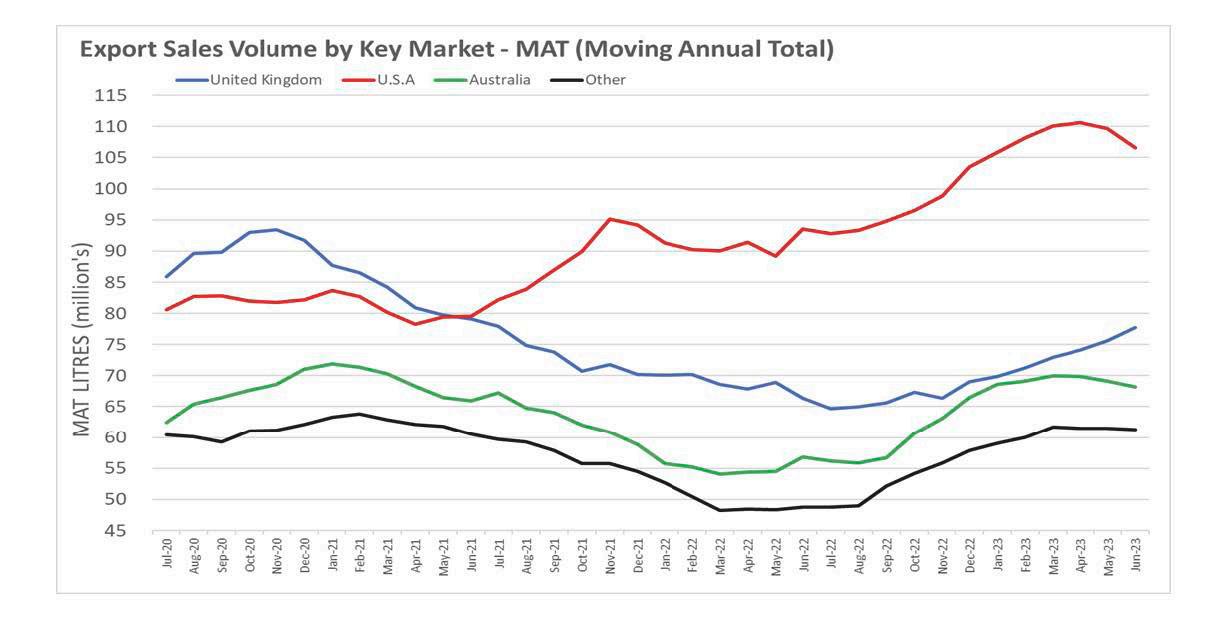
The MAT (Moving Annual Total) trend line (below) illustrates the strong connection between demand and supply. From June 2020 the surge in growth was driven from a record (at the time) V20 harvest, the uncertainty of Covid-19 influenced the timing and rate of growth. A correction in Jan-June 2021 was unavoidable as V20 supply was exhausted. The decline in June 2021 –May 2022 was supply driven from the low V21 harvest.
A record export MAT June 2023 of $2.4 billion is growing at 23% year on year. This is driven from an improved $ per litre ($7.61 LT) in both packaged and non-packaged exports.
Source: New Zealand Winegrowers export market reports.SIGNIFICANT CHANGES IN THE EXPORT MARKET MIX

Exports to the USA MAT June 2023 of 107ML has grown by 14% or 13ML in the last year. The last quarter illustrates a rebalancing of growth with USA and Australia, the UK growth trend continues. The 2 year (June 2023 – June 2021) movement illustrates the changing export landscape where USA exports grew 27ML or 34% from total export growth of 29ML.
Source: all the data above was sourced from New Zealand Winegrowers NZ Wine Export reports.
 Source: all the data above was sourced from New Zealand Winegrowers NZ Wine Export reports.