WATER QUALITY MONITORING NETWORK REPORT
SPRING 2025


BACKGROUND
This report analyses data collected by the Angling Trust’s Water Quality Monitoring Network (WQMN)’s 800 volunteers during spring 2023, 2024 and 2025 in England and Wales. Spring is defined as 20th March-21st June for each year. There was a variable sampling effort, with 847 samples collected in spring 2023, 1209 in 2024 and 983 in 2025
In 2025, all four nations saw their record mean spring temperature since records began – surpassing that set in 2024. Spring 2025 was also exceptionally dry, with the UK experiencing the 6th driest spring on record In comparison, 2023 was a more or less average year by historical standards, whilst 2024 recorded high temperatures and exceptional rainfall. Considering these conditions, it is unsurprising that the WQMN’s data showed elevated water temperatures in 2025 compared to the two previous years.
High rainfall acts as a multiplier of pollution inputs into our waterways. Agricultural pollution, road runoff, and sewage spills all increase as rainfall increases, as rainfall overwhelms our crumbling sewage infrastructure and washes pollutants from the land into waterways. 2024 saw a record 3,614,427 million hours of untreated sewage
enter freshwater habitats, with water companies and regulators invariably identifying the unusually wet months as a contributing factor.
Spring’s exceptionally dry conditions likely contributed to a decreased nutrient load entering waterways Ultimately, however, it is the concentration of nutrients - not the total load - which determines outcomes for freshwater species. Dry conditions brought with it low river levels, and therefore less water in which nutrients can dilute
In this case, more dilution means more pollution, despite the likely reduction in total inputs. The Angling Trust’s WQMN data collected in spring 2025 revealed that water temperature, electrical conductivity, ammonia and nitrate concentrations increase – all of which add stress to freshwater species on the brink. There was welcome news that phosphate concentration fell, but this is likely to have been outweighed by the net effect of increased nutrient concentrations and water temperature.
KEY FINDINGS
Compared to the ‘more or less average’ spring of 2023 (Met Office, 2023), water temperatures in 2025 were significantly higher, with March being 1.7°C warmer, April being 1.8°C warmer, and May being 0.6°C warmer. Average water temperatures in 2025 also exceeded 2024, corresponding with 2025’s air temperature breaking the record set in 2024.
Electrical conductivity, ammonia, and nitrate concentrations were significantly increased in spring 2025 compared to 2023 and 2024,
The average electrical conductivity was 17% higher in 2025 compared to 2024, and 33% higher compared to 2023.
Only one month in 2023 and 2024 breached 5ppm for average nitrate concentration. In 2025, every spring monthly average breached 5ppm, with the average over the whole of spring being 5.34ppm and 53.6% of samples breaching 5ppm.
Ammonia concentrations increased significantly in 2025, with the percentage of samples breaching good ecological status being 2.23%, 4.68% and 5.38% in 2023, 2024 and 2025 respectively.
Phosphate concentrations were lower in 2025 compared to the two previous years, with the percentage of phosphate samples exceeding good ecological status being 34.4%, 33.9% and 30.1% in 2023, 2024, and 2025, respectively.

POLICY RECOMMENDATIONS
1. Environment Agency (EA) and Natural Resource Wales (NRW) must scale up their water quality monitoring to produce a clearer understanding of pollution inputs and the increasing role of climate change to pollutant concentrations.
2. EA and NRW should scale up and accelerate their use of citizen science data such as that presented in this report.
3. The government should set clear overarching targets and strategic direction for the water sector, ensuring full compliance with legal requirements like the Water Framework Directive (WFD).
4. The water industry’s systematic lack of investment in infrastructure has fuelled both increased pollution and increased abstraction. The National Infrastructure Commission (NIC) should have an enhanced role to treat water as a national infrastructure priority, identifying and planning investment needs over a significantly longer timeframe than the current five-year cycles.
5. The NIC should set statutory resilience standards for the water sector, as current standards are lacking, especially in relation to heightened water stress conditions in dry periods, such as that experienced in spring 2025.
6. As DEFRA looks to increase the number of farm inspections over the next three years, climate resilience and adaptation measures must form a crucial part of advice given.
7. Water storage must be ramped up across the board, by providing additional support for farmers and households to install storage solutions.
8. Water Resource Management Plans do not go far enough to reduce unsustainable abstraction from freshwater habitats. More ambitious and earlier reductions are needed in abstraction licences, especially from sensitive catchments.
9. Investment in nature-based solutions such as wetland restoration and creation, sustainable drainage systems and natural flood management strategies must go further and faster.
DATA ANALYSIS
The following data analysis was prepared by the Angling Trust, using data collected by the Water Quality Monitoring Network (WQMN). The WQMN is a coalition of more than 800 volunteers across England and Wales. To date, we have collected over 10,000+ water samples, making it the largest regular citizen science water quality monitoring project in the UK.
All volunteers are equipped with the following tried-and-tested equipment: Hanna Instruments low-range phosphate checker, Hach nitrate test strips, and the HM Digital temperature and conductivity probe. Approximately 50% of groups also have the Hanna medium-range ammonia checker, with the proportion of users increasing year-on-year.
WEATHER CLASSIFICATION
England and Wales have experienced highly variable weather conditions across the three springs assessed in this report, with multiple records broken in both 2024 and 2025. Each can be roughly characterised as follows:
2023: “More or less average” weather conditions, with the exception of May, which saw just 55% of expected rainfall compared with long-term average between 1990-2010 (Met Office, 2023)
2024: “May 2024 set a new record with an average mean temperature of 13 1°C for the UK, surpassing the previous record of 12 1°C set in 2008” (Met Office, 2024) It was also exceptionally wet, with England and Wales having their respective fifth and eighth wettest springs on record.
35%
2025: All four nations recorded their warmest spring for mean temperature since the series began in 1884, surpassing the previous record from 2024. “By mid-May, the UK was experiencing its driest spring in over 100 years “June’s wetter weather eased conditions slightly, but “spring 2025 still ranks as the sixth driest spring since this series began in 1836, with just 128.2mm of rainfall – approximately 40% below the long-term average and still the driest spring in more than 50 years.” (Met Office, 2025)
1 - TEMPERATURE
72%
Water temperature data collected by WQMN volunteers demonstrated that the record air temperatures in 2025 translated into elevated water temperatures. March, April and May were hottest in 2025, with the largest increases occurring in March and April.
the action or activity of gathering information about consumers' needs and preferences
Compared to the ‘more or less average’ spring of 2023, water temperatures in 2025 were significantly higher, with March being 1.7°C warmer, April 1.8°C warmer, and May 0.6°C warmer.
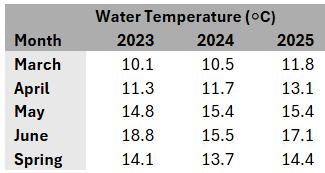
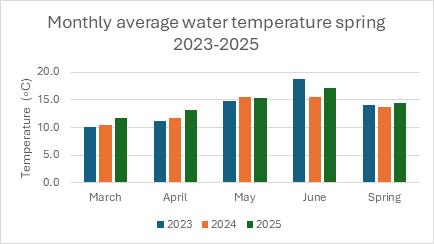
2024 was, at the time, the hottest spring on record. 2025 surpassed this new high in terms of air temperature WQMN data reveals it to have been hotter in our rivers too – with spring 2025 being 0 3 °C warmer than 2024 Aside from May, where the temperature was the same in both years, water temperatures were significantly higher in every month of 2025, with increases of 1.3°C, 1.4°C, and 0.6°C in March, April and June, respectively.
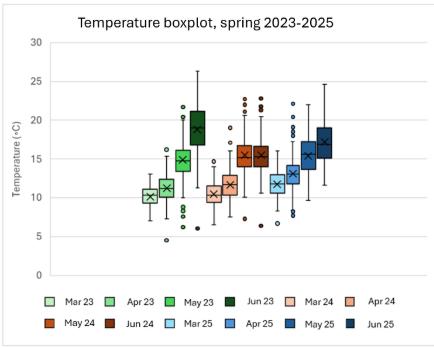
The boxplot demonstrates that temperatures were most variable in May and June each year, with the interquartile range being wider, and there being fewer outliers in the earlier months
2 - ELECTRICAL CONDUCTIVITY
Electrical conductivity (EC) was significantly higher, and with a stronger positive skew in 2025 compared to 2023 and 2024. The mean EC was 17% higher in 2025 compared to 2024, and 33% higher compared to 2023.
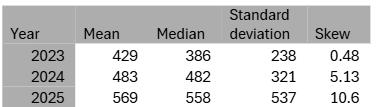
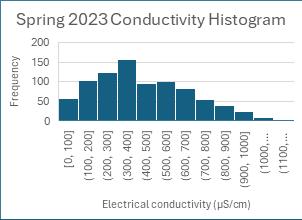
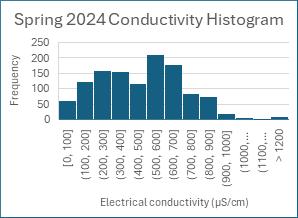
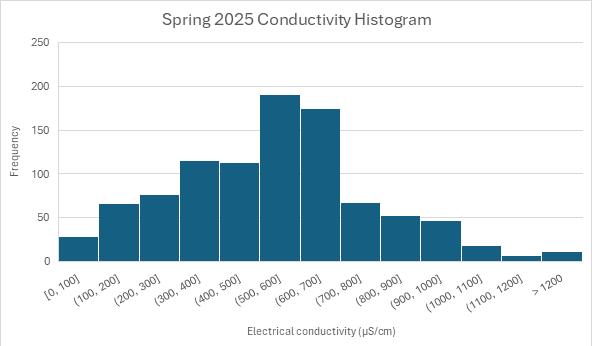
The histograms for each year represent the distribution of EC results during each spring. The stand-out chart is the 2025 distribution, which is extremely positively skewed, with a skew value of 10.6. This reflects the fact that the majority of readings are low to moderate, but there are a few extremely high values (outliers). These extreme high values stretch the distribution's tail to the right The mean is significantly higher than the median, due to those high outlier values
3 - PHOSPHATE
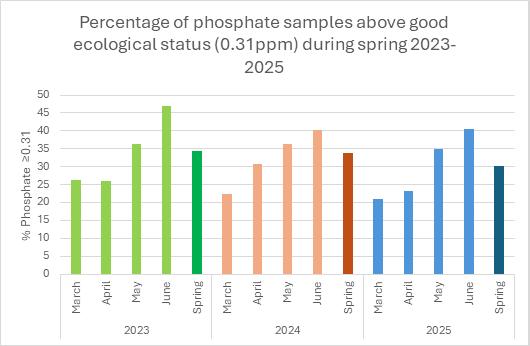
Spring 2025 saw fewer samples exceed the upper limit of good ecological status of 0 31ppm provided by the Water Framework Directive (WFD). Phosphate concentrations increased as spring progressed in every year, with the exception of March to April 2023.
Over spring, the percentage of phosphate samples exceeding GES were 34.3%, 33.9% and 30.1% in 2023, 2024, and 2025, respectively. Phosphate site averages were especially low during March and April 2025, with the average for the whole of spring increased by the significantly higher averages in May and June.
4 - NITRATE
2025 saw a significant increase in nitrate concentrations Compared to the (arguably far too high) upper limit of 11.3ppm provided by the Nitrates Directive, 2025 saw huge increases in breaches compared to 2023 and 2024. 2.36% and 2.07% in 2023 and 2024, respectively, breached good ecological status. In 2025, that figure jumped to 6.41%. By far the worst month for nitrate pollution was March 2025, in which 9.42% of samples breached good ecological status Prior to this month, the highest value in any spring month had been 5 95%, recorded in June 2023
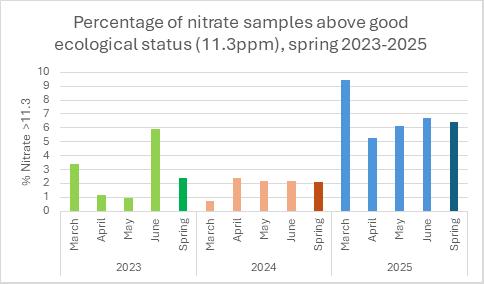
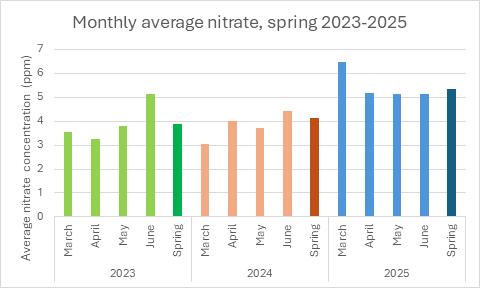
Volunteers are provided with guidance that 5ppm is sufficient to contribute significantly to eutrophication Prior to 2025, only one month (June 2023) had recorded an average monthly nitrate value above 5ppm. In 2025, every spring monthly average breached 5ppm, with the average over the whole of spring being 5.34ppm and 53.6% of samples breaching 5ppm.
5 - AMMONIA
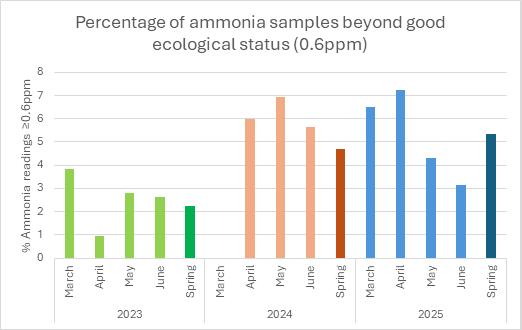
Both 2024 and 2025 showed significantly elevated ammonia concentrations compared to 2023. The percentage of samples breaching good ecological status was 2.23%, 4.68% and 5 38% in 2023, 2024 and 2025 respectively 2025 saw by far the highest proportion of ammonia failure compared to the two previous Marches. 3.85% of March readings in 2023 and 0% in March 2024 breached good ecological status, whilst 6.49% of readings in March 2025 breached good ecological status.
IMPACTS OF FINDINGS ON FRESHWATER ECOSYSTEMS
From an ecological health perspective, this report does not make for easy reading. Of the 3 years analysed, spring 2025 showed the highest water temperature, nitrate and ammonia concentrations, and the highest electrical conductivity. The only indicator of pollution to decrease was phosphate concentration. Unusually high water temperatures can have devastating impacts on freshwater ecosystems, and amplify the negative effects of the nutrients which were also found to increase in concentration
TEMPERATURE-DRIVEN STRESS
The combination of high temperatures and a high concentration of nutrients causes significant drops in dissolved oxygen, as algae proliferates, consuming oxygen overnight whilst breathing aerobically. Many fish species will have suffered in the conditions revealed by this report. For example, brown trout have an upper lethal limit of around 25°C (Elliott, 1981; Coutant, 1977), at which point they are vulnerable not only to asphyxiation, but organ failure.
Extended exposure of 22-25°C can also prove fatal when this temperature persists for several days (Anttila et al., 2014; Karcher et al, 2021). In reality, sub-lethal stress begins at 20-22°C as fish and other organisms suffer changes in gene-expression and metabolic dysfunction.
EUTROPHICATION
Phosphate and nitrate are the two primary drivers of eutrophication. Results here are mixed, with phosphate falling and nitrate rising. However, the increase in nitrate was far greater, proportionately, than the fall in phosphate. This, combined with increased water temperatures is likely to have driven significant algal blooms and dissolved oxygen depletion.
The effects of algal blooms can be felt for years to come, as they not only impact adult and juvenile fish, but also suffocate spawning grounds. Algae can form thick layers over gravel beds where fish like brown trout and Atlantic salmon lay their eggs. These layers reduce water flow through the gravel, blocking oxygen-rich water from reaching the buried eggs, which can suffocate and die
AMMONIA TOXICITY
Ammonia exists in two forms in water: NH₄ ⁺ (ionised ammonia), which is relatively non-toxic, and NH₃ (un-ionised ammonia), which is highly toxic to fish Un-ionised ammonia diffuses through gill membranes into the bloodstream, damaging gill tissue and impairing oxygen uptake. Trout and other salmonids are especially sensitive to ammonia poisoning.
Unfortunately, as water temperature and pH increase, so do the negative effects of increased NH₄ ⁺ concentrations, such as those revealed by the WQMN’s data Warmer water with a higher pH breaks down NH₄ ⁺ into NH₃ (toxic). As a result, the same ionised ammonia level can be 20-30 times more toxic in warm, alkaline water (EPA, 2013).
The increase of both temperature and ionised ammonia concentrations revealed in this report is a deadly combination for many freshwater species, with the likely effects on salmonids being especially severe
CONCLUSION
The concentration of nutrients is dependent on two key variables: the total nutrient load entering waterways, and the volume of water in which nutrients are diluted. We can reasonably assume that nutrient loads entering waterways were lower than previous years, especially compared with 2024, where high rainfall led to increased untreated sewage spills, agricultural and road runoff.
However, it seems as though 2025’s dry weather has tilted the equation in favour of lower dilution, causing concentrations to increase, despite the likely fall in nutrients entering waterways Ultimately, it is the concentration of nutrients which drives changes in aquatic ecosystems. Furthermore, this has occurred over the breeding season for many species and the increased nutrient levels and temperatures are likely to have caused significant disruption.
The findings of this report highlight the deeply interconnected aspects of the water cycle which policymakers must take into account to meet the scale of the water pollution crisis Systemic change is needed on both sides of the equation. The water sector and agricultural regulations are in need of radical reform to reduce pollution inputs into rivers. With climate change set to deliver more extreme dry spells such that experienced in spring 2025, water management must be transformed to meet our increasing needs at a time of increasing shortage, whilst curbing the over-abstraction, which contributes significantly to the high concentration of pollutants identified in this report
To this end, policy recommendations are stated on page 4. It is high time that the immense resources created by citizen scientists across the UK are deeply integrated into overdue plans for change.
APPENDIX
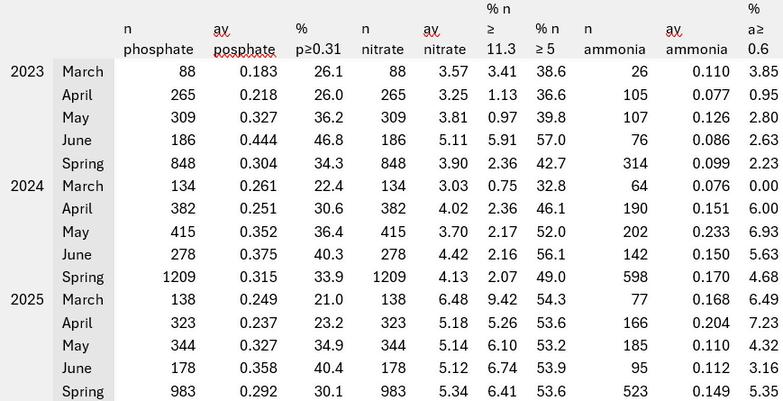
A - CHEMICAL TESTING AVERAGES AND COMPARISONS WITH GOOD ECOLOGICAL STATUS
B - REFERENCES
Coutant, C.C. (1977). Compilation of temperature preference data. Journal of the Fisheries Research Board of Canada, 34(5): 730–745.
DEFRA. (2025). Event Duration Monitoring - Storm Overflows - Annual Returns. Retrieved from https://environment data gov uk/dataset/21e15f12-0df8-4bfc-b763-45226c16a8ac
Elliott, J.M. (1981). Some aspects of thermal stress on freshwater teleosts. In: Stress and Fish, A.D. Pickering (ed.), Academic Press, London, pp. 209–245
EPA (2013) Aquatic Life Ambient Water Quality Criteria for Ammonia – Freshwater 2013 EPA 822-R-13-001
Hampuwo, B., Duenser, A., & Lahnsteiner, F. (2025). Effects of elevated temperature on gene expression, energy metabolism, and physiology in brown trout, Salmo trutta. Conservation physiology, 13(1), coaf025. https://doi.org/10.1093/conphys/coaf025
Matti Vornanen, Jaakko Haverinen, Stuart Egginton; Acute heat tolerance of cardiac excitation in the brown trout (Salmo trutta fario) J Exp Biol 15 January 2014; 217 (2): 299–309 doi: https://doi org/10 1242/jeb 091272
Kärcher O, Flörke M, Markovic D. Different life stage, different risks: Thermal performance across the life cycle of Salmo trutta and Salmo salar in the face of climate change. Ecol Evol. 2021; 11: 8941–8956. https://doi.org/10.1002/ece3.7731
Met Office. (2023). Relative lack of Spring rainfall triggers water scarcity alert. Retrieved from https://www.metoffice.gov.uk/blog/2023/relative-lack-of-spring-rainfall-triggers-waterscarcity-alert
Met Office (2024) Review of 2024: Multiple records broken in a year of mixed weather Retrieved from https://www.metoffice.gov.uk/blog/2024/review-of-2024-multiple-recordsbroken-in-a-year-of-mixed-weather
Met Office. (2025). How close are we to breaking spring records? Retrieved from https://www.metoffice.gov.uk/blog/2025/how-close-are-we-to-breaking-spring-records